enablence technologies inc. management’s …€¦ · revenues and expenses of enablence and its...
TRANSCRIPT

1
ENABLENCE TECHNOLOGIES INC.
MANAGEMENT’S DISCUSSION AND ANALYSIS OF FINANCIAL CONDITION AND RESULTS OF OPERATIONS (“MD&A”)
FOR THE THREE AND ELEVEN MONTHS ENDED MARCH 31, 2011 AND THE THREE AND TWELVE MONTHS ENDED APRIL 30, 2010
DATED: MAY 30, 2011
2
ENABLENCE TECHNOLOGIES INC.
MANAGEMENT'S DISCUSSION AND ANALYSIS OF FINANCIAL CONDITION AND RESULTS OF OPERATIONS (“MD&A”) The following is a discussion and analysis of the unaudited consolidated financial statements of Enablence Technologies Inc. (“Enablence”) for the three and eleven months ended March 31, 2011, and should be read in conjunction with other securities filings available on www.sedar.com. The effective date of management’s discussion and analysis is May 30, 2011. The financial statements have been prepared in accordance with Canadian generally accepted accounting principles (“GAAP”). The financial statements include the assets, liabilities, revenues and expenses of Enablence and its subsidiaries, including those of Teledata Networks Ltd. (“Teledata”) from the June 23, 2010 acquisition date. References made herein to “Enablence”, “the Company”, “we” and “our” mean Enablence and its subsidiaries, collectively, unless the context indicates otherwise. Management has evaluated the effectiveness of the Company’s disclosure controls and procedures as of March 31, 2011 and has concluded that these are effective in providing reasonable assurance that material information relating to the Company has been appropriately disclosed. All amounts included in the MD&A are in thousands, except per share amounts or as indicated otherwise. All financial amounts are in Canadian dollars, unless otherwise stated. FORWARD-LOOKING STATEMENTS This MD&A includes certain forward-looking statements that are based upon current expectations, which involve risks and uncertainties associated with our business and the environment in which the business operates. Any statements contained herein that are not statements of historical facts may be deemed to be forward-looking statements, including those identified by the expressions “anticipate”, “believe”, “plan”, “estimate”, “expect”, “intend” and similar expressions to the extent they relate to the Company or its management. The forward-looking statements are not historical facts, but reflect management’s current expectations regarding future results or events. These forward-looking statements are subject to a number of risks and uncertainties that could cause actual results or events to differ materially from current expectations. The Company does not undertake or accept any obligation to release publicly any updates or revisions to any forward-looking statements to reflect any change in the Company’s expectations, except as prescribed by applicable securities laws.
3
OVERVIEW ENABLENCE’S BUSINESS Enablence operates through two operating segments. The Optical Components and Subsystems (“OCS”) segment designs, manufactures and sells optical components and subsystems for access, metro and long-haul markets to a global customer base. It utilizes its patented technologies including planar lightwave circuit (“PLC”) intellectual property, know-how and trade secrets in the production of an array of photonics components and broadband equipment. The Systems segment designs, manufactures and sells fiber-to-the-home (FTTH) equipment and multi-service access platforms (MSAP) for triple-play residential and business services. Enablence delivers a key portion of the infrastructure for next-generation telecommunication systems. The Company’s product lines address all three segments of optical networks: Access, connecting homes and businesses to the network; Metro, communication rings within large cities; and Long-haul, linking cities and continents. The Company’s Access solutions enable voice, data, video, and Internet communications across both copper and fiber-based network infrastructures. RECENT DEVELOPMENTS Subsequent to March 31, 2011, there were several changes to the business, where the Company:
announced it was planning to divest the Systems segment; raised $10 million through the sale by private placement of common shares; finalized a US$3.5 million note payable and invested the related US$3.5 million in its
China joint venture; and announced the resignation of Stephan Guerin and Nishith Goel from the Board of
Directors. Each of these developments is described in more detail below. Potential Divestiture of the Systems Segment On April 28th, 2011, the Company announced that it had begun an initiative to explore strategic alternatives to achieve the most value-enhancing and efficient divestiture including sale, partial sale or closure of the Systems segment. The decision to divest the Systems segment will allow management to focus on the OCS segment. The Company has retained an investment banker to assist in the evaluation of alternatives such as a sale, partial sale or closure. Management anticipates the divestiture to be completed prior to September 30, 2011, however there can be no assurance as to the likelihood, terms or timing of any transaction. The Company’s decision to divest the Systems segment was driven by the estimated cash requirements to complete the development and initial supply of key products in Systems’ product roadmap and build its revenue to a predictable and cash positive level. Fluctuations in Systems’ revenue level has consumed a significant amount of the Company’s cash resources. Enablence management further concluded that the synergy and integration opportunities between its Systems and OCS segments were not as significant as previously anticipated, and were no longer strategic.
4
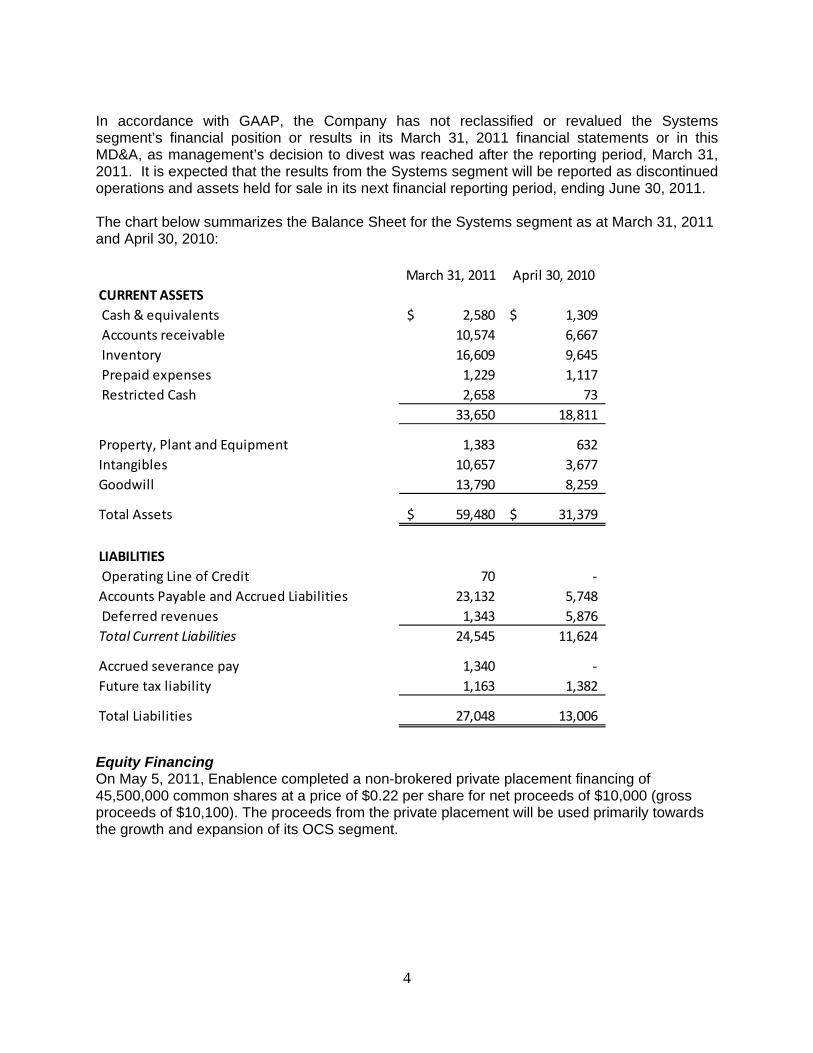
In accordance with GAAP, the Company has not reclassified or revalued the Systems segment’s financial position or results in its March 31, 2011 financial statements or in this MD&A, as management’s decision to divest was reached after the reporting period, March 31, 2011. It is expected that the results from the Systems segment will be reported as discontinued operations and assets held for sale in its next financial reporting period, ending June 30, 2011. The chart below summarizes the Balance Sheet for the Systems segment as at March 31, 2011 and April 30, 2010:
March 31, 2011 April 30, 2010
CURRENT ASSETS
Cash & equivalents 2,580$ 1,309$
Accounts receivable 10,574 6,667
Inventory 16,609 9,645
Prepaid expenses 1,229 1,117
Restricted Cash 2,658 73
33,650 18,811
Property, Plant and Equipment 1,383 632
Intangibles 10,657 3,677
Goodwill 13,790 8,259
Total Assets 59,480$ 31,379$
LIABILITIES
Operating Line of Credit 70 ‐
Accounts Payable and Accrued Liabilities 23,132 5,748
Deferred revenues 1,343 5,876
Total Current Liabilities 24,545 11,624
Accrued severance pay 1,340 ‐
Future tax liability 1,163 1,382
Total Liabilities 27,048 13,006
Equity Financing On May 5, 2011, Enablence completed a non-brokered private placement financing of 45,500,000 common shares at a price of $0.22 per share for net proceeds of $10,000 (gross proceeds of $10,100). The proceeds from the private placement will be used primarily towards the growth and expansion of its OCS segment.
5
Note Payable and China JV funding Enablence is expanding its OCS segment in part with its investment in a joint venture with Sunsea Telecommunications Co. Ltd. (the "JV Partner”) that will operate in China, named Foshan Sunsea-Enablence Optoelectronics Technology Co., Ltd (the “China JV”). The JV Partner will own 51% of the China JV, and Enablence will own a 49% interest. The China JV will develop, manufacture and sell optical components based in part on Enablence’s PLC technology. The initial investments by the China JV partners are as follows:
US$9,180 by the JV Partner, all in cash US$8,820 by Enablence, comprising:
o US$3,500 in cash; o US$1,000 of capital equipment; and, o US$4,320 in intellectual property and know-how
In conjunction with the initial funding of the China JV, on May 10, 2011, Enablence finalized a note payable with a U.S. bank, with a principal amount of US$3,500, secured by US$1,200 cash on deposit and a lien on the shares in the Company’s investment in the China JV. The note has a maturity date of April 20, 2016 and an interest rate at the greater of 5.5% and Wall Street Journal Prime Rate plus 1.5%. The note is repayable as interest only for the first twelve months, then interest and principal amortized over the remaining term of the loan. As partial consideration for the loan, the Company issued to the bank warrants to purchase up to 400,000 common shares of Enablence, at an exercise price of $0.22 per share, expiring April 9, 2013. On May 12, 2011, the Company paid the initial investment in the China JV, through its contribution of US$3,500. Resignation of Directors On April 19, 2011, Mr. Stephan Guerin and Mr. Nishith Goel resigned from the Board of Directors. Until such time as suitable replacements have been selected, the Board will continue with four directors. The resignations were tendered to allow both individuals to focus on their primary business interests.

6
HIGHLIGHTS
During the three months ended March 31, 2011, Enablence: Generated $8,174 in OCS revenue, an increase of 18% over the prior year quarter; Generated 33% gross margin in OCS for the second consecutive quarter, up from 25%
in the prior year quarter; Excluding the Systems segment, the Company reported positive Adjusted EBITDA (a
non-GAAP measure as defined below) for the first time in Company history; Began the physical move of the polymer-based production operations from Wilmington
Massachusetts to Fremont, California, to be completed by June 30, 2011. This will result in reduced costs in OCS;
Recorded impairment charges related to its Systems segment totaling $37,273; and, Experienced a 75% decline in Systems revenue compared with the previous quarter,
and a 9% decline from the prior year quarter; in part triggering a decision to divest of the segment
The Company has changed its fiscal year end to June 30 from April 30. As a result, the current fiscal year will comprise 14 months ending June 30, 2011. During this transition fiscal year, the Company will report on 5 periods. The 2011 fiscal period includes the two months of May and June 2010 (the “Stub 2011”), and the four quarters ending September 30, 2010, December 31, 2010, March 31, 2011 and June 30, 2011. This MD&A covers the results for the three and eleven-month periods ending March 31, 2011 compared with the three and twelve-month periods ending April 30, 2010. On June 23, 2010, Enablence acquired Teledata, operating from Tel Aviv, Israel. Teledata designs, manufactures and sells high-speed multi-service broadband equipment to customers in emerging markets. Teledata’s operating results and financial position have been included in Enablence’s consolidated results since the date of acquisition on June 23, 2010. Teledata is reported as part of the Systems segment and is part of the divestiture plan announced on April 28, 2011.
7
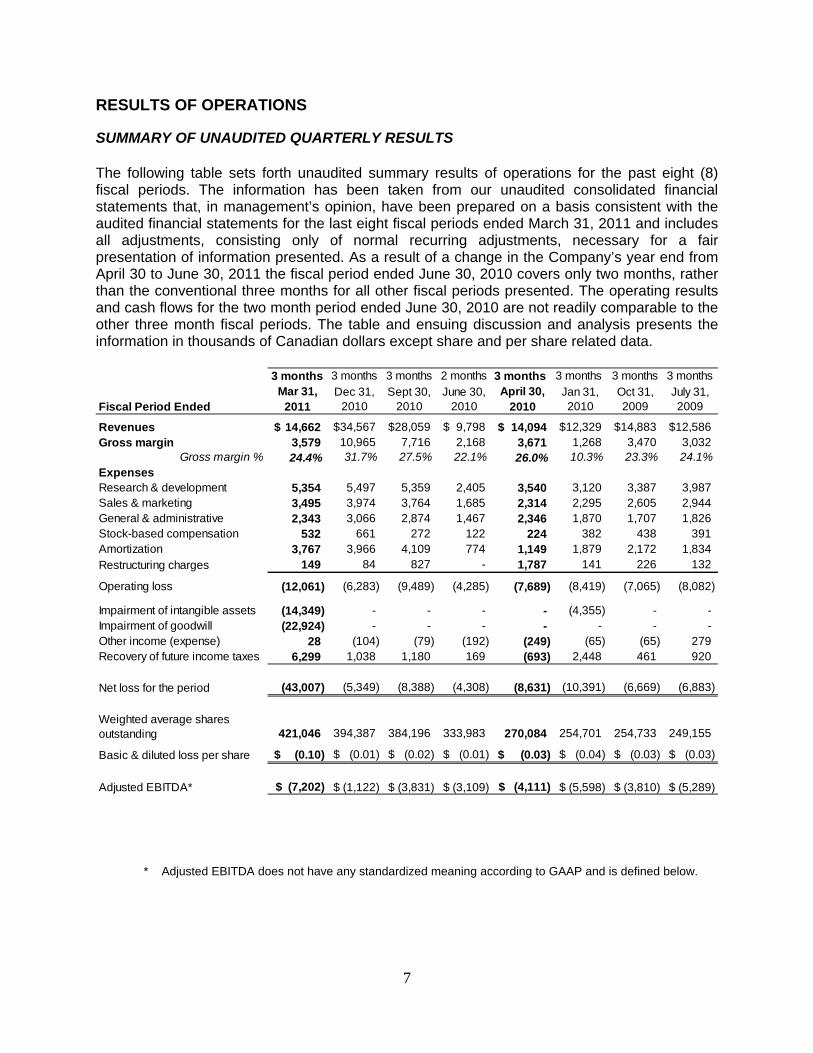
RESULTS OF OPERATIONS SUMMARY OF UNAUDITED QUARTERLY RESULTS The following table sets forth unaudited summary results of operations for the past eight (8) fiscal periods. The information has been taken from our unaudited consolidated financial statements that, in management’s opinion, have been prepared on a basis consistent with the audited financial statements for the last eight fiscal periods ended March 31, 2011 and includes all adjustments, consisting only of normal recurring adjustments, necessary for a fair presentation of information presented. As a result of a change in the Company’s year end from April 30 to June 30, 2011 the fiscal period ended June 30, 2010 covers only two months, rather than the conventional three months for all other fiscal periods presented. The operating results and cash flows for the two month period ended June 30, 2010 are not readily comparable to the other three month fiscal periods. The table and ensuing discussion and analysis presents the information in thousands of Canadian dollars except share and per share related data.
3 months 3 months 3 months 2 months 3 months 3 months 3 months 3 months
Fiscal Period EndedMar 31,
2011Dec 31,
2010Sept 30,
2010June 30,
2010April 30,
2010Jan 31, 2010
Oct 31, 2009
July 31, 2009
Revenues 14,662$ 34,567$ 28,059$ 9,798$ 14,094$ 12,329$ 14,883$ 12,586$ Gross margin 3,579 10,965 7,716 2,168 3,671 1,268 3,470 3,032
Gross margin % 24.4% 31.7% 27.5% 22.1% 26.0% 10.3% 23.3% 24.1%ExpensesResearch & development 5,354 5,497 5,359 2,405 3,540 3,120 3,387 3,987 Sales & marketing 3,495 3,974 3,764 1,685 2,314 2,295 2,605 2,944 General & administrative 2,343 3,066 2,874 1,467 2,346 1,870 1,707 1,826 Stock-based compensation 532 661 272 122 224 382 438 391 Amortization 3,767 3,966 4,109 774 1,149 1,879 2,172 1,834 Restructuring charges 149 84 827 - 1,787 141 226 132
Operating loss (12,061) (6,283) (9,489) (4,285) (7,689) (8,419) (7,065) (8,082)
Impairment of intangible assets (14,349) - - - - (4,355) - - Impairment of goodwill (22,924) - - - - - - - Other income (expense) 28 (104) (79) (192) (249) (65) (65) 279 Recovery of future income taxes 6,299 1,038 1,180 169 (693) 2,448 461 920
Net loss for the period (43,007) (5,349) (8,388) (4,308) (8,631) (10,391) (6,669) (6,883)
Weighted average shares outstanding 421,046 394,387 384,196 333,983 270,084 254,701 254,733 249,155
Basic & diluted loss per share (0.10)$ (0.01)$ (0.02)$ (0.01)$ (0.03)$ (0.04)$ (0.03)$ (0.03)$
Adjusted EBITDA* $ (7,202) $ (1,122) $ (3,831) $ (3,109) $ (4,111) $ (5,598) $ (3,810) $ (5,289)
* Adjusted EBITDA does not have any standardized meaning according to GAAP and is defined below.
8
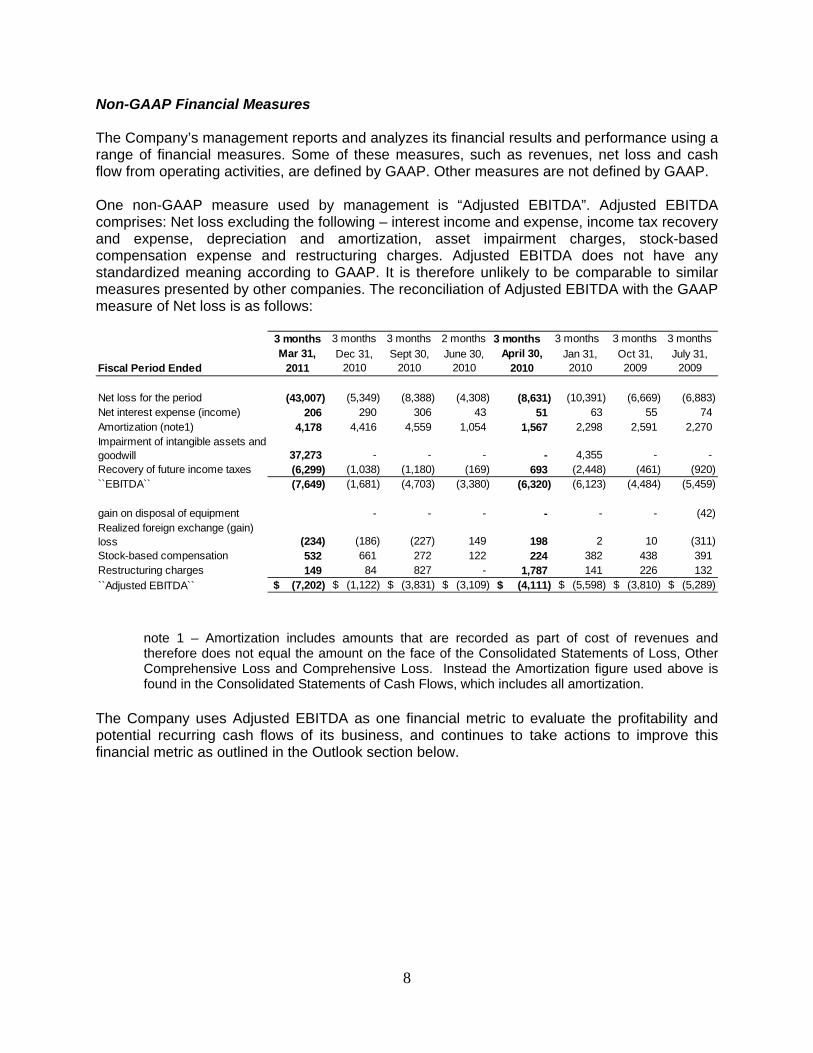
Non-GAAP Financial Measures The Company’s management reports and analyzes its financial results and performance using a range of financial measures. Some of these measures, such as revenues, net loss and cash flow from operating activities, are defined by GAAP. Other measures are not defined by GAAP. One non-GAAP measure used by management is “Adjusted EBITDA”. Adjusted EBITDA comprises: Net loss excluding the following – interest income and expense, income tax recovery and expense, depreciation and amortization, asset impairment charges, stock-based compensation expense and restructuring charges. Adjusted EBITDA does not have any standardized meaning according to GAAP. It is therefore unlikely to be comparable to similar measures presented by other companies. The reconciliation of Adjusted EBITDA with the GAAP measure of Net loss is as follows:
3 months 3 months 3 months 2 months 3 months 3 months 3 months 3 months
Fiscal Period EndedMar 31,
2011Dec 31,
2010Sept 30,
2010June 30,
2010April 30,
2010Jan 31, 2010
Oct 31, 2009
July 31, 2009
Net loss for the period (43,007) (5,349) (8,388) (4,308) (8,631) (10,391) (6,669) (6,883) Net interest expense (income) 206 290 306 43 51 63 55 74 Amortization (note1) 4,178 4,416 4,559 1,054 1,567 2,298 2,591 2,270 Impairment of intangible assets and goodwill 37,273 - - - - 4,355 - - Recovery of future income taxes (6,299) (1,038) (1,180) (169) 693 (2,448) (461) (920) ``EBITDA`` (7,649) (1,681) (4,703) (3,380) (6,320) (6,123) (4,484) (5,459)
gain on disposal of equipment - - - - - - (42) Realized foreign exchange (gain) loss (234) (186) (227) 149 198 2 10 (311) Stock-based compensation 532 661 272 122 224 382 438 391 Restructuring charges 149 84 827 - 1,787 141 226 132
``Adjusted EBITDA`` (7,202)$ (1,122)$ (3,831)$ (3,109)$ (4,111)$ (5,598)$ (3,810)$ (5,289)$
note 1 – Amortization includes amounts that are recorded as part of cost of revenues and therefore does not equal the amount on the face of the Consolidated Statements of Loss, Other Comprehensive Loss and Comprehensive Loss. Instead the Amortization figure used above is found in the Consolidated Statements of Cash Flows, which includes all amortization.
The Company uses Adjusted EBITDA as one financial metric to evaluate the profitability and potential recurring cash flows of its business, and continues to take actions to improve this financial metric as outlined in the Outlook section below.

9
PRO FORMA UNAUDITED FINANCIAL RESULTS The following table sets forth unaudited summary results of operations for the past eight (8) fiscal periods of the Company after removing the results of the Systems segment. Pro-forma excluding Systems 3 months 3 months 3 months 2 months 3 months 3 months 3 months 3 months
Fiscal Period EndedMar 31,
2011Dec 31,
2010Sept 30,
2010June 30,
2010April 30,
2010Jan 31, 2010
Oct 31, 2009
July 31, 2009
Revenues 8,174$ 8,828$ 8,437$ 4,397$ 6,925$ 5,986$ 6,068$ 4,469$ Gross margin 2,654 2,907 2,277 698 1,751 1,280 1,113 811
Gross margin % 32.5% 32.9% 27.0% 15.9% 25.3% 21.4% 18.3% 18.1%ExpensesResearch & development 1,235 1,394 1,340 966 1,542 1,187 1,522 1,596 Sales & marketing 362 424 451 273 487 317 408 414 General & administrative 1,362 1,729 1,315 970 1,680 1,272 1,160 1,202 Stock based compensation 533 661 271 123 224 382 439 391 Amortization 357 390 390 252 373 641 900 459 Restructuring charges 149 84 827 - 1,786 (36) - -
Operating loss (1,344) (1,775) (2,317) (1,886) (4,341) (2,483) (3,316) (3,251)
Impairment of intangible assets - - - - - (1,580) - - Impairment of goodwill - - - - - - - - Other income (expense) 25 146 111 (198) (247) (64) (307) 520 Recovery of future income taxes 112 120 226 5 (797) 951 174 267
Net loss for the period (1,207) (1,509) (1,980) (2,079) (5,385) (3,176) (3,449) (2,464)
Adjusted EBITDA* $ 85 $ (222) $ (411) $ (1,247) $ (1,568) $ (1,107) $ (1,853) $ (1,690)
* Adjusted EBITDA does not have any standardized meaning according to GAAP and is defined above. The following table sets forth unaudited reconciliation of Adjusted EBITDA with the GAAP measure of Net loss for the past eight (8) fiscal periods of the Company after removing the results of the Systems segment.
3 months 3 months 3 months 2 months 3 months 3 months 3 months 3 months
Fiscal Period EndedMar 31,
2011Dec 31,
2010Sept 30,
2010June 30,
2010April 30,
2010Jan 31, 2010
Oct 31, 2009
July 31, 2009
Net loss for the period (1,207) (1,509) (1,980) (2,079) (5,385) (3,176) (3,449) (2,464) Net interest expense (income) 239 231 237 31 50 64 55 74 Amortization (note1) 745 813 810 515 762 1,028 1,266 887 Impairment of intangible assets and goodwill - - - - - 1,580 - -
Recovery of future income taxes(112) (120) (226) (5) 797 (951) (174) (267)
``EBITDA`` (335) (585) (1,159) (1,538) (3,776) (1,455) (2,302) (1,770)
gain on disposal of equipment - - - - - - - - Realized foreign exchange (gain) loss (262) (382) (350) 168 198 2 10 (311) Stock-based compensation 533 661 271 123 224 382 439 391 Restructuring charges 149 84 827 - 1,786 (36) - -
``Adjusted EBITDA`` 85$ (222)$ (411)$ (1,247)$ (1,568)$ (1,107)$ (1,853)$ (1,690)$
10
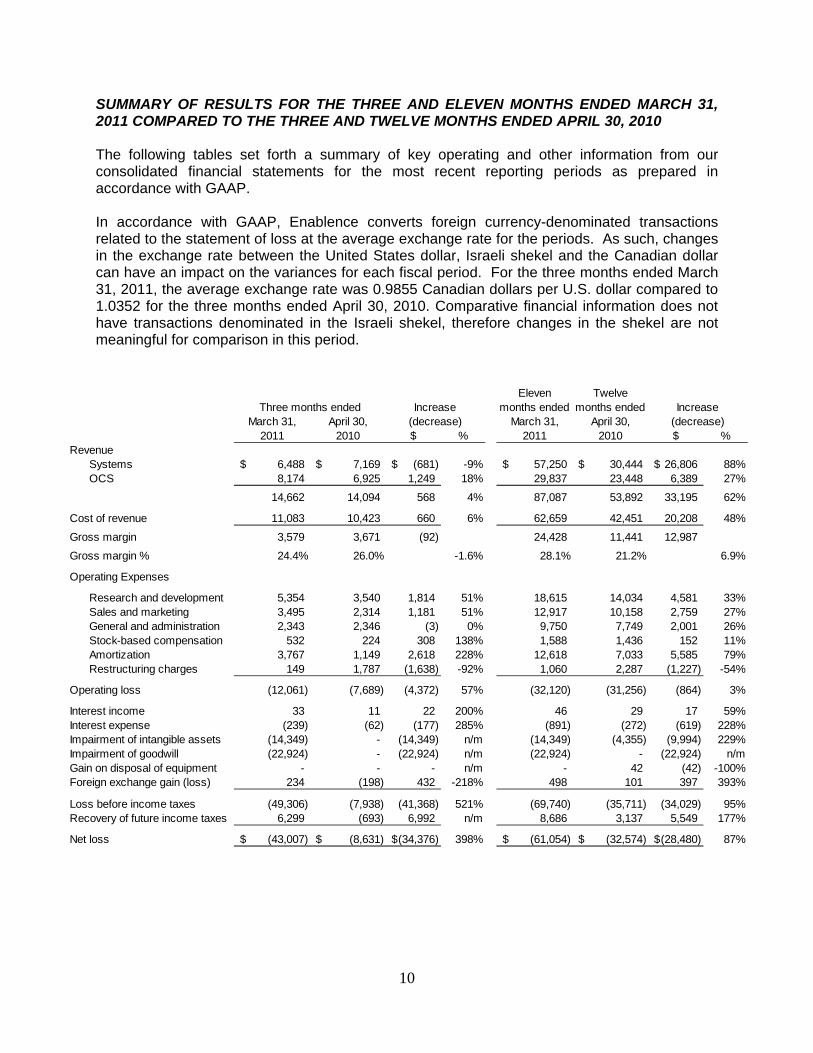
SUMMARY OF RESULTS FOR THE THREE AND ELEVEN MONTHS ENDED MARCH 31, 2011 COMPARED TO THE THREE AND TWELVE MONTHS ENDED APRIL 30, 2010 The following tables set forth a summary of key operating and other information from our consolidated financial statements for the most recent reporting periods as prepared in accordance with GAAP.
In accordance with GAAP, Enablence converts foreign currency-denominated transactions related to the statement of loss at the average exchange rate for the periods. As such, changes in the exchange rate between the United States dollar, Israeli shekel and the Canadian dollar can have an impact on the variances for each fiscal period. For the three months ended March 31, 2011, the average exchange rate was 0.9855 Canadian dollars per U.S. dollar compared to 1.0352 for the three months ended April 30, 2010. Comparative financial information does not have transactions denominated in the Israeli shekel, therefore changes in the shekel are not meaningful for comparison in this period.
Eleven months ended
Twelve months ended
$ % $ %Revenue
Systems 6,488$ 7,169$ (681)$ -9% 57,250$ 30,444$ 26,806$ 88%OCS 8,174 6,925 1,249 18% 29,837 23,448 6,389 27%
14,662 14,094 568 4% 87,087 53,892 33,195 62%
Cost of revenue 11,083 10,423 660 6% 62,659 42,451 20,208 48%
Gross margin 3,579 3,671 (92) 24,428 11,441 12,987
Gross margin % 24.4% 26.0% -1.6% 28.1% 21.2% 6.9%
Operating Expenses
Research and development 5,354 3,540 1,814 51% 18,615 14,034 4,581 33%Sales and marketing 3,495 2,314 1,181 51% 12,917 10,158 2,759 27%General and administration 2,343 2,346 (3) 0% 9,750 7,749 2,001 26%Stock-based compensation 532 224 308 138% 1,588 1,436 152 11%Amortization 3,767 1,149 2,618 228% 12,618 7,033 5,585 79%Restructuring charges 149 1,787 (1,638) -92% 1,060 2,287 (1,227) -54%
Operating loss (12,061) (7,689) (4,372) 57% (32,120) (31,256) (864) 3%
Interest income 33 11 22 200% 46 29 17 59%Interest expense (239) (62) (177) 285% (891) (272) (619) 228%Impairment of intangible assets (14,349) - (14,349) n/m (14,349) (4,355) (9,994) 229%Impairment of goodwill (22,924) - (22,924) n/m (22,924) - (22,924) n/mGain on disposal of equipment - - - n/m - 42 (42) -100%Foreign exchange gain (loss) 234 (198) 432 -218% 498 101 397 393%
Loss before income taxes (49,306) (7,938) (41,368) 521% (69,740) (35,711) (34,029) 95%Recovery of future income taxes 6,299 (693) 6,992 n/m 8,686 3,137 5,549 177%
Net loss (43,007)$ (8,631)$ (34,376)$ 398% (61,054)$ (32,574)$ (28,480)$ 87%
Three months ended Increase Increase(decrease) (decrease)April 30,
2010March 31,
2011March 31,
2011April 30,
2010

11
SUMMARY OF RESULTS FOR THE THREE MONTHS ENDED MARCH 31, 2011 COMPARED TO THE THREE MONTHS ENDED APRIL 30, 2010
Revenues Revenue in OCS increased by $1,249, or 18% (21% excluding the impacts of the US dollar weakening as compared to the Canadian dollar) for the three months ended March 31, 2011 compared to the prior year period driven by market demand for its products used in high-speed networks. Systems segment revenues for the three months ended March 31, 2011 decreased by $681, or 9% (5% excluding the impacts of the US dollar weakening as compared to the Canadian dollar) compared to the prior year period. The prior year period does not include the results of Teledata. Excluding Teledata, revenue in Systems decreased by approximately 26% (23% excluding the impacts of the US dollar weakening as compared to the Canadian dollar). The decrease occurred in North America, where the new Teledata platform was being introduced, and management believes resulted in delays in some purchase decisions by its customers. Revenue from Teledata had decreased significantly from previous quarter levels. Teledata revenue is characterized by fewer numbers of larger value projects. The March 2011 quarter did not have any significant projects, and an approximately $5 million project was delayed. Revenue (based on ship-to location of the customer) is split by region as follows:
Region $ % $ % $ % $ %
North America 5,754 39% 8,783 62% 29,282 34% 34,829 65%Central and Latin America 1,760 12% 75 1% 8,362 10% 454 1%Asia Pacific 3,344 23% 3,211 23% 32,791 38% 10,051 19%Europe, Middle East and Africa 3,804 26% 2,025 14% 16,652 19% 8,558 16%
14,662$ 100% 14,094$ 100% 87,087$ 100% 53,892$ 100%
Eleven months ended
Twelve months ended
March 31, 2011April 30,
2010 March 31, 2011April 30,
2010
Three months ended
The shift in revenue from North America to other regions is driven by the acquisition of Teledata, whose customers are almost entirely outside of North America. This regional revenue mix may change quarterly due to large individual projects in Systems, however it is expected to remain significant outside North America. The regional split is expected to continue to be largely outside North America, and not significant in Central and Latin America after the Systems segment is disposed of. During the three months ended March 31, 2011, no one customer accounted for greater than 10% of the Company’s total revenue. Two customers accounted for 28% of the accounts receivable balance at March 31, 2011 (15% and 13% individually). During the three months ended April 30, 2010, one customer accounted for 11% of the Company’s total revenue, and no one customer accounted for greater than 10% of the accounts receivable balance at April 30, 2010.

12
During the eleven months ended March 31, 2011, two customers accounted for 26% of the Company’s total revenue (16% and 10% individually) and no one customer accounted for greater than 10% of the Company’s total revenue during the twelve months ended April 30, 2010. Cost of revenues The Company’s cost of revenues is comprised of a number of elements, some of which vary with revenues, such as cost of products manufactured by third parties, and some of which do not vary significantly with revenues, such as compensation of operations staff and facilities costs. Cost of revenues include the costs of distribution and other third party contractors who provide a variety of customer and sales support services and whose costs are linked directly to revenues. Gross margins declined by 1.6 points to 24.4% compared with 26.0% in the prior year period. The decrease in gross margin was due to the Systems segment, where revenue declined organically, and the Teledata revenue was not sufficient to offset this decline. Systems gross margin fell from 27% in the prior year period to 14% in the current year quarter. Gross margin in OCS improved from 25% in the prior year period to 33% in the current year quarter due to increased volume and improved product mix. Operating expenses Research & Development expenses for the three months ended March 31, 2011 increased by $1,814 (or 51%) compared to the three months ended April 30, 2010. The increase was driven by the acquisition of Teledata, while spending decreased organically by approximately 21% (18% excluding the impact of foreign exchange) from the results of previously initiated cost reduction efforts. Sales & Marketing expenses for the three months ended March 31, 2011 increased by $1,181 (or 51%) compared to the three months ended April 30, 2010. Excluding the Teledata acquisition, Sales & Marketing expenses decreased by approximately 3% (increase of 1% excluding the impact of foreign exchange) due to the increase in revenue and the addition of resources to support OCS and Systems, offset by reductions in corporate marketing. General & Administration expenses for the three months ended March 31, 2011 decreased by $3 (or 0%) compared to the three months ended April 30, 2010. Excluding the Teledata acquisition, General & Administration expenses decreased by approximately 20% (18% excluding the impact of foreign exchange) due cost reduction initiatives across the business. Amortization for the three months ended March 31, 2011 increased by $2,618 (or 228% compared to the three months ended April 30, 2010. The increase was driven by the acquisition of Teledata and related amortization of intangible assets of $2,837 offset by a decrease in amortization as a result of the intangible asset impairment charges recorded in the prior year. Stock-based compensation for the three months ended March 31, 2011 increased by $308 (or 138% compared to the three months ended April 30, 2010. The increase resulted from the increase in options outstanding compared to the prior year period. The Company has granted 14,430 options during the current year. Total stock options outstanding as at March 31, 2011 was 29,620 compared to 19,213 as at April 30, 2010.

13
Restructuring charges for the three months ended March 31, 2011 of $149 are comprised of costs associated with relocating the Company’s polymer-based production operations from the Wilmington, Massachusetts fabrication facility to the Fremont, California fabrication facility. The expenses are primarily employee-related termination costs. The prior year charges of $1,787 related to executive termination costs. Interest Income Enablence invests cash and cash equivalents in short-term investments with a Canadian chartered bank. During the three months ended March 31, 2011, Enablence earned interest income on these investments of $33, as compared to $11 during the three months ended April 30, 2010. Interest income is a function of prevailing interest rates and the amount of funds invested. Interest expense Interest expense during the three months ended March 31, 2011 was $239 compared to $62 during the three months ended April 30, 2010. The increase in the current year quarter was due mainly to the issue of US$10,000 of 5% subordinated notes as part of the financing of the acquisition of Teledata as well as an increase in the total of secured notes payable. The Company’s interest expense is a function of the balance of debt, the prevailing interest rates, and the average foreign exchange rate between the underlying currency of the debt security and the Canadian dollar. The table below sets out the balances outstanding at the end of each period, and the US$ equivalent of the total outstanding:
March 31, 2010 April 30, 2010
Secured note payable $4,544 $2,095 Convertible notes payable 2,909 3,047 Subordinated notes payable 9,696 - Total in C$ $17,149 $5,142 Total in US$ $17,457 $5,063
The secured note payable was issued on July 16, 2010 and has an interest rate based on the Wall Street Journal prime rate plus 1.50%, resulting in an interest rate of 4.75% at March 31, 2011. The interest rate on the convertible notes and subordinated notes is 5%. Foreign exchange gain (loss) Foreign exchange gains and losses arise as a result of converting assets and liabilities denominated in currencies other than the functional currency of the entity into the functional currency of the entity balance sheet date and realized gains or losses arising from the settlement of these balances during the period. During the three months ended March 31, 2011 the Company recorded a foreign exchange gain of $234 mainly due to the strengthening of the Canadian dollar, as compared to foreign exchange loss of $198 during the three months ended April 30, 2010.

14
Impairment of intangible assets and goodwill Intangible assets are reviewed annually for impairment or whenever events or changes in circumstances indicate that the carrying amount of an asset may not be recoverable. The Company performed impairment tests on its intangible assets at March 31, 2011 and recorded an impairment charge of $14,349 ($nil in the quarter ended April 30, 2010; $4,355 in the quarter ended January 31, 2010). Goodwill is tested at the conclusion of the third quarter of each fiscal year or if factors indicative of impairment are present. The Company performed impairment tests on its goodwill at March 31, 2011 and recorded an impairment expense of $22,924 (2010 - nil). The significant drivers of the impairment charges were the continued poor financial results of the Systems segment, revised assumptions around revenue and revenue growth, which were updated based on more current estimates and based on the results of the Systems segment since each piece was acquired. The Company announced in April 2011 that it would be seeking alternatives to divest of the Systems segment. The impairment charges for goodwill and intangible assets relates entirely to the Systems segment. Income taxes Future income tax recovery is due to the amortization of the intangible assets recognized on acquisitions and the related future tax liabilities that were recorded at that time. The future tax liability is drawn down in line with the amortization and impairment of the related asset. No other future tax asset has been recorded, and none will be recorded until, in the opinion of management, it is more likely than not that the future tax assets will be realized, in accordance with Canadian GAAP. During the three months ended March 31, 2011, the Company recorded a future income tax recovery of $6,299 as compared to an expense of $693 during the three months ended April 30, 2010. The recovery in the current quarter is due to the impairment expenses recorded in the current year period. Net loss The net loss for the three months ended March 31, 2011 was $43,007, which included impairment expenses of $22,924 and $14,349 for goodwill and intangible assets, respectively. Net loss excluding the impairment for the three months ended March 31, 2011 was $5,734 compared to $8,631 in the three months ended April 30, 2010 due to the factors above. Loss per Common Share The table below presents the basic and diluted loss per common share for each of the comparative fiscal periods.
Three months ended March 31,
2011
Three months ended April 30,
2010 Basic and Diluted Loss per Common Share $0.10 $0.03 Weighted Average Number of Common Shares 421,046 270,084
Due to a net loss, financial instruments including warrants and options are anti-dilutive.

15
SUMMARY OF RESULTS FOR THE ELEVEN MONTHS ENDED MARCH 31, 2011 COMPARED TO THE TWELVE MONTHS ENDED APRIL 30, 2010 As a result of a change in the Company’s year end from April 30 to June 30, the fiscal year to date period ended March 31, 2011 covers eleven months (“Current YTD”), while the prior fiscal year to date period covers twelve months (“Prior YTD”). This, combined with the acquisition of Teledata, make year-to-date comparisons less meaningful. Revenues Revenue in the OCS segment increased by $6,389, or 27% (31% excluding the impacts of the US dollar weakening as compared to the Canadian dollar) over the prior year period driven by market demand for its products used in high-speed networks, offset by the shorter fiscal period. Systems segment revenues for the eleven months ended March 31, 2011 increased by $26,806 or 88% (93% excluding the impacts of the US dollar weakening as compared to the Canadian dollar) compared to Prior YTD primarily due to the acquisition of Teledata. Organically, revenue in Systems decreased by approximately 26% (19% excluding the impacts of the US dollar weakening as compared to the Canadian dollar) over the prior year period due to the shorter fiscal period and slower sales in North America, where the new Teledata platform was being introduced, and management believes resulted in delays in some purchase decisions by its customers. Gross margin improved from 21.2% to 28.1%. The increase in gross margin was driven by four key factors:
favourable gross margins in the Teledata products; increased revenues in the OCS segment, where gross margins improve with higher
volumes over which to spread the fixed costs decrease in inventory valuation reserves recorded. Prior YTD includes $1,965 of
inventory reserves, compared to $538 recorded in Current YTD; and initial success in management’s gross margin improvement initiatives, including the
replacement of certain contract manufacturing suppliers and shipments of cost-reduced optical network terminal (“ONT”) products.
Gross margin in the OCS segment increased from 21% in Prior YTD to 29% Current YTD. Operating Expenses Operating expenses increased as a result of the Teledata acquisition, offset by the impacts of the US dollar weakening as compared to the Canadian dollar, and the shorter fiscal period. Changes in restructuring charges and impairment charges are described above in the quarterly analysis.
16
OUTLOOK Following the planned divestiture through a sale, partial sale or closure of the Systems segment, management will focus solely on the OCS segment, including the recently formed China JV. There is significant uncertainty on the outcome of the Company’s efforts to divest of the Systems segment, but management will strive to optimize the return to shareholders on disposition or closure. Accordingly, the remainder of this Outlook comments on the OCS segment. In respect of the OCS segment, the primary focus areas for the Company are:
growing revenues; improving gross margins; managing working capital and cash flow; and launching the China JV.
Management believes the market growth for the types of optical components Enablence designs and sells is approximately 14-20% over the next three years, based on certain market data. Initiatives to maintain and exceed the expected market growth include:
adding sales and marketing resources to expand its customer base; identifying and addressing adjacent markets for our products; expanding our product portfolio through existing product evolution, and new products
identified through our engineering services activities; and, launching the China JV to provide higher volumes and access to the Chinese market for
optical components based on Enablence's proprietary Planar Lightwave Circuit (“PLC”) technology.
The Company’s initiatives to drive gross margin improvement include:
continuing new product development and portfolio evolution; leveraging the China JV to improve volumes and reduce costs; consolidating the OCS operations in Fremont, California; and
Achieving higher sales volumes will improve gross margin rates by spreading fixed costs over the higher revenues. The Company’s initiatives to manage working capital and cash flow include:
continuing to work closely with our key vendors and customers to maximize cash flow; exploring opportunities for establishing banking relationships to provide access to debt facilities; and
continuing to evaluate opportunities to generate capital and strengthen the Company’s balance sheet to accelerate growth by being a lower risk supplier to our customers and allowing flexibility to address growth opportunities as they arise.
17
The Company funded its US$3,500 cash investment in the China JV during May 2011. Highlights of the China JV follow:
In December 2010, the Company announced it is entering into a joint venture with China's SUNSEA Telecommunications Co. Ltd. (the "JV Partner” ), a move that will strategically position Enablence's OCS segment to capitalize on the vast opportunity presented by the Chinese market for optical components required for broadband telecommunications equipment.
The joint venture, to be called Foshan Sunsea-Enablence Optoelectronics Technology Co., Ltd (the “China JV”), will be established in Foshan, China. The China JV is expected to finalize its lease agreement in June, 2011, and begin the build-out to be operational by approximately October 2011. The China JV is not expected to generate revenue until the latter part of calendar 2011. Its initial focus will be on producing components based on Enablence's proprietary Planar Lightwave Circuit (“PLC”) platform in high volumes. Its product lines may expand into PLC-based modules and transceivers.
The China JV will be created with an initial capital investment of US$18 million. Enablence will contribute US$3.5 million in cash and US$1 million in equipment, as well as its market-leading expertise in developing and manufacturing optical components based on its PLC technology. SUNSEA will contribute US$9.2 million of cash. Enablence will hold a 49-percent ownership stake in the joint venture.
In its first 12 months of operation (expected to be January 2012 to December 2012, Enablence and SUNSEA expect the joint venture to generate revenues of approximately US$8 - 10 million. This is expected to rise significantly in the second and subsequent years of operation. The partners expect the venture to be profitable and accretive to Enablence’ Adjusted EBITDA (as defined) within the first year of operations.
A number of product developments are planned and being implemented in fiscal year 2011, including:
integration of higher speed capabilities across our product offering; and development of multi-channel 100 gigabyte optical components, aimed at the long haul
and metro loop optical fibre markets.
These development programs will be funded in part by a third party funded design contracts, where Enablence retains the rights to the intellectual property developed and gains a “lead customer” for initial product revenues. The Company will continue to evaluate and assess profitable growth opportunities that will allow it to rapidly expand into new markets, extend its customer base and increase gross margins.
The decision to close the Wilmington, Massachusetts fabrication facility will result in approximately $1,000 in restructuring charges. $700 of these charges have been reported in its results for the eleven months ended March 31, 2011, and the remaining estimated $300 will be reported in the quarter ending June 30, 2011, when the actions contemplated are expected to be completed. The cost savings, once the transition of the polymer product fabrication is completed are expected to be approximately $250 per quarter.
18
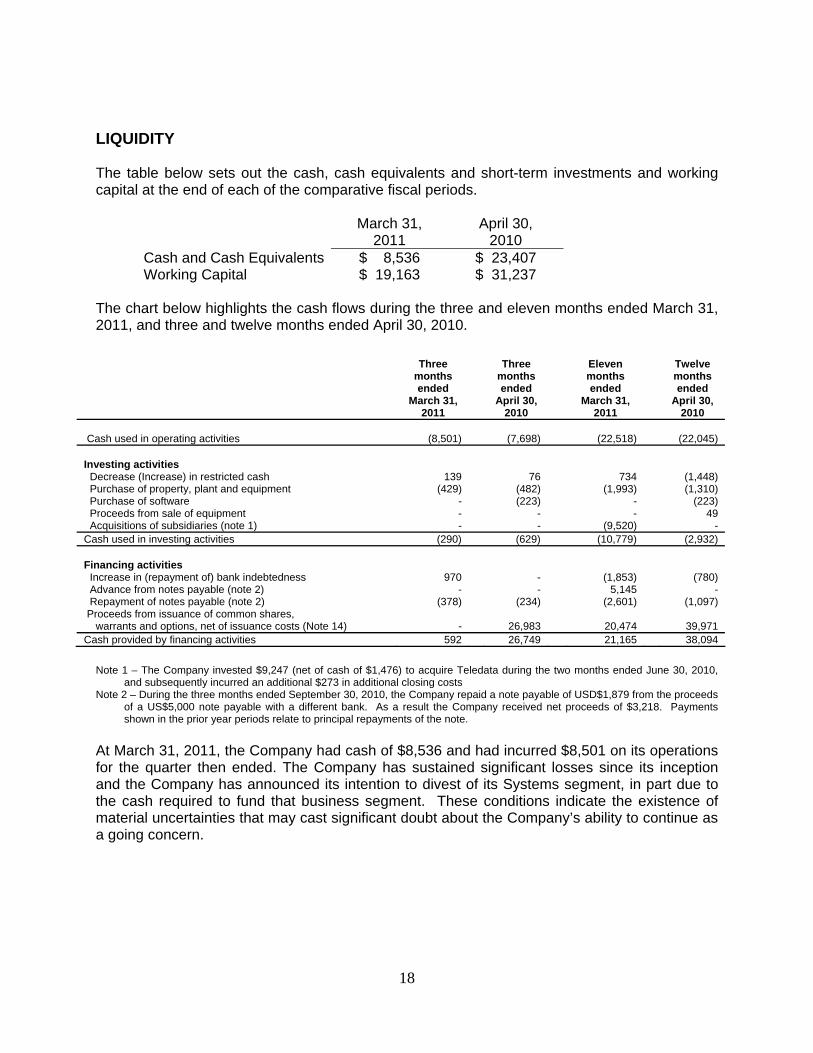
LIQUIDITY The table below sets out the cash, cash equivalents and short-term investments and working capital at the end of each of the comparative fiscal periods.
March 31,
2011 April 30,
2010 Cash and Cash Equivalents $ 8,536 $ 23,407 Working Capital $ 19,163 $ 31,237
The chart below highlights the cash flows during the three and eleven months ended March 31, 2011, and three and twelve months ended April 30, 2010.
Three months ended
March 31, 2011
Three months ended
April 30, 2010
Eleven months ended
March 31, 2011
Twelve months ended
April 30, 2010
Cash used in operating activities (8,501) (7,698) (22,518) (22,045) Investing activities Decrease (Increase) in restricted cash 139 76 734 (1,448) Purchase of property, plant and equipment Purchase of software
(429) -
(482) (223)
(1,993) -
(1,310) (223)
Proceeds from sale of equipment - - - 49 Acquisitions of subsidiaries (note 1) - - (9,520) - Cash used in investing activities (290) (629) (10,779) (2,932) Financing activities Increase in (repayment of) bank indebtedness 970 - (1,853) (780) Advance from notes payable (note 2) - - 5,145 - Repayment of notes payable (note 2) (378) (234) (2,601) (1,097) Proceeds from issuance of common shares, warrants and options, net of issuance costs (Note 14)
-
26,983
20,474
39,971
Cash provided by financing activities 592 26,749 21,165 38,094
Note 1 – The Company invested $9,247 (net of cash of $1,476) to acquire Teledata during the two months ended June 30, 2010,
and subsequently incurred an additional $273 in additional closing costs Note 2 – During the three months ended September 30, 2010, the Company repaid a note payable of USD$1,879 from the proceeds
of a US$5,000 note payable with a different bank. As a result the Company received net proceeds of $3,218. Payments shown in the prior year periods relate to principal repayments of the note.
At March 31, 2011, the Company had cash of $8,536 and had incurred $8,501 on its operations for the quarter then ended. The Company has sustained significant losses since its inception and the Company has announced its intention to divest of its Systems segment, in part due to the cash required to fund that business segment. These conditions indicate the existence of material uncertainties that may cast significant doubt about the Company’s ability to continue as a going concern.
19
The Company’s ability to reach profitability is dependent on divesting its Systems segment as soon as practical, while minimizing the cash required to support it during the divestiture process including a sale, partial sale or closure. Other dependencies include the successful introduction of new products and the success of the China JV. There can be no assurance that Enablence will gain adequate market acceptance, or that the Company will achieve higher gross margins, even though management has identified specific actions to reduce its cost of revenues in the current conditions. The Company has not yet earned operating profits. The Company’s ability to continue as a going concern is dependent upon the divestiture of its Systems segment, the ability to generate positive cash flow from its remaining business, the ability to pay its US$ 10,000 Notes Payable on maturity in June 2012, and the ability to raise additional debt or equity. The successful outcome of management’s activities cannot be assured because they are contingent on future circumstances. The $10,000 net cash proceeds on the sale on common shares and US$3,500 in proceeds from bank debt were completed in May 2011. While management believes this additional financing will be sufficient to fund the business moving forward, there is substantial risk in the divestiture plans of the Systems segment. The Company believes that the existing working capital and forecasted revenues, combined with the net $10,000 of cash raised in May 2011 from the equity financing and US$3,500 in debt to fund the China JV will be sufficient to cover the Company’s total cash requirements beyond March 31, 2012, based upon its operating forecasts and assuming the successful divestiture of the Systems segment. These forecasts include assumptions regarding:
The divestiture of the Systems segment with minimal funding for ongoing operations prior to its sale or closure;
revenue growth from the acceptance of the Company’s new products; an increase in design services revenue and margins from key optical component
customers; improved gross margins from the transfer of polymer fabrication capacity and key
personnel, and subsequent closing of the Wilmington, Massachusetts facility; improvements in supply chain and inventory management performance; and improved treasury management, particularly as it relates to accounts receivable.
The Company expects to invest up to $1,000 during the next 12 months on component manufacturing equipment to improve manufacturing processes with the ultimate objective of improving gross margins and product offerings, and on design and test equipment. The Company invested US$3,500 into the China JV in May 2011.
20
CAPITAL RESOURCES Enablence finances its operations through the issuance of common shares and certain notes payable. Subsequent to quarter end, on May 5, 2011, Enablence completed a non-brokered private placement financing of 45,500,000 common shares at a price of $0.22 per share for net proceeds of $10,000 (gross proceeds of $10,100). Also subsequent to quarter end, on May 10, 2011, the Company finalized a note payable with a US bank, with a principal amount of US$3,500, secured by US$1,200 cash on deposit and a lien on the shares in the Company’s investment in the China JV. The note has a maturity date of April 20, 2016 and an interest rate at the greater of 5.5% and Wall Street Journal Prime Rate plus 1.5%. The note is repayable as interest only for the first twelve months, then interest and principal amortized over the remaining term of the loan. During the quarter ending March 31, 2011 the Company established a US$ 1 million revolving line of credit. This line of credit is subject to certain limitations, including the amount and age of certain of the Company’s accounts receivable. Interest on the line of credit is calculated at 1.5% over the prime rate as published in the Wall Street Journal. The Company had borrowed the full US$1 million as at March 31, 2011, and repaid the line in May 2011 after the equity financing was completed. On December 6, 2010, Enablence completed a public offering of 36,600 common shares at a price of $0.58 per share for gross proceeds of $21,228 (net cash proceeds of $19,707). As partial compensation for this transaction, 1,464 broker warrants were issued entitling the holder to purchase one common share at a price of $0.58 per share to June 5, 2011. The warrants were valued at $404 and recorded as a non-cash issuance cost. The fair value was determined using the Black-Scholes pricing model. With the acquisition of ANDevices, Inc. in February 2008, the Company assumed a US$3,735 note payable. On July 16, 2010 the note payable, with a principal of USD$1,879 was repaid from the proceeds of a new US$5,000 note payable with a different lending institution. This US$5,000 note payable:
matures on July 20, 2013; bears interest at 1.5 % over the prime rate as published in the Wall Street Journal; is repayable as interest only for the first six months, then monthly payments of US$181
per month for interest and principal thereafter; is secured by the assets of one of the subsidiaries of the Company; and is subject to certain financial performance and asset coverage covenants of one of the
Company’s subsidiaries. As a result, the Company received, after payment of loan placement costs and fees, net cash proceeds of US$3,090.
On June 23, 2010 the Company acquired Teledata. In consideration for acquiring 100% of the outstanding shares of Teledata, the Company:
issued subordinated secured 5% notes payable totaling $10,384 (US$10,000), with a maturity date of June 23, 2012;
issued 54,932 common shares, representing $30,762 (US$30,000) at market value; and paid $10,384 (US$10,000) of cash.
21
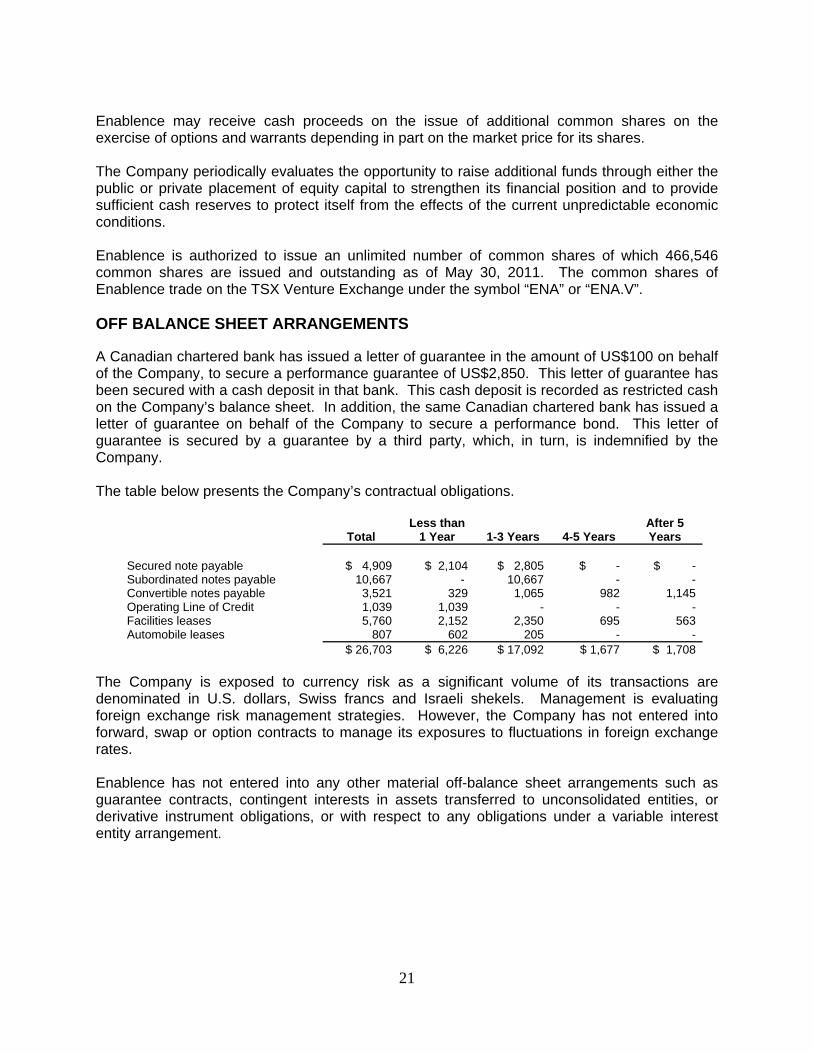
Enablence may receive cash proceeds on the issue of additional common shares on the exercise of options and warrants depending in part on the market price for its shares. The Company periodically evaluates the opportunity to raise additional funds through either the public or private placement of equity capital to strengthen its financial position and to provide sufficient cash reserves to protect itself from the effects of the current unpredictable economic conditions. Enablence is authorized to issue an unlimited number of common shares of which 466,546 common shares are issued and outstanding as of May 30, 2011. The common shares of Enablence trade on the TSX Venture Exchange under the symbol “ENA” or “ENA.V”.
OFF BALANCE SHEET ARRANGEMENTS A Canadian chartered bank has issued a letter of guarantee in the amount of US$100 on behalf of the Company, to secure a performance guarantee of US$2,850. This letter of guarantee has been secured with a cash deposit in that bank. This cash deposit is recorded as restricted cash on the Company’s balance sheet. In addition, the same Canadian chartered bank has issued a letter of guarantee on behalf of the Company to secure a performance bond. This letter of guarantee is secured by a guarantee by a third party, which, in turn, is indemnified by the Company. The table below presents the Company’s contractual obligations.
Total
Less than 1 Year
1-3 Years
4-5 Years
After 5 Years
Secured note payable
$ 4,909
$ 2,104
$ 2,805
$ -
$ -
Subordinated notes payable 10,667 - 10,667 - - Convertible notes payable 3,521 329 1,065 982 1,145 Operating Line of Credit 1,039 1,039 - - - Facilities leases 5,760 2,152 2,350 695 563 Automobile leases 807 602 205 - -
$ 26,703 $ 6,226 $ 17,092 $ 1,677 $ 1,708 The Company is exposed to currency risk as a significant volume of its transactions are denominated in U.S. dollars, Swiss francs and Israeli shekels. Management is evaluating foreign exchange risk management strategies. However, the Company has not entered into forward, swap or option contracts to manage its exposures to fluctuations in foreign exchange rates. Enablence has not entered into any other material off-balance sheet arrangements such as guarantee contracts, contingent interests in assets transferred to unconsolidated entities, or derivative instrument obligations, or with respect to any obligations under a variable interest entity arrangement.
22
TRANSACTIONS WITH RELATED PARTIES During the three months ended April 30, 2010 the Company entered into an agreement to terminate the employment of an executive. In accordance with the terms of his employment agreement, the Company agreed to pay $1,750 in termination costs to this individual. The Company subsequently entered into a fifteen month consulting contract at a value of $375. At March 31, 2011, all but $100 of these obligations had been expensed and paid in cash.
RISKS AND UNCERTAINTIES The Company operates in a dynamic, rapidly changing environment that involves risks and uncertainties and as a result management expectations may not be realized for a number of reasons. An investment in Enablence common shares is speculative and involves a high degree of risk and uncertainty. The current global economic crises pose additional risks and uncertainties which may materially affect management’s expectations. Divestitures may adversely affect our business. The Company is actively pursuing certain divestitures, such as the expected separation of the Systems segment, that would further our business objectives, or eliminate assets that do not meet our return-on-investment criteria. The anticipated benefits of our divestitures and other strategic transactions may not be realized or may be realized more slowly than we expected. Divestitures and other strategic opportunities have resulted in, and in the future could result in, a number of financial consequences, including without limitation: reduced cash balances; contingent liabilities, including indemnification obligations; restructuring actions, which could result in charges that have a material effect on our results of operations and our financial position; legal, accounting and advisory fees; and one-time writeoffs of large amounts. Any investor should also consider carefully these risks and the risks and uncertainties that are detailed in our Annual Information Form filed on August 26, 2010, and available at: www.sedar.com. CRITICAL ACCOUNTING ESTIMATES The preparation of financial statements, in conformity with GAAP, requires management to make estimates and assumptions that affect the reported amounts of assets and liabilities and the disclosure of contingent assets and liabilities as at the date of the financial statements and the reported amount of revenue and expenses during the reporting periods. Actual results could differ from those estimates. Significant estimates include, but are not limited to, investment tax credits, allowance for doubtful accounts, inventory provisions, inventory valuation, asset impairments, accruals, stock-based compensation, the estimated useful lives and valuation of property, plant and equipment, future income taxes, carrying value of intangible assets and goodwill.

23
The Company has adopted the accounting recommendations contained in the CICA Handbook Section 3870 - “Stock-based Compensation and Other Stock-based Payments”. This Section establishes standards for the recognition, measurement and disclosure of stock-based compensation and other stock-based payments made in exchange for goods and services, and applies to transactions, including non-reciprocal transactions, in which an enterprise grants shares of common stock or other equity instruments, or incurs liabilities based on the price of common stock or other equity instruments. The Company uses the fair-value based method to account for all stock-based payments to employees and non-employees by measuring the compensation cost of the stock-based payments using the Black-Sholes option-pricing model. The fair value of the stock-based compensation is recorded as a charge to operations (or share issuance costs for broker warrants) over the vesting period with a credit to contributed surplus. FUTURE ACCOUNTING PRONOUNCEMENTS
Business Combinations
In January 2009, the CICA issued Handbook Section 1582, Business Combinations, which will replace Handbook Section 1581, Business Combinations. The new standard is effective for acquisitions in fiscal years beginning on or after January 1, 2011 but with earlier adoption permitted and provides the Canadian equivalent to IFRS 3, Business Combinations. The Company is assessing the impact of the new standard on its consolidated financial statements.
Consolidated financial statements and non-controlling interests
In January 2009, the CICA issued Handbook sections 1601, Consolidated Financial Statements, and 1602, Non-Controlling Interests, which will replace Handbook Section 1600, Consolidated Financial Statements. These new standards are effective for interim and annual consolidated statements for fiscal years beginning on or after January 1, 2011 but with earlier adoption permitted and provide the Canadian equivalent to IFRS IAS 27, Consolidated and Separate Financial Statements. The new standards are not expected to have a material effect on the Company’s current consolidated financial statements, but will have an impact on the recognition and measurement of the SUNSEA joint venture, when that transaction is completed.
International Financial Reporting Standards ("IFRS")
The Canadian Accounting Standards Board has confirmed that the use of International Financial Reporting Standards (“IFRS”) will be required in 2011 for publicly accountable profit-oriented enterprises. IFRS will replace Canada’s current GAAP for those enterprises. The official change-over date is for interim and annual financial statements relating to fiscal years beginning on or after January 1, 2011. Accordingly, the Company will adopt this new standard for the fiscal year beginning July 1, 2011. Companies will be required to provide comparative IFRS information for the previous fiscal year.
Management has identified the accounting standards that will likely have the greatest impact on the Company’s financial reports due to the magnitude of the related account balance, the significance of the IFRS and Canadian GAAP differences or the complexity of the standard. Management is selecting the IFRS accounting policies that will best reflect the nature of the Company’s assets, liabilities, and business operations and will be in a position to collect the requisite IFRS information for presentation of comparative information with its first fiscal quarter of 2011, starting on July 1, 2011.
24
Management believes that the highest priority areas that IFRS will impact the Company’s financial statements are:
presentation of financial statements; share-based payments; the effects of changes in foreign exchange rate; accounting for government grants and related royalty payments; impairment of assets; provisions, contingent liabilities and contingent assets; and consolidation and business combinations
Management has not yet finalized the estimated impact of these potential changes on its results or financial position. The calculation of share-based payments, such as stock options, under Canadian GAAP, involves making certain estimates, such as the volatility rate and risk free rate of return, at the time of issuance, then amortizing the cost derived from these estimates over the vesting period of the stock options. Under IFRS, the cost of the stock options, which is a non-cash charge to earnings, reflects higher costs during the initial vesting periods, decreasing over the successive vesting periods. Financial statement presentation under IFRS differs, at times materially, from financial statement presentation under Canadian GAAP. As an example, the balance sheet may include changes in the classification of assets and liabilities between current and long-term. Under Canadian GAAP, the Company has determined that its foreign subsidiaries are self-sustaining and therefore translates their foreign currency denominated balance sheet accounts at the relevant period end exchange rate. Under IFRS the Company must assess what the functional currency of each operation, which may result in a conclusion that is different than the one determined under Canadian GAAP’s self-sustaining operations guidelines. Government grants are recorded as a reduction of the expenses they relate to, and reports any royalties paid against these grants as a cost of revenues, under Canadian GAAP. Under IFRS, the government grants are treated as a liability and the related royalties as a payment of interest and principal on the debt. At such time as the Company records an impairment of an intangible asset that charge is a permanent reduction of the intangible asset, under Canadian GAAP. Under IFRS the Company can elect to reverse the impairment charges, if circumstances indicate that the value of the intangible asset has recovered. Under Canadian GAAP, the threshold for determining whether a contingent liability should be recorded in the financial statements is higher than the threshold under IFRS. As a result, under IFRS the Company may have higher total liabilities than it would under Canadian GAAP. The Company has prepared a project plan outlining the areas where changes have to be implemented and the expected completion of each of the areas.

25
CHANGE IN ACCOUNTING POLICY During the three months ended December 31, 2010, the Company changed its accounting policy for the classification on certain third party costs. The Company has reclassified these costs from sales & marketing expense to cost of revenues to provide more relevant information on the financial statements. The reclassifications of $1,177 and $517 have been made for the three months ending Sept 30, 2010 and the two months ending June 30, 2010 respectively, reducing sales and marketing expenses, and increasing cost of revenues. These reclassifications had no effect on the prior year financials statements, nor on previously reported revenue, net loss, Statements of Shareholders’ Equity or Consolidated Balance Sheets for the current year. Disclosure Controls and Internal Control over Financial Reporting Disclosure controls and procedures (“DC&P”) have been designed to ensure that information required to be disclosed by the Company is accumulated and communicated to the Company’s management as appropriate to allow timely decisions regarding required disclosure. Enablence’s Chief Executive Officer and Chief Financial Officer have concluded, based on their evaluation as of the end of the period covered by the annual filings that the Company’s disclosure controls and procedures (“ICFR”) for the three and eleven months ended March 31, 2011 are effective to provide reasonable assurance that material information related to Enablence is made known to them. Following the disposition of the Systems segment, ICFR and DC&P will be adjusted to reflect the modifications to the Company’s reporting requirements. FINANCIAL AND OTHER INSTRUMENTS Enablence's financial instruments consist of cash and cash equivalents, accounts receivable, accounts payable, notes payable and convertible notes. Unless otherwise noted, it is the opinion of Enablence's management that Enablence is not exposed to significant interest, currency or credit risk arising from these financial instruments. The fair value of these financial instruments approximates their carrying value due to their short-term maturity or capacity of prompt liquidation. ADDITIONAL INFORMATION Additional information related to the Company can be found on SEDAR at: www.sedar.com.