enabled by real-world solutions supported by analysis and ......
TRANSCRIPT

©OECD/IEA2017
TheIEAworksaroundtheworldtosupportacceleratedcleanenergytransitionsthatare
enabledbyreal-world SOLUTIONSsupportedbyANALYSIS
andbuiltonDATA

World Energy Investment 2017
Simon Bennett, Economics and Investment OfficeCOP23 IETA Pavilion, 9 NOVEMBER 2017

0
250
500
750
1000
USD(2016)billion
Globalenergyinvestmentfell12%in2016,asecondconsecutiveyearofdecline
Totalenergyinvestmentwas$1.7trillionin2016.Electricitysectorinvestmentovertookoilandgasforthefirsttime,whileenergyefficiencywasthebiggestgrowthsector.
Globalenergyinvestment2016
-25%-1%
+9%
Networks
Renewable
Thermal
Oil&gas
Coal
Electricity Oil,gas&coal RenewablesintransportandheatEnergyefficiency
-25%

Theroleofstateactorsinenergyinvestmentshasincreased
Theshareofstateactorsintotalenergyinvestmentreached42%in2016,largelythankstostate-ownedenterprisesinelectricitysectorinvestment,notablyinChina,andNOCsinupstreamoil&gas
Sourcesoffinancefor2016energyinvestmentsbyfinancingmechanism
7%
93%
ProjectfinanceBalancesheet
42%
47%
11%
Government/SOEsPrivatesectorHouseholds,communitiesandself-consumption
Ownershipof2016energyinvestmentsbytypeoforganisation

0
20
40
60
80
Europe China UnitedStates RestofAsia
USD(2016)billion
EuropeleadsefficiencyspendingbutChinaissettoovertakeitby2018
Policycontinuestounderpinefficiencyspending,especiallyinbuildingsinsulation,heatingsystemsandhomeappliances.Muchofthegrowthintransportefficiencyspendingisinelectricvehicles.
Globalenergyefficiencyinvestment,2016

Electrificationoftransportandheatisprogressing
Electricvehicle(EV)salesgrew38%in2016,bringand,at$6billion,nowrepresent10%ofalltransportefficiencyspending.Another$6billionwasspentgloballyonEVchargingstations.
GlobalelectricvehiclesalesElectricitydemandfromnewheatpumpssold
0
2
3
5
6
2010 2012 2014 2016
TWh
0
250
500
750
1000
2010 2012 2014 2016
Thou
sand
units

0100200300400500600700800
2010 2011 2012 2013 2014 2015 2016 2017
USDbillion
(nom
inal)
0100200300400500600700800
2010 2011 2012 2013 2014 2015 2016 2017
USDbillion
(nom
inal)
USindependents Majors Otherprivate NOCs
37%
12% 14% 14% 14% 16% 10% 13%18% 19% 20% 21% 20%
19% 17%
28%
42%
29%
39%
28%
38%
27%
38%
27%42%
26%
44% 45%
25%
12%21%
25%
405060708090100110120
0100200300400500600700800
2010 2011 2012 2013 2014 2015 2016 2017
USDbillion
(nom
inal)
GlobalCostIndex(Rightaxis)
Global upstream investment rebounds modestly in 2017
RampupofactivitiesleadstocostinflationinUStightoilbutelsewhereupstreamcostsdeclinefurther.NOC’shareintotalinvestmentreachesanotherrecordhigh.
Globaloilandgasupstreamcapitalspending2010-2017
+6%-26%
25%
37%

Oilandgasprojectsmovingtoshortertimelinesandsmallersizes
Ashiftincompanystrategiesandtechnologydevelopmentsleadstoshorterprojectcyclesacrossalltheoilandgasindustry
Averagesizeofconventionalresourcessanctioned andtime-to-market
Deepwateroffshore
Otheroffshore
Onshore
GlobalAverage
1.5
2.0
2.5
3.0
3.5
4.0
4.5
5.0
0 100 200 300 400 500 600 700
Timetom
arket(years)
Averagesizeofresources(Millionbarrels)
2010-20142016-2017

Awaveofcoalpowerinvestmentiscomingtoapause
In2016,sanctioningofnewcoalpowerfelltothelowestlevelinnearly15years,hamperedbycompetitionfromrenewablesandenvironmentalchallenges.GaspowerFIDsexceededthoseforcoalbyover1.5times.
Averageannualfinalinvestmentdecisionsfornewcoal-firedpowercapacity
0
20
40
60
80
100
120
140
2001-2005 2006-10 2011-15 2016
GW China
India
SoutheastAsia
Restofworld
Globalaverageactualadditions

Investmentincleanpowerisnotkeepingpacewithdemand
WhilethecontributionofnewsolarPVandwindhasgrownnearlythree-quartersinthepastfiveyears,FIDsfornuclearandhydropowerhaveslowed.CleanpowerFIDsin2016generateatonlytwo-thirdsthelevelofpowerdemandgrowth.
Expectedannualpowergenerationfromfinalinvestmentdecisions
0
100
200
300
400
500
2012-13 2014-15 2016
TWh
Nuclear Hydropower&otherrenewablesWind SolarPVAveragepowerdemandgrowth(2012-16)

We'vetrackedasteady$37billion/yearofcleanenergyandelectricitynetworksR&Dspending,withroomforgrowthfromtheprivatesector.AsashareofGDP,ChinanowspendsmostonenergyR&D
GlobalcleanenergyR&Dfundingneedsastrongboost
GlobalR&Dspendingoncleanenergyandelectricitynetworks
Top3ITcompanyR&Dspenders
0
10
20
30
40
2012 2015
USD(2016)billion
Private Public

Conclusions
o Investmentfellby12%in2016,asecondconsecutiveyearofdecline,andelectricitysectorinvestmentovertookoil,gasandcoalinvestmentscombined
o AnupswingofUSshaleinvestmentiscreatingatwo-speedoilmarketandtriggeringarapidtransformationoftheoilandgasindustry
o Althoughelectricityinvestmentremainsrobust,policiesneedtofocusonmaintainingsupplyadequacy,stimulatinganaccelerationofcleanpowerandstrengtheningmarketsignalsforinvestmentinflexibility
o ThecleanenergytransitionneedsmoreR&DbutenergyR&Dexpendituresarestable;thereisalotofscopeforincreasedspendingonenergyinnovationbygovernmentsand,inparticular,theprivatesector
o Investmentdecisionstodaywillleavetheirmarkonenergyonenergyinfrastructurefordecadestocome;theIEAwillcontinuetofocusoninvestmentasacornerstoneofasecureandsustainableenergysystem


Energy Efficiency 2017
Brian Dean, Energy Efficiency DivisionCOP23 IETA Pavilion, 9 NOVEMBER 2017

©IEA2017
Key messages
• 2016confirmedtherecentstepupinglobalenergyefficiencygains
• Thisisgeneratingeconomic,socialandenvironmentalbenefits
• Butstrongerpolicyimplementationisessential
Freedownload:www.iea.org/efficiency
©IEA2017
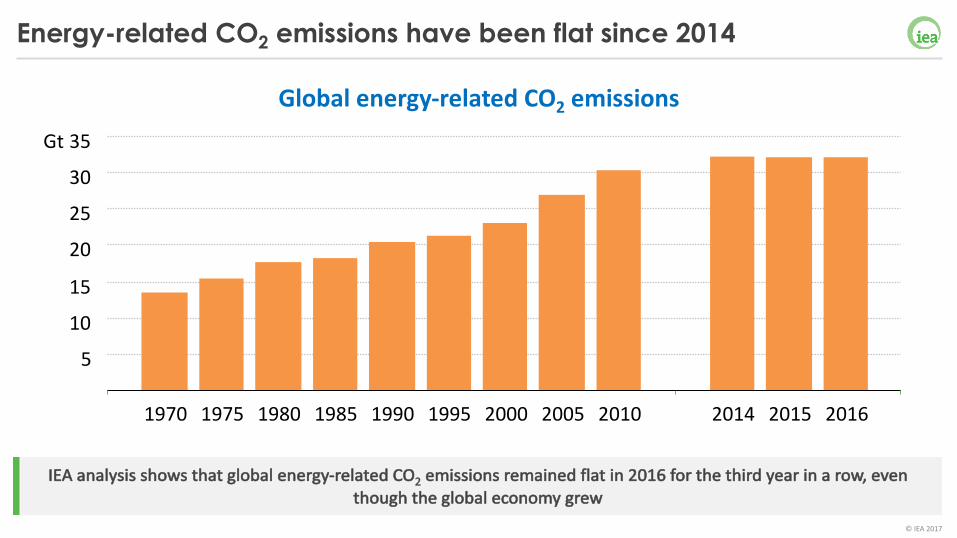
Energy-related CO2 emissions have been flat since 2014
IEAanalysisshowsthatglobalenergy-relatedCO2 emissionsremainedflatin2016forthethirdyearinarow,eventhoughtheglobaleconomygrew
5
10
15
20
25
30
35
1970 1975 1980 1985 1990 1995 2000 2005 2010 2014 2015 2016
Gt
Globalenergy-relatedCO2 emissions
©IEA2017
28
30
32
34
36
2014 emissions GDP growth Renewables and fuel mix
Energy intensity 2016 emissions
Emiss
ions (
Billio
n ton
nes C
O 2e)
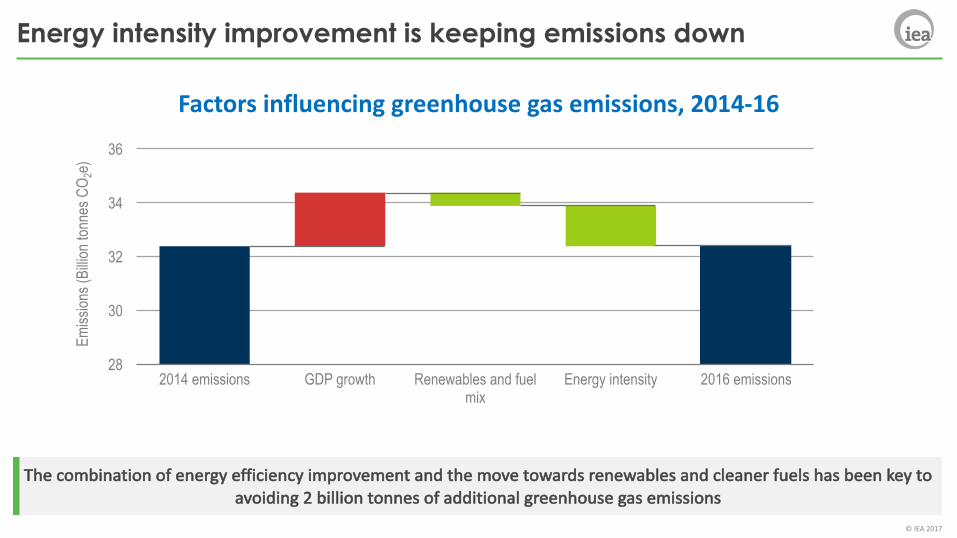
Energy intensity improvement is keeping emissions down
Thecombinationofenergyefficiencyimprovementandthemovetowardsrenewablesandcleanerfuelshasbeenkeytoavoiding2billiontonnesofadditionalgreenhousegasemissions
Factorsinfluencinggreenhousegasemissions,2014-16

©IEA2017
The world is generating more value from its energy use
Thisdecadehasseenintensityimprovementratesatalmostdoublethehistoricaverage,suggestingthattheworldhasenteredaneweraoffasterintensitygains.
Changesinglobalenergyintensity(energyperunitofGDP)
-3.0%
-2.0%
-1.0%
0.0%
1981-90 1991-2000 2001-10 2011 2012 2013 2014 2015 2016
Annu
al ch
ange
in en
ergy
inten
sity
Average annual change 1981-2010 Average annual change 2011-2016

©IEA2017
Efficiency delivers a global energy productivity bonus
The2016intensityimprovementrepresentsanadditionalUSD2.2trillionofvaluecreatedfromglobalenergyuse,equivalenttotwicethesizeoftheAustralianeconomy.
Economicvalueofimprovedenergyintensity,2016(USDbillion)
32260114
532
1127
2174
0%
2%
4%
6%
8%
0 1 2 3 4 5 6 7
2016
impr
ovem
ent in
ener
gy in
tensit
y
Japan European Union
India United States China World

©IEA2017
Global energy use is significantly changing
Energyefficiencyreducedglobalenergyuseby12%in2016,anamountequivalenttotheenergyuseoftheEuropeanUnion.
Globalfinalenergyconsumptionandsavingsfromenergyefficiency
0
2 000
4 000
6 000
8 000
10 000
12 000
2000 2016
MtoeEfficiency savings
©IEA2017
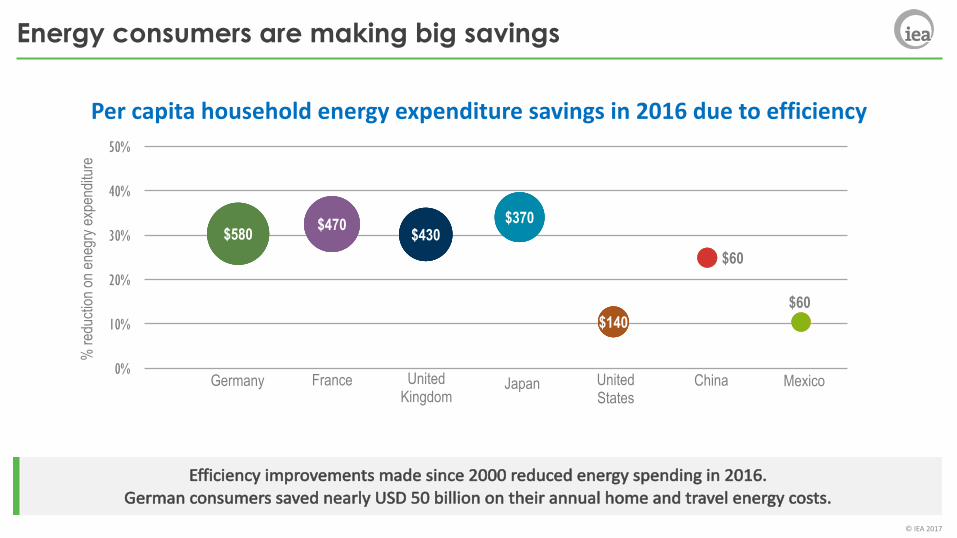
Energy consumers are making big savings
Efficiencyimprovementsmadesince2000reducedenergyspendingin2016.GermanconsumerssavednearlyUSD50billionontheirannualhomeandtravelenergycosts.
Percapitahouseholdenergyexpendituresavingsin2016duetoefficiency
$60
$580 $470 $430$370
$140
$60
Germany France United Kingdom
Japan UnitedStates
China Mexico0%
10%
20%
30%
40%
50%
% re
ducti
on on
eneg
ry ex
pend
iture

©IEA2017
24% 26% 28% 30% 32%
2016
2015
2014
2013
2012
% of global energy use covered by mandatory efficiency policies
Existing policies New policies
Policies of the past drive progress of today
Theamountofglobalenergyusecoveredbymandatoryefficiencypoliciesgrewin2016,but68%ofenergyuseremainsuncovered.Weowetheefficiencygainsoftodaytothepoliciesofthepast.
Annualadditionstotheglobalpolicycoverageofmandatorycodesandstandards
Existing policies New policies

©IEA2017
Vehicle efficiency policy is two-speed
Nearly40countrieshavefuelefficiencystandardsforcars.OnlyCanada,China,JapanandtheUnitedStateshavestandardsfortrucks.
Efficiencystandardcoveragebytransportend-use,2016
0%
10%
20%
30%
40%
50%
60%
Cars
Ener
gy us
e cov
ered
by fu
el eff
icien
cy
stand
ards
Trucks
Europe
Asia
North America
ChinaUSA Japan
Canada

©IEA2017
Space cooling energy use growth
Spacecoolingwillcontinuetobethefastestgrowingsourceofenergydemandinbuildings.
0
100
200
300
400
500
600
1990 2000 2010 2020 2030 2040 2050
Inde
x 19
90 =
100
Space cooling
Appliances and other equipment
Lighting
Water heating
Cooking
Space heating
Globalenergyconsumptionbybuildingend-use,1990-2050

©IEA2017
Demand for space cooling is heating up
Thereissignificantfuturecoolingenergygrowththathasminimalpolicyprogresstoday
Spacecoolingenergyuseandpolicyprogress
0%
5%
10%
15%
20%
25%
30%
35%
40%Policy progress index
Australia Korea United States Japan China India Italy Indonesia Mexico Brazil
2015 energy use 2050 energy use (projected)

©IEA2017
Concluding points
• EnergyEfficiency2017 showsthecriticalimportanceofenergyefficiencytoeconomies,householdsandtheenvironment.
• Therehasbeenastepupinefficiencygainsinrecentyears,despitelowerenergyprices,andthisishavingmanypositiveimpacts.
• However,68%ofglobalenergyuseremainsuncoveredbymandatoryefficiencypolicyandthecurrentlowrateofpolicyimplementationneedstoaccelerate.
• Decarbonisationrequirestheintegrationofefficiencyandrenewablesintotheenergysystemthroughaharmonisedpolicyapproach.
• TheIEAisattackingtheunmetenergyefficiencypotentialbyfacilitatingknowledgesharingandprovidingconcretepolicyrecommendations.

©IEA2017

Renewables 2017
Caroline Lee, Environment and Climate Change UnitCOP23 IETA Pavilion, 9 NOVEMBER 2017

©IEA2017
2016 – Renewables hitting new records driven by solar PV
Renewablesbreakinganall-timerecordaccountingfortwothirdsofglobalnetcapacityadditions;ForthefirsttimesolarPVbecomingthegloballeaderinnetcapacitygrowth
Powercapacityadditionsbyfuel2016
Retirements
0 50 100 150 200
Renewables
Gas
Wind
Solar PV
Coal
Additions (GW)

©IEA2017
Pricediscoverythroughcompetitiveauctionseffectivelyreducescostsalongtheentirevaluechain
AnnouncedwindandsolarPVaverageauctionpricesbycommissioningdate
Competition driving costs down
020406080
100120140160180
2012 2013 2014 2015 2016 2017 2018 2019 2020
USD/MWh
Onshore wind average auction price
Solar PV average auction price

©IEA2017
Renewables growth more and more dependent on wind and solar
SolarPVentersanewera,becomingtheundisputedleaderinrenewablepowercapacitygrowth;PValsoaccountsfor60%oftheupsidepotentialintheacceleratedcase
Renewableelectricitycapacitygrowthbytechnology
0%
10%
20%
30%
40%
50%
60%
70%
80%
90%
0
200
400
600
800
1 000
1 200
1999-2004 2005-10 2011-16 2017-22
Capacity growth (GW)Additional -accelearated caseOther renewables
Hydropower
Solar PV
Wind
% from wind and solar PV (right axis)

©IEA2017
China continues to lead growth while India overtakes the EU
Theforecastis12%moreoptimisticvs.lastyearmainlyduetosolarPVrevisionsinChinaandIndia;Growthcouldbe27%higherwithenhancedpoliciesaddressingregulatoryuncertaintiesandgridintegration
Renewablecapacitygrowthbycountry/region
050
100150200250300350400450500
China United States EU India Japan Brazil Africa & Middle East
Capacity growth (GW)
2011-16 2017-22 main case Additional accelerated case

©IEA2017
Renewables closing the gap with coal
Renewablegenerationtoexpandbyoverathirdwithitsshareincreasingfrom24%in2016to30%in2022,rapidlyclosingthegapwithcoal
Electricitygenerationbyfuel
0
2 000
4 000
6 000
8 000
10 000
12 000
2002 2006 2010 2014 2018 2022
Generation (TWh)
Coal
Natural gas
Nuclear
Renewables

©IEA2017
Surging EVs to complement biofuels in renewable transport
Shareofrenewablesinroadtransportincreasesfrom4%in2016toalmost5%in2022,withbiofuelsrepresenting80%ofthegrowthledbyAsia&Brazil;EVelectricityconsumptiondoublesby2022,withrenewablesproviding30%ofdemand
2016 2022
7%
Biofuelsandelectricvehiclescontributiontorenewableenergyconsumptioninroadtransport
4%Biofuels
EV 2/3 wheelers
Electrc cars and buses

©IEA2017
Progress in renewable heat depends on strong policies
Renewablesshareinheatconsumptionrisesfrom9%in2016to11%in2022.Chinaleadsabsolutegrowthwithnewtargets;EUremainsthelargestrenewableheatconsumerwhiletotalheatdemandoutpacesrenewablesgrowthinIndia
Shareofrenewablesinheatconsumptionbyselectedcountries
0%
5%
10%
15%
20%
25%
2010 2012 2014 2016 2018 2020 2022
% of renewables
European Union
USA
India
China

©IEA2017
Concluding remarks
Ø Renewablesriseby1,000GWto2022,equaltohalfofcurrenttotalcoalcapacity
Ø Renewablesgenerationexceeds8,000TWh by2022,equaltototalelectricityconsumptionofChina,India&Germanycombined
Ø SolarPVentersaneweraleadingthegrowthinrenewables,drivenbyarapidexpansionindeployment&manufacturingcapacityinChina
Ø DespiterapidgrowthinEVs,decarbonisationoftransportisalongwayoff
Ø Only30%ofelectricityusedbyEVsissourcedfromrenewables
Ø Advancedbiofuelsrequirespecificincentivestobolsterdeployment
Ø Policymakershavetoturntheirfocustosystemintegration&expandingtheuseofrenewablesforheating&cooling

©IEA2017
Thank you
Renewables2017TeamYasminaAbdelilah
HeymiBaharEmanueleBianco
UteCollierKarolinaDaszkiewiczPharoahLeFeuvreMeganMercerYasuhiroSakuma
Questionsandcomments:[email protected]

©IEA2017

©IEA2017
Wind and solar transforming power sector - system integration becomes key
Moreflexiblepowersystems,adaptedmarketdesignandpolicieswillhavetoplayakeyroleinintegratinglargersharesofwindandsolarinasecureandcost-effectiveway
VREshareinannualelectricitygeneration2016-22
0% 10% 20% 30% 40% 50% 60% 70% 80%
JapanBrazilIndia
ChinaUnited States
AustraliaItaly
United KingdomGermany
SpainIreland
Denmark
% of total generation
PV share in 2016
Wind share in 2016
Additional PV share in 2022
Additional wind share in 2022