emulsion chamber technology experiment summary
TRANSCRIPT
EMULSION CHAMBER TECHNOLOGY EXPERIMENT
(ECT)
Final Reporton Contract NAS8-38428
SUMMARY
The experimental objective of ECT was to develop space-borne emulsion chambertechnology so that cosmic rays and nuclear interactions may subsequently be studied atextremely high energies with long exposures in space.
A small emulsion chamber was built and flown on flight STS-62 of the Columbiain March 1994. Analysis of the several hundred layers of radiation-sensitive material hasshown excellent post-flight condition and suitability for cosmic ray physics analysis at
much longer exposures. Temperature control of the stack was 20 + I*C throughout theactive control period and no significant deviations of temperature or pressure in thechamber were observed over the entire mission operations period. The unfortunate flightattitude of the orbiter (almost 90% Earth viewing) prevented any significant number of
heavy particles (Z > 10) reaching the stack and the inverted flow of shower particles in thecalorimeter has not allowed evaluation of absolute primary cosmic ray-detection efficiency
nor of the practical time limits of useful exposure of these calorimeters in space to the levelof detail originally planned. Nevertheless, analysis of the observed backgrounds and
quality of the processed photographic and plastic materials after the flight show thatproductive exposures of emulsion chambers are feasible in low orbit for periods of up toone year or longer. The engineering approaches taken in the ECT program were proveneffective and no major environmental obstacles to prolonged flight are evident.
ACKNOWLEDGMENTS
The succe_ful accomplishment of the ECT experiment on STS-62 required theparticipation and effort of many individuals at several institutions. Notable among thesewel'e"
Tom ParneU, Mark Christi, Ellen Roberts, and Walt Fountain, (Marshall Space
Flight Center, Space Sciences Lab, Cosmic Ray Laboratory)
Dave CockreU, Jimmy Johnson, John Owens, Lou Ann Fikes, David Siersma,James McGee, (Marshall Space Flight Center, Engineering)
Steve Sutherlin and John Webber, (Orbital Sciences Corporation, Thermal and
Electrical Engineering)
Gerard Durback, Joanne Baker, Neal Barthelme, (Goddard Space Flight Center,
Engineering)
Eugene Benton, Allan Frank, Eric Benton, (ERIL Research, Dosimetry Program)
Takahiro Tominaga, Bei-Lei Dong, and Kanaya Chevli,(University of Alabama in Huntsville, Cosmic Ray Laboratory)
Francis Wessling, Reinhold Freiseis, Ron Eakes, Lisa Hughes, (University ofAlabama in Huntsville, Engineering)
//
o
2.
3.
4.
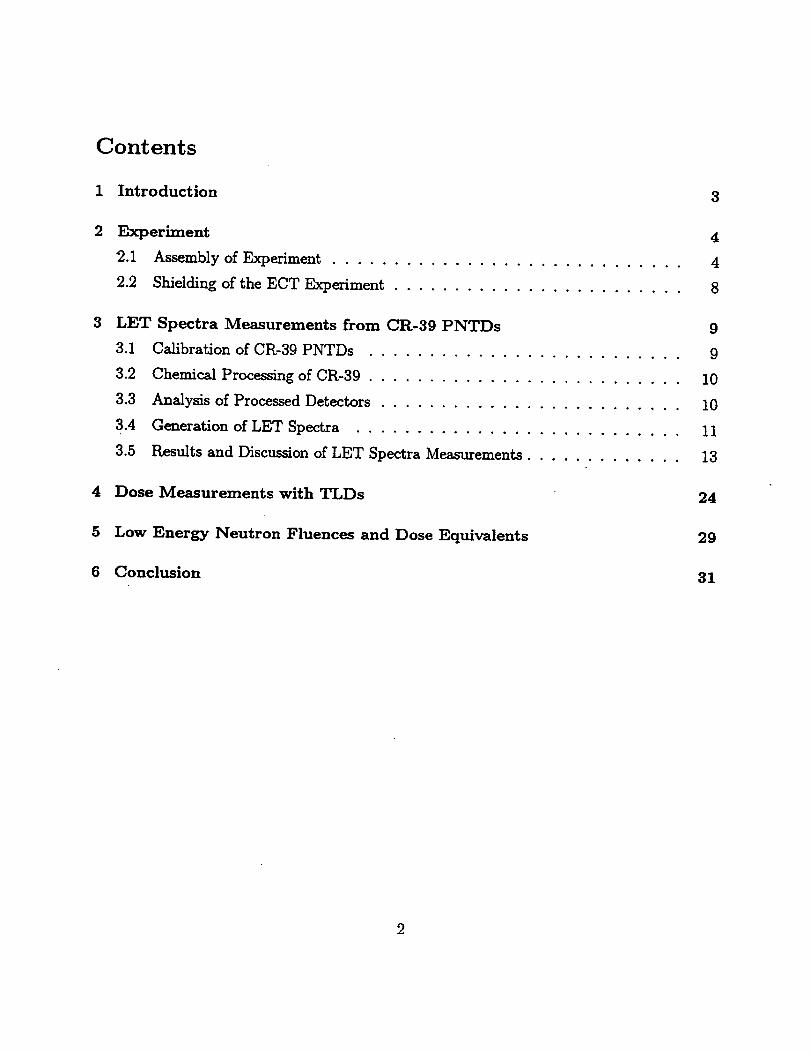
CONTENTS
Introduction .................................................................................................. 1
Instrumentation .............................................................................................. 1
Flight Profile ................................................................................................. 2
Data Analysis ................................................................................................ 3
a) Materials for Data Analysis ....................................................................... 3
b) X-rayb)l.b)2.
Film .......................................................................................... 4
High Energy Event Detection and Energy Spectrum .................................. 5Background Analysis ..................................................................... 6b)2.1. Background Density, Position Dependence and Fluence .................... 6b)2.2. Isothermal, Low-temperature Development Method Required ............. 8
for Space Flight X-ray Filmsb)2.3. Materials Compatibility Studies ................................................ 9
c) Emulsions ......................................................................................... 11
c)l. Quality of Tracks (Examination by Berriman-Curve Test) ........................ 11
c)2. Tracing of High Energy Tracks/Showers in Emulsions ............................ 12c)3. Track Density in Emulsions ............................................................ 13c)4. Linear Energy Transfer (LET) Data ................................................... 14
d) CR-39 Analysis ................................................................................... 14d)l. CR-39 Etching, Uniformity, and Quality ............................................. 15d)2. CR-39 Objects (Etch-pit hole) Data .................................................... 15d)3. CR-39 Data Comparison with Balloon-borne Environments ....................... 16
.
o
Appendix A:
Appendix B:
Appendix C:
Appendix D:
Conclusions: ECT Flight Data and Projected Feasibility for Long-Duration Space .............. 17Flights
References .................................................................................................. 18
Dosimetry Report: LET Spectra, Absorbed Dose and Neutron DoseEquivalents
Thermal, Mechanical and Electrical Systems Report
Emulsion Stack Assembly Procedure
Flight Emulsion Stack Configuration
°°,
Ul
1. Introduction
Emulsion chambers have proven an efficient means of measuring the charge composition
and energy spectrum of cosmic rays in the region above 1013eV (ref 1,2,3,4)). Suchmeasurements require detector exposure factors of thousands of m: hours exposure above the
atmosphere to provide adequate statistics. So far these have been, and continue to be, obtainedusing balloons. However, definitive measurements of abundances above 1015eV require
exposures of detectors of area several m 2 for periods of many months, and ultimately will requireflight on an orbital platform. An engineering test flight of a 40 x 50 cm _ emulsion chamber was
undertaken on the Space Shuttle to evaluate the effects of radiation background, launch, thermal
and other environments on a heavy calorimeter of this type. Since the detector stack was
composed of parallel sheets of total mass-thickness ~ 120g cm 2, it also provided a thick structure
easily modeled for radiation transport calculations. The stack included arrays of small dosimetry
detectors to provide a means of calibrating the transport cedes in the orbital radiation field at high
shielding depths.
This paper describes the technical results of the first orbital flight of an emulsion chamber.
The flight experiment was performed in March, 1994, on NASA's Space Shuttle Columbia, and
designated STS-62. The Emulsion Chamber Technology (ECT) mission was planned to assess
the major uncertainties of space exposure of an emulsion calorimeter through the flight of one
sub-unit of a chamber. Deployment of an actual experiment for astrophysical research purposes
would require an assembly of many such chambers. Verification of the effectiveness of theemulsion chamber technology in space is vital for large-scale cosmic ray experiments on the STS
and the International Space Station platforms. The secondary objective of the ECT flight was toobtain radiation data for studying the effects of shielding on the penetrative particles of interest,
utilizing the emulsion chamber's self-shielding materials that are much greater than the maximum
value in ordinary manned space vehicles.
Our emulsion chambers contain a fine-grain, three-dimensional tracking telescope and a
sampling calorimeter, which have proven powerful in observing very high energy cosmic ray
protons and nuclei. This method was well established for balloon flight experiments by the
Japanese American Cooperative Emulsion Experiment (JACEE) collaboration for directobservation of cosmic rays toward the "knee" region (E - 1015 eV) (1). Very low intensities ofcosmic rays in the "knee" region (~ 100/m 2 year sr at E ~ 1015 eV) call for a large-area and long-
duration space experiments.
Long-duration space experiments, however, pose several logistic and technological
challenges for emulsion chambers. Among many issues, the following three must at least be
studied and overcome for successful experiments: (1) assess the feasibility of track registration
and analyses with emulsions and X-ray f'dms under conditions of high background density of
slow protons coming from the radiation belts, (2) protection from hostile thermal environments tosecure uniform and regular track registration quality, and (3) provision of the mechanical strength
for safeguard of emulsions from extreme vibration and shock loads during launch of the Shuttle.
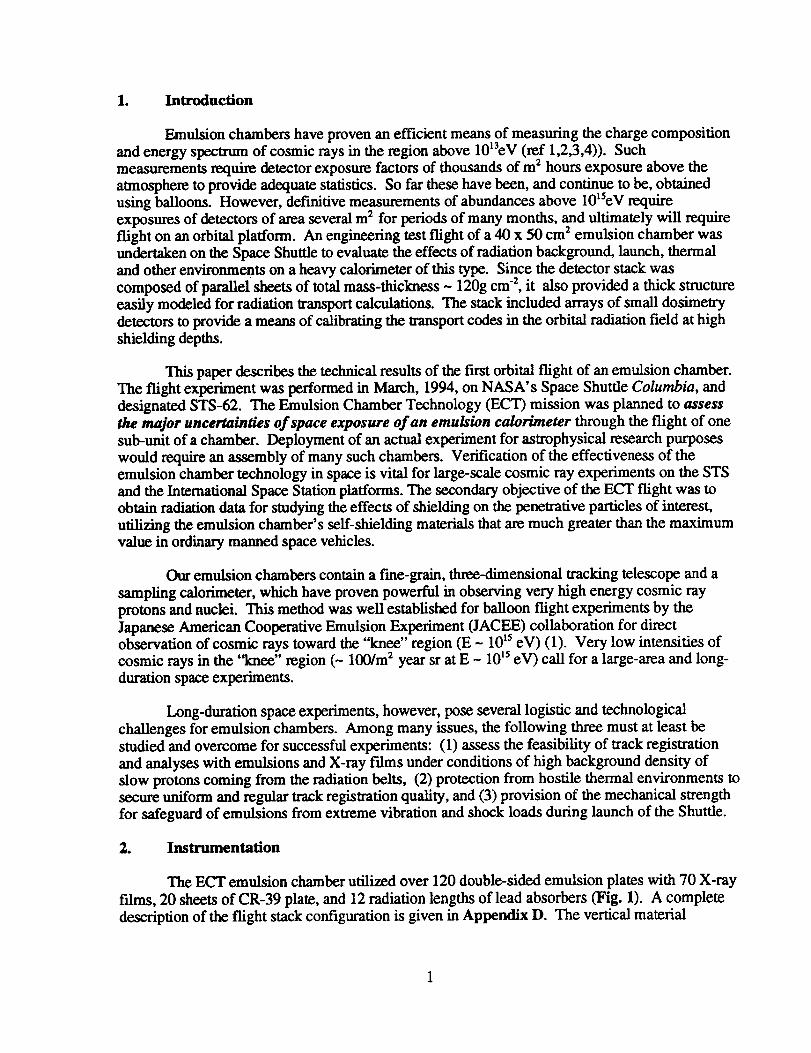
2. Instrumentation
The ECT emulsion chamber utilized over 120 double-sided emulsion plates with 70 X-ray
fdms, 20 sheets of CR-39 plate, and 12 radiation lengths of lead absorbers (Fig. 1). A complete
description of the flight stack configuration is given in Appendix D. The vertical material
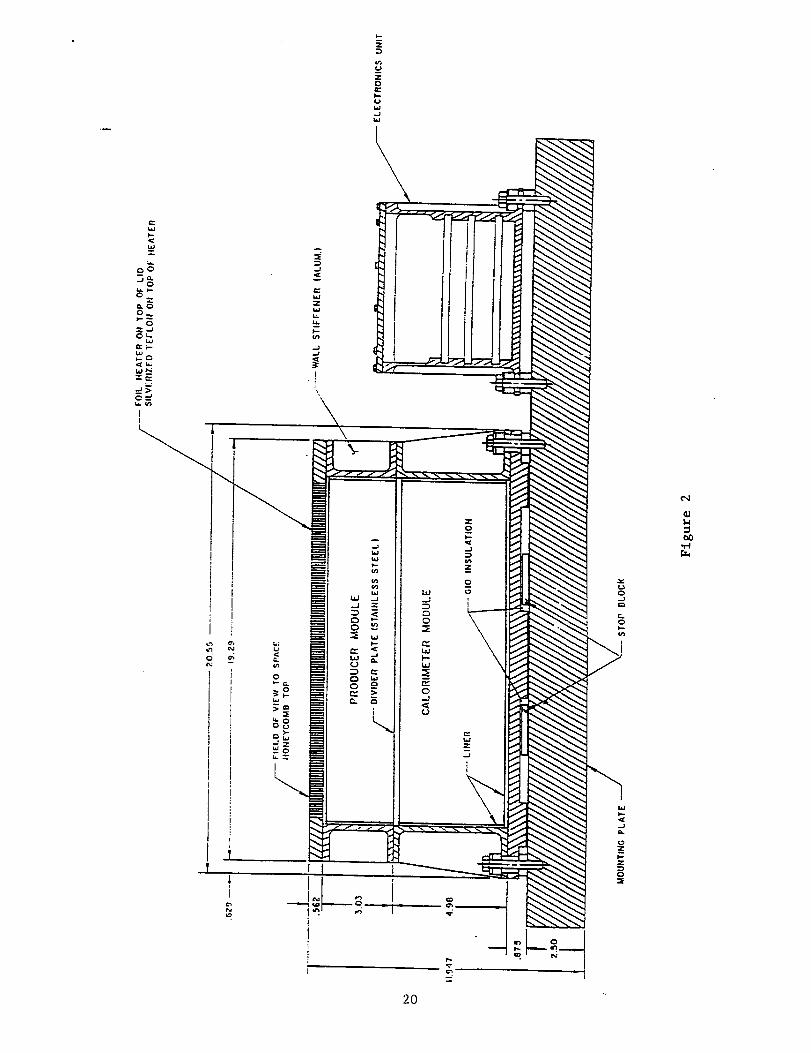
thicknesswas 120 g/cm 2. All thematerialswere tightlymounted ina hermeticallyscaled,
anodized aluminum chamber which was milledout of 2 blocks(Fig.2). The ceilingorlidwas an
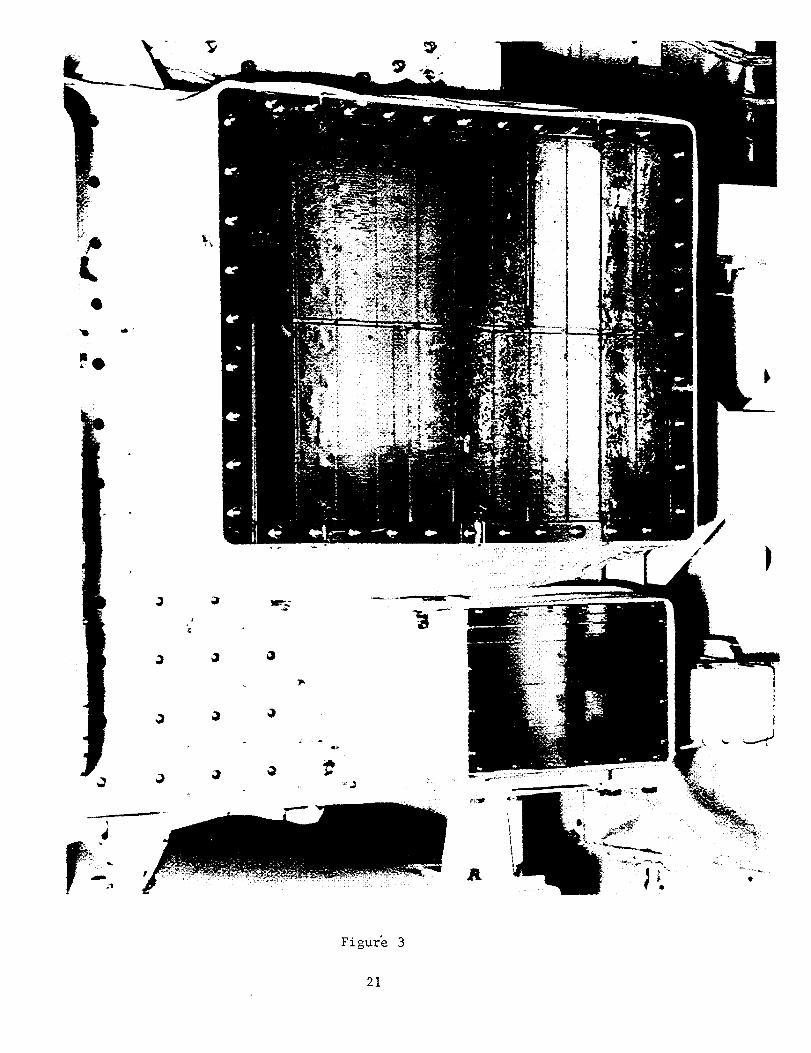
aluminum honeycombpancl. Thin Kapton-film heaterswere mounted on the top and thebottomof the chamber. A dozen thermistorswere mounted insideand outsidethechamber, which, with
an electroniccontrolunit,regulatedtheuniform temperatureof20.0-I-0.I°C, atallthepointsin
the chamber (Fig.3) duringthe periodwhile the system was powered. Ground procedureswere
designed so thatthechamber temperatureshouldnot exceed 30°C atany time. No excursions
above 24°C were encountered.
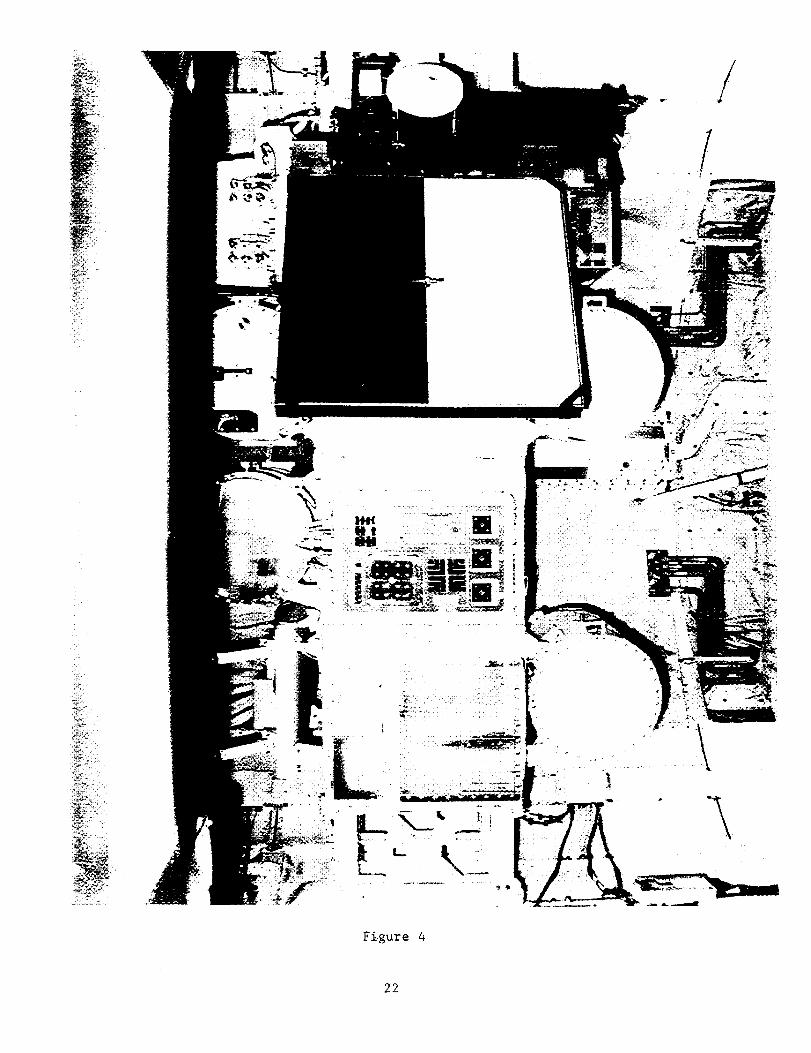
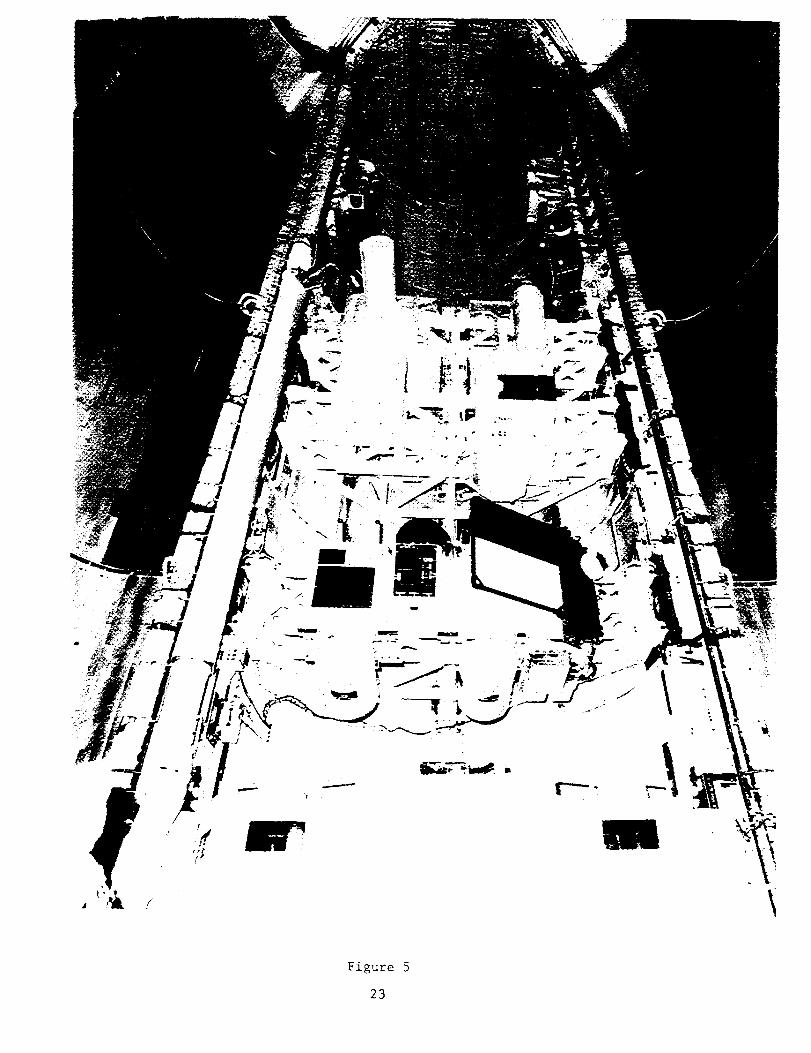
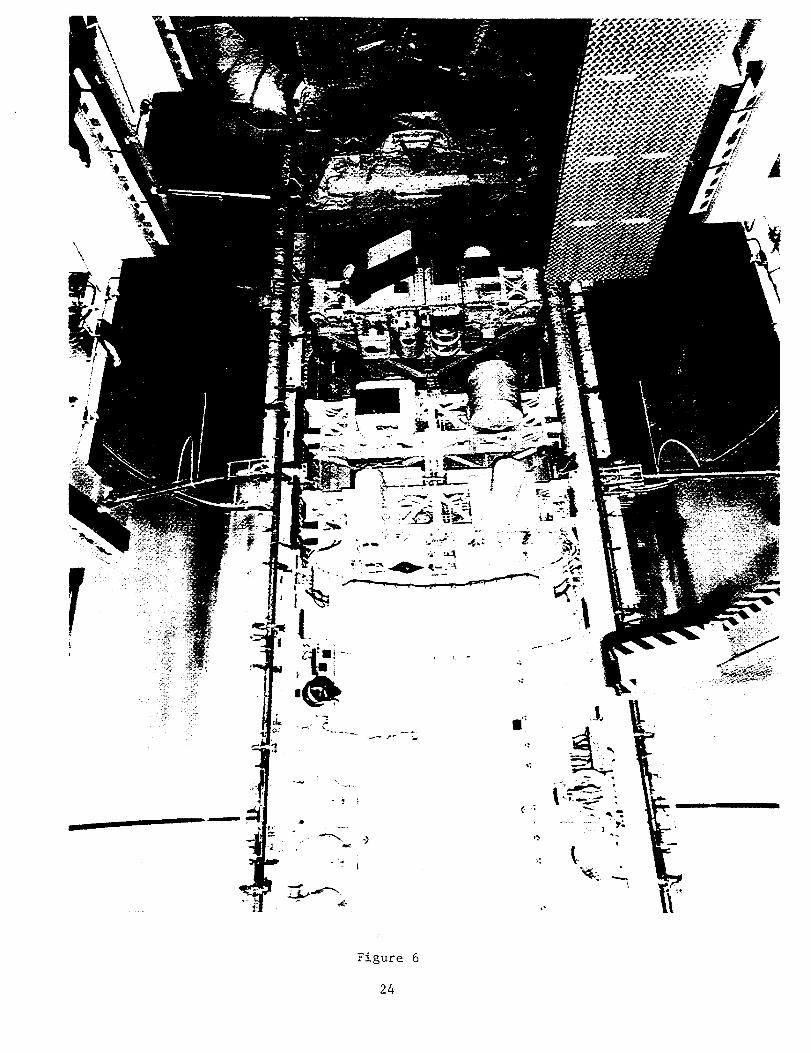
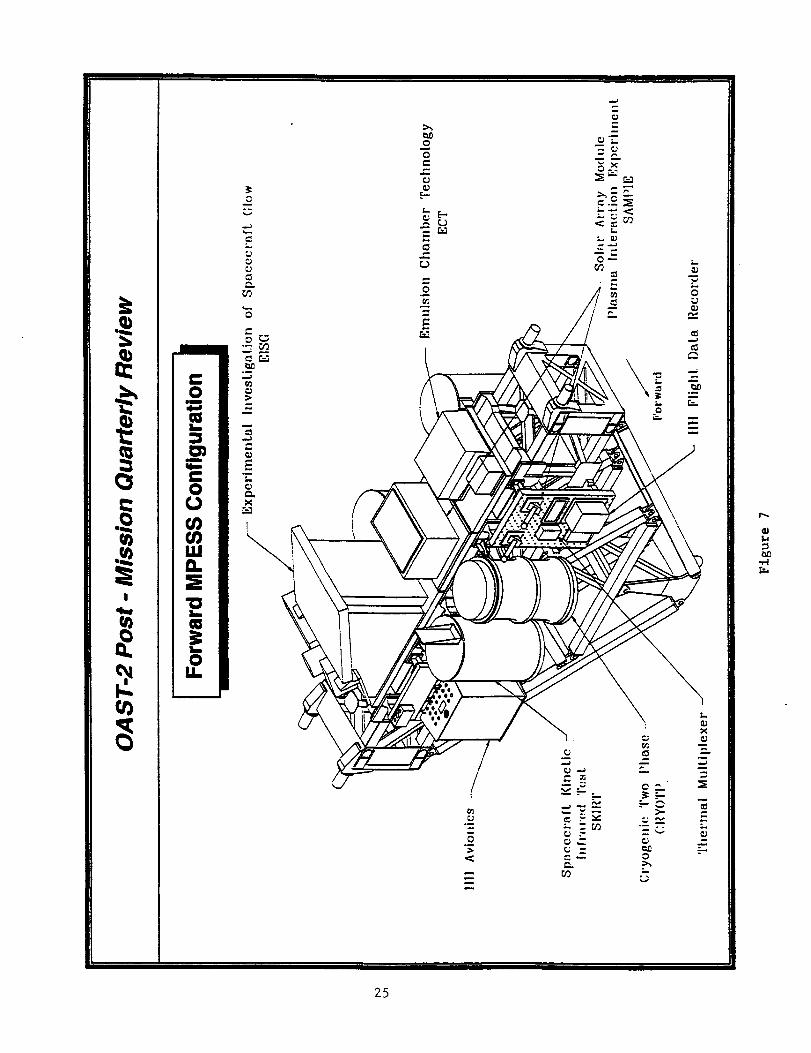
was mounted inthe Columbia on a cross-baystructuretermed the Mission Particular
Experiment Support Structure(MPESS) which was configuredby Goddard Space FlightCenter
tocarrya totalof sixexperiments fortheOfficeof Aeronauticsand Space Technology (OAST).
This configurationwas termed OAST-2. Figs.4,5,and 6 show ECT and the OAST-2 inthe bay
of Columbia. The otherexperimentsareidentifiedinFig.7.
3. Flight Profile of STS-62
STS-62 was launched at 7:53 a.m. CST on March 4, 1994. The mission lasted a total of
335.3 hours or 13.97 days. The orbiter Columbia had a mean altitude of 296 km and an orbital
inclination of 39.0 deg. While the cargo bay doors were open for most of the flight, the bay was
mostly facing the Earth.
ECT was designed to measure cosmic rays and should ideally always have been facing
deep space and away from Earth. Practically, on the Space Shuttle, that is never possible for avariety of reasons. At the time of mission planning, OAST-2 was secondary payload consisting
of 6 experiments. The original ECT requirement was 80 hours space viewing, based on 50%
Space:50% Earth viewing over a possible 6 to 7 day flight. This minimum was subsequentlyreduced to 35-40 hours deep-space viewing. Later, the mission was extended to 14 days without
changing the ECT minimums. Because of United States Microgravity Payload (USMP)
requirements and thermal problems with at least two OAST-2 payloads, the mission was changedfrom a basically gravity-gradient (-XLV) orientation to a mostly Earth-viewing flight. More than
10 days were spent in this latter orientation (-ZLV), with about 80 hours -XLV (equivalent to 40
hours deep-space). There were additional periods of several hours uninterrupted deep-space
viewing which permitted testing of the cold case thermal control system but did not substantially
add to the deep-space viewing fraction of the total exposure.
The result of this orientation mix was that only 12% of the orbital time was spent facing
deep space, with the consequence that almost 90% of all cosmic ray showers entered ECT fromthe bottom, with most of the heavies having already interacted with materials in the Shuttle or the
ECT support structure.
This produced two major impacts:
° The fraction of heavy nuclei detected was very low compared with that originally
expected.
. The effect of retrograde showers through the calorimeter was quite different from
normal (i.e. balloon) experience, preventing direct comparison of proton andhelium fluxes and thus calibration of event-retrieval efficiency. Also, the particle
2
background distribution is different in the stack making extrapolations to much
longer flight times of several months problematical.
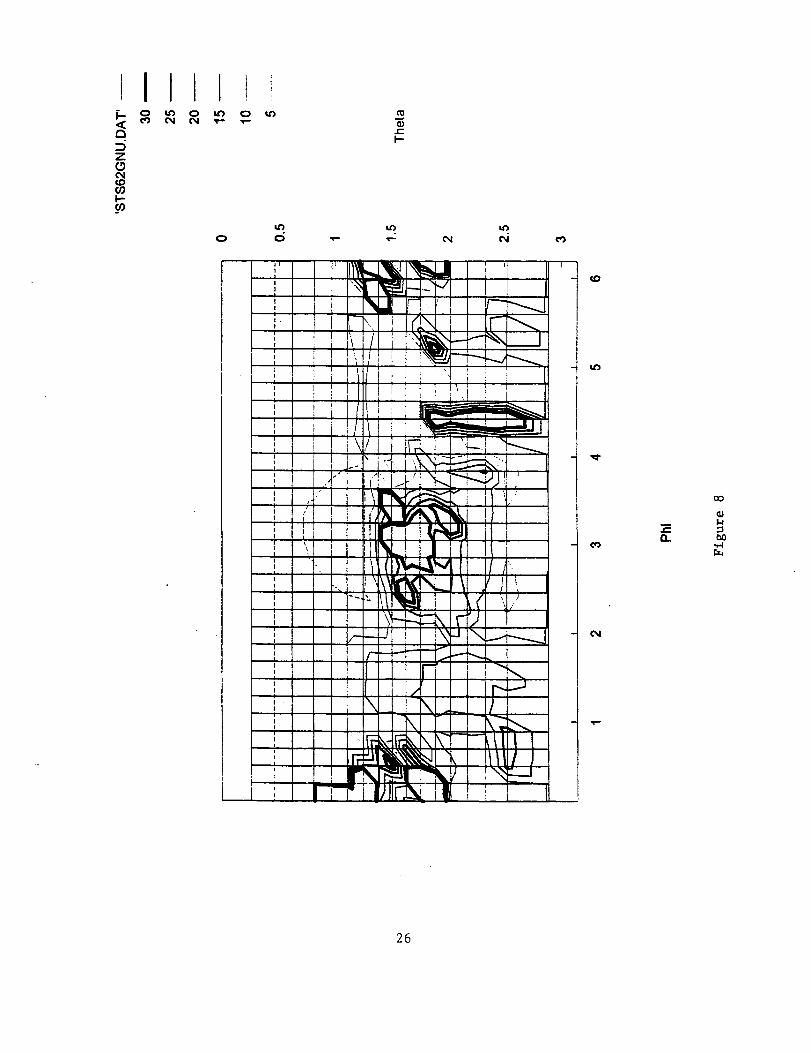
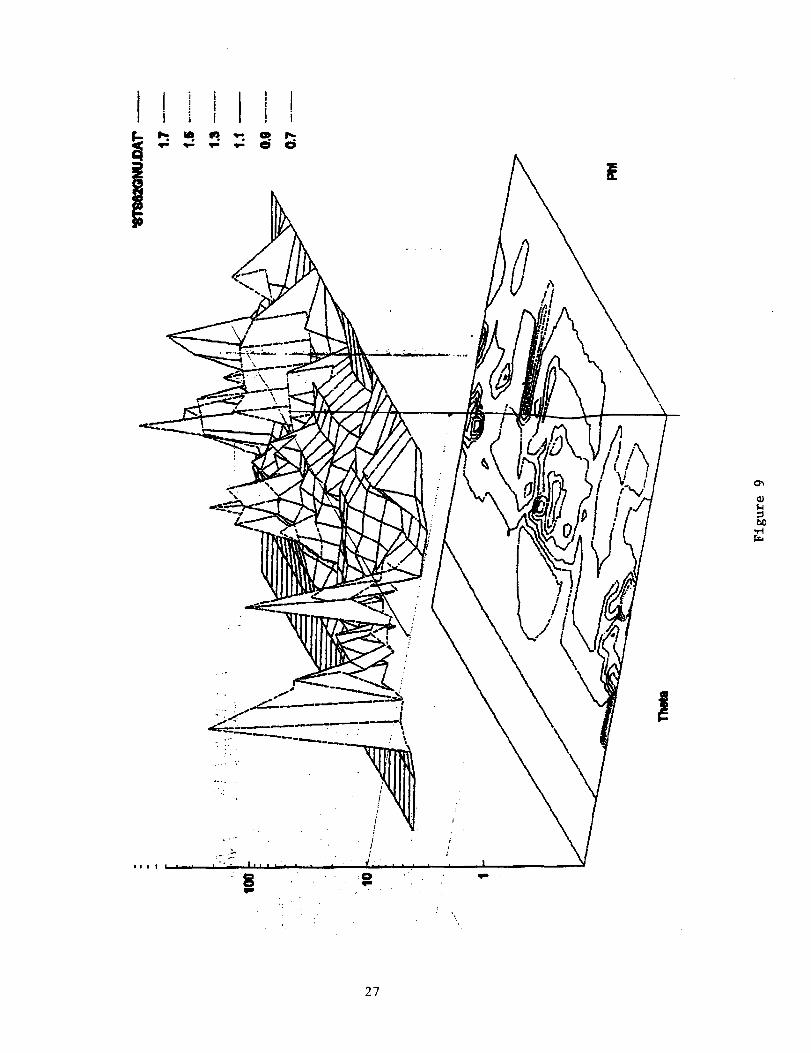
The complex mass distribution of the materials in the Shuttle bay (see Figs. 8 and 9) has
prevented the planned simplification of calculations using NASA radiation-transport codes.
It should be emphasized however that, despite these complications to our original analysisplan, many events were traced, and detailed analyses performed as discussed below. The
engineering approaches used in the ECT experiment were adequate to protect the emulsion
materials and would provide the design basis for a space exposure using emulsion calorimetry for
a flight period many times longer.
4. Data Analysis
4.a) Materials for Data Analysis
All the photographic plates and solid state track detectors in the ECT were analyzed. To
evaluate the performance of the emulsion chamber materials in space flight, an approximately-
identical emulsion chamber of the 1994 Antarctic balloon flight experiment (JACEE-12: a 10-day
circumpolar flight) performed only 3 months prior to the STS-62 flight, was analyzed for
comparison.
The differences observed in these materials are largely a result of the thermal, mechanicaland radiation environments of the space flight and a balloon flight. Table A1 illustrates the major
differences of the EL-q" shuttle flight and the Antarctic balloon flight exposure. The Antarctic
balloon flight was made in the stratosphere (-38 km above the ground) and did not receive any
trapped-belt proton background. However, the year 1994, in which both STS-62 and JACEE-12
were flown, was close to solar minimum and background particle fluxes were high in both ECTand JACEE-12 chambers, due to trapped particles and low energy cosmic rays respectively.
Comparisons of materials from these two flight materials exposed at solar-minimum help define
the background problem and give solid bases for projecting the emulsion chamber capabilities for
future long-duration orbital flights.
Materials in the Ground Control Unit for the EC_'s STS-62 flight were developed and
analyzed together with the flight materials. Other materials used in the analysis include those usedin the Materials Compatibility Tests that were performed during the Production Phase (1991 - 93).
Table A1. Flight parameters of the STS-62 (ECT) and the Antarctic circumpolar experiment(JACEE-12).
Flight Dates Duration of Altitude Temperature Developments
Flight (Averse) durinl_ Flight Processed in
ECT 3/4-18/94 14 Days 296 kin 20 + 0.1 °C May, 1994
JACEE-12 1/3-14/94 10 Days 38 km -5 -4-30C * April, 1994
• Diurnal temperature variation at a particular plate. This does not include stable variations in platetemperatures from top to bottom (-15°(2) in the stack, nor the cool-down period (-1 day)
immediately following balloon launch.
3

4.b) X-ray Films
Assessment of the performance of the X-ray films was made by scanning, mapping, and
photometry of the recorded high energy shower events. While - 1000 high energy events weretypically observed by visual scanning in one block of an emulsion chamber in the JACEE-12Antarctic 10-day flight, the number of events recorded by similar selection criteria in the ECT
experiment was about 500, mainly because most energetic particles entered from the bottom of theinstrument. In fact, the observed number of events above a detection threshold energy of about 3
TeV (sum of gamma ray energies emanating from the interaction) was about 400 events, or 40%
of expectation for full-time deep-space experiment. Most primaries entered the bottom of thechamber, having interacted in the material of the bottom of the shuttle bay, in the MPESS
structure and the experiment mounting plate. Interactions occurring at a distance from the
emulsion chamber produce diffuse showers that are not detected except at very high primary
energies.
The scanning and analysis on this point were made at the UAH Cosmic Ray Laboratory by
using an in-house designed ccD photometer. A sample of events are shown in a photograph of a
flight X-ray film where several high energy cascades are clearly visible. The background darknessdiscussed in the following section appear as a general gray field in the X-ray films, as shown in a
TV picture (Fig. 10a).
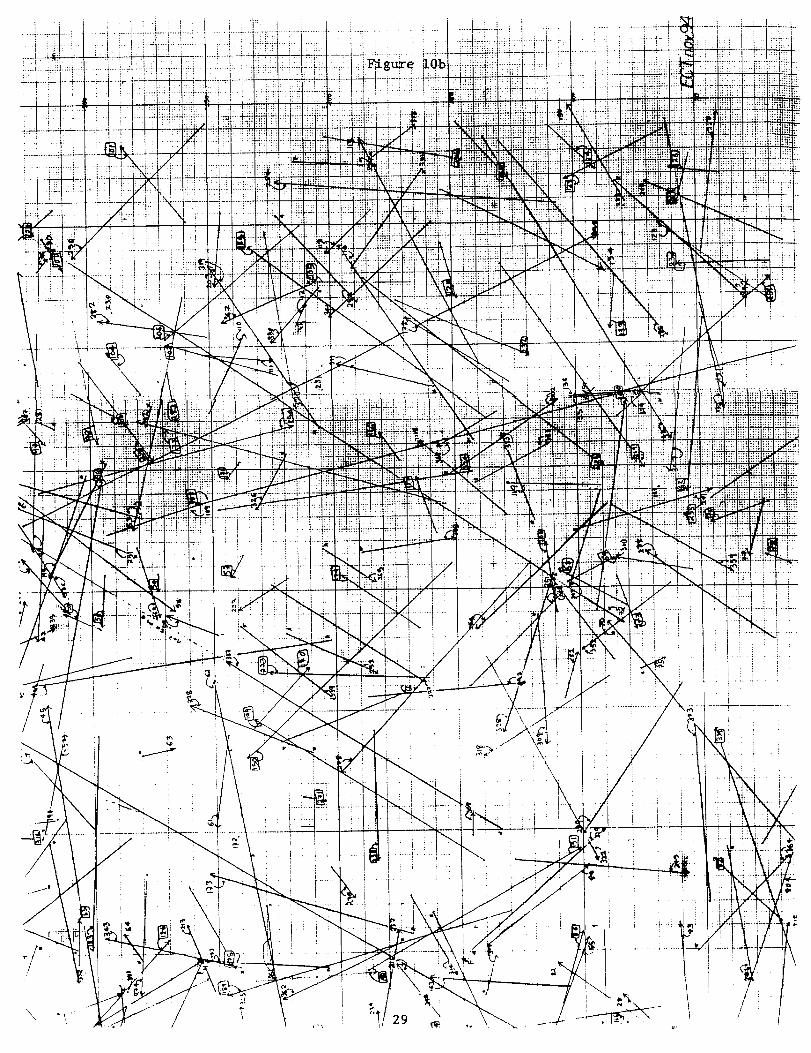
All 32 layers of x-ray fdm in the calorimeter were scanned. The scanned events were
projected onto a single map, which gave the direction and incoming zenith angle of each event at aglance, as shown in Fig. 10b. Using this event-map and x-ray f'tlms, each event spot on x-ray
films was measured for optical density (D,n_,,_). The background density (D_) is also measured
around the shower event. The optical density where a shower is located is
D = D,a,,,, + D_, where (1)
D = log loI./I, (2)
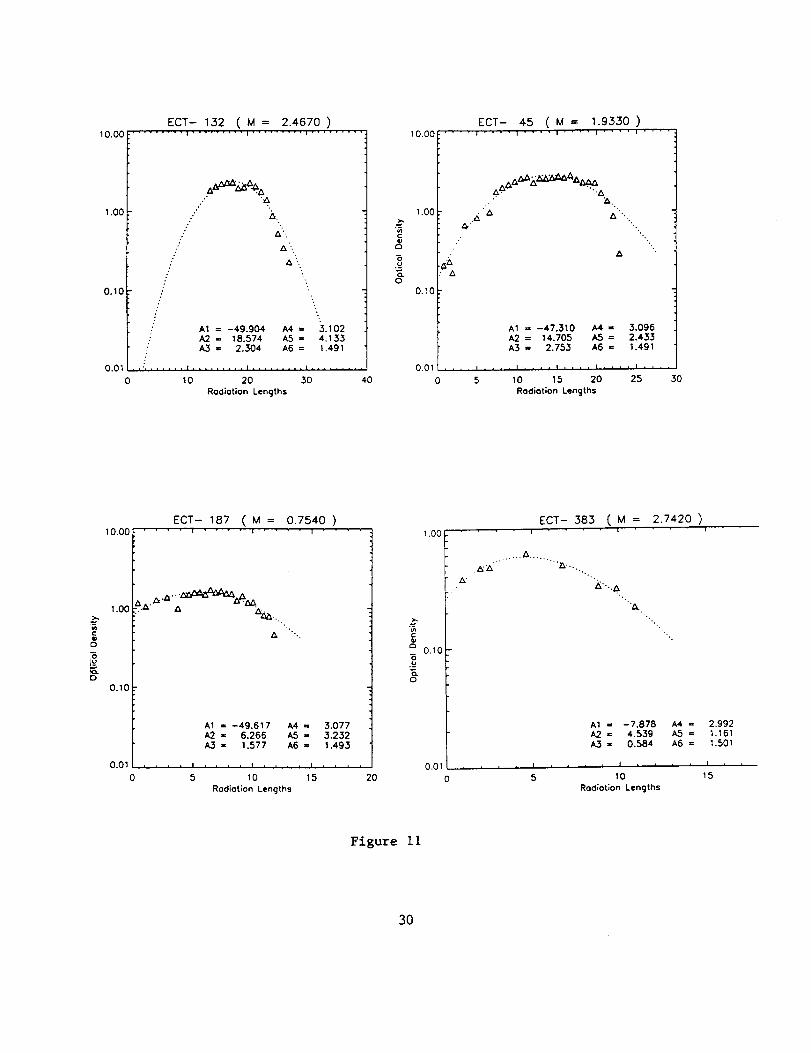
and Io and I are incident and transmitted light intensity measured by a photometer. Thesemeasured data at various radiation lengths in the emulsion calorimeter were plotted as a function ofthe material thickness (t). Automatic shower fitting for each event was performed at NASA
MSFC. Fig. 11 illustrates four such examples. For each shower spot, both D and De were
measured. To eliminate contamination from the shower in the De measurements, the Dbgmeasurements were performed at about 1 cm away from the shower. All the D data for the
shower events thus include two values of D: D,_,_, and Dbf" Only the Deo,,_,'s are used forshower curve analysis. The maximum optical density of an event (D,_) is the De,,,,, ` value at the
maximum point in the fitted curve (shower maximum). It is approximately proportional to the
number of shower electrons (N,), and it can be related to the total shower energy as a power
function of the shower energy (lET):
D=_ *- [YET] °'s. (3)
The world-wide convention of equation (1) that defines the shower density D,a_,._ from
directly measurable film density D and background density D¢ is approximate and valid only for
low optical density measurements. It is increasingly inaccurate for higher energy events that have
high D and/or De values. This is because the quasi-linear response function of the Optical Density
4
ofX-ray filmsgraduallydeviatesfrom lincarityatveryhigh electrondensities(9),and ultimately
saturatesto the asymptoticdensity(D o),
ID = D o (1 ).where a is a constant representing silver grain size (4)
1+ tr.p
High energy events that have high optical density, D_o,_ > 2, in high background-density
exposures are subject to corrections corresponding to the exact definition of the subtraction
formulae (6) for the optical density of the shower, D_,,_. The electron density of the shower
(9_,,_) and background (Pbg) have to he used in subtracting the background density from theelectron density (Pot_) observed in X-ray films. The correct electron density and the optical
density of the shower at all ranges of the optical density are :
and
where
Do(D- Db,)
P_o,,_= Po_r_ed"P_z: _(D0 _ D)(D ° _ Db'), (5)
ID_,,_ = D O (1 - ) = K (D - Dbg ), (6)
1+ t_p,_.,
r-= (1--_o)--_- ° Do ./(7)
The ECT experiment is the first to recognize the limitation of the approximate formulae (1)
in high density environment. We note here that the exact formulae (6) should be used in any
future space experiment where background density Db, is not small. For example, for a film with
a background Db,- 1.0, the correct value of D shower (from equation 6) may equal 3.5, while thevalue from equation (1) is D_o,,= - 3.0.
4. b):l. High Energy Event Detection and Energy Spectrum.
A total of 383 events was measured by photometric shower densitometry with theselection criterion that the event must have more than 6 layers of the D,a_ values above the
minimum set value, D_,_ (t) > 0.15. The average number of the events detected with the same
criterion for the Antarctic 10-day balloon flight (JACEE-12; 1994) was 864 events. This criterion
approximately corresponds to events with the shower energy greater than 3 TeV (primary energy- 12 TeV for protons, 40 TeV for irons). The detected events have various zenith angles ranging
from 0 ° to 87 °. The specmlm analysis was made only for events with the zenith angle from 0 o to
80 o, as the D fit for events with zenith angles from 80 ° to 87 o was relatively poor, due to the fact
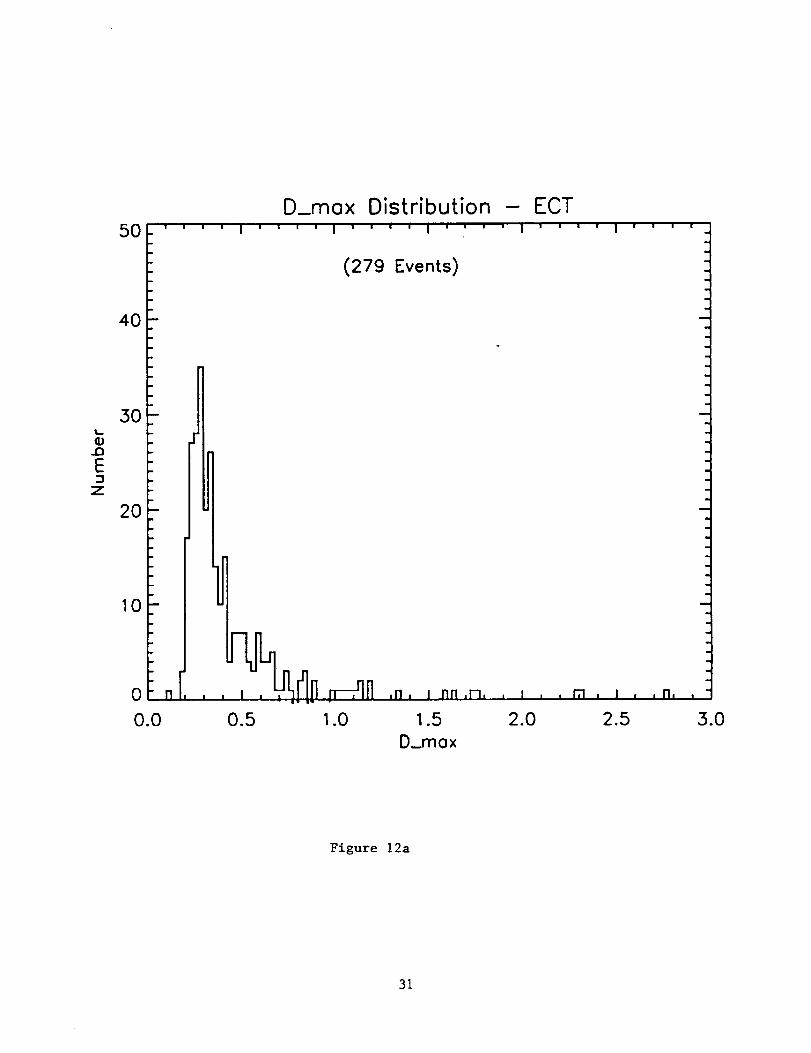
that some of these data were at the edges of X-ray films and there were some uncertainties in Dbsdata at the edges when measured at the point away from the shower spot. The raw ECT data on
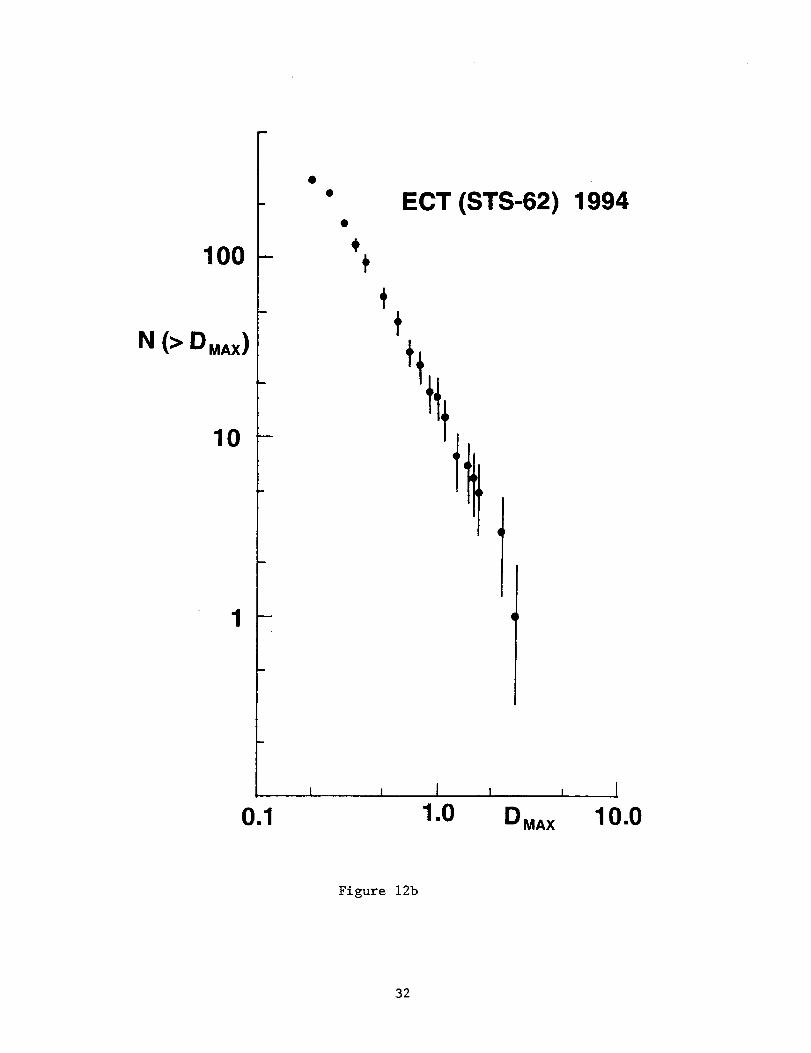
the D z differential distribution is shown in Fig. 12a. The integral D_ spectrum of high energycosmic rays from measured events is (Fig. 12b):
I(> Dm,,_ ) = 1005 (Dm_/0.1) "t'u± 0.096 (8)
5
The integral energy spectnun I(>ZET (TeV)) can be obtained from the D._ spectrum by using
the relationship, D_.,_ *_ [ZET] °'s,
I(>ZEy (TeV)) _ (>ZET)" 1.5o±o.os (9)
The ECT result formulae (9) is consistent with the all-particle energy spectrum for high energy
cosmic rays observed on several JACEE balloon flight experiments, namely:
I(>EE7 (TeV)) ._ (>EET) (1.,5- 1.55) (10)
This close correlation between measured spectral indices of the gamma-ray inelasticity for
the space-flight and balloon flight data confirms the spectrographic capability of the emulsion
chamber for high energy cosmic rays. Although a large part of the flight time was earth-facing,
and the majority of high charge events interacted with the materials of the shuttle bay floor, theemulsion chamber recorded and identified most of them as interactions originating outside the
chamber. Those inversely-developing shower events were degraded in the detectable shower
energy (r.E_) due to spreading of showers in the path between the vertex (cargo bay floor) and the
ECT calorimeter. The inversely-developing events in the integral energy spectrum are reduced in
intensity by the reduced (_'t) value which were measured within a finite photometric slit size (250_a x 250 _tm). The loss in the intensity in such a raw (uncorrected) energy spectrum was about
60%, if compared with the prediction for the full-time deep-space flight (~ 1000 events).
Low energy cosmic ray protons (E < 10 TeV) and shower electrons were major
components of the track background in the emulsion chamber. In spite of the fact that a large
portion of cosmic rays entered the F.L-W chamber after passing through the materials of the cargo
bay floor, secondary tracks (leading cosmic ray particles, fragments, produced mesons, and
showers) were still at relatively high energies, and were not absorbed by these materials. They
were accompanied as "inversely developing showers" as shown later in Fig. 19. Hence, the totalbackground intensity due to cosmic rays experienced for the inverted exposure of ECT is
approximately equivalent to a 14-day deep-space orientation flight, at least in the majority of thebulk of the chamber.
The recognition of this fact is important as a preamble in the evaluation and extrapolation
procedures of the Emulsion Chamber Technology in space for future long-duration orbital flights.
4.b):2 Background Analysis
4.b):2.1 Background Density, Position Dependence and Fluence
The background optical density was in the order of 2.4 in the central part of the x-ray films when a conventional, regular development method (20 0(2 isothermal) was adopted. That
of the Antarctic, long-duration balloon flights (10 days) in the similar period (JACEE-12) was 2.2.Both ECT and JACEE-12 received the highest cosmic ray background intensity at the solar
minimum period, when the geomagnetic cut-off was the lowest and the lowest energy cosmic ray
particles entered the detectors without magnetic rejection. These values of the background
densities are approaching the limit of efficient use of X-ray films. The actual films were processedwith drastic reduction of background density to D = 0.2 ~ 0.6 by a new, low-temperature method,described in the next section.
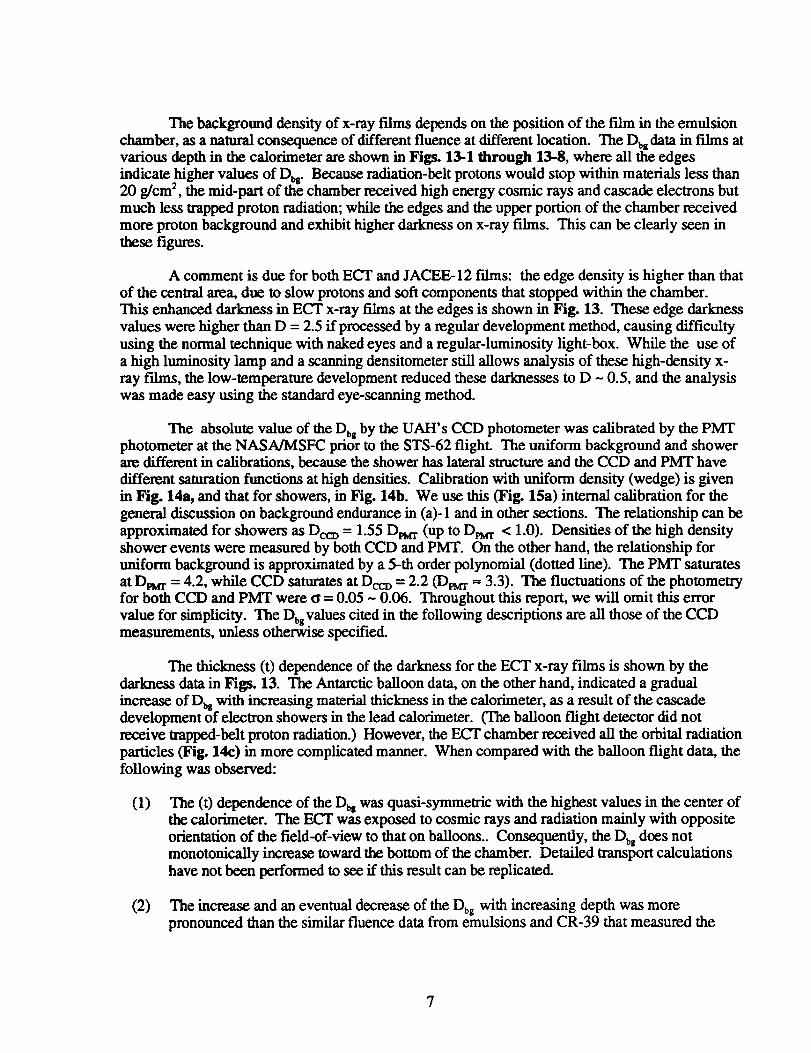
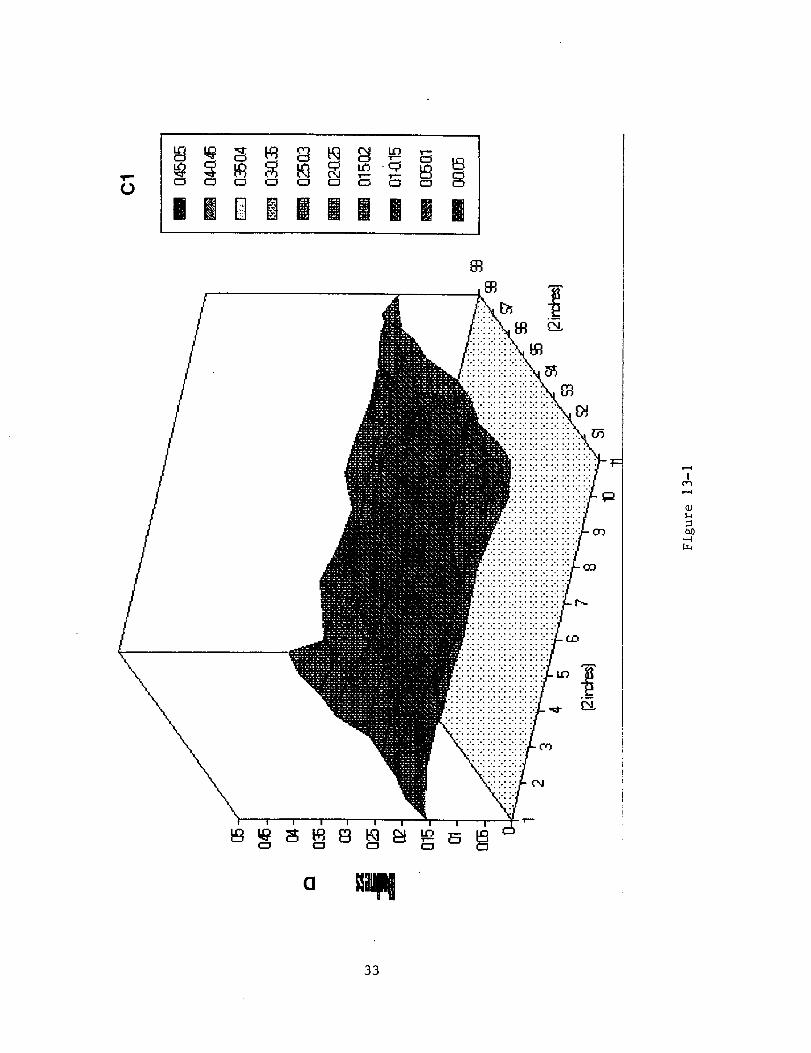
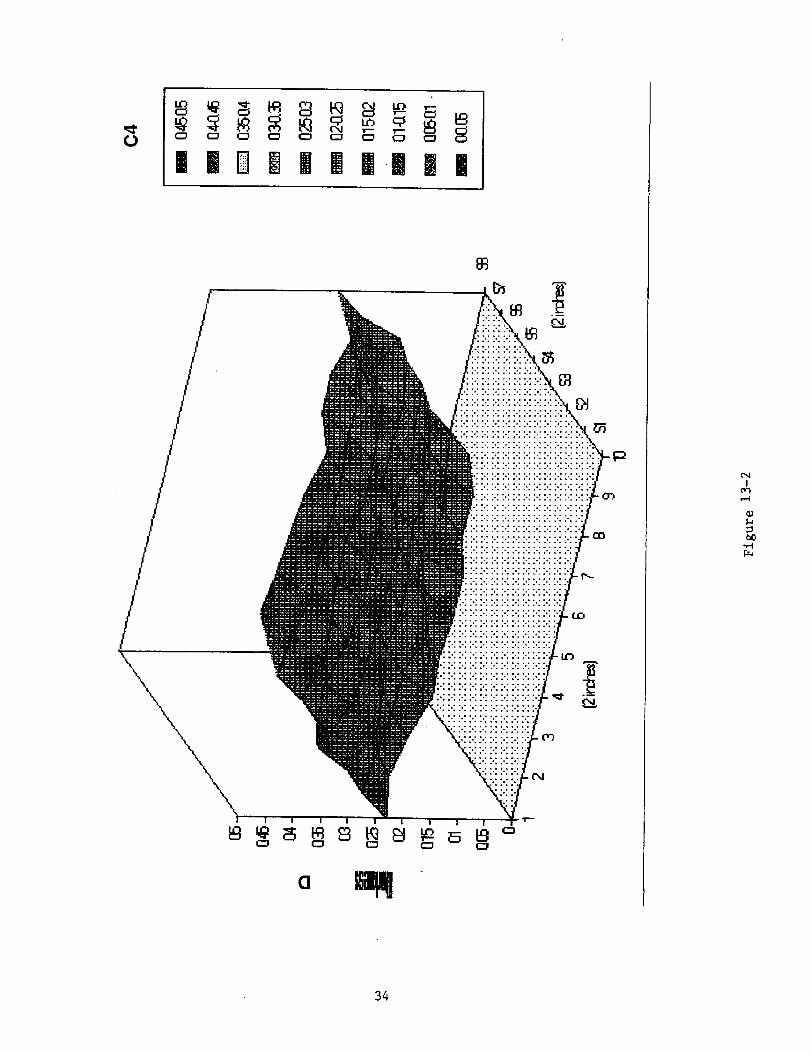
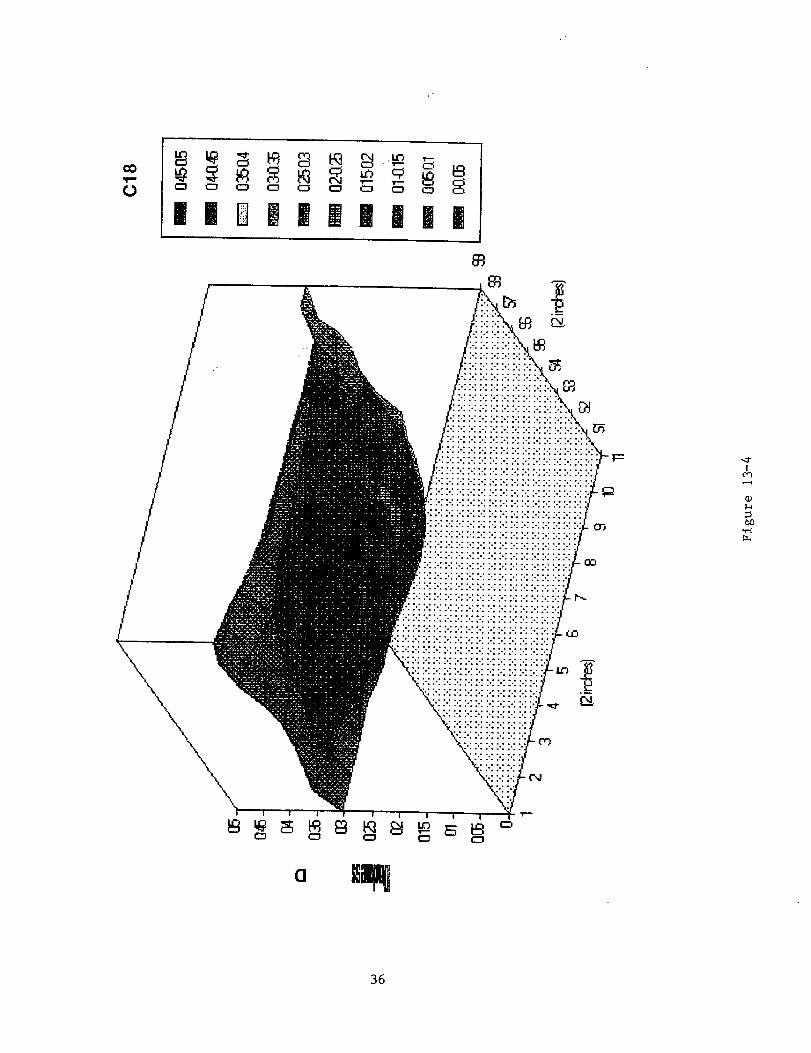
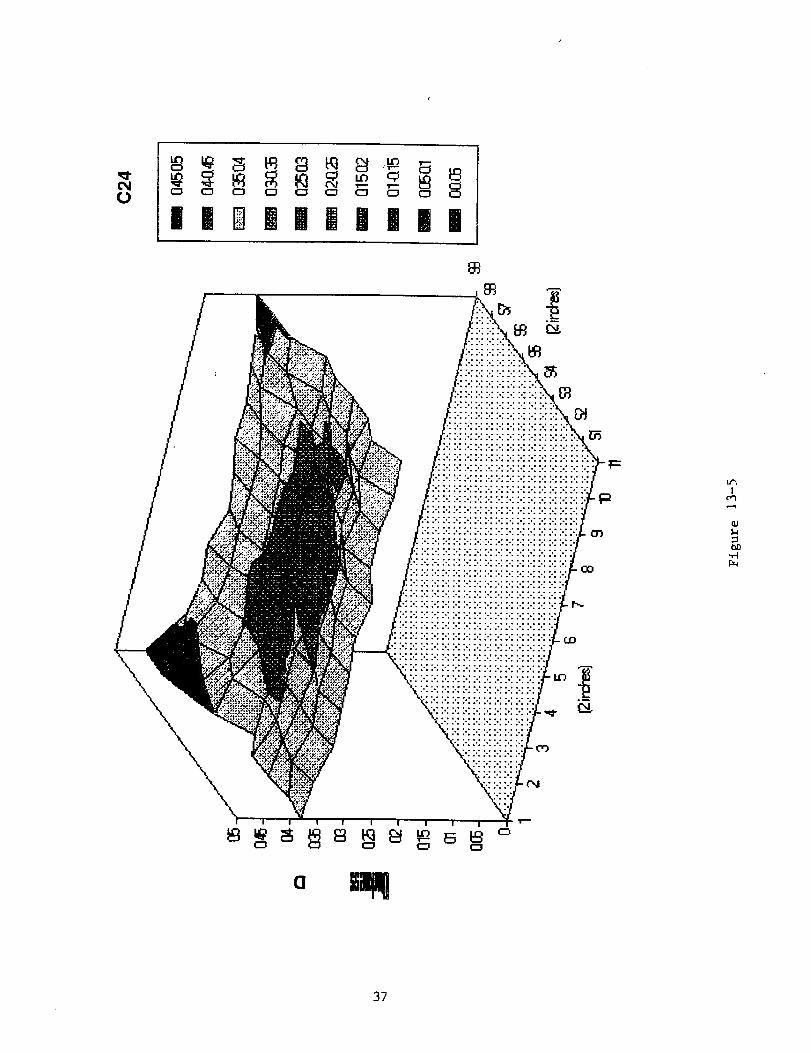
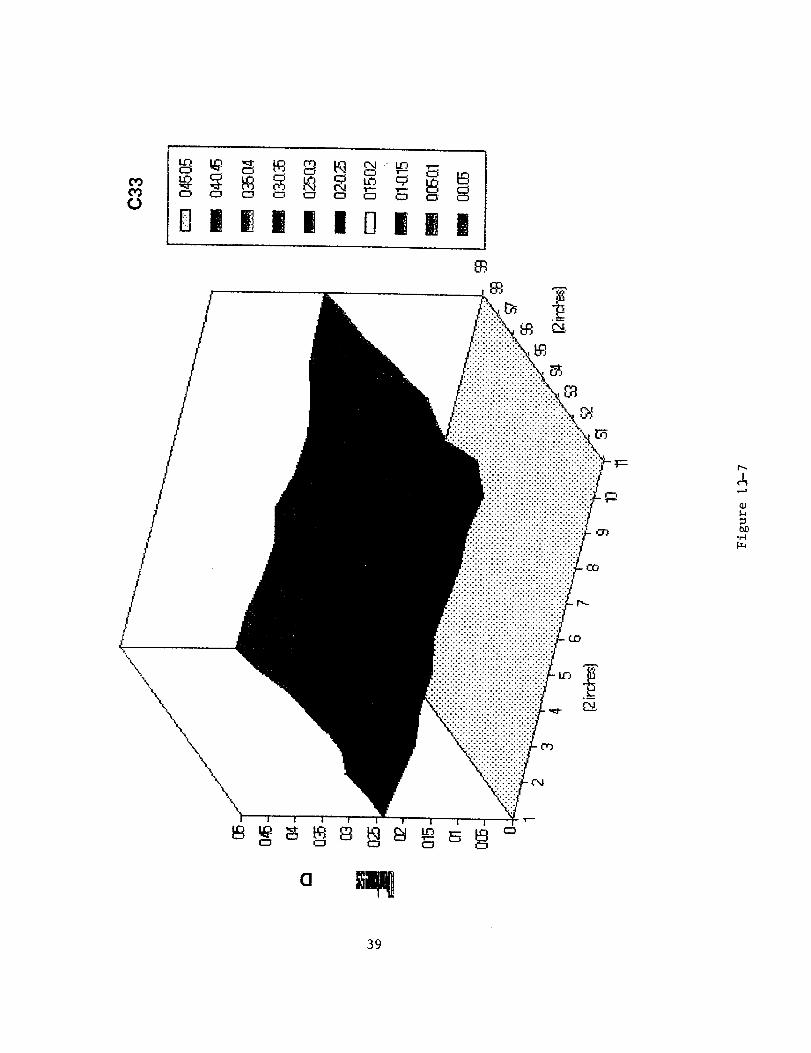
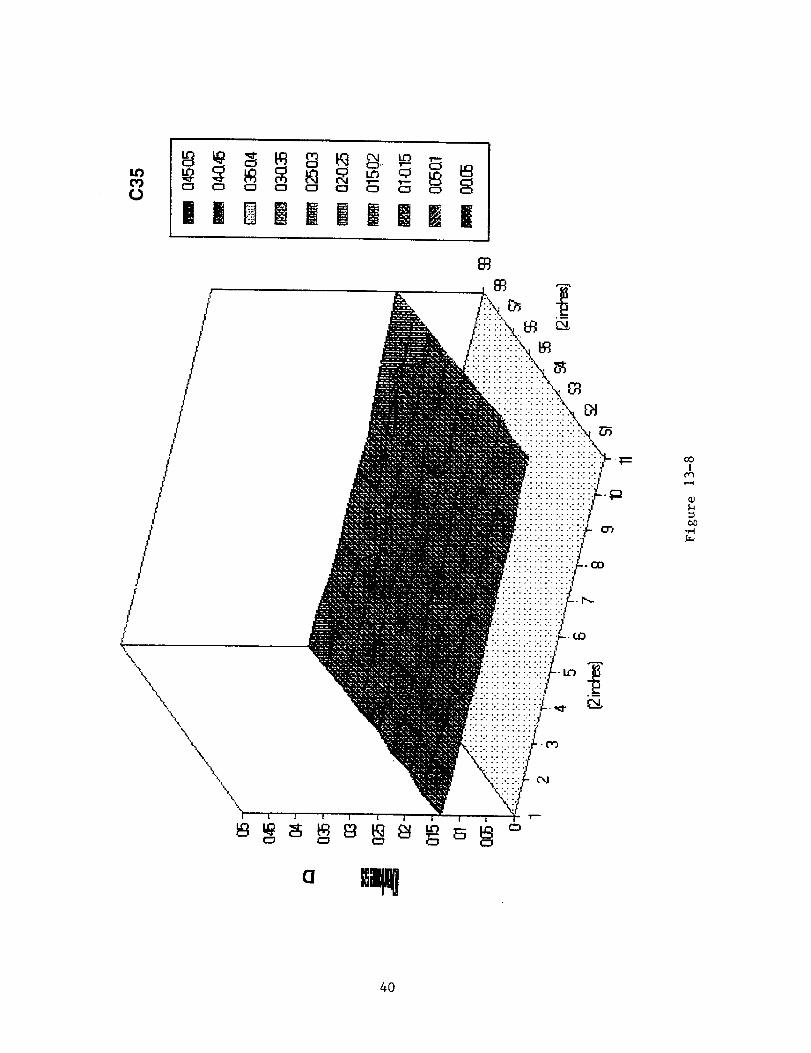
The background density of x-ray f'flms depends on the position of the film in the emulsion
chamber, as a natural consequence of different fluence at different location. The D_ data in films atvarious depth in the calorimeter are shown in Figs. 13-1 through 13-8, where all the edges
indicate higher values of D_r Because radiation-belt protons would stop within materials less than20 g/cm 2, the mid-part of the chamber received high energy cosmic rays and cascade electrons but
much less wapped proton radiation; while the edges and the upper portion of the chamber received
more proton background and exhibit higher darkness on x-ray films. This can be clearly seen inthese figures.
A comment is due for both ECT and JACEE-12 f'tlms: the edge density is higher than that
of the central area, due to slow protons and soft components that stopped within the chamber.
This enhanced darkness in ECT x-ray films at the edges is shown in Fig. 13. These edge darkness
values were higher than D = 2.5 if processed by a regular development method, causing difficulty
using the normal technique with naked eyes and a regular-luminosity light-box. While the use of
a high luminosity lamp and a scanning densitometer still allows analysis of these high-density x-
ray films, the low-temperature development reduced these darknesses to D - 0.5, and the analysiswas made easy using the standard eye-scanning method.
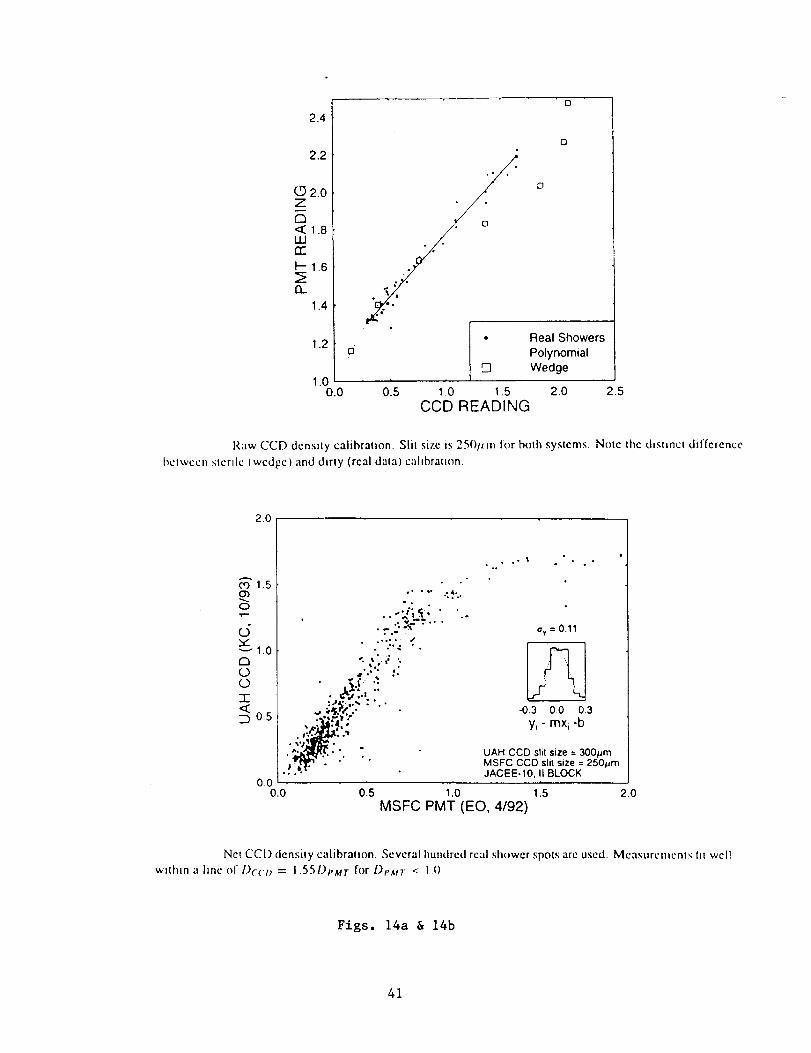
The absolute value of the Dbs by the UAH's CCD photometer was calibrated by the PMTphotometer at the NASA/MSFC prior to the STS-62 flight. The uniform background and showerare different in calibrations, because the shower has lateral structure and the CCD and PMT have
different saturation functions at high densities. Calibration with uniform density (wedge) is given
in Fig. 14a, and that for showers, in Fig. 14b. We use this (Fig. 15a) internal calibration for thegeneral discussion on background endurance in (a)-1 and in other sections. The relationship can be
approximated for showers as Dc_ = 1.55 Da.tr (up to Dv_ r < 1.0). Densities of the high density
shower events were measured by both CCD and PMT. On the other hand, the relationship for
uniform background is approximated by a 5-th order polynomial (dotted line). The PMT saturates
at Da,rr = 4.2, while CCD saturates at Dcct, = 2.2 (Dr_rr = 3.3). The fluctuations of the photometryfor both CCD and PMT were t_ = 0.05 ~ 0.06. Throughout this report, we will omit this error
value for simplicity. The D b_values cited in the following descriptions are all those of the CCDg. .
measurements, unless otherwise specified.
The thickness (t) dependence of the darkness for the ECT x-ray films is shown by the
darkness data in Figs. 13. The Antarctic balloon data, on the other hand, indicated a gradual
increase of D_ with increasing material thickness in the calorimeter, as a result of the cascadedevelopment of electron showers in the lead calorimeter. (The balloon flight detector did not
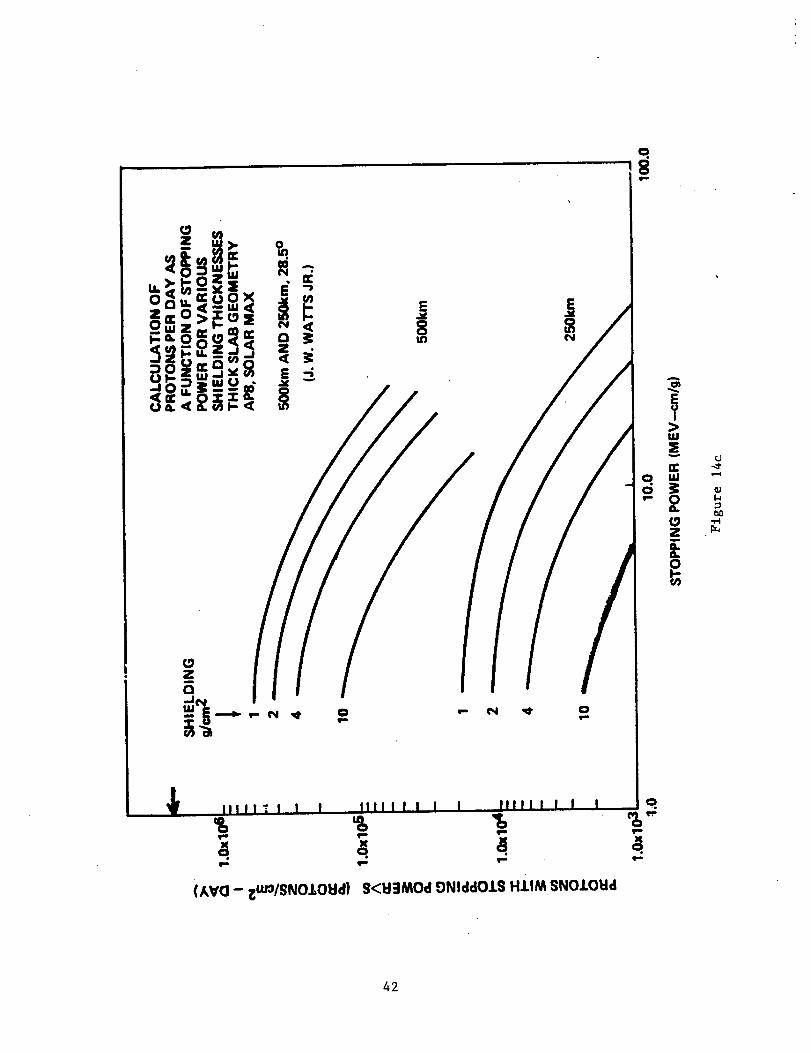
receive trapped-belt proton radiation.) However, the ECT chamber received all the orbital radiation
particles (Fig. 14e) in more complicated manner. When compared with the balloon flight data, the
following was observed:
(1) The (t) dependence of the D_ was quasi-symmetric with the highest values in the center ofthe calorimeter. The ECT was exposed to cosmic rays and radiation mainly with opposite
orientation of the field-of-view to that on balloons.. Consequently, the D_ does notmonotonically increase toward the bottom of the chamber. Detailed transport calculations
have not been performed to see if this result can be replicated.
(2) The increase and an eventual decrease of the Dbg with increasing depth was morepronounced than the similar fluence data from emulsions and CR-39 that measured the
This observation might offer a plausible explanation to account for the enhanced depth-dependence
of x-ray film data, although we cannot quantitatively fully understand the ECT fright data at this
point. The analysis is complicated by the mixing of different radiation profiles due to the mixed
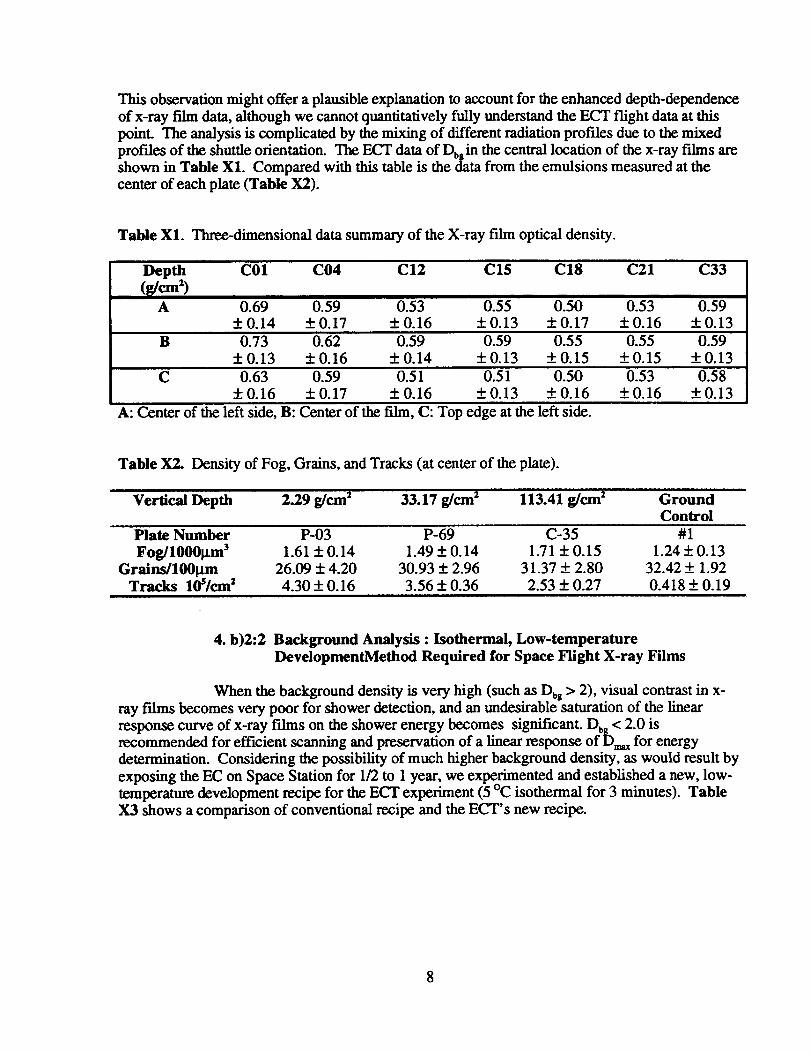
profiles of the shuttle orientation. The ECr data of Dbgin the central location of the x-ray films areshown in Table X1. Compared with this table is the data from the emulsions measured at the
center of each plate (Table X2).
Table Xl. Three-dimensional data summary of the X-ray film optical density.
Depth C01 C04 C12 C15 C18 C21 C33
( /cm 2)A 0.69 0.59 0.53 0.55 0.50 0.53 0.59
+ 0.14 + 0.17 + 0.16 + 0.13 + 0.17 + 0.16 + 0.13
B 0.73 0.62 0.59 0.59 0.55 0.55 0.59
+0.13 :t:0.16 +0.14 +0.13 +0.15 +0.15 +0.13
C 0.63 0.59 0.51 0.51 0.50 0.53 0.58
_+0.16 _+0.17 _+0.16 _+0.13 _+0.16 _+0.16 _+0.13
A: Center of the left side, B: Center of the film, C: Top edge at the left side.
Table X2. Density of Fog, Grains, and Tracks (at center of the plate).
Vertical Depth 2.29 g/cm z 33.17 g/cm 2 113.41 g/cm 2 Ground
Control
Plate Number P-03 P-69 C-35 #1
Fog/1000ttm 3 1.61 _+0.14 1.49 _+0.14 1.71 _+0.15 1.24 _+0.13
Grains/1001JJn 26.09 _+4.20 30.93 _+2.96 31.37 _+ 2.80 32.42 _+ 1.92Tracks 10s/era 2 4.30 _+0.16 3.56 _+0.36 2.53 _+ 0.27 0.418 _+0.19
4. b)2:2 Background Analysis : Isothermal, Low-temperature
DevelopmentMethod Required for Space Flight X-ray Films
When the background density is very high (such as Dbs > 2), visual contrast in x-
ray f'dms becomes very poor for shower detection, and an undesirable saturation of the linear
response curve of x-ray f'tlms on the shower energy becomes significant. Db_< 2.0 isrecommended for efficient scanning and preservation of a linear response of D=_ for energy
determination. Considering the possibility of much higher background density, as would result by
exposing the EC on Space Station for 1/2 to 1 year, we eXpeor_.ented and established a new, low-temperature development recipe for the ECT experiment (5 C isothermal for 3 minutes). TableX3 shows a comparison of conventional recipe and the ECT's new recipe.
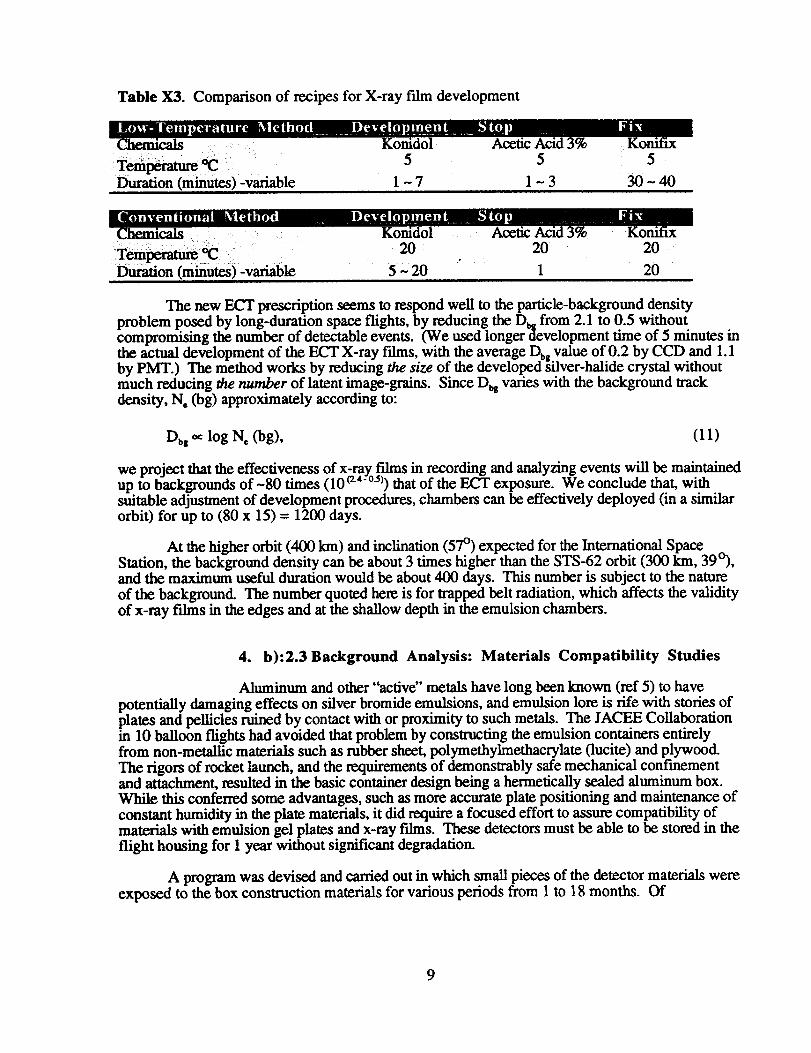
Table X3. Comparison of recipes for X-ray film development
..... Acetic Acid
Duration (minutes) -variable 1 ~ 7 1 ~ 3
5
30-40
2o 2oDuration (m_u_) -variable 5 ~ 20 I
20
20
The new ECT prescription seems to respond well to the particle-background densityproblem posed by long-duration space flights, by reducing the D_ from 2.1 to 0.5 withoutcompromising the number of detectable events. (We used longerdevelopment time of 5 minutes inthe actual development of the ECT X-ray films, with the average D b_value of 0.2 by CCD and 1.1by PMT.) The method works by reducing the size of the developed _ilver-halide crystal without
much reducing the number of latent image-grains. Since Dbs varies with the background trackdensity, N e (bg) approximately according to:
Dbg *_ log N, (bg), (II)
we project that the effectiveness of x-ray films in recording and analyzing events will be maintainedup to backgrounds of-80 times (10 cz4-0.5)) that of the ECT exposure. We conclude that, withsuitable adjustment of development procedures, chambers can be effectively deployed (in a similarorbit) for up to (80 x 15) = 1200 days.
At the higher orbit (400 kin) and inclination (57 °) expected for the International Space ^Station, the background density can be about 3 times higher than the STS-62 orbit (300 kin, 39"),and the maximum useful duration would be about 400 days. This number is subject to the nature
of the background. The number quoted here is for trapped belt radiation, which affects the validityof x-ray films in the edges and at the shallow depth in the emulsion chambers.
4. b):2.3Background Analysis: Materials Compatibility Studies
Aluminum and other "active" metals have long been known (ref 5) to have
potentially damaging effects on silver bromide emulsions, and emulsion lore is fife with stories ofplates and peUicles ruined by contact with or proximity to such metals. The JACEE Collaborationin 10 balloon flights had avoided that problem by constructing the emulsion containers entirelyfrom non-metallic materials such as rubber sheet, polymethylmethacrylate (lucite) and plywood.The rigors of rocket launch, and the requirements of demonstrably safe mechanical confinementand attachment, resulted in the basic container design being a hermetically sealed aluminum box.While this conferred some advantages, such as more accurate plate positioning and maintenance ofconstant humidity in the plate materials, it did require a focused effort to assure compatibility ofmaterials with emulsion gel plates and x-ray films. These detectors must be able to be stored in theflight housing for 1 year without significant degradation.
A program was devised and carded out in which small pieces of the detector materials wereexposed to the box construction materials for various periods from 1 to 18 months. Of
9
principal concern was Al. Tests were conducted with bare A1 and with various kinds of surfacecoating on the metal. Tests were conducted both with the dissimilar materials both in direct
contact, and in close proximity within small sealed chambers.
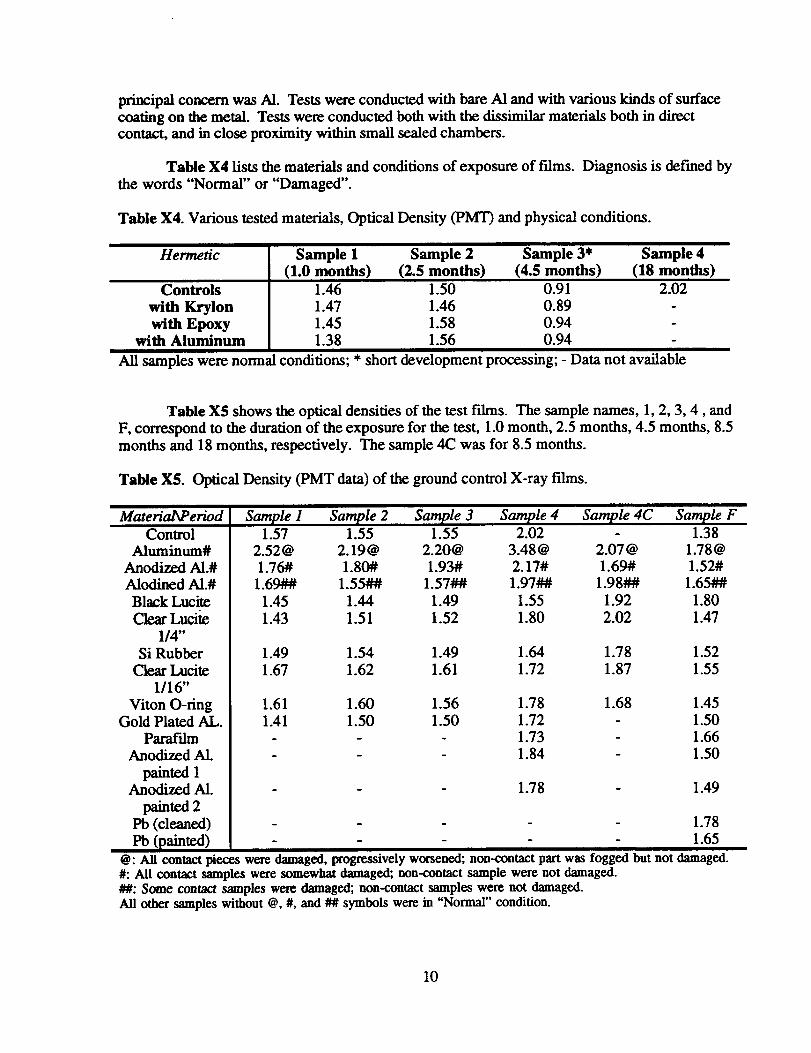
Table X4 lists the materials and conditions of exposure of films. Diagnosis is defined by
the words "Normal" or "Damaged".
Table X4. Various tested materials, Optical Density (PMT) and physical conditions.
Hermetic
Controls
with Krylon
with Epoxywith Aluminum
Sample 1 Sample 2 Sample 3* Sample 4
(1.0 months) (2.5 months) (4.5 months) (18 months)1.46 1.50 0.91
1.47 1.46 0.89
1.45 1.58 0.941.38 1.56 0.94
2.02
All samples were normal conditions; * short development processing; - Data not available
Table X5 shows the optical densities of the test f'dms. The sample names, 1, 2, 3, 4, and
F, correspond to the duration of the exposure for the test, 1.0 month, 2.5 months, 4.5 months, 8.5
months and 18 months, respectively. The sample 4C was for 8.5 months.
Table XS. Optical Density (PMT data) of the ground control X-ray films.
Mat eri aAP e rio d
Control
Aluminum#
Anodized Al.#
Alodined AI.#
Black Lucite
ClearLucite
1/4"
Si Rubber
Clear Lucite
1/16"
Viton O-ringGold Plated AL.
ParafilmAnodized AL
painted 1Anodized A1.
painted 2Pb (cleaned)
Pb(painted)
Sample 1 Sample 2 Sample 3 Sample 4 Sample 4C Sample F1.57 1.55 1.55 2.02 1.38
2.52@ 2.19@ 2.20@ 3.48@ 2.07@ [email protected]# 1.80# 1.93# 2.17# 1.69# 1.52#
1.69## 1.55## 1.57## 1.97## 1.98## 1.65##
1.45 1.44 1.49 1.55 1.92 1.80
1.43 1.51 1.52 1.80 2.02 1.47
1.49 1.54 1.49 1.64 1.78 1.52
1.67 1.62 1.61 1.72 1.87 1.55
1.61 1.60 1.56 1.78 1.68 1.45
1.41 1.50 1.50 1.72 - 1.50- - 1.73 - 1.66- - 1.84 - 1.50
1.78 - 1.49
1.781.65
@: All contact pieces were damaged, progressively worsened; non-contact part was fogged but not damaged.#: All contact samples were somewhat damaged; non-contact sample were not damaged.##: Some contact samples were damaged; non-contact samples were not damaged.All other samples without @, #, and ## symbols were in "Normal" condition.
10
Aluminum and alodinedaluminum were shown todestroyemulsions and X-ray filmson
contact,while anodized aluminum was inert.Anodized aluminum was selectedforthespace flight
emulsion chamber based upon thesematerialcompatibilitytests.The actualshuttleflightresult
confirmed the ground testresults.Itisreasonabletoextrapolatefurther,based on theground tests
and the ECT flight, that all the materials in the flight emulsion chamber in a ECT pressurized
vessel should be safe for long duration space flights at least up to 18 months.
4.c) Emulsions
Measurements of thehigh energy cosmic ray events,background trackdensity,chemical
fog,and graindensitywere performed using high magnificationmicroscopes. Similar
measurements were performed with ground controlunitand balloon-borneemulsions tocompare
the quality and capabilities with the space-flight emulsions.
4.c): 1 Quality of Tracks (Examination by Berriman-Curve Test)
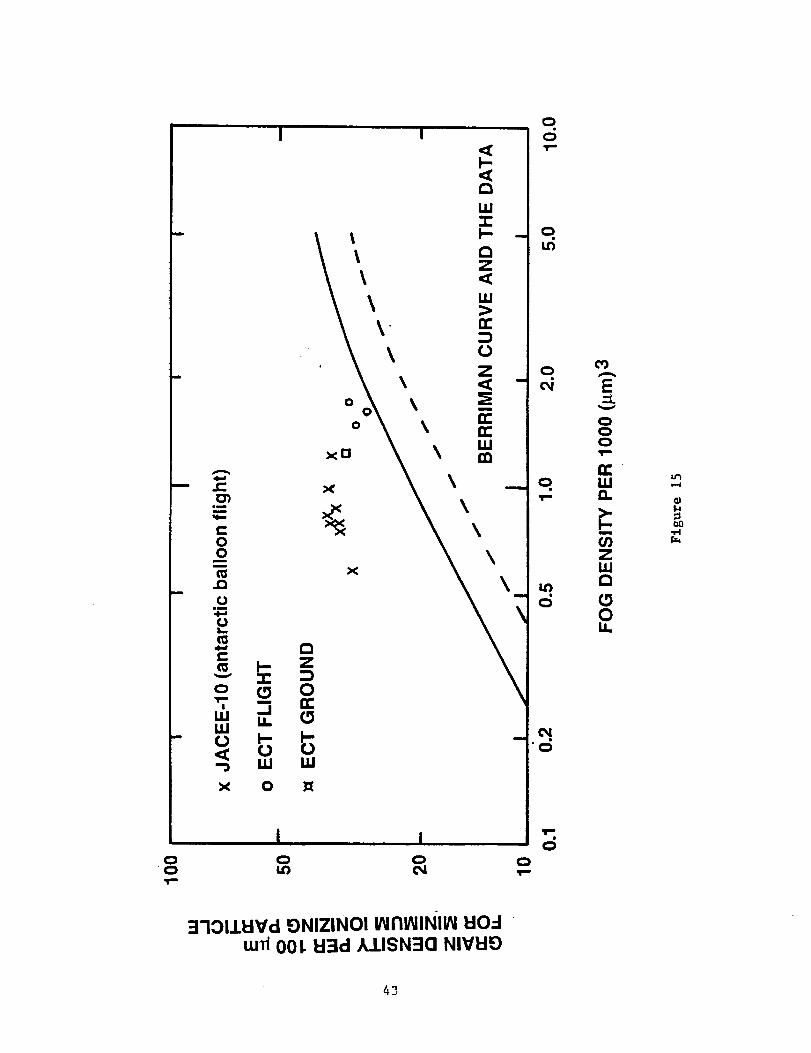
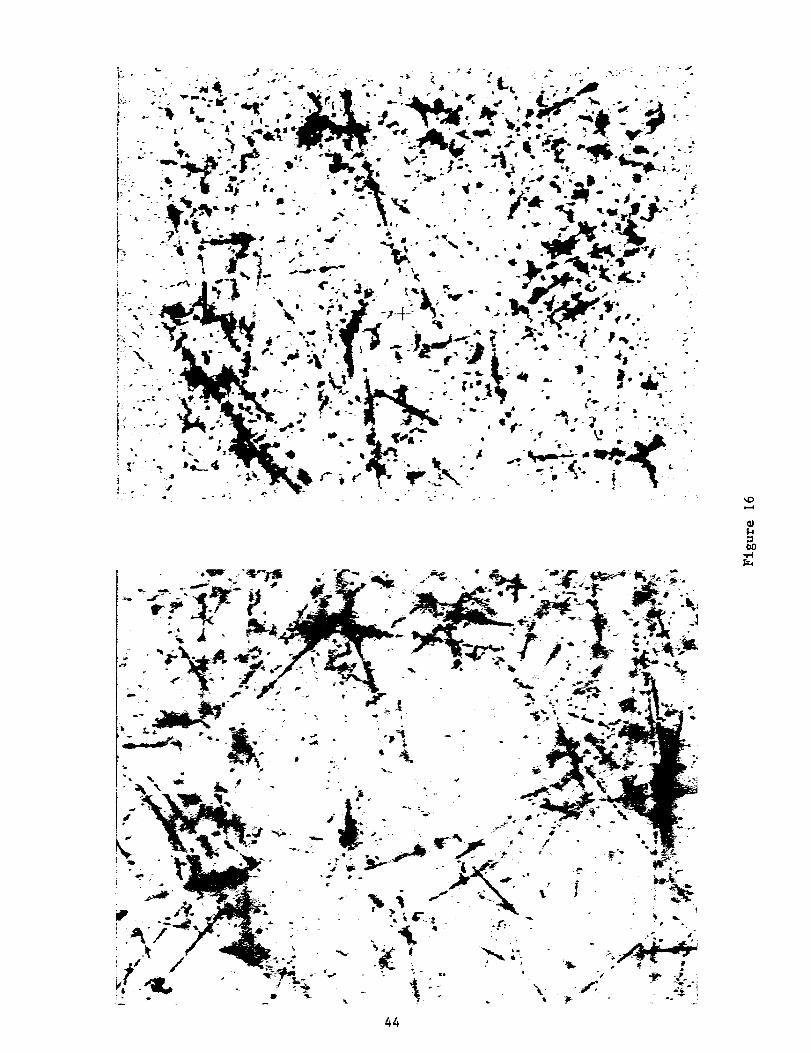
The contrast for track recognition in emulsions was excellent and clear track measurementswere achieved. Grain density relative to the fog density is a measure for evaluating the quality of
the track recognition contrast ('Berriman curve Fig. 15). "Excellent" quality of emulsions are
indicated by a domain above the solid curve in the figure, while the dotted curve represents the
"good recognition". They were measured at the central part of the emulsions, because the majority
of the emulsion measurements for cosmic rays depend on the quality in the central part where the
event tracking will be made. All the ECT emulsions mined out to be "excellent contrast" as
demonstrated in Fig. 15 (Berriman curve) and Fig. 16 (photograph).
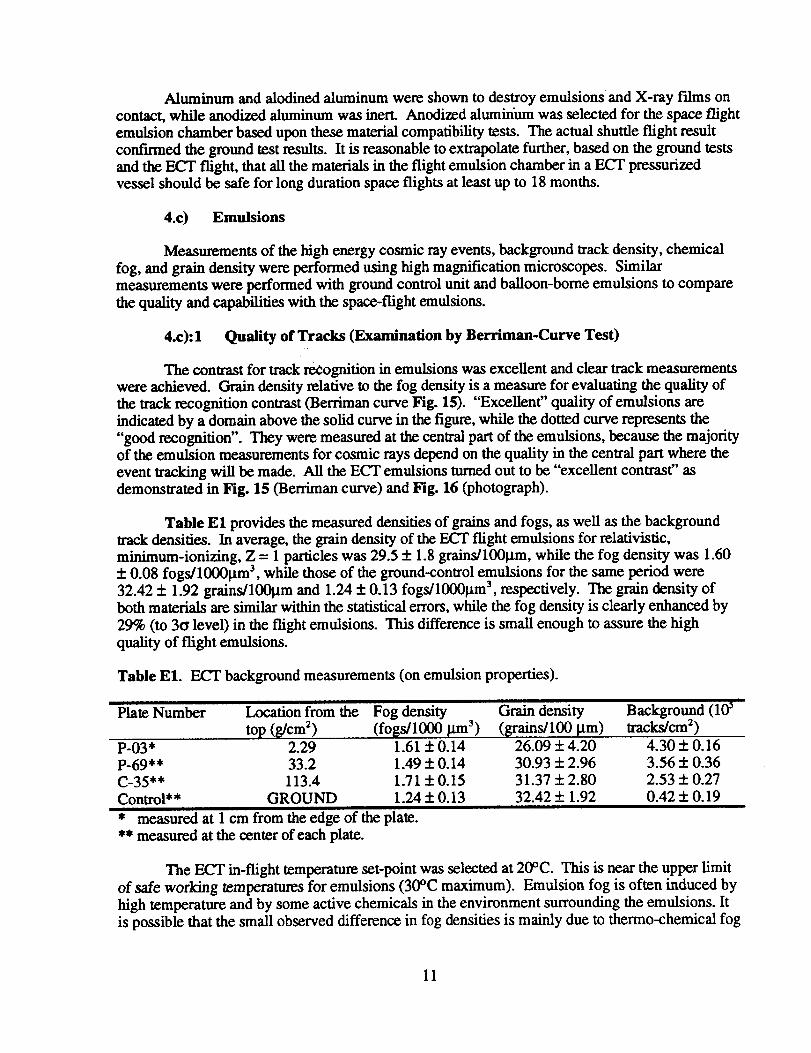
Table E1 provides the measured densities of grains and fogs, as well as the background
track densities. In average, the grain density of the ECT flight emulsions for relativistic,minimum-ionizing, Z = 1 particles was 29.5 + 1.8 grains/1001xrn, while the fog density was 1.60
+ 0.08 fogs/10001xm 3, while those of the ground-control emulsions for the same period were
32.42 + 1.92 grains/100_tm and 1.24 + 0.13 fogs/10001am 3, respectively. The grain density ofboth materials are similar within the statistical errors, while the fog density is clearly enhanced by
29% (to 3a level) in the flight emulsions. This difference is small enough to assure the high
quality of flight emulsions.
Table El. Ecr background measurements (on emulsion properties).
I
Plate Number Location from the Fog density Grain density Background (105
top (_/cm 2) (foBs/1000 _tm 3) (grains/100 txm) tracks/cm 2)P-03* 2.29 1.61 + 0.14 26.09 + 4.20 4.30 + 0.16P-69"* 33.2 1.49 + 0.14 30.93 + 2.96 3.56 + 0.36
C-35"* 113.4 1.71 + 0.15 31.37 + 2.80 2.53 + 0.27
Control** GROUND 1.24 + 0.13 32.42 + 1.92 0.42 + 0.19
* measured at 1 cm from the edge of the plate.
** measured at the center of each plate.
The ECT in-flight temperature set-point was selected at 20°C. This is near the upper limit
of safe working temperatures for emulsions (30°C maximum). Emulsion fog is often induced by
high temperature and by some active chemicals in the environment surrounding the emulsions. It
is possible that the small observed difference in fog densities is mainly due to thermo-chemical fog
11
inducedduring some part of the transportation and storage period when several days of high
temperature (21 - 22.5°C) were recorded for the flight emulsions. The ground-control unit did not
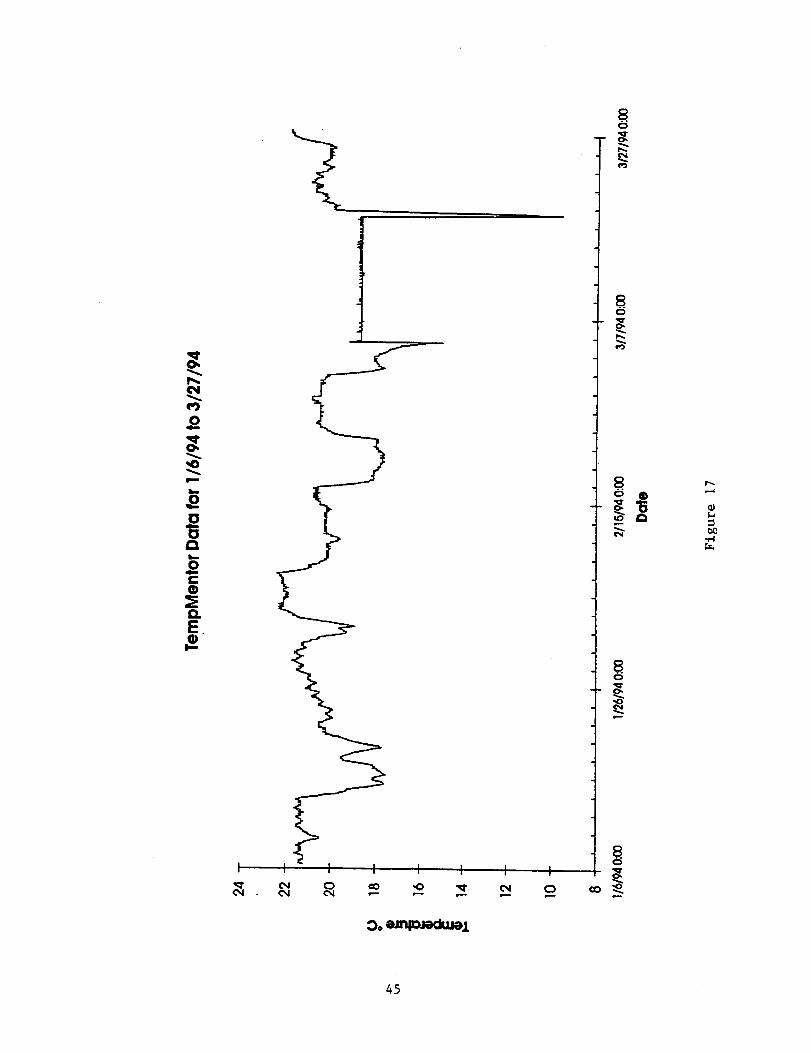
experience such high temperatures. Table X5, Table E1 and Fig. 15 show a time-and-temperature dependence of fogs in emulsions. In the following discussion we should emphasize
that the fogging observed in the ECT plates was a small but observable effect that did not affect
data retrieval to any significant degree.
The compatibility test (described below) indicated a very slow increase of fog as a function
of the increasing storage period at room temperature (= 17°C). In the anodized aluminum box inwhich the ECT emulsions were flown, the fog increased from only 5% to 10% for a storageduration of 1 month to 18 months over the hermetically sealed storage emulsions (contact with
Lucite plates). The ECT result implies that the observed increase of fog over the ground-storagematerials was not likely to have originated from the chemical reaction with the materials in the
ECT box in the space environment, but it is more likely due to the increased temperature during
the periods (Jan 6 -13; Jan 26 - 30; Feb. 1 - 5, 1994) prior to the STS flight (Fig. 17).
Although the analysis of fog indicated with reasonable likelihood that high temperature
during ground storage/transportation was responsible for an increased fog of about 30%, a further
question remains: whether there was any combinatory fog increase due to other materials in thechamber, interacting at higher temperatures than that of our compatibility tests. This examination
will be necessary to fully guarantee a limited fog-increase for a very long-duration space flight, andit must be addressed here as a further requirement of a ground test.
4.c):2 Tracing of High Energy Tracks/Showers in Emulsions
The flight emulsions provided high visibility for all individual tracks including minimum
ionizing tracks. Very clear shower tracks were photographed from emulsions showing excellent
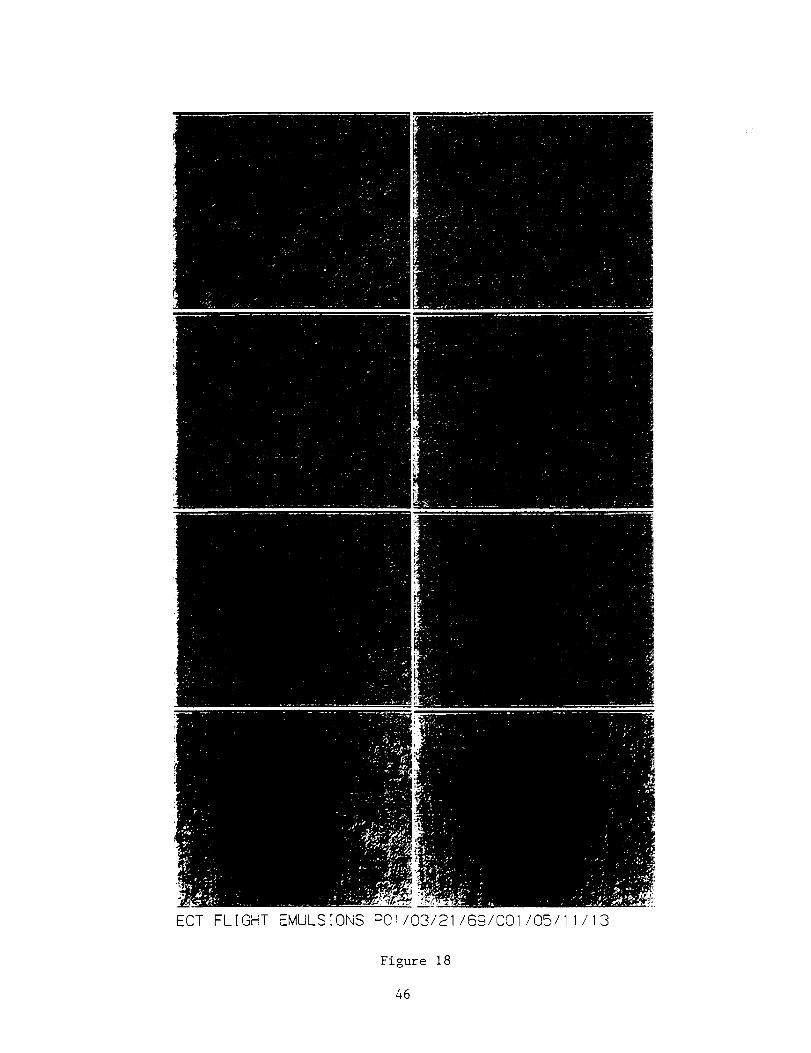
quality of event recording as demonstrated in Figs. 18 and 19. A "normal shower development"is shown in Fig. 18, which is an event entered into the chamber from space in deep-space flight
orientation period. An "inverse shower development" is easily identified by the unique signal of
the inverse development of the lateral spread. Shown in Fig. 19 is an example where the event
produced a cascade shower from the bottom to the top of the chamber after entering and interacting
with the cargo bay during the Earth-observing orientation of the STS-62.
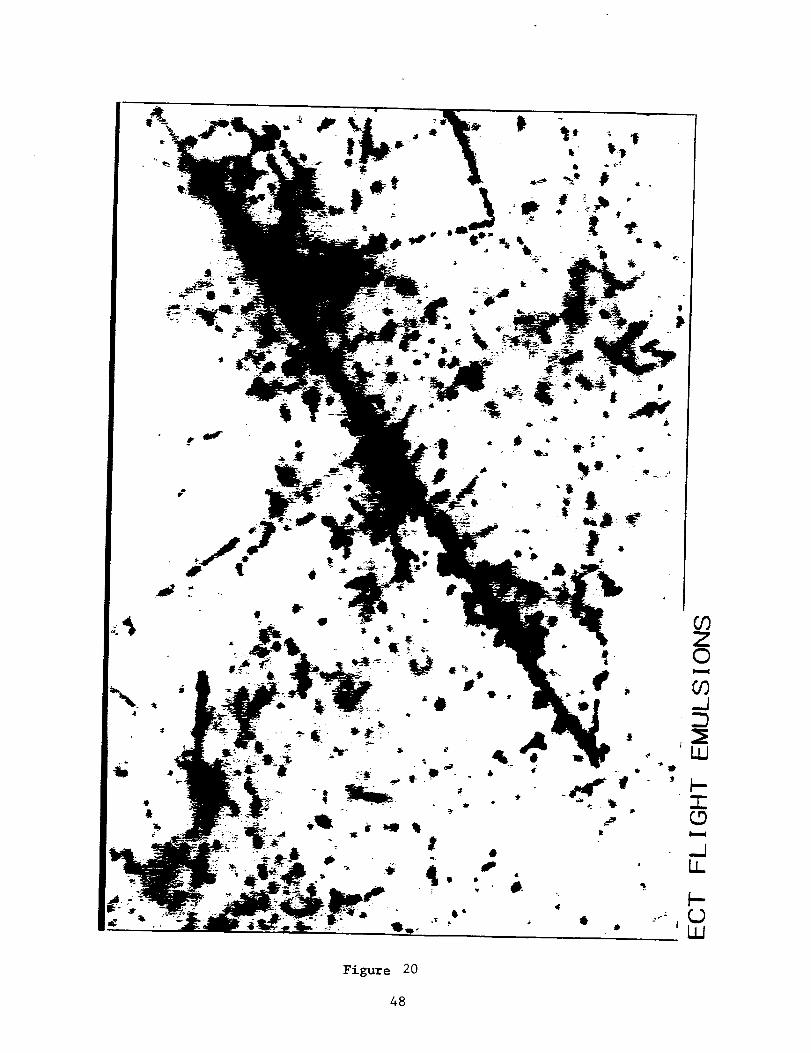
A primary iron nucleus track and two interaction vertices in the emulsion chamber were
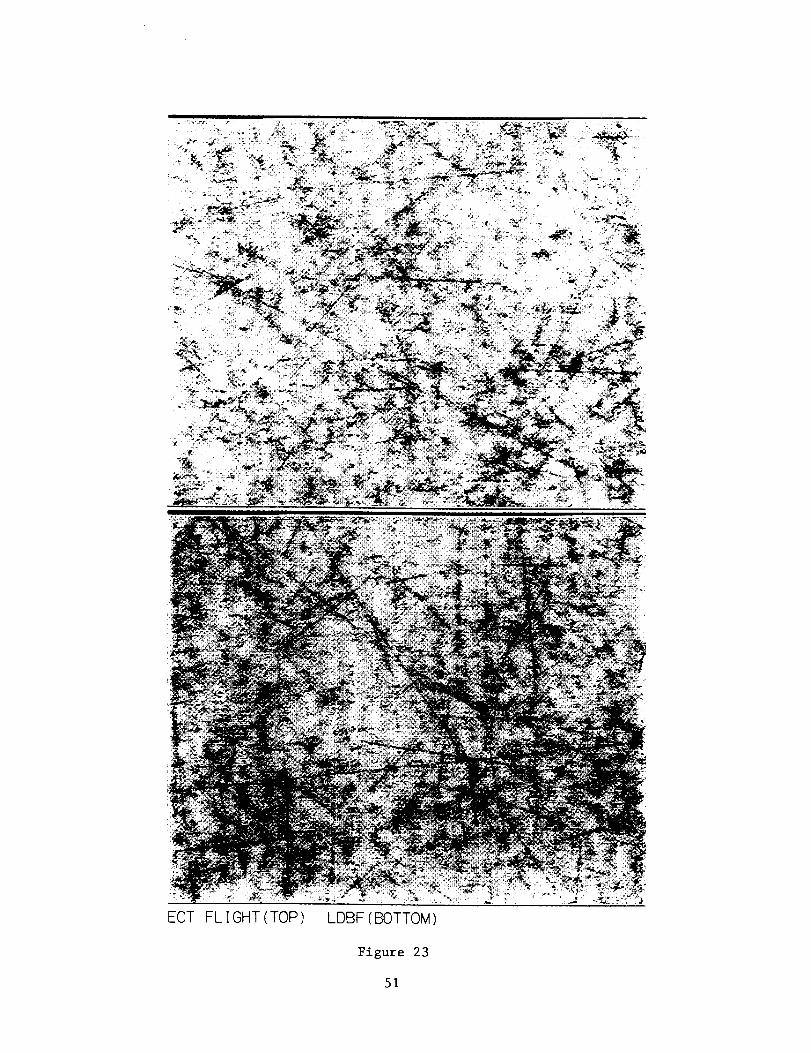
photographed in Figs. 20 - 22 with the highest magnification of x 100 objective lens. General
(x 20) image of emulsions were compared in Fig. 23 between an ECT emulsion and a long-duration balloon-borne emulsion, where similar excellence of track qualities are observable.
Showers were traced from the lower part of the calorimeter upward into the target and
primary modules. This event tracing is expected to be subject to interference by copious .
background tracks at high background density. Despite the density in the order of 10°/cm" in theECT emulsions, there were no significant difficulties in tracing events upwards even when the
"jet" structure of the event becomes thin and small in the target module.
The ECT and long-duration balloon-bome emulsions (JACEE-12, 1994; JACEE-13,
1995) have the highest background level among all the past space-flight emulsion chamber
experiments. It is not straightforward to assess what density of the background will prevent
efficient tracing, because we do not have much experience with emulsions that have much higher
background density than the ECT or JACEE-12. Nevertheless, some assessment is possible.
12
Emulsion is a three-dimensional micro-photographic device. The vertical focus is as sharp
as 1 pro, and the lateral resolution of tracks is as good as 0.1 Inn. One minimum-ionizing,
relativistic track will form about 30 grains in 100 Inn of track length. The visibility can be
approximately defined by the average grain distance (r_) between different tracks versus average
grain distance in a track (q):
r_/r, > X, (12)
where (x> 1). Sufficient track recognition with a condition of (L- 2). The minimum condition to
identify a track corresponds to (X~ 1).
A cosmic ray track has an average zenith angle of 45 °, and therefore, the average lateral
grain separation is 2.36 tam, while that of vertical is also 2.36 tam. This chain of grains (blobs)
belonging to a single track can be recognized as a track when other grains from other tracksoverwhelm and confuse the recognition of a single particular track. When one has 106/cm 2 track
density in emulsions (ECT) the average track separation (rb_) is in the order of 14 microns,
satisfying the above ratio r_/r_ > 1 by a factor of about 5. If the background cosmic ray tracks(not those of trapped-belt radiation protons which will be absorbed in emulsion chamber)
accumulates up to 35 times more than the ECT track density, the single ionizing track recognition
becomes very hard as the r_ becomes as large as rg. This is true for the high-sensitivity emulsions(Fuji ET-7B). Hence, our conclusion should be that the single ionizing track can be traced with
7 2increasing difficulty in high background track densities up to 3.5 x 10 particlesdcm, and the
ECT's 14 day flights had only 1/35 of this limit. The limit may be 35 x 14 days = 490 days onorbit, provided that the emulsion chamber is large enough to absorb most of slow proton
background coming from the radiation belts. The edges and the very top portion of the emulsion
chamber record slow protons before their stopping, and the visibility of a single track therein will
be poorer in these edge regions.
Concerning traceability in low sensitivity emulsions (Fuji ET-6B) for nuclei with charge of
helium or larger; the same argument applies with different parameters. The r_ of a Helium track inET-6B is 2.53 Inn. Because ET-6B records grains of background protons as few as 7 grains/100
Inn, they can be completely ignored. The background tracks to be considered are those of helium
and 7_/13->2. They are less than 30% of cosmic rays. Therefore, from the consideration of r_, thelimit of track recognition will not be reached until exposures of 1,420 days. This limit with the
low-sensitive emulsions (ET-6B) will remain close to this value even when radiation-belt protons
increases in a very high orbit (500 - 1000 km), so long as the main detector part where the self-
absorption of the emulsion chamber effectively works is concerned.
For heavier tracks (Z > 2), the average grain separation in low-sensitivity ET-6B emulsions
is 1.12 lain for lithium (Z = 3), and 0.28 Inn for Carbon (Z = 6). Acceptable track densities for them
are very high, and the limit of exposure duration in space would exceed several years, so long as
low-sensitivity emulsions are used.
4.c):3 Track Density in Emulsions
The track density was measured by both manual and automatic microscopes. Track by
track identification was easily made by manual visual scanning as listed in Table El.
The automatic microscope (CUE-2) does not identify blobs and separate grains as
belonging to the same track, and gives an order of magnitude larger number of objects in a field of
13
view. (An advanced algorithm to connect the spatially-separatext parts of a track [objects] into an
identified single track is being developed, but it has not yet been used in the ECT analysis.)
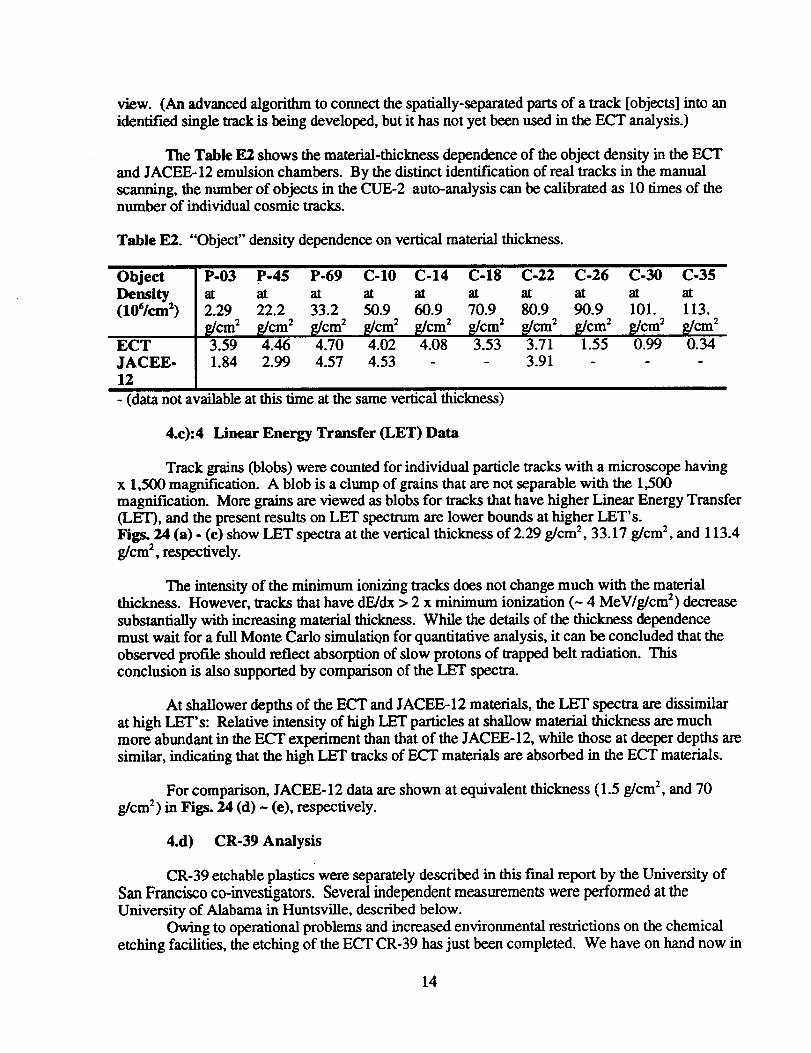
The Table E2 shows the material-thickness dependence of the object density in the ECTand JACEE-12 emulsion chambers. By the distinct identification of real tracks in the manual
scanning, the number of objects in the CUE-2 auto-analysis can be calibrated as 10 times of thenumber ofindividualcosmic tracks.
Table E2. "Objecf' density dependence on vertical material thickness.
ObjectDensity(10'/cm 2)
ECT
JACEE-12
P-03 P-45 P-69 C-10 C-14 C-18 C-22 C-26 C-30 C-35
at at at at at at at at at at
2.29 22.2 33.2 50.9 60.9 70.9 80.9 90.9 101. 113.
$/cm 2 g/cm 2 g/cm 2 g/cm 2 g/cm 2 g/cm 2 g/crn 2 g/cm 2 g/cm 2 g/cm 23.59 4.46 4.70 4.02 4.08 3.53 3.71 1.55 0.99 0.34
1.84 2.99 4.57 4.53 - - 3.91 - - -
- (data not available at this time at the same vertical thickness)
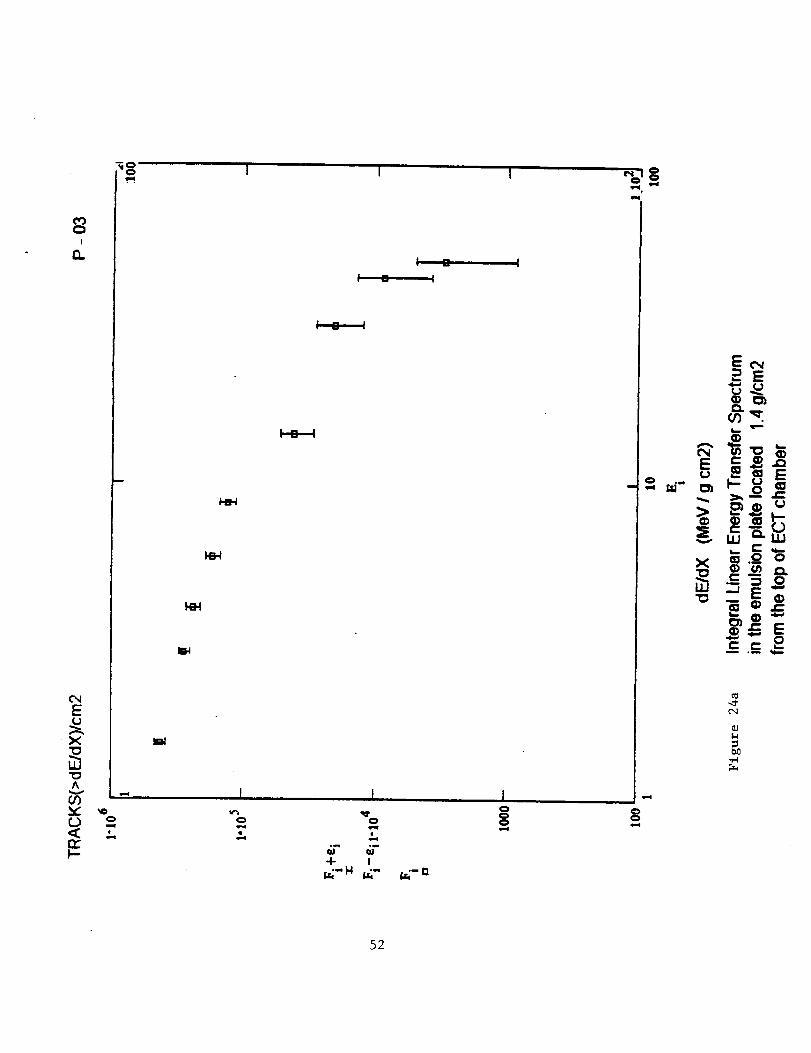
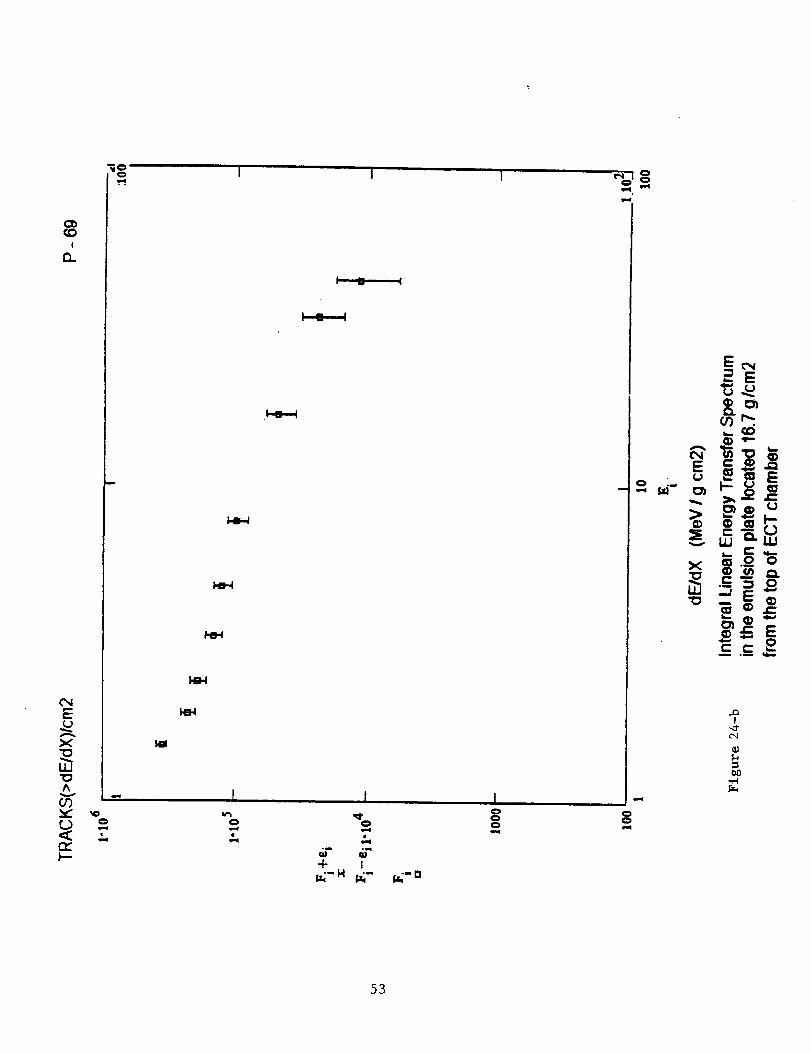
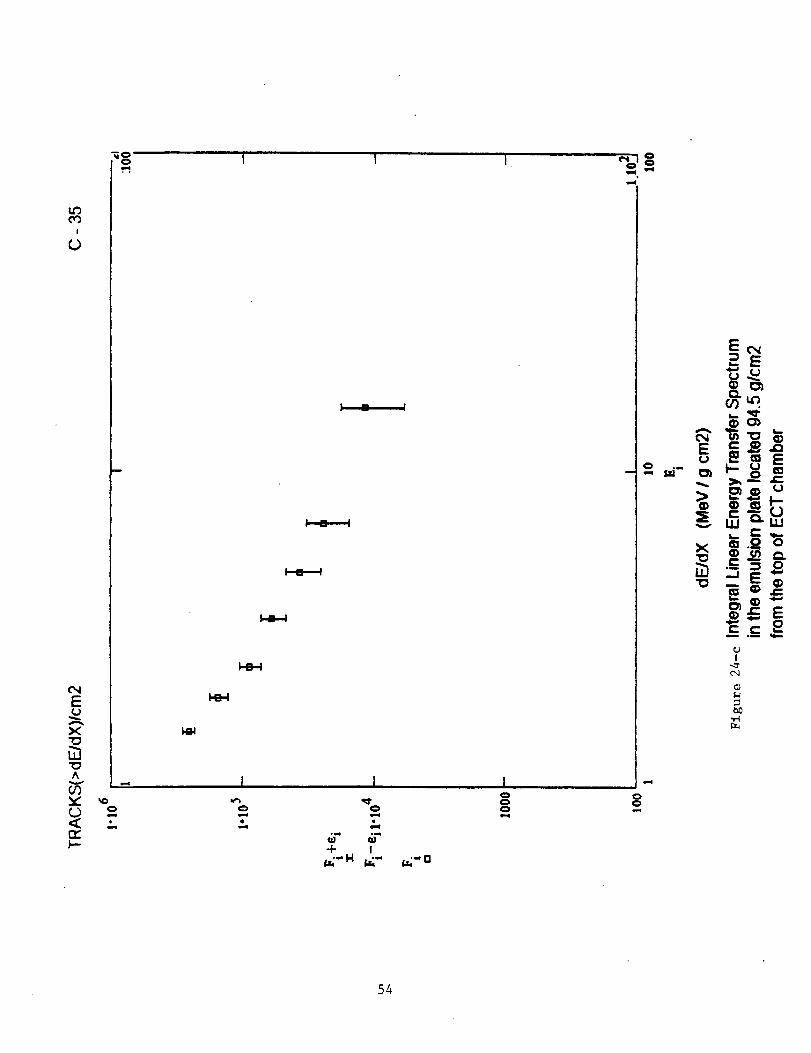
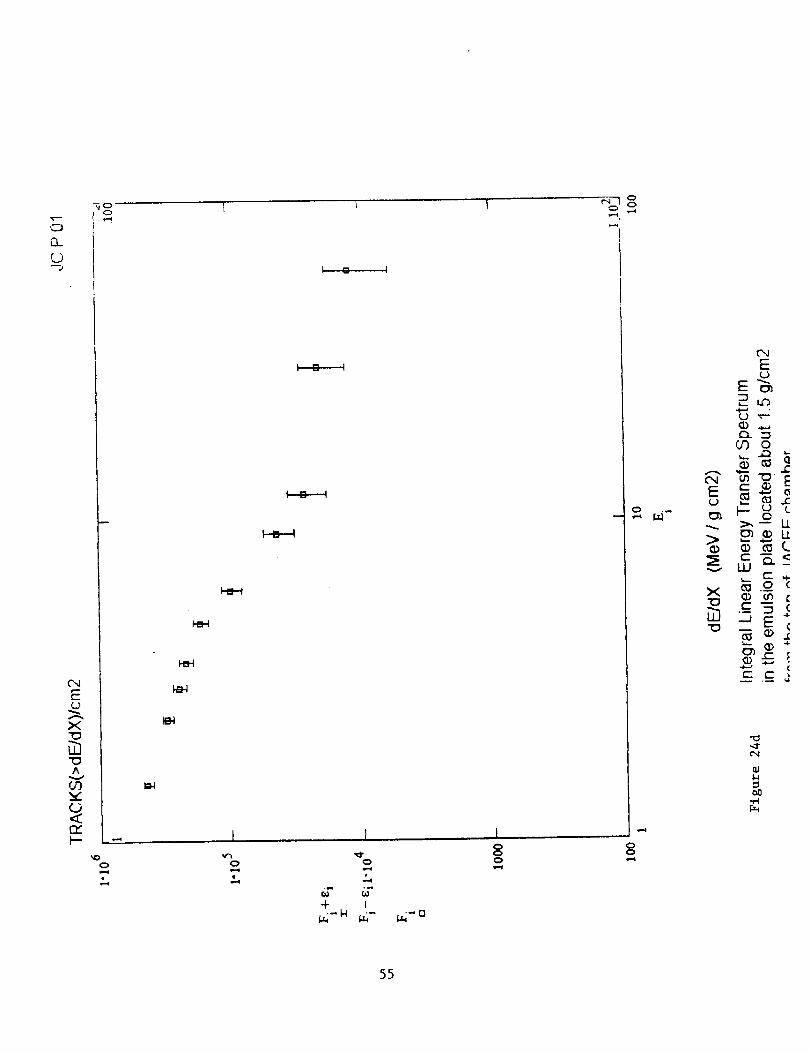
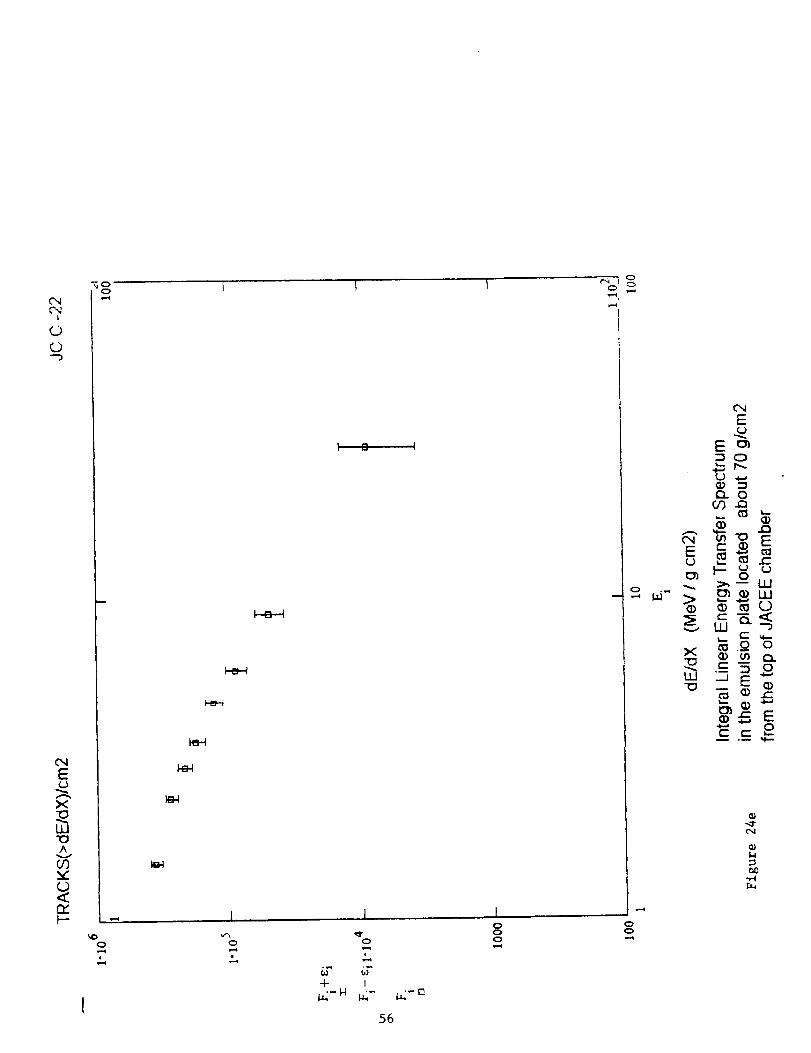
4.c):4 Linear Energy Transfer (LET) Data
Track grains (blobs) were counted for individual particle tracks with a microscope havingx 1,500 magnification. A blob is a clump of grains that are not separable with the 1,500
magnification. More grains are viewed as blobs for tracks that have higher Linear Energy Transfer(LET), and the present results on LET spectrum are lower bounds at higher LET's.
Figs. 24 (a) - (e) show LET spectra at the vertical thickness of 2.29 g/cm 2, 33.17 g/cm 2, and 113.4
g/cm 2, respectively.
The intensity of the minimum ionizing tracks does not change much with the materialthickness. However, tracks that have dE/dx > 2 x minimum ionization (- 4 MeV/g/cm 2) decrease
substantially with increasing material thickness. While the details of the thickness dependencemust wait for a full Monte Carlo simulation for quantitative analysis, it can be concluded that the
observed profile should reflect absorption of slow protons of trapped belt radiation. This
conclusion is also supported by comparison of the LET spectra.
At shallower depths of the ECT and JACEE-12 materials, the LET spectra are dissimilar
at high LET's: Relative intensity of high LET particles at shallow material thickness are much
more abundant in the ECT experiment than that of the JACEE-12, while those at deeper depths are
similar, indicating that the high LET tracks of ECT materials are absorbed in the ECT materials.
For comparison, JACEE-12 data are shown at equivalent thickness (1.5 g/era 2, and 70
g/cm 2) in Figs. 24 (d) ~ (e), respectively.
4.d) CR-39 Analysis
CR-39 etchable plastics were separately described in this fmal report by the University of
San Francisco co-investigators. Several independent measurements were performed at the
University of Alabama in Huntsville, described below.
Owing to operational problems and increased environmental restrictions on the chemicaletching facilities, the etching of the ECT CR-39 has just been completed. We have on hand now in
14
our lab two sets of CR-39 plates fabricated from material of the same specification (American
Acrylics USF-3). One set flew in orbit for 14 days in ECT; the other for 10 days on an Antarcticballoon. A few notable differences were discovered in these two different flight experiments. An
assessment of the difference of sensitivity was made by taking a temperature effect into account.
Assessment of the difference in physical appearance was made in terms of scattering centers
formed by small etch-pits and contaminants, nonetheless, thorough assessment requires additionalmaterial compatibility tests of CR-39 at different temperatures and at different atmospheric
pressures.
4.d): 1 CR-39 Etching, Uniformity, and Quality
Large size CR-39 plates (40 cm x 50 cm) were included in the ECT and regular balloon
flight emulsion chambers. They are intended to be used for charge measurements of heavynucleus tracks, and are also considered for the state-of-the-art coordinate measurements for future
analysis of track momentum by using the multiple Coulomb scattering method.
The large-size CR-39 plates exposed in previous experiments were usually cut into smaller
segments and etched (20 cm x 25 cm or smaller size) so that they fit the stage of measurementmicroscopes. The University of Alabama in Huntsville has developed a large stage microscope
(50 cm x 50 cm) to analyze a large-size CR-39 plate for coordinate measurements.
Correspondingly, the ECT CR-39's were etched in their original shape (40 cm x 50 cm) in a large
etching bath at the Naval Research Laboratory. Standard etching recipe was used: 70°C for 24hours with 6.25N NaOH solution. Two large racks made from stainless-steel wire-mesh were
used in a etching bath. The temperature gradient over the entire racks were monitored at various
rack positions and was controlled to within + 0.05°C.
4.d):2 CR-39 Objects (Etch-pit hole) Data
CR-39 plates were scanned with an automated "object" analysis microscope (GALAI
CUE-2 Auto-morphometer). Each plate was measured at the center (Part B) and at opposing
edges (Parts A and C). Many parameters were measured automatically during the scanning
operations. There were many small etch-pit holes and the measured data of the "area size", whichinclude those of background stopping a-particles, and contamination due to chemical instability of
CR-39 surfaces. The ECT plates had a larger population of these small etch-pits relative to those
of the JACEE-12 balloon flight materials, although these two experiments used the same CR-39formulation from the same lot.
The measured "track density" strongly depends on how many of these small etch-pits are
contained. Also, "average area-size" similarly depends on them, but in the opposite way: the
"average size" becomes smaller when more small-sized contaminants are included. To minimizethe effect of small-size contaminants, the auto-program set the minimum sampling value (60 tan2)
for the "object" area-size.
Three different sets of CR-39's were included in the ECT emulsion chambers. The group
('I) are 10 sheets of CR-39 (CR1 ~ CR10), used in the emulsion chamber for regular charge
measurements of high energy nuclei. The group (1I) consists of 6 sheets (B2 - B7) inserted in thecalorimeter section, which contained dozens of CR-39 doublets (E04 + E01, El2 + E05, ...) in
cut-out slots. The dosimetry and LET spectra in the calorimeter are reported by using these
materials in the separate article by the University of San Francisco group.
15
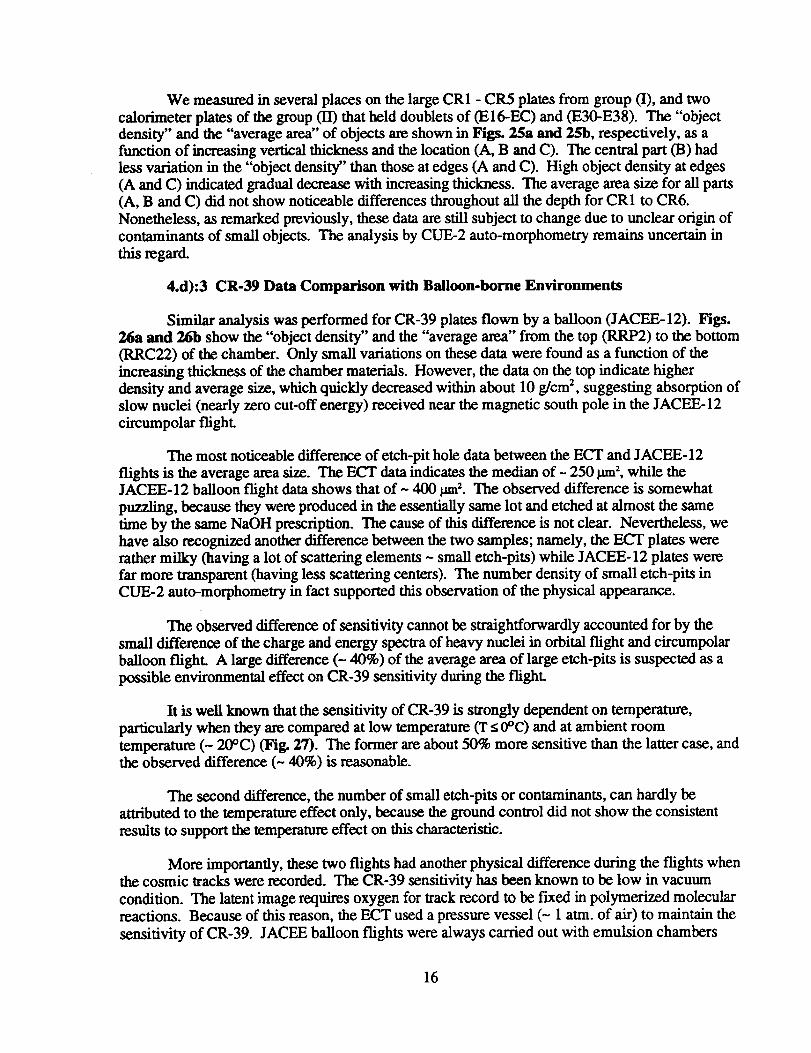
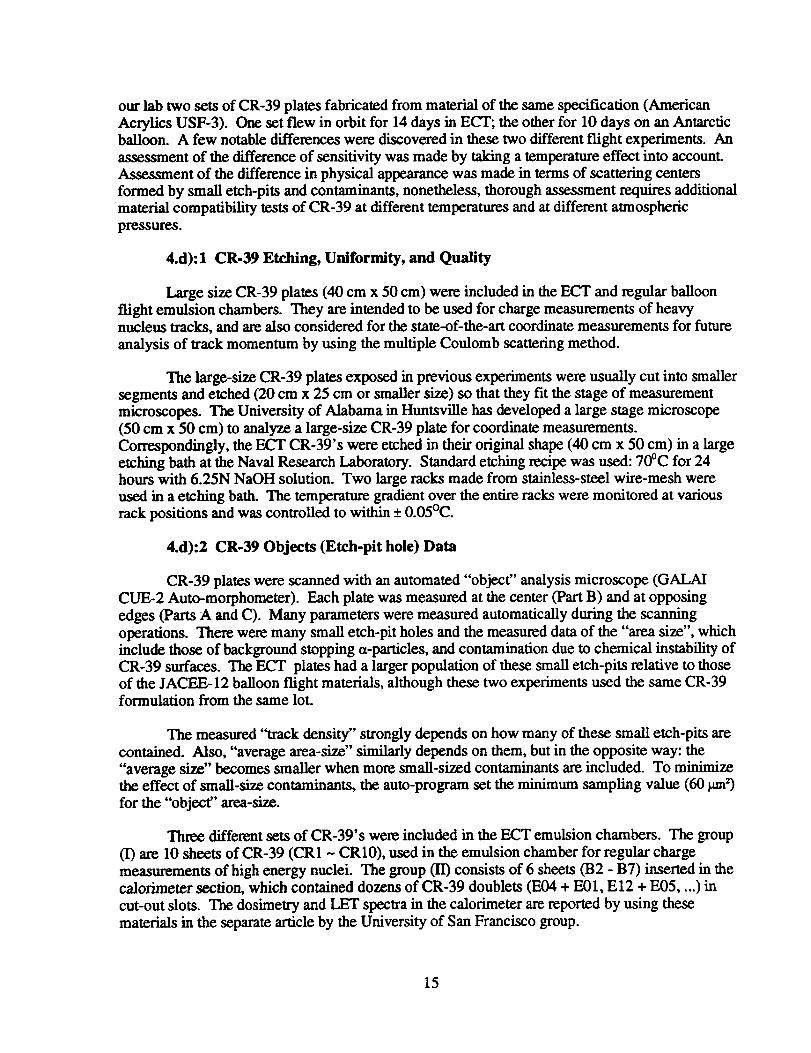
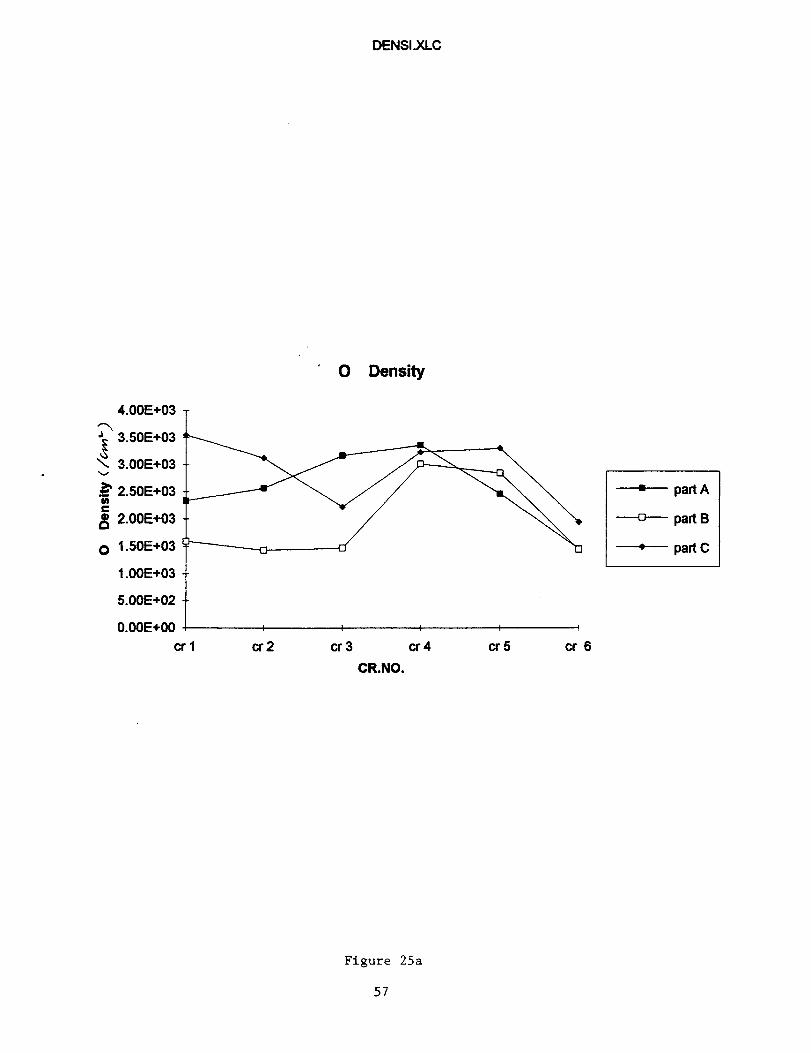
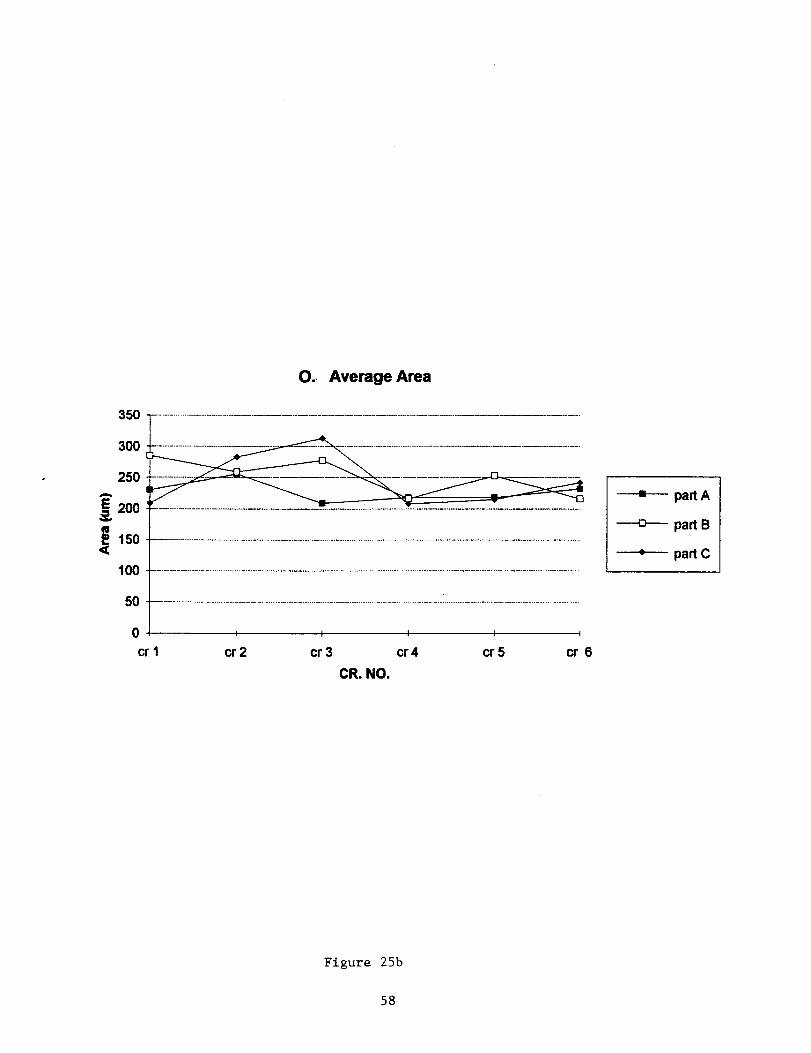
We measured in several places on the large CR1 - CR5 plates from group (I), and two
calorimeter plates of the group (II) that held doublets of (E16-EC) and (E30-E38). The "objectdensity" and the "average area" of objects are shown in Figs. 25a and 25b, respectively, as afunction of increasing vertical thickness and the location (A, B and C). The central part (B) had
less variation in the "object density" than those at edges (A and C). High object density at edges
(A and C) indicated gradual decrease with increasing thickness. The average area size for all parts(A, B and C) did not show noticeable differences throughout all the depth for CR1 to CR6.
Nonetheless, as remarked previously, these data are still subject to change due to unclear origin of
contaminants of small objects. The analysis by CUE-2 auto-morphometry remains uncertain in
this regard.
4.d):3 CR-39 Data Comparison with Balloon-borne Environments
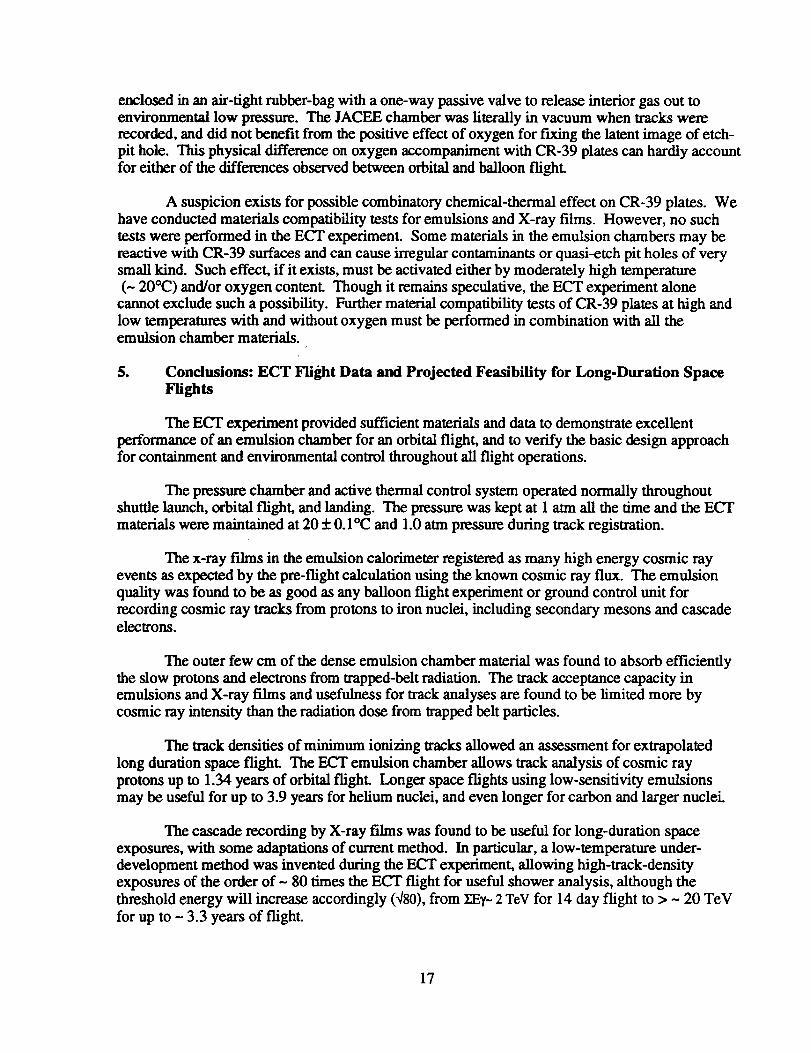
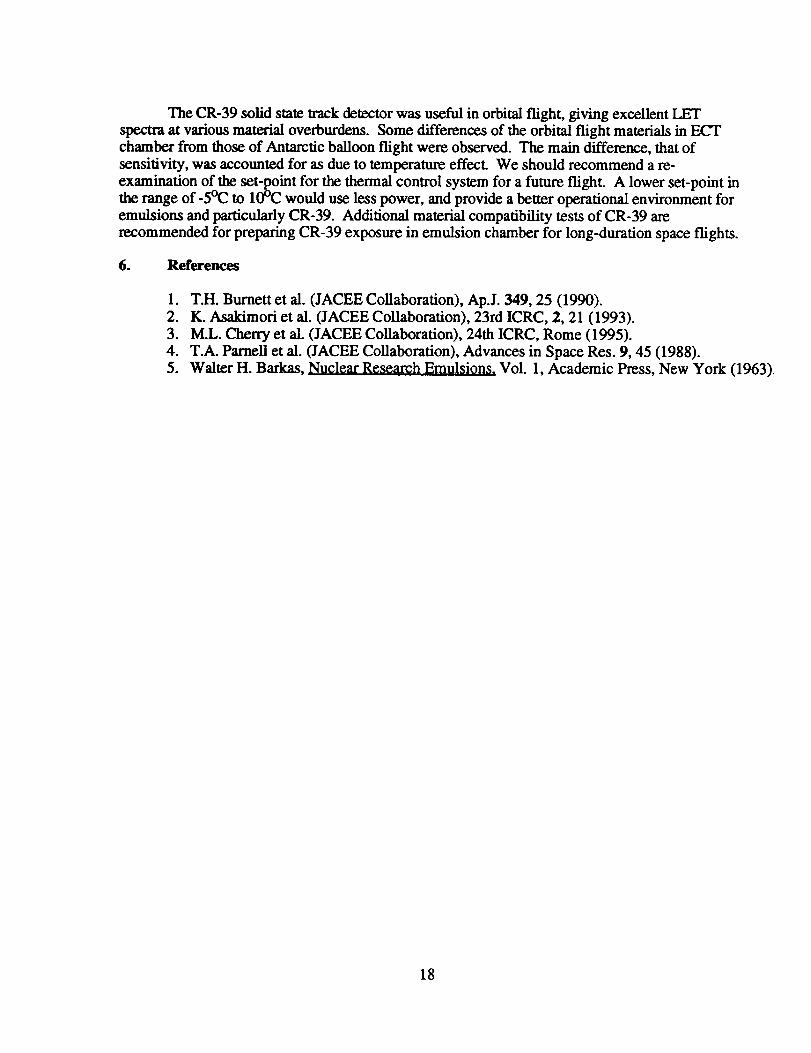
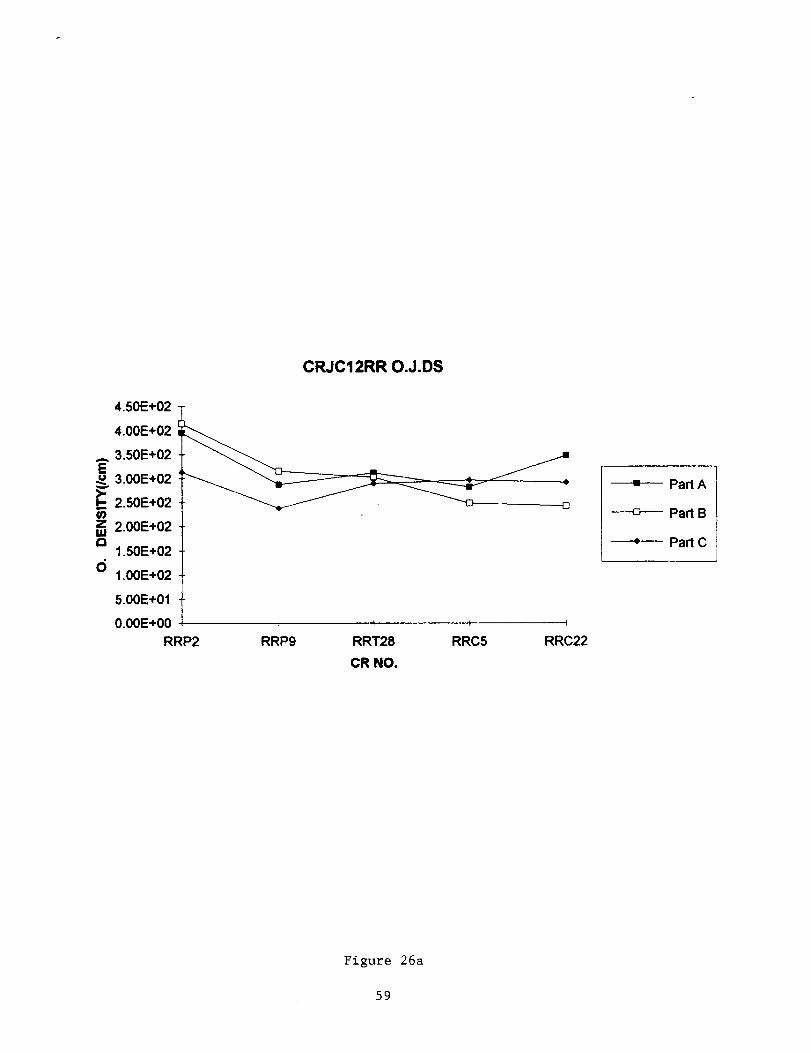
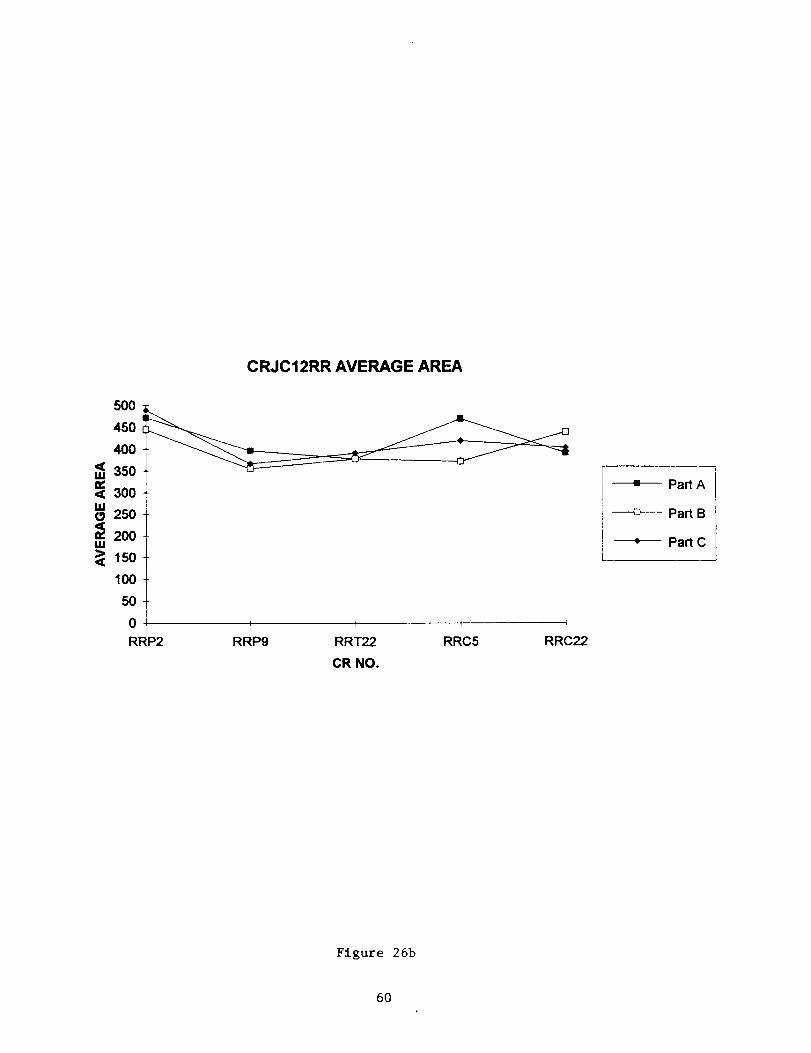
Similar analysis was performed for CR-39 plates flown by a balloon (JACEE-12). Pigs.
26a and 26b show the "object density" and the "average area" from the top (RRP2) to the bottom(RRC22) of the chamber. Only small variations on these data were found as a function of the
increasing thickness of the chamber materials. However, the data on the top indicate higher
density and average size, which quickly decreased within about 10 g/cm 2, suggesting absorption of
slow nuclei (nearly zero cut-off energy) received near the magnetic south pole in the JACEE-12
circumpolar flight.
The most noticeable difference of etch-pit hole data between the ECT and JACEE-12
flights is the average area size. The ECT data indicates the median of ~ 250 lain2, while theJACEE-12 balloon flight data shows that of ~ 400 lain2. The observed difference is somewhat
puzzling, because they were produced in the essentially same lot and etched at almost the same
time by the same NaOH prescription. The cause of this difference is not clear. Nevertheless, we
have also recognized another difference between the two samples; namely, the ECT plates were
rather milky (having a lot of scattering elements ~ small etch-pits) while JACEE-12 plates were
far more transparent (having less scattering centers). The number density of small etch-pits inCUE-2 auto-morphometry in fact supported this observation of the physical appearance.
The observed difference of sensitivity cannot be straightforwardly accounted for by the
small difference of the charge and energy spectra of heavy nuclei in orbital flight and circumpolar
balloon flight. A large difference (- 40%) of the average area of large etch-pits is suspected as a
possible environmental effect on CR-39 sensitivity during the flight.
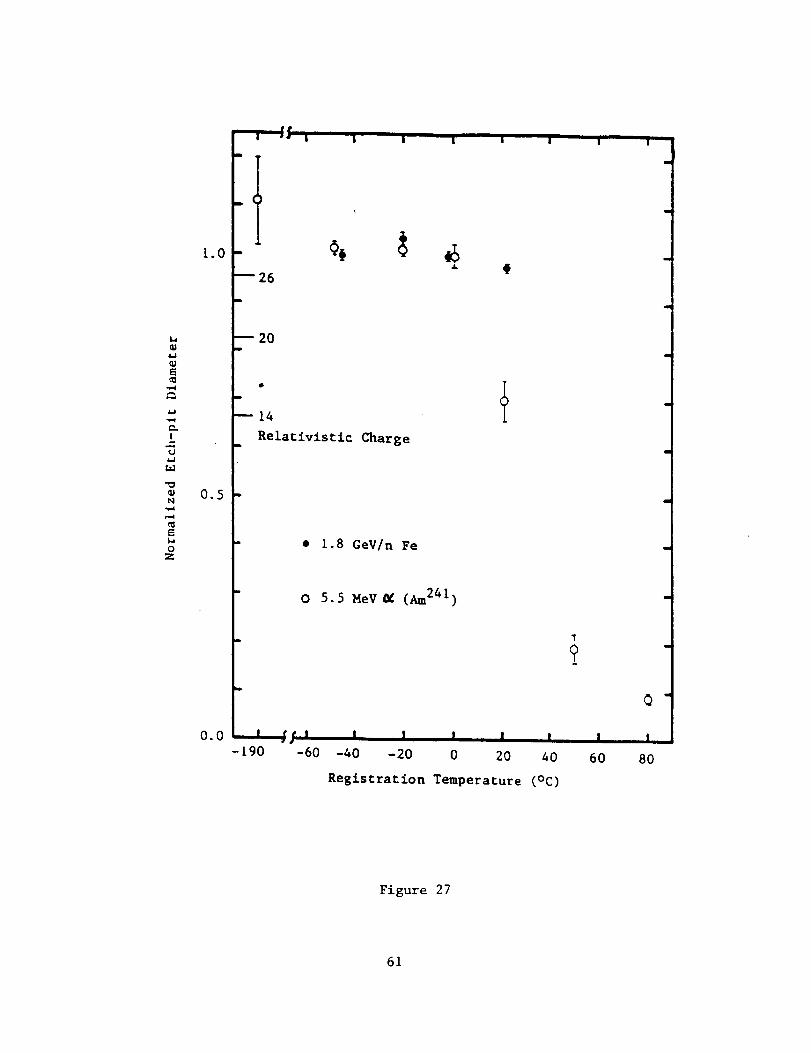
It is well known that the sensitivity of CR-39 is strongly dependent on temperature,
particularly when they are compared at low temperature (T_< 0°C) and at ambient room
temperature (- 20°C) (Fig. 27). The former are about 50% more sensitive than the latter case, andthe observed difference (~ 40%) is reasonable.
The second difference, the number of small etch-pits or contaminants, can hardly be
attributed to the temperature effect only, because the ground control did not show the consistent
results to support the temperature effect on this characteristic.
More importantly, these two flights had another physical difference during the flights whenthe cosmic tracks were recorded. The CR-39 sensitivity has been known to he low in vacuum
condition. The latent image requires oxygen for track record to be fixed in polymerized molecular
reactions. Because of this reason, the ECT used a pressure vessel (~ 1 atm. of air) to maintain the
sensitivity of CR-39. JACEE balloon flights were always carded out with emulsion chambers
16
enclosedin anair-tightrubber-bagwith a one-way passive valve to release interior gas out to
environmental low pressure. The JACEE chamber was literally in vacuum when tracks wererecorded, and did not benefit from the positive effect of oxygen for fining the latent image of etch-
pit hole. This physical difference on oxygen accompaniment with CR-39 plates can hardly accountfor either of the differences observed between orbital and balloon flighL
A suspicion exists for possible combinatory chemical-thermal effect on CR-39 plates. We
have conducted materials compatibility tests for emulsions and X-ray films. However, no such
tests were performed in the ECT experiment. Some materials in the emulsion chambers may be
reactive with CR-39 surfaces and can cause irregular contaminants or quasi-etch pit holes of verysmall kind. Such effect, if it exists, must be activated either by moderately high temperature
(~ 20°C) and/or oxygen contenL Though it remains speculative, the ECT experiment alone
cannot exclude such a possibility. Further material compatibility tests of CR-39 plates at high and
low temperatures with and without oxygen must be performed in combination with all theemulsion chamber materials.
m Condusions: ECT FHg,ht Data and Projected Feasibility for Long-Duration Space
FUghts
The ECT experiment provided sufficient materials and data to demonstrate excellentperformance of an emulsion chamber for an orbital flight, and to verify the basic design approach
for containment and environmental control throughout all flight operations.
The pressure chamber and active thermal control system operated normally throughout
shuttle hunch, orbital flight, and landing. The pressure was kept at 1 atm all the time and the ECT
materials were maintained at 20 + 0.1 °C and 1.0 atm pressure during track registration.
The x-ray films in the emulsion calorimeter registered as many high energy cosmic ray
events as expected by the pre-flight calculation using the known cosmic ray flux. The emulsion
quality was found to be as good as any balloon flight experiment or ground control unit forrecording cosmic ray tracks from protons to iron nuclei, including secondary mesons and cascadeelectrons.
The outer few cm of the dense emulsion chamber material was found to absorb efficiently
the slow protons and electrons from trapped-belt radiation. The track acceptance capacity in
emulsions and X-ray films and usefulness for track analyses are found to be limited more bycosmic ray intensity than the radiation dose from trapped belt particles.
The track densities of minimum ionizing tracks allowed an assessment for extrapolated
long duration space flighL The ECT emulsion chamber allows track analysis of cosmic ray
protons up to 1.34 years of orbital flighL Longer space flights using low-sensitivity emulsions
may be useful for up to 3.9 years for helium nuclei, and even longer for carbon and larger nuclei.
The cascade recording by X-ray films was found to be useful for long-duration space
exposures, with some adaptations of current method. In particular, a low-temperature under-
development method was invented during the _ experiment, allowing high-track-densityexposures of the order of - 80 times the ECT flight for useful shower analysis, although the
threshold energy will increase accordingly (_/80), from XE_,~2 TeV for 14 day flight to > ~ 20 TeV
for up to ~ 3.3 years of flight.
17
TheCR-39 solid state track detector was useful in orbital flight, giving excellent LETspectra at various material overburdens. Some differences of the orbital flight materials in ECF
chamber from those of Antarctic balloon flight were observed. The main difference, that of
sensitivity, was accounted for as due to temperature effect. We should recommend a re-
examination of the set-point for the thermal control system for a future flight. A lower set-point in
the range of -5°12 to 10°C would use less power, and provide a better operational environment for
emulsions and particularly CR-39. Additional material compatibility tests of CR-39 are
recommended for preparing CR-39 exposure in emulsion chamber for long-duration space flights.
6. References
1. T.H. Burnett et al. (JACEE Collaboration), Ap.J. 349, 25 (1990).
2. K. Asakimori et al. (JACEE Collaboration), 23rd ICRC, 2, 21 (1993).
3. M.L. Cherry et al. (JACEE Collaboration), 24th ICRC, Rome (1995).
4. T.A. Parnell et al. (JACEE Collaboration), Advances in Space Res. 9, 45 (1988).
5. Walter H. Barkas, Nuclear Research Emulsions. Vol. 1, Academic Press, New York (1963)
18
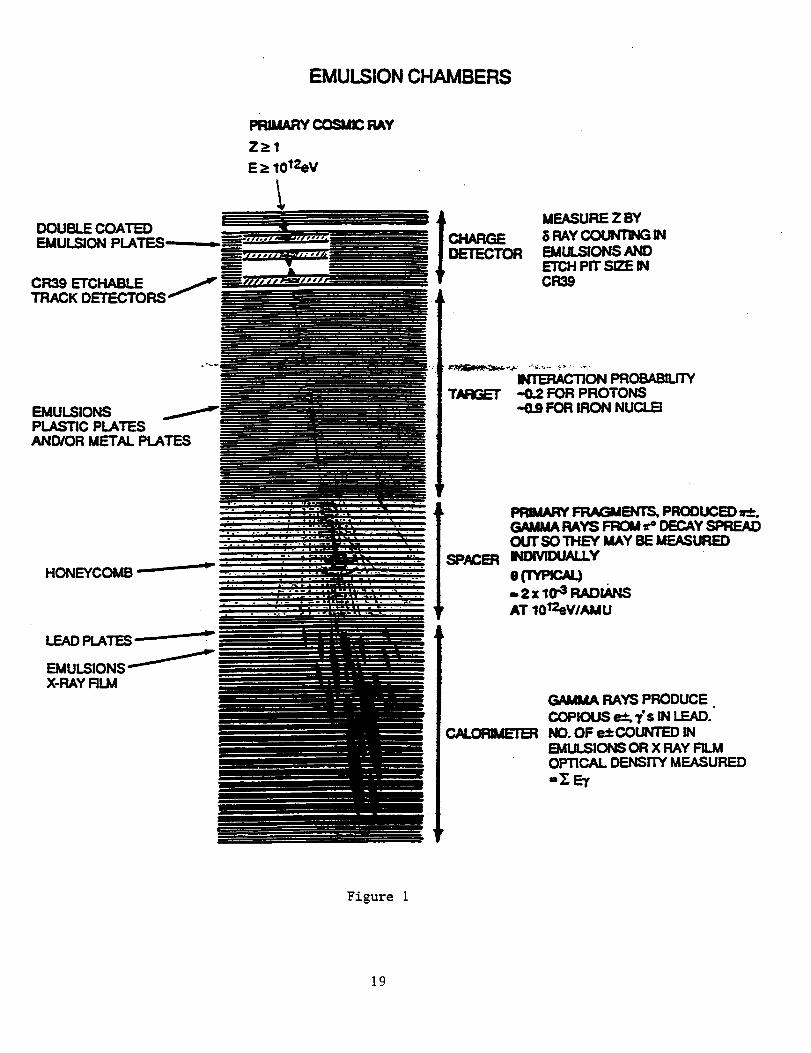
EMULSION CHAMBERS
DOUBLE COATEDEMULSION PLATES
CR39 ETCHABLETRACK DETECTORS
PRUUU_Y COSMIC RAY
MEASURE Z BY8 RAY COUN11NG INEMULSIONS ANDETCH PIT S_E _CR39
EMULSIONSPLASTIC PLATESAND/OR METAL PLATES
INT1ERAC_ON PROBABILITYTARGET -0.2 FOR PROTONS
-O.9 FOR IRON NUCLEI
HONEYCOMB --
LEAD PLATES
EMULSIONSX-RAY FILM
I PRIMARY _ENTS. PRODUCED r__.
GAMMA RAYS _ lr° DECAY SPREAOOUT SO THEY MAY BE MEASURED
SPACER INOIVIDUALLY
AT llOt2eWAMU
GAMMA RAYS PRODUCE.COPIOUS _ 7"s _1 LEAD.NO. OF e_ COUNTED INEMULSIONS OR X RAY FILMOPTICAL DENSITY MEASURED
Figure i
19
[]
0
\
_J
em
2O
-=
!
Fi gur'e 3
21
i?i
=..
=
i
Fi.gure 4
-_, _
\\
22
t
/
_
°
\
Figure 5
23
\\
I
Figure 6
24
_ °Bm
in
b
0
_E
I.--
0
m
25
a
Z
¢C)
i--
0 _ 0 er) 0 er)
0
iz_ Lf)
i.-
er)
t.-n
co
25
t I i i i I Ii i J i i
F._
27
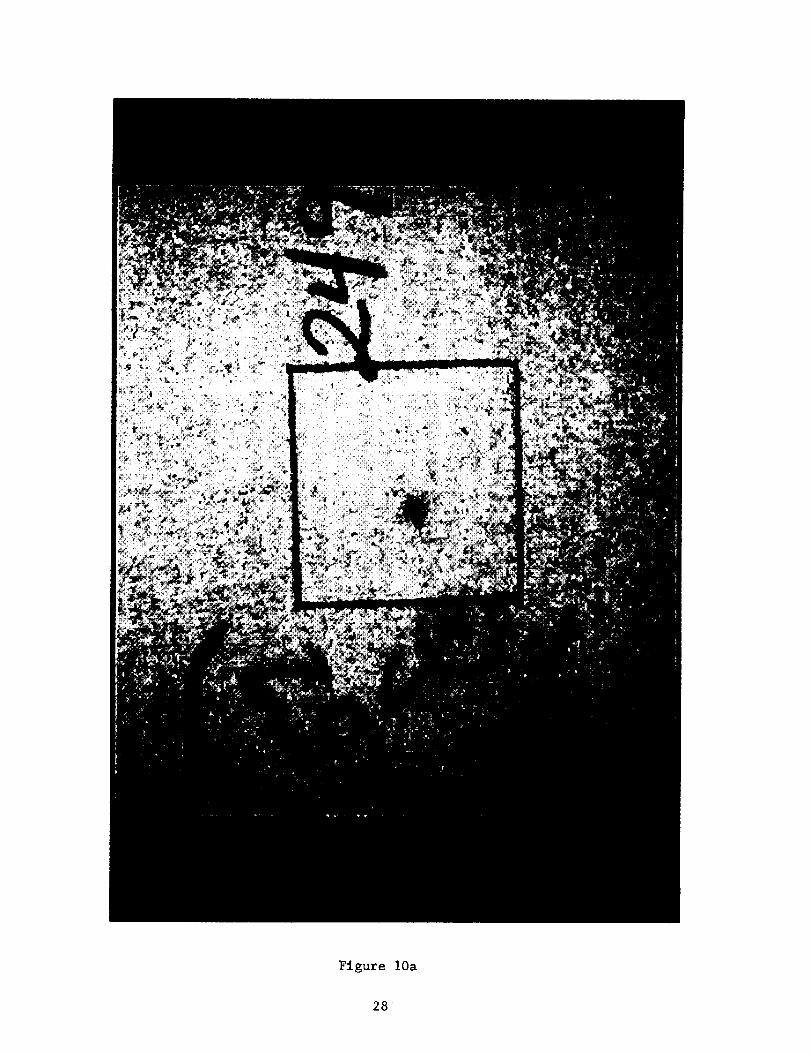
Figure lOa
28 ¸
10.00
1.00
0.10
0.01
ECT- 132 ( M = 2.4670 )......... I ......... I ......... I .........
/
- ',,#,
.'" _.
.. ",
• A',
" A"..
A'.
AI ,,, -49.904 A4 = 3.102
A2. = 18.574 A5 = 4.133A3 = 2.304 A6 = 1.491
,,',, ..... I ......... I ......... I ........
10 20 30
Rodlotlon Lengths
4O
"6.u_
O
10.00
1.00
0.10
ECT- 45 ( M = 1.9330 )• ' ' ' ' I .... I .... I .... I .... I ....
_z_-.z_,,_4,_" "'.A
• "A•
•4""A Z_'"...
A1 ,, -47.310 A,4 I 5.096A.2 = 14.705 A5 = 2.433
A3 _-. 2.753 A6 "= 1.491
0.01 .... I , , , . I . • • • I , , , , I .... I ....
0 .5 10 15 20 25 30Rodiotion Lengths
C_
D
10.00
1.00
0.10
0.01
0
ECT- 187 ( M = 0.7540 )• " " I .... l .... I
_,,. z,.. _4_Z_ _6,_...
A1 ,, -49.617 A4 = 3.077A2 = 6.266 A.5 = 3.232
A3 = 1.577 A6 = 1.493
.... I .... I , •
10 15Rodlotlon Lengths
2O
1.00
"_ 0.10-6U
0.01
ECT- 383 ( M = 2.7420 )I I
/%....... ..... ...
z_v_ "_"-A" "'''"',
"',
"_.
, , I
5
A1 I -7.878 A4 = 2.992A2 = 4.539 A5 = 1.161
A3 ,, 0.584 A6 = 1.501
I , , , , I ,
10 15
Rodlotion Lengths
Figure it
3O
ID.JD
E
Z
5O
4O
3O
2O
I0
D_max Distribution - ECT.... I .... I .... I .... i .... I ....
m
=
=
=
=
(279 Events)
=
m
"10 n
0.0
I I,n, I nn ,n, , I
1.5 2.0D_mox
r;-i , I , ,n, ,
2.5
13.0
Figure 12a
31
100
N (> D MAX)
10
1
0.1
ECT (STS-62) 1994
f
1.0I I
D MAX
Figure 12b
32
BIDmBHI|B||
/
\
I
,,-4r-_
8
33
||B_HH|H|H
__8___ °o
i
---4
34

0||DB||||||
/
:.::,::............
I
0
35
cO,,p 'l-'-- ,p
(:::1 (:3 C3 (:3 C3 (:_ (:::3 E3 E::3
l|Dm|||J||
:::::::::::::::::::::::::::::::::::::.:
:::::::::::::::::::::::::::::::::::::::::::
:.::::::::::::::::::::::::::::::::::::::::
:.::-::.:
=========================================
:.: :.: :.: :.: :,: (30.o
:.:
:': :': :': :': :': :-: :.: :.: :.: :.: :.: :-: :.: :.: r'--.-
:,: :-: :-: :.: :.: :-: :.: :.: :-: :-: :.: :-: :.: :.:
:-: :.: :.: :.: :.: :,: :.: :.: :-: :.: :.: :.: :.: :.: •
: :': :': :': :': :: :" :': :': :': :': :: :': :': :': (.io:.: :.: :.: :.: :.: :.: :.: :.: :.: :.:
' :.: :,: :.: :.: :.: :.: :.: :.: :.: :.: :,: :.: :.: :.:
:::]!:]!:]!:]]:]!:!!:]!:ii:]!:i]:ii:!]::-; :.: ..- ._
,::.::.: ._-:.::.::.::.: :.::.::.::.::,
:-: :.: :.: :.: :.: :.: :.:
.: :-: :.: :.: :-: :-: :.:
:-: :.: :.: :.: :.: :-:
I
r-_
36
iBBJg|H|Bi
::::::::::::::::::::::::::::::::::::
:-::.::-: !
:::::::::::::::::::::::::::::::::::::::::::: p,.,...°.o
::::::::::::::::::::::::::::::::::::::::::: CO============================================
:.: :.: :.: :.: :.: .......:,: :.: :,: :,: :,: :,: :.:. -_-:.:.. ...........
°'° ,,o ,,o .*o °.o .°o
• : :.: :.: :.: :-: :.:
___5_ _'o
37

BIIDKHH|||B
:,::,::,::-::.:",° °,' °,° '." "o°
::::::::::::::::::::::::::::::::: _=_:::::::::::::::::::::::::::::::::::::::::::::::::::::::::::::::::::::::::::::::::::::::::::::::::::::::::::::::::::::::::::::::::::::::::::::::::::::::::::::::::::::::::::::::::::::::::::::::::::::::::::::
I
B
0D||||Ii-III||
> L[)
A
-,-4
0
0 _
39
at)
o o _ o
D|_Km|DJ|
///
\
\\
\\
\
,goI
QJ
40
2.4
2.2
2.0Z
<: 1.8LUcr
I--- 1.6
13-
1.4
1.2
[]
o
Real Showers
Polynomial
Wedge1.0
0.0 0.5 1.0 1.5 2.0 2.5
CCD READING
Raw CCD density calibration. Slit size is 2501,tin for both systems. Note tile (.listmct difference
between sterl Ic ( wedge ) and dirty (real data) calibratmn.
2.0
co 1.5o3o'T--
c5"-41.0r'_00
m<
0.5
0.0
°° ° to .8.,•. °o
° o ,
..:,;.,_. • .•-".. • .-.-.: ..._
•,. t'i; .
.'d " i.
• _; _,/ .•1•_. .J &,• ,. "_ o " .
"1 "".. •."
• •- %°.
ay = 0.11
-0,3 0.0 0.3
y, - mxi -b
UAH CCD slit size = 3001,rmMSFC CCD slit size = 250#mJACEE-10, II BLOCK
0.0 0.5 1.0 1.5 2.0
MSFC PMT (EO, 4/92)
Net CCD density calibration Several hundred real shower spots are used. Measurements lit well
within a line of l)c(t) = 1.551)l, Mr for I)t, MT < 10
Figs. 14a & 14b
41
(AYO - _ura/$NO.I, OHd) s<HgMOd 9NIddOJ.S H.LIM SNO.I.OHd
11'--4
42
--- e-
(..00
mm
.(3m
Uim
U!__
e3
03
c)
|
UJIJJ
- U<{-3
0
X
I.--l-
m
..II.I.
I-ULU
0
0
0
XD
X
r_
LU
\
\
\
\
\
\
oC_
q
0c_
o.
0
"0
I i o0 0 0
A
E
000
O:
(/3ZI11a
0U.
I.i
3"IOI.I.EIVd _DNIZINOI INRININIIN blO.-I
uJd 001. 1:i3d AJ.ISN3Q NIVI:I£)
4.3
44
r._
o
II
E.
I
f
I_1 I l
C_J C_ ¢0 "0
1
II.
I I
Q
c_
ci
p.
r_
Oo aJl_Jq_k_.L
45
k
ECT FLIGHT EMULSIONS P01/03/21/69/C01/05/11/13
Figure 18
46
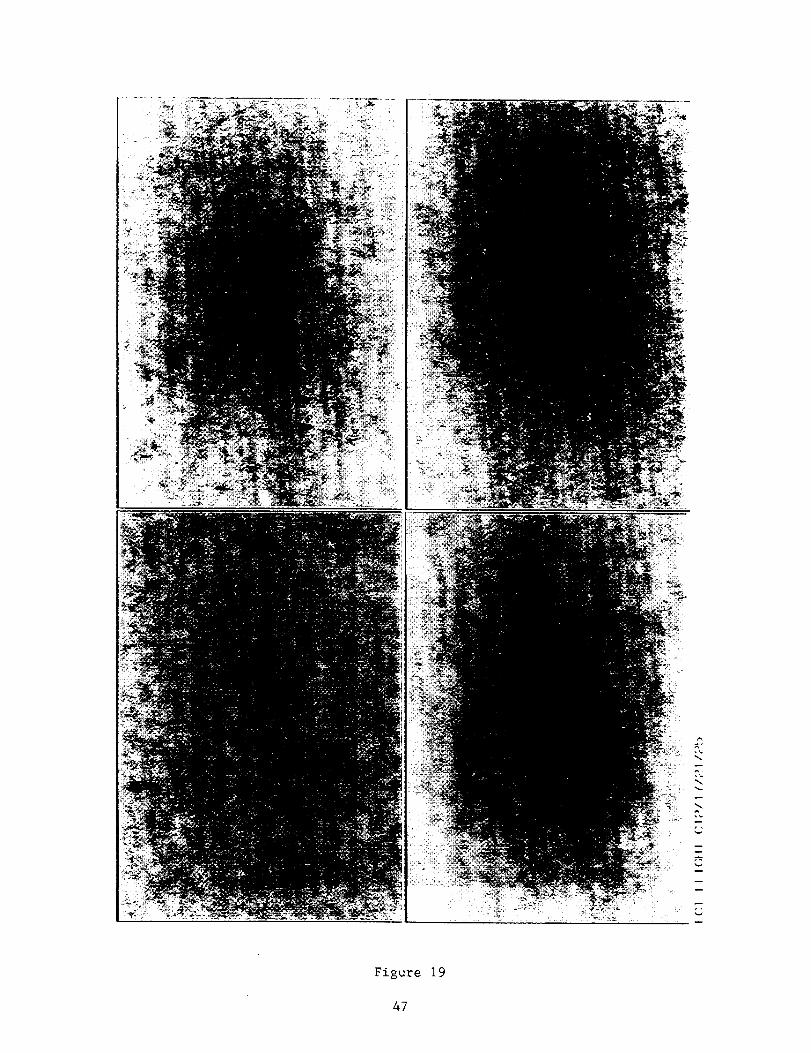
Figure 19
47
o
P
M
"r"C_
L,I.
iI.I.I
Figure 20
48
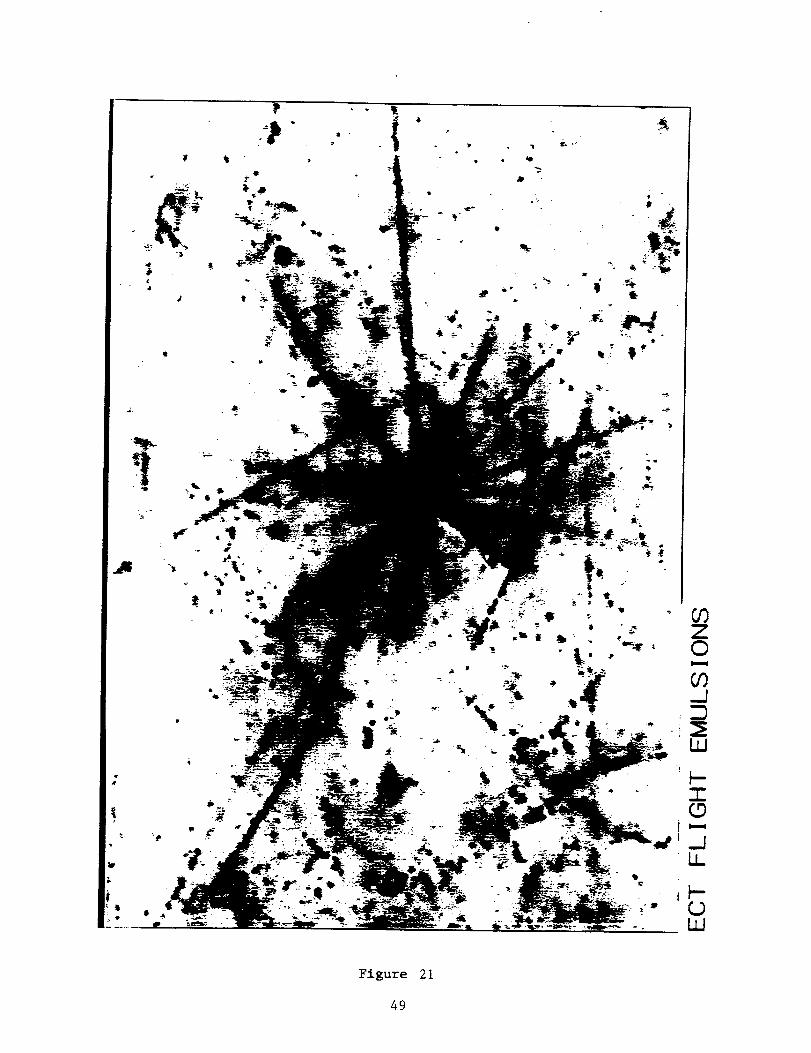
Figure 21
49
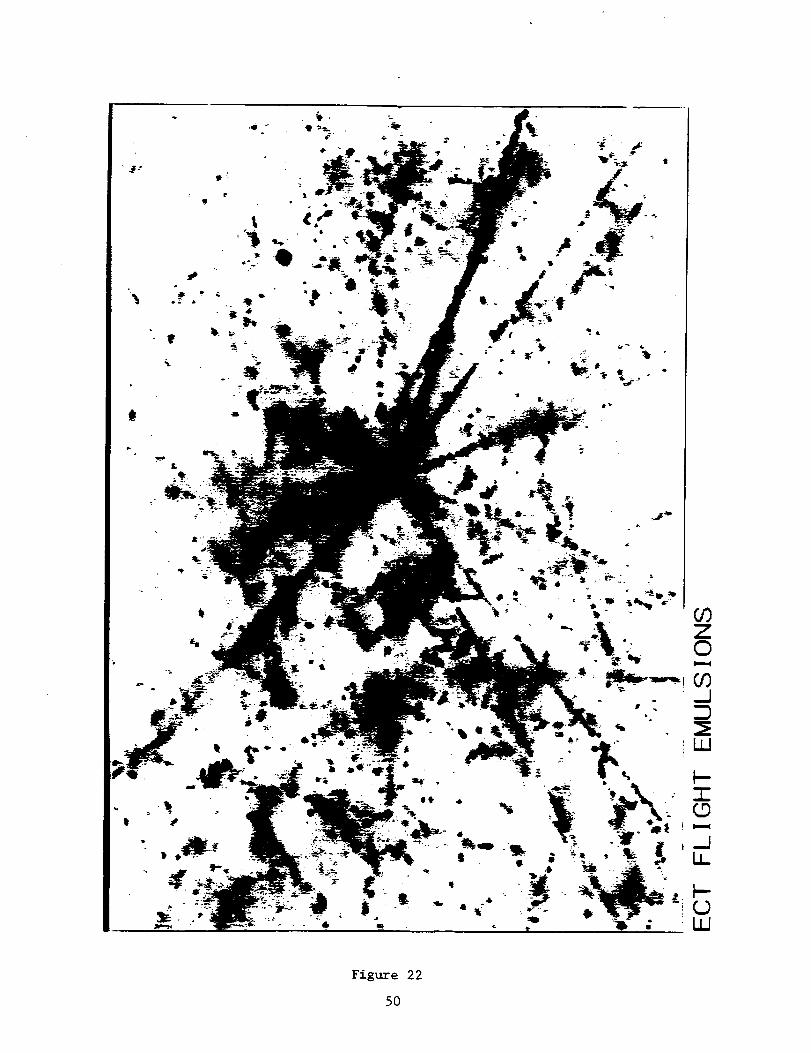
Figure 22
5O
illl
ECT FLIGHT (TOP) LDBF ( BOTTOM )
Figure 23
51
O
I
E
X
^V
Ct)
IX:
o
|
" - I
I
Q
°e,l o_
w•4- I
Iooo
mmm,J
E
_E
lm 4Fro
X _ m &_,
.aE_
_ a)-'.-'
_J
0,0
o
52
!
13.
C_
X
-oo
Av
j--
l--.e---4
I-ll,-4
I,,m-I
O o
°_ °l,IoJ gj-.F I
IOO
_1,=,
=E
D,.
_ w w._ Cm ._o '_
_NE_= ._= _
!
¢,4
I
C0
53
!
E(..)
X
^
[2:j--
0 ¢_ 0
°m, .,_
I •
0¢_0M
0
_o I o
m
e,,,i
¢_,
1::: C_I
,_ [::::
_'_" _ __..
_ w ,,,
×
_ °_ _
I
54
0
Q_
E
X
"0A
v
ra_v0
I'-" -"q
0
D ,,I
0
+ I
0
0r_l I o
°_
E
X _.o <
_ e---
QI
55
£',4C-4
|
O(..)
04E(.J
X
,,m,&
v
0O
rY
-_o
1...4a-4
l..ta.4
)la4
ira4
iz,- I
O
Z..
4-
[]
I
O
e
I.-13
56
,-L_,_oo,,-,i
I
0,4E
E o_:30
(3. OrJ') ..Q,_ m $
c'4 -o EE g_=
_.,-- ILl
@ _tO
X _.o o
r-'_ 0
"_ 0c- e- 1....
0
DENSDQ_C
4.00E+03
•_ 3.50E+03
_ 3.00E+03
i 2.50E+032.00E+03
O 1.50E+03
1.00E+03
5.00E+02
O.OOE+O0
0 Density
ft I I I I I
crl cr2 cr3 cr4 cr5 cr 6
CR.NO.
= part A
----o--- part B
; part C
Figure 25a
57
O. Average Area
50 .................................................................................................................
3oo25O
200q• 150 ....................................................................................................................<
100 ..........................................................................................................................................................................
50 ..................................................................................................................................................................
0 I I I I I
crl cr2 cr3 cr4 cr5 cr 6
CR. NO.
= partA
----D--- partB
* part C
Figure 25b
58
CRJC12RR O.J.DS
4.50E+02
4.00E+02
3.50E+02
v 3.00E+022.50E+02
¢0z 2.00E+02u,Ia
1.50E+02d
1,00E+02
5.00E+01
0.00E+00
RRP2
; I I I
RRP9 RRT28 RRC5 RRC22
CR NO.
= Part A
Part B
Part C
Figure 26a
59
CRJC12RR AVERAGE AREA
500
450400
350
,,¢ 300u.If_ 250
200gJ
150
100
5O
0
RRP2 RRP9 RRT22 RRC5 RRC22
CR NO.
= Part A
Part B
• Part C
Figure 26b
6O
t_
&J
P-.!
4.4
_o
N
E
0Z
1.0
0.5
0.0
fl'
!t'--26
IP
-- 20m
-- 14
Relativistic Chargem
• 1.8 GeV/n Fe
O 5.5 MeY _ (Am 241)
i ,_j t I I ! IIS
-L90 -60 -40 -20 0 20 40
Registration Temperature (oc)
T
?
I
60
| -
m
!
80
Figure 27
61
APPENDIX A
ECT Dosimetery Report: LET Spectra,Absorbed Doses and Neutron Dose Equivalents
Measurement of LET Spectra, Absorbed Doses and
Low Energy Neutron Dose Equivalents in the
Emulsion Chamber Technology Experiment
Final Report
E. V. Benton, A. L. Frank,
E. R. Benton, and L. A. Frigo
Subcontract No. SUB92-162-A4
University of Alabama in Huntsville
Huntsville, AL 35899
28 August 1995
Measurement of LET Spectra, Absorbed Doses and
Low Energy Neutron Dose Equivalents in the
Emulsion Chamber Technology Experiment
Abstract
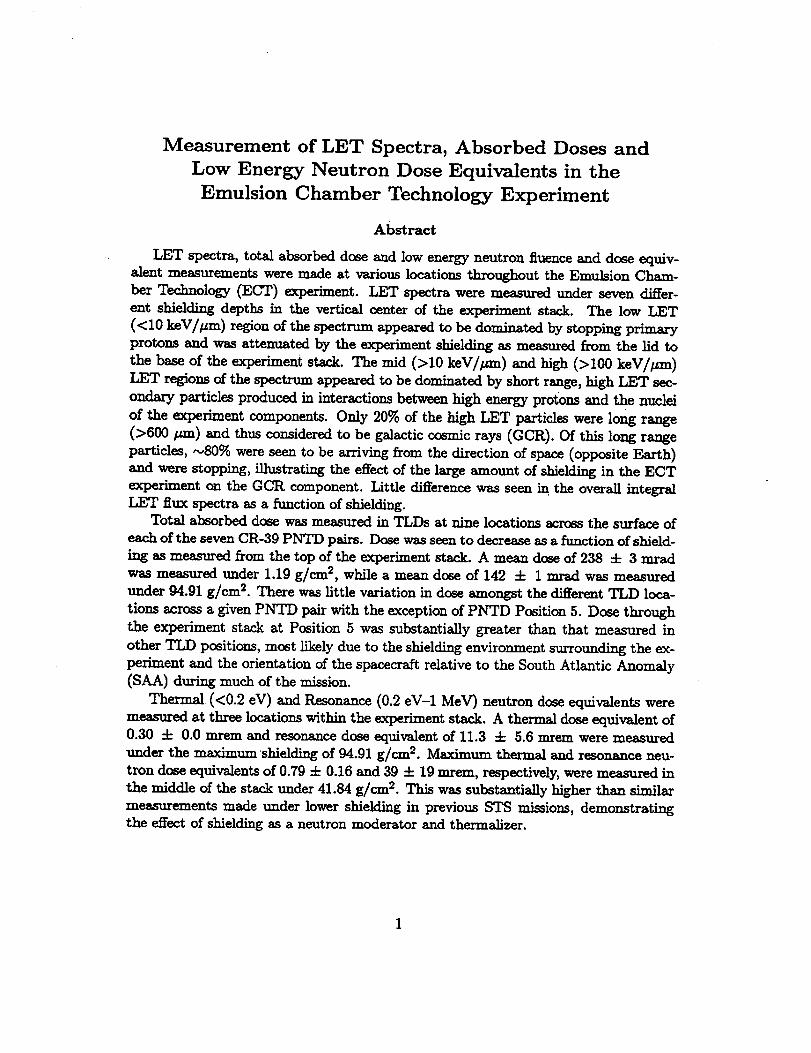
LET spectra, total absorbed dose and low energy neutron fluence and dose equiv-alent measurements were made at various locations throughout the Emulsion Cham-
ber Technology (ECT) experiment. LET spectra were measured under seven differ-
ant shieldingdepths in the verticalcenterof the experiment stack. The low LET
(<I0 keV//zm) regionof the spectrum appeared tobe dominated by stoppingprimary
protons and was attenuated by the experiment shielding as measured from the lid to
the base of the experiment stack.The mid (>i0 keV//_m) and high (>i00 keV/#m)
LET regionsof the spectrum appeared to be dominated by shortrange,high LET sec-
ondary particlesproduced ininteractionsbetween high energy protonsand the nuclei
of the experiment components. Only 20% of the high LET particleswere long range
(>600 pro) and thus consideredto be galacticcosmic rays (GCR). Of thislong range
particles,-_8(}_were seen to be arrivingfrom the directionof space (oppositeEarth)
and were stopping,illustratingthe effectof the largeamount of shieldingin the ECT
experiment on the GCR component. Littledifferencewas seen in,the overallintegral
LET fluxspectraas a functionof shielding.
Total absorbed dose was measured in TLDs at nine locationsacrossthe surfaceof
each ofthe seven CR-39 PNTD pairs.Dose was seento decreaseasa functionofshield-
ing as measured from the top ofthe experiment stack.A mean doseof 238 4- 3 mrad
was measured under 1.19g/cm 2,while a mean dose of 142 + I mrad was measured
under 94.91 g/cm 2.There was littlevariationindose amongst the differentTLD loca-
tionsacrossa givenPNTD pairwith the exceptionof PNTD Position5. Dose through
the experiment stack at Position5 was substantiallygreaterthan that measured in
other TLD positions,most likelydue to the shieldingenvironment surroundingthe ex-
periment and the orientationofthe spacecraftrelativeto the South AtlanticAnomaly
(SAA) during much of the mission.
Thermal (<0.2 eV) and Resonance (0.2eV-1 MeV) neutron dose equivalentswere
measured at threelocationswithinthe experimentstack.A thermaldose equivalentof
0.30 -4-0.0 mrem and resonancedose equivalentof 11.3 4- 5.6 mrem were measured
under the maximum shieldingof 94.91g/cm 2. Maximum thermal and resonance neu-
trondose equivalentsof0.79_ 0.16and 39 4- 19 torero,respectively,were measured in
the middle ofthe stackunder 41.84g/cm 2.This was substantiallyhigherthan similar
measurements made under lower shieldingin previous STS missions,demonstratingthe effectof shieldingas a neutron moderator and thermalizer.
Contents
1 Introduction
2
3
Experiment 4
2.1 Assembly of Experiment ............................. 4
2.2 Shielding of the ECT Experiment ........................ 8
9
3.1 Calibration of CR-39 PNTDs .......................... 9
3.2 Chemical Processing of CR-39 .......................... 10
3.3 Analysis of Processed Detectors ......................... 10
3.4 Generation of LET Spectra ........................... 11
3.5 Results and Discussion of LET Spectra Measurements ............. 13
3 LET Spectra Measurements from CR-39 PNTDs
4 Dose Measurements with TLDs
5 Low Energy Neutron Fluences and Dose Equivalents
6 Conclusion
24
29
31
2
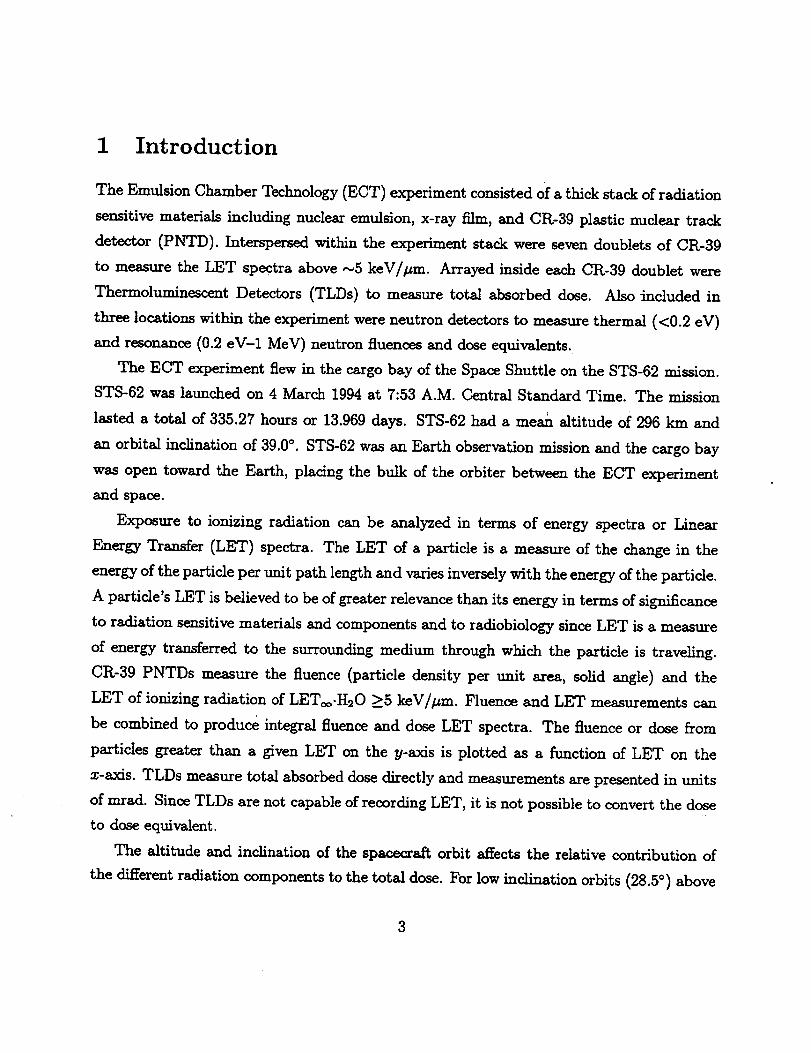
1 Introduction
The Emulsion Chamber Technology (ECT) experiment consisted of a thick stack of radiation
sensitive materials including nuclear emulsion, x-ray film, and CR-39 plastic nuclear track
detector (PNTD). Interspersed within the experiment stack were seven doublets of CR-39
to measure the LET spectra above N5 keV/#m. Arrayed inside each CR-39 doublet were
Thermoluminescent Detectors (TLDs) to measure total absorbed dose. Also included in
three locations within the experiment were neutron detectors to measure thermal (<0.2 eV)
and resonance (0.2 eV-1 MeV) neutron fluences and dose equivalents.
The ECT experiment flew in the cargo bay of the Space Shuttle on the STS-62 mission.
STS-62 was launched on 4 March 1994 at 7:53 A.M. Central Standard Time. The mission
lasted a total of 335.27 hours or 13.969 days. STS-62 had a mean altitude of 296 km and
an orbital inclination of 39.0 °. STS-62 was an Earth observation mission and the cargo bay
was open toward the Earth, placing the bulk of the orbiter between the ECT experiment
and space.
Exposure to ionizing radiation can be analyzed in terms of energy spectra or Linear
Energy Transfer (LET) spectra. The LET of a particle is a measure of the change in the
energy of the particle per unit path length and varies inversely with the energy of the particle.
A particle's LET is believed to be of greater relevance than its energy in terms of significance
to radiation sensitive materials and components and to radiobiology since LET is a measure
of energy transferred to the surrounding medium through which the particle is traveling.
CR-39 PNTDs measure the fluence (particle density per unit area, solid angle) and the
LET of ionizing radiation of LETcc.H_O >5 keV/pm. Fluence and LET measurements can
be combined to produce integral fluence and dose LET spectra. The fluence or dose from
particles greater than a given LET on the y-axis is plotted as a function of LET on the
x-axis. TLDs measure total absorbed dose directly and measurements are presented in units
of mrad. Since TLDs are not capable of recording LET, it is not possible to convert the dose
to dose equivalent.
The altitude and inclination of the spacecraft orbit affects the relative contribution of
the different radiation components to the total dose. For low inclination orbits (28.5 ° ) above
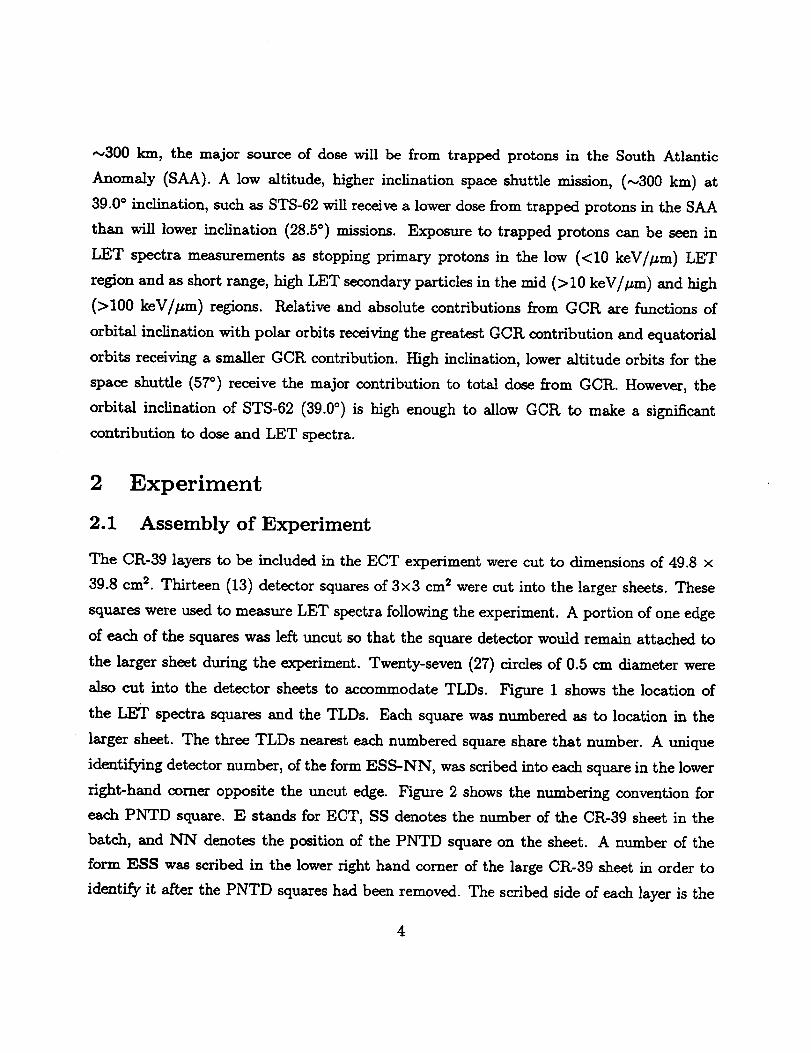
_300 km, the major source of dose will be from trapped protons in the South Atlantic
Anomaly (SAA). A low altitude, higher inclination space shuttle mission, (_300 km) at
39.0 ° inclination, such as STS-62 will receive a lower dose from trapped protons in the SAA
than will lower inclination (28.5 ° ) missions. Exposure to trapped protons can be seen in
LET spectra measurements as stopping primary protons in the low (<10 keV//_m) LET
region and as short range, hiF_ LET secondary particles in the mid (>10 keV/#m) and high
(>100 keV/#m) regions. Relative and absolute contributions from GCR are functions of
orbital inclination with polar orbits receiving the greatest GCR contribution and equatorial
orbits receiving a smaller GCR contribution. High inclination, lower altitude orbits for the
space shuttle (57 °) receive the major contribution to total dose from GCR. However, the
orbital inclination of STS-62 (39.0 °) is high enough to allow GCB. to make a significant
contribution to dose and LET spectra.
2 Experiment
2.1 Assembly of Experiment
The CR-39 layers to be included in the ECT experiment were cut to dimensions of 49.8 ×
39.8 cm 2. Thirteen (13) detector squares of 3x3 cm 2 were cut into the larger sheets. These
squares were used to measure LET spectra following the experiment. A portion of one edge
of each of the squares was left uncut so that the square detector would remain attached to
the larger sheet during the experiment. Twenty-seven (27) circles of 0.5 cm diameter were
also cut into the detector sheets to accommodate TLDs. Figure 1 shows the location of
the LET spectra squares and the TLDs. Each square was numbered as to location in the
larger sheet. The three TLDs nearest each numbered square share that number. A unique
identifying detector number, of the form ESS-NN, was scribed into each square in the lower
right-hand comer opposite the uncut edge. Figure 2 shows the numbering convention for
each PNTD square. E stands for ECT, SS denotes the number of the CR-39 sheet in the
batch, and NN denotes the position of the PNTD square on the sheet. A number of the
form ESS was scribed in the lower right hand comer of the large CR-39 sheet in order to
identify it after the PNTD squares had been removed. The scribed side of each layer is the
4
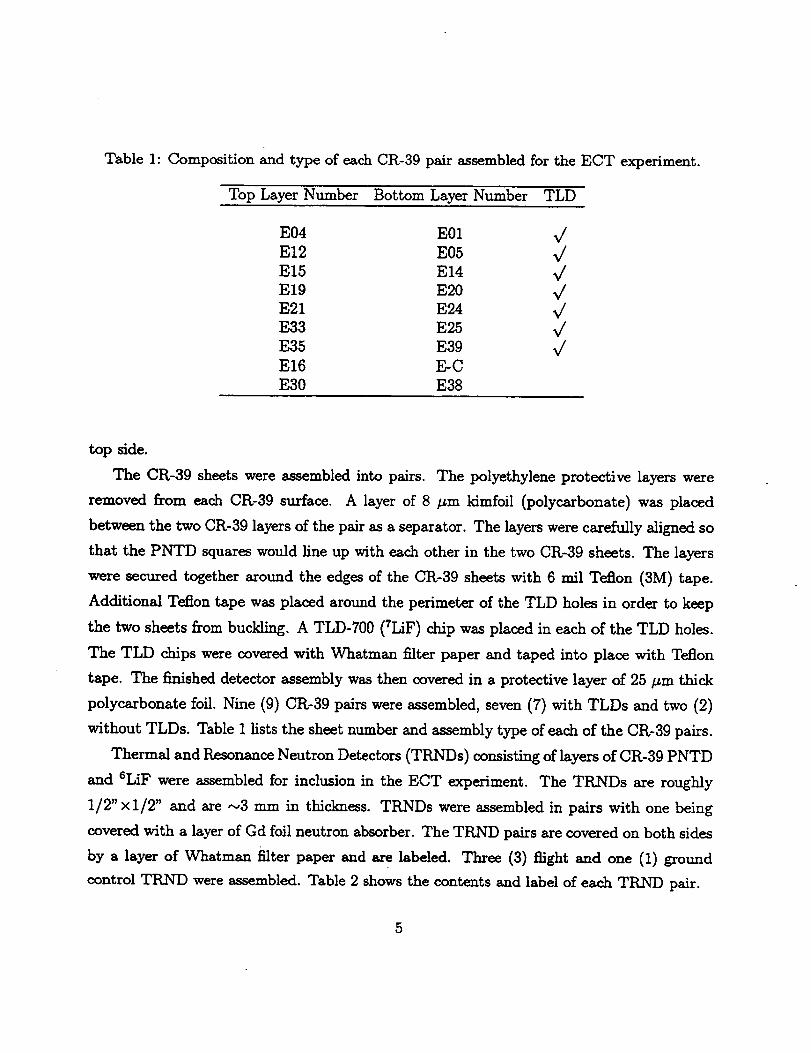
Table 1: Composition and type of eachCR-39pair assembled for the ECT experiment.
Top Layer Number Bottom Layer Number TLD
E04 E01 v/
El2 E05 _/
E15 El4 _/
El9 E20 _/
E21 E24 _/
E33 E25 _/
E39El6 E-C
E30 E38
top side.
The CR-39 sheets were assembled into pairs. The polyethylene protective layers were
removed from each CR,-39 surface. A layer of 8 /_m kimfoil (polycarbonate) was placed
between the two CR-39 layers of the pair as a separator. The layers were carefully aligned so
that the PNTD squares would line up with each other in the two CR-39 sheets. The layers
were secured together around the edges of the CR-39 sheets with 6 rail Teflon (3M) tape.
Additional Teflon tape was placed around the perimeter of the TLD holes in order to keep
the two sheets from buckling. A TLD-700 (TLiF) chip was placed in each of the TLD holes.
The TLD chips were covered with Whatman filter paper and taped into place with Teflon
tape. The finished detector assembly was then covered in a protective layer of 25 lzm thick
polycarbonate foil. Nine (9) CR-39 pairs were assembled, seven (7) with TLDs and two (2)
without TLDs. Table 1 lists the sheet number and assembly type of each of the CR-39 pairs.
Thermal and Resonance Neutron Detectors (TRNDs) consisting of layers of CR-39 PNTD
and SLiF were assembled for inclusion in the ECT experiment. The TRNDs are roughly
1/2" ×1/2" and are ,-,3 mm in thickness. TRNDs were assembled in pairs with one being
covered with a layer of Gd foil neutron absorber. The TRND pairs are covered on both sides
by a layer of Whatman filterpaper and are labeled. Three (3) flightand one (I) ground
control TRND were assembled. Table 2 shows the contents and label of each TRND pair.
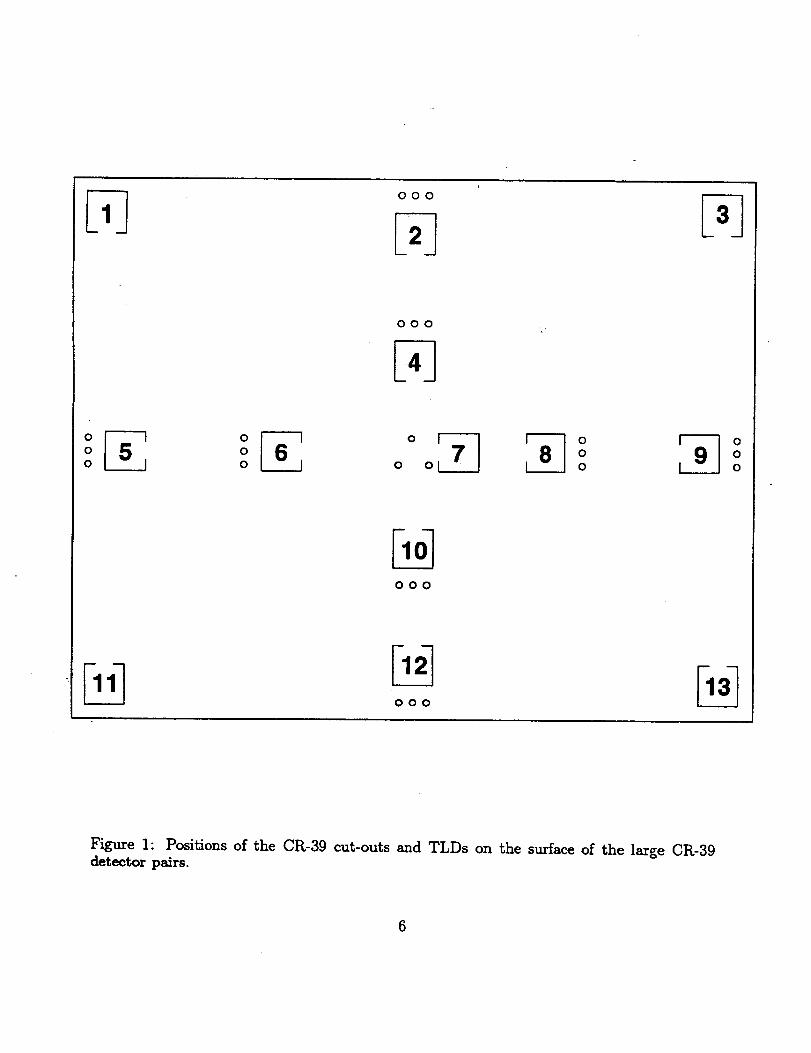
oo_
ooo
0 0 0 0
000 0
00
000
000
Figure 1: Positions of the CR-39 cut-outs and TLDs on the surface of the large CR-39detector pairs.
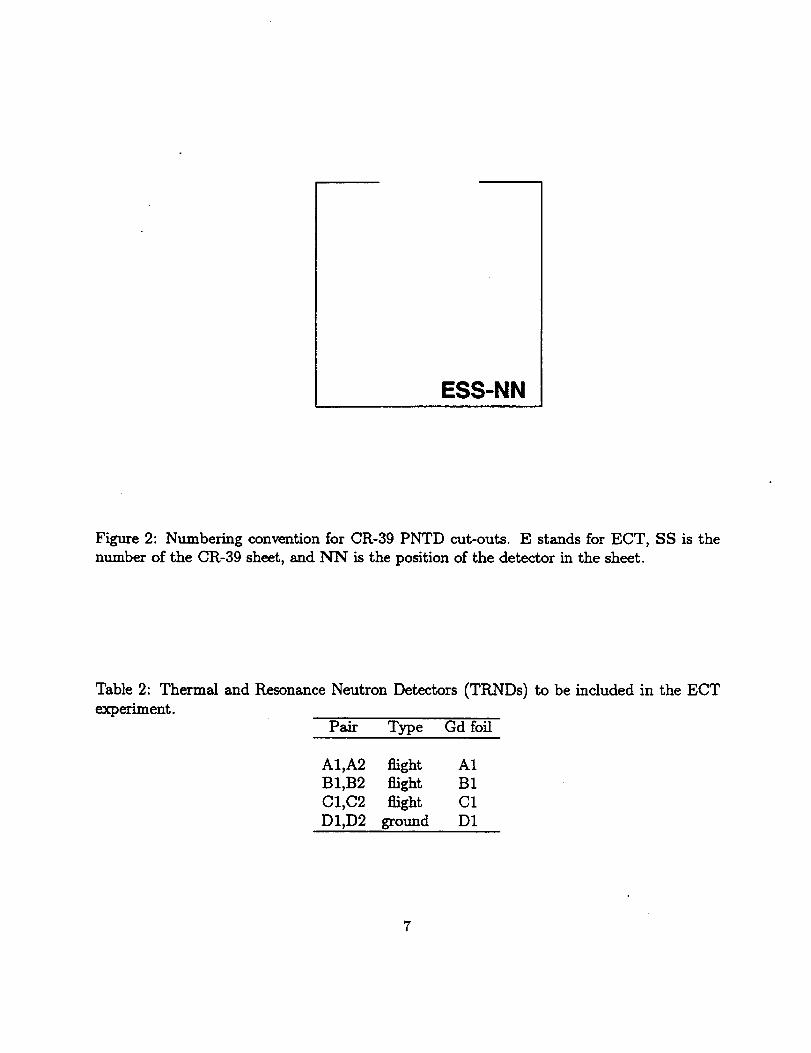
ESS-NN
Figure 2: Numbering convention for CR-39 PNTD cut-outs. E stands for ECT, SS is the
number of the CR-39 sheet, and NN is the position of the detector in the sheet.
Table 2: Thermal and Resonance Neutron Detectors (TRNDs) to be included in the ECT
experiment.
Pair Type Gd foil
A1,A2 flight A1
B1,B2 flight B1
C1,C2 flight C1
D1,D2 ground D1
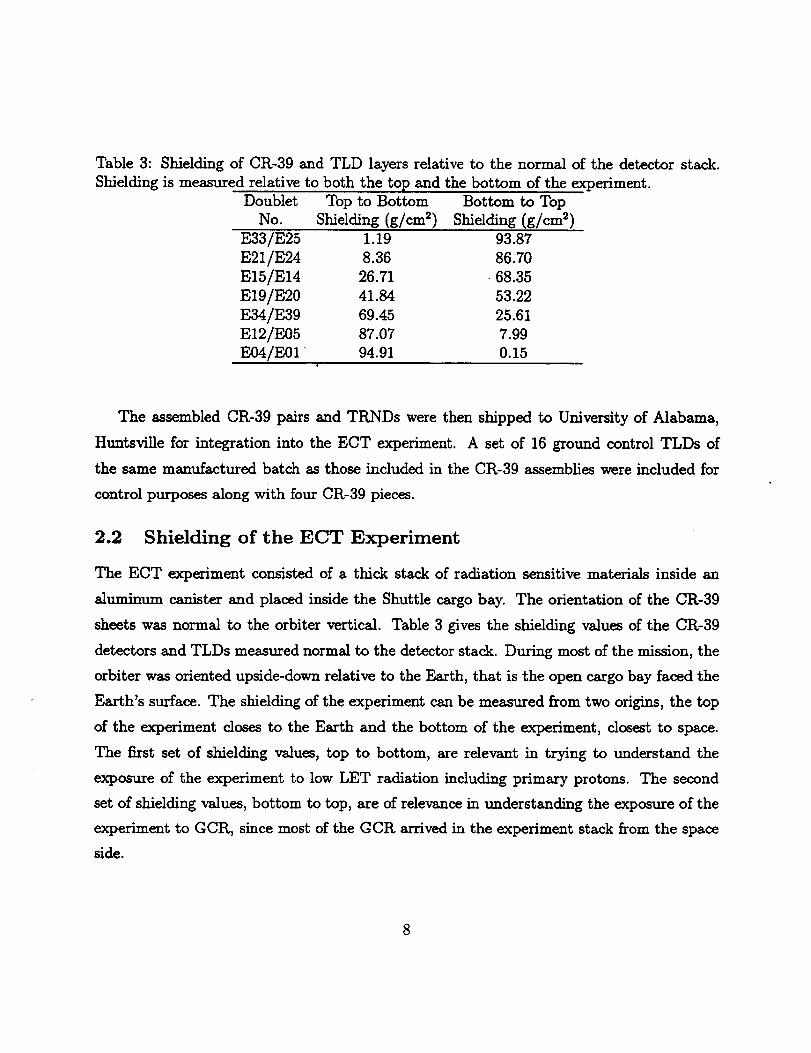
Table 3: Shielding of CR-39 and TLD layers relative to the normal of the detector stack.
Shielding is measured relative to both the top and the bottom of the experiment.
Doublet Top to Bottom Bottom to Top
No. Shielding (g/cm 2) Shielding (g/cm 2)
E33/E25 1.19 93.87
E21/E24 8.36 86.70
E15/E14 26.71 68.35
E19/E20 41.84 53.22
E34/E39 69.45 25.61
E12/E05 87.07 7.99
E04/E01 • 94.91 0.15
The assembled CR-39 pairs and TRNDs were then shipped to University of Alabama,
Huntsville for integration into the ECT experiment. A set of 16 ground control TLDs of
the same manufactured batch as those included in the CR-39 assemblies were included for
control purposes along with four CR-39 pieces.
2.2 Shielding of the ECT Experiment
The ECT experiment consisted of a thick stack of radiation sensitive materials inside an
aluminum canister and placed inside the Shuttle cargo bay. The orientation of the CB.-39
sheets was normal to the orbiter vertical. Table 3 gives the shielding values of the CR-39
detectors and TLDs measured normal to the detector stack. During most of the mission, the
orbiter was oriented upside-down relative to the Earth, that is the open cargo bay faced the
Earth's surface. The shielding of the experiment can be measured from two origins, the top
of the experiment doses to the Earth and the bottom of the experiment, closest to space.
The first set of shielding values, top to bottom, are relevant in trying to understand the
exposure of the experiment to low LET radiation including primary protons. The second
set of shielding values, bottom to top, are of relevance in understanding the exposure of the
experiment to GCR, since most of the GCR arrived in the experiment stack from the space
side.
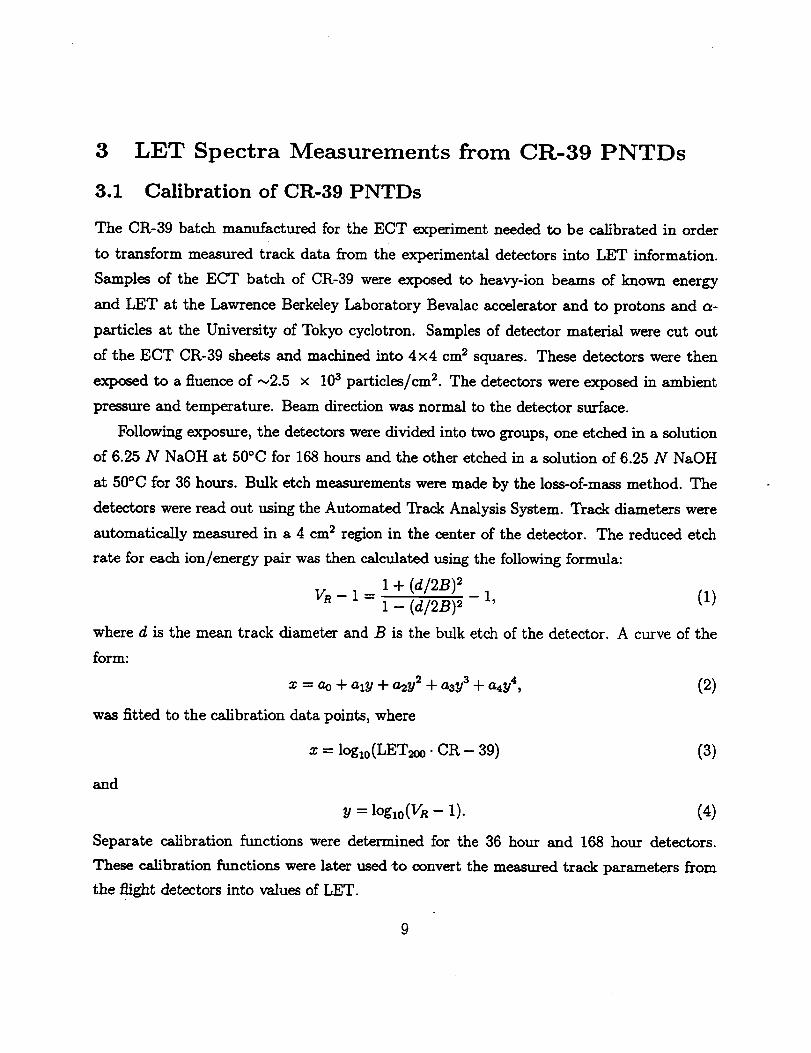
3
3.1
LET Spectra Measurements from CR-39 PNTDs
Calibration of CR-39 PNTDs
The CR-39 batch manufactured for the ECT experiment needed to be calibrated in order
to transform measured track data from the experimental detectors into LET information.
Samples of the ECT batch of CR-39 were exposed to heavy-ion beams of known energy
and LET at the Lawrence Berkeley Laboratory Bevalac accelerator and to protons and a-
particles at the University of Tokyo cyclotron. Samples of detector material were cut out
of the ECT CR-39 sheets and machined into 4×4 cm 2 squares. These detectors were then
exposed to a fluence of --,2.5 × 103 particles/cm 2. The detectors were exposed in ambient
pressure and temperature. Beam direction was normal to the detector surface.
Following exposure, the detectors were divided into two groups, one etched in a solution
of 6.25 N NaOH at 50°C for 168 hours and the other etched in a solution of 6.25 N NaOH
at 50°C for 36 hours. Bulk etch m_surements were made by the loss-of-mass method. The
detectors were read out using the Automated Track Analysis System. Track diameters were
automatically measured in a 4 cm 2 region in the center of the detector. The reduced etch
rate for each ion/energy pair was then calculated using the following formula:
1 + (d/2B) 2
VR- 1 = 1 - (d/2B) 2 - 1, (1)
where d is the mean track diameter and B is the bulk etch of the detector. A curve of the
form:
x = ao ..F azy -t- a2y 2 -F a3y 3 -t- a4y 4,
was fitted to the calibration data points, where
x = loglo(LET200 • CR - 39)
and
(2)
(3)
= lOgl0(VR- I). (4)
Separate calibration functions were determined for the 36 hour and 168 hour detectors.
These calibration functions were later used to convert the measured track parameters from
the flight detectors into values of LET.
9
3.2 Chemical Processing of CR-39
LET spectra was measured in CR-39 PNTDs at seven shielding depths within the ECT
stack. Doublets were removed from the thirteen locations on the large CR-39 sheets. The
upper sheet of each doublet was etched for 36 hours in a solution of 6.25 N NaOH at 50°C.
The lower sheet in each doublet was etch for 168 hours in 6.25 N NaOH at 50°C. The two
etching regimes were used in order to enhance tracks from two different components of the
LET spectra. The values of bulk etch (thickness of material removed from each surface of the
CR-39 detector by chemical processing) of detectors processed for 168 hours and 36 hours
were ,-_40 pm and ---8 pro, respectively.
3.3 Analysis of Processed Detectors
LET spectra was measured in each of the two layers from the doublet in position 7 on the
large CR-39 sheet. A three pass, semi-automated track analysis system was used to scan the
detector surface and measure the particle tracks. During the first pass, an etched CR-39 layer
was placed on the microscope stage and all the objects on the detector surface (both tracks
and noise) were automatically located. During the second pass, a human operator reviewed
all the detected objects, separating particle tracks from spurious noise events. Finally, during
the third pass, the operator measured semi-major and semi-minor axes of each elliptical track
opening. The measured track parameters were converted to the unitless reduced etch rate
ratio, VR, by:
_/ 4(a/B)2VR -- 1 -F [1 - (b/B)_] 2' (5)
where a and b are the semi-major and semi-minor axes of the track surface openings and B
is the bulk etch of the detector. Values of VR were converted to LET using the calibration
functions determined for the specific manufactured batch of CR-39 employed in the ECT
experiment. Separate calibration functions were used for the 168 and 36 hour etches.
10
3.4 Generation of LET Spectra
Two etching regimes were used in order to enhance tracks produced by particlesbelonging
to differentcomponents of the LET spectra. The 168 hour etch allows low LET tracks to
become sufficientlylargeto be easilylocated and measured. However, the long etch period
over-etchestracksproduced by short-range,high-LET secondaries.The 36 hour etch permits
short-range, high-LET secondary particletracksto be measured since these tracks are not
over-etched during the short etch period. Low LET tracksare too small to be easilymeasured
using such a short etch time.
The LET spectra for each layer of the doublet was determined separately. The spectra
for the two etch durations were then combined to create a total LET spectrum. Figure 3
shows the integralLET flux spectra measured in the two detectorsof the E04/E01 doublet
for the 36 hour etch, the 168 hour etch and the combined spectra. At low LETs, there is
littledifferencebetween the 168 hour spectrum and the combined spectra, while at high
LETs, the 36 hour spectrum isidenticalto the combined spectra. The 168 hour spectrum
fallsoff more rapidly than does the 36 hour spectrum at high LETs, illustratingthat the
longer etch period causes some of the high LET data to be lost.This data mostly takes the
form of tracks from short-range,high-LET secondary particles.These particleshave ranges
lessthan the ,-,40#m bulk etch produced by the 168 hour etch,and the resultingtracksare
over-etched and unmeasurable afterthisthicknessof detector isremoved. The 36 hour etch
only extends down to ,-,30keV/#m, while the 168 hour spectraextends down to _5 keV/#m,
the minimum LET registrationthreshold in CR-39. The shorter etching regime does not
provide enough time for the low LET tracks to become large enough to be readily located
and measured. By combining the LET spectra for the two etch regimes, an LET spectrum
covering both LET regions isobtained.
The values of uncertainty in the LET spectra have been estimated. Figure 4 shows the
combined integralLET flux spectrum for detectors E04/E01 with error bars. In the low
LET region (LEToo-H20_10 keV/#m) the uncertainty in the integral flux spectrum is _6%.
For LET=.H20,_100 keV//_m, the integral LET flux spectrum uncertainty is _8%. At high
LET (LEToo-H20_500 keV/#m), the uncertainty in integral flux spectrum is --,40%. The
11
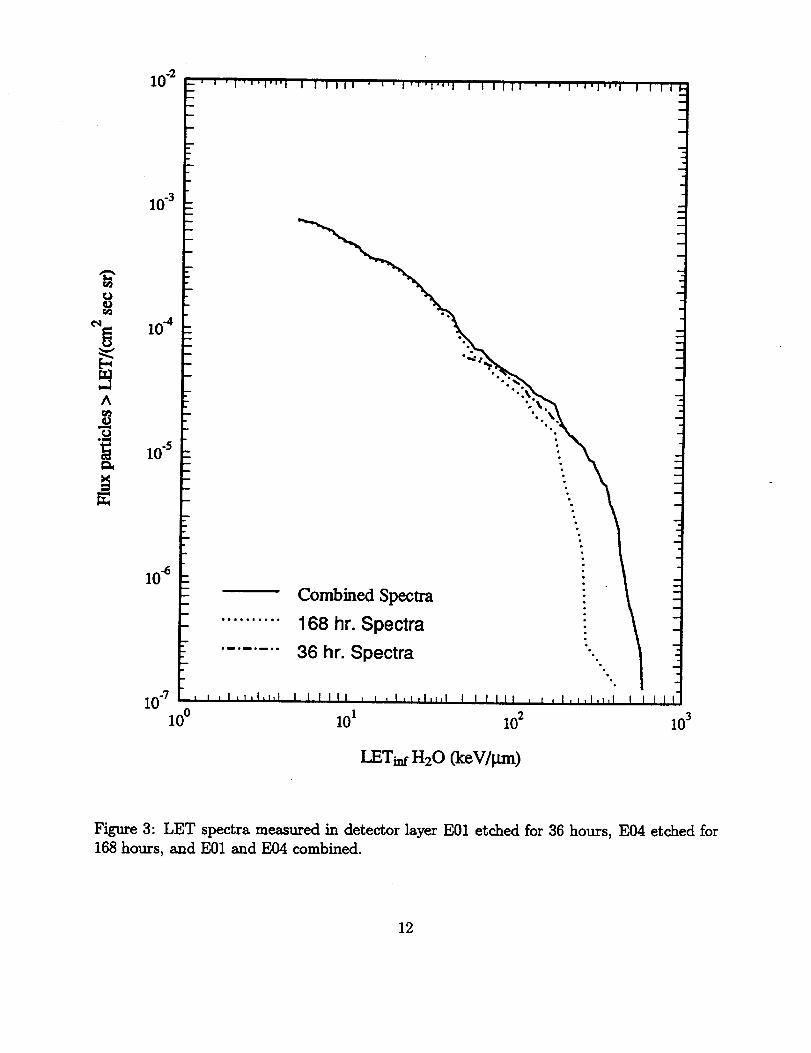
10.2
I0-3
_ 10..4
lO.S
10"_
Combined Spectra
168 hr. Spectra
36 hr. Spectra /10-7
100 101 102 103
LETinf H20 (keV/Bm)
Figure 3: LET spectra measured in detector layer E01 etched for 36 hours, E04 etched for168 hours, and E01 and E04 combined.
12
sizableincrease in uncertainty at high LET is due to poor statisticssince there are only
a small number of tracks in this LET region. Values of uncertainty in integral LET flux
spectra were similar for the other six measured LET spectra.
3.5 Results and Discussion of LET Spectra Measurements
Figure 5 shows the combined integral LET flux spectra for the seven CR-39 doublets mea-
sured for the ECT experiment. Figures 6 to 12 show separately the combined integral LET
spectra for each doublet. Over most of the LET range, there is close agreement between all
seven spectra within the limits of uncertainty. At low LET, the highest flux values were seen
in detectors E33/E25 (Figure 6). This detector pair was closest to the lid of the experiment
and was the least shielded pair from low LET particles arriving from the Earth direction.
Since the cargo bay was opened toward the Earth and the layers E33/E25 were the most heav-
ily shielded pair from particles arriving from the space (anti-Earth) direction, this detector
pair had one of the lowest flux spectra in the high LET region (LEToo.H_O>100 keV//_m).
A significant fraction of the particles in the high LET region are GCR and the largest flux
of GCR is expected from the space direction.
Detector pair E04/E01 (Figure 12) was at the bottom of the ECT experiment stack,
closest to the floor of the cargo bay. It was the most heavily shielded detector pair from
particles arriving from the Earth direction and the least shielded from particles arriving from
the space direction. E04/E01 had amongst the lowest flux values in both the low and high
LET regions showing the complexity of shielding effects. In addition to the shielding from
the experiment stack, there is also significant shielding from the orbiter itself, especially from
the floor of the cargo bay which was parallel to the experiment stack.
The highest values for LET flux spectra in the mid and high LET regions (LEToo-H20>_20
keV//_m) were measured in detector pairs E15/E14 and E19/E20 (Figures 8 and 9, respec-
tively). These detector pairs were in the middle of the experiment stack. Given the shielding
of these detector pairs from the experiment stack as measured from the space-end of the ex-
periment, plus the shielding of the orbiter, these two detector pairs were probably the most
heavily shielded of the experiment. This relatively large amount of shielding probably led
13
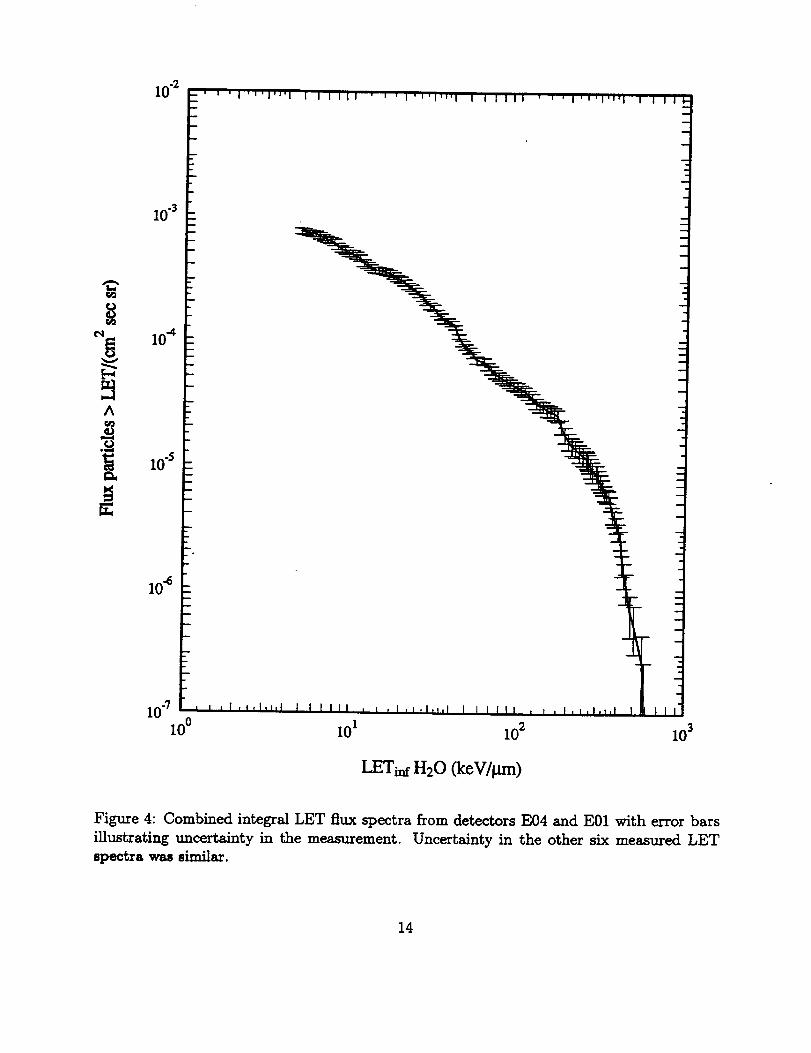
10.2
lO.S
10 °
10 0 101 102
LETinf H20 OceV/_rn)
Figure 4: Combined integral LET flux spectra from detectors E04 and E01 with error bars
illustrating uncertainty in the measurement. Uncertainty in the other six measured LET
spectra was similar.
14
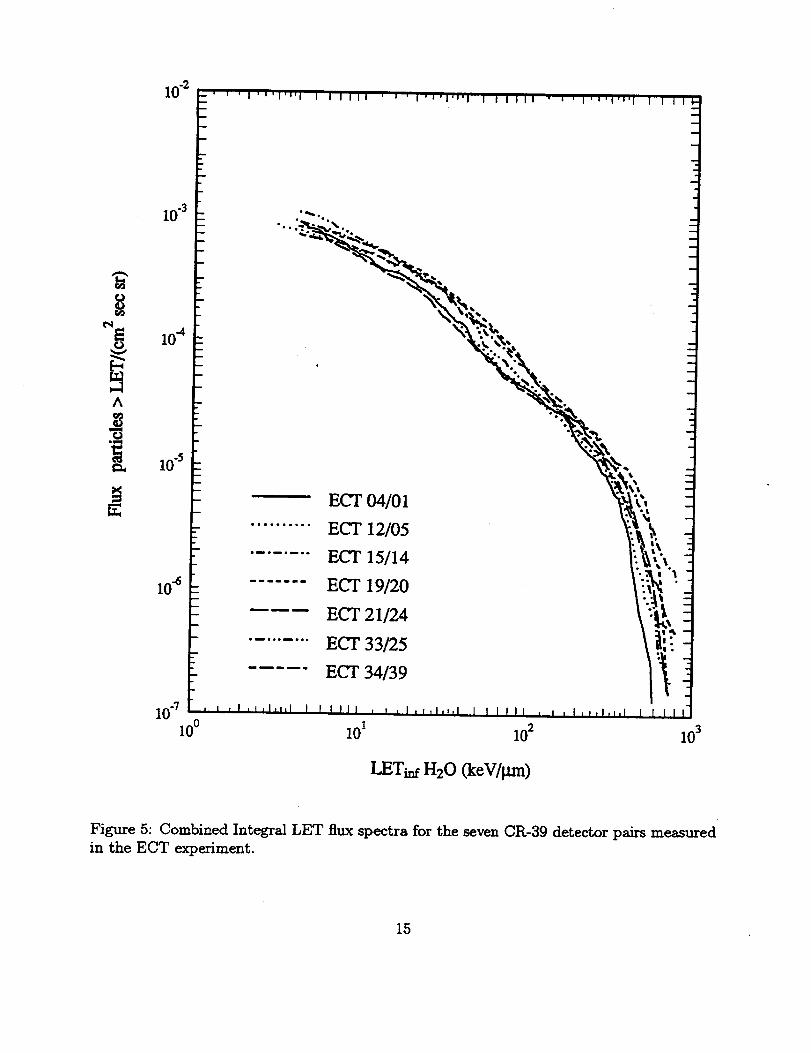
10 -2
8e,1
A
10"s
10 -4
10 "s
lif e
ECT 04/01
.......... ECT 12/05
........ ECT 15/14
....... ECT 19/20
ECT 21/24
......... ECT 33/25
..... ECT 34/39
10 -s
10° 101 10 2 10 s
LET_ H20 (keWgm)
Figure 5: Combined Integral LET flux spectra for the seven CR-39 detector pairs measured
in the ECT experiment.
15
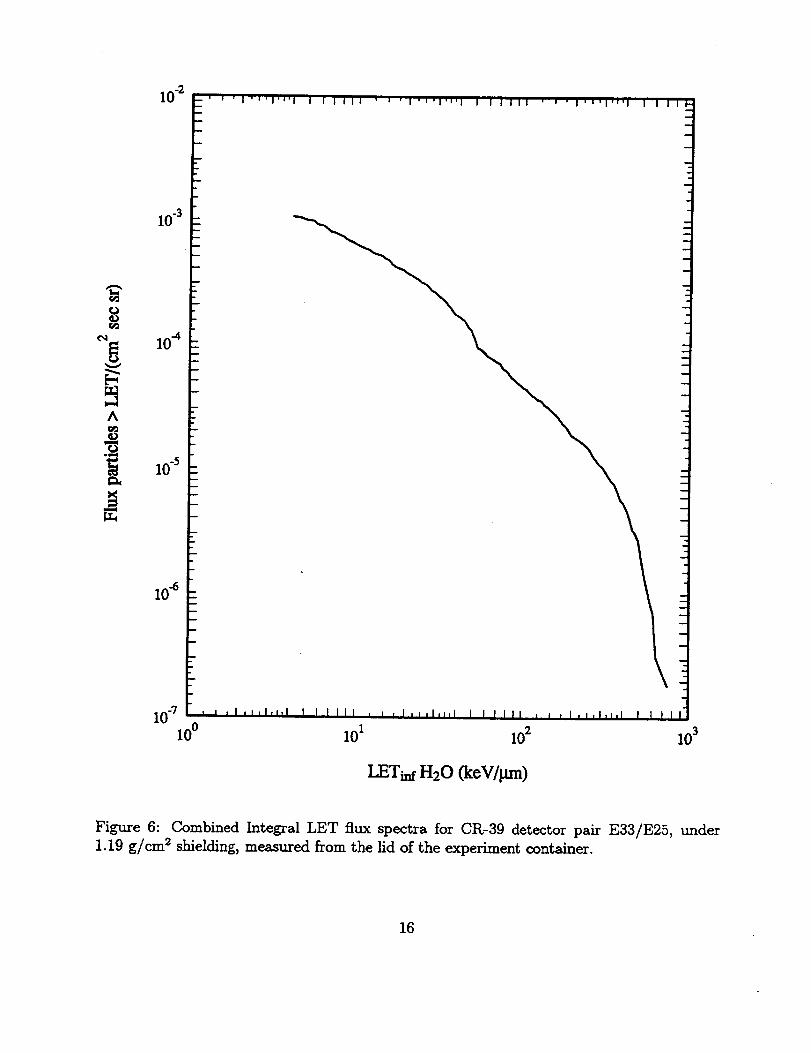
r_
A
I0"3
10-4
10 -s
10 _s
10 -_
10 ° 101 10 2 lO s
LETuff H20 (keV/_m)
Figure 6: Combined Integral LET flux spectra for CR-39 detector pair E33/E25, under
1.19 g/cm 2 shielding, measured from the lid of the experiment container.
16
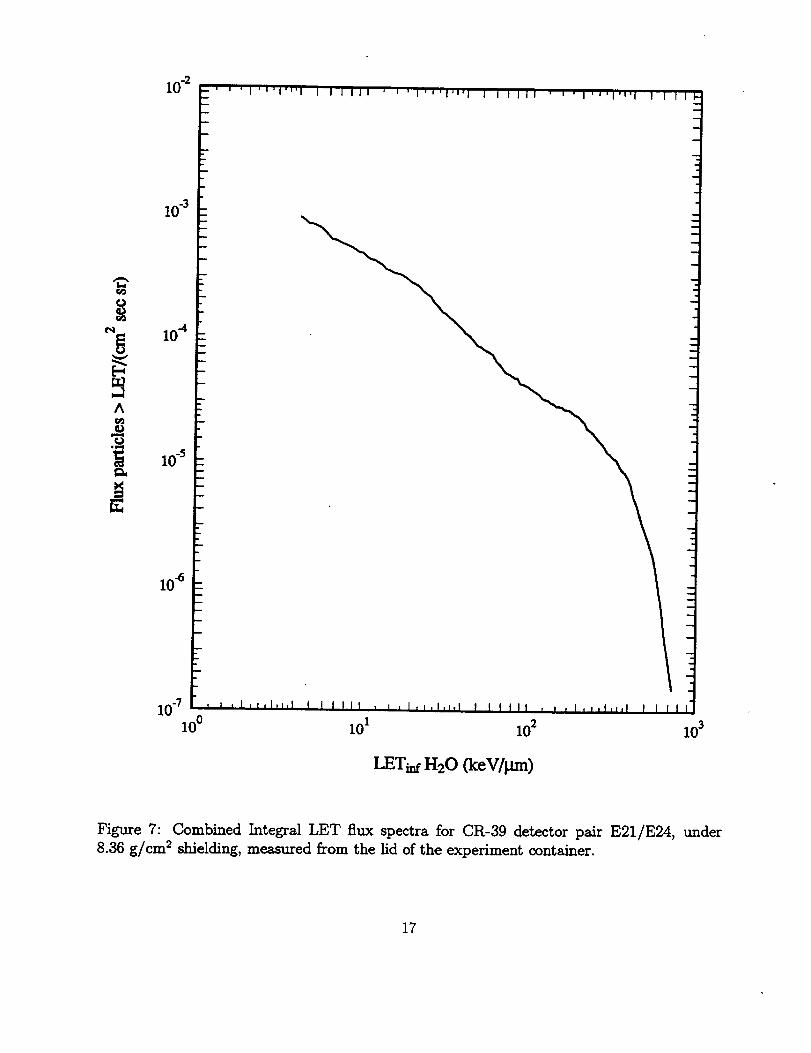
10-2
10-3
10.4
_t_ lOS
10 -_
10 a
10 ° 101 102 10 3
LET_ H20 (keY/lain)
Figure 7: Combined Integral LET flux spectra for CR-39 detector pair E21/E24, under
8.36 g/cm 2 shielding, measured from the lid of the experiment container.
17
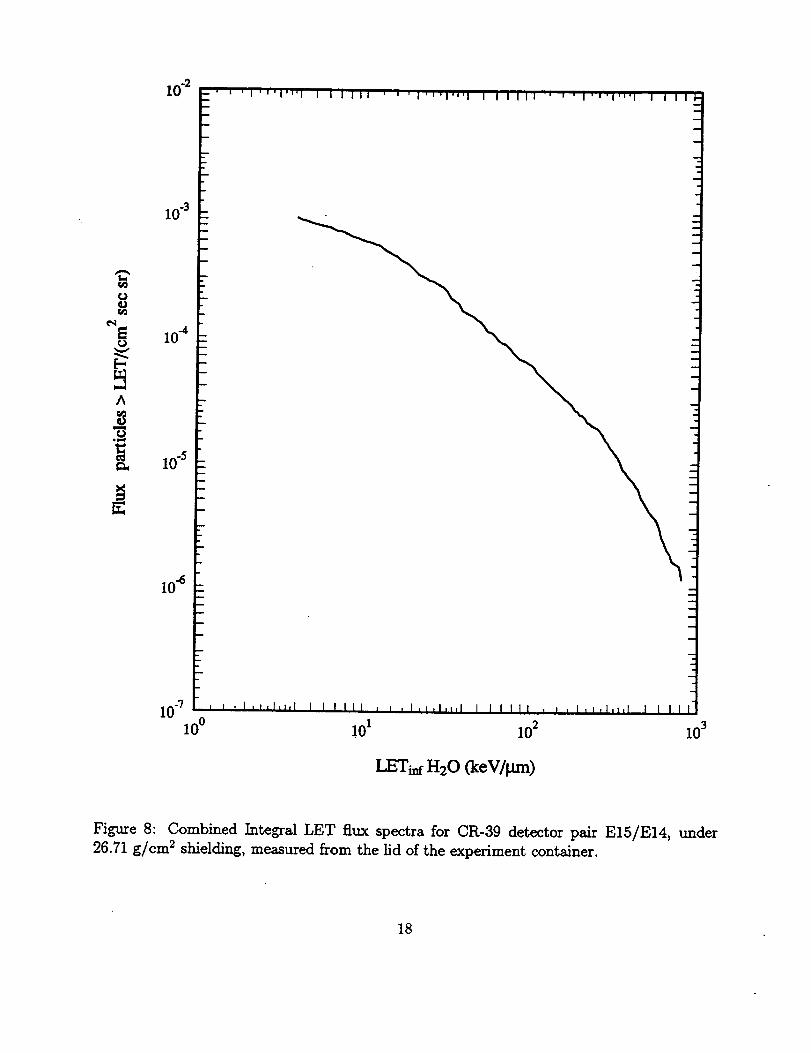
10-2
10-3
10.4
"__ 10 -5
10 -6
LET_ H20 (keY/gin)
Figure 8: Combined Integral LET flux spectra for CR-39 detector pair E15/E14, under
26.71 g/cm 2 shielding, measured from the lid of the experiment container.
18
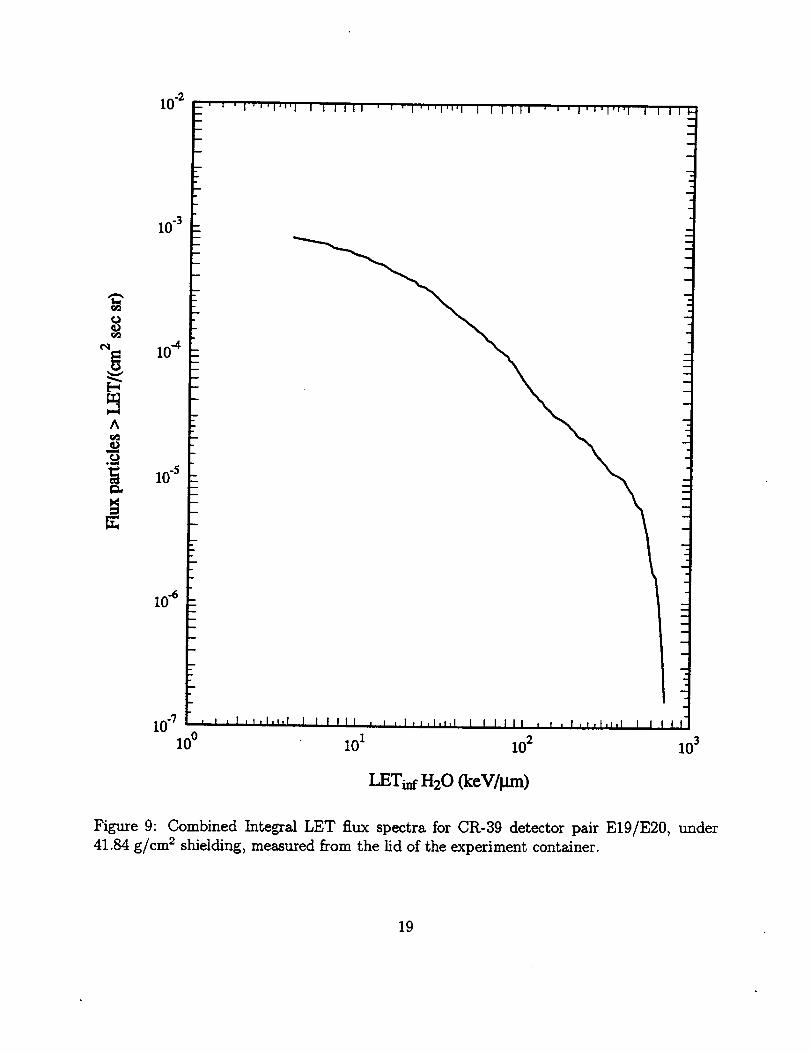
10.2
10 .3
_ 104
"_ 10-5
104
I0 '] t
100 101 102 103
LET_ H20 (IceVl Lm)
Figure 9: Combined Integral LET flux spectra for CR-39 detector pair E19/E20, under
41.84 g/cm 2 shielding, measured from the lid of the experiment container.
19
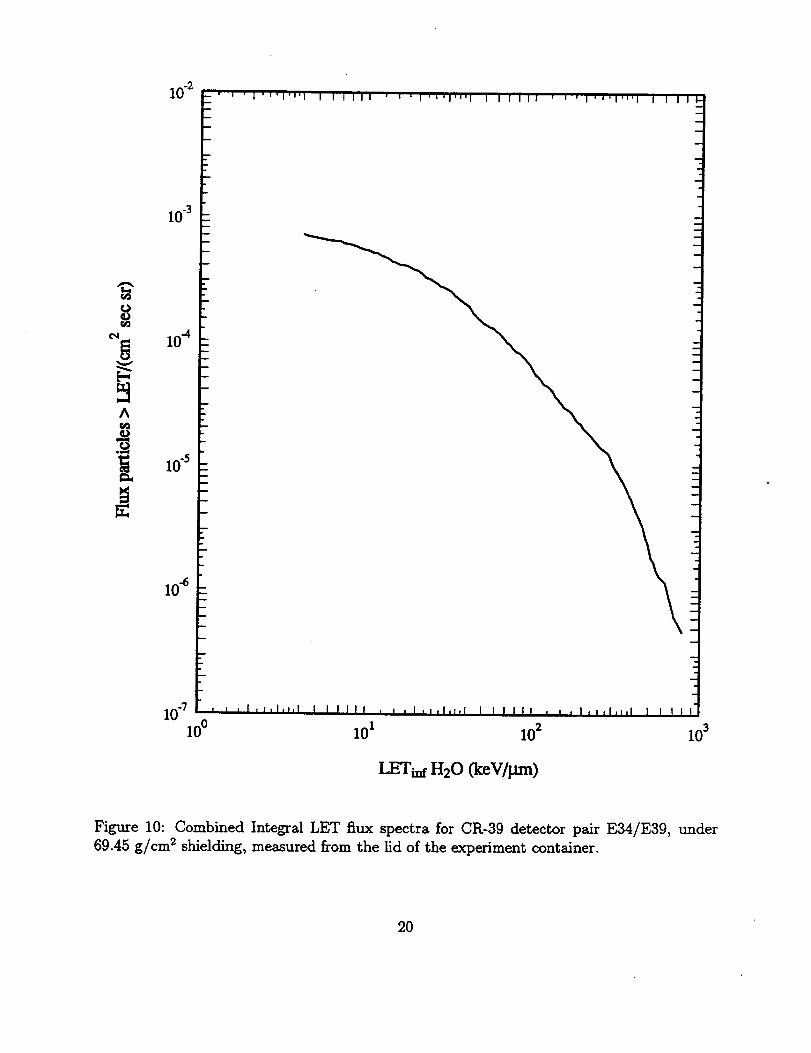
10-2
i0 -3
10.4
"_ 10"s
10-6
10° 101 102 l0 s
LET_ H20 (keY/pro)
Figure 10: Combined Integral LET flux spectra for CR-39 detector pair E34/E39, under
69.45 g/cm 2 shielding, measured from the lid of the experiment container.
2O
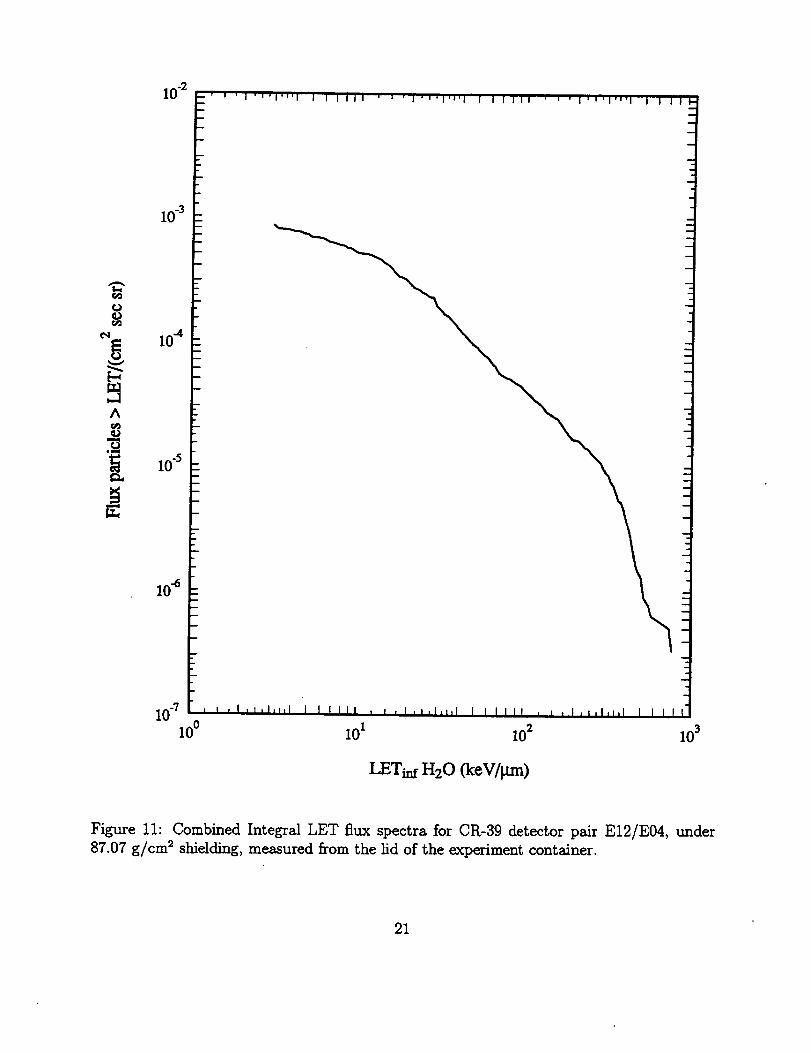
"L"
¢)r_
eq
A
10 .3
i0"5
10_
10° 101 10 2 10 3
LETinf H20 (keW_n)
Figure 11: Combined Integral LET flux spectra for CR-39 detector pair E12/E04, under
87.07 g/cm 2 shielding, measured f_om the lid of the experiment container.
21
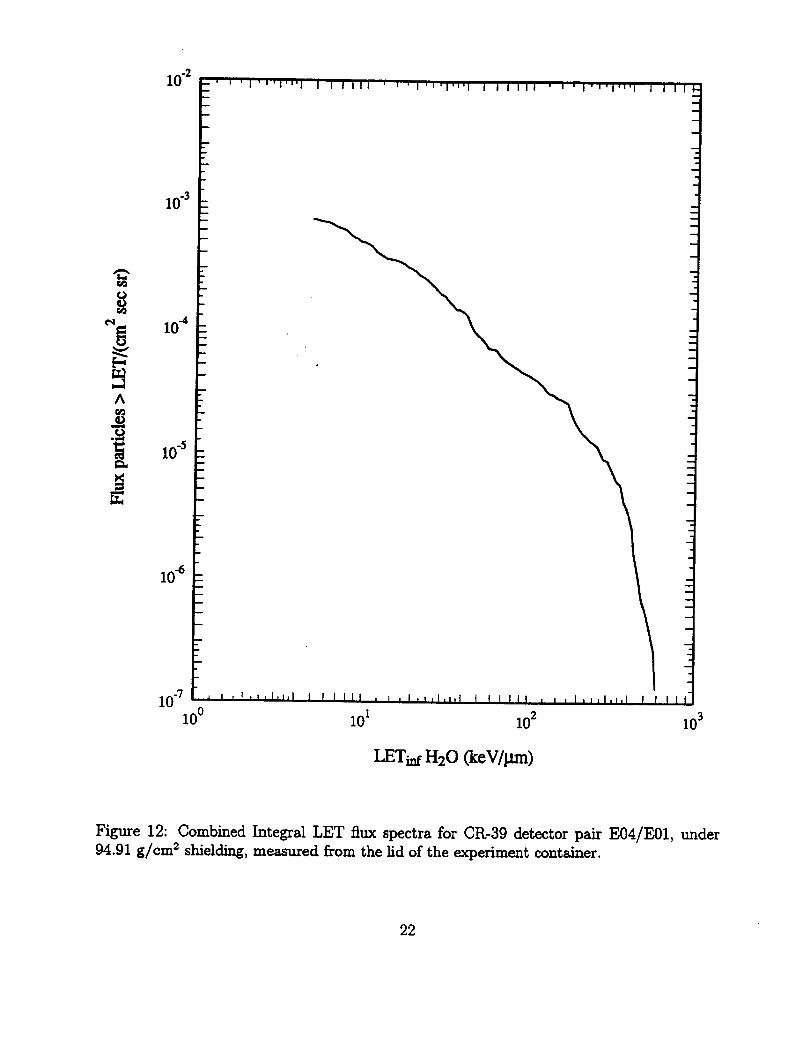
10 .2
Ar_o
10.3
10 "4
10 .5
10"6
/10 -7
10 0 101 10 2 10 3
LETinf H20 (keV/gm)
Figure 12: Combined Integral LET flux spectra for CR-39 detector pair E04/E01, under
94.91 g/cm 2 shielding, measured from the lid of the experiment container.
22
to a large production of short-range,high-LET secondary particlesin these layers.Particls
passing through the experiment were reduced in energy and increasedin cross sectionsfrom
nucleon interactions.They subsequently underwent inelasticcollisionswith the heavier nu-
clei(C and O) of the CR-39 and surrounding materials,producing the relativelyhigh signal
measured in the mid to high LET region.
Particleevents were divided into two categories,long range events (>600 #m) consisting
mostly of GCR, and short range events (<600 #m). Long range particleevents were identified
when two tracks,one of each surface of the detector layer,were found to have been made
by the same particle.Since the pre-etch thicknessof the CR-39 layerswas ,_600/zm, the
minimum range of two surface particlesevents was on the order of this thickness. The
remaining particleevents took the form of singletracks on only one surface of the CR-39
detector.At low LETs, (<10 keV//_m), most oftheseevents are made up of stopping primary
protons. At higher LETs, a significantfractionof these events are caused by short-range,
high-LET secondary particles.The minimum range of a particleobserved in CR-39 as a
track followinga 36 hour etch is_8 _m.
For all seven detector pairs measured, _20% of the particleevents were long range. In
CR-39 detectors flown in lessheavily shieldedconfigurations(i.e.insidea Shuttle mid-deck
locker),long range events show littlechange in LET through the thickness of the detector.
Tracks on each of the two detector surfaces are roughly of equal size,indicating that the
particle'sLET is changing only slowly. For a majority of the long range particle events
measured in the ECT CR-39 layers,the track on the surface of the detector facing space
was often smaller than the track on the surfacefacing Earth. This was seen in ,_80% of the
long range particleevents and indicatesthat the particleswere arrivingfrom the directionof
space and that they were near the end of theirranges (i.e.the change in track sizeindicates
the rapid change in LET seen near the particle'sBragg peak). That fact that so many of
the long range particleevents were near theirstopping points illustratesthe effectof heavy
shieldingof the ECT experiment on the GCR component.
23
4 Dose Measurements with TLDs
Sets of three TLDs were positioned in nine locations across the plane of each of the seven
CR-39 detector pairs (see Figure 1). Following disassembly of the detectors after flight, all
the TLDs were read out along with background detectors. Measured dose values from each
of the three TLDs within a given set were averaged together to obtain a mean dose for that
particular position on a given CR-39 detector layer. Mean measured doses from TLDs are
listed in Table 4, along with the uncertainty in each measurement, in terms of CR-39 pair
and TLD position. Also listed in Table 4 is the mean dose and its uncertainty for all TLD
positions on each CR-39 doublet. Figure 13 shows the measured TLD doses for each of the
nine positions as a function of shielding depth measured from the bottom to the top of the
experiment stack. Figure 14 shows a similar plot of dose as a function of shielding measured
from the top of the stack to the bottom. Figure 15 shows the mean dose for each detector
layer as a function of shielding depth measured from top to bottom.
As can be seen in Figures 14 and 15, dose dropped rapidly as a function of shielding
between the first two layers, E33/E25 and E21/E24, from 248 + 3 to 197 + 2 mrad
within ,-,7 g/cm 2. Dose remained relatively constant between layers E21/E24 and E12/E05,
dropping from 197 4- 2 to 181 4- 2 mrad through _79 g/cm 2. The dose again fell off
rapidly between layers E12/E05 and E04/E01, dropping from 181 4- 2 to 142 + 1 mrad in
,_8 g/cm 2.
Measured doses in each of the nine TLD positions were relatively similar across a given
detector layer. Only TLD Position 5 differed significantly from this pattern. The initial
decrease in dose between layers E33/E25 and E21/E24 is not as great as that measured in
the other TLD locations and dose can be seen to rise between layers E21/E24 and E19/E20
at Position 5, while it remains relatively constant for the other locations. Between E19/E20
and E04/E01, dose at Position 5 falls off gently. The reason for this difference in dose as
a function of shielding between TLD Position 5 and the other eight TLD locations is most
likely due to a combination in differences in shielding and in the orientation of the spacecraft
during most of the mission. TLD Position 5 was on the right-most side of the detector
sheet as can be seen in Figure 1. Thus it was close to the vertical side of the experiment
24
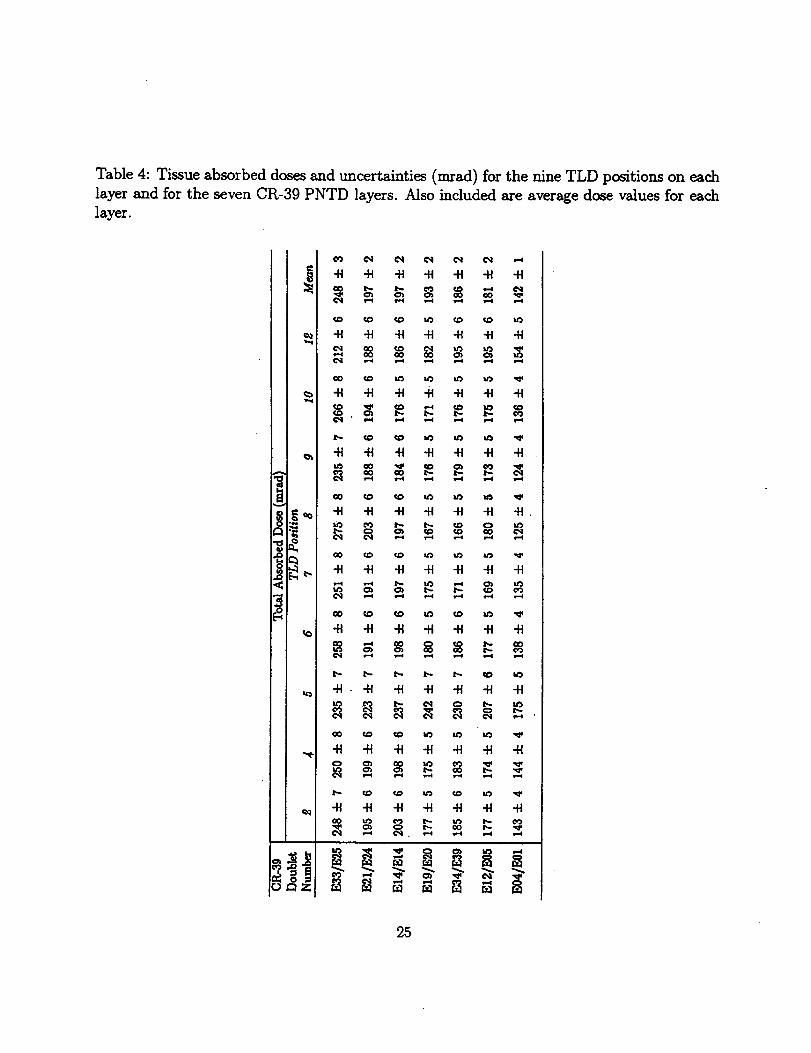
Table4: Tissueabsorbeddosesand uncertainties (mrad) for the nine TLD positions on each
layer and for the seven CR-39 PNTD layers. Also included are average dose values for each
layer.
25
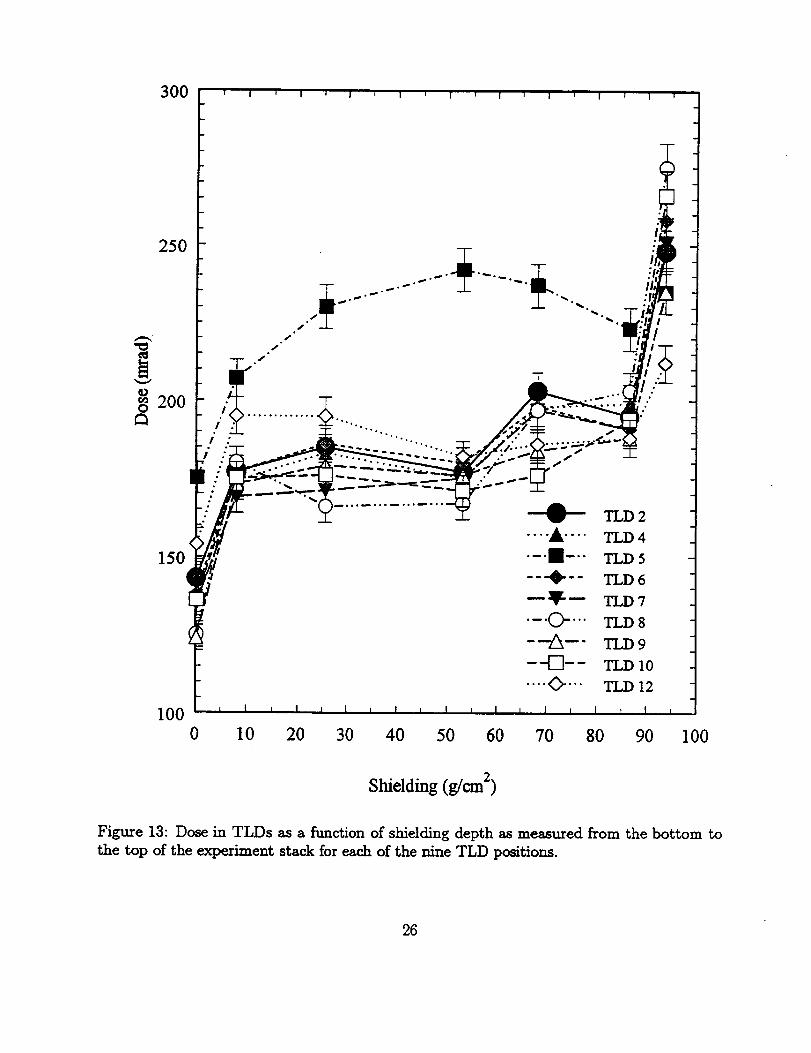
300
250
200O
150
F100
0
***,.°°°°°°°°
'17_292
TLD4
TLD5
TLD6
TLD7
TLD8
TLD9
TLD 10
TLD12
I _ I
80 90
Shielding (g/era z)
Figure 13: Dose in TLDs as a function of shielding depth as measured from the bottom to
the top of the experiment stack for each of the nine TLD positions.
26
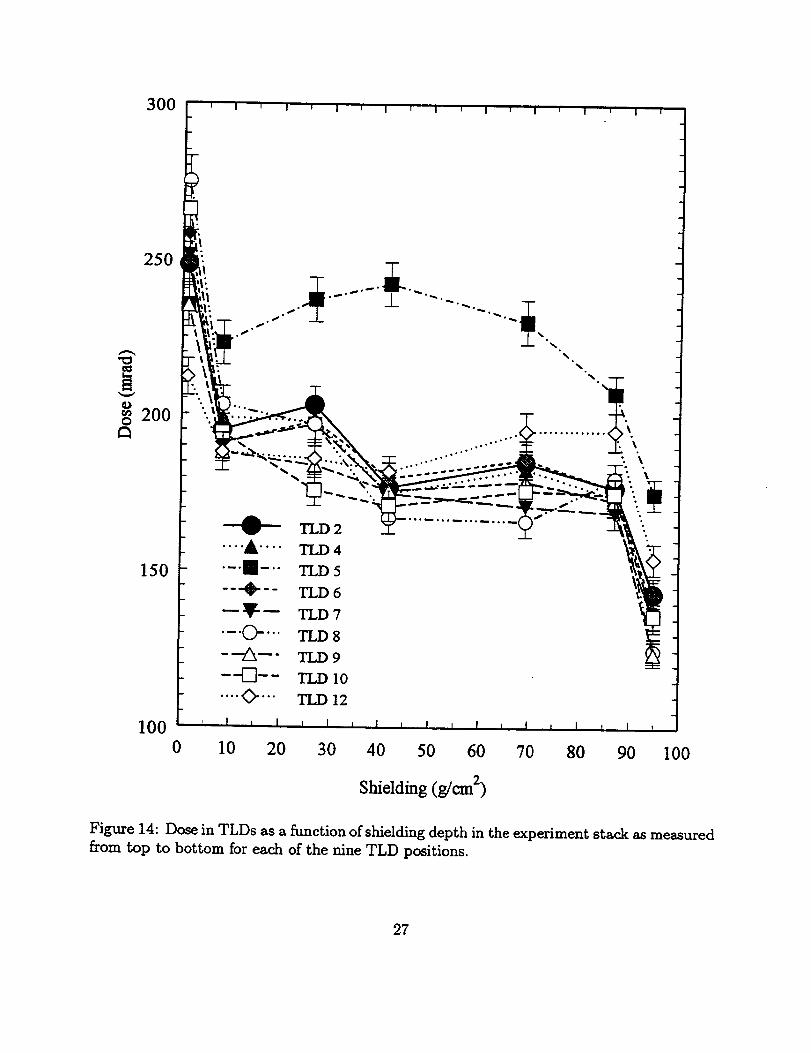
3O0
250
@
o 200
_" Z=-[ ..
150
100
0 10 20 30 40 50 60 70 80 90 100
Sh/eldmg (_ 2)
Figure 14: Dose in TLDs as a function of shielding depth in the experiment stack as measured
from top to bottom for each of the nine TLD positions.
27
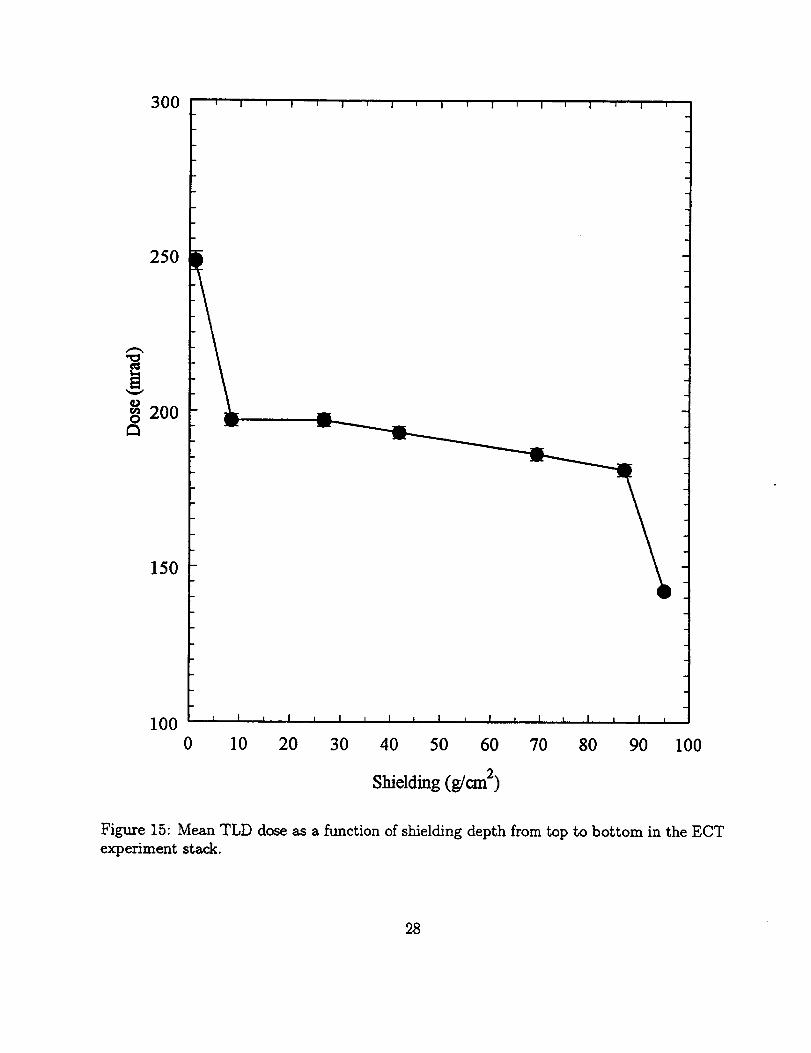
@
250
200
150
100 , i T I i i i i i I t I t I I I w I i
0 10 20 30 40 50 60 70 80 90 100
Shielding (g/era 2)
Figure 15: Mean TLD dose as a function of shielding depth from top to bottom in the ECTexperiment stack.
28
container. Given the higher doses at mid-level values of shielding in TLD 5 versus the other
locations, this location may be have been under the minimum of shielding from surrounding
experiments and from the orbiter itself. TLD Position 12 also shows an increase in dose
between layers E19/E20 and E12/E05, illustrating a similar minimum of vertical shielding.
It is also possible that TLD Position 5 was facing toward the West, the direction of
greatest trapped proton flux, while the spacecraft traversed the SAA, during the majority of
the mission, leading to a higher dose from trapped protons in this particular TLD position.
Since the spacecraft was oriented upside down with the open cargo bay facing the Earth, the
vertical sides of the experiment .were perpendicular to the Earth's surface during most of the
mission. Trapped protons, travelling in a helical motion around the lines of the geomagnetic
field tend to encounter the spacecraft parallel to the Earth's surface. Due to the East/West
trapped proton anisotropy, the greatest flux of trapped protons impinges on the spacecraft
from the West. STS-62 was an Earth observation mission and it is likely that the orientation
of the orbiter remained fixed relative to the Earth during much of the mission. This would
permit the East/West effect to be seen in the relative doses of TLDs positioned across the
detector surface and may explain the substantially larger doses seen in TLD position 5 and, to
a lesser degree, TLD position 12 as compared to doses measured in the other TLD positions.
5 Low Energy Neutron Fluences and Dose Equivalents
The thermal (<0.2 eV) and resonance (0.2 eV-1 MeV) neutron fluences and dose equivalents
were measured in the ECT assembly on STS-62 with Thermal/Resonance Neutron Detectors
(TRNDs). The TRNDs are composed of SLiF films between CR-39 PNTD layers. Each
detector contains a pair of SLiF/CR-39 sandwiches with one of the pair covered by Gd foil
(25 #m) thermal neutron absorbers. When irradiated with neutrons, the 6Li(n,a)T reaction
takes place and the CR-39 layers are irradiated in turn by lower energy c_-particles. In the
half of the detector covered by Gd, the thermal neutrons are eliminated from the reactions,
allowing a separation between thermal- and resonance-induced track densities on the CR-39.
By assuming energy spectra for the incident neutrons (a well-thermalized spectrum below
0.2 eV; a E_ 1 moderated spectrum between 0.2 eV and 1 MeV) calibrations in neutrons/track
29
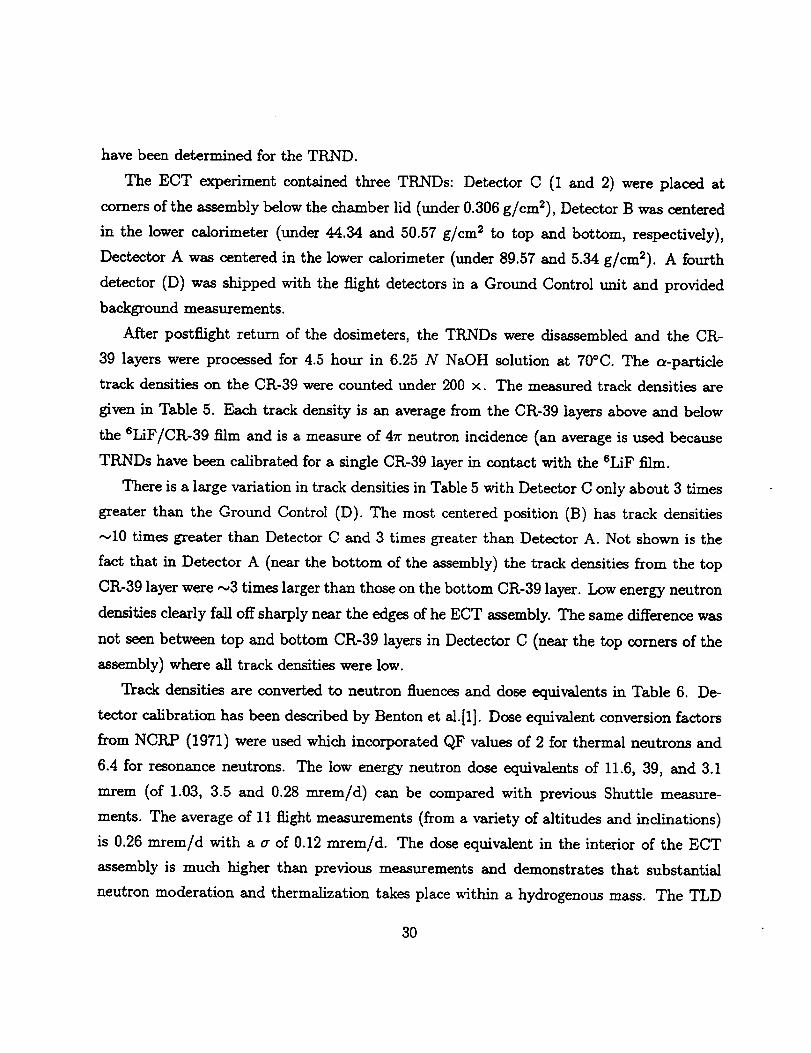
have been determined for the TRND.
The ECT experiment contained three TRNDs: Detector C (1 and 2) were placed at
comers of the assembly below the chamber lid (under 0.306 g/cm2), Detector B was centered
in the lower calorimeter (under 44.34 and 50.5? g/cm 2 to top and bottom, respectively),
Dectector A was centered in the lower calorimeter (under 89.57 and 5.34 g/cm2). A fourth
detector (D) was shipped with the flight detectors in a Ground Control unit and provided
background measurements.
After postflight return of the dosimeters, the TRNDs were disassembled and the CR-
39 layers were processed for 4.5 hour in 6.25 N NaOH solution at ?0°C. The s-particle
track densities on the CR-39 were counted under 200 ×. The measured track densities are
given in Table 5. Each track density is an average from the CR-39 layers above and below
the SLiF/CR-39 film and is a measure of 47r neutron incidence (an average is used because
TReNDs have been calibrated for a single CR-39 layer in contact with the eLiF film.
There is a large variation in track densities in Table 5 with Detector C only about 3 times
greater than the Ground Control (D). The most centered position (B) has track densities
--,10 times greater than Detector C and 3 times greater than Detector A. Not shown is the
fact that in Detector A (near the bottom of the assembly) the track densities from the top
CR,-39 layer were _3 times larger than those on the bottom CR-39 layer. Low energy neutron
densities elearly fall off sharply near the edges of he ECT assembly. The same difference was
not seen between top and bottom CR-39 layers in Dectector C (near the top comers of the
assembly) where all track densities were low.
Track densities are converted to neutron fluences and dose equivalents in Table 6. De-
tector calibration has been described by Benton et al.[1]. Dose equivalent conversion factors
from NCRP (1971) were used which incorporated QF values of 2 for thermal neutrons and
6.4 for resonance neutrons. The low energy neutron dose equivalents of 11.6, 39, and 3.1
mrem (of 1.03, 3.5 and 0.28 torero/d) can be compared with previous Shuttle measure-
ments. The average of 11 flight measurements (from a variety of altitudes and inclinations)
is 0.26 mrem/d with a er of 0.12 mrem/d. The dose equivalent in the interior of the ECT
assembly is much higher than previous measurements and demonstrates that substantial
neutron moderation and thermalization takes place within a hydrogenous mass. The TLD
30
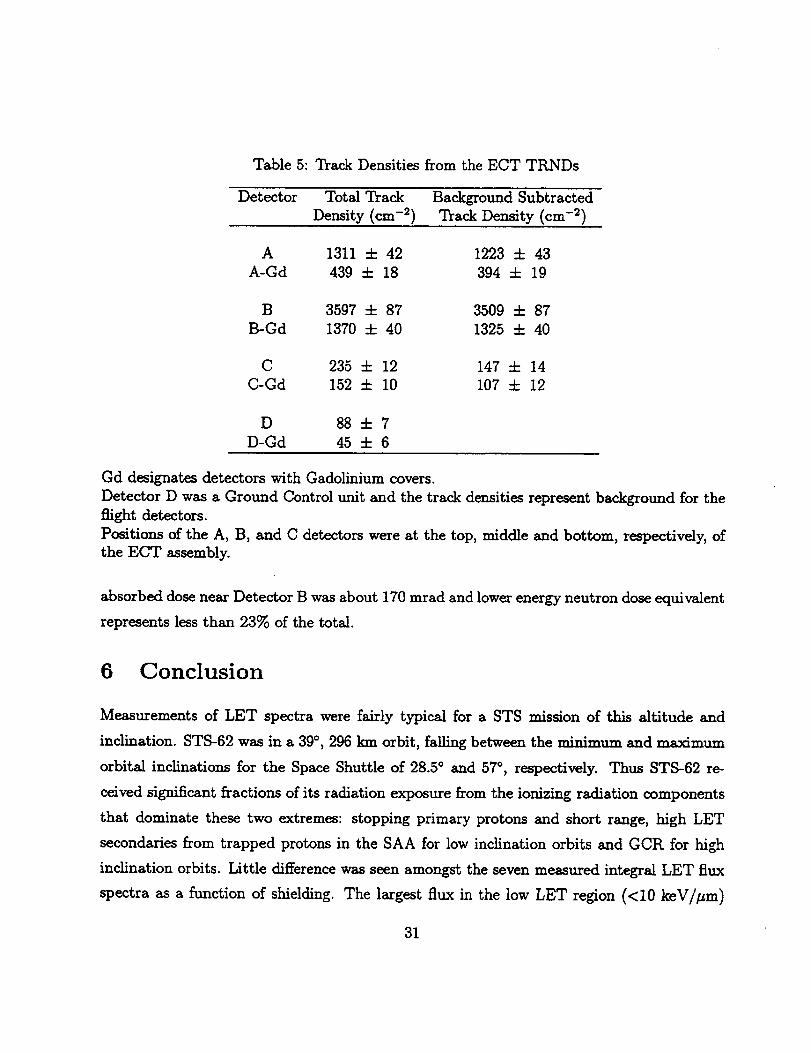
Table 5: Track Densities from the ECT TRNDs
Detector Total Track Background Subtracted
Density (cm -2) Track Density (cm -2)
A 1311 =5 42 1223 =5 43
A-Gd 439 4- 18 394 =5 19
B 3597 =5 87 3509 =5 87
B-Gd 1370 =5 40 1325 =5 40
C 235 =5 12 147 =5 14
C-Gd 152 ::1= 10 107 =5 12
D 88=5 7
D-Gd 45 =5 6
Gd designates detectors with Gadolinium covers.
Detector D was a Ground Control unit and the track densities represent background for the
flight detectors.
Positions of the A, B, and C detectors were at the top, middle and bottom, respectively, of
the ECT assembly.
absorbed dose near Detector B was about 170 mrad and lower energy neutron dose equivalent
represents less than 23% of the total.
6 Conclusion
Measurements of LET spectra were fairly typical for a STS mission of this altitude and
inclination. STS-62 was in a 39 °, 296 km orbit, falling between the minimum and maximum
orbital inclinations for the Space Shuttle of 28.5 ° and 57 °, respectively. Thus STS-62 re-
ceived significant fractions of its radiation exposure from the ionizing radiation components
that dominate these two extremes: stopping primary protons and short range, high LET
secondaries from trapped protons in the SAA for low inclination orbits and GCR for high
inclination orbits. Little difference was seen amongst the seven measured integral LET flux
spectra as a function of shielding. The largest flux in the low LET region (<10 keV//_m)
31
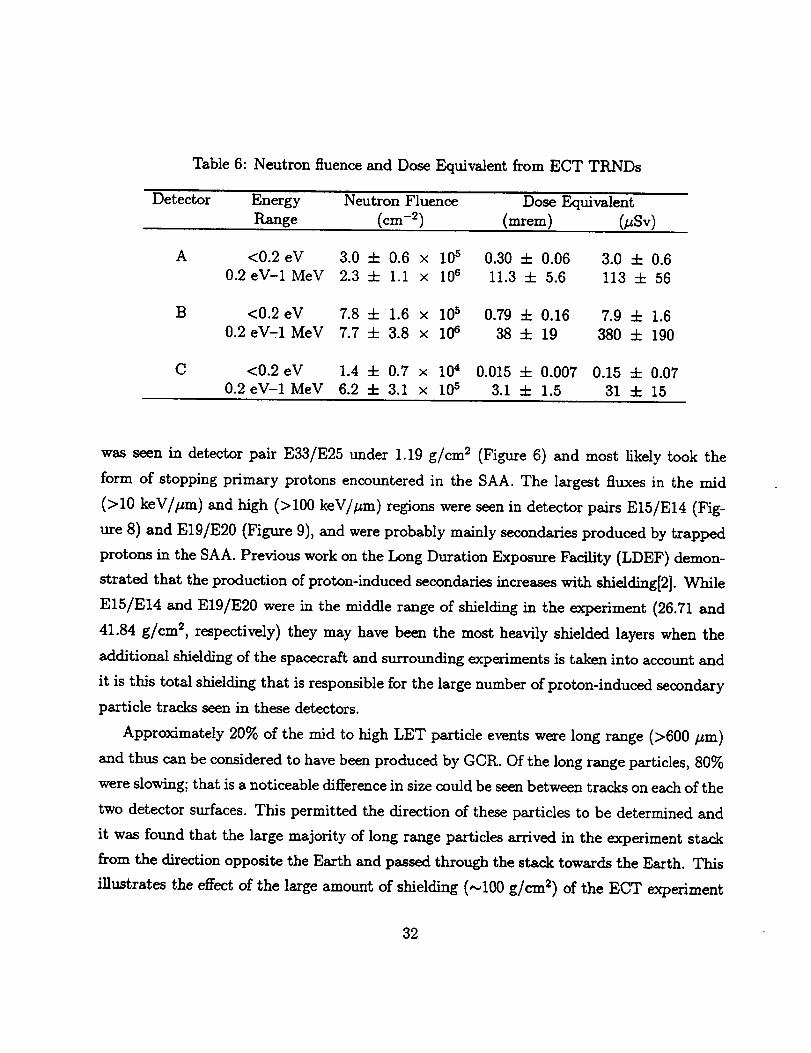
Table 6: Neutron fluenceand DoseEquivalent from ECT TRNDs
Detector Energy Neutron Fluence Dose Equivalent
Range (cm -2) (m_em) (_Sv)
A <0.2 eV 3.0 4- 0.6 x 10⁵ 0.30 4- 0.06 3.0 4- 0.6
0.2 eV-1 MeV 2.3 4- 1.1 x 10⁶ 11.3 4- 5.6 113 4. 56
B <0.2 eV 7.8 4. 1.6 x 10⁵ 0.79 :k 0.16 7.9 4- 1.6
0.2eV-1MeV 7.7 4. 3.8 x 10 e 38 =k 19 380 =k 190
C <0.2 eV 1.4 4- 0.7 x 10⁴ 0.015 4. 0.007 0.15 4- 0.07
0.2 eV-1 MeV 6.2 4- 3.1 × l0 s 3.1 -4- 1.5 31 4- 15
was seen in detector pair E33/E25 under 1.19 g/cm 2 (Figure 6) and most likely took the
form of stopping primary protons encountered in the SAA. The largest fluxes in the mid
(>10 keV//zm) and high (>100 keV/#m) regions were seen in detector pairs E15/E14 (Fig-
ure 8) and E19/E20 (Figure 9), and were probably mainly secondaries produced by trapped
protons in the SAA. Previous work on the Long Duration Exposure Facility (LDEF) demon-
strated that the production of proton-induced secondaries increases with shielding[2]. While
E15/E14 and E19/E20 were in the middle range of shielding in the experiment (26.71 and
41.84 g/cm 2, respectively) they may have been the most heavily shielded layers when the
additional shielding of the spacecraft and surrounding experiments is taken into account and
it is this total shielding that is responsible for the large number of proton-induced secondary
particle tracks seen in these detectors.
Approximately 20% of the mid to high LET particle events were long range (>600/zm)
and thus can be considered to have been produced by GCR. Of the long range particles, 80%
were slowing; that is a noticeable difference in size could be seen between tracks on each of the
two detector surfaces. This permitted the direction of these particles to be determined and
it was found that the large majority of long range particles arrived in the experiment stack
from the direction opposite the Earth and passed through the stack towards the Earth. This
illustrates the effect of the large amount of shielding (,_100 g/cm 2) of the ECT experiment
32
on GCR.
Total absorbed dose as measured by TLDs was seen to be attenuated by shielding in the
experiment stack. The least shielded layer (1.19 g/cm 2) had a mean dose of 248 -4- 3 mrad.
Dose decreased rapidly in the first _7 g/cm 2 of shielding and then plateaued at ,-,190 mrad
in the middle of the experiment stack. At the bottom of the stack, under the greatest
shielding of 94.91 g/cm 2, mean dose dropped to 142 -4- 1 mrad. Little difference in dose
could be seen for the nine TLD locations across a given detector layer, except for TLD
Position 5. This position measured a significantly higher dose in the middle levels of the
experiment stack and was on the left-most edge of the detector stack. This difference in
measured dose as a function of TLD position was probably due to a combination of shielding
and experiment orientation. Previous work on LDEF[3] demonstrated the differences in dose
across a spacecraft orbiting in a fixed orientation relative to the Earth due to the East/West
trapped proton anisotropy in the SAA. Since STS-62 was an Earth observation mission, it is
reasonable to assume that the orbiter remained in a fixed orientation for a significant portion
of the mission. It is possible that TLD Position 5 was oriented toward the West and under
comparatively low shielding, leading to a disproportionately large dose from trapped protons
at this position as compared to other TLD positions across the detector surface.
Thermal and resonance neutron dose equivalents were found to vary substantially with
shielding. In this case shielding can be considered a neutron thermalizing and moderating
medium, since in was largely hydrogenous in composition. A low energy dose equivalent of
3.5 mrem/d was measured in Detector B under 41.84 g/cm 2. This is substantially greater
than the 0.26 mrem/d mean dose equivalent measured on previous STS missions, demon-
strating the effect of the hydrogenous mass of the experiment in neutron moderation and
thermalization.
Since the ECT experiment was included on an Earth observation STS mission and thus
orbited upside down during most of the flight, the primary objectives of the experiment could
not be met. However, the fact that a large percentage (80%) of long range particle events
were found to be traversing the experiment from space towards the Earth and were seen to
be slowing down validates the general design of the experiment. LET spectra measurements
showed that a substantial fraction (80%) of mid to high LET particles took the form of short
33
range, high LET secondaries produced by trapped protons and indicates that this component
is significant in orbits of this inclination (39 °) as well as lower inclination orbits and must
be adequately taken into account during the data reduction and analysis process.
34
References
[1] E. V. Benton, 1%. P. Henke, A. L. Frank, C. S. Johnson, 1%. M. Cassou, M. T. Tran, and
E. Etter. Space radiation dosimetry aboard Cosmos 1129: U. S. portion of experiment
K-309. In M. A. Heinrich and K. A. Souza, editors, Final Reports of U. S. Plant and
Radiation Experiments Flown on the Soviet Satellite Cosmos 11_9, T. M. 81288. NASA,
Ames Research Center, 1981.
[2] E. 1%. Benton, I. Csige, E. V. Benton, and L. A. Frigo. Contribution of proton-induced
short range secondaries to the LET spectra on LDEF. In LDEF-69 Months in Space:
Third Post-Retrieval Symposium, NASA-CP 3275, pages 167-178, Washington DC, 1995.
[3] E. V. Benton, I. Csige, A. L. Frank, E. R. Benton, L. A. Frigo, T. A. Parnell, J. Watts,
and A. Harmon. Absorbed dose and LET spectra measurements on LDEF. In LDEF-
69 Months in Space: Third Post-Retrieval Symposium, NASA-CP 3275, pages 125--148,
Washington DC, 1995.
35
APPENDIX B
ECT Mechanical, Thermal, and Electrical
Systems Report
Orbital Sciences CorporationSpace & Electronics Systems GroupHuntsville Technical Support Center1525 Perimeter Parkway, Suite 200
Huntsville, ALabama 35806
Table of Contents
1.0 Summary ............................................................................................................ 1
2.0 Current Status .................................................................................................. 1
3.0 Assembly, Integration and Flight .................................................................. 2
3.1 Assembly for Flight ........................................................................... 2
3.1.1 Emulsion Chamber Assembly .............................................. 2
3.1.2 Electronics Unit Assembly .................................................... 3
3.2 Final Preparations for Shipment ................................................... 3
3.3 Integration for Flight ....................................................................... 4
3.4 The OAST-2 Mission ......................................................................... 4
3.5 De-integration .................................................................................... 4
4.0 Engineering Performance ................................................................................ 5
4.1 Thermal Performance ....................................................................... 5
•4.1.1 Bay-to-Sun Attitude ............................................................... 8
4.1.2 Tail-to-Earth Attitude ............................................................ 8
4.1.3 Bay-to Earth Attitude ............................................................ 8
4.1.4 Bay-to-Space Attitude ............................................................ 8
4.2 Mechanical Performance ................................................................ 15
4.2.1 Mechanical Interference ...................................................... 16
4.2.2 Mechanical Installation ....................................................... 16
4.2.3 Emulsion Chamber Internal Pressure .............................. 16
4.2.4 Epoxy Adhesive Bonding of Thermal Switches ............... 17
4.3 Electrical & Data Performance ..................................................... 17
4.3.1 Temp Mentor ......................................................................... 17
4.3.2 Electronics Unit .................................................................... 24
4.3.3 Ground Software ................................................................... 24
4.3,4 Data Products ............... . ........................................................ 24
5.0 Issues for Future Flights ............................................................................... 25
5.1 Limited Carrier Spacecraft Power ............................................... 25
5.2 Limited ECT On-board Power ...................................................... 25
5.3 Limited Memory .............................................................................. 25
5.4 Telemetry Data ................................................................................ 26
5.5 Electrical Connectors ...................................................................... 26
5.6 Mechanical Interfaces .................................................................... 26
6.0 MSFC Contacts ............................................................................................... 26
ii
1.0 Summary
This report documents the preparation and performance of the Emulsion Chamber
Technology Experiment (ECT) hardware and software for the OAST-2/STS-62 mission
aboard the Orbiter Columbia. Also discussed are lessons learned, current status and
issues for future flights of ECT.
ECT flew as one of several experiments comprising the OAST-2 payload on STS-62,
beginning with launch at KSC on 4 March 1994 and ending with touchdown at KSC on 18
March 1994. The ECT flight hardware was located on the upper surface of the
Hitchhiker-M bridge structure in the aft end of the payload bay, next to the portside
payload bay sill. The hardware was facing out of the payload bay in the +Z direction,
affording an acceptable view. The effective exposure time accrued was seventy-five (75)
hours. Columbia's flight performance was nominal and impacts on experiment operationswere minimal.
Excellent thermal control of the ECT Emulsion Chamber was maintained during flight
and no significant power interruptions occurred. Telemetry and recovered on-board data
confirm that the temperature of the Emulsion Chamber was controlled to 20 _+ 1 °C
throughout the entire flight. The flight hardware arrived back at MSFC after the OAST-
2/STS-62 mission in good condition. The emulsion stack showed no apparent thermal,mechanical, light or radiation damage and contained returned data. All stored electronicdata was recovered.
The mechanical interference problem identified during system-level integration and
testing at GSFC involving the pressure transducer and the adjacent mounting bolt was
eliminated by correct positioning of the pressure transducer during final assembly of the
Emulsion Chamber. No interference problems were encountered during pre-launch
integration at KSC. None of the thermal switches de-bonded during shipment, groundhandling or flight.
2.0 Current Status
The flight hardware, quality-sensitive spares and quality-sensitive ground support
equipment (GSE) are packed for storage in the ECT Shipping Container. All AA alkaline
cells have been removed from the Electronics Unit and the Temp Mentor. Quality
Assurance documentation and the Hardware Activity Log are packed with the hardware.
Quality Assurance coverage has been maintained by NASA since hardware delivery and
acceptance. MSFC Quality Assurance personnel have indicated that QA coverage will be
continuous and that ECT will be ready for re-flight provided that all quality-sensitive
items are placed in appropriate storage at MSFC. As of the time of this report, the flight
hardware, quality-sensitive spares, quality-sensitive GSE and non-quality-sensitive itemshave been placed in bonded storage at MSFC.
Emulsion stack materials, including the lead sheets and processed plates, are in the
custody of the Cosmic Ray Emulsion Laboratory (MSFC/ES62). Development hardware
and other non-quality-sensitive or non-flight items are currently stored at UAH Materials
Science Building. Post flight data products provided by NASA will also be found at UAHMaterials Science Building.
3.0 Assembly, Integration and Flight
3.1 Assembly for Flight
Previous reports have described the system-level integration and testing at GSFC. The
Temp Mentor's RS-232 power loop-back feature caused the Temp Mentor on-board power
depletion while at GSFC. Thus, no temperature record for the period 10/26/93 through
11/23/93 exists. A mechanical interference problem was identified involving the pressure
transducer and the adjacent mounting bolt. The bolt was omitted for GSFC testing. The
ECT hardware was de-integrated and shipped back to MSFC from GSFC after completion
of the required integration and testing activities, arriving on 11/23/93. The test emulsion
stack arrived with no apparent damage. The ECT hardware also arrived in excellent
condition. The materials for the flight emulsion stack had been made ready by this timeat the Cosmic Ray Emulsion Laboratory (MSFC/ES62).
3.1.1 Emulsion Chamber Assembly
The Emulsion Chamber was cleaned thoroughly before final assembly for flight. The
loading of the flight emulsion stack went extremely well once again. The assembly of the
Emulsion Chamber with emulsion stack has now been sucessfully completed three times,
once with the development hardware and twice with the flight hardware. The use of
alignment fixtures during assembly was abandoned early on and the standard procedure
is to assemble the Bottom Plate and Lower Chamber before loading. The Emulsion
Chamber assembly procedure is included in Appendix A. The flight emulsion stack
configuration record was provided by the Cosmic Ray Emulsion Laboratory (MSFC/ES62)and is included in Appendix B.
The pressure transducer was rotated to the extreme counter-clockwise or (nearly) vertical
position when installed on the Emulsion Chamber, in order to alleviate the interference
problem involving the pressure transducer and the adjacent mounting bolt. As a result,
no mechanical interference was encountered during integration of the ECT flight
hardware at KSC. This step of the Emulsion Chamber assembly must be performed with
2
the ECT Flight Wiring Harness connected to the Emulsion Chamber in order to ensureproper positioning of the pressure transducer while preventing interference with theadjacent feedthrough connector.
The O-rings used in the assembly of the Emulsion Chamber were coated with a minimumamount of vacuum grease. Leak testing followed assembly, with Helium detection andpressure decay tests. In keeping with the ECT mission approach, no extraordinarymethods were used. It was noted during testing that considerable amounts of Helium hadbeen absorbed by the stack materials, evidenced by unexpected pressure increases duringpressure decay tests. The Emulsion Chamber was left pressurized with air toapproximately 30 psia for shipment to KSC.
3.1.2 Electronics Unit Assembly
The Electronics Unit was cleaned thoroughly before final assembly for flight. Fresh AAalkaline cells were installed in the Electronics Unit and the Temp Mentor. A flight-qualified PROM hosting the 7/93 version of the ECT flight software was installed in theElectronics Unit. This version of the flight software was verified by over 150 hours of testoperation before installation in the Electronics Unit.
The power loop-back feature was disabled on the Temp Mentor's RS-232 port and instead
built into the Electronics Unit's RS-232 port, feedthrough connector J7. Power is now
conserved because GSE cables are connected to the Electronics Unit's RS-232 port for onlya relatively short time, during ground operations.
3.2 Final Preparations for Shipment
Two bimetallic thermal switches were re-bonded to the Emulsion Chamber with flight
epoxy. Flight velcro was installed on both assemblies, lockwires were installed, lockwire
ends were encapsulated with flight epoxy, and touch-ups were made on heater wire
insulation and silverized Teflon tape. After some assurances were given by GSFC
concerning ferry temperature control, the decision was made to omit the Solimide TA-301
polyimide foam insulation, due to its tendency to shed particulates. It is likely that a
method could be developed using adhesive tape or a hot surface to seal the surfaces and
make the foam acceptable for flight. The concerns raised last summer by GSFC's QAcontractor and others were addressed with these actions.
All exposed connectors on the Emulsion Chamber and Electronics Unit were covered with
Teflon dust covers before shipment. The Temp Mentor was deployed and the ECT
Shipping Container was sealed for shipment on 12/29/93. Shipment to KSC occurred on1/3/94.
3.3 Integration for Flight
The ECT team arrived at KSC on 1/4/94. OAST-2 integration and testing activities took
place in Hangar AM. The hardware was unpacked, checked out and installed on the
Small Top Pallet. The Emulsion Chamber was vented to atmosphere. The Temp Mentor
data was recovered and the Temp Mentor was deployed for flight. The Small Top Pallet
with the ECT flight hardware was then installed on the HH-M structure. Power and data
cables were integrated, followed by installation of the MLI and ground wires. The
Emulsion Chamber was again vented to atmosphere just before the MLI was closed.
GSFC provided some grounding lugs, lockwires and cable ties, cleaning of the radiator
surfaces and some stitching on the MLI. Integration and testing activities were completedon 1/6/94. OAST-2 was integrated with the Orbiter Columbia some weeks later.
3.4 The OAST-2 Mission
ECT flew as one of several experiments comprising the OAST-2 payload on STS-62,
beginning with launch at KSC on 4 March 1994 and ending with touchdown at KSC on 18
March 1994. The ECT flight hardware was located on the upper surface of the
Hitchhiker-M bridge structure in the aft end of the payload bay, next to the portside
payload bay sill. The hardware was facing out of the payload bay in the +Z direction,
affording an acceptable view. The effective exposure time accrued was seventy-five (75)
hours. Columbia's flight performance was nominal and impacts on experiment operationswere minimal.
The ECT team staffed the GSFC Payload Operations Control Center (POCC) around the
clock during the OAST-2/STS-62 flight. Training sessions and mission simulations werealso supported in the weeks prior to the mission.
3.5 De-integration
The ECT flight hardware was de-integrated from OAST-2 and packed for shipment to
MSFC on 5 April 1994 at KSC. The ECT Shipping Container, along with spares and
materials arrived at MSFC early on 6 April 1994. Disassembly, processing of emulsion
stack materials and packing for storage followed. The Hardware Activity Log is includedin Appendix C.
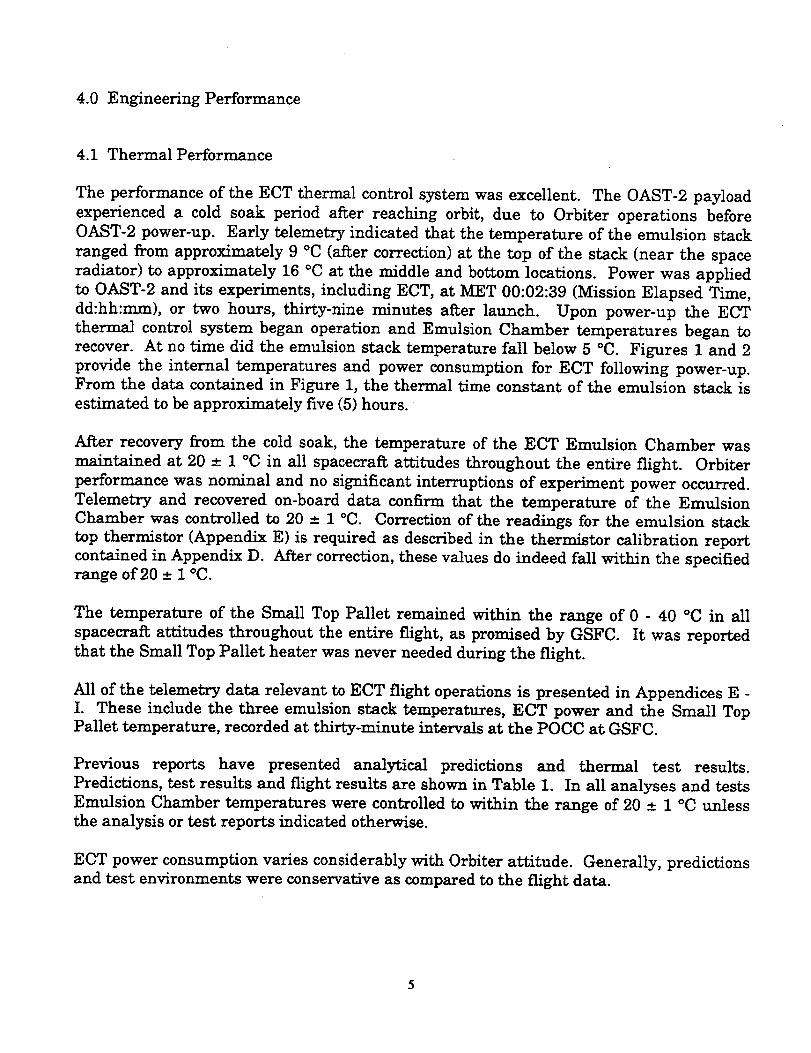
4.0 Engineering Performance
4.1 Thermal Performance
The performance of the ECT thermal control system was excellent. The OAST-2 payload
experienced a cold soak period after reaching orbit, due to Orbiter operations before
OAST-2 power-up. Early telemetry indicated that the temperature of the emulsion stack
ranged from approximately 9 °C (after correction) at the top of the stack (near the space
radiator) to approximately 16 °C at the middle and bottom locations. Power was applied
to OAST-2 and its experiments, including ECT, at MET 00:02:39 (Mission Elapsed Time,
dd:hh:mm), or two hours, thirty-nine minutes after launch. Upon power-up the ECT
thermal control system began operation and Emulsion Chamber temperatures began to
recover. At no time did the emulsion stack temperature fall below 5 °C. Figures 1 and 2
provide the internal temperatures and power consumption for ECT following power-up.
From the data contained in Figure 1, the thermal time constant of the emulsion stack is
estimated to be approximately five (5) hours.
After recovery from the cold soak, the temperature of the ECT Emulsion Chamber was
maintained at 20 _+ 1 °C in all spacecraft attitudes throughout the entire flight. Orbiter
performance was nominal and no significant interruptions of experiment power occurred.
Telemetry and recovered on-board data confirm that the temperature of the Emulsion
Chamber was controlled to 20 __. 1 °C. Correction of the readings for the emulsion stack
top thermistor (Appendix E) is required as described in the thermistor calibration report
contained in Appendix D. After correction, these values do indeed fall within the specifiedrange of 20 ± 1 °C.
The temperature of the Small Top Pallet remained within the range of 0 - 40 °C in all
spacecraft attitudes throughout the entire flight, as promised by GSFC. It was reported
that the Small Top Pallet heater was never needed during the flight.
All of the telemetry data relevant to ECT flight operations is presented in Appendices E -
I. These include the three emulsion stack temperatures, ECT power and the Small TopPallet temperature, recorded at thirty-minute intervals at the POCC at GSFC.
Previous reports have presented analytical predictions and thermal test results.
Predictions, test results and flight results are shown in Table 1. In all analyses and tests
Emulsion Chamber temperatures were controlled to within the range of 20 ± 1 °C unless
the analysis or test reports indicated otherwise.
ECT power consumption varies considerably with Orbiter attitude. Generally, predictions
and test environments were conservative as compared to the flight data.
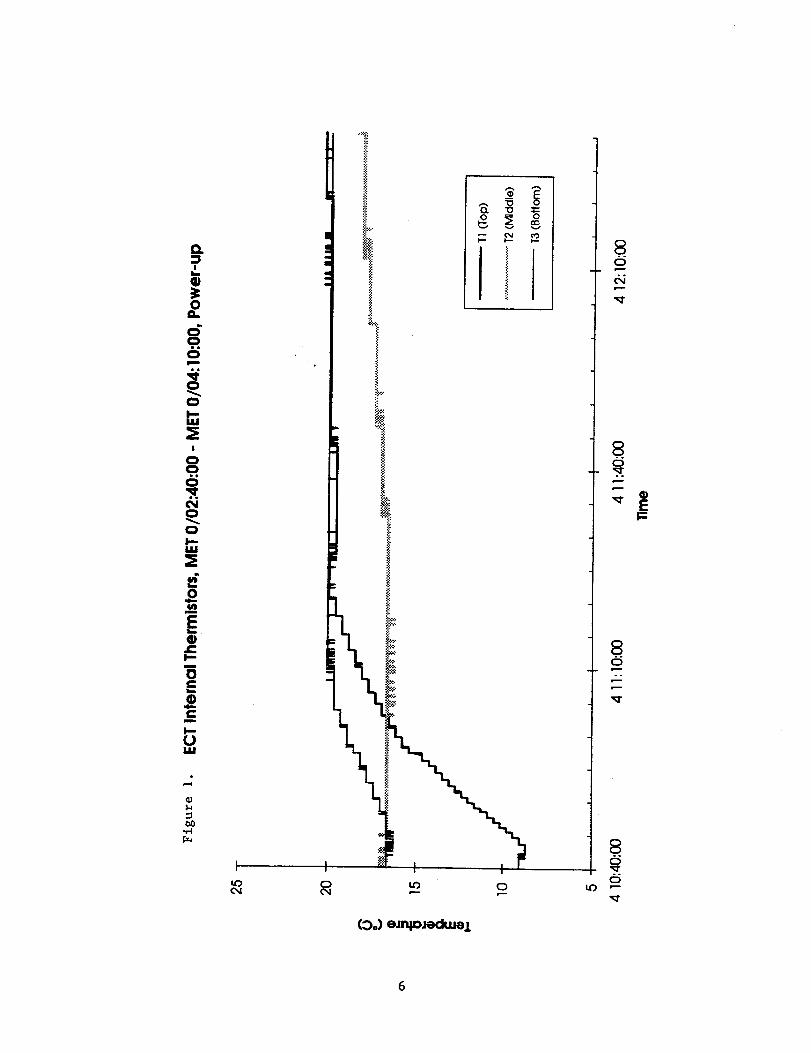
c_0
0
0In
I
00
0I.--
mm
@Inm
Ct-
Ot"
mm
I-.U
_\
Io
i
0
8
(=)o) eJnlDJeCkuel
L,_ ,--
8
k--
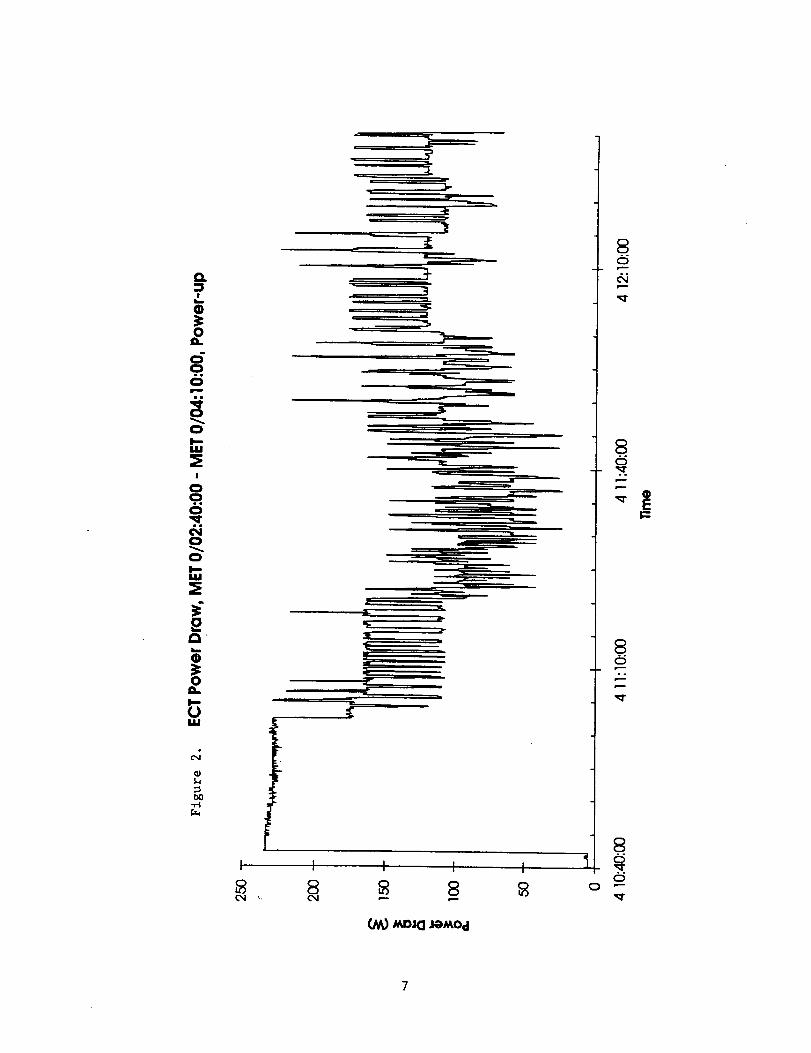
o
MJ
!
o9.0
0
0
IJ,I
.e
0
0a.
(aluul
b8-,-4
I
8
_ 4.
17,-
• m
. ÷
.i
L!
m
=1-
z3,-
if r"w
1
a-
t
I I I
8 8 8
8
8
8
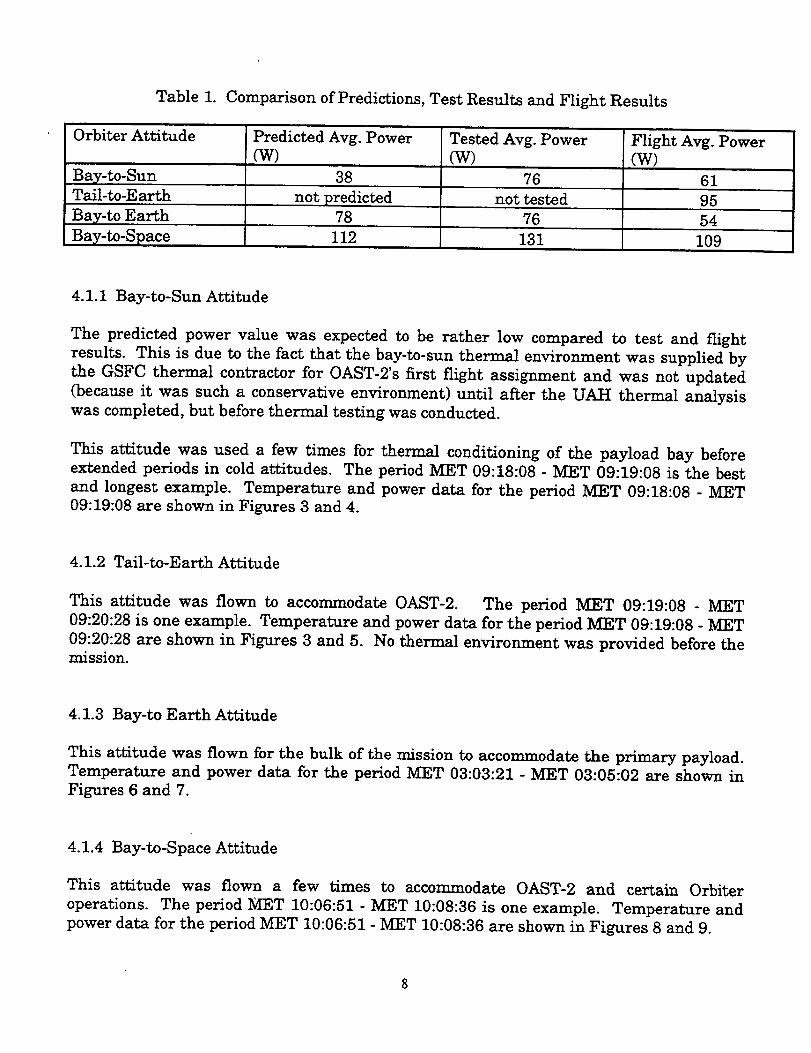
Table 1. Comparison of Predictions, Test Results and Flight Results
Orbiter Attitude Predicted Avg. Power Tested Avg. Power Flight Avg. Power
(W) (W) (W)Bay-to-Sun 38 76 61
Tail-to-Earth not tested 95
Bay-to Earth
Bay-to-Space
not predicted
78
11276 54
131 109
4.1.1 Bay-to-Sun Attitude
The predicted power value was expected to be rather low compared to test and flight
results. This is due to the fact that the bay-to-sun thermal environment was supplied by
the GSFC thermal contractor for OAST-2's first flight assignment and was not updated
(because it was such a conservative environment) until after the UAH thermal analysis
was completed, but before thermal testing was conducted.
This attitude was used a few times for thermal conditioning of the payload bay before
extended periods in cold attitudes. The period MET 09:18:08 - MET 09:19:08 is the best
and longest example. Temperature and power data for the period MET 09:18:08 - MET
09:19:08 are shown in Figures 3 and 4.
4.1.2 Tail-to-Earth Attitude
This attitude was flown to accommodate OAST-2. The period MET 09:19:08 - MET
09:20:28 is one example. Temperature and power data for the period MET 09:19:08 - MET
09:20:28 are shown in Figures 3 and 5. No thermal environment was provided before themission.
4.1.3 Bay-to Earth Attitude
This attitude was flown for the bulk of the mission to accommodate the primary payload.Temperature and power data for the period MET 03:03:21 - MET 03:05:02 are shown in
Figures 6 and 7.
4.1.4 Bay-to-Space Attitude
This aWitude was flown a few times to accommodate OAST-2 and certain Orbiter
operations. The period MET 10:06:51 - MET 10:08:36 is one example. Temperature and
power data for the period MET 10:06:51 - MET 10:08:36 are shown in Figures 8 and 9.
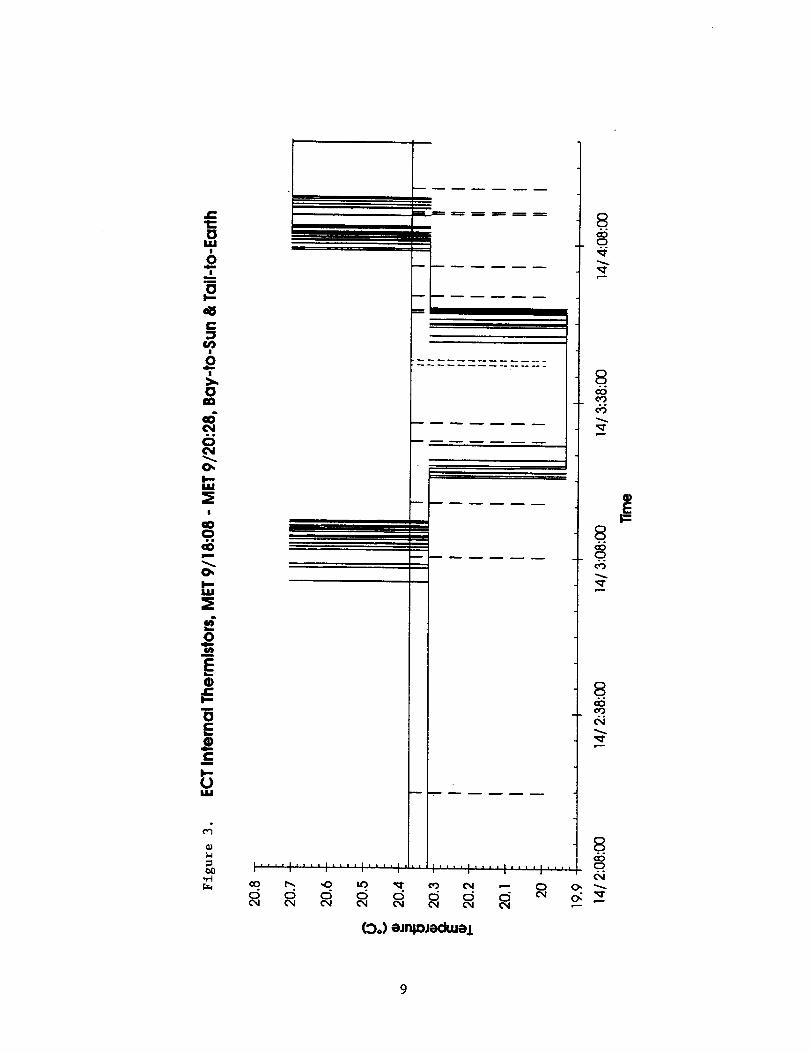
o.,_
o
|
c_
!1'''" I ill, _ |l|, I '°° Ill
o (5 <5 c_ <5
I .... I .... I .... l'"
d d o c_
(_o) emmJ_lwe.l.
+
_r
8.o
co
.o
, .o.
9
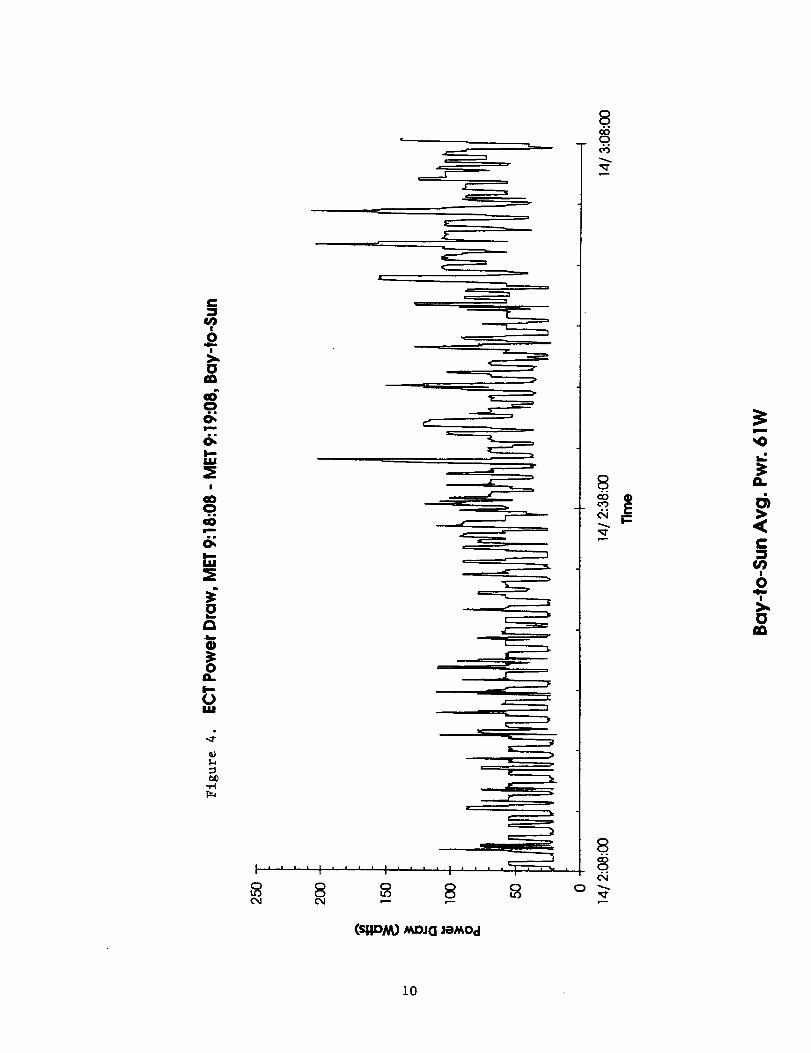
S
.£
im
o.i
=,8
LI,II
!
0!
tO
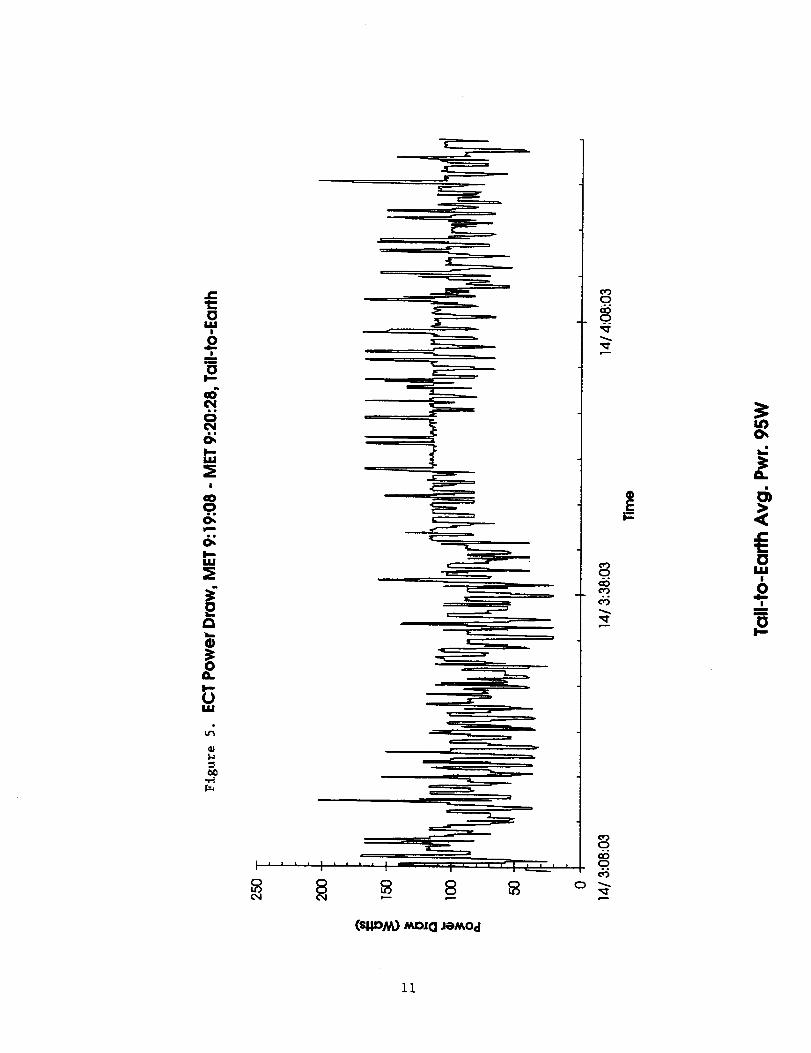
c_
8
IE
(:30o
0o°
0
11
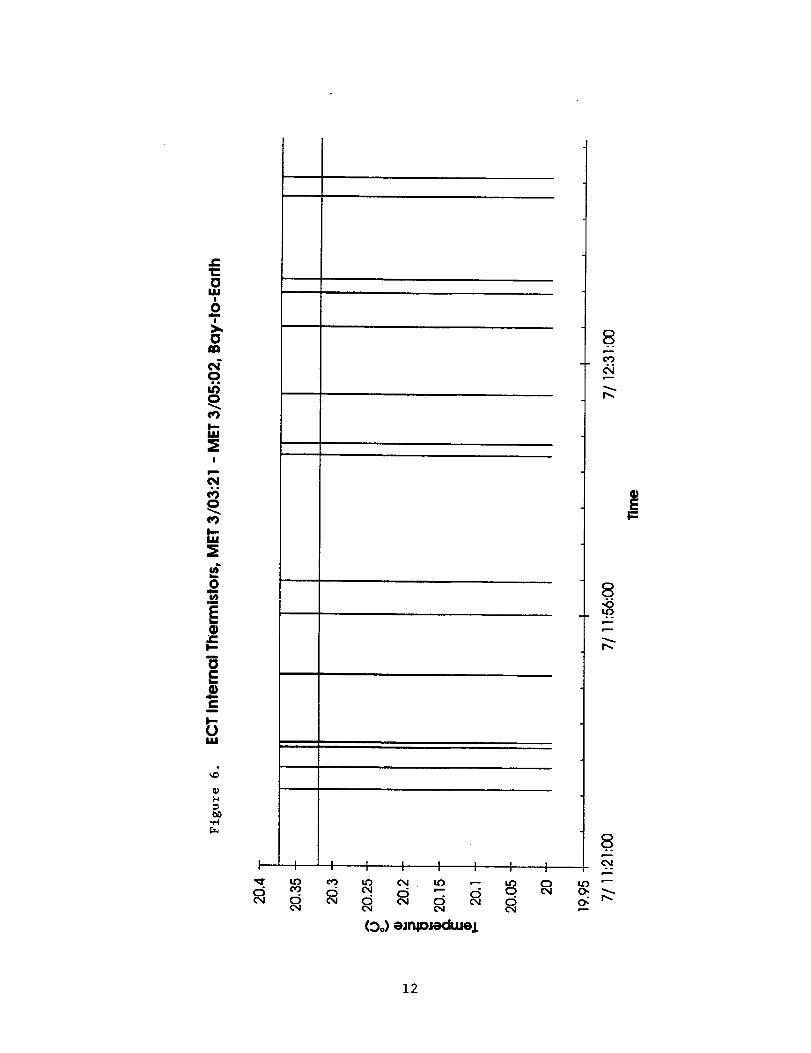
!
.£
0
I,,-..D
CImm
e.-m
I-.0I.IM
0d
12
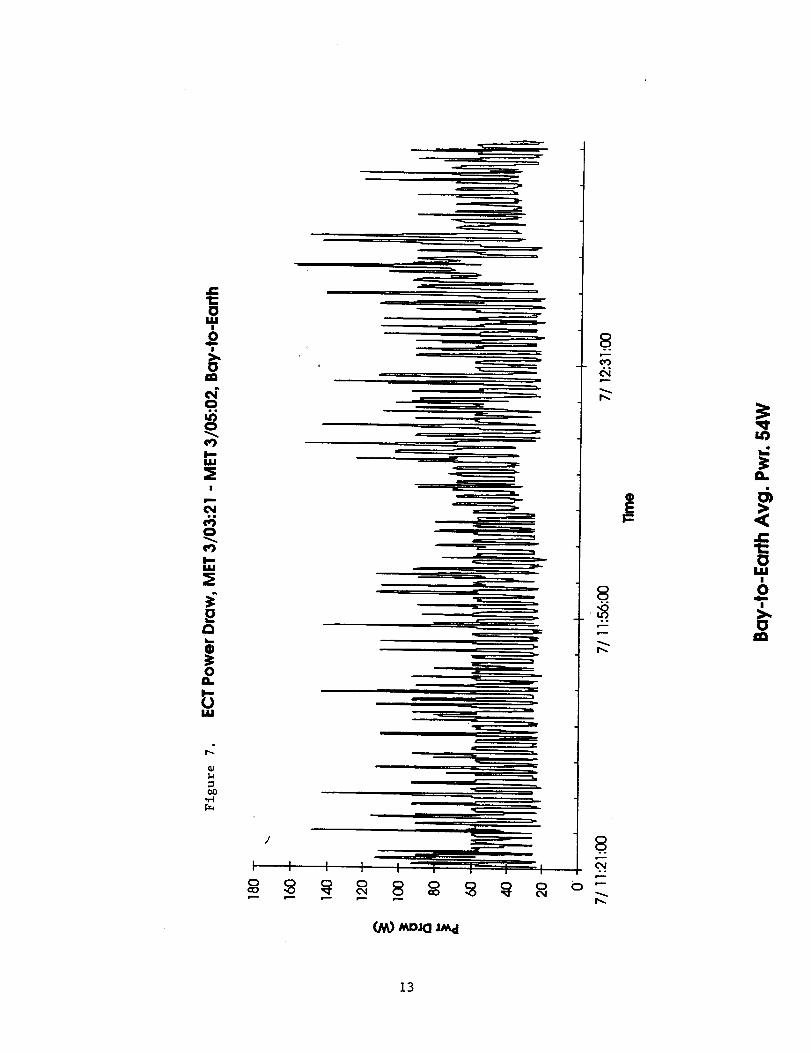
• T
m
II
r "-I
r_
lUll
•11
I I I I0
8 0
go.
o°
0 "-"
0ul
|
! °°° |
13
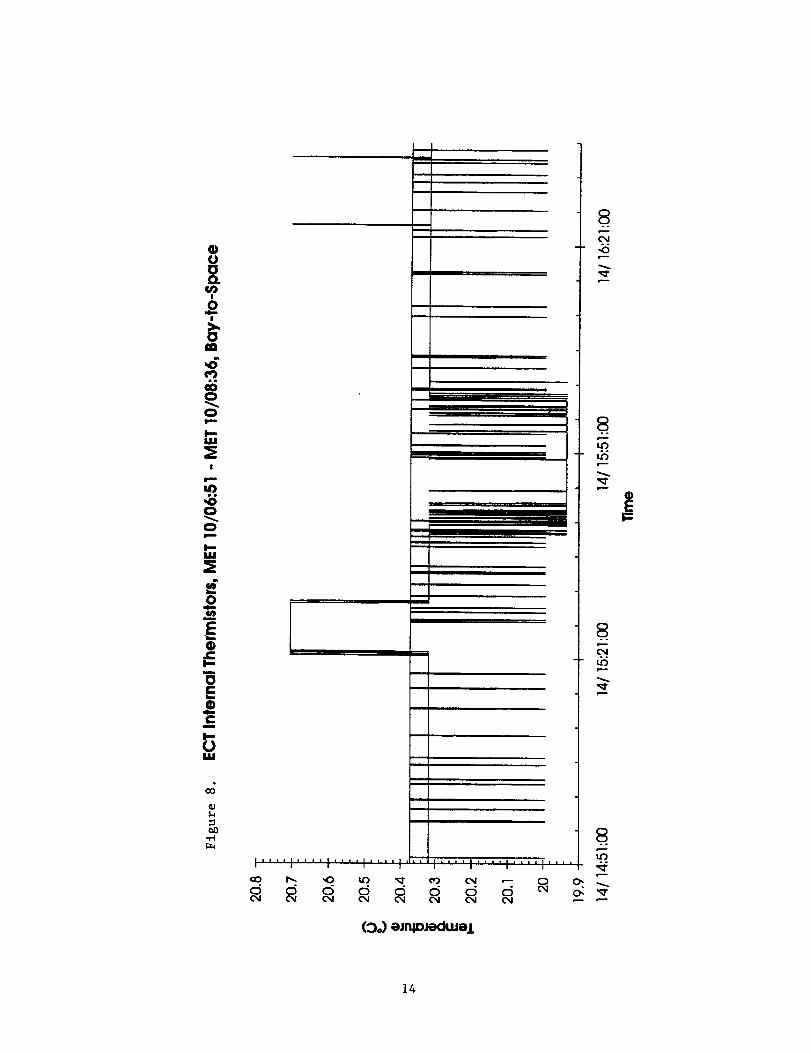
m
@r=
m
L_
t=u
I===
UI,M
P_
I
I
m
, I
{0_ @Jl'_.ledl.l.lel
8°°
r===
14
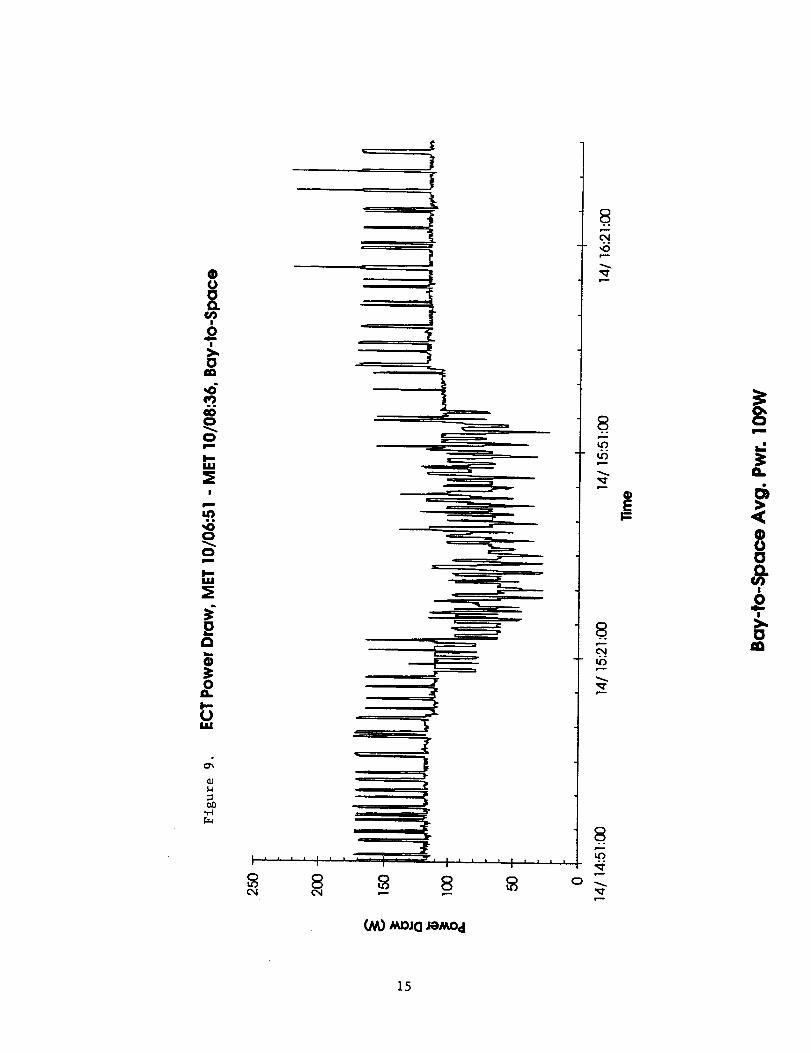
-----
..o , {'Jr' T
8 8 8 8 8
!
8.°
14').°
(A_ A_,DJG_MOd
15
4.2 Mechanical Performance
The ECT flight hardware and GSE mechanical performance was nominal. No damage or
unusual wear was noted and all flight parts, including fasteners, were recovered after de-
integration and disassembly. No mechanical spares were required for the OAST-2/STS-62
mission. No mechanical damage to the flight emulsion stack or evidence of light leakagehas been reported to date.
4.2.1 Mechanical Interference
A mechanical interference problem was identified during GSFC integration and testing
involving the pressure transducer and the adjacent mounting bolt. Gerard Durback
(GSFC) elected to omit the mounting bolt during GSFC integration and testing. Upon
final assembly, the pressure transducer was rotated to the extreme counter-clockwise or
(nearly) vertical position when installed on the Emulsion Chamber, in order to alleviate
this interference problem. No mechanical interference was encountered during
integration of the ECT flight hardware at KSC and all mounting hardware was installedfor flight.
4.2.2 Mechanical Installation
Installation of the Emulsion Chamber onto the Small Top Pallet for flight was performed
by GSFC personnel with assistance from the ECT team and mounting hardware torques
and gaps were set according to the procedure agreed to by Gerard Durback (GSFC) and
Dr. Fran Wessling (UAH). All thermal insulation hardware was installed. During
installation it was determined that some mounting hardware gaps were present on the
upper side of the Emulsion Chamber mounting flange and some were present on the lower
side. Gerard Durback (GSFC) elected to employ shims in either or both positions such
that the total of the two gaps would be within specification. Gerard Durback (GSFC) also
elected to omit all shims on the Electronics Unit mounting hardware. Final mounting bolt
torque values were 160 - 170 inch-pounds for both the Emulsion Chamber and the
Electronics Unit. The GSFC installation procedure is included in Appendix J.
4.2.3 Emulsion Chamber Internal Pressure
As shown in Figure 10, the Emulsion Chamber maintained a steady internal pressure
after some initial transients. In keeping with the ECT mission approach, no
extraordinary methods were used in the fabrication or assembly of the Emulsion Chamber
to ensure that internal pressure is maintained during orbital flight. The O-rings used in
the assembly of the Emulsion Chamber were coated with a minimum amount of vacuum
grease. Leak testing followed assembly, with Helium detection and pressure decay tests.
It was noted during testing that considerable amounts of Helium had been absorbed by
15
the stack materials, evidenced by unexpected pressure increases during pressure decay
tests. The Emulsion Chamber was lei_ pressurized with air to approximately 30 psia forshipment to KSC.
4.2.4 Epoxy Adhesive Bonding of Thermal Switches
An effective procedure for bonding thermal switches to the flight hardware with epoxy
adhesive was developed. The ECT epoxy adhesive bonding procedure is included in
Appendix K. Surface preparation and cleanliness were found to be of the utmost
importance. Extra washing of the bonding site with acetone seemed to be helpful and was
usually included aider the last cleaning step. Our recommendation for any future use of
thermal switches is that the stud-mounted variety be employed if possible, preventing theneed for bonding the parts.
4.3 Electrical & Data Performance
The Electronics Unit system operated nominally. Thermal control of the flight hardware
was uninterrupted. The AA alkaline cells for the Electronics Unit on-board memory back-up power performed nominally and the stored record from the Electronics Unit on-board
memory was recovered intact, if incomplete (refer to Section 4.3.2), aider the flighthardware was returned to MSFC. See Figures 10 - 13.
Temp Mentor operation was nominal. The Temp Mentor on-board memory was more than
adequate, the AA alkaline cells performed nominally and the stored record from the Temp
Mentor on-board memory was recovered intact aider the flight hardware was returned toMSFC. See Figures 14 and 15.
4.3.1 Temp Mentor
The Temp Mentor RS-232 port power loop-back feature energizes the Temp Mentor RS-
232 interface whenever the Temp Mentor interface cable is plugged into the Temp Mentor
RS-232 port, as it is when carried aboard the Electronics Unit. (This was the cause of the
Temp Mentor power depletion while at GSFC. Thus, no temperature record for the period
10/26/93 through 11/23/93 exists.) This power loop-back was disabled on the Temp
Mentor's RS-232 port and instead built into the Electronics Unit's RS-232 pert,
feedthrough connector J7, before delivery to KSC. Temp Mentor power is now conserved
because GSE cables are connected to the Electronics Unit's RS-232 port, feedthrough
connector J7, for only a relatively short time, during ground operations.
If a different Temp Mentor unit is intended for flight aboard the Electronics Unit in
subsequent missions the same RS-232 port power loop-back must be disabled on that
Temp Mentor's RS-232 port.
17
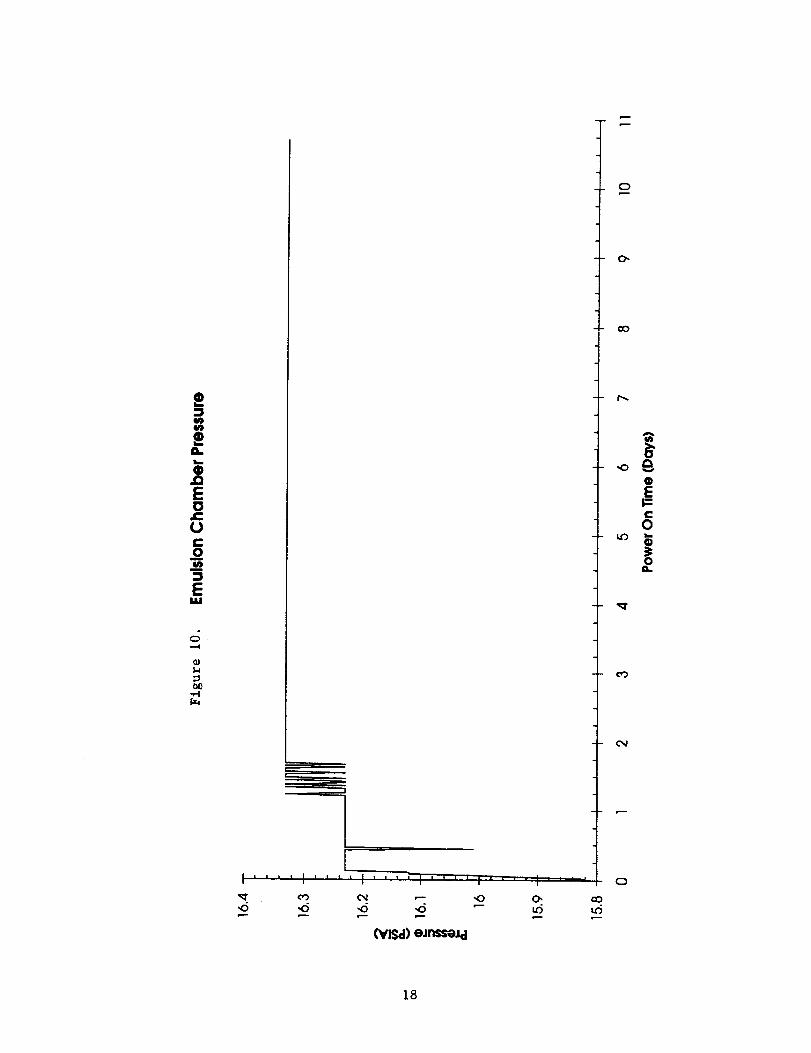
2
2IL
Eo
i::I,U
_o
18
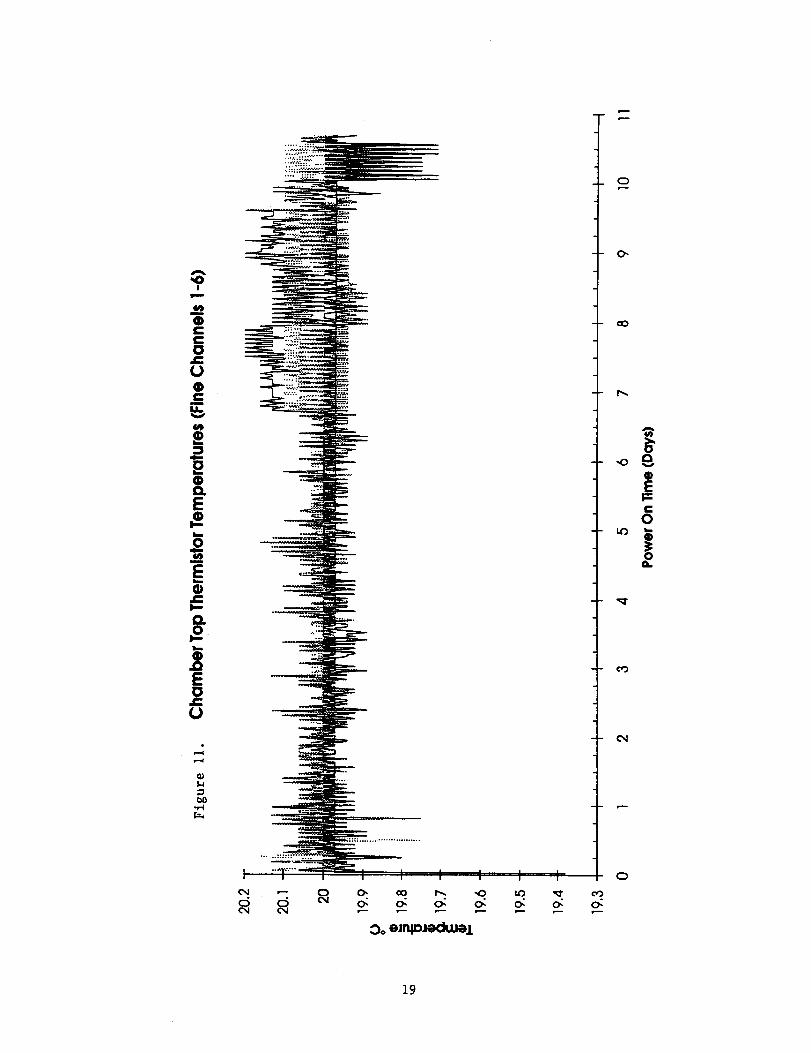
A
V
o
0Je"
Q.
E0.c¢0
¢D
0L
c_
19
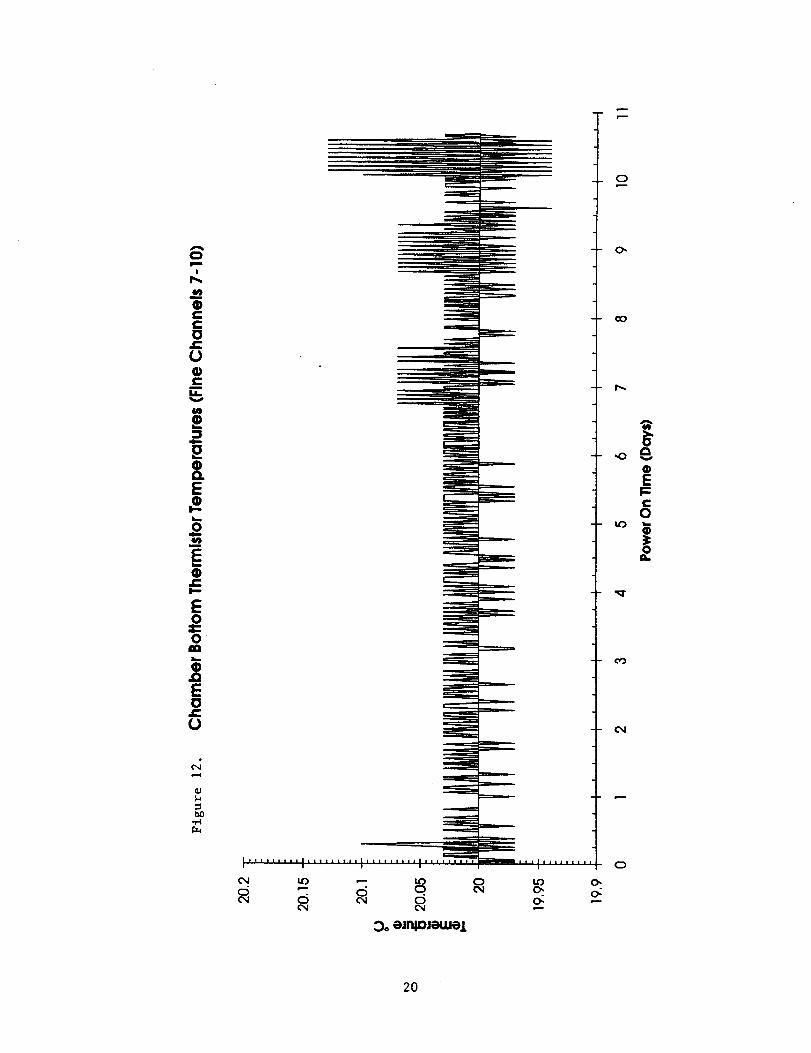
o
E0
U
0
O-
r_
2O
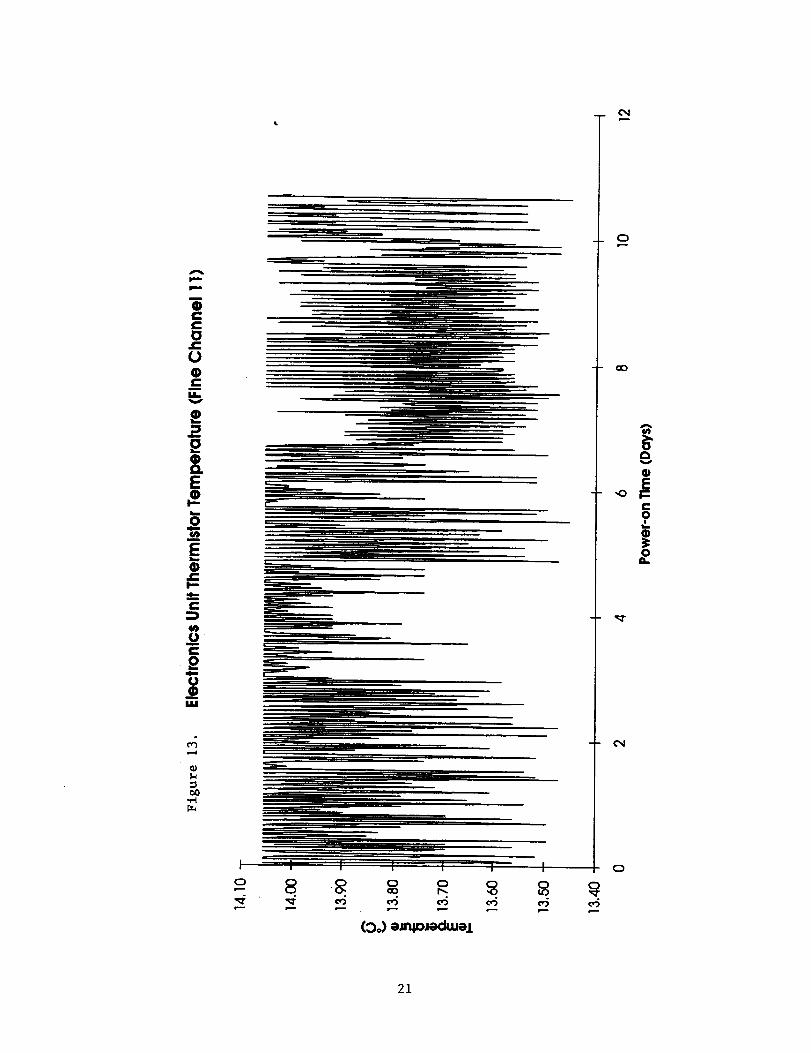
iEI--
.m-
41oU "--IIi
I.I,I
I I I l I
o 8 ._ o oI
r--
ao
B
E
o
c%J
0
21
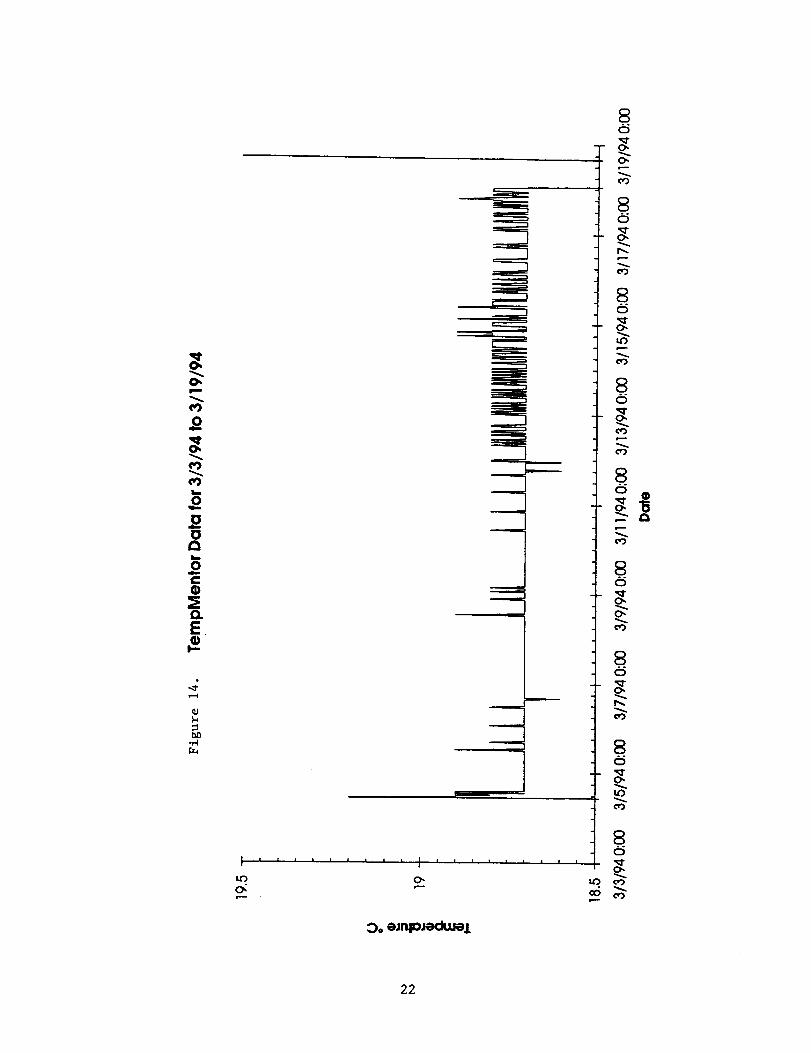
o
E+
_3
',,P-I
III111,Iiiiiiiiiiii
Oo eJ_p0JmK_ue.L
8
0',
8
0
8
co
O')
8
O,
co
C)
f_
C)
8
aO cO
22
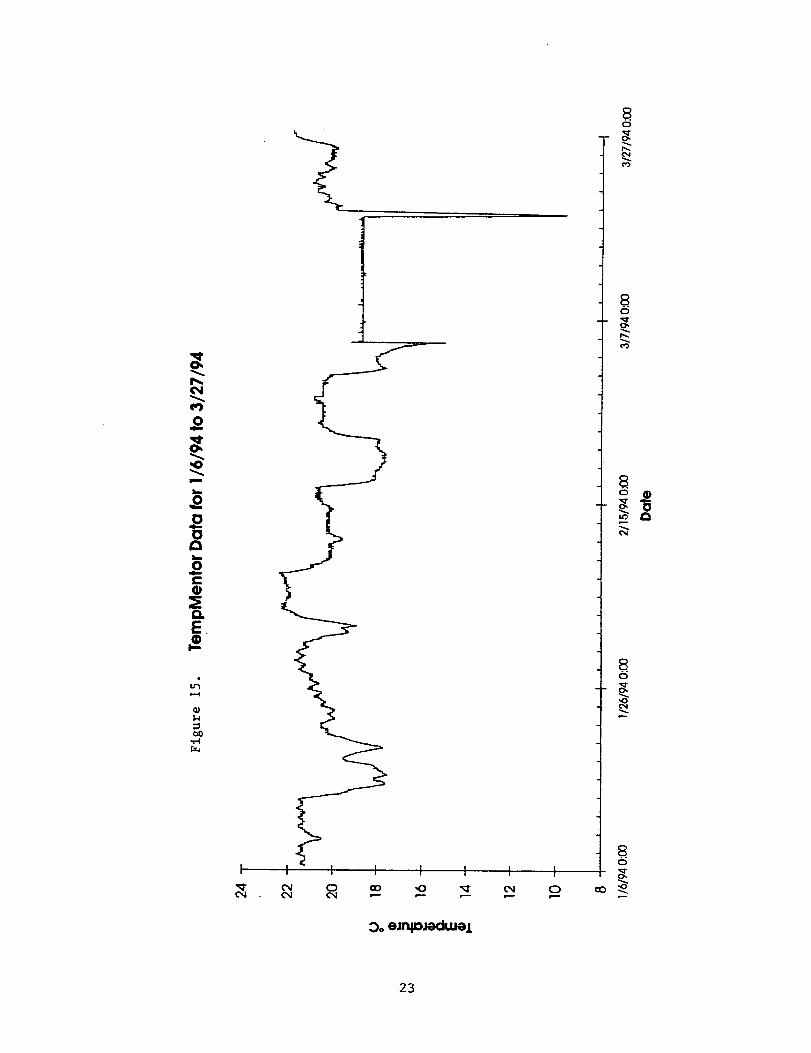
e_
_.o
E.
&
I I I
'_" O_ G) CO "(3 _ O4C_ O_1 04 ,D ,__ ,.._ ,._
I
G)
8O
.8.O
Lo
S
Oo ejnp_,mck.uml
23
4.3.2 Electronics Unit
The 7/93 version of the ECT flight software was used for the OAST-2/STS-62 mission. It
was loaded into the pedigreed flight PROMs for the final assembly of the Electronics Unit.
The flight software was verified by more than 150 hours of test operation before final
assembly of the Electronics Unit. The 7/93 version of the software prevents data
overwriting so that no stored data is lost after all available on-board memory is used.
However, data storage was not optimized in the 7/93 version and all available on-board
memory was used by Flight Day 11. (The STS-62 flight lasted fourteen days.)
Nonetheless, nominal temperature measurement and heater power control continued
without interruption and the recorded data was recovered. The Temp Mentor data
(Figures 14 and 15) and the telemetry data (Appendices E - I) confirm that thermalcontrol was uninterrupted.
Data storage can be and should be made more efficient for use in subsequent missions.
4.3.3 Ground Software
The LabView application was used by John Weber (FS) to create software to display and
capture telemetry data on spacecraft pointing, experiment power and three temperatures
in real time. Due to late changes in mission planning for telemetry by JSC spacecraft
pointing data was not received. The power and temperature data parameters weresuccessfully displayed on screen and captured on hard disk.
4.3.4 Data Products
Utilization of the telemetry data captured by the ECT ground system turned out to be
rather difficult, requiring a great amount of manual file manipulation. Snapshots of the
telemetry data were printed at the POCC every thirty minutes. Plots of this data were
provided by GSFC's thermal contractor and are included in Appendices E - I.
Utilization of the stored data recovered from the Electronics Unit and the Temp Mentor
was straightforward. This data is shown in Figures 10 - 15. Averaging of power values
did require some post-processing of the Electronics Unit data.
The primary NASA data product for telemetry is essentially a copy of the entire mission
telemetry stream, accompanied by a index. This contains all telemetry data from the
Orbiter and from the Hitchhiker Avionics. The necessary post-processing task was not
attempted. This data has been supplied on nine-track magnetic tape and on CD-ROM.
24
5.0 Issues for Future Flights
The next flight for ECT will likely be of much longer duration than the fourteen-day flightof OAST-2/STS-62. With minor modifications, the hardware and software can be madeready for such a mission. Five issues must be addressed: (1) limited carrier spacecraftelectrical power for thermal control; (2) limited electrical power for Temp Mentor powerand Electronics Unit memory back-up power from ECT on-board power sources; (3)limited Temp Mentor and Electronics Unit memory for data storage; (4) the availabilityand compatibility of telemetry data; and (5) the availability and compatibility of electricalconnectors.
5.1 Limited Carrier Spacecraft Power
With regard to thermal control, limitations on available carrier spacecraft electrical powerwill necessitate modifications to the ECT thermal control design, such as covering aportion of the radiator surface with MLI or thermal louvers. A different temperature setpoint for the Emulsion Chamber may also be needed, with possible impacts on flightsoftware and thermal switches. A lower set point will affect the length of powerinterruption which may be tolerated without damage to the emulsion stack.
5.2 Limited ECT On-board Power
Back-up power for Electronics Unit memory was provided by two AA alkaline cells. The
Temp Mentor power was provided by four AA alkaline cells. The adequacy of these power
sources must be evaluated against missions of longer duration. The present numberand/or type of cells may be inadequate.
Once again, if a new Temp Mentor is to be carried aboard the Electronics Unit, then the
power loop-back must be disabled on the Temp Mentor's RS-232 port. This is intended to
prevent power depletion.
5.3 Limited Memory
Data storage in Electronics Unit memory should be optimized. This was known before the
OAST-2/STS-62 flight, but Chris Watson (UAH) was not able to complete the task in time
for delivery to KSC. With the efficient use of available Electronics Unit memory, the
frequency of data storage and perhaps the number of parameters stored might be adjusted
such that the available Electronics Unit memory is sufficient for a mission of longer
duration. The Electronics Unit design allows adding memory to the system, but a memory
upgrade will result in more expense and probably more testing. The appropriate sample
rate for the Temp Mentor must also be selected, based on the Temp Mentor available
memory and longer mission durations.
25

5.4 Telemetry Data
During the flight of OAST-2/STS-62, data was provided to ground personnel via telemetryfor experiment power and three temperatures. However, this data was handled andformatted by the Hitchhiker Avionics system prior to transmission. To enable the use oftelemetry data during another flight, similar arrangements must be provided by thecarrier spacecraft and compatible hardware/software resources must be made ready forground monitoring. Close coordination between the ECT team and the appropriateauthorities will be vital to the availability of telemetry data during any subsequentmission.
5.5 Electrical Connectors
The lack of available and compatible electrical connectors may present significantdifficulties, especially if schedules are short. It is recommended that at least a flight-qualified mating connector for the Electronics Unit power feedthrough connector, J1, belocated and made available as soon as possible.
5.6 Mechanical Interfaces
ECT is designed to be compatible with GSFC's Small Top Pallet. This interface consists of
a grid of 3/8"-24 inserts on 7.000 cm centers to accept primary structural fasteners and a
staggered grid of #10-32 lockplates for tie-down fasteners. For the OAST-2 mission, GSFC
supplied all mounting fasteners. ECT supplied thermal standoff hardware and specialparts designed to transmit shear loads.
For a future mission, a new mounting plate might be developed, if no suitable existing
structure is available. Only a portion of the 3/8"-24 hole pattern and a small number of
#10-32 holes for tie-downs would be required.
6.0 MSFC Contacts
Rickey Clements, Quality Assurance
Lou Ann Fikes, Chief Engineer's Office
John Owens, Program Manager
Dr. Tom Parnell, Project Scientist
David Siersma, Payload Integration & Testing
544-7394
544-6495
544-1969
544-7690
544-1325
26
APPENDIX C
Emulsion Stack Assembly Procedure
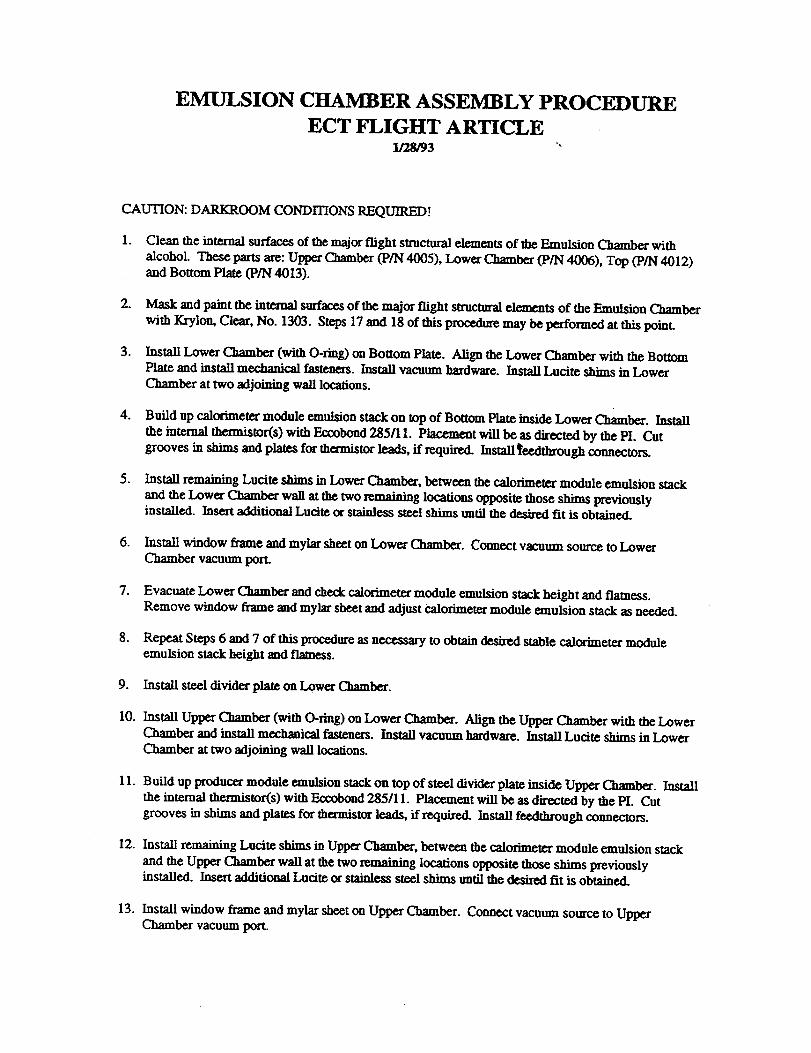
E ION CHAMBER ASSEMBLY PROCEDURE
ECT FLIGHT ARTICLE1/28/93 '"
CAUTION: DARKROOM CONDITIONS REQUIRED!
. Clean the internal surfaces of the major fright structural elements of the Emulsion Chamber with
alcohol. These parts are: Upper Chamber (P/N 4005), Lower Chamber (P/N 4006), Top (P/N 4012)and Bottom Plate (P/N 4013).
.
.
Mask and paint the internal surfaces of the major flight structural elements of the Emulsion Chamber
with Krylon, Clear, No. 1303. Steps 17 and 18 of this procedure may be performed at this point.
Install Lower Chamber (with O-ring) on Bottom Plate. Align the Lower Chamber with the Bottom
Plate and instal] mechanical fasteners. Install vacuum hardware. Install Lucite shims in LowerChamber at two adjoining wall locations.
.
.
Build up calorimeter module emulsion stack on top of Bottom Plate inside Lower Chamber. Install
the internal thermistor(s) with Eccobond 285/11. Placement will be as directed by the PI. Cut
grooves in shims and plates for thermistor leads, if required. Install _eedthrough connectors.
Install remaining Lucite shims in Lower Chamber, between the calorimeter module emulsion stack
and the Lower Chamber wall at the two remaining locations opposite those shims previouslyinstalled. Insert additional Lucite or stainless steel shims until the desired fit is obtained.
6. Install window frame and mylar sheet on Lower Chamber. Connect vacuum source to LowerChamber vacuum port.
7. Evacuate Lower Chamber and check calorimeter module emulsion stack height and flatness.Remove window frame and mylar sheet and adjust calox_eter module emulsion stack as needed.
8. Repeat Steps 6 and 7 of this procedure as necessary to obtain desired stable calorimeter moduleemulsion stack height and flatness.
9. Install steel divider plate on Lower Chamber.
10. Install Upper Chamber (with O-ring) on Lower Chamber. Align the Upper Chamber with the LowerChamber and install mechanical fasteners. Install vacuum hardware. Install Lucite shims in Lower
Chamber at two adjoining wall locations.
11.Build up producer module emulsion stack on top of steel divider plate inside Upper Chamber. Install
the internal thermistor(s) with Eccobond 285/11. Placement will be as directed by the PI. Cutgrooves in shims and plates for thermistor leads, if required. Install feedthrough connectors.
12. Install remaining Lucite shims in Upper Chamber, between the calorimeter module emulsion stack
and the Upper Chamber wall at the two remaining locations opposite those shims previouslyinstalled. Insert additional Lucite or stainless steel shims until the desired fit is obtained.
13. Install window frame and mylar sheet on Upper Chamber. Connect vacuum source to UpperChamber vacuum port.
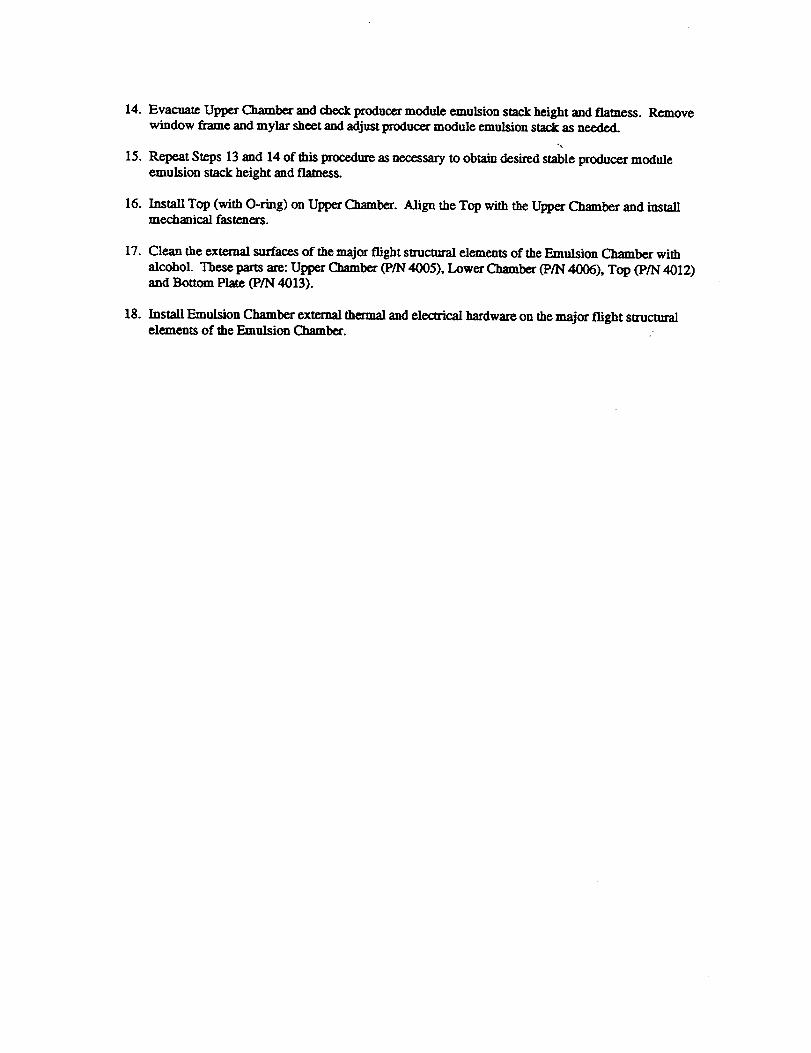
14.Evacuate Upper Chamber and check producer module emulsion stack height and flatness. Removewindow frame and mylar sheet and adjust producer module emulsion stack as needed.
15. Repeat Swps 13 and 14 of this procedure as necessary to obtain desired stable producer moduleemulsion stack height and flamess.
16. Install Top (with O-ring) on Upper Chamber. Align the Top with the Upper Chamber and installmechanical fasteners.
17. Clean the external surfaces of the major flight structural elements of the Emulsion Chamber with
alcohol. These parts are: Upper Chamber (P/N 4005), Lower Chamber (P/N 44306), Top (P/N 4012)and Bottom Plate (P/N 4013).
18. Install Emulsion Chamber external thermal and electrical hardware on the major flight structu_elements of the Emulsion Chamber. .
APPENDIX D
Hight Emulsion Stack Configuration
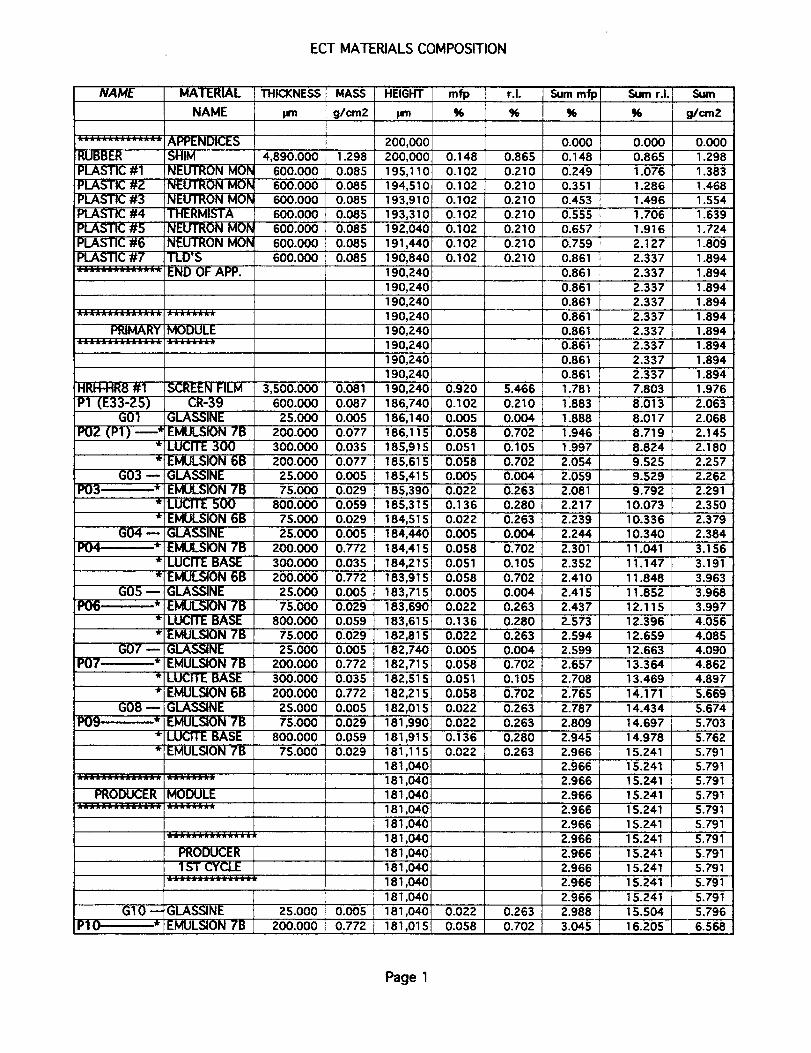
ECT MATERIALS COMPOSITION
NAME MATERIAL THICKNESS
NAME prn
_'-:_ APPENDICES
RUBBER
PLASTIC #1
PLASTIC #2
PLASTIC #3PLASTIC #4
PLASTIC #5
PLASTIC #6
PLASTIC #7
SHIM
NEUTRON MOb
NEUTRON MObNEUTRON MOb
THERMISTA
NEUTRON MOk
NEUTRON MOk
TLD'S
_;;_;_;;;; END OF APP.
PRIMARY MODULE
HRFFHR8 #1
P1 (E33-25)GO1
P02 (P1) ----*
GO3 m
I)03 *
GO4m
P04 *
G05
I)O6 ,*
GO7mP07 *
G08
I)09 *"K-
SCREEN FILM
CR-39
GLASSINE
EMULSION 7B
LUCITE 300
EMULSION 6B
GLASSINE
EMULSION 7B
LUCITE 500EMULSION 6B
GLASSINE
EMULSION 7B
LUCITE BASEEMULSION 6B
GLASSINE
EMULSION 7B
LUCITE BASE
EMULSION 7B
GLASSINEEMULSION 7B
LUCITE BASE
EMULSION 6B
GLASSINE
EMULSION 7B
LUCITE BASE
EMULSION 7B
PRODUCER MODULE
_ A -" "- "- -" -" "- "- -" -" ,; -" ,;
PRODUCER
1 ST CYCLE
G10 -- GLASSINE
P10 * EMULSION 7B
MASS HEIGHT mfp
g/cm2 pm %
200,000
4,890.000 1.298 200,000 0.148
600.000 0.085 195,110 0.102
600.000 0.085 194,510 0.102600.000 0.085 193,910 0.102
600.000 0.085 193,310 0.102
600.000 0.085 192,040 0.102
600.000 0.085 191,440 0.102
600.000 0.085 190,840 0.102
190,240
190,240
190,240
190,240
190,240
190,240190,240
190,240
3,500.000 0.081 190,240 0.920
600.000 0.087 186,740 O. 102
25.000 0.005 186,140 0.005
200.000 0.077 186,115 0.058
300.000 0.035 185,915 0.051
200.000 0.077 185,615 0.058
25.000 0.005 185,415; 0.005
75.000 0.029 185,390 0.022
800.000 0.059 185,315 0.13675.000 0.029 184,515 0.022
25.000 0.005 184,440 0.005
200.000 0.772 184,415 0.058
300.000 0.035 184,215 0.051
200.000 0.772 183,915! 0.058
25.000 0.005 183,715 0.005
75.000 0.029 183,690 0.022
800.000 0.059 183,615 0.136
75.000 0.029 182,815 0.022
25.000 0.005 182,740 0.005
200.000 0.772 182,715! 0.058300.000 0.035 182,5151 0.051
200.000 0.772 182,215 0.058
25.000 0.005 182,015 0.022
75.000 0.029 181,990 0.022
800.000 0.059 181,915 0.136
75.000 0.029 181,115 0.022
181,040
181,040
181,040
181,040
181,040181,040
181,040
181,040
181,040
181,04025.000 0.005 181,040 0.022
200.000 0.772 181,015 0.058
r.I. Sum mfp Sum r.I. Sum
% % % g/cm2
0.000 0.000 0.000
0.865 0.148 0.865 1.298
0.210 0.249 1.076 1.383
0.210 0.351 1.286 1.468
0.210 0.453 1.496 1.554
0.210 0.555 1.706 1.6390.210 0.657 1.916 1.724
0.210 0.759 2.127 1.809
0.210 0.861 2.337 1.894
0.861 2.337 1.894
0.861 2.337 1.8940.861 2.337 1.894
0.861 2.337 1.8940.861 2.337 1.894
0.861 2.337 1.894
0.861 2.337 1.894
0.861 2.337 1.894
5.466 1.781 7.803 1.976
0.210 1.883 8.013 2.063
0.004 1.888 8.017 2.068
0.702 1.946 8.719 2.145
0.105 1.997 8.824 2.180
0.702 2.054 9.525 2.257
0.004 2.059 9.529 2.2620.263 2.081 9.792 2.291
0.280 2.217 10.073 2.350
0.263 2.239 10.336 2.379
0.004 2.244 10.340 2.384
0.702 2.301 11 .O41 3.156
0.105 2.352 11.147 3.191
0.702 2.410 11.848 3.963
0.004 2.415 11.852 3.968
0.263 2.437 12.115 3.997
0.280 2.573 12.396 4.0560.263 2.594 12.659 4.085
0.004 2.599 12.663 4.090
0.702 2.657 13.364 4.862
0.105 2.708 13.469 4.897
0.702 2.765 14.171 5.669
0.263 2.787 14.434 5.674
0.263 2.809 14.697 5.703
0.280 2.945 14.978 5.762
0.263 2.966 15.241 5.791
2.966 15.241 5.7912.966 15.241 5.791
2.966 15.241 5.791
2.966 15.241 5.791
2.966 15.241 S.791
2.966 15.241 5.791
2.966 15.241 S.791
2.966 15.241 5.791
2.966 1 S.241 5.791
2.966 15.241 5.791
0.263 2.988 15.504 5.796
0.702 3.045 16.205 6.568
Page 1
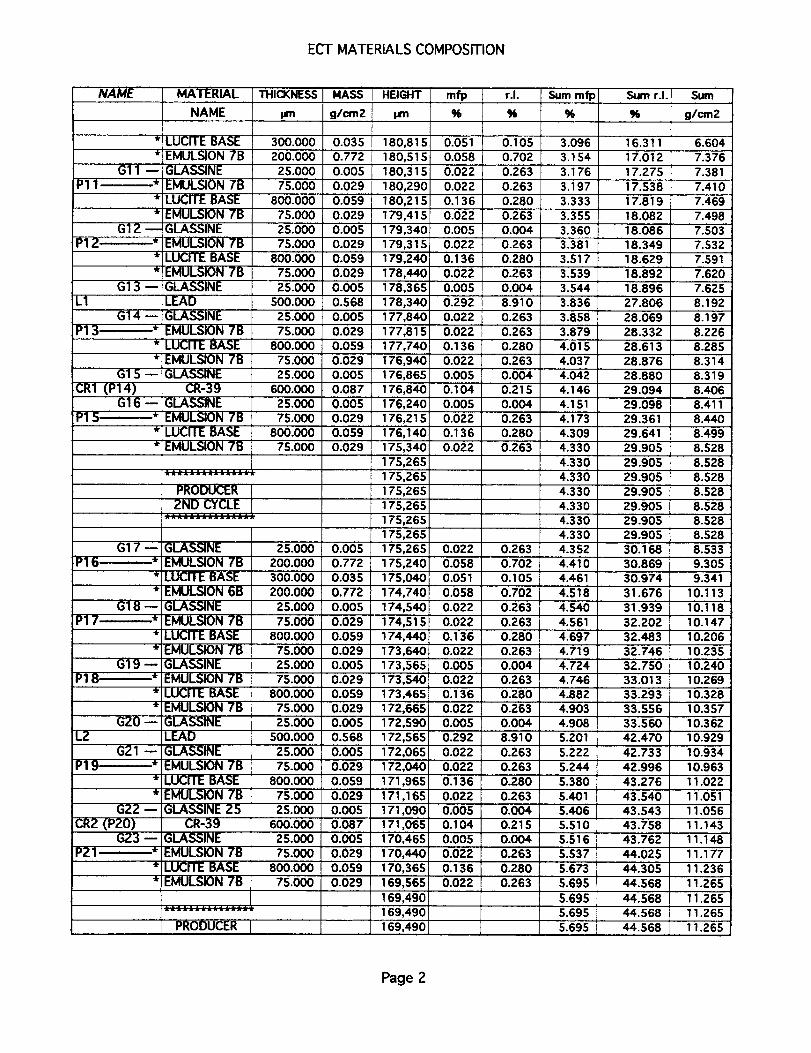
ECT MATERIALS COMPOSITION
NAME MATERIAL THICKNESS
NAME wn
Gll --Pll , *
G12
P12 *
G13 --
L1
G14 --
P13 *
G15
CR1 (P14)G16 --
P15 *
G17
P16 . *
G18 m
P17 *
G19
P18 *
G20 --
L2
G21 --
P19_*
G22 --
CR2 (P20)GZ3--
P21 _
LUCITE BASE
EMULSION 7B
GLASSINE
EMULSION 7B
LUCITE BASE
EMULSION 7BGLASSINE
EMULSION 7B
LUCITE BASE
EMULSION 7B
GLASSINE
LEAD
GLASSINE
EMULSION 7B
LUCITE BASE
EMULSION 7B
GLASSINE
CR-39
GLASSINEEMULSION 7B
LUCITE BASE
EMULSION 7B
PRODUCER
2ND CYCLE
GLASSINE
EMULSION 7B
LUCITE BASE
EMULSION 6B
GLASSINE
EMULSION 7B
LUCITE BASE
EMULSION 7B
GLASSINE
EMULSION 7B
LUCITE BASEEMULSION 7B
GLASSINELEAD
GLASSINE
EMULSION 7B
LUCITE BASE
EMULSION 7B
GLASSINE 25
CR-39
GLASSINE
EMULSION 7BLUCITE BASE
EMULSION 7B
MASS HEIGHT mfp
g/crn2 pm %
300.000 0.035 180,815 0.051
200.000 0.772 180,515 0.058
25.000 0.005 180,315 0.022
75.000 0.029 180,290 0.022
800.000 0.059 180,215 0.136
75.000 0.029 179,415 0.022
25.000 0.005 179,340 0.O05
75.000 0.029 179,315 0.022
800.000 0.059 179,240 0.136
75.000 0.029 178,440 0.02225.000 0.005 178,365 0.005
500.000 0.568 178,340 0.292
25.000 0.005 177,840 0.022
75.000 0.029 177,815 0.022
800.000 0.059 177,740 0.136
75.000 0.029 176,940 0.022
25.000 0.O05 176,865 0.005
600.000 0.087 176,840 0.104
25.000 0.005 176,240 0.005
75.000 0.029 176,215 0.022
800.000 0.059 176,140 0.13675.000 0.029 175,340 0.022
175,265
175,265
175,265
175,265
175,265
175,265
25.000 0.005 175,265 0.022
200.000 0.772 175,240 0.058
300.000 0.035 175,040 0.O51
200.000 0.772 174,740 0.058
25.000 0.005 174,540 0.022
75.000 0.029 174,515 0.022
800.000 0.059 174,440 0.13675.000 0.029 173,640 0.022
25.000 0.005 173,565 0.OOS
75.000 0.029 173,540 0.022
800.000 0.059 173,465 0.136
75.000 0.029 172,665 0.02225.000 0.005 172,590 0.005
500.000 0.568 172,565 0.292
25.000 0.005 172,065 0.02275.000 0.029 172,040 0.022
800.000 O.O59 171,965 0.136
75.000 0.029 171,165 0.02225.000 0.005 171,090 0.005
600.000 0.087 171,065 0.104
25.000 0.005 170,465 0.005
75.000 0.029 170,440 0.022
800.000 0.059 170,365 O.136
75.000 0.029 169,565 0.022
169,490
169,490
169,490PRODUCER I
r.I. Sum mfp Sum r.I. Sum
% % g/ran2
O.105 3.096 16.311 6.604
0.702 3.154 17.012 7.376
0.263 3.176 17.275 7.381
0.263 3.197 17.538 7.410
0.280 3.333 17.819 7.469
0.263 3.355 18.082 7.498
0.004 3.360 18.O86 7.5030.263 3.381 18.349 7.532
0.280 3.517 18.629 7.5910.263 3.539 18.892 7.620
0.004 3.544 18.896 7.625
8.910 3.836 27.806 8.192
0.263 3.858 28.069 8.197
0.263 3.879 28.332 8.226
0.280 4.015 28.613 8.285
0.263 4.037 28.876 8.314
0.004 4.042 28.880 8.319
0.215 4.146 29.094 8.4060.004 4.151 29.098 8.411
0.263 4.173 29.361 8.4400.280 4.309 29.641 8.499
0.263 4.330
4.330
29.905
29.905
8.528
8.528
4.330 29.905 8.528
4.330 29.905 8.528
4.330 29.905 8.528
4.330 29.905 8.528
4.330 29.905 8.5280.263 4.352 30.168 8.533
0.702 4.410 30.869 9.305
0.105 4.461 30.974 9.341
0.702 4.518 31.676 10.113
0.263 4.540
4.561
4.697
4.719
0.263
31.939
32.202
32.483
32.746
0.280
0.263
10.118
10.147
10.206
10.235
0.004 4.724 32.750 10.240
0.263 4.746 33.013 10.2690.280 4.882 33.293 10.328
0.263 4.903 33.556 10.357
0.004 4.908 33.560 10.362
8.910 5.201 42.470 10.929
0.263 5.222 42.733 10.934
0.263 5.244 42.996 10.963
0.280 5.380 43.276 11.022
0.263 5.401 43.540 11.051
0.004 5.406 43.543 11.056
0.215 5.510 43.758 11.1430.004 5.516
5.5370.26343.762
44.025
11.14811.177
0.280 5.673 44.305 11.236
0.263 44.568 11.2655.695
5.695 44.568
44.568
44.568
5.695
5.695
11.265
11.265
11.265
Page 2
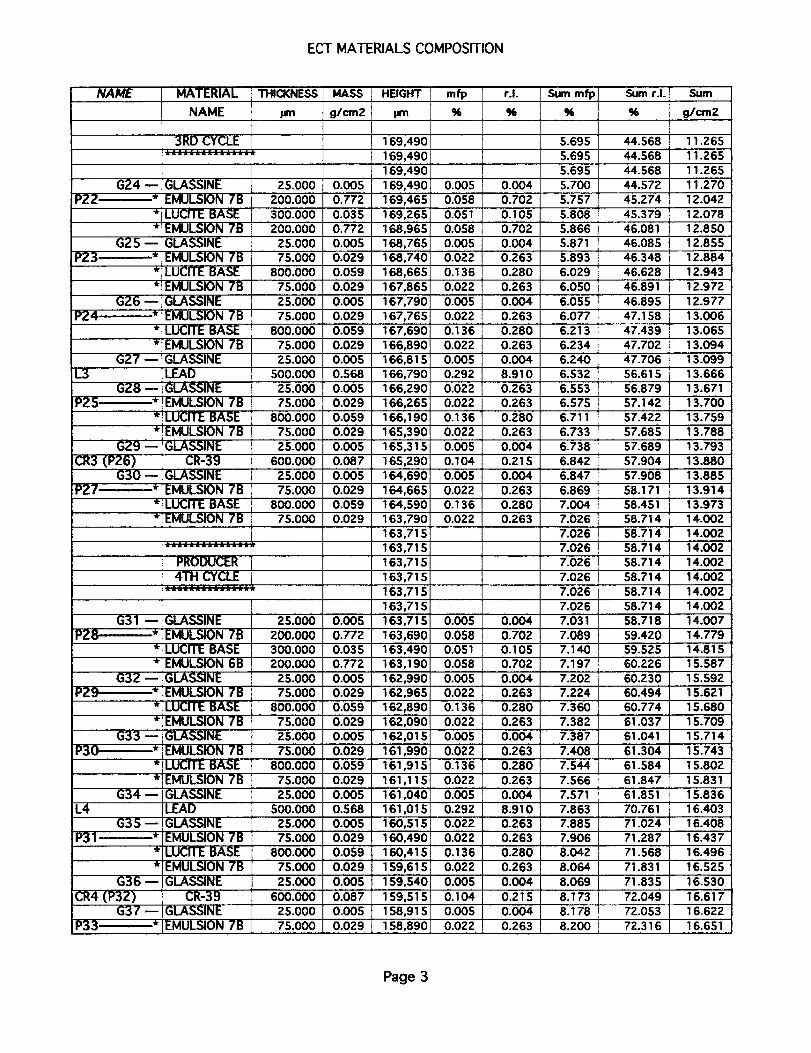
ECT MATERIALS COMPOSITION
NAME
PZZ
P23
P24
L3
PZ5
MATERIAL THICKNESS
NAME pm
3RD CYCLE
G24- GLASSINE* EMULSION 7B
* LUCITE BASE
* EMULSION 7B
G25- GLASSINE
..* EMULSION 7B
* LUCITE BASE
* EMULSION 7B
G26 m GLASSINE
* EMULSION 7B
* LUCITE BASE
* EMULSION 7B
GZ7- GLASSINE
LEADG28- GLASSINE
* EMULSION 7B
G29
CR3 (PZ6)G30
P27 *
G31
PZ8 *
G32 m
PZC *
G33 --
P30 *
G34 m
L4
G35 --P31 *
LUCITE BASE
EMULSION 7B
GLASSINE
CR-39
GLASSINE
EMULSION 7B
LUCITE BASE
EMULSION 7B
PRODUCER
4TH CYCLE
GLASSINE
EMULSION 7B
LUCITE BASE
EMULSION 6BGLASSINE
EMULSION 7B
LUCITE BASE
EMULSION 7B
GLASSINE
EMULSION 7B
LUCITE BASE
EMULSION 7B
GLASSINE
LEADGLASSINE
EMULSION 7B
LUCITE BASE
EMULSION 7B
GLASSINE
CR-39
GLASSINEEMULSION 78
G36 --
CR4 (P32)G37
P33 *
25.000
200.000
300.000200.000
25.00075.000
800.000
75.000
25.000
75.000
800.000
75.000
25.000
500.00O
25.00O75.000
800.000
75.000
25.OOO
600.0O0
25.000
75.OOO
800.000
75.000
25.000
20O.0OO
300.000
2OO.0OO
25.00075.000
800.000
75.000
25.000
75.000
800.000
75.000
25.000
500.000
25.00075.000
800.000
75.000
25.0O0
60O.0O0
25.00075.000
MASS HEIGHT mf_
g/cm2 prn %
169,490
169,490
169,4900.005 169,490 0.005
0.772 169,465 0.0580.035 169,265 0.051
0.772 168,965 0.058
O.00S 168,765 0.005
0.029 168,740 0.022
0.059 1 68,665 0.136
0.029 167,865 0.022
0.005 167,790 0.005
0.029 167,765 0.022
0.059 167,690 0.136
0.029 166,890 0.0220.005 166,815 0.005
0.568 166,790 0.292
0.005 166,290 0.022
0.029 166,265 0.022
0.059 166,190 0.136
0.029 165,390 0.022
0.00S 165,315 0.005
0.087 165,290 0.104
0.005 164,690 0.005
0.029 164,665 0.022
0.059 164,590 0.1360.029 163,790 0.022
163,715
163,715
163,715
163,715
163,715
163,715
0.OOS 163,715 0.005
0.772 163,690 0.058
0.035 163,490 0.0510.772 163,190 0.058
0.005 162,990 0.005
0.029 162,965 0.022
0.059 162,890 0.136
0.029 162,090 0.022
0.005 162,015 0.005
0.029 161,990 0.022
0.059 161,915 0.1360.029 161,115 0.022
0.005 161,040 0.005
0.568 161,015 0.292
0.005 160,515 0.022
0.029 160,490 0.022
0.059 160,41S 0.136
0.029 159,615 0.022
0.005 159,540 0.005
0.087 159,515 0.104
0.005 158,915 0.005
0.029 158,890 0.022
r.I. Sum mfp Sum r.I. Sum
% % % g/cruZ
5.695 44.568 11.265
5.695 44.568 11.265
5.695 44.568 11.265
0.004 5.700 44.572 11.270
0.702 5.757 45.274 12.0420.105 5.808 45.379 12.078
0.702 5.866 46.081 12.850
0.004 5.871 46.085 12.855
0.263 5.893 46.348 12.884
0.280 6.029 46.628 12.943
0.263 6.050 46.891 12.972
0.004 6.055 46.895 12.977
0.263 6.077 47.158 13.006
0.280 6.213 47.439 13.065
0.263 6.234 47.702 13.094
0.004 6.240 47.706 13.099
8.9100.263
6.532
0.004
6.553
56.615
56.879
6.738
13.666
13.671
0.263 6.575 57.142 13.7000.280 6.711 57.422 13.759
0.263 6.733 57.685 13.788
57.689 13.793
0.215 57.9046.842 13.880
0.702
0.004 6.847 57.908 13.885
0.263 6.869 58.171 13.914
0.280 7.004 $8,451 13.973
0.263 7.026 58.714 14.0027.026 58.714 14.002
7.026 58.714 14.002
7.026 $8.714 14.002
7.026 58.714 14.002
7.026 58.714 14.002
7.026 58.714 14.002
0.004 7.031 58.718 14.007
0.702 7.089 59.420 14.779
0.105 7.140 59.525 14.8157.197 60.226 15.587
7.2020.004 60.230 15.592
0.263 7.224 60.494 15.621
0.280 7.360 60.774 15.680
7.382 61.0370.263 15.709
0.004 7.387 61.041 15.714
0.263 7.408 61.304 15.743
0.280 7.544 61.584 15.802
0.263 7.566 61.847 15.831
0.004 7.571 61.851 15.836
8.910 7.863 70.761 16.403
0.263 7.885 71.024 16.4080.263 7.906 71.287 16.437
0.280 8.042 71.568 16.496
0.263 8.064 71.831 16.525
0.004 8.069 71.835 16.530
0.215 8.173 72.049 16.617
0.004 8.178 72.053 16.622
0.263 8.200 72.316 16.651
Page 3
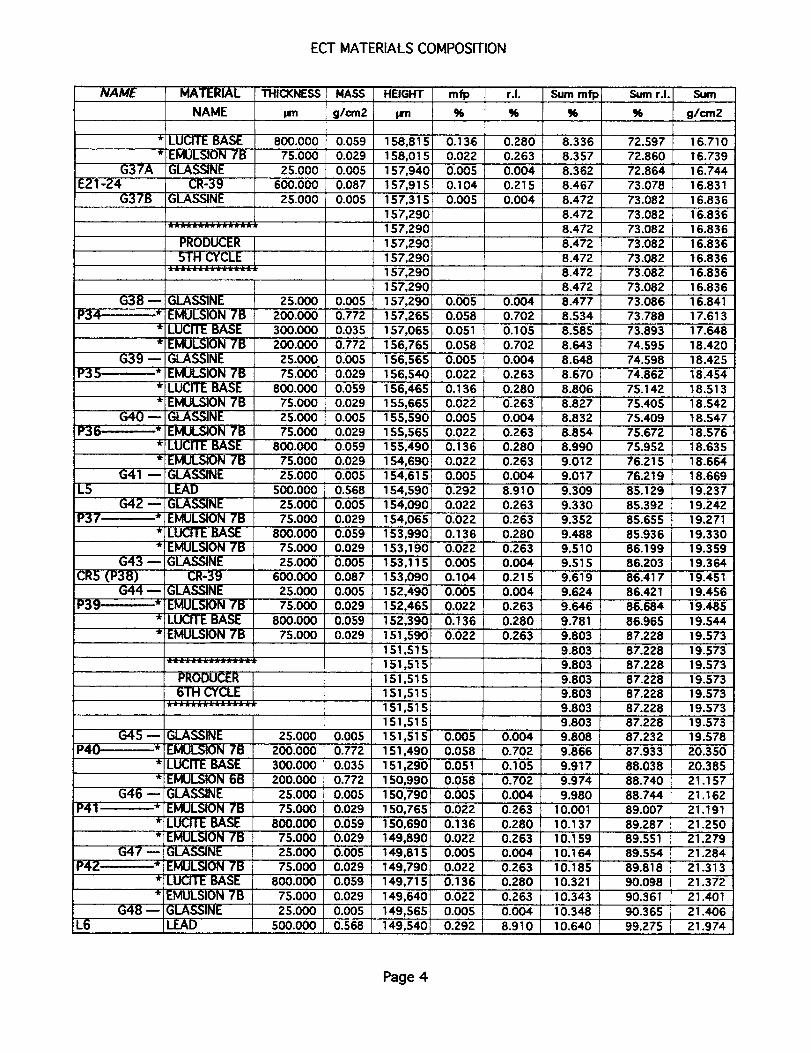
ECT MATERIALS COMPOSITION
NAME MATERIAL !THICKNESS
NAME _m
* LUCITE BASE 800.000
* EMULSION 7B 75.000
G37A GLASSINE 25.000
E21-24 CR-39 600.000
G37B GLASSINE 25.000
AAAAA::_.. ....
PRODUCER
STH CYCLE
G38- GLASSINE
P34----.-_* EMULSION 7B* LUCITE BASE
* EMULSION 7B
G39- GLASSINE
P35_* EMULSION 7B
* LUCITE BASE
* EMULSION 7B
G40- GLASSINE
P36---------* EMULSION 7B
* LUCITE BASE* EMULSION 7B
G41 -- GLASSINE
L5 LEADG42- GLASSINE
P37_* EMULSION 7B
* LUCITE BASE
* EMULSION 7B
G43- GLASSINE
CR5 (P38) CR-39C-44 D GLASSINE
P39---------* EMULSION 7B
* LUCITE BASE
* EMULSION 7B
25.000
200.000
300.000
2O0.000
25.0007s.ooo'
800.00075.000
25.000
75.000
800.0007s.0oo25.00O
500.000
25.000
75.000
800.00075.000
25.000
600.000
25.000
75.000
800.000
75.000
G45--
P4O' *
G46
P41 *
G47--
P4Z *
-1
G48 --
L6
PRODUCER
6TH CYCLE
GLASSINEEMULSION 7B
LUCITE BASE
EMULSION 6B
GLASSINE
EMULSION 7B
LUCITE BASE
EMULSION 7B
GLASSINE
EMULSION 7B
LUCITE BASE
EMULSION 7B
GLASSINE
LEAD
25.000
200.OO0
300.000
200.000
25.000
75.00O
800.00075.000
25.OOO
75.000
800.000
75.000
25.000
500.000
MASS HEIGHT mfp
g/cm2 len
0.059 158,815 0.136
0.029 158,015 0.022
0.005 157,940 0.005
0.087 157,915 0.104
0.005 157,315 0.005
157,290
157,290
157,290
157,290
157,290
157,290
0.005 157,290 0.0050.772 157,265 0.058
0.035 157,065 0.051
0.772 156,765 0.0580.005 156,565 0.005
0.029 156,540 0.022
0.059 156,465 0.136
0.029 155,665 0.022
0.005 155,590 0.005
0.029 155,565 0.022
0.059 155,490 0.136
0.029 154,690 0.0220.005 154,6151 0.005
0.568 154,590 0.292
0.005 154,090 0.022
0.029 154,065 0.0220.059 153,990 0.136
0.029 153,190 0.022
0.005 153,115 0.005
0.087 153,090 0.104
0.005 152,490 0.005
0.029 152,465 0.022
0.059 152,390 0.136
0.029 1S 1,590 0.022
151,515
151,515151,515
151,515
151,515
151,515
0.005 151,515 0.005
0.772 151,490 0.058
0.035 151,290 0.0510.772 150,990 0.058
0.005 150,790 0.0050.029 150,765 0.022
0.059 150,690 0.136
0.029 149,890 0.022
0.005 149,815 0.005
0.029 149,790 0.022
0.059 149,715 O.136
0.029 149,640 0.022
0.005 149,565 0.005
0.568 149,540 0.29'2
r.I. Sum mfp Sum r.I. Sum
% % % g/cruZ
0.280 8.336 72.597 16.710
0.263 8.357 72.860 16.739
0.004 8.362 72.864 16.744
0.215 8.467 73.078 16.831
0.004 8.472 73.082 16.836
8.472 73.082 16.836
8.472 73.082 16.836
8.472 73.082 16.836
8.472 73.082 16.8368.472 73.082 16.836
8.472 73.082 16.836
0.004 8.477 73.086 16.841
0.702 8.534 73.788 17.613
0.105 8.585 73.893 17.648
0.702 8.643 74.595 18.420
0.004 8.648 74.598 18.425
0.263 8.670 74.862 18.454
0.280 8.806 75.142 18.513
0.263 8.827 75.405 18.542
0.004 8.832 75.409 18.547
0.263 8.854 75.672 18.5760.280 8.990 75.952 18.635
0.263 9.012 76.215 18.664
0.004 9.017 76.219 18.669
8.910 9.309 85.129 19.237
0.263 9.330 85.392 19.242
0.263 9.352 85.655 19.271
0.280 9.488 85.936 19.330
0.263 9.510 86.199 19.359
0.004 9.515 86.203 19.364
0.215 9.619 86.417 19.4510.004 9.624 86.421 19.456
0.263 9.646 86.684 19.485
0.280 9.781 86.965 19.544
0.263 9.803 87.228 19.573
9.803 87.228 19.573
9.803 87.228 19.5739.803 87.228 19.573
9.803 87.228 19.573
9.803 87.228 19.573
9.803 87.228 19.573
0.004 9.808 87.232 19.5780.702 9.866 87.933 20.350
0.105 9.917 88.038 20.3850.702 9.974 88.740 21.157
0.004 9.980 88.744 21.162
0.263 10.001 89.007 21.191
0.280 10.137 89.287 21.250
0.263 10.159 89.551 21.279
0.004 10.164 89.554 21.284
0.263 10.185 89.818 21.313
0.280 10.321 90.098 21.372
0.263 10.343 90.361 21.401
0.004
8.910
10.348
10.640
90.365
99.275
21.406
21.974
Page 4
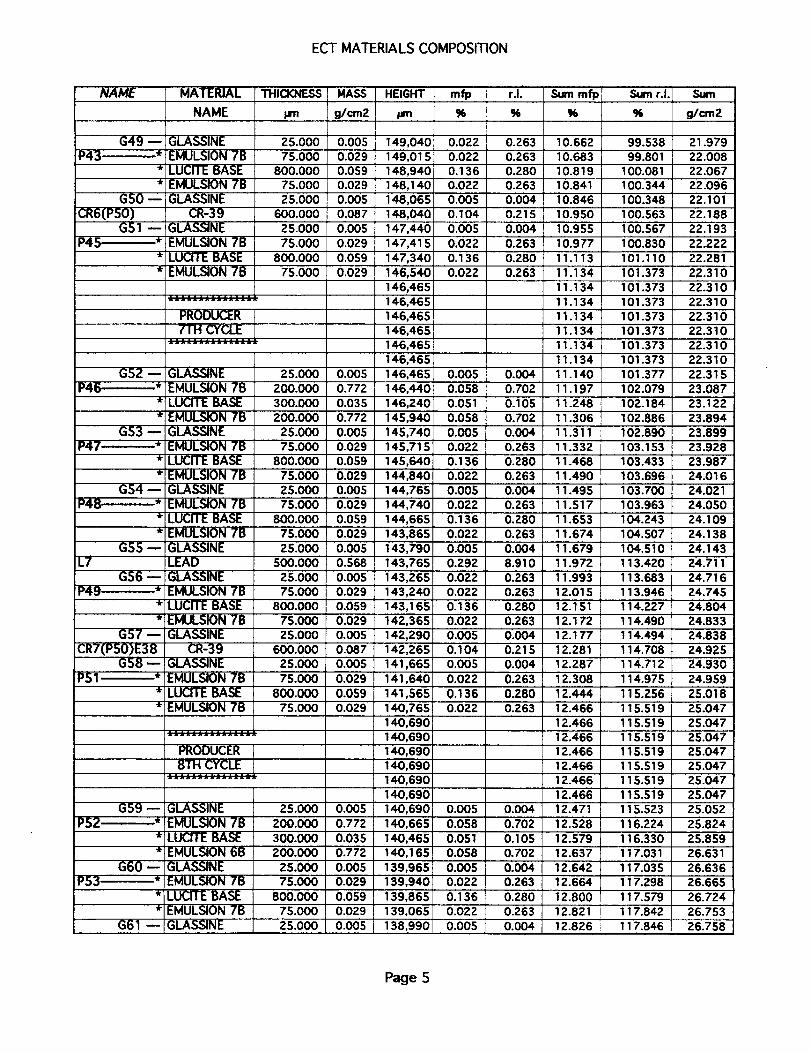
ECT MATERIALS COMPOSITION
NAME MATERIAL THICKNESS
NAME pm
G49 --
P43 *
G50 --
CR6(PSO)GS1 --
P45 *
GS2 --
P46 *
G53 --
P47 *
G54 --
P48 *
G55 --
L7
G56 --
P49 *
G57 --
CRT(P50)E38G58 --
P51 *
G59 --
P52 *
G60 --
P53 *
G61 --
!GLASSINE
i EMULSION 7Bi LUCITE BASE
EMULSION 7B
_GLASSINE
CR-39
GLASSINE
EMULSION 7B
LUCITE BASE
EMULSION 7B
AA_AAAA&AAAAAA
PRODUCER
TrH CYCLEAAAAAAAA&&A..A
GLASSINE
EMULSION 7B
LUCITE BASE
EMULSION 7B
GLASSINE
EMULSION 7B
LUCITE BASE
EMULSION 7B
GLASSINE
EMULSION 7B
LUCITE BASEEMULSION 7B
GLASSINE
LEADGLASSINE
EMULSION 7B
LUCITE BASE
EMULSION 7B
GLASSINE
CR-39GLASSINE
EMULSION 7B
LUCITE BASE
EMULSION 7B
A&AAAAAAAAAAAA
PRODUCER
8TH CYCLE
GLASSINE
EMULSION 7B
LUCITE BASE
EMULSION 6B
GLASSINE
EMULSION 7B
LUCITE BASE
EMULSION 7B
GLASSINE
MASS HEIGHT mfp
g/cruZ wn
25.000 0.005 149,040:0.022
75.000 0.029 149,015 0.022800.000 0.059 148,940 ! 0.136
75.000 0.029 148,140 0.022
25.000 0.005 148,065 0.005
600.000 0.087 148,040 0.104
25.000 0.005 147,440 0.005
75.000 0.029 147,415 0.022
800.000 0.059 147,340 O.136
75.000 0.029 146,540 0.022
146,465
146,465
146,465
146,465
146,465146,465
25.000 0.005 146,465 0.005
200.000 0.772 146,440 0.058
300.000 0.035 146,240 0.051
200.000 0.772 145,940 0.058
25.000 0.005 145,740 O.OOS
75.000 0.029 145,715 0.022
800.000 0.059 145,640 O. 136
75.000 0.029 144,840 0.022
25.000 0.005 144,765 0.005
75.000 0.029 144,740 0.022800.000 0.059 144,665 0.136
75.000 0.029 143,865 0.022
25.000 0.005 143,790 0.005
500.000 0.568 143,765 0.292
25.000 0.005 143,265 0.022
75.000 0.029 143,240 0.022
800.000 0.059 143,165 O.136
75.000 0.029 142,365 0.022
25.000 0.005 142,290 0.005
600.000 0.087 142,265 O.10425.000 0.005 141,665 0.005
75.000 0.029 141,640 0.022
800.000 0.059 141,565 O.13675.000 0.029 140,765 0.022
140,690
140,690
140,690
140,690140,690
140,690
25.000 0.005 140,690 0.O05
200.000 0.772 140,665 0.058
300.000 0.035 140,465 0.051
200.000 0.772 140,165 0.058
25.000 0.005 139,965 O.OOS
75.000 0.029 139,940 0.022
800.000 0.059 139,865 0.136
75.000 0.029 139,065 0.022
25.000 0.005 138,990 0.005
r.I. Sum mfp Sum r.I. Sum
% % % g/cm2
0.263 10.662 99.538 21.979
0.263 10.683 99.801 22.008
0.280 10.819 100.081 22.067
0.263 10.841 100.344 22.096
0.004 10.846 100.348 22.1010.215 10.950 100.563 22.188
0.004 10.955 100.567 22.193
0.263 10.977 100.830 22.2220.280 11.113 101.110 22.281
0.263 11.134 101.373 22.310
11.134 101.373 22.31011.134 101.373 22.310
11.134 101.373 22.310
11.134 101.373 22.310
11.134 101.373 22.310
11.134 101.373 22.3100.004 11.140 101.377 22.315
0.702 11.197 102.079 23.087
0.105 11.248 102.184 23.122
0.702 11.306 102.866 23.894
0.004 11.311 102.890 23.899
0.263 11.332 103.153 23.9280.280 11.468 103.433 23.987
0.263 11.490 103.696 24.016
0.004 11.495 103.700 24.021
0.263 11.517 103.963 24.050
0.280 11.653 104.243 24.109
0.263 11.674 104.S07 24.138
0.004 11.679 104.510 24.143
8.910 11.972 113.420 24.711
0.263 11.993 113.683 24.716
0.263 12.015 113.946 24.745
0.280 12.151 114.227 24.804
0.263 12.172 114.490 24.8330.004 12.177 114.494 24.838
0.215 12.281 114.708 24.925
0.004 12.287 114.712 24.930
0.263 12.308 114.975 24.959
0.280 12.444 115.256 25.018
0.263 12.466 115.519 25.047
12.466 115.519 25.047
12.466 115.519 25.047
12.466 115.519 25.04712.466 115.$19 25.047
12.466 115.$19 25.047
12.466 115.519 25.047
0.004 12.471 115.523 25.052
0.702 12.528 116.224 25.824
0.105 12.579 116.330 25.859
0.702 12.637 1 t7.031 26.631
0.004 12.642 117.035 26.636
0.263 12.664 117.298 26.665
0.280 12.800 117.579 26.724
0.263 12.821 117.842 26.753
0.004 12.826 117.846 26.758
Page S
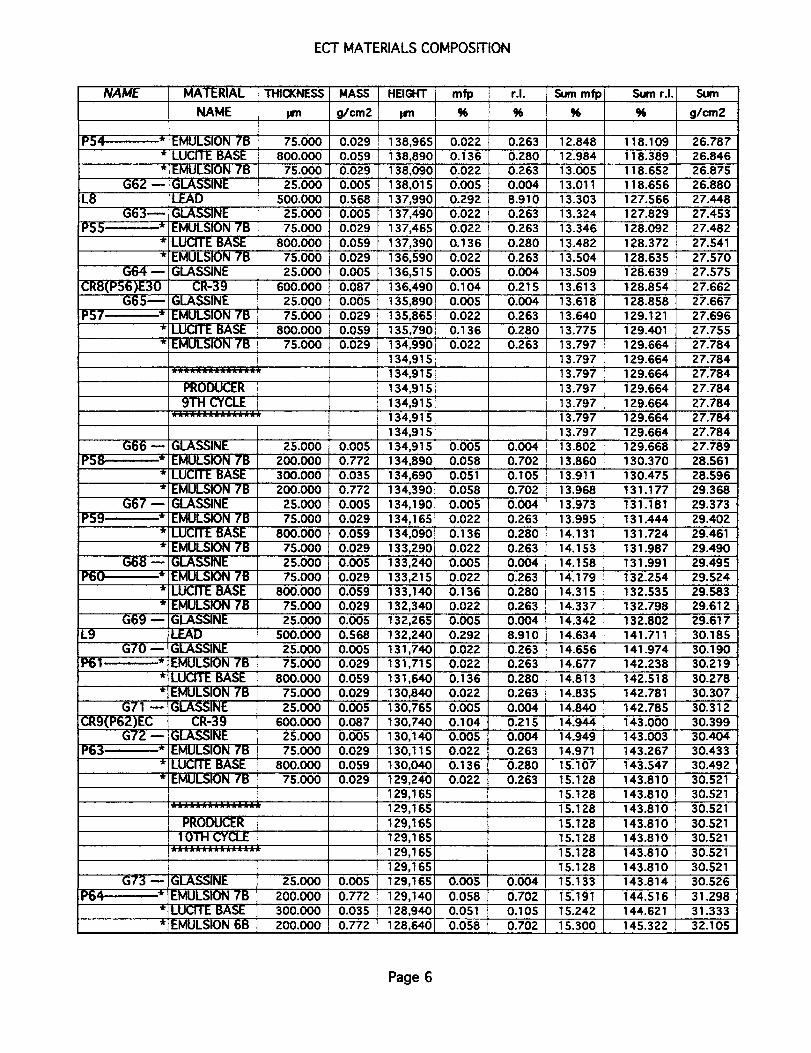
ECTMATERIALS COMPOSITION
MATERIALNAME THICKNESS
NAME irn
PS4 *
G62 --
L8
G63 m
!PS5 ' ' *
G64 --
CR8(PS6)E30G65_
P57 *
G66
PS8 *
G67
P59 *'k
G68
P60 *
G69
L9G70 --
P61 *
G71
CRg(P62)ECG72
P63 *
G73
P64 *
EMULSION 7B
LUCITE BASEEMULSION 7B
GLASSINE
LEAD
GLASSINE
EMULSION 7B
LUCITE BASE
EMULSION 7B
GLASSINE
CR-39
GLASSINE
EMULSION 7B
LUCITE BASEEMULSION 7B
PRODUCER
9TH CYCLE
GLASSINE
EMULSION 7B
LUCITE BASE
EMULSION 7BGLASSINE
EMULSION 7B
LUCITE BASE
EMULSION 7B
GLASSINE
EMULSION 7B
LUCITE BASE
EMULSION 7B
GLASSINE
iLEADGLASSINE
EMULSION 7B
;LUCITE BASE
EMULSION 7B
GLASSINE
CR-39
:GLASSINE
EMULSION 7BLUCITE BASE
EMULSION 7B
PRODUCER
10TH CYCLEP_ .............
GLASSINE
EMULSION 7B
LUCITE BASE
IEMULSION 6B
MASS HEIGHT mfp
g/cruZ lrn %
75.000 0.029 138,965 0.022800.000 0.059 138,890 0.136
75.000 0.029 138,O90 0.022
25.000 0.005 138,015 0.005
500.000 0.568 137,990 0.292
25.000 0.005 137,490 0.022
75.000 0.029 137,465 0.022
800.000 0.059 137,390 0.136
75.000 0.029 136,590 0.022
25.000 0.005 136,515 0.005
600.000 0.087 136,490 O. 104
25.000 0.005 135,890 0.00575.000 0.029 135,865 0.022
800.000 0.059 135,790 O. 136
75.000 0.029 134,990 0.022
134,915
134,915
134,915
134,915
134,915
134,915
25.000 0.O05 134,915 0.005200.000 0.772 134,890 0.058
300.000 0.035 134,690 0.051
200.000 0.772 134,390 0.058
25.000 0.005 134,190 0.005
75.000 0.029 134,165 0.022
800.000 0.059 134,090 0.136
75.000 0.029 t 33,290 0.022
25.000 O.OOS 133,240 O.OOS
75.000 0.029 133,215 0.022
800.000 0.059 133,140 0.136
75.000 0.029 132,340 0.02225.000 0.005 132,265 0.005
500.000 0.568 132,240 0.292
25.000 0.005 131,740 0.022
75.000 0.029 131,715 0.022
800.000 0.059 131,640 0.136
75.000 0.029 130,840 0.022
25.000 0.005 130,765 O.0OS
600.000 0.087 130,740 0.104
25.000 0.005 130,140 0.00575.000 0.029 130,115 0.022
800.000 0.059 130,040 0.136
75.000 0.029 129,240 0.022
129,165
129,165
129,165
129,165
129,165
129,165
25.000 O.OOS 129,165 0.005
200.000 0.772 129,140 0.058
300.000 0.035 128,940 0.051
200.000 0.772 128,640 0.058
r.I. Sum mfp Sum r.I. Sum% % % g/cruZ
0.263 12.848 118.109 26.787
0.280 12.984 118.389 26.846
0.263 13.005 118.652 26.8750.004 13.011 118.656 26.880
27.4488.910 13.303 127.566
0.263 13.324 127.829 27.453
0.263 13.346 128.092 27.482
13.482 128.3720.280 27.541
0.263 13.504 128.635 27.570
0.004 13.509 128.639 27.575
0.215 13.613 128.854 27.662
0.004 13.618 128.858 27.667
0.263 13.640 129.121 27,696
0.280 13.775 129.401 27.755
0.263 13.797 129.664 27.784
13.797 129.664 27.78413.797 129.664 27.784
13.797 129.664 27.784
13.797 129.664 27.784
13.797 129.664 27.78413.797 129.664 27.784
0.004 13.802 129.668 27.789
0.702 13.860 130.370 28.561
0.105 13.911 130.475 28.$96
0.702 13.968 131.177 29.368
0.004 13.973 131.181 29.373
0.263 13.995 131.444 29.402
0.280 14.131 131.724 29.461
0.263 14.153 131.987 29.490
0.004 14.158 131.991 29.495
0.263 14.179 132.254 29.5240.280 14.315 132.535 29.583
0.263 14.337 132.798 29.612
0.004 14.342 132.802 29.617
8.910 14.634 141.711 30.185
0.263 14.656 141.974 30.190
0.263 14.677 142.238 30.219
0.280 14.813 142.518 30.278
0.263 14.835 142.781 30.3070.004 14.840 142.785 30.312
0.215 14.944 143.000 30.3990.004 14.949 143.003 30.404
0.263 14.971 143.267 30.433
0.280 15.107 143.547 30.492
0.263 15.128 143.810 30.521
15.128 143.810 30.52115.128 143.810 30.521
15.128 143.810 30.52115.128 143.810 30.521
15.128 143.810 30.521
15.128 143.810 30.5210.004 15.133 143.814 30.526
0.702 15.191 144.516 31.2980.105 15.242 144.621 31.333
0.702 15.300 145.322 32.105
Page 6
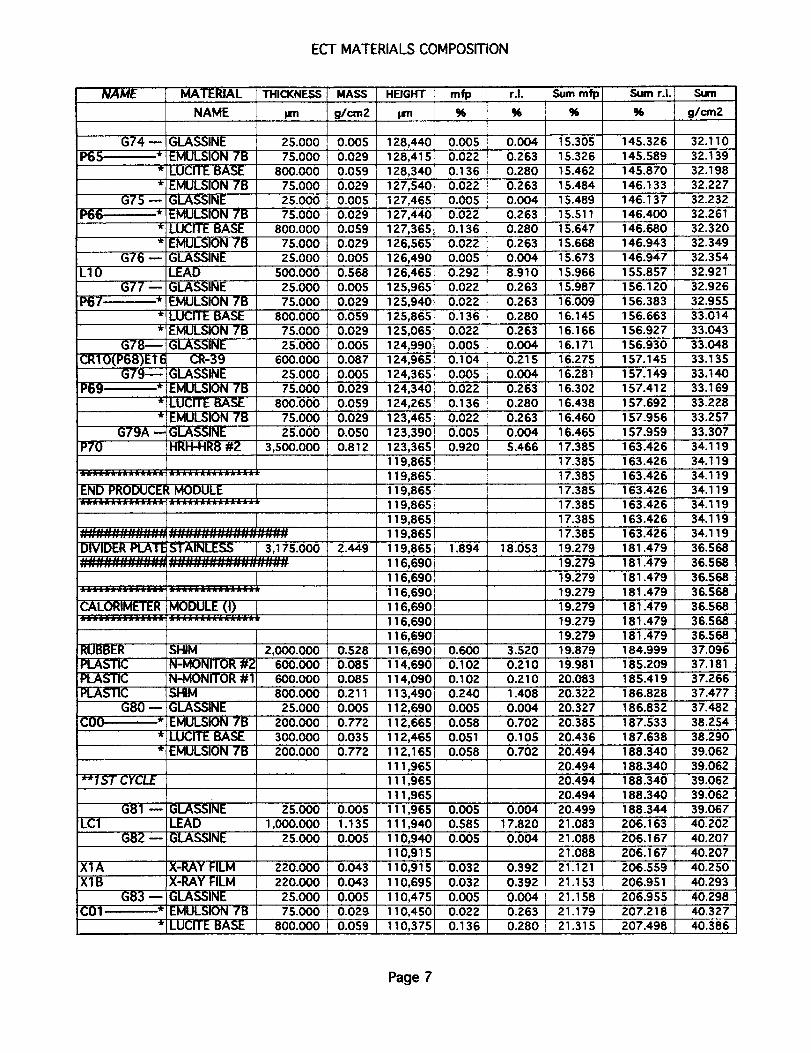
ECT MATERIALS COMPOSITION
NAME MATERIAL THICKNESS
NAME i_
GLASSINE 25.000
EMULSION 7B 75.000
LUCITE BASE 800.000
EMULSION 7B 75.000
GLASSINE 25.000
EMULSION 7B 75.000LUCITE BASE 800.000
EMULSION 7B 75.000
GLASSINE 25.00O
LEAD 500.0O0
GLASSINE 25.000
EMULSION 7B 75.000
LUCITE BASE 800.000
EMULSION 7B 75.000
GLASSINE 25.0OO
CR-39 600.000
GLASSINE 25.000
EMULSION 7B 75.000
LUCITE BASE 800.000
EMULSION 7B 75.000
GLASSINE 25.000
HRH-HR8 #2 3,500.000
G74 --
P65..--.--.---* i.'
.'
G7S --
P66_**i
G76 --
LIOG77 --
P67--------*,I
.i
G78---- !
CR10(P68)E16G79--
P69_*
G79A --
P70
ENO"PRo cp ..... l
DWIDER PLATE STAINLESS 3,175.000• . *m .. iI .= .i im .. u .m .. Jill ........ .i .i., .i .i .. I,*.*.:::::::::::::::::::::: :::::::::::::::::::::::::::::
............................. L
Myp.u.L..E. [
RUBBER SHIM Z,O00.0O0PLASTIC N-MONITOR #2 600.000
PLASTIC N-MONITOR #1 600.000
PLASTIC SHIM 8OO.OOOGS0- GLASSINE 25.000
COO----------* EMULSION 7B 200.000
* LUCITE BASE 300.000*: EMULSION 7B 200.000
*'151- CYCLE
G81 -- GLASSINE 25.000
LC1 LEAD 1,000.000
G82- GLASSINE 25.00O
X1A
X1BI
G83 --
CO1 *
X-RAY FILM
X-RAY FILM
GLASSINE
EMULSION 7BLUCITE BASE
220.00O
220.000
25.000
75.000
800.000
MASS HEIGHT mfp
g/cruZ pm %
0.005 128,44.0 0.005
0.029 128,415 0.022
0.059 128,340 0.136
0.029 127,540 0.022
0.005 127,465 0.0050.029 127,440 0.022
0.059 127,365 0.136
0.029 126,565 0.022
0.005 126,490 O.005
0.568 126,465 0.292
0.005 125,965 0.022
0.029 125,940 0.022
0.059 125,865 0.136
0.029 125,065 0.022
0.005 124,990 O.OOS
0.087 124,965 O. 1040.005 124,365 0.005
0.029 124,340 0.022
0.059 124,265 0.136
0.029 123,465 0.022
0.050 123,390 0.005
0.812 123,365 0.920
119,865
119,865
119,865
119,865
119,865119,865
2.449 119,865 1.894
116,690
116,690
116,690116,690
116,690
116,690
0.528 116,690 0.600
0.085 114,690 0.102
O.085 114,090 O. 1020.211 113,490 0.240
0.005 112,690 0.005
0.772 112,665 0.058
0.035 112,465 0.051
0.772 112,165 0.058
111,965
111,965
1 t 1,965
0.005 111,965 0.005
1.135 111,940 0.5850.0O5 110,940 0.0O5
11(),915
0.043 110,91S 0.032
0.043 110,695 0.032
0.005 110,475 0.0050.029 110,450 0.022
0.059 110,375 0.136
r.I. Sum mfp Sum r.I. Sum
% % % g/cm2
0.004 15.305 145.326 32.110
0.263 15.326 145.589 32.139
0.280 145.870 32.198
0.263
15.462
15.484 146.133 32.227
0.004 15.489 146.137 32.2320.263 15.511 146.400 32.261
0.280 15.647 146.680 32.320
0.263 15.668 146.943 32.349
0.004 15.673 146.947 32.354
8.910 15.966 155.857 32.921
0.263 15.987 156.120 32.926
0.263 16.009 156.383 32.955
0,280 16.145 156.663 33.014
16.166
16.171
0.263 156.927
156.9300.004
33.04333.048
0.215 16.275 157.145 33.135
0.004 16.281 157.149 33.1400.263 16.302 157.412 33.169
0.280 16.438 157.692 33.228
0.263 16.460 157.956 33.2570.004 16.465 157.959 33.307
5.466 17.385 163.426 34.119
17.385 163.426 34.119
t7.385 163.426 34.119
17.385 163.426 34.119
17.385 163.426 34.119
17.385 163.426 34.119
17.385 163.426 34.119
18.053 19.279 181.479 36.$68
19.279 181.479 36.568
19.279 181.479 36.568
19.279 181.479 36.568
19.279 181.479 36.568
19.279 181.479 36.56819.279 181.479 36.568
3.520 19.879 184.999 37.096
0.210 19.981 185.209 37.181
0.210 20.083 185.419 37.266
1.408 20.322 186.828 37.4770.004 20.327 186.832 37.482
0.702 20.385 187.533 38.254
0.105 20.436 167.638 38.290
0.702 20.494 188.340 39.062
20.494 188.340 39.06220.494 188.340 39.062
20.494 188.340 39.062
0.004 20.499 188.344 39.067
17.820 21.083 206.163 40.202
0.004 21.088 206.167 40.207
21.088 206.167 40.207
0.392 21.121 206.559 40.250
0.392 21.153 206.951 40.293
0.004 21.158 206.955 40.298
0.263 21.179 207.218 40.327
0.280 21.315 207.498 40.386
Page 7
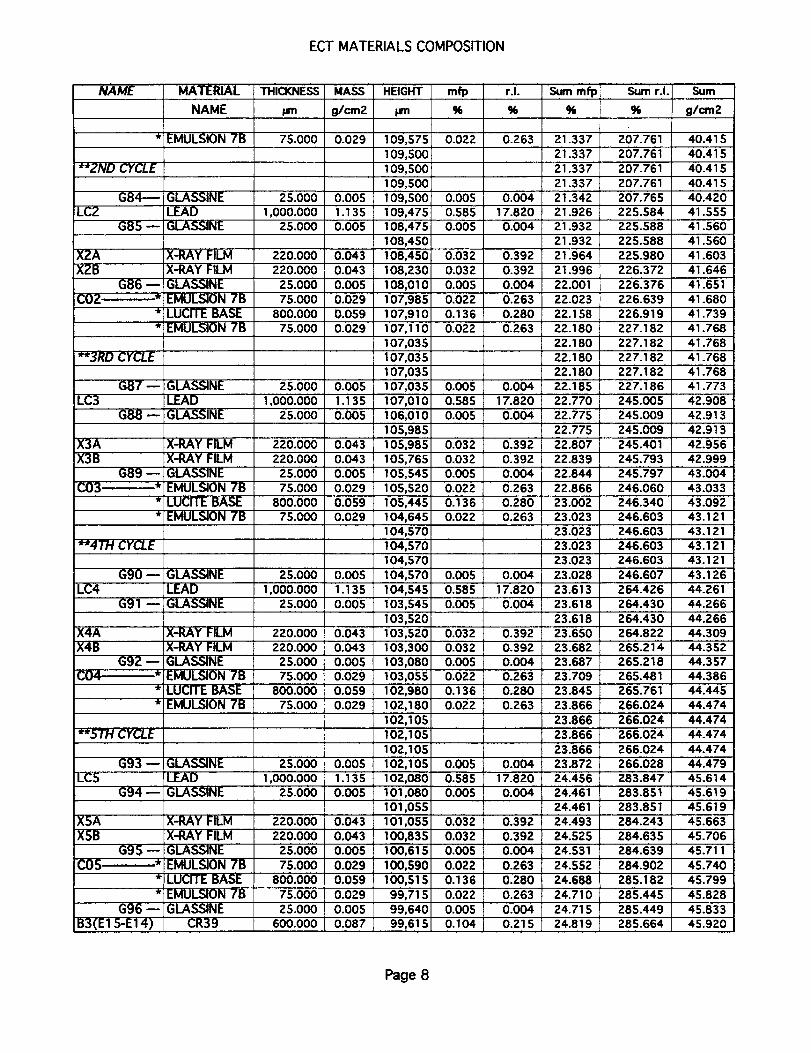
ECTMATERIALS COMPOSITION
NAME
**ZND CYCLE
G84---
LCZ
G85
XZA
XZB
G86 --
COZ *
**3RD CYCLE
LC3
X3A
X3B
G87
G88--
G89CO3 ' *
**4TH CYCLE
LC4
X4A
X4B
G90 --
G91 --
**STH CYCLE
G93
LC5G94 --
XSA
X5B
G95 --
C05 *
G96 --
B3(E1 5-E14)
MATERIAL THICKNESS
NAME pm
EMULSION 7B
GLASSINE
LEAD
GLASSINE
X-RAY FILM
X-RAY FILM
GLASSINE
EMULSION 7B
LUCITE BASE
EMULSION 7B
GLASSINE
LEADGLASSINE
X-RAY FILM
X-RAY FILM
GLASSINE
EMULSION 7B
LUCITE BASE
EMULSION 7B
GLASSINE
LEAD
GLASSINE
X-RAY FILM
X-RAY FILM
GLASSINE
EMULSION 7B
LUCITE BASEEMULSION 7B
GLASSINE
LEAD
GLASSINE
X-RAY FILM
X-RAY FILM
GLASSINE
EMULSION 7B
LUCITE BASE
EMULSION 7B
GLASSINE
CR39
75.000
25.000
1,000.000
25.000
220.000220.000
25.000
75.000800.000
75.000
25.000
1,000.000
25.000
220.000
220.000
25.0007s.ooo
800.000
75.000
25.000
1,000.00025.000
220.000220.000
25.000
75.000
800.000
75.000
25.000
1,000.00025.000
220.000
220.000
25.000
75.000
800.000
7s.ooo!
25.000,600.000
MASS
g/cm2
0.029
0.005
1.135
0.005
0.043
0.043
0.005
0.029
0.0590.029
0.005
1.135
0.005
0.043
0.043
0.005
0.0290.059
0.029
0.005
1.135
0.005
0.0430.043
0.005
0.029
0.059
0.029
0.005
1.135
O.O05
0.043
0.043
0.005
0.029
0.059
0.029
0.005
0.087
HEIGHT mfp r.I.
pm % %
109,575 0.022 0.263
109,500
109,500
109,500
109,500 0.005 0.004
109,475 0.585 17.820
108,475 0.005 0.004108,450
108,450 0.032 0.392
108,230 0.032 0.392
108,010 0.005 0.004
107,985 0.022 0.263
107,910 0.136 0.280
107,110 0.022 0.263
107,035
107,035
107,035
107,035 0.005 0.004
107,010 0.585 1 _820106,010 0.005 0.004
105,985
105,985 0.032 0.392
105,765 0.032 0.392
105,545 0.005 0.004
105,520 0.022 0.263
105,445 0.136 0.280
104,645 0.022 0.263
104,570
104,570104,570
104,570 0.005 0.004
104,545 0.585 17.820103,545 0.005 0.004
103,520
103,520 0.032 0.392
103,300 0.032 0.392
103,080 0.005 0.004
103,055 0.022 0.263102,980 0.136 0.280
102,180 0.022 0.263
102,105
102,105
I02,105102,105 0.005 0.004
102,080 0.585 17.820
101,080 0.005 0.004
101,055
101,055 0.032 0.392
100,835 0.032 0.392
100,615 0.005 0.004
100,590 0.022 0.263
100,515 0.136 0.280
99,715 0.022 0.263
99,640 0.005 0.004
99,615 0.104 0.215
Sum mfp
%
21.337
21.33721.337
21.337
21.342
21.926
21.93221.932
2t.96421.996
22.001
22.023
22.15822.180
22.180
22.180
22.180
22.185
22.770
22.775
22.775
22.807
22.839
22.84422.866
23.002
23.023
23.023
23.023
23.023
23.028
23.613
23.618
23.618
23.65023.682
23.687
23.709
23.845
23.866
23.866
23.866
23.866
23.872
24.45624.461
24.461
24.493
24.525
24.531
24.552
24.688
24.710
24.715
24.819
Sum r.l.
96
207.761
207.761
207.761
207.761
207.765
225.584
225.588225.588
225.980
226.372
226.376
226.639226.919
227.182
227.182
227.182
227.182
227.186
245.005245.009
245.009245.401
245.793245.797
246.060246.340
246.603
246.603
246.603
246.603
246.607264.426
264.430
264.430264.822
265.214
265.218
265.481
265.761
266.024
266.024
266.024
266.024
266.028
283.847283.851
283.851
284.243
284.635
284.639
284.902
285.182
285.445
285.449
285.664
Sum
glcm2
40.415
40.415
40.415
40.415
40.420
41.555
41.56041.560
41.603
41.646
41.651
41.680
41.739
41.768
41.768
41.768
41.768
41.773
42.908
42.913
42.91342.956
42.99943.004
43.033
43.092
43.121
43.121
43.121
43.121
43.12644.261
44.266
44.266
44.30944.352
44.357
44.386
44.44544.474
44.474
44.474
44.47444.479
45.61445.619
45.619
45.663
45.706
45.711
45.740
45.799
45.828
45.833
45.920
Page 8
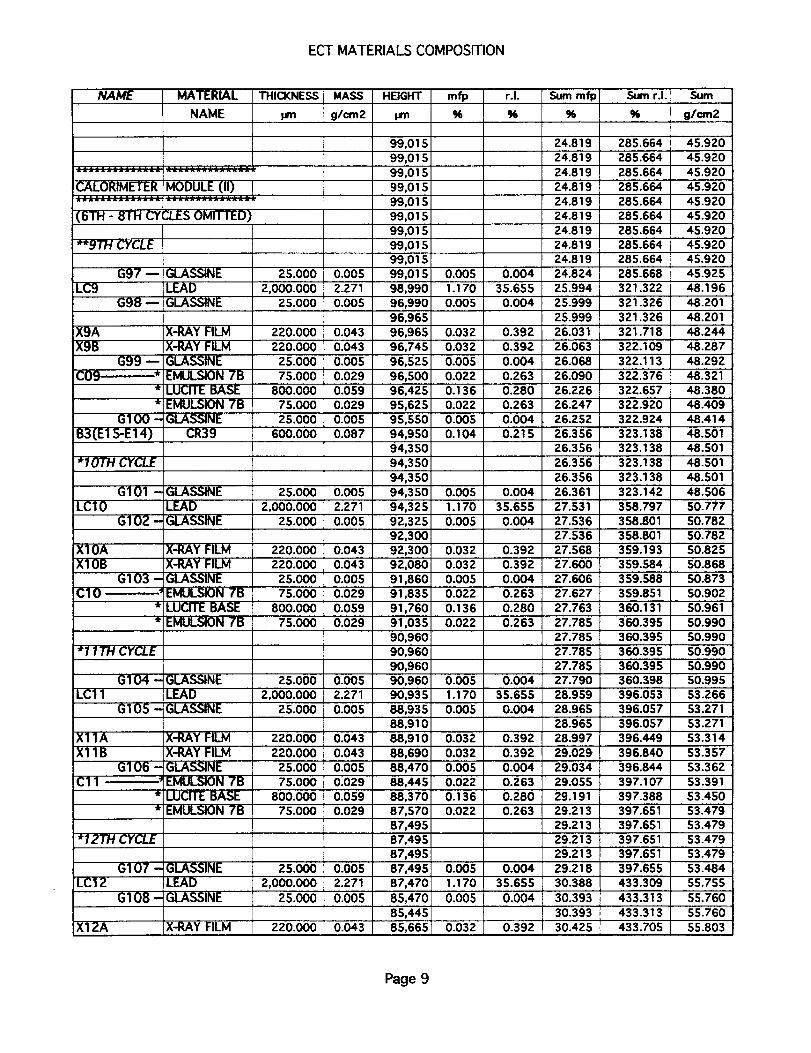
ECT MATERIALS COMPOSITION
NAME MATERIAL THICKNESS
NAME pm
L.O 'MR.!MODULE(.'!)...L(6TH - 8TH CYCLES OMITTED)
**9THCYCLE
G97
LC9
G98
X9A
X9B
G99 --
C09 *_r
W
GIO0 -
B3(E1 S-E14)
* 10TH CYCLE
G101 -
LC10GIOZ -
X10A
X10B
G103 -
C10
*11THCYCLE
G104 -
LCll
G105 -
X11A
X11BG106 -
C1 1
*1ZTH CYCLE
!GLASSINE
I LEADIGLASSINE
X-RAY FILM
X-RAY FILM
GLASSINE
EMULSION 7B
LUCITE BASE
EMULSION 7B
GLASSINECR39
GLASSINE
LEAD
GLASSINE
X-RAY FILM
X-RAY FILM
GLASSINE
EMULSION 7BLUCITE BASE
EMULSION 7B
GLASSINE
LEAD
GLASSINE
X-RAY FILM
X-RAY FILM
GLASSINE
EMULSION 7B
LUCITE BASE
EMULSION 7B
ILC12
G107 - GLASSINE
LEAD
G108 - GLASSINE
X12A X-RAY FILM
25.000
2,000.00025.000
220.000
220.00025.000
75.000
800.000
75.000
25.000
600.000
25.000
2,000.00025.000
220.000
220.000
25.000
75.000
800.000
75.O00
25.000
2,000.00025.000
220.000
220.000
25.00075.000
800.000
75.O0O
25.000
2,000.000
25.000
220.000
MASS
g/cm2
0.005
2.271
0.005
0.043
0.043
0.005
0.0290.059
0.029
0.005
0.087
0.005
2.271
0.005
0.043
0.043
0.005
0.029
0.059
0.029
0.005
2.271
0.005
0.043
0.043
0.0050.029
0.059
0.029
0.005
2.271
0.005
0.043
HEIGHT mfp
pm
99,015
99,015
99,015
99,015
99,015
99,015
99,01599,015
99,015
99,015 0.005
98,990 1.170
96,990 0.005
96,965
96,965 0.032
96,745 0.032
96,525 0.005
96,500 0.022
96,425 0.136
95,625 0.02295,550 0.005
94,950 0.104
94,350
94,350
94,350
94,350 0.005
94,325 1.170
92,325 0.005
92,300
92,300 0.032
92,080 0.03291,860 0.005
91,835 0.022
91,760 0.13691,035 0.022
90,960
90,960
90,960
90,960 0.005
90,935 1.17088,935 0.005
88,91o88,910 0.032
88,690 0.032
88,470 0.005
88,445 0.022
88,370 0.136
87,570 0.022
87,49587,495
87,495
87,495 0.005
87,470 1.170
85,470 0.005
85,44585,665 0.032
r.I. Sum mfp Sum r.I. Sum
% % % g/om2
24.819 285.664 45.920
24.819 285.664 45.920
24.819 285.664 45.920
24.819 285.664 45.920
24.819 285.664
24.819 285.664
45.92045.920
24.819 285.664 45.92024.819 285.664 45.920
24.819 285.664 45.920
0.004 24.824 285.668 45.925
35.655 25.994 321.322 48.196
0.004 25.999 321.326 48.201
25.999 321.326 48.201
0.392 26.031 321.718 48.244
0.392 26.063 322.109 48.287
0.004 26.068 322.113 48.292
0.263 26.090 322.376 48.321
0.280 26.226 322.657 48.380
0.263 26.247 322.920 48.409
0.004 26.252 322.924 48.414
0.215 26.356 323.138 48.50126.356 323.138 48.501
26.356 323.138 48.501
26.356 323.138 48.501
0.004 26.361 323.142 48.506
35.655 27.531 358.797 50.7770.004 27.536 358.801 50.782
27.536 358.801 50.782
0.392 27.568 359.193 50.825
0.392 27.600 359.584 50.868
0.004 27.606 359.588 50.873
0.263 27.627 359.851 50.902
27.763
27.78527.785
27.785
0.280 360.131360.395
360.395
50.961
0.263
27.785
50.99050.990
360.395 50.990
360.395 50.990
0.004 27.790 360.398 50.995
35.655 28.959 396.053 53.266
0.004 28.965 396.057 53.27128.965 396.057 53.271
0.392 28.997 396.449 53.314
0.392 29.029 396.840 53.357
0.004 29.034 396.844 53.3620.263 29_55 397.107 53.391
0.280 29.191 397.388 53.450
0.263 29.213 397.651 53.479
29.213 397.651 53.479
29.213 397.651 53.47929.213 397.651 53.479
0.004 29.218 397.655 53.484
35-655 30.388 433.309 55.755
0.004 30.393 433.313 55.760
30.393 433.313 55.760
0.392 30.425 433.705 55.803
Page 9
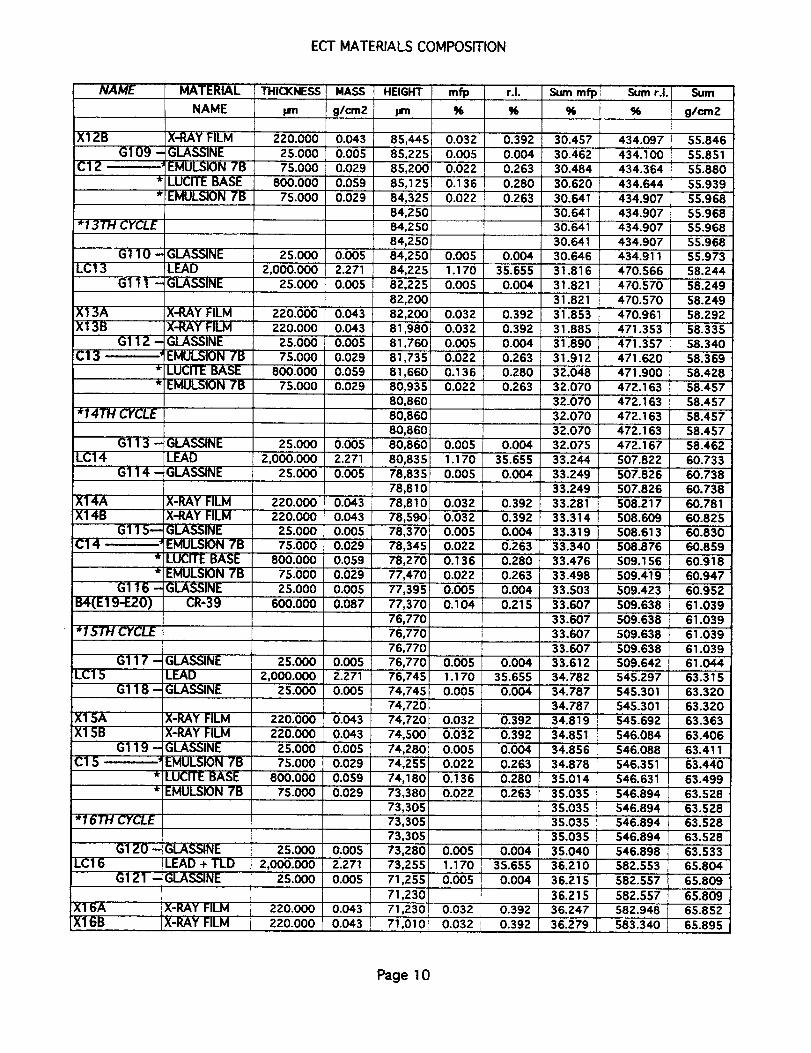
ECTMATERIALSCOMPOSITION
NAME MATERIAL THICKNESS
NAME prn
Xl 2B
G109 -
C1 Z __
! *13TH CYCLE
G110-LC13
Glll -
Xl 3A
X13B
G112 -
C13
*14TH CYCLE
G113 -
LC14
G114-
X14A
X14B
Gl15--C14 -. "_
"/t
G116 -
B4(E 19-E20)
*1._ IH CYCLE
LC1 5
X1 5AX1 5B
G117 -
G118 -
G119 -
C1S
*16TH CYCLE
LC16
X1 6A
Xl 6B
G1 20 -
G121 -
X-RAY FILM
GLASSINE
EMULSION 7B
LUCITE BASE
EMULSION 7B
GLASSINELEAD
GLASSINE
X-RAY FILMX-RAY FILM
GLASSINE
EMULSION 7B
LUCITE BASE
EMULSION 7B
GLASSINE
LEAD
GLASSINE
X-RAY FILM
X-RAY FILM
GLASSINE
EMULSION 7B
LU_H_" BASE
EMULSION 7B
GLASSINE
CR-39
GLASSINE
LEAD
GLASSINE
X-RAY FILMX-RAY FILM
GLASSINE
EMULSION 7B
LUCI_ BASE
EMULSION 7B
GLASSINE
LEAD + TLD
GLASSINE
X-RAY FILM
X-RAY FILM
MASS HEIGHT
g/cm2 Irn
220.000 0.043 85,445
25.000 0.005 85,225
75.000 0.029 85,200
800.000 0.059 85,125
75.000 0.029 84,325
84,250184,2501
84,25025.000 0.005 84,250
2,000.000 2.271 84,225
25.000 0.005 82,225
82,200
220.000 0.043 82,200
220.000 0.043 81,980
25.000 0.005 81,760
75.000 0.029 81,735
800.000 0.059 81,660
75.000 0.029 80,935
80,860
80,86080,860
25.000 0.005 80,860
2,000.000 2.271 80,835
25.000 0.005 78,835
78,810
220.000 0.043 78,810
220.000 0.043 78,590
25.000 0.005 78,370
75.000 0.029 78,345800.000 0.059 78,270
75.000 0.029 77,470
25.000 0.005 77,395
600.000 0.087 77,370
76,770
76,770
76,770
25.000 0.005 76,770
2,000.000 2.271 76,74525.000 0.005 74,745
74,720220.000 0.043 74,720
220.000 0.043 74,500
25.000 0.005 74,280
75.000 0.029 74,255
800.000 0.059 74,180
75.000 0.029 73,380
73,305
73,30573,305
25.000 0.005 73,280
2,000.000 2.271 73,255
25.000 O.OOS 71,255
71,230220.000 0.043 71,230
I 220.000 0.043 71,010
mf_
%
0.032
0.005
o_o220.136
0.022
0.0051.170
0.005
0.032
0.032
0.0050.022
0.136
0.022
0.005
1.170
0.005
0.0320.032
0.005
0.022
0.136
0.022
0.005
0.104
0.0051.170
0.005
0.032
0.032
0.005
0.022
0.136
0.022
0.005
1.170
0.005
0.032
0.032
r.I. Sum mfp sum r.I. Sum
% % % g/cruZ
0.392 30.457 434.097 55.846
0.004 30.462 434.100 55.851
0.263 30.484 434.364 55.880
0.280 30.620 434.644 55.939
0.263 30.641 434.907 55.968
30.641 434.90730.641 434.907
30.641 434.907
55.968
55.968
55.9680.004 30.646 434.911 55.973
35.655 31.816 58.244470.566
470.5700.004 31.821 58.249
58.249
509.156
31.821 470.570
0.392 31.853 470.961 58.292
0.392 31.885 471.353 58.335
0.004 31.890 471.357 58.340
0.263 31.912 471.620 58.369
0.280 32.048 471.900 58.428
0.263 32.070 472.163 58.457
32.070 472.163 58.457
32.070 472.163 58.457
32.070 472.163 58.4570.004 32.075 472.167 $8.462
35.655 33.244 507.822 60.733
0.004 33.249 507.826 60.73833.249 507.826 60.738
0.392 33.281 508.217 60.781
0.392 33.314 508.609 60.825
_004 33.319 508.613 60.830
0.263 33.340 508.876 60.8590.280 33.476
33.4980.263 509.41960.91860.947
0.004 33.503 509.423 60.952
0.215 33.607 509.638 61.039
33.607
33.607
509.638
509.638
509.638
509.642
545.297545.301
33.607
33.612
34.78234.787
0.00435.655
0.004
61.039
61.03961.039
61.044
63.315
63.320
34.787 545.301 63.3200.392 34.819 545.692 63.363
0.392 34.851 546.084 63.406
0.004 34.856 546.088 63.411
0.263 34.878 546.351 63.440
546.6310.280
0.263 546.894
546.894
35.014
35.035
35.035
35.035 546.894
35.035 546.894
63.499
63.528
63.528
63.528
63.528
0.004 35.040 546.898 63.533
35.655 36.210 582.553 65.804
0.004 36.215 582.557 65.809
0.39236.21536.247
582.557
582.948
65.809
65.852
0.392 36.279 583.340 65.895
Page 10
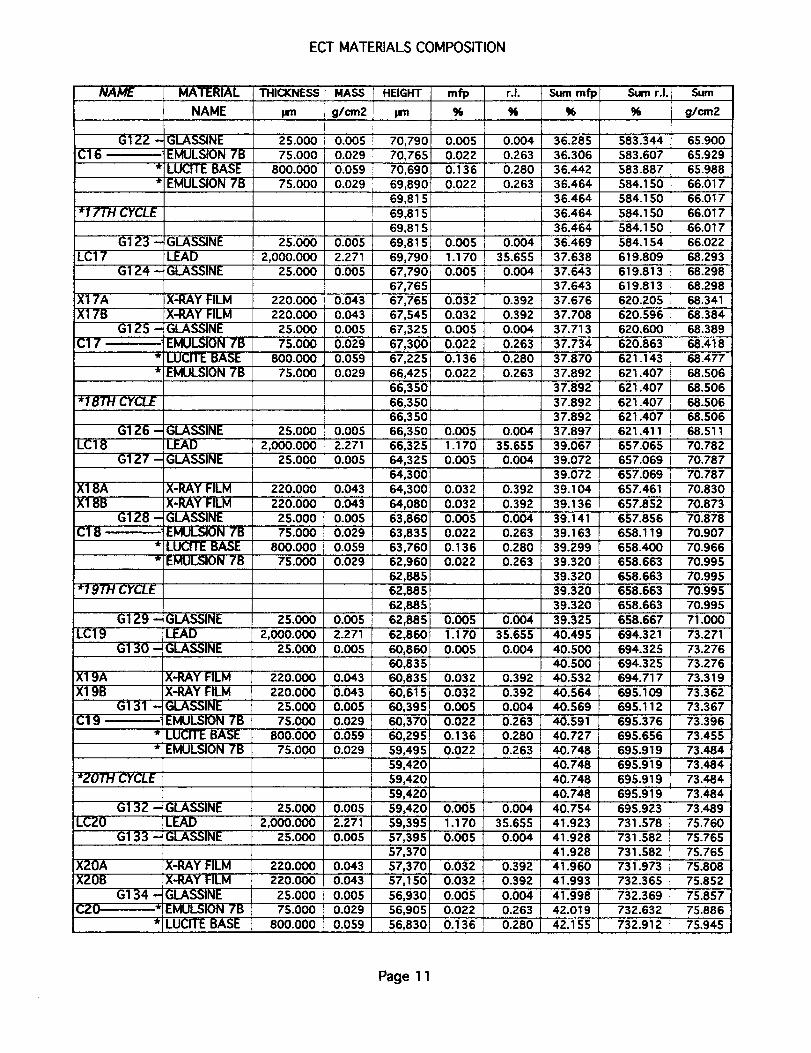
ECI" MATERIALS COMPOSITION
C16 -
NAME MATERIAL THICKNESS
NAME pm
G122 -
* 17TH CYCLE
LC17
X17A
X17B
G123 -
G124 -
G125 --
C17 _-'
*18TH CYCLE
LC18
X18A
X18B
.!
C18
G1 Z6 -
G127 -
G128
"I 9TH CYCLE
G129 -
LC19
G130 -
X19A
X19B
G131 -C19 ....
*20TH CYCLE
G132 -ILCZ0
G1 33 -
GLASSINE
EMULSION 7B
LUCITE BASEEMULSION 7B
GLASSINE
LEAD
GLASSINE
X-RAY FILM
X-RAY FILM
GLASSINE
EMULSION 7B
LUCITE BASE
EMULSION 7B
GLASSINE
LEAD
GLASSINE
X-RAY FILM
X-RAY FILM
GLASSINE
EMULSION 7B
LUCITE BASEEMULSION 7B
I GLASSINE
LEAD
GLASSINE
X-RAY FILM
X-RAY FILM
GLASSINEEMULSK)N 7B
LUCITE BASE
EMULSION 7B
GLASSINE
LEAD
GLASSINE
XZOA X-RAY FILM
XZOB X-RAY FILM
G134 - GLASSINE
C20 * EMULSION 7B
• LUCITE BASE
25.000
75.000
800.000
75.000
25.000
2,000.0OO
25.000
220.000
220.000
25.000
75.000
800.000
75.000
25.000
2,000.00025.000
220.000
220.000
25.000
75.000
800.000
75.000
25.00O
2,000.000
25.000
220.000
220.000
25.000
75.000800.000
75.000
25.000
2,O00.00025.000
220.000220.000
25.00075.000
800.000
MASS
g/cm2
0.005
0.029
0.059
0.029
0.005
2.271
0.005
0.043
0.043
0.005
0.029
0.059
0.029
0.005
2.271
0.005
0.043
0.043
0.005
0.029
0.059
0.029
0.005
2.271
0.005
0.043
0.043
0.005
0.0290.059
0.029
0.005
2.271
0.005
0.0430.043
0.0050.029
0.059
HEIGHT mfp
pm %
70,790 0.005
70,765 0.022
70,690 0.136
69,890 0.022
69,815
69,81569,815
69,815 0.O05
69,790 1.17067,790 0.005
67,765
67,765 0.032
67,545 0.032
67,325 0.005
67,300 0.022
67,225 0.136
66,425 0.022
66,350
66,35066,350
66,350 0.005
66,325 1.170
64,325 0.005
64,300
64,300 0.032
64,080 0.032
63,860 0.005
63,835 0.022
63,760 0.13662,960 0.022
62,885
62,885
62,885
62,885 0.005
62,860 1.170
60,860 0.005
60,835
60,835 0.032
60,615 0.03260,395 0.005
60,370 0.02260,295 0.136
59,495 0.022
59,420
59,420
59,420
59,420 0.005
59,395 1.170
57,395 0.00557,370
57,370 0.032
57,150 0.032
56,930 0.00556,905 0.022
56,830 0.136
r.I. Surn mfp Sum r.I. Sum
_ _ g/cm2
0.004 36.285 583.344 65.900
0.263 36.306 583.607 65.929
0.280 36.442 583.887 65.988
0.263 36.464 584.150 66.017
36.464 584.150 66.017
36.464 584.150 66.017
36.464 584.150 66.017
0.004 36.469 584.154 66.022
35.655 37.638 619.809 68.293
0.004 37.643 619.813 68.29837.643 619.813 68.298
0.392 37.676 620.205 68.341
0.392 37.708 620.596 68.384
0.004 37.713 620.600 68.389
0.263 37.734 620.863 68.418
0.280 37.870 621.143 68.477
0.263 37.892 621.407 68.506
37.892 621.407 68.506
37.892 621.407 68.506
37.892 621.407 68.506
0.004 37.897 621.411 68.511
35.655 39.067 657.065 70.7820.004 39.072 657.069 70.787
39.072 657.069 70.787
0.392 39.104 657.461 70,8300.392 39.136 657.852 70.873
0.004 39.141 657.856 70.878
0.263 39.163 658.119 70.907
0.280 39.299 658.400 70.966
0.263 39.320 658.663 70.995
39.320 658.663 70.995
39.320 658.663 70.99539.320 658.663 70.995
0.004 39.325 658.667 71.000
35.655 40.495 694.321 73.271
0.004 40.500 694.325 73.27640.500 694.325 73.276
0.392 40.532 694.717 73.319
0.392 40.564 695.109 73.362
0.004 40.569 695.112 73.367
0.263 40.591 695.376 73.396
0.280 40.727 695.656 73.455
0.263 40.748 695.919 73.48440.748 695.919 73.484
40.748 695.919 73.484
40.748 695.919 73.484
0.004 40.754 695.923 73.489
35.655 41.923 731.578 75.760
0.004 41.928 731.582 75.765
41.928 731.582 75.765
0.392 41.960 731.973 75.808
0.392 41.993 732.365 75.852
0.004 41.998 732.369 75.857
0.263 42.019 732.632 75.886
0.280 42.155 732.912 75.945
Page 1 1
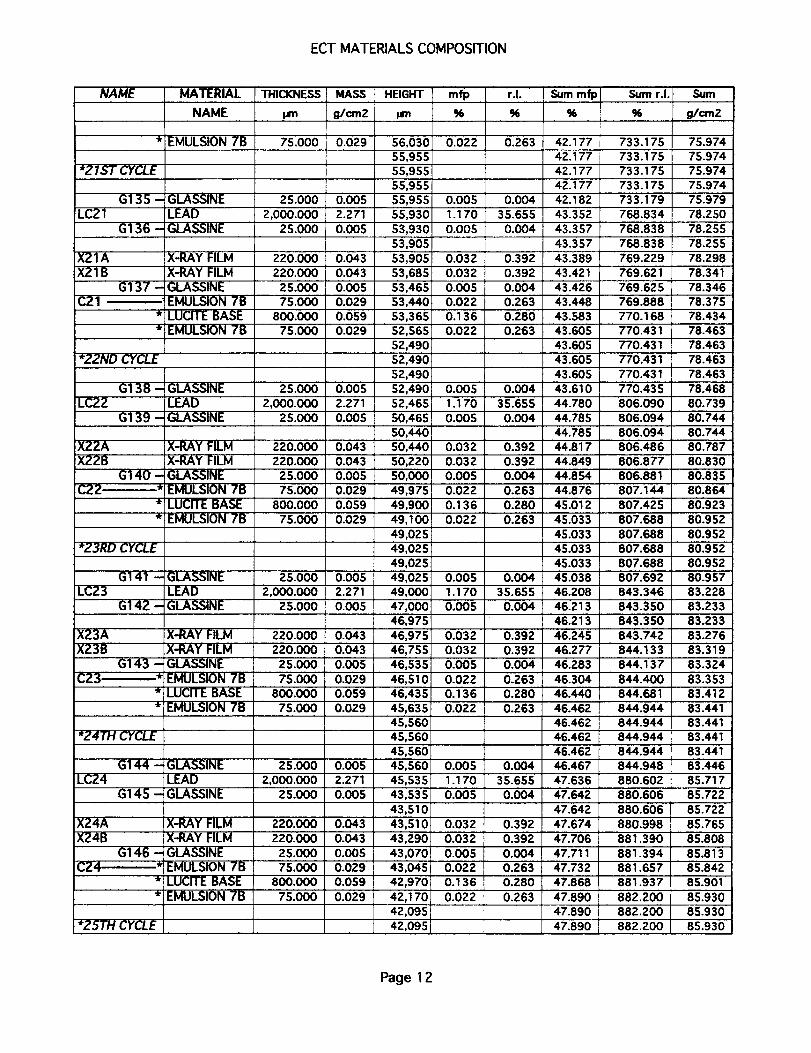
ECT MATERIALS COMPOSITION
NAME MATERIAL THICKNESS
NAME pm
*ZIST CYCLE
G135 -
LC21
G136 -
X21A
XZ1 BG137 -
C21
EMULSION 7B
GLASSINE
LEAD
GLASSINE
X-RAY FILM
X-RAY FILM
GLASSINE
EMULSION 7B
LUCITE BASE
EMULSION 7B
*ZZND CYCLE
LC22
X22A
XZ2B
CZZ
G138 - GLASSINE
LEAD
G139 - GLASSINE
X-RAY FILM
X-RAY FILM
G140 - GLASSINE
* EMULSION 7B
* LUCITE BASE
* EMULSION 7B
*23RD CYCLE
G141 -
LC23
G142 -
XZ3A
XZ3B
G143 -
C23 *
*24TH CYCLE
G144 -
LC24
G145 -
XZ4A
X24B
G146 -C24 *
,!
*257" CYCLE
GLASSINE
LEAD
GLASSINE
X-RAY FILM
X-RAY FILM
GLASSINE
EMULSION 7BLUCITE BASE
EMULSION 7B
GLASSINE
LEAD
GLASSINE
X-RAY FILMX-RAY FILM
GLASSINE
EMULSION 7B
LUCITE BASEEMULSION 7B
MASS HEIGHT mfp
g/cm2 _n %
75.000 0.029 56,030 0.022
55,955
55,955
55,95525.000 0.005 55,955 0.005
2,000.000 2.271 55,930 1.1 70
25.000 0.005 53,930 0.OO5
53,905
220.000 0.043 53,905 0.032220.000 0.043 53,685 0.032
25.000 0.005 53,465 0.005
75.000 0.029 53,440 0.022
800.000 0.059 53,365 0.136
75.000 0.029 52,565 0.022
52,490
52,49052,490
25.000 0.005 52,490 0.005
2,000.000 2.271 52,465 1.1 70
25.000 0.005 50,465 0.O05
50,440
220.000 0.043 50,440 0.032220.000 0.043 50,220 0.032
25.000 0.005 50,000 0.005
75.000 0.029 49,975 0.022
800.000 0.059 49,900 0.136
75.000 0.029 49,100! 0.022
49,02549,025]
49,025
25.000 0.005 49,025 0.005
2,000.OO0 2.271 49,000 1.1 70
25.000 0.005 47,000 0.005
46,975
220.000 0.043 46,975 0.032
220.000 0.043 46,755 0.032
25.000 0.005 46,535 0.OO5
75.000 0.029 46,510 0.022
800.000 0.059 46,435 0.136
75.000 0.029 45,635 0.02245,560
45,560
45,560
25.000 0.005 45,560 0.0052,000.000 2.271 45,535 1.1 70
25.000 0.005 43,535 0.005
43,510
220.000 0.043 43,510 0.032220.000 0.043 43,290 0.032
25.000 0.005 43,070 0.005
75.000 0.029 43,045 0.022
800.000 0.059 42,970 0.136
75.000 0.029 42,170 0.02242,095
42,095
r.I. Sum mfp Sum r.I. Sum
% % % g/crn2
0.263 42.177 733.175 75.974
42.177 733.175 75.974
42.177 733.175 75.974
42.177 733.175 75.974
0.004 42.182 733.179 75.979
35.655 43.352 768.834 78.250
0.004 43.357 768.838 78.25543.357 768.838 78'.255
0.392 43.389 769.229 78.298
0.392 43.42t 769.621 78.341
0.004 43.426 769.625 78.3460.263 43.448 769.888 78.375
0.280 43.$83 770.168 78.434
0.263 43.605 770.431 78.463
43.605 770.431 78.463
43.605 770.431 78.463
43.605 770.431 78.463
0.004 43.610 770.435 78.468
35.655 44.780 806.090 80.7390.004 44.785 806.094 80.744
44.785 806.094 80.7440.392 44.817 806.486 80.787
0.392 44.849 806.877 80.830
0.004 44.854 806.881 80.835
0.263 44.876 807.144 80.8640.280 45.012 807.425 80.923
0.263 45.033
45.033
45.033
807.688
807.688
807.688
45.033 807.688
0.004 45.038 807.69235.655 46.208 843.346
80.952
80.952
80.952
80.952
80.95783.228
0.004 46.213 843.350 83.233
46.213 843.350 83.233
0.392
0.3920.004
0.263
0.280
0.263
0.004
46.245
46.277
46.283
46.304
46.440
46.462
46.462
46.462
46.46246.467
47.636
47.642
47.642
47.674
47.706
47.711
47.732
47.868
47.890
47.890
47.890
35.655
0.004
0.392
843.742
844.133
844.137
844.400
844.681
844.944
844.944844.944
844.944
844.948
880.602
880.606
880.606
880.998
881.390
881.394
881.657
881.937
882.200
882.200
882.200
0.392
0.004
0.263
0.280
0.263
83.276
83.319
83.324
83.353
83.412
83.441
83.44183.441
83.441
83.446
85.717
85.722
85.722
85.765
85.808
85.813
85.842
85.901
85.930
85.930
85.930
Page 12
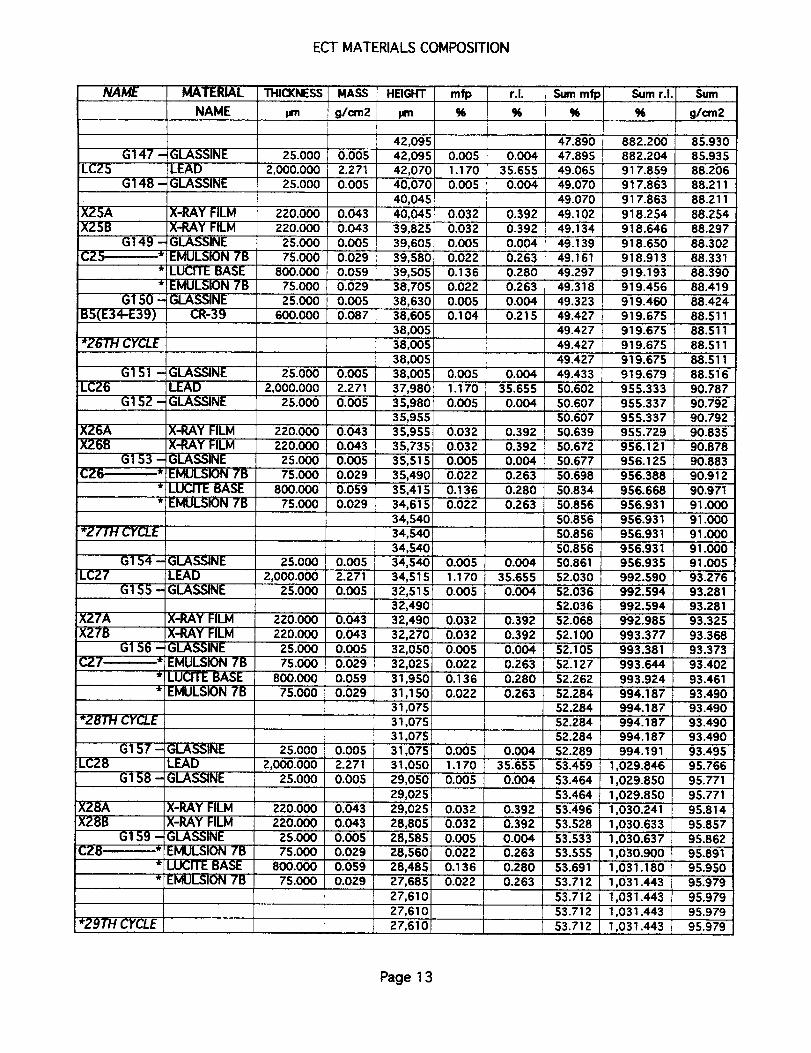
ECT MATERIALS COMPOSITION
NAME MATERIAL
NAME
G147 - GLASSINE
LC25 LEADG148 - GLASSINE
XZSA X-RAY FILM
X25B X-RAY FILM
G149 - GLASSINECZ5' * EMULSION 7B
• LUCITE BASE
• EMULSION 7B
G150 - GLASSINE
BS(E34"E39) CR-39
G1 51 - GLASSINE
LC26 LEADG1 52 -GLASSINE
X-RAY FILM
X-RAY FILM
GLASSINE
EMULSION 7B
• LUCITE BASE
• iEMULSION 7B
GLASSINE
LEAD
GLASSINE
X-RAY FILM
X-RAY FILM
GLASSINE
EMULSION 7B
LUCITE BASE
• EMULSION 7B
GLASSINE
LEAD
GLASSINE
X-RAY FILM
X-RAY FILMG1 59 - GLASSINE
• EMULSION 7B
• LUCITE BASE
• EMULSION 7B
*Z6TH CYCLE
XZ6A
XZ6B
G1 53 -
CZ6 *
*Z7"fH CYCLE
G1 54 -
LC27
G155-
XZ7AXZ7B
rIc27 G156-.
*28TH CYCLE
G157 -LCZ8
G158 -
X28AXZ8B
CZ8
THICKNESS MASS HEIGHT mfp
pm g/cm2 pm %
42,095
25.000 0.005 42,095 0.005
2,000.000 2.27l 42,070 1.170
25.000 0.005 40,070 0.005
40,045
220.000 0.043 40,045 0.032
220.000 0.043 39,825 0.032
25.000 0.005 39,605 0.005
75.000 0.029 39,580 0.022
800.000 0.059 39,505 0.136
75.000 0.029 38,705 0.02225.000 0.005 38,630 0.005
600.000 0.087 38,605 0.104
38,005
38,005
38,005
25.000 0.OO5 38,005 0.005
2,000.000 2.271 37,980 1.170
25.000 0.005 35,980 0.005
35,955
220.000 0.043 35,955 0.032220.000 0.043 35,735 0.032
25.000 0.005 35,515 0.005
75.000 0.029 35,490 0.022
800.000 0.059 35,415 0.136
75.000 0.029 34,615 0.022
34,54034,540
34,540
25.000 0.005 34,540 0.005
2,000.000 2.271 34,$15 1.1 70
25.000 0.005 32,515 0.00532,490
220.000 0.043 32,490 0.032
220.000 0.043 32,270 0.032
25.000 0.005 32,050 0.005
75.000 0.029 32,025 0.022
800.000 0.059 31,950 0.136
75.000 0.029 31,150 0.022
31,075
31,075
31,07525.000 0.005 31,075 0.005
2,000.000 2.271 31,050 1.1 70
25.000 0.005 29,050 0.005
29,025
220.000 0.043 29,025 0.032
220.000 0.043 28,8051 0.032
25.000 0.005 28,585 0.005
75.000 0.029 28,560 0.022
800.000 0.059 28,485 0.136
75.000 0.029 27,685 0.022
27,610
27,610
27,610*29TH CYCLE
r.I. Sum mfp Sum r.I. Sum
% % % g/cm2
47.890 882.200 85.930
0.004 47.895 882.204 85.935
35.655 49.065 917.859 88.2060.004 917.86349.070 88.211
49.070 917.863 88.211
0.392 49.102 918.254 88.2540.392 49.134 918.646 88.297
0.004 49.139 918.650 88.302
0.263 49.161 918.913 88.3310.280 49.297 919.193 88.390
0.263 49.318 919.456 88.419
0.004 49.323 919.460 88.424
0.215 49.427 919.675 88.511
49.427 919.675 88.511
49.427 919.675 88.511
49.427 919.675 88.511
0.004 49.433 919.679 88.516
35.655 50.602 955.333 90.787
0.004 50.607 955.337 90.792
50.607 955.337 90.7920.392 50.639 955.729 90.835
0.392 50.672 956.121 90.878
0.004 50.677 956.125 90.883
0.263 50.698 956.388 90.912
0.280 50.834 956.668 90.971
0.263 50.856 956.931 91.0OO
50.856 956.931 91.000
50.856 956.931 91.000
50.856 956.931 91.000
0.004 50.861 956.935 91.005
35.655 52.030 992.590 93.276
0.004 52.036 992.$94 93.28152.036 992.594 93.281
0.392 52.068 992.985 93.325
0.392 52.100 993.377 93.368
0.004 52.105 993.381 93.373
0.263 52.127 993.644 93.402
0.280 52.262 993.924 93.461
0.263 52.284 994.187 93.490
52.284 994.187 93.490
52.284 994.187 93.49052.284 994.187 93.490
0.004
35.655
994.191
1,029.846
52.289
53.459
93.495
1,030.241
95.766
0.004 53.464 1,029.850 95.771
53.464 1,029.850 95.7710.392 53.496 95.814
1,030.63353.5280.392
1,031.443
95.857
0.004 53.533 1,O30.637 95.8620.263 53.555 1,030.900 95.891
0.280 53.691 1,031.180 95.950
0.263 53.712 1,031.443 95.979
53.712 1,031.443 95.97953.712 95.979
53.712 !,031.443 95.979
Page 13
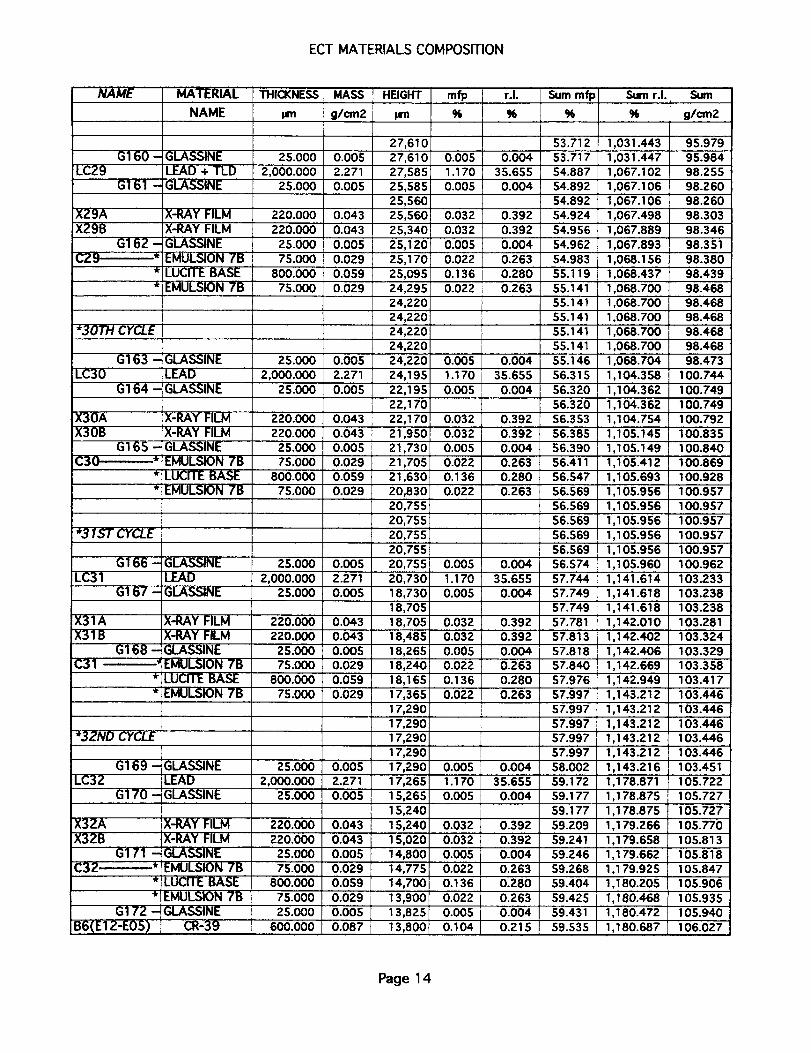
ECT MATERIALS COMPOSITION
NAME
G160
LCZ9
G161
XZ9AXZ9B
C29
X30A
X3OB
C30
MATERIAL
NAME
- GLASSINE
LEAD + TLD
- GLASSINE
X-RAY FILMX-RAY FILM
G162 - GLASSINE
* EMULSION 7B
* LUCITE BASE* EMULSION 7B
*30TH CYCLE
G163 - GLASSINE
LC30 LEAD
G164 - GLASSINE
X-RAY FILM
X-RAY FILM
G165 - GLASSINE* EMULSION 7B
* LUCITE BASE
* EMULSION 7B
*31ST CYCLE
G166 - GLASSINE
LC31 LEAD
G167 - GLASSINE
X31A X-RAY FILM
X31 B X-RAY FILM
G168 - GLASSINE
C31 ' * EMULSION 7B
• LUCITE BASE
• EMULSION 7B
• 3ZND CYCLE
LC32
X32A
X32B
C3Z
B6(E12-E05) ]
G169 - GLASSINE
LEAD
G170 - GLASSINE
X-RAY FILM
X-RAY FILM
G171 - GLASSINE
* EMULSION 7B
* LUCITE BASE
* LEMULSION 7BG172 _ GLASSINE
CR-39
THICKNESS MASS HEIGHT mfp
pm 9/cm2 prn %
27,610
25.000 0.005 27,610 0.0052,000.000 2.271 27,585 1.170
25.000 0.005 25,585 0.005
25,560
220.000 0.043 25,560 0.032
220.000 0.043 25,340 0.032
25.000 0.005 25, 120 0.005
75.000 0.029 25,170 0.022
800.000 0.059 25,095 0.136
75.000 0.029 24,295 0.022
24,220
24,22024,220
24,220
25.000 0.005 24,220 0.005
2,000.000 2.271 24,195 1.170
25.000 0.005 22,195 0.005
22,170
220.000 0.043 22,170 0.032
220.000 0.043 21,950 0.032
25.000 0.005 21,730 0.005
75.000 0.029 21,705 0.022800.000 0.059 21,630 0.136
75.000 0.029 20,830 0.022
20,755
20,755
20,755
20,755
25.000 O.OOS 20,755 0.005
2,000.000 2.271 20,730 1.170
25.000 O.OOS 18,730 0.005
18,705
220.000 0.043 18,705 0.032
220.000 0.043 18,485 0.03225.000 0.005 18,265 0.005
75.000 0.029 18,240 0.022
800.000 0.059 18,165 0.136
75.000 0.029 17,365 0.022
17,290
17,290
17,290
17,290
25.000 0.005 17,290 0.005
2,000.000 2.271 17,265 1.17025.000 0.005 15,265 O.005
15,240
220.000 0.043 15,240 0.032
220.000 0.043 15,020 0.03225.000 0.005 14,800 0.005
75.000 0.029 14,775 0.022
800.000 0.059 14,700 0.136
75.000 0.029 13,900 0.022
25.000 0.005 13,825 0.005
600.000 0.087 13,800 0.104
r.I. Sum mfp Sum r.I. Sum
% % g/cm2
53.712 1,031.443 95.9790.004 53.717 1,031.447 95.984
35.655 54.887 1,067.102 98.255
0.004 54.892 1,067.106 98.260
54.892 1,067.106 98.260
0.392 54.924 1,067.498 98.303
0.392 54.956 1,067.889 98.346
0.004 54.962 1,067.893 98.351
0.263 54.983 1,068.156 98.380
0.280 55.119 1,068.437 98.439
0.263 55.141 1,068.700 98.468
55.141 1,068.700 98.46855.141 1,068.700 98.468
55.141 1,068.700 98.468
55.141 1,068.700 98.468
0.004 55.146 1,068.704 98.473
35.655 56.315 1,104.358 100.744
0.004 56.320 1,104.362 100.749
56.320 1,1 04.362 100.749
0.392 56.353 1,104.754 100.792
0.392 56.385 1,105.145 100.835
0.004 56.390 1,105.149 100.840
0.263 56.411 1,105.412 100.869
0.280 56.547 1,105.693 100.9280.263 56.569 1,105.956 100.957
56.569 1,105.956 100.957
56.569 1,105.956 100.95756.569 1,105.956 100.957
56.569 1,105.956 100.957
0.004 56.574 1,105.960 100.962
35.655 57.744 1,141.614 103.233
0.004 57.749 1,141.618 103.238
57.749 1,141.618 103.238
0.392 57.781 1,142.010 103.281
0.392 57.813 1,142.402 103.3240.004 57.818 1,142.406 103.329
0.263 57.840 1,142.669 103.3580.280 57.976 1,142.949 103.417
0.263 57.997 1,143.212 103.446
57.997 1,143.212 103.446
57.997 1,143.212 103.446
57.997 1,143.212 103.446
57.997 1,143.212 103.446
0.004 58.002 1,143.216 103.451
35.655 59.172 1,1 78.871 105.722
0.004 59.177 1,1 78.875 105.727
$9.177 1,178.875 105.727
0.392 59.209 1,179.266 105.770
0.392 59.241 1,179.658 105.813
0.004 59.246 1,179.662 105.8180.263 59.268 1,1 79.925 105.847
0.280 59.404 1,180.205 105.906
0.263 59.425 1,180.468 105.935
0.004 59.431 1,180.472 105.940
0.215 59.535 1,180.687 106.027
Page 14
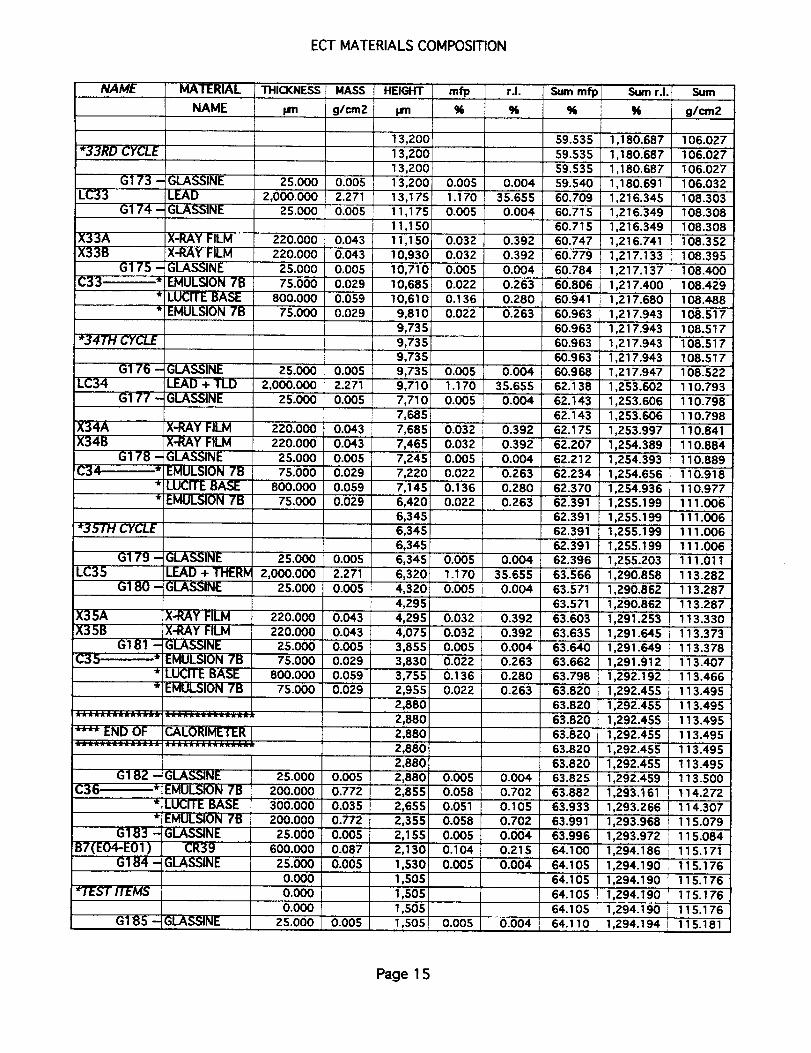
ECT MATERIALS COMPOSITION
NAME
*33RD CYCLE
G173 -
LC33
G174 -
X33AX33B
G175 -
C33 *
*34TH CYCLE
G176 -
LC34
G177 -
X34A
X34B
C34
MATERIAL THICKNESS
NAME prn
GLASSINE
LEAD
GLASSINE
X-RAY FILM
X-RAY FILM
GLASSINE
EMULSION 7B
LUCITE BASE
EMULSION 7B
GLASSINE
LEAD + TLD
GLASSINE
X-RAY FILM
X-RAY FILM
G178 - GLASSINE
* EMULSION 7B
* LLk.;11 I: BASE*EMULSION 7B
*35TH CYCLE
G179 -
LC35
G180 -
X35AX35B
G181 -
C35 *
GLASSINE
LEAD + THERIv
GLASSINE
X-RAY FILM
X-RAY FILM
GLASSINEEMULSION 7B
LUCI_ BASE
EMULSION 7B
_;;; END OF CALORIMEIkR.............................
G182 -C36 *
G183 -
B7(EO4-E01 )G184 -
*_ST GEMS
G185 -
GLASSINEEMULSION 7B
LUCITE BASE
EMULSION 7B
GLASSINE
CR39
GLASSINE
GLASSINE
25.000
2,000.00025.000
220.000220.000
25.000
75.000
800.00075.000
25.000
2,000.000
25.000
220.000
220.000
25.000
75.000800.000
75.000
25.000
2,000.000
25.000
220.000
220.00025.000
75.000
800.000
75.000
25.000
200.000
300.000
200.000
25.000
600.000
25.0OO
0.000
0.000
0.000
25.000
MASS
g/cm2
0.005
2.271
0.005
0.043
0.043
0.005
0.029
0.059
0.029
0.00S
2.271
0.005
0.043
0.043
0.005
0.029
0.059
0.029
0.005
2.271
0.005
0.043
0.0430.005
0.029
0.059
0.029
0.0050.772
0,035
0.772
0.005
0.087
0.005
0.005
HEIGHT mfp
pm %
13,200
13,200
13,20013,200 0.00S
13,175 1.170
11,175 0.005
11,150
11,150 0.032
10,930 0.032
10,710 0.005
10,685: 0.022
10,610i 0.1369_10 _ 0.022
9,735
9,7359,735
9,735 0.O05
9,710 1.170
7,710 0.005
7,685
7,685 0.032
7,465 0.032
7,245 0.005
7,220 O.022
7,145 0.1366,420 0.022
6,345
6,345
6,345
6,345 0.005
6,320 1.170
4,320 0.005
4,295
4,295 0.032
4,075 0.032
3,855 0.0053,830 0.022
3,755 0.136
2,955 0.022
2,880
2,880
2,880
2,880
2,8801
2,880 0.0052,855 0.058
2,655 0.051
2,355 0.058
2,155 0.005
2,130 0.104
1,$30 0.005
1,505
1,505
1,505
1,505 0.005
0.004
35.655
0.004
0.392
0.392
0.004
0.263
0.280
0.263
0.004
35.655
0.004
0.3920.392
0.0040.263
0.280
0.263
0.004
35.6550.004
0.3920.392
0.004
0.263
0.280
0.263
0.004
0.702
0.105
0.7020.004
0.21 S
0.004
0.004
r.I. Surn mfp
% %
59.535
59.535
59.535
59.540
60.709
60.715
60.715
60.74760.779
60.784
60.806
60.941
60.96360.963
60.963
60.963
60.968
62.138
62.143
62.143
62.175
62.207
62.212
62.23462.370
62.391
62.391
62.391
62.39162.396
63.566
63.57163.571
63.603
63.63563.640
63.662
63.798
63.820
63.820
63.820
63.82063.820
63.820
63.82563.882
63.933
63.991
63.996
64.100
64.105
64.105
64.105
64.105
64.110 i
Sum r.I. Sum
g/cm2
1,180.687 106.027
1,180.687 106.027
1,180.687 106.027
1,180.691 106.032
1,216.345 108.303
1,216.349 108.308
1,216.349 108.3081,216.741 108.352
1,217.133 108.395
1,217.137 108.400
1,217.400 108.429
1,217.680 108.488
1,217.943 108.517
1,217.943 108.517
1,217.943 108.517
1,217.943 108.517
1,217.947 108.522
1,253.602 110.793
1,253.606 110.798
1,253.606 110.798
1,253.997 110.841
1,254.389 110.8841,254.393 110.889
1,254.656 110.9181,254.936 110.977
1,255.199 111.006
1,255.199 111.O06
1,255.199 111.006
1,255.199 111.0061,255.203 111.011
1,290.858 113.282
1,290.862 113.2871,290.862 113.287
1,291.253 113.330
1,291.645 113.373
1,291.649 113.378
1,291.912 113.407
1,292.192 113.466
1,292.455 113.495
1,292.455 113.495
1,292.455 113.495
1,292.455 113.4951,292.455 113.495
1,292.455 113.4951,292.459 113.500
1,293.161 114.272
1,293.266 114.307
1,293.968 115.079
1,293.972 115.084
1,294.186 115.171
1,294.190 115.176
1,294.190 115.176
1,294.190 115.176
1,294.190 115.176
1,294.194 , 115.181
Page 1 5
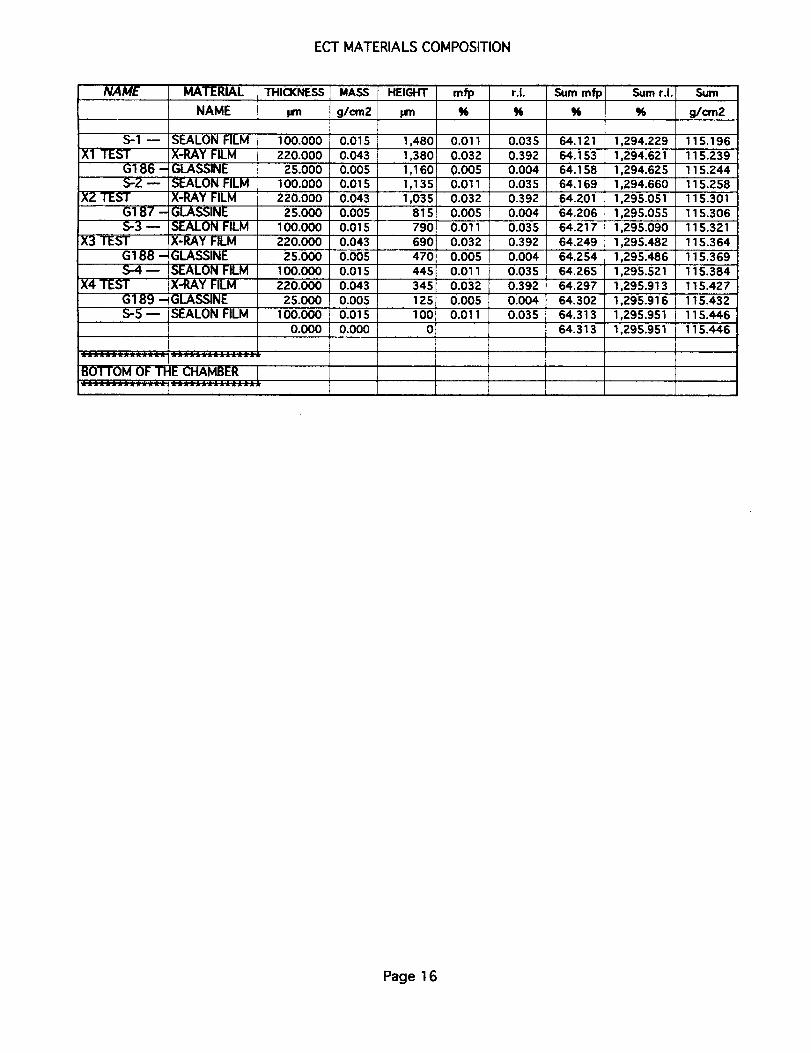
ECT MATERIALS COMPOSITION
NAME MATERIAL THICKNESS
NAME pm
_1--Xl TEST
G186 -S..Z m
X2 TESTG187 -.-S.-3--
X3 TESTG188 -S-4--
X4 TESTG189 -S.-S--
SEALON FILMX-RAY FILMGLASSINESEALON FILMX-RAY FILMGLASSINESEALONFILMX-RAY FILM!GLASSINE!SEALON FLMX-RAY FILMGLASSINESEALON FILM
'_¢;¢_¢¢_¢¢_
6° °M OF C M6ER L
MASS HEIGHT mfp
g/cm2 pm %
100.000 0.01S 1,480 0.011
220.000 0.043 1,380 0.032
25.000 0.005 1,160 0.005100.000 0.015 1,135i 0.011220.000 0.043 1,O35 0.032
25.000 0.005 815 0.005100.000 0.015 790 0.011220.000 0.043 690 0.03225.000 0.005 470 0.005
100.000 0.015 445 0.011
220.000 0.043 345 0.032
25.000 0.005 125 0.005100.000 0.015 100 0.011
0.000 0.000 0
r.I. Sum mfp Sum r.I. Sum
% % $6 g/cm2
0.035 64.121 1,294.229 115.196
0.392 64.153 1,294.621 115.239
0.004 64.158 1,294.625 115.244
0.035 64.169 1,2.94.660 115.2580.392 64.201 1,295.051 115.301
0.004 64.206 1,295.055 115.306
0.035 64.217 1,295.090 115.321
0.392 64.249 1',295.482 115.364
0.004 64.254 1,295.486 115.369
0.035 64.265 1,295.521 115.384
0.392 64.297 1,295.913 115.427
0.004 64.302 1,295.916 115.432
0.035 64.313 1,295.951 115.446
64.313 1,295.951 115.446
Page 16