emulsifying activity of a biosurfactant produced by a … activity of a biosurfactant produced by a...
TRANSCRIPT

ORIGINAL ARTICLE
Emulsifying activity of a biosurfactant produced by a marinebacterium
K. Abraham Peele1 • V. Ravi Teja Ch.2 • Vidya P. Kodali2
Received: 16 June 2016 / Accepted: 8 August 2016 / Published online: 22 August 2016
� The Author(s) 2016. This article is published with open access at Springerlink.com
Abstract Biosurfactants produced by biofilm-forming
bacteria have great applications in biotechnology, phar-
maceutical, food engineering, bioremediation, and biohy-
drometallurgy industries. This study aimed to find out the
bacteria that produce novel exopolymers (EPSs) which can
find potential role in oil biodegradation. A screening pro-
cedure was performed to detect EPS-producing bacteria.
The EPS producing isolate was identified as Acinetobacter
species by 16S rDNA analysis. The polymer produced by
the isolate has shown significant emulsification and sur-
factant activities, and the activities were compared to some
of the commercial emulsifiers. The EPS has been partially
characterized by FTIR analysis and has been proved to be a
glycolipoprotein. This is one of the very few reports on
Acinetobacter species producing EPS with surfactant
properties.
Keywords Bioemulsifier � Biodegradation �Bioremediation � Hydrocarbon � Marine microbiology
Abbreviations
EPS Exopolysaccharide
FTIR Fourier transform infrared spectroscopy
PBS Phosphate buffer saline
DAPI 40, 6-Diamidino-2-phenylindole
Introduction
Biosurfactants are surface-active and structurally diverse
group molecules that are synthesized by the microbial
cells. Most of the surfactants being used are chemically
synthesized. There is an observable increase in the interest
among the scientists on microbial emulsifiers because of
their potential applications in environmental protection,
low toxicity, high biodegradability, and high foaming
capacity. Bioemulsifiers get accumulated at the interphase
between the two immiscible phases by which they can
reduce the surface tension, thereby resulting in the
increased solubility and emulsification of the immiscible
phases. Bioemulsifiers can convert the insoluble substrate
into soluble substrates which can be utilized by the
microorganisms for their metabolism (Rodrigues et al.
2006). Biosurfactants with such surface properties stood as
good examples for enhanced oil recovery (EOR). Some of
the biosurfactants are very effective, and they can reduce
the surface tension of water from 72 dynes/cm to value
range of 25–30 dynes/cm (Satpute et al. 2010). Lipopep-
tides belong to a class of biosurfactants that have shown
remarkable surface active properties, viz., surplus crude oil
recovery, food processing, de-emulsification, antimicro-
bial, antitumor, antiviral, and anti adhesive activities
(Bodour et al. 2004). Biosurfactants have been shown
dispersant activity by reducing the surface tension of oil–
water interface effectively. Many bacteria like Acineto-
bacter, Rhodococcus species, and Actinomycetes, and other
biofilm forming bacteria have been reported to produce
biosurfactants. However, there is only less abundance of
biosurfactant producing microorganisms that can be grown
in natural environments than in contaminated environ-
ments. Growth pattern and biofilm formation may depend
on various development factors, such as surface area,
& Vidya P. Kodali
1 Department of Biotechnology, Vignan’s University,
Vadlamudi, Guntur Dist., Andhra Pradesh, India
2 Department of Biotechnology, Vikrama Simhapuri
University, Nellore Dist., Andhra Pradesh, India
123
3 Biotech (2016) 6:177
DOI 10.1007/s13205-016-0494-7
smoothness, flow velocity, and nutrients (Donlan and
Costerton 2002). Hence, this study aims to isolate and
molecular characterize an emulsifier producing bacterium
from marine source.
Materials and methods
Isolation of EPS producer and biofilm assay
The marine water samples were collected from Bay of
Bengal at Bapatla, Andhra Pradesh. Serial dilutions were
performed for the screening of bacteria with the highest
EPS producing ability. These marine isolates were grown
using Nutrient broth (Hi media, Mumbai). Tube staining
method with crystal violet is used to test the biofilm pro-
ducing ability of the microbes (Abraham et al. 2012;
Fabres-Klein et al. 2015). The highest EPS producer was
screened for biosurfactant activity and was characterized
biochemically. Identification of the strain was carried out
by 16S r-DNA analyses.
Staining and visualization of EPS with fluorescent
labeled lectins
For the visualization of EPS by sample M, glass slides were
immersed in bacterial suspension and kept in Petri dishes
for 7 days at 37 �C for the biofilm formation, then the glass
slide surface is covered with 50 ll DAPI solution for
15 min, and then the slide was washed with 1 ml PBS and
distilled water. Treated slide was observed under fluores-
cence microscope (Carl Ziess) after drying (Pal and Paul
2013).
Biosurfactant production and quantification
The biosurfactant production was studied in Luria broth
(LB) by growing sample M for 14 days under submerged
conditions at various pH and temperature conditions.
The supernatant was collected by centrifugation, dried,
lyophilized, and analyzed for biosurfactant production by
measuring total carbohydrate, lipid, and protein contents
(Dubois et al. 1951; Lowry et al. 1951; Kodali and Sen
2008). The critical micelle concentration (CMC) of
biosurfactant was measured in PBS buffer using K6
force tensiometer (Kruss, Germany) (Hayder et al.
2014).
Emulsifying potential of the biosurfactant
Emulsifying potential of the biosurfactant of sample M was
found out against hydrocarbons such as (benzene and
xylene), vegetable oils such as (olive and sunflower), and
crude oils such as (kerosene, diesel, and petrol). All these
hydrocarbons were of analytical grade (Fischer scientific,
USA), and the rest of the oils were bought from local
suppliers. The emulsifying activity was measured by
combining equal volumes of biosurfactant solution (1 %
w/v) and the hydrophobic substrates in 10-mm-diameter
tubes, mixed on a vortex for 2 min and left to stand for 24,
96 and 168 h at 30 �C. Emulsifying activity was deter-
mined, and it is the percentage of the total height that was
occupied by the emulsion after a time period of 24 h
(Camacho-Chab et al. 2013).
Thin-layer chromatography and FTIR analysis
The biosurfactant was dissolved in methanol and spotted
on a 10 9 10 cm precoated silicagel GF 254. Samples will
be prepared by the homogeneous dispersal of 1 mg of the
biosurfactant sample, in pellets of potassium bromide, and
now, these samples were subjected for FTIR analysis. IR
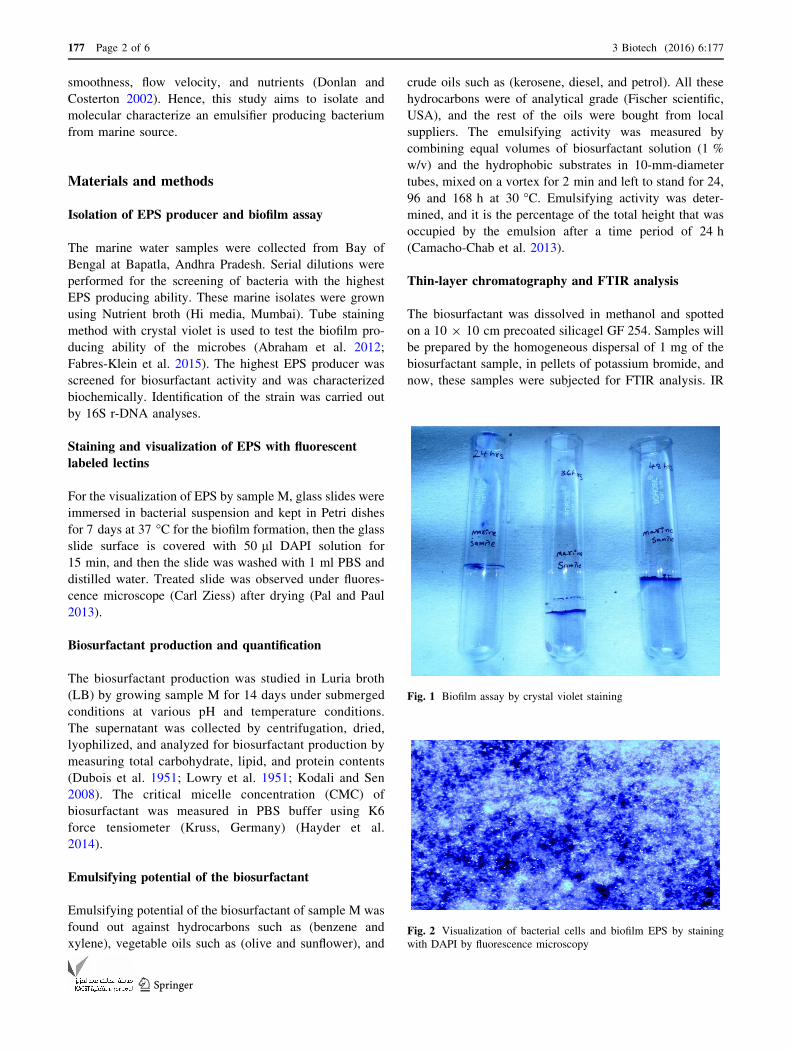
Fig. 1 Biofilm assay by crystal violet staining
Fig. 2 Visualization of bacterial cells and biofilm EPS by staining
with DAPI by fluorescence microscopy
177 Page 2 of 6 3 Biotech (2016) 6:177
123

spectra were collected over the range of 400–4000 cm-1
and with a resolution of 4 cm-1 (Das et al. 2008;
Thompson et al. 1994).
16S rDNA sequence analysis
The 16S rDNA analysis of the sample M was analyzed.
DNA purification kit (PureFast� Bacterial Genomic DNA
kit), 16S Bac specific primer-forward (10 pico-moles/lL),and 16S Bac specific primer-reverse (10 pico-moles/lL)were used to amplify the 16S rDNA gene by PCR. The
PCR mixture contained 50-lL final volume; 25 lL of
master mix contains 10X Taq buffer, 2 mM MgCl2,
0.4 mM dNTPs mix, 2U Proofreading Taq DNA poly-
merase, and 1 lL genomic DNA. The DNA amplification
was performed using Eppendorf PCR, System. The PCR
program was as follows: 94 �C for 1 min, 60 �C for 1 min,
and 72 �C for 1 min for 30 cycles each of 6 min at 72 �C.The PCR products were visualized under UV light after
electrophoresis on a 2 % (w/v) agarose gel containing
ethidium bromide. The PCR product was sent to Helini
Biomolecules for sequence analysis. The nucleotide
0 1 2 3 4 5 6 7 8 9 10 11 12 13 14 150.0
0.5
1.0
1.5
2.0
0
100
200
300
400
Abs
orba
nce
at 6
00 n
m Biosurfactant C
onc (mg/L)
Time (days)
4 5 6 7 8 9 10 11 12
0
100
200
300
400
Bio
surf
acta
nt C
onc
(mg/
L)
pH
0
100
200
300
400
4 15 20 25 30 37 45 50 55
Temperature (°C)
Bio
surf
acta
nt C
onc
(mg/
L)
(a) (b)
(c)
Fig. 3 a Time course (growth kinetics) of sample M produced biosurfactant. b Effect of pH on biosurfactant production by sample M. c Effect oftemperature on biosurfactant production by sample M
0 200 400 600 800 10000
20
40
60
80
surfa
ce te
nsio
n (m
N/M
)
300Biosurfactant Concentration
Fig. 4 Critical micelle concentration of bioemulsifier produced by
sample M
3 Biotech (2016) 6:177 Page 3 of 6 177
123

sequence of the 16S rDNA genes (about 1400 nucleotides
each) was aligned using CLUSTAL W program (Thomp-
son et al. 1994).
Results and discussion
Isolation and screening of EPS producer
From six isolates, one isolate was selected based on its
highest EPS (Biofilm) producing ability (Fig. 1), named
sample M, and was characterized biochemically. The iso-
late was positive for catalase, laccase, and lactase tests, and
negative for starch hydrolysis, methyl red and Voges-
Proskauer, indole production, utilization of citrate, urease
production, and hydrogen sulfide production tests. In drop
collapsing test, a flat drop and, in oil displacement method,
a clear zone were observed (Andreoni et al. 2000; Rodri-
gues et al. 2006).
Staining and visualization of EPS with fluorescently
labeled lectins
The biofilm of sample M was stained with DAPI and
visualized by fluorescence microscope (Fig. 2) DAPI stains
the cells and extracellular matrix by passing through the
cell membrane and allows the microscopic detection of the
biofilm.
Biosurfactant production and quantification
The biosurfactant produced by sample M was extracted and
dissolved in 1 ml of demineralized water. The total car-
bohydrate and protein concentrations were observed to be
310 and 150 lg/ml, respectively. Sample M showed
maximum biosurfactant production at pH 7.0 and 37 �C
(Fig. 3). The addition of biosurfactant at the concentration
of 300 mg/l to PBS buffer and CMC reduced the surface
tension value to 39 and of 39 mN/m, respectively (Fig. 4)
(Kokare et al. 2007; Khopade et al. 2012).
Emulsifying potential of the biosurfactant
The emulsifying activity of biosurfactant from sample M
was tested against different hydrocarbon substrates. The
emulsifying activity of biosurfactant was evaluated after
24, 96, and 168 h. The emulsions found to be stable even
after 7 days. Synthetic surfactants Triton X-100 and Tween
20 were more efficient than biosurfactant, and the two
Table 1 Emulsifying activity of biosurfactant, synthetic surfactants, and bioemulsifiers on various hydrophobic substrates after 168 h of
incubation at 30 �C
Hydrophobic
substrate
Emulsifying activity
of Biosurfactant
Emulsifying activity
of Synthetic surfactants
Emulsifying activity
of Biopolymers
Tween 20 Triton X-100 Gum arabic Xanthan gum
Xylene 74 ± 0.91 94 ± 0.72 95 ± 0.96 78 ± 1.16 78 ± 1.19
Benzene 67 ± 1.42 94 ± 0.97 68 ± 0.70 82 ± 2.13 72 ± 1.35
Toluene 71 ± 0.97 82 ± 0.24 81 ± 1.93 70 ± 1.85 70 ± 3
Diesel 76 ± 1.23 73 ± 0.37 68 ± 2 89 ± 0.48 89 ± 1.2
Petrol 78 ± 0.78 68 ± 2.2 72 ± 0.67 88 ± 0.84 87 ± 3
Kerosene 67 ± 0.82 67 ± 1.46 69 ± 0.25 78 ± 0.87 75 ± 0.89
Motor oil 81 ± 0.94 69 ± 1.32 67 ± 0.49 93 ± 0.71 91 ± 0.75
Olive oil 73 ± 2.05 100 100 99 ± 0.49 83 ± 0.84
Sunflower oil 76 ± 0.89 100 98 ± 0.82 98 ± 0.2 86 ± 0.41
Fig. 5 Emulsification potential of bioemulsifier in kerosene (1 %
w/v) at 24 h
177 Page 4 of 6 3 Biotech (2016) 6:177
123
natural biopolymers showed emulsification activities of
100 % against oils after 168 h (Table 1). Biosurfactant
showed stronger emulsifying activities than gum arabic,
and the emulsifying activity of biosurfactant was depen-
dent on the type of substrate (Camacho-Chab et al. 2013).
These results indicated that biosurfactant of sample M was
a good emulsifier (Fig. 5).
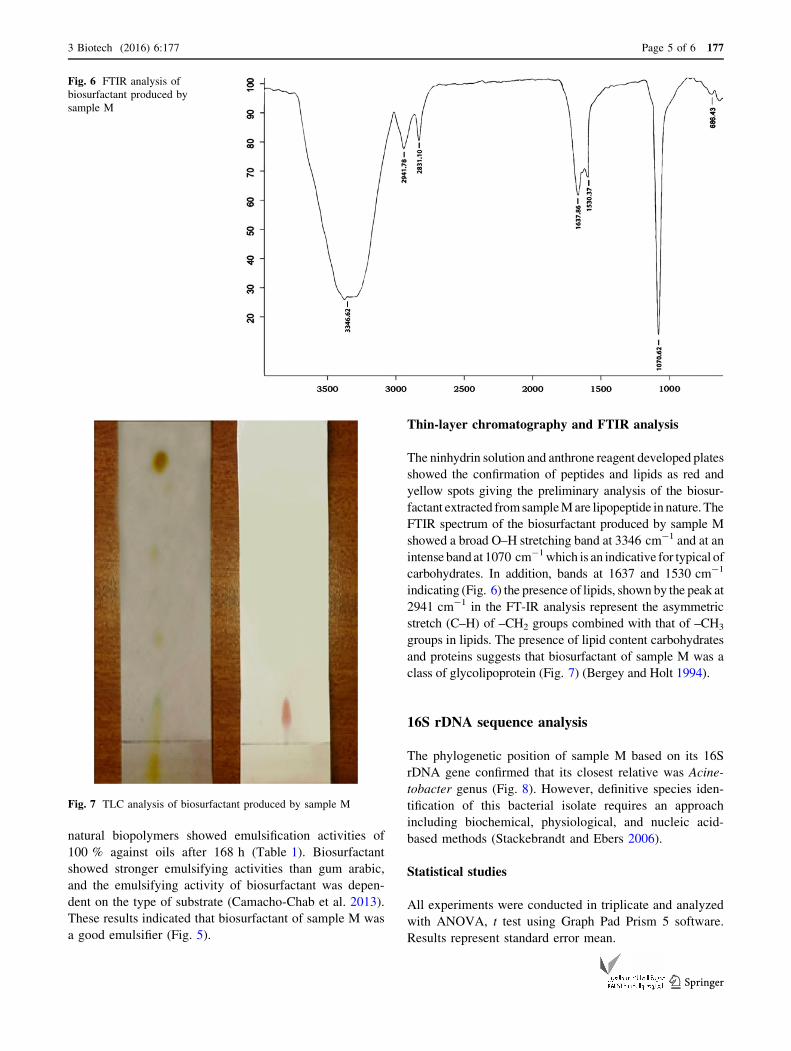
Thin-layer chromatography and FTIR analysis
The ninhydrin solution and anthrone reagent developed plates
showed the confirmation of peptides and lipids as red and
yellow spots giving the preliminary analysis of the biosur-
factant extracted fromsampleMare lipopeptide in nature. The
FTIR spectrum of the biosurfactant produced by sample M
showed a broad O–H stretching band at 3346 cm-1 and at an
intense bandat 1070 cm-1which is an indicative for typical of
carbohydrates. In addition, bands at 1637 and 1530 cm-1
indicating (Fig. 6) the presence of lipids, shown by the peak at
2941 cm-1 in the FT-IR analysis represent the asymmetric
stretch (C–H) of –CH2 groups combined with that of –CH3
groups in lipids. The presence of lipid content carbohydrates
and proteins suggests that biosurfactant of sample M was a
class of glycolipoprotein (Fig. 7) (Bergey and Holt 1994).
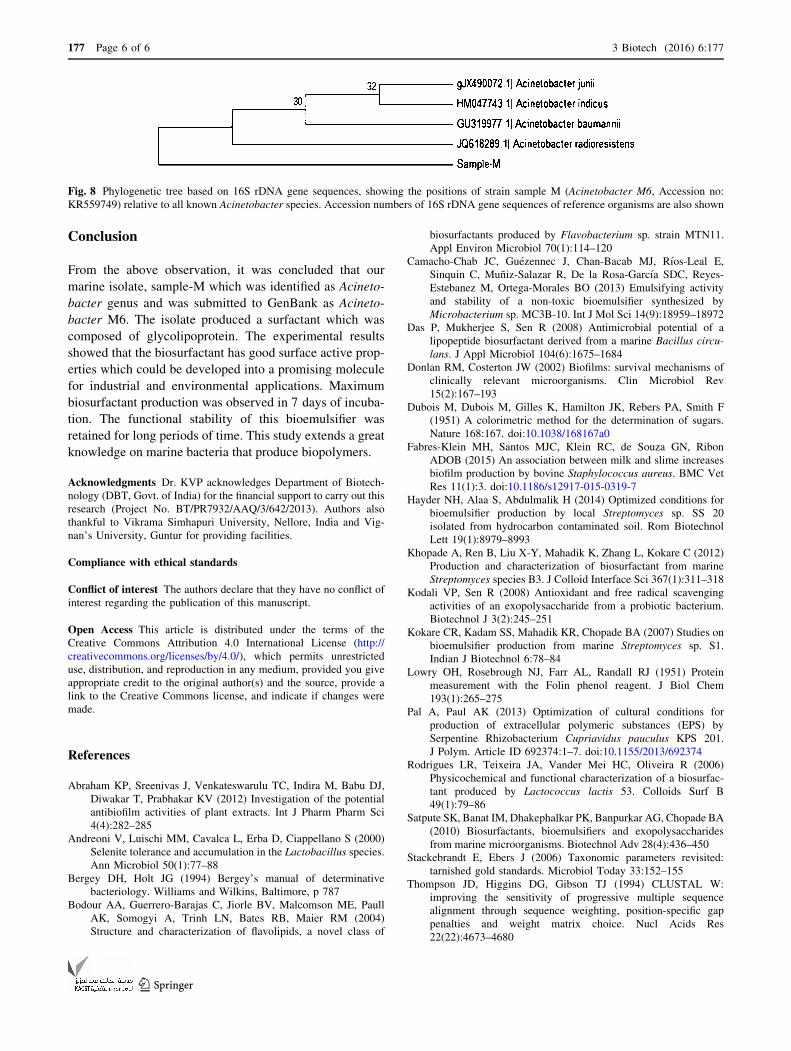
16S rDNA sequence analysis
The phylogenetic position of sample M based on its 16S
rDNA gene confirmed that its closest relative was Acine-
tobacter genus (Fig. 8). However, definitive species iden-
tification of this bacterial isolate requires an approach
including biochemical, physiological, and nucleic acid-
based methods (Stackebrandt and Ebers 2006).
Statistical studies
All experiments were conducted in triplicate and analyzed
with ANOVA, t test using Graph Pad Prism 5 software.
Results represent standard error mean.
Fig. 6 FTIR analysis of
biosurfactant produced by
sample M
Fig. 7 TLC analysis of biosurfactant produced by sample M
3 Biotech (2016) 6:177 Page 5 of 6 177
123
Conclusion
From the above observation, it was concluded that our
marine isolate, sample-M which was identified as Acineto-
bacter genus and was submitted to GenBank as Acineto-
bacter M6. The isolate produced a surfactant which was
composed of glycolipoprotein. The experimental results
showed that the biosurfactant has good surface active prop-
erties which could be developed into a promising molecule
for industrial and environmental applications. Maximum
biosurfactant production was observed in 7 days of incuba-
tion. The functional stability of this bioemulsifier was
retained for long periods of time. This study extends a great
knowledge on marine bacteria that produce biopolymers.
Acknowledgments Dr. KVP acknowledges Department of Biotech-
nology (DBT, Govt. of India) for the financial support to carry out this
research (Project No. BT/PR7932/AAQ/3/642/2013). Authors also
thankful to Vikrama Simhapuri University, Nellore, India and Vig-
nan’s University, Guntur for providing facilities.
Compliance with ethical standards
Conflict of interest The authors declare that they have no conflict of
interest regarding the publication of this manuscript.
Open Access This article is distributed under the terms of the
Creative Commons Attribution 4.0 International License (http://
creativecommons.org/licenses/by/4.0/), which permits unrestricted
use, distribution, and reproduction in any medium, provided you give
appropriate credit to the original author(s) and the source, provide a
link to the Creative Commons license, and indicate if changes were
made.
References
Abraham KP, Sreenivas J, Venkateswarulu TC, Indira M, Babu DJ,
Diwakar T, Prabhakar KV (2012) Investigation of the potential
antibiofilm activities of plant extracts. Int J Pharm Pharm Sci
4(4):282–285
Andreoni V, Luischi MM, Cavalca L, Erba D, Ciappellano S (2000)
Selenite tolerance and accumulation in the Lactobacillus species.
Ann Microbiol 50(1):77–88
Bergey DH, Holt JG (1994) Bergey’s manual of determinative
bacteriology. Williams and Wilkins, Baltimore, p 787
Bodour AA, Guerrero-Barajas C, Jiorle BV, Malcomson ME, Paull
AK, Somogyi A, Trinh LN, Bates RB, Maier RM (2004)
Structure and characterization of flavolipids, a novel class of
biosurfactants produced by Flavobacterium sp. strain MTN11.
Appl Environ Microbiol 70(1):114–120
Camacho-Chab JC, Guezennec J, Chan-Bacab MJ, Rıos-Leal E,
Sinquin C, Muniz-Salazar R, De la Rosa-Garcıa SDC, Reyes-
Estebanez M, Ortega-Morales BO (2013) Emulsifying activity
and stability of a non-toxic bioemulsifier synthesized by
Microbacterium sp. MC3B-10. Int J Mol Sci 14(9):18959–18972
Das P, Mukherjee S, Sen R (2008) Antimicrobial potential of a
lipopeptide biosurfactant derived from a marine Bacillus circu-
lans. J Appl Microbiol 104(6):1675–1684
Donlan RM, Costerton JW (2002) Biofilms: survival mechanisms of
clinically relevant microorganisms. Clin Microbiol Rev
15(2):167–193
Dubois M, Dubois M, Gilles K, Hamilton JK, Rebers PA, Smith F
(1951) A colorimetric method for the determination of sugars.
Nature 168:167. doi:10.1038/168167a0
Fabres-Klein MH, Santos MJC, Klein RC, de Souza GN, Ribon
ADOB (2015) An association between milk and slime increases
biofilm production by bovine Staphylococcus aureus. BMC Vet
Res 11(1):3. doi:10.1186/s12917-015-0319-7
Hayder NH, Alaa S, Abdulmalik H (2014) Optimized conditions for
bioemulsifier production by local Streptomyces sp. SS 20
isolated from hydrocarbon contaminated soil. Rom Biotechnol
Lett 19(1):8979–8993
Khopade A, Ren B, Liu X-Y, Mahadik K, Zhang L, Kokare C (2012)
Production and characterization of biosurfactant from marine
Streptomyces species B3. J Colloid Interface Sci 367(1):311–318
Kodali VP, Sen R (2008) Antioxidant and free radical scavenging
activities of an exopolysaccharide from a probiotic bacterium.
Biotechnol J 3(2):245–251
Kokare CR, Kadam SS, Mahadik KR, Chopade BA (2007) Studies on
bioemulsifier production from marine Streptomyces sp. S1.
Indian J Biotechnol 6:78–84
Lowry OH, Rosebrough NJ, Farr AL, Randall RJ (1951) Protein
measurement with the Folin phenol reagent. J Biol Chem
193(1):265–275
Pal A, Paul AK (2013) Optimization of cultural conditions for
production of extracellular polymeric substances (EPS) by
Serpentine Rhizobacterium Cupriavidus pauculus KPS 201.
J Polym. Article ID 692374:1–7. doi:10.1155/2013/692374
Rodrigues LR, Teixeira JA, Vander Mei HC, Oliveira R (2006)
Physicochemical and functional characterization of a biosurfac-
tant produced by Lactococcus lactis 53. Colloids Surf B
49(1):79–86
Satpute SK, Banat IM, Dhakephalkar PK, Banpurkar AG, Chopade BA
(2010) Biosurfactants, bioemulsifiers and exopolysaccharides
from marine microorganisms. Biotechnol Adv 28(4):436–450
Stackebrandt E, Ebers J (2006) Taxonomic parameters revisited:
tarnished gold standards. Microbiol Today 33:152–155
Thompson JD, Higgins DG, Gibson TJ (1994) CLUSTAL W:
improving the sensitivity of progressive multiple sequence
alignment through sequence weighting, position-specific gap
penalties and weight matrix choice. Nucl Acids Res
22(22):4673–4680
Fig. 8 Phylogenetic tree based on 16S rDNA gene sequences, showing the positions of strain sample M (Acinetobacter M6, Accession no:
KR559749) relative to all known Acinetobacter species. Accession numbers of 16S rDNA gene sequences of reference organisms are also shown
177 Page 6 of 6 3 Biotech (2016) 6:177
123