ems digital life
TRANSCRIPT

EMS Digital LifeHow Europe’s elite use media throughout the day in today’s digital world
Reinier SchaperReinier SchaperAmsterdam, 17 March 2008

EMS: The well accepted currency for pan European media planning & targeting, covering the upscale, affluent & influential Europeans

The upcoming EMS 2008 release is tailored to new needs of the media industry, adding usage of websites & Digital Life to the existing wealth of print readership, TV viewing & marketing information

EMS Digital LifeThose who use the Internet for at leastThose who use the Internet for at least 1 hour per week (Universe: 38.4 mln)

In a global economy, you need global data. EMS Digital Life and its sister survey PAX Digital Life apply an identical approach to 26 countries in Europe and Asia-Pacific. Global insights and global planning have become a reality.
PAXPAX

This report shows only some of the topline results. The full release later this year will provide you with much more of what is listed below.

1. Access to more screens

Access to screens is the crucial condition for living digital. Practically all have mobile devices, TV, and PC or laptop at home. However it does mean they can switch and choose when, where and how they like to receive content.

Zooming in on the mobile devices, the number of smartphones, blackberries and PSPs is substantial, as is the penetration of PDAs and videoplayers.
More access to PCs & laptops, digital TV screens, mobiles & smartphones implies, by definition, digital media consumption.
2. Media consumption i di i lgoing digital

Almost 80% of Europeans have increased usage of the Internet over the last 2 years, and decreased their consumption of offline media to some extent. Beware that those percentages apply to the general changes in media habits, and not to th l f di tithe volume of media consumption.

Watching TV and reading print shift to other platformsActivities in past 30 days via a computer or mobile device:
Watch li TV
p y p
live TV
43%
Read electronic Read electronic newspaper/magazine
68%Base: Total Europe
Source: EMS Digital Life 2008, first results

The European elite spend nearly 1 hour each day reading print, 1½ hours watching TV, another 1½ hours listening to the radio, and over 2 hours using Internet (incl. email). That’s an impressive total of over 6 hours spent on media

People have turned into digital consumers, and even more quickly they have become actively engaged themselves in the digital space.
3. Uptake of di i l fdigital features
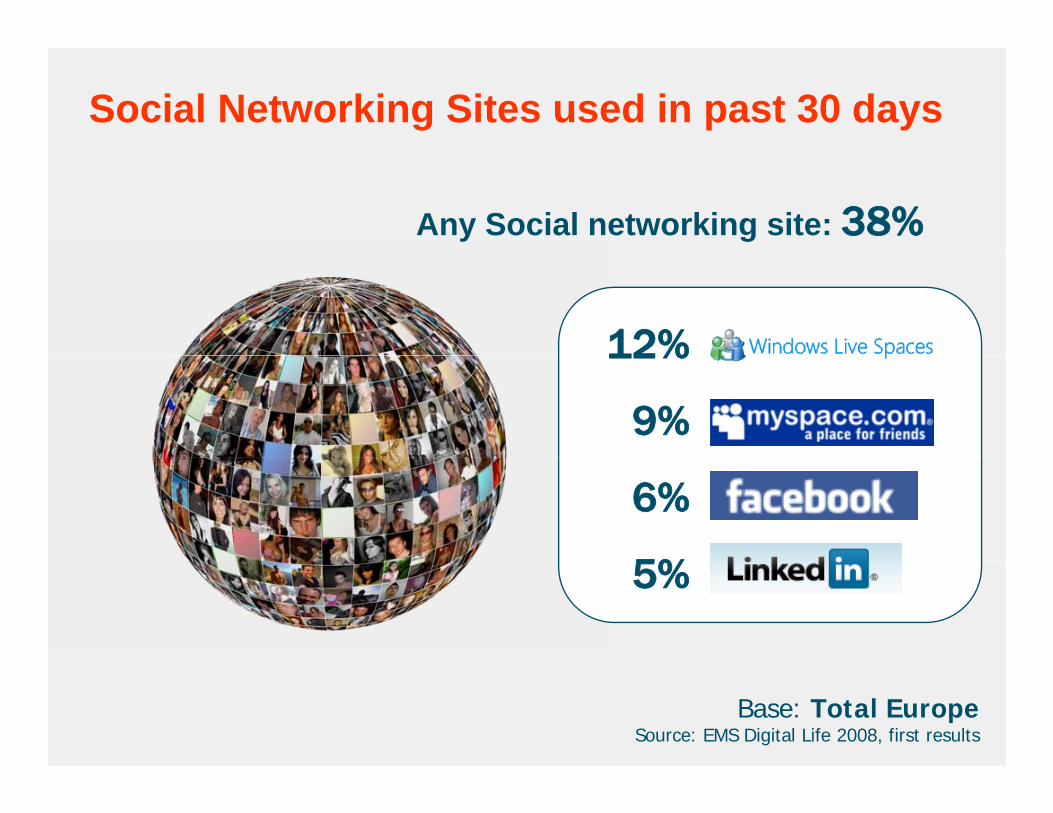
Social Networking Sites used in past 30 days
Any Social networking site: 38%
12%12%
9%
6%
5%5%
Base: Total EuropeSource: EMS Digital Life 2008, first results

Creating content has become a favourite pastime for many, and for the ones under 35 it is even turning into an essential part of their daily life
Base: Total EuropeSource: EMS Digital Life 2008, first results

How do people behave in the real and in the virtual world? This is at the core of the diary part of EMS Digital Life.
4. Media use h ianywhere, anytime
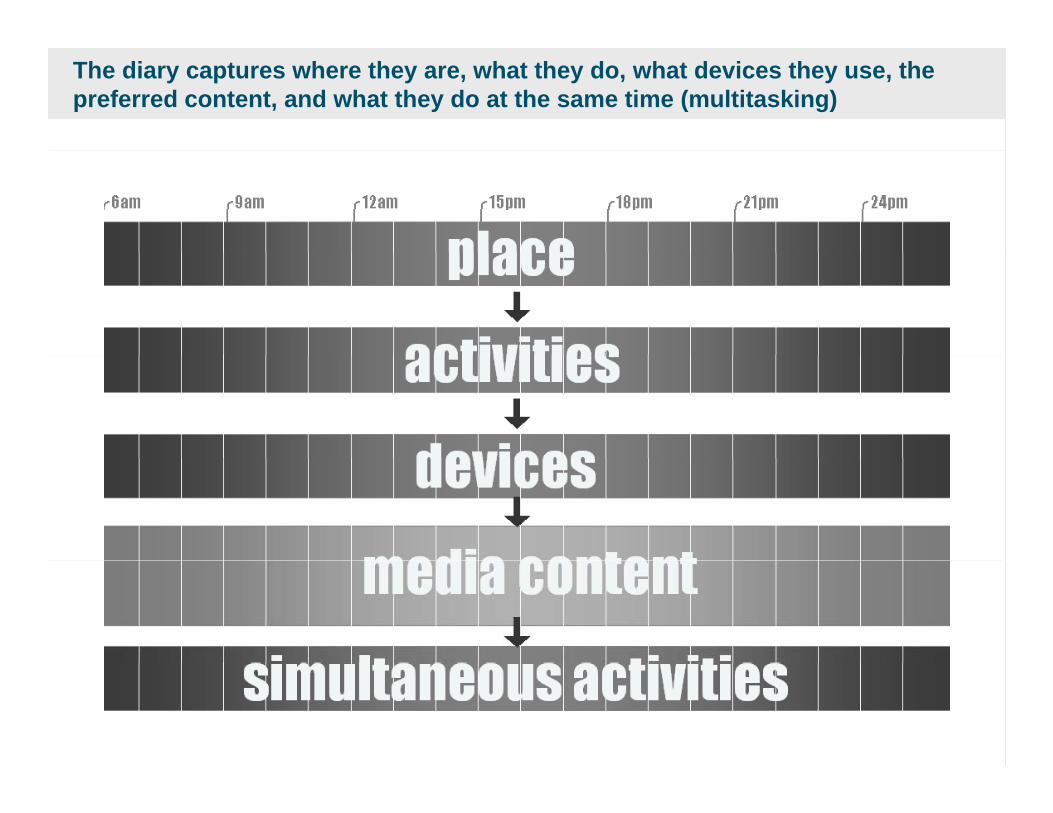
The diary captures where they are, what they do, what devices they use, the preferred content, and what they do at the same time (multitasking)

Here’s a snapshot of such a diary, revealing the dynamics, in this case of a typical working day.

Where are consumers located throughout the day
Source: EMS Digital Life 2008, first results
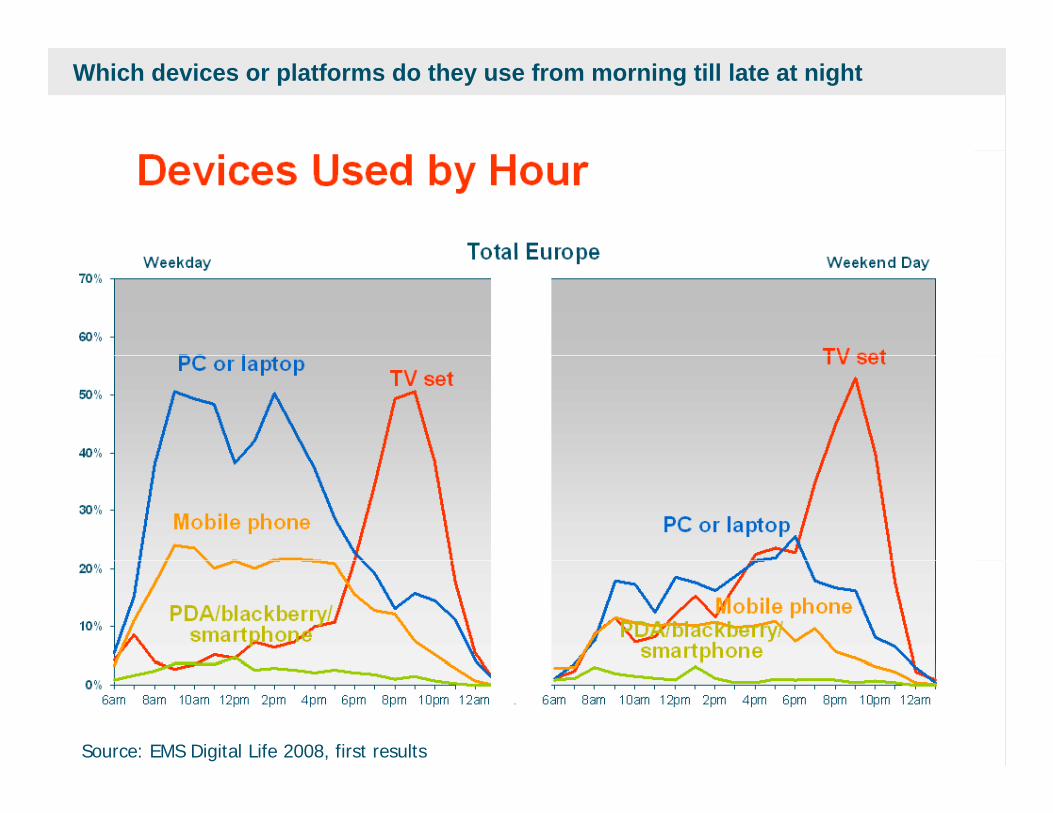
Which devices or platforms do they use from morning till late at night
Source: EMS Digital Life 2008, first results
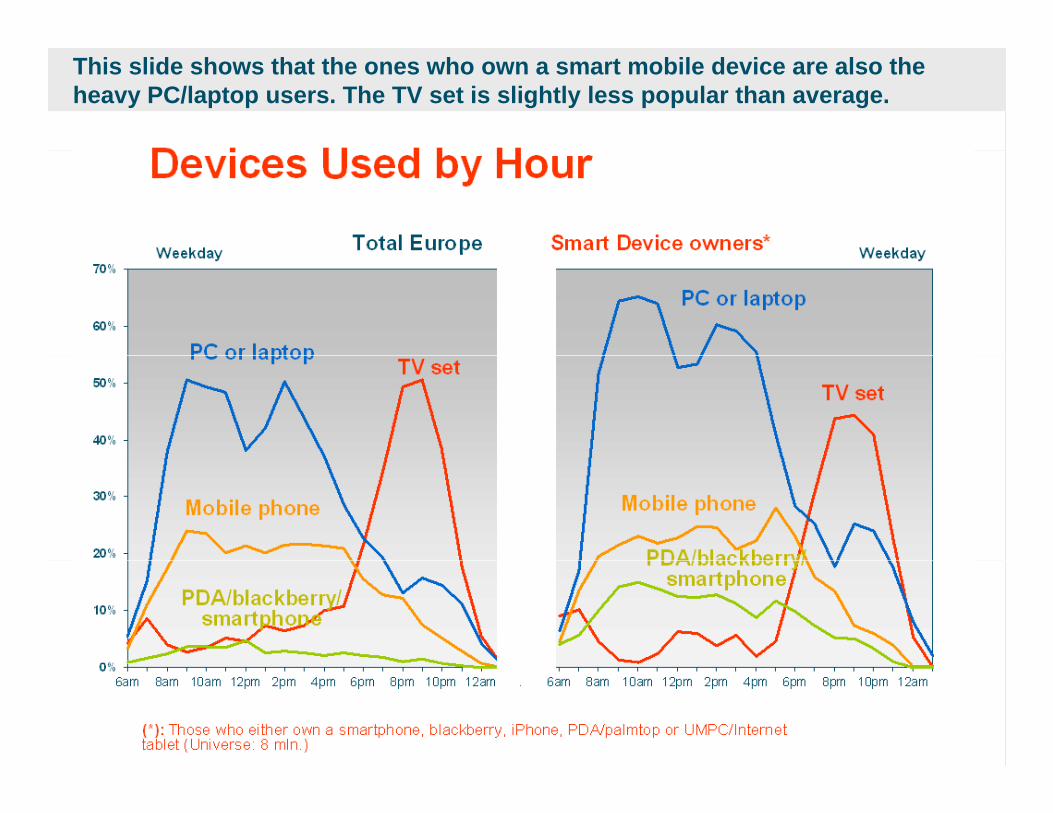
This slide shows that the ones who own a smart mobile device are also the heavy PC/laptop users. The TV set is slightly less popular than average.

The following 3 slides show the use of different types of media throughout the day for different target groups
Source: EMS Digital Life 2008, first results

Main Activity by HourTotal Europe Uploaders*
45%Weekday Weekday
30%
35%
40% Watching TV
W t hi TV
20%
25%
30%
Using
Watching TVUsing Internet
10%
15% Reading newspap./magazine
gInternet Reading
newspap./magazine
0%
5%
6am 8am 10am 12pm 2pm 4pm 6pm 8pm 10pm 12am . 6am 8am 10am 12pm 2pm 4pm 6pm 8pm 10pm 12am
Source: EMS Digital Life 2008, first results
(*): Those who have done 3+ out of those 9 activities in last 30 days: (1) keep weblog/maintain website, (2) post comment on weblog, (3) add content to a wiki, (4) update profile on social networking site, (5) attribute tags to web content, (6) upload photos on photo sharing site, (7) upload video clip on a video sharing site, (8) sell products online, (9) write an online customer review (Universe: 12.5 mln.)

Main Activity by HourHeavy print readers* Heavy Internet users**
45%Weekday Weekday
30%
35%
40%
Reading /
Watching TVWatching TV
Using Internet
20%
25%
30% newspap./magazine
Using
Reading newspap./magazine
10%
15%
Using Internet
0%
5%
6am 8am 10am 12pm 2pm 4pm 6pm 8pm 10pm 12am . 6am 8am 10am 12pm 2pm 4pm 6pm 8pm 10pm 12am
Source: EMS Digital Life 2008, first results
(*): Those who read print for 9.5 or more hours, in a typical week (Universe: 2.2 mln.)(**): Those who use the Internet (excl. e-mail) for 14 or more hours, in a typical week (Universe: 5.2 mln.)
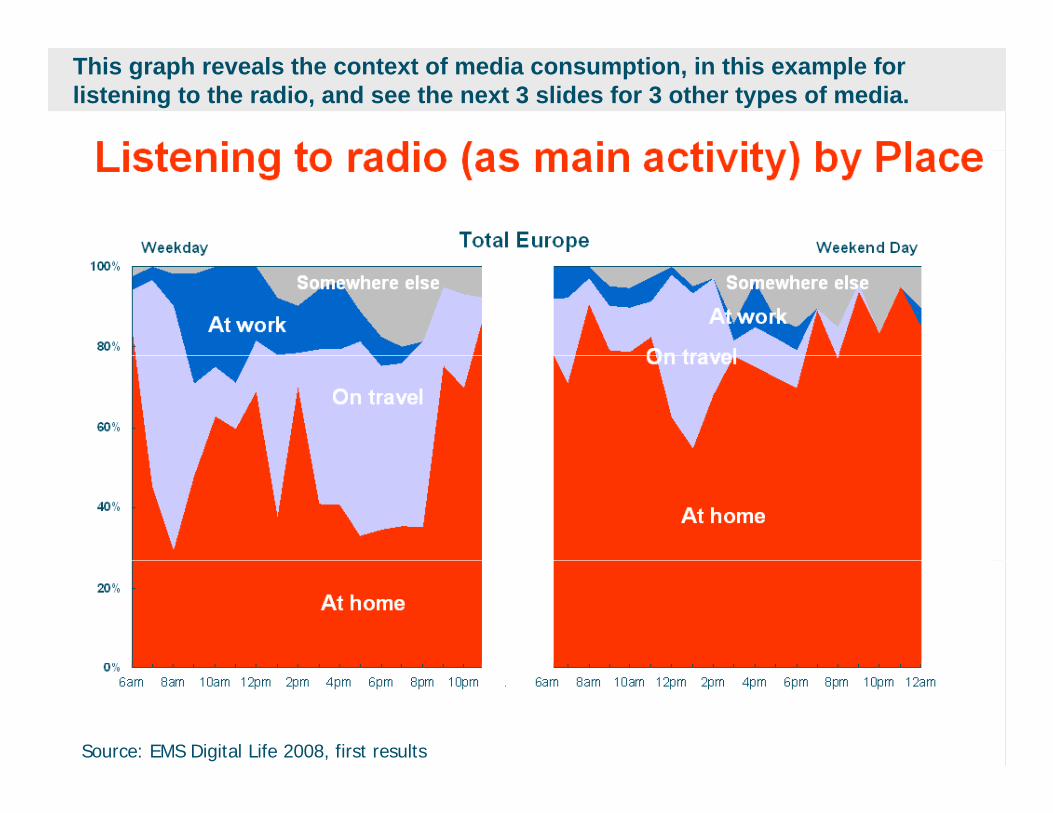
This graph reveals the context of media consumption, in this example for listening to the radio, and see the next 3 slides for 3 other types of media.
Source: EMS Digital Life 2008, first results

Reading print (as main activity) by Place
Total Europe100%
Weekday Weekend Day
Somewhere else Somewhere else
80% On travelAt work
60%
At home
20%
40% At home
At home
0%6am 8am 10am 12pm 2pm 4pm 6pm 8pm 10pm . 6am 8am 10am 12pm 2pm 4pm 6pm 8pm 10pm 12am
Source: EMS Digital Life 2008, first results

Watching TV (as main activity) by Place
Total Europe100%
At work
Weekday Weekend Day
Somewhere
80%On travel
At work
Somewhere
else
60%
At home
else
20%
40% At home
At home
0%6am 8am 10am 12pm 2pm 4pm 6pm 8pm 10pm . 6am 8am 10am 12pm 2pm 4pm 6pm 8pm 10pm 12am
Source: EMS Digital Life 2008, first results
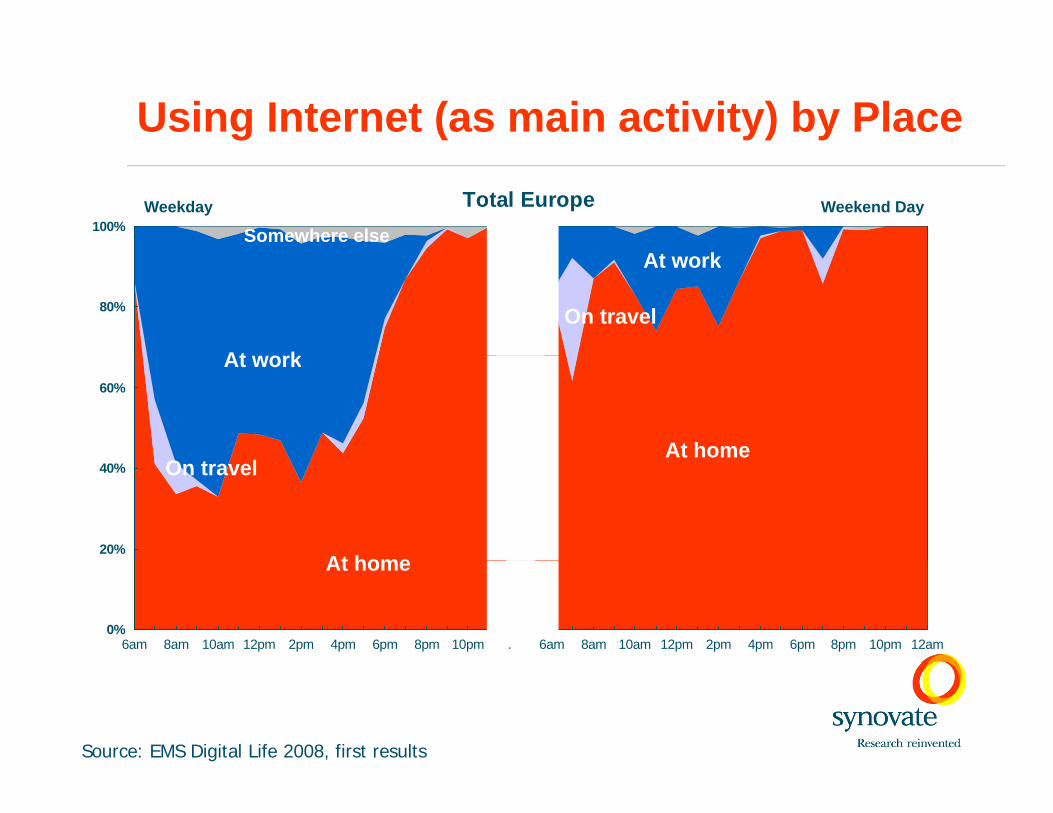
Using Internet (as main activity) by Place
Total Europe100%
Weekday Weekend Day
At kSomewhere else
80%
At k
On travel
At work
60%
At work
At home
20%
40% On travel
At home
0%6am 8am 10am 12pm 2pm 4pm 6pm 8pm 10pm . 6am 8am 10am 12pm 2pm 4pm 6pm 8pm 10pm 12am
At home
Source: EMS Digital Life 2008, first results

Of course EMS Digital Life enables you to select your own target groups. For example, the next slide shows the consumption of News/Business content by the young and the old, compared to the total, as presented by the graph of this slide.
Source: EMS Digital Life 2008, first results

Consumption of News/Business content by hour
Age 55+ Age under 3525%
Weekday Weekday
Watching
20%
Watching News/Bus. TV program
Watching News/Bus
15%
ReadingVisiting
News/Business Reading any daily
Visiting News/Business
News/Bus. TV program
5%
10% Reading any daily
newspaper
News/Business site any daily
newspaperNews/Business
site
0%6am 8am 10am 12pm 2pm 4pm 6pm 8pm 10pm 12am . 6am 8am 10am 12pm 2pm 4pm 6pm 8pm 10pm 12am
Source: EMS Digital Life 2008, first results

Another feature is analyzing your own audiences. This graph shows patterns of watching certain kind of TV programs for the total. The next slide shows the weekday pattern for Channel X viewers.
Source: EMS Digital Life 2008, first results

TV programs watched by hour
Total Europe24%
Weekend day Weekend dayBase of Watched TV Channel X
in past 30 days
16%
18%
20%
22%
News/Business
News/Business
10%
12%
14%
16%
SportsDocumentary
/FactualDocumentary
/Factual
News/Business
4%
6%
8%
10% /Factual
Sports
0%
2%
4%
6am 8am 10am 12pm 2pm 4pm 6pm 8pm 10pm 12am . 6am 8am 10am 12pm 2pm 4pm 6pm 8pm 10pm 12am
Source: EMS Digital Life 2008, first results

Despite all innovations, we are stuck with only 24 hours in a day. We have to compromise and do things simultaneously. The following 2 slides show the levels of reading and watching TV, and those levels related to other activities.
5. Multitasking5. Multitasking

Reading print & Simultaneous activities by Hour
Total Europe12%
Weekday Weekend Day
10%
6%
8%
2%
4%Reading print & other
activitiesReading print & other
activities
0%
2%
6am 8am 10am 12pm 2pm 4pm 6pm 8pm 10pm 12am . 6am 8am 10am 12pm 2pm 4pm 6pm 8pm 10pm 12am
Reading print “only” Reading print “only”
Source: EMS Digital Life 2008, first results

Watching TV & Simultaneous activities by Hour
Total Europe60%
Weekday Weekend Day
50%
30%
40%
Watching TV & other activities
Watching TV & other activities
10%
20%
0%
10%
6am 8am 10am 12pm 2pm 4pm 6pm 8pm 10pm 12am . 6am 8am 10am 12pm 2pm 4pm 6pm 8pm 10pm 12am
Watching TV “only” Watching TV “only”
Source: EMS Digital Life 2008, first results

As a last example, this graph reveals that the very upscale Europeans are much less able to relax in the weekend, and do more so at the end of a weekday.
Source: EMS Digital Life 2008, first results

Conclusion
the devices are digitalthe devices are digitalthe media are digitalthe media are digitallife is digitalgEMS Digital Lifegdelivers the insights

EMS Digital LifeEMS Digital LifeHow Europe’s elite use media throughout the day in today’s digital world
F i f ti l t t th li d ik @ tFor more information please contact [email protected]