empowering e-fleets for business and private purposes … · empowering e-fleets for business and...
TRANSCRIPT

Empowering e-fleets for business
and private purposes in cities
Programme: STEER
Project number: IEE/12/713/SI2.644746
e-Mobility Fleet Schemes and Market
Potentials in Italy
Date: 07/04/14
Main author(s): Carla Piñeiro – INOVA
e-mail: [email protected]
Teresa Borgonovo – FLI
e-mail: [email protected]
Project coordinator: Aida Abdulah – CHOICE
e-mail: [email protected]
e-Mobility Fleet Schemes and Market Potentials – ITALY
2
Table of contents
1. Executive Summary ......................................................................................................................... 4
2. Introduction ...................................................................................................................................... 5
2.1 The eBRIDGE Project ................................................................................................................... 5
2.2 Scope of the report ........................................................................................................................ 6
2.3 Methodology .................................................................................................................................. 6
3. Electric Mobility in Italy .................................................................................................................... 7
3.1 Starting Point ................................................................................................................................. 7
3.2 General Aspects of Mobility .......................................................................................................... 8
Demography .................................................................................................................................... 8
Mobility patterns............................................................................................................................... 9
3.3 The Italian Carpool ...................................................................................................................... 10
Vehicle Figures .............................................................................................................................. 10
Environment ................................................................................................................................... 12
3.4 Italian Fleet Hot Spots ................................................................................................................. 14
Main Locations for Car Sharing ..................................................................................................... 14
free Flow Car Sharing Operators ................................................................................................... 15
Business EV Car Sharing Operators ............................................................................................. 15
3.5 Research & Development ........................................................................................................... 16
Key Running R&D Projects on Electric Vehicles ........................................................................... 16
Demonstrative e-Fleet Projects ..................................................................................................... 16
4. Market Potentials ........................................................................................................................... 18
4.1 Main Drivers and Constraints ...................................................................................................... 18
5. Local Assessment.......................................................................................................................... 19
5.1 Starting Point ............................................................................................................................... 19
5.2 General Aspects of Mobility ........................................................................................................ 20
Demography .................................................................................................................................. 20
Mobility patterns............................................................................................................................. 21
5.3 The Milan Carpool ....................................................................................................................... 22
Total vehicles ................................................................................................................................. 22
6. References .................................................................................................................................... 23

e-Mobility Fleet Schemes and Market Potentials – ITALY
3
Index of figures
Figure 1 Time Plan Methodology............................................................................................................. 6
Figure 2 Demographic trends .................................................................................................................. 8
Figure 3 Share of cities by size class ...................................................................................................... 8
Figure 4 Modal share 2010 ...................................................................................................................... 9
Figure 5 Modal share 2012 ...................................................................................................................... 9
Figure 6 Reasons for travel 2012 .......................................................................................................... 10
Figure 7 Total vehicles registered 2008 - 2012 ..................................................................................... 11
Figure 8 Passenger vehicles powertrain type 2008 - 2012 ................................................................... 11
Figure 9 Selection of most sold EVs 2013 (first semester) ................................................................... 12
Figure 10 Greenhouse gas emissions from transport 2008 - 2011 ....................................................... 13
Figure 11 CO2 emissions per kWh from electricity generation 2008 - 2010 ......................................... 13
Figure 12 Demographic trends .............................................................................................................. 21
Figure 13 Modal share 2008 and 2012 ................................................................................................. 21
Figure 14 Total vehicles registered 2008 - 2012 ................................................................................... 22
Index of figures
Table 1 Main locations for car sharing .................................................................................................. 14
Table 2 Free flow car sharing operators in Italy .................................................................................... 15
Table 3 Main business car sharing operators ....................................................................................... 15
Table 4 Key running R&D projects on electric vehicles ........................................................................ 16
Table 5 Demonstrative e-fleet projects .................................................................................................. 16

e-Mobility Fleet Schemes and Market Potentials – ITALY
4
1. Executive Summary
Electric mobility is a highly promising technology that can help address severe global
challenges such as climate change and fossil fuel dependency; it can contribute to cutting
local CO2 emissions and noise pollution coming from transport and enable synergies with
smart grids and so favour a greater percentage of renewable energies production. 1
The large potential of electric vehicles in urban fleets includes (a) improving electric mobility
markets through niche development, thus accelerating mass market adoption of electric
vehicles; (b) supporting the achievement of energy and climate protection goals; and (c)
contributing to tackling global recession by revitalising the industrial fabric and fostering
innovation, growth and job creation.
Italian gross domestic product (GDP) of 1,580 billion EUR in 2011 represents 12.50% of EU
27 GDP2. With a population of 59 million (2012), Italy represents 11.87% of total European
population (500.35 million) 3 and 93.57% of this population lives in cities that have between
50,000 and 300,000 inhabitants. With 40 million vehicles in 2011, Italy has the second
largest European carpool representing 15.30% of the total EU fleet. 4
Italy has about 3,500 enterprises in the automotive sector, employing about 1.2 million direct
and indirect workers. The automotive industry invests more than 2 billion EUR in R&D per
year. In 2010, a periodic survey by the Italian Electric Road Vehicle Association (CIVES)
confirmed that around 50 producers, assemblers, and importers in the country are able to
manufacture or supply HEVs and EVs. The components industries have become more active
with new commitments on advanced batteries and charging stations, while the producers of
power electronics, complete electric and hybrid drivetrains, and electric motors are improving
their products.
Regarding charging infrastructure, a growing number of initiatives are being carrying out to
develop and promote their implementation. These initiatives are mainly related to three
areas: development of new plugs and charging stations, financial support to create local
infrastructure and validation of electric infrastructure technologies and business models
through pilot actions.
Italy has seen some successful stories of EVs in public fleets. The Municipality of Reggio
Emilia (170,000 inhabitants) has been committed to electric mobility since 2001. The project
“Electric Car in Reggio Emilia” has provided public and private companies with about 250
EVs for daily use. Within the EU-funded project REZIPE, the municipality has recently
installed a charging station powered by photovoltaic panels (3.7 kWp). Users can charge and
test 5 e-Piaggio Porter vans, as part of the integrated action plan of the municipality to
promote sustainable mobility at urban level. Another interesting case study is the Poste
Italiane Spa, the public company providing the main part of postal services in Italy. Its fleet
consists of 37,600 vehicles: 3,000 of them are EVs or bi-fuel (methan/gasoline). Poste
Italiane has got the brightest EV fleet in Italy, with 1,000 “Free Duck” vehicles, produced by
Ducati Energia and used for delivering in the city centres. The “Free Duck” vehicle concept
has been developed through two different co-funded projects, the “Green Post” project (EU
funding) and the “Postal ZEV” project (funded by the Italian Ministry of Environment).
1 Council of the European Union. 2010.
2 Eurostat, (2013a). GDP at current market prices.
3 Eurostat, (2013b). Population on 1 January.
4 European Automobile Manufacturers' Association (ACEA). Pocket guide 2013.

e-Mobility Fleet Schemes and Market Potentials – ITALY
5
2. Introduction
2.1 The eBRIDGE Project
eBRIDGE is a co-funded EU project to promote electric fleets for urban travel in European
cities. The project aims to bring innovation and new technologies to make today’s mobility
cleaner, more efficient and sustainable.
During eBRIDGE, alternatives to current mobility patterns will be explored in order to analyze
whether electric mobility is a feasible option to make cities cleaner and more sustainable.
Although electric vehicles fulfil all the requirements to
be among the most important players in urban
transport systems of the near future – they are clean,
efficient, silent, and incur low running costs –
significant barriers to a wider diffusion and use of
electric vehicles remain to be addressed, including
low user acceptance and higher purchase costs
compared to conventional cars.
On this backdrop, eBRIDGE aims to demonstrate how
the introduction of electric vehicles in fleets for
business and private urban travel can efficiently
contribute to the improvement of market conditions for
the electric mobility sector.
Seven case studies with heterogeneous starting
conditions assure a broad-spectrum outcome. Berlin
(Germany), Milan (Italy), Lisbon (Portugal), Vigo (Spain), Valencia (Spain), a selection of
Austrian municipalities and Carmarthen (Wales) are developing actions to optimise
operational fleet performance, test and launch solutions to increase the convenience and
ease of use of car sharing offers and finally, raise awareness among the target groups and
further relevant stakeholders through engaging marketing approaches on the suitability of
electric mobility for urban transport and commuting.
The eBRIDGE team involves technical experts, academics, associations, public
administrations, mobility providers and public transport and car sharing operators:
- choice GmbH (Coord.), Germany
- DB FuhrparkService GmbH, Germany
- Allmenda Social Business e.G., Austria
- Forschungsgesellschaft Mobilität – Austrian Mobility Research gem. GmbH, Austria
- I Nova Consultores en Excelencia e Innovación Estratégica, S.L., Spain
- Galician Cluster of Automotive Companies, Spain
- Movilidad Urbana Sostenible S.L., Spain
- Comunitat Autònoma de les Illes Balears, Spain
- Fondazione Legambiente Innovazione, Italy
- Azienda Trasporti Milanesi S.p.A, Italy
- Occam, Portugal
- Câmara Municipal de Lisboa, Portugal
- Cardiff University, United Kingdom

e-Mobility Fleet Schemes and Market Potentials – ITALY
6
2.2 Scope of the report
The goal of the “Work Package 2: Market Analysis”, is to analyse the current situation and
trends of electric fleets in the eBRIDGE targeted regions by assessing information about all
context relevant issues such as market overview, best practice, legal framework, policy, and
environmental impacts. The work package will also assess the market potential of electric
mobility, mainly for fleets.
The present report “e-Mobility Fleet Schemes and Market Potentials – ITALY”, gathered this
information for Italy and particularly Milan, the Italian case study site.
2.3 Methodology
In the course of this work package, data from Germany, Austria, Spain, Italy, Portugal and
United Kingdom have been gathered and analysed for the period 2008-2012.
The overall goal has been to establish the current state of play on electric urban fleets for
every participant country. A factsheet on transferability at a European scale will be based on
this report series.
Relevant data regarding national carpools such as registrations, power train type, sales
figures, as well as information about car sharing hot spots and main charging operators have
been collected and analysed.
Additionally, a brief assessment of the market potential of electric vehicles including identified
national barriers and drivers is provided.
Finally, the assessment of the Milan case study facilitates the comparison of the local and
national levels, showing to what extent the Italian energy and climate targets are on track.
The methodology is based on four steps as shown in Figure 1. First, the relevant aspects of
urban mobility and electric fleets were defined in the data collection template. The contents
of the report were likewise defined and main timelines drafted. Finally, the results of the data
analysis and complementary sources were added, and presented in the present report.
Figure 1 Time Plan Methodology
Source: Own diagram

e-Mobility Fleet Schemes and Market Potentials – ITALY
7
3. Electric Mobility in Italy
3.1 Starting Point
The introduction of EVs in Italy has been driven by a series of temporary environmental
control actions and the increasing share of renewable energy sources within a
heterogeneous energy mix.
The governmental bodies are formally committed to the European Union targets for CO2
emission reductions and increased use of alternative fuels and are currently proposing and
discussing new legislation, regulations, and supporting measures to significantly reduce the
environmental and energy impact of the transport sector, which still accounts for about 27%
of the overall end use of energy and about 30% of the overall greenhouse gas emissions.
At European level, automotive industries have the mandatory goal to keep the emissions of
new cars under 95gCO2/km by 2020. Technology applied to conventional vehicles will allow
them to emit, in average, 103-104 gCO2/km. To reach the goal, it's necessary to introduce
electric cars. That's why several car producers (Renault, Toyota, BMW …) are investing to
be on the market with EVs for urban contexts.
CIVES5 estimates that in Italy the number of EVs (BEVs, PHEVs and HEVs) might be of 6
out of 700,000 conventional vehicles, from now until 2020 (10-12% of year market).
According to another Enel6, potential market penetration of EVs and PHEVs might be of
850,000-3,800,000 (depending on the regulatory conditions).
At national level, the Authority for Electric Energy and Gas has released the “Piano
Nazionale infrastrutturale per la ricarica dei veicoli alimentanti ad energia elettrica (National
infrastructural Plan for charge of electric vehicles)”. This plan was foreseen by the 134/2012
national law; it provides specific guidelines to promote an homogeneous development of
recharging services and it states that the starting point has to be identified in the urban
areas.
The same law set up incentives for all low carbon emissions vehicles; not only EVs, but also
vehicles powered by biofuel, methane and GPL, as well as the hybrid ones. The budget
allocated and at disposal only for the year 2013 has been 40 million EUR, 5 of which were
allocated to be used by Italian Regions for: sustainable mobility in urban / metropolitan areas,
public and private fleets, fuel distribution systems and two-wheeled vehicles (motorcycles).
On September 2013, as per the Ministry of Infrastructure and Transport, 31 projects were
submitted to request these funds.
A condition for the implementation of EV operational systems is the standardisation and the
regulation of the safety systems. In Italy, this condition is fulfilled.
In Italy, to achieve the emission reduction goals it will be important to discourage the private
ownership of vehicles: throughout Europe, Italy has one of the highest density of cars –
ranked only after Luxembourg and Iceland - with 61 cars per 100 inhabitants in 20127.
5 CIVES is the acronym for Commissione Italiana Veicoli Elettrici Stradali (Italian Commission for Electric Road
Vehicles). It's the Italian section of the European Association for Battery, Hybrid and Fuel Cell Electric Vehicles. 6
Enel – Energy vendor, Associazione Nazionale delle Imprese Elettriche (ASSOELETTRICA) - National Association of Electric Companies. 7 Osservatorio Autopromotec – Autopromotec Observatory.

e-Mobility Fleet Schemes and Market Potentials – ITALY
8
3.2 General Aspects of Mobility
DEMOGRAPHY
Italy recorded a total population of 59.39 million inhabitants in 2012. The median age of
population has been steadily increasing in the last decades, being 43.8 in 2012 and the
second oldest in EU-27.8
Figure 2 classifies Italy´s population for the period 2008-2012 in two categories: total
population and working population (aged between 18 and 70 years).
In 2012, more than two thirds of the total population was working population (67.65%), able
to hold or obtain a driving license.
From 2008 to 2012, total population has decreased a 0.38% and working population 1.65%.
Figure 2 Demographic trends
Source: Own graphic based on Istituto Nazionale di Statistica (ISTAT) - Italian Statistical Office. (2013)
The country´s population is distributed as shown in Figure 3. In 2013, 93.57% of cities have
between 50,000 and 300,000 citizens.
Figure 3 Share of cities by size class
Source: Own graphic based on Istituto Nazionale di Statistica (ISTAT) - Italian Statistical Office. (01.01.2013)
8 Eurostat (2013c) Population structure and Age.

e-Mobility Fleet Schemes and Market Potentials – ITALY
9
MOBILITY PATTERNS
Mostly of the commuting trips (going to work) in 2010 were done by private cars (70.82%);
12.55% by public transport; 9.94% walked, 3.62% used motorcycle and 3.07% by bike.
Figure 4 Modal share 2010
Source: Istituto Nazionale di Statistica (ISTAT) - Italian Statistical Office, Italia in cifre (2010)
Data of 2012 show that almost two thirds (65.38%) of the trips are made by car (42.59%
being driver and 22.79% being passenger). A quarter of the trips are made by public
transport and the remaining 9.41% by other private means. 9
Differences between students and employed are significant. While employed people drive
their own car (72.79%), students are mainly passengers of private cars (43.92%) or use the
public transport (42.15%).
Figure 5 Modal share 2012
Source: Istituto Nazionale di Statistica (ISTAT) - Italian Statistical Office (2013)
In 2012, trip purpose in urban areas was as following: commuting 27.9% (a.v.: 9 million, 1.4
of which are students trips); family management 46.8% (a.v.15.1 million); leisure 25.2%
(a.v.8.1 million).
9 No data for walking/cycling.

e-Mobility Fleet Schemes and Market Potentials – ITALY
10
Figure Trip purpose 2012
Source: Istituto Nazionale di Statistica (ISTAT) - Italian Statistical Office (2013)
There is a decreasing trend of commuting due to the economic crisis: from 128 million trips in
2008 to 97.5 in 2011. In 2012, average daily trips were almost 10 million less than in 2011 (-
8.5%)10. The decline in consumption of mobility was caused largely by the collapse of travel
for leisure.
The majority of journeys are made in a range of 10 km (70,4%); in a range of 10-50 km are
26,6% and journeys on a long distance(>50 km) cover the 3% of the total.
3.3 The Italian Carpool
VEHICLE FIGURES
Total vehicles registered
The number of passenger cars and light transport vehicles has increased steadily from 39.19
million in 2008 to 40.33 million in 201111. In this period, the trend of increase is slightly higher
in light commercial vehicles (4.20%) than in passenger cars (2.79%).
92.05% of the registered vehicles were passenger cars in this period (2008-2011).
The average age of the passenger cars was 8.6 years in 2011.12
In 2012, passenger cars represented 75.37% of the total number of vehicles circulating in
Italy (49,193,242)13. Electric cars were 1,978 (0.01% of the passenger cars)14.
10
Ricerchetrasporti -Decimo rapporto sulla mobilità in Italia (10th Report on mobility in Italy) 11
No data available for light transport vehicles 2012. 12
Automobile Club d’Italia (ACI) - Automobile Club of Italy, “Analisi dell'anzianità del parco veicoli in Italia” (2011) 13
Automobile Club d’Italia (ACI) - Automobile Club of Italy, “Annuario statistic 2013” 14
Report “Analisi dell’Osservatorio Airp sulla Mobilità Sostenibile” (2013)

e-Mobility Fleet Schemes and Market Potentials – ITALY
11
Figure 7 Total vehicles registered 2008 - 2012
Source: Own graphic based on Automobile Club d’Italia (ACI) - Automobile Club of Italy (2013)
Vehicle powertrain type
In 2012, 6.99% of the passenger vehicles were alternative powered vehicles, being 93.01%
conventional fuelled vehicles.
Among the alternative fuelled vehicles, almost all - 99.68% (6.96% of the total) - are liquefied
petroleum gas (LPG) or compressed natural gas (CNG) fuelled. 0.32% (0.02% of the total)
are battery electric vehicles (BEV), plug-in hybrid electric vehicles (PHEV) and hybrid electric
vehicles (HEV).
The total amount of LPG and CNG registered vehicles has significantly increased by 57.85%
between 2008 and 2012.
In the same period, BEVs, PHEVs and HEVs have decreased by 6.00%.
Figure 8 Passenger vehicles powertrain type 2008 - 201215
Source: Own graphic based on Automobile Club d’Italia (ACI) - Automobile Club of Italy (2013)
15
No data available for 2009.

e-Mobility Fleet Schemes and Market Potentials – ITALY
12
Selection of most sold EVs per supplier & model
Final figures of the first five months of 2013 recorded a fall of 11.25% of the car market.
Nevertheless, hybrid vehicles scored a record (+166.06%), while electric vehicles registered
a more moderate growth: +32.80% for a total of 251 units.
The final figures related to the first semester 2013 show about 6,800 new registrations of
hybrid vehicles and about 500 new battery electric vehicles.
Figure 9 shows a selection of the most sold EVs with Toyota leading the market of hybrid
vehicles with its models Yaris, Auris and Prius.
The market of battery electric vehicles is more distributed, being the top three models Nissan
Leaf, Renault Zoe and Smart ED.
Figure 9 Selection of most sold EVs 2013 (first semester)
Source: Unione Nazionale Rappresentanti Autoveicoli Esteri (UNRAE) – National Union Representatives of
Foreign Vehicles (2013)
ENVIRONMENT
The EU has called for the need to drastically reduce world greenhouse gas (GHG)
emissions, with the goal of limiting climate change below 2ºC. Overall, the EU needs to
reduce emissions by 80–95% below 1990 levels by 2050, in the context of the necessary
reductions of the developed countries as a group, in order to reach this goal.
European Commission analysis shows that while deeper cuts can be achieved in other
sectors of the economy, a reduction of at least 60% of GHGs by 2050 with respect to 1990
levels is required from the transport sector, which is a significant and still growing source of
GHGs. By 2030, the goal for transport will be to reduce GHG emissions to around 20%
below their 2008 level.
Accordingly, the White Paper on Transport (2011) establishes as first goal to halve the use of
conventionally fuelled cars in urban transport by 2030; phase them out in cities by 2050;
achieving essentially CO2-free city logistics in major urban centres by 2030. 16
16
European Commission (2011a) WHITE PAPER - Roadmap to a Single European Transport Area: Towards a competitive and resource efficient transport system (2011) COM/2011/0144.

e-Mobility Fleet Schemes and Market Potentials – ITALY
13
Moreover, the European Union’s ten-year growth strategy, Europe 2020, established a set of
targets including climate, energy and sustainability targets. The EU targets are translated into
national targets in each EU country.
In the specific case of Italy, the national target related GHG for 2020 is to reduce the GHG
13% with respect to 2005. 17
The total GHG emissions transport in MT CO2 units18 shows, after a great drop between
2008 and 2009 (3.59 %), that the trend of decreasing continues steadily, being the average
drop rate of 4.79% from 2008 to 2011.
Figure 10 Greenhouse gas emissions from transport 2008 - 2011
Sources: Own graphic based on Eurostat (2013d) Indicators Theme 6 Climate Change and Energy
Regarding electricity generation, CO2 emissions per kWh, data from 2008 to 2010 shows a
decreasing trend, being the average decline rate of 10.18%, with a great drop between 2008
and 2009 (9.07%).
This can be considered a positive development with regards to electric mobility.
Figure 11 CO2 emissions per kWh from electricity generation 2008 - 2010
Source: Own graphic based on CO2 Emissions from Fuel Combustion Highlights, IEA (2012)
17
European Commission (2011b) Europe 2020 Targets. 18
This indicator shows trends in the emissions from transport (road, rail, inland navigation and domestic aviation)
of the greenhouse gases regulated by the Kyoto Protocol.

e-Mobility Fleet Schemes and Market Potentials – ITALY
14
3.4 Italian Fleet Hot Spots
MAIN LOCATIONS FOR CAR SHARING
After some pilot trials and a brief running-in period, station-based car sharing is by now a
tried and tested reality, fully operational in 14 cities and in expansion all over the country. 12
of these cities are within the National Circuit ICS, while the Bolzano and Naples operators
are not part of this circuit.
In addition, as we will describe in the next paragraph, new free-floating car sharing services
are now catching on in the Italian cities, starting from Milan.
The main car sharing locations, which we can consider due to the number of cars, users and
parking spots are the following.
Table 1 Main locations for car sharing
Star date Number of
cars Number of
users Number of parkings
Bologna 2002 (ICS) 49 1.136 40
Brescia 2010 (ICS) 6 161 6
Florence 2005 (ICS) 19 636 18
Genoa Savona
2004 (Genoa, ICS)
2009 (Savona, ICS) 57 2,722 49
Milan
2001 (ICS-GuidaMI)
2004 (e-vai)
2013 (Car2Go, Enjoy and EQsharing)
1,386 138,484 104
Padua 2011 (ICS) 10 129 10
Palermo 2009 (ICS) 36 700 36
Parma 2007 (ICS) 19 416 13
Rome 2005 (ICS) 124 3,064 85
Turin 2002 (ICS) 139 2,417 79
Venice 2002 (ICS) 60 3,977 21
Source: Own table based on Iniziativa Car Sharing (ICS) - Car Sharing Initiative (2013), press info on Car2Go and
Enjoy services in Milan, AMAT info on EQsharing service and e-vai info on e-vai service.
Up to date, the ICS national circuit of Car Sharing in Italy has a total of circa 23,000
customers with 670 vehicles available and 437 reserved parking places. The subscriptions
are increasing with an average monthly rate of 135%, while the journeys made every month
are between 13,000 and 15,000, for a total of around 600,000 Km.
e-Mobility Fleet Schemes and Market Potentials – ITALY
15
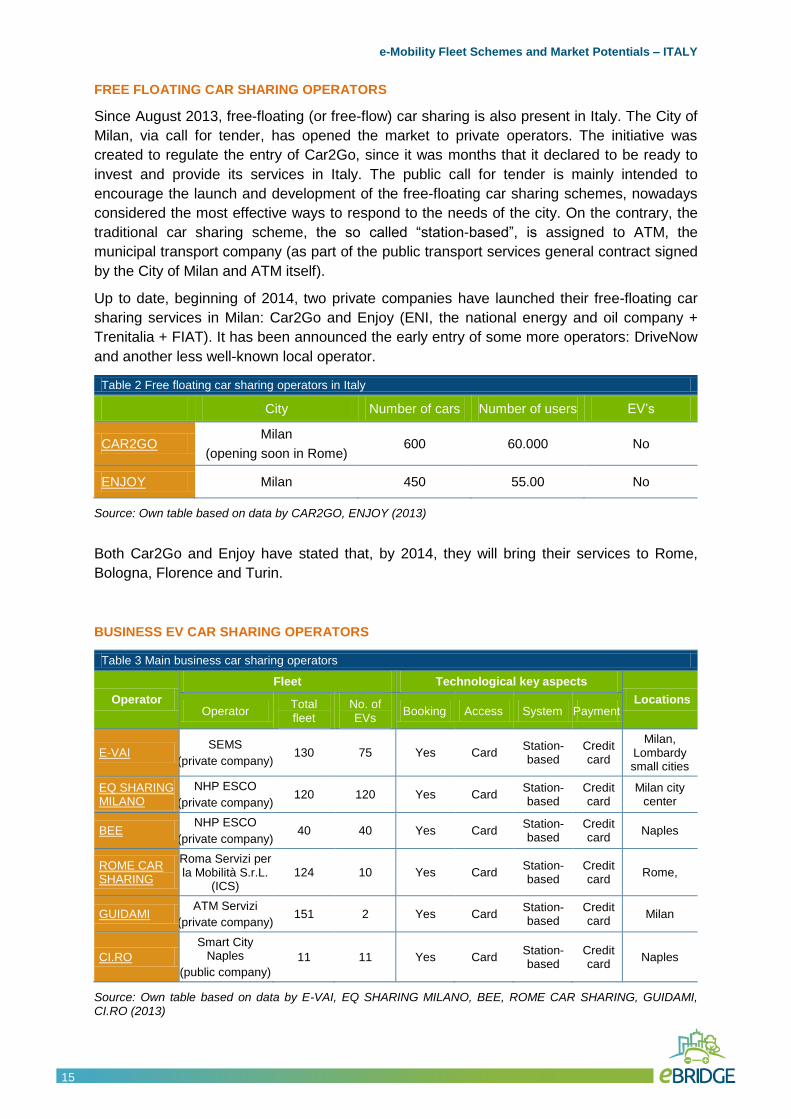
FREE FLOATING CAR SHARING OPERATORS
Since August 2013, free-floating (or free-flow) car sharing is also present in Italy. The City of
Milan, via call for tender, has opened the market to private operators. The initiative was
created to regulate the entry of Car2Go, since it was months that it declared to be ready to
invest and provide its services in Italy. The public call for tender is mainly intended to
encourage the launch and development of the free-floating car sharing schemes, nowadays
considered the most effective ways to respond to the needs of the city. On the contrary, the
traditional car sharing scheme, the so called “station-based”, is assigned to ATM, the
municipal transport company (as part of the public transport services general contract signed
by the City of Milan and ATM itself).
Up to date, beginning of 2014, two private companies have launched their free-floating car
sharing services in Milan: Car2Go and Enjoy (ENI, the national energy and oil company +
Trenitalia + FIAT). It has been announced the early entry of some more operators: DriveNow
and another less well-known local operator.
Table 2 Free floating car sharing operators in Italy
City Number of cars Number of users EV’s
CAR2GO Milan
(opening soon in Rome) 600 60.000 No
ENJOY Milan 450 55.00 No
Source: Own table based on data by CAR2GO, ENJOY (2013)
Both Car2Go and Enjoy have stated that, by 2014, they will bring their services to Rome,
Bologna, Florence and Turin.
BUSINESS EV CAR SHARING OPERATORS
Table 3 Main business car sharing operators
Operator
Fleet Technological key aspects
Locations Operator
Total fleet
No. of EVs
Booking Access System Payment
E-VAI SEMS
(private company) 130 75 Yes Card
Station-based
Credit card
Milan, Lombardy small cities
EQ SHARING MILANO
NHP ESCO
(private company) 120 120 Yes Card
Station-based
Credit card
Milan city center
BEE NHP ESCO
(private company) 40 40 Yes Card
Station-based
Credit card
Naples
ROME CAR SHARING
Roma Servizi per la Mobilità S.r.L.
(ICS) 124 10 Yes Card
Station-based
Credit card
Rome,
GUIDAMI ATM Servizi
(private company) 151 2 Yes Card
Station-based
Credit card
Milan
CI.RO
Smart City Naples
(public company)
11 11 Yes Card Station-based
Credit card
Naples
Source: Own table based on data by E-VAI, EQ SHARING MILANO, BEE, ROME CAR SHARING, GUIDAMI, CI.RO (2013)

e-Mobility Fleet Schemes and Market Potentials – ITALY
16
3.5 Research & Development
KEY R&D PROJECTS ON ELECTRIC VEHICLES
Table 4 R&D projects on electric vehicles
Title Key areas covered Coordinator Partners Budget Funding
ZERO REGIO
(2004 – 2009)
Use of hydrogen as an alternative motor fuel.
Develop infrastructure systems for hydrogen consisting of hydrogen production, compression, storage and distribution
equipment and integration of these in conventional refueling stations
Adaptation and demonstration of 700 bar refuelling technology for hydrogen
Demonstrate of hydrogen as an alternative fuel via automobile-fleet field tests at two locations: Rhein-Main (Germany), and Lombardia, (Italy).
Show ways and prospects for faster penetration of hydrogen as alternative motor fuel.
Infraserv Gmbh & Co. Höchst Kg
(Germany)
16 18.68 million EUR
FP6
European Commission
Source: Own table based on project web pages (2013)
DEMONSTRATIVE E-FLEET PROJECTS
Since 2011, the Italian AEEG Authority (Authority for Electric Energy and Gas) has been
supporting projects on electric vehicles, charging infrastructures and market & managing
systems, some of them directly connected to the above mentioned projects:
Table 5 Demonstrative e-fleet projects
Project Key areas covered Years Nº of EVs
Nº of partners
Coordinator
E-Mobility Project
Installation of a large charging infrastructure (more than 400 charging points in three Italian cities) and an adequate fleet (100 EV Smart cars available for rental) in three cities of different size and traffic conditions: Milan, Pisa, and Rome.
2008
-
2013
100 2 Enel S.p.A.
(Italy)
E-Moving
Build up a recharging infrastructure for electric cars in Milan and Brescia with a total of 270 recharging points, while Renault will supply 47 vehicles (saloon cars and vans) available from its Zero Emission range, equipped with latest generation lithium-ion batteries.
2010
-
2015
47 >4 A2A S.p.A.
(Italy)

e-Mobility Fleet Schemes and Market Potentials – ITALY
17
ENEL Distribution S.p.A. (and HERA S.p.A. ) project
Involves six territorial contexts: cities in the Milan province, Pisa, Genoa, Bari, Perugia and the main cities in the Emilia Romagna region.
The project plan foresees to install 310 charging infrastructures distributed as follows: 270 by Enel Distribution and an additional of 40 (20 in Modena and 20 in Imola) by Hera.
2013
-
2015
>140 2
Enel Distribution
S.p.A. (Italy)
Class onlus project (Green Land Mobility)
Involves nine Italian provinces: Milan, Rome, Genoa, Bologna, Naples, Bari, Catania, Varese, Monza - Brianza, for a total of about seventy cities.
The project plan foresees to install 150 charging points in 107 big shopping centers and outlets and other 43 ones in all the Monza and Brianza province territory.
2012
-
2015
35 12
Class Onlus non
profit association
(Italy)
ENEL Energy S.p.A. project
The project plan foresees to install 26 charging infrastructures in Rome, Milan and other three cities in the Milan province.
Within this project, it will also be studied in deep the possible installation of two fast charging infrastructures (1 in Rome and 1 in Milan).
The choice of the infrastructure location takes into account the density of traffic flows in the selected cities.
2011 - 2014 60 3
Enel Energia S.p.A. (Italy)
Source: Own table based on project web page and Italian AEEG Authority (2013)
A new interesting project is the “GREEN LINE – sviluppo della mobilità sostenibile” project, a partnership between the Politecnico di Milano and Villa di Serio, Nembro, Alzano Lombardo, Albino, Ranica, Pradalunga and Gorle Municipalities (in the Bergamo province).
The idea is to design and create a sort of “green line” to connect the 7 small cities, setting up 61 electric charging stations and 122 dedicated green parking slots.
During the project life, public events, conferences and technical workshop will be organized to directly engage citizens, logistic companies and the Public Procurement Offices of the Municipalities invoved.

e-Mobility Fleet Schemes and Market Potentials – ITALY
18
4. Market Potentials
4.1 Main Drivers and Constraints
In general terms and at European level, the main market barriers for the successful
integration of electric mobility into European transport systems include technological,
infrastructural and cost-related aspects. Finding integrative solutions to overcoming the
current challenges concerning battery technology, standardisation of the recharging
infrastructure, interaction with electricity generation systems and cost and business case of
large scale introduction is crucial for the development of the electric mobility market in the
short and long term. The increased demand for EVs, along with the sharing of best practice
and extensive public and organisational awareness-raising activities, will help encourage
infrastructure and technological investments and reduce costs.
In 2010, GfK Eurisko managed a survey for Renault titled "The Italian and electric mobility:
expectations and potential".
This survey produced a first potential user profile, taking into account two target groups: the
“young people” group and the “adults” group.
Considering the target “young people” (49 cases), females (57%) are more prone to the
usage of electric vehicles than males. The age between 18-20 years (57%) is more prone to
EVs than the age between 16-17 years (43%).
Taking into account the target “adults” (159 cases), males (60%) are more prone to EVs.
The Study Centre of Direct Line (online-insurances company) has carried out a survey on a
sample of 1,000 Italians aged 18 to 65 years old. The objective of the survey was to
understand what Italians think about “green” cars (bi-fuel, electric, hybrid).
These are the most noticeable findings: 98% locates the lowest price of the car ownership
tax as one of the greatest advantages of having an electric car. Following this, the possibility
to move without constraints (97%) and free parking places in the Italian major cities (96 %), a
modern design (90%) and the characteristic that engine is extremely quiet (90%).
Regarding the problematic issues coming out from the survey: according to the 89% of
people, the lack of charging stations throughout the country is the main barrier, together with
the difficulty to know where to find the already available charging points (88%); it follows the
fact that market prices are still too high compared to the less modern and less technological
conventional gasoline-powered cars (86%); then it comes the impossibility to get a self-
service recharging (84%).
e-Mobility Fleet Schemes and Market Potentials – ITALY
19
5. Local Assessment
5.1 Starting Point
Milan is the second-most populous city in Italy and the capital of Lombardy. The city has a
population of about 1.4 million (2012), while its urban area is the 5th largest in the EU with an
estimated population of about 5,248,000.
Milan is the main industrial, commercial and financial centre of Italy and a leading global city.
It attracts more than 2 million annual visitors. It hosts numerous cultural institutions and
universities, with 185,000 enrolled students in 2011. The city is also well known for several
international events and fairs, including Milan Fashion Week and the Milan Furniture Fair, the
largest of its kind in the world, and will host the 2015 Universal Exposition.
Milan is an important transport hub divided into four modes of transport, managed by ATM
(the Transportation Company of the City of Milan): underground, bus, tram and trolley bus.
The surface network is used in a widespread manner throughout the city of Milan, the
municipalities of the urban area and a part of the territory of the Province.
Both transport networks are integrated to the railway line Trenord completion of an
intermodal system that allows the customer to move easily with public transport.
The ATM product range includes light rail, car sharing GuidaMi and bike sharing BikeMi.
ATM also manages 21 car parks matching, the parking system “SostaMilano”, with the
control of parking areas and all payment systems in the city.
The city has been active in promoting public transport and cycling, and should continue
strengthening efforts in this direction.
Since November 2012 the City Council started the process of drafting the PUMS (Urban Plan
of Sustainable Mobility), which provides a path of participation open to the city and to the
institutional and non-institutional actors involved and interested. The "Guidelines for the
Urban Mobility Plan" have been approved by the City Council with 10 points to follow to build
the Milan of the future:
1. Set a metropolitan vision system.
2. Develop the infrastructure for public transport.
3. Enhance rail service.
4. Make sustainable accessibility to new areas of urban transformation.
5. Increase the security levels, spreading the pedestrian areas and the islands
environmental.
6. Facilitate and support the cycling.
7. Rationalize the use of motor vehicles (Area C systems, sharing solutions and smart).
8. Make efficient parking system.
9. Promote the development of a new urban freight logistics.
10. Overcome barriers and make the city more accessible for everyone.
One of the most impactful actions, in a positive way, on the urban mobility of these years has
been the introduction of Area C. This is the Congestion Charge regulating access into the

e-Mobility Fleet Schemes and Market Potentials – ITALY
20
restricted traffic zone in the Milan city centre. It is active on Mondays, Tuesdays,
Wednesdays and Fridays (weekdays), from 7.30 to 19.30, and Thursday from 7.30 to 18,
with these restrictions:
3 free accesses for electric vehicles, mopeds and motor vehicles (motorcycles,
tricycles and quadricycles) and hybrid and bi-fuel vehicles (methane and liquid gas
powered).
2 toll accesses for petrol powered vehicles Euro 1 and more advanced ones and
petrol/diesel powered vehicles Euro 4 and more advanced ones, without particulate
filter.
3 bans to access and transit: diesel powered vehicles Euro 0, 1, 2 and 3, petrol
powered vehicles Euro 0(except waived) and vehicles or combinations of vehicles with
a length exceeding 7.50 meters (except waived)
The implementations of Area C aim to improve the conditions of life for those who live, work,
study and visit the city. Its objectives are:
o Reduce traffic into the Congestion Charge area;
o Implement a more effective public transport network and encourage the use of it;
o Reinforce the right of individual mobility;
o Find resources for investing on sustainable mobility for pedestrian, cycling and traffic
at moderate speeds;
o Improve the quality of urban life by reducing the number of accidents, the wild park,
noise pollution and air pollution.
5.2 General Aspects of Mobility
DEMOGRAPHY
Milan recorded a total population of 1,262,101 inhabitants in 2012. The median age of
population in 2011 was 45.1, quite older than national average age for the same year (43.5)
and the EU-27 (41.2). 19
In Figure 12 Milan´s population is classified between 2008 and 2012 in two categories: total
population and population aged between 18 and 70 years (old enough to get a driving
license).
In 2012, two thirds of total population was working population (66.67%), able to hold or
obtain a driving license. This percentage is similar in previous years, being the average for
period 2008-2012 of 67.64%.
From 2008 to 2012, Milan´s total population have decreased 2.89% and population aged
between 18 and 70 years has dropped 5.74%.
19
Eurostat (2013c) Population structure and Age.

e-Mobility Fleet Schemes and Market Potentials – ITALY
21
Figure 12 Demographic trends
Source: Own graphic based on Istituto Nazionale di Statistica (ISTAT) - Italian Statistical Office (2013)
MOBILITY PATTERNS
In 2008, 50% of the trips was done by public transport, 45% by own vehicle (car/motorbike)
and the remaining 5% by soft modes (walking or cycling). The small ratio of walking/cycling
contrasts with the national figures (13.01% of the trips), this is due to the high quality of the
public transport services of Milan, being the best of the country.
In 2012, the share of walking and cycling remained stable but 7% of trips changed, being
done by public transport instead of using own vehicle.
The number of average trips per person and day for these years was 2.70 and the average
distance per trip was 3.50 km.
Figure 13 Modal share 2008 and 2012
Source: Own graphic based on Agenzia Mobilità Ambiente Territorio (AMAT) - Mobility Agency of Milan (2013)

e-Mobility Fleet Schemes and Market Potentials – ITALY
22
5.3 The Milan Carpool
TOTAL VEHICLES
The number of passenger cars has almost remained stable from 2008 to 2011, increasing
0.07%, from 723.93 thousand in 2009 to 724.45 thousand in 2011.20
The average age for these cars in 2011 was 7.0 years.
Figure 14 Total vehicles registered 2008 - 2012
Source: Own graphic based on Istituto Nazionale di Statistica (ISTAT) - Italian Statistical Office (2013)
20
No data available for light transport vehicles from 2008 to 2010. No data available for year 2012. The data of
this section correspond to conventional fueled vehicles (ICEVs), no available data for other powertrain type.

e-Mobility Fleet Schemes and Market Potentials – ITALY
23
6. References
Agenzia Mobilità Ambiente Territorio (AMAT) - Mobility Agency of Milan
www.amat-mi.it/it/
Associazione Italiana Ricostruttori Pneumatici (AIRP) - Italian Association of Tyre Retreaders
http://www.asso-airp.it/
o Report “Analisi dell’Osservatorio Airp sulla Mobilità Sostenibile” (2013)
http://www.asso-airp.it/ew/ew_news2/press/2013-07ParcoAutoEcologicheITALIA.pdf
Associazione Nazionale delle Imprese Elettriche (ASSOELETTRICA) - National Association of Electric Companies
www.assoelettrica.it/
www.assoelettrica.it/wp-content/uploads/.../Enel-Mobilità-elettrica.pdf
Automobile Club d’Italia (ACI) - Automobile Club of Italy
www.aci.it
o Report “Analisi dell'anzianità del parco veicoli in Italia” (2011)
http://www.aci.it/fileadmin/documenti/studi_e_ricerche/dati_statistiche/Anzianita/Introduzione.pdf
o Report “Annuario statistic 2013”
http://www.aci.it/laci/studi-e-ricerche/dati-e-statistiche/annuario-statistico.html
Business car sharing operators.
City Council of Milan, Piano Urbano Della Mobilità - Urban Plan of Sustainable
Mobility (PUMS), (2012).
Commissione Italiana Veicoli Elettrici Stradali (CIVES) - Italian Commission for Electric Road Vehicles
http://www.ceiweb.it/
Council of the European Union (2010). Conclusions on clean and energy-efficient
vehicles for a competitive automotive industry and decarbonised road transport.
Brussels, 2010.
http://www.consilium.europa.eu/uedocs/cms_Data/docs/pressdata/en/intm/114617.pdf
Enel Spa – Energy vendor
http://www.enel.it/
European Commission (2011a) WHITE PAPER - Roadmap to a Single European
Transport Area: Towards a competitive and resource efficient transport system (2011)
COM/2011/0144 final.
European Commission (2011b) Europe 2020 Targets
http://ec.europa.eu/europe2020/pdf/targets_en.pdf
Eurostat (2013a) GDP at current market prices (accessed October 2013).
http://epp.eurostat.ec.europa.eu/statistics_explained/index.php/National_accounts_%E2%80%93_GDP

e-Mobility Fleet Schemes and Market Potentials – ITALY
24
Eurostat (2013b) Population on 1 January. (accessed October 2013)
http://epp.eurostat.ec.europa.eu/tgm/table.do?tab=table&language=en&pcode=tps00001&tableSelection
=1&footnotes=yes&labeling=labels&plugin=1
Eurostat (2013c) Population structure and Age (accessed October 2013)
http://epp.eurostat.ec.europa.eu/statistics_explained/index.php/Population_structure_and_ageing
Eurostat (2013d) Indicators Theme 6 Climate Change and Energy (accessed October
2013)
http://epp.eurostat.ec.europa.eu/portal/page/portal/sdi/indicators/theme6
Eurostat (2013e) Indicators Theme 7 Transport (accessed October 2013)
http://epp.eurostat.ec.europa.eu/portal/page/portal/sdi/indicators/theme7
European Automobile Manufacturers' Association (ACEA). Pocket guide 2013.
http://www.acea.be/images/uploads/files/POCKET_GUIDE_13.pdf
GfK Eurisko and Renault (2010) "The Italian and electric mobility: expectations and
potential".
Hybrid & Electric Vehicle Implementing Agreement (IA-HEV), Italy
http://www.ieahev.org/by-country/italy/
Iniziativa Car Sharing (ICS) - Car Sharing Initiative
http://www.icscarsharing.it/
International Energy Agency (2013 a) Electric Vehicle Sales and Government Targets
2013
http://www.iea.org/etp/tracking/electric-vehicles/
IEA (2013 b) Tracking Clean Energy Progress 2013
http://www.iea.org/publications/TCEP_web.pdf
IEA (2011) CO2 Emissions from fuel combustion 2011. Highlights.
http://www.iea.org/media/statistics/CO2highlights.pdf
Istituto Nazionale di Statistica (ISTAT) - Italian Statistical Office
www.istat.it
Osservatorio Autopromotec – Autopromotec Observatory.
http://www.autopromotec.com
Ricerchetrasporti -Decimo rapporto sulla mobilità in Italia (10th Report on mobility in
Italy)
http://www.ricerchetrasporti.it/tag/motivi-dello-spostamento/
Unione Nazionale Rappresentanti Autoveicoli Esteri (UNRAE) – National Union
Representatives of Foreign Vehicles
www.unrae.it

e-Mobility Fleet Schemes and Market Potentials – ITALY
25
eBRIDGE: Empowering e-fleets for business
and private purposes in cities
The sole responsibility for the content of this publication lies with the authors. It does not necessarily reflect the
opinion of the European Union. Neither the EASME nor the European Commission are responsible for any use
that may be made of the information contained therein.