employer-sponsored health insurance in new jersey · new jersey has more small businesses than the...
TRANSCRIPT

Employer-SponsoredHealth Insurance in New Jersey
A Databook fromRutgers Center for State Health Policy
Kimberley Fox, M.P.A.Cara L. Cuite, M.S.Yamalis Diaz, B.A.Joel C. Cantor, Sc.D.
Rutgers Center for State Health Policy317 George Street, Suite 400
New Brunswick, NJ 08901-2008www.cshp.rutgers.edu


ACKNOWLEDGMENTS
The authors would like to thank Marilyn Dahl, Senior Assistant Commissioner, New Jersey Department of
Health and Senior Services, and the New Jersey Task Force on Accessibility and Affordability, whose efforts to
assess coverage in the state led the Center for State Health Policy to produce this report. We would also like to
thank Jim Branscome at the Agency for Health Care Research and Quality who provided considerable assistance
in acquiring special request data from the MEPS-IC survey and assistance in data interpretation. At the Center for
State Health Policy, we would like to acknowledge the contributions of Felicity Tsikiwa, Paul Hamborg, Dorothy
Gaboda, and Mario Kravanja for their data management support and statistical consultation, and Lori Glickman,
Publications Manager, for assisting with report production. Finally, we thank The Robert Wood Johnson Founda-
tion for their sponsorship and support of this project.


1
INTRODUCTION
This databook presents an overview of employer-sponsored health insurance in New Jersey based on three
years of data from the Medical Expenditure Panel Survey Insurance Component (MEPS-IC), a national survey of
23,000 employers sponsored by the United States Agency for Healthcare Research and Quality (AHRQ). Data are
reported for selected categories of employers, plans, and employees in the United States, New Jersey, and neigh-
boring states of New York and Pennsylvania. In addition to comparing offer rates, eligibility and enrollment, premi-
ums, and employee contributions in New Jersey, the United States, New York, and Pennsylvania for all establish-
ments and by firm size, we report data by other firm characteristics such as type of ownership, industry, and the
nature of their workforce such as the percent of part-time employees and low-wage workers. We also examine the
level and type of self-insurance in the employer health insurance market, plan options offered, the differential costs
of specific plans, and waiting periods for employee eligibility. Finally, for those establishments that do not offer
health insurance, we provide information about their historical coverage and alternative benefits to help employees
pay for health costs.
This databook is structured to determine whether New Jersey is different from the rest of the country and
neighboring states in terms of:
� business characteristics;
� the rate of insurance coverage provided by different types of businesses;
� the percent of employees in establishments that offer health insurance;
� the characteristics of plans offered and the waiting periods required;
� the level of self-insurance, self-administration, and stop-loss coverage;
� the average single and family premiums and employee cost sharing within different typesof businesses;
� employee enrollment in employer-sponsored health insurance by firm size and by hours worked; and
� the nature of past and current efforts to provide health benefits among firms that do not offer health
insurance coverage.

2
METHODS
Rutgers’ Center for State Health Policy (CSHP) analyzed data from the MEPS-IC from 1996-1998, available on
public use tables and specially requested from AHRQ, the sponsoring federal agency that administers the survey.
The MEPS-IC is a national survey of a representative sample of business and government establishments with at
least one employee selected from the Standard Statistical Establishment list maintained by the Census Bureau and
the 1992 Census of Governments. The data were collected in 1997, 1998, and 1999 and reflect employer-based
insurance coverage available in the preceeding year (1996, 1997, and 1998). The sample allocation and design of
the sample support reliable state level estimates for many establishment, employee, and plan characteristics.
Specifically, the sample within each state was allocated to and selected from 14 strata by a combination of the size
of the establishment and the size of the firm. This databook reports findings for private-sector employers only.
The national response rate for the survey in 1997 was 66%, yielding a sample of 23,000 private business
establishments. The response rate for New Jersey private sector establishments was 59%, yielding a sample of
425 businesses, including those that did not offer health insurance. In 1997 and 1998, the response rate in New
Jersey was comparable but increased slightly. Note that while the sample may include some of the same busi-
nesses across years, the sample is cross-sectional, not longitudinal. In addition to stratifying the sample by size of
establishment and size of the firm, state-level estimates were also weighted to ensure representativeness (MEPS-
IC-001 Technical Appendix, www.meps.ahrq.gov/mepsdata/ic/technote.pdf).
MEPS-IC data are not public, but AHRQ publishes annual tables of most survey items by firm size for the
United States and by state that are accessible through their web site. In addition to analyzing data on these public
use tables, we requested data from AHRQ on survey items that were not reported on the public tables (such as
self-insurance rates) that would allow us to drill down into more depth on specific issues in New Jersey, allowing
cross-tabulations by specific types of employers that are not available on the public tables. These data were re-
quested prior to 1998 data being released and thus are only available for 1996 and 1997. Specifically, we re-
quested more in-depth data on offer and take-up rates by specific establishment characteristics, on self-insurance,
and on prior coverage for establishments that do not offer health insurance.
In this databook, which is targeted to a New Jersey audience, we present data that compare New Jersey and
United States trends in employer-sponsored health insurance between 1996 and 1998. We also present cross-

3
sectional comparisons of New Jersey with the United States and its two neighboring states of Pennsylvania and
New York as points of reference in 1997, the most recent year in which all relevant data were available.
As with any survey, there is sampling error associated with the estimates presented here. Sampling error
increases with smaller sample sizes. Thus, small differences should be interpreted with caution. Using the stan-
dard of reliability utilized by the AHRQ, we do not report those estimates where the standard error is greater than
30% of the estimate. To assist in the interpretation of the data, we conducted significance tests across years within
New Jersey and the United States and of cross-sectional comparisons between New Jersey and the United States,
New York, and Pennsylvania in 1997. We report statistical significance below p =.05.
For the purposes of interpreting the tables in this databook, we utilized the establishment as our primary unit of
measurement. An establishment is considered an economic unit at a single physical location where business is
conducted or services or industrial operations are performed. A firm would be the larger unit, defined as a busi-
ness with a separate management and legal structure, which represents the entire organization, including the
company headquarters and all divisions, subsidiaries, and branches within the company. In the case of a single-
establishment firm, the firm and establishment are identical. The unit of analysis used here is the establishment,
but we classify establishments by firm size because health insurance decisions are generally made at that level.
One final note is that estimates reported here may not be comparable to the October 1999 issue brief pub-
lished by CSHP because of subsequent changes in MEPS-IC estimation methods.

4
NJ US NY PA
Firm Characteristics50% or More Low-wage Employees1 13.8% 20.1% 15.1% 21.6%Greater than 25% Part-time Employees 33.5% 36.9% 35.8% 41.7%Has Union Employees 6.3% 4.2% 7.1% 4.6%In Business Less than 5 Years 38.1% 46.1%* 38.0% 37.1%Single Establishment Firms 83.8% 77.3% 83.5% 76.2%
Firm Size<50 Employees 83.3% 78.2%* 84.1% 76.4%*>50 Employees 16.7% 21.8%* 15.9% 23.6%*
Type of OwnershipUnincorporated 25.8% 35.0%* 29.7% 40.2%*S Corporation2 31.4% 23.8%* 30.1% 23.0%Corporation 46.1% 47.8% 45.4% 43.5%Partnership/Joint Venture 5.8% 6.7% 6.1% 7.2%Sole Proprietorship 16.7% 21.8%* 18.4% 26.2%*
IndustryAgriculture/Forestry/Fishing NR 4.6% 2.1% 2.6%Mining/Manufacturing 7.8% 6.7% 5.6% 8.3%Construction 10.4% 8.9% 9.6% 8.6%Transportation/Communication/Utilities 4.7% 4.2% 3.1% 4.7%Wholesale Trade 10.1% 7.2% 8.5% 7.8%Retail 20.3% 22.6% 20.4% 24.6%Finance/Insurance/Real Estate 9.8% 10.1% 12.1% 9.4%Services 35.4% 35.6% 38.6% 34.0%
Table 1A: Percent of Establishments by Selected Characteristics, NJ/US/NY/PA,1997
1 Low wage is defined as earning <$6.50 per hour2 A form of corporation allowed by the IRS for most companies with 75 or fewer shareholders*Significantly different than New Jersey (p<.05)NR indicates that the estimate is not reliable using standards established by AHRQ; see “Methods”Source: MEPS Special Request data & MEPS-IC 1997 Tables; www.meps.ahrq.gov/data.htm; Tables II.A.1.a, II.A.1.b

5
TABLES 1A AND 1B
Characteristics of businesses influence whether they purchase health insurance. Smaller companies, busi-
nesses with more low-wage or part-time workers, newer businesses, and certain industries are less likely to offer
health insurance. Understanding the nature of the state’s business sector is helpful in targeting public policies to
encourage insurance coverage. Tables 1A and 1B show the characteristics of New Jersey private sector establish-
ments and employment within those establishments compared with the United States and neighboring states.
TABLE 1A—KEY FINDINGS
� New Jersey has more older businesses than the national average.
� New Jersey has more small businesses than the national average.
� New Jersey has fewer unincorporated establishments and fewer establishments with sole proprietorship,
but more S corporations than the national average.
� Businesses in New Jersey and New York are similar in terms of size, ownership, industry, and
other characteristics.

6
NJ US NY PA
Firm Characteristics50% or More Low-wage Employees1 10.4% 15.4% 12.4% 15.9%25% or More Part-time Employees 19.3% 28.1%* 28.7% 36.5%*
Firm SizeLess than 50 Employees 30.5% 31.7% 33.0% 30.9%50 or More Employees 69.5% 68.3% 67.0% 69.1%
Type of OwnershipUnincorporatedS Corporation2 15.7% 15.2% 15.9% 15.8%Corporation 68.8% 72.7% 72.7% 66.9%Partnership/Joint Venture 9.5% 5.9% 7.6% 5.4%Sole Proprietorship 6.0% 6.2% 3.9% 11.9%
IndustryAgriculture/Forestry/Fishing 0.3% 1.8%* 0.4% 0.8%Mining/Manufacturing 19.4% 18.2% 13.6% 19.3%Construction 3.8% 5.1% 4.2% 4.8%Transportation/Communication /Utilities 4.9% 6.1% 5.5% 5.4%Wholesale Trade 8.5% 6.6% 8.4% 4.2%Retail 15.8% 20.4% 16.0% 20.7%Finance/Insurance/Real Estate 7.3% 7.6% 13.8% 6.0%Services 39.9% 34.3% 38.1% 38.8%
1 Low wage is defined as earning <$6.50 per hour2 A form of corporation allowed by the IRS for most companies with 75 or fewer shareholders*Significantly different than New Jersey (p<.05)Source: MEPS Special Request Data & MEPS-IC 1997 Tables; www.meps.ahrq.gov/data.htm; Tables II.B.1.a
Table 1B: Percent Distribution of Employees by Selected Characteristics ofEstablishments, NJ/US/NY/PA,1997

7
TABLE 1B–KEY FINDINGS
� New Jersey employees are less likely to work in an establishment with 25% or more part-time
employees than the United States average.
� New Jersey employees are less likely to work in the agriculture, forestry, or fishing industries
than the United States average.
� Most New Jersey employees work at large companies, despite the preponderance of small
businesses in the state.
� While not a statistically significant difference, employees in New Jersey are less likely to work at firms that
have 50% or more low-wage employees.

8
NJ US
Avg. Avg.Annual Annual
1996 1997 1998 % Change 1996 1997 1998 % Change
% Establishments that OfferHealth Insurance
All Establishments 55.9% 52.8% 57.4% 1.6% 52.9% 52.4% 55.2%* 2.2%
<50 Employees 46.2% 44.5% 49.3% 3.6% 41.7% 40.4% 43.7%* 2.5%
>50 Employees 94.3% 93.9% 95.9% 0.9% 93.9% 95.6%* 96.3% 1.3%
% Employees in Establishments thatOffer Health Insurance
All Establishments 87.0% 89.0%† 89.2% 1.3% 86.5% 85.7% 87.0% 0.3%
<50 Employees 63.6% 67.6% 70.6% 5.4% 62.3% 62.3% 64.7% 1.9%
>50 Employees 97.1% 98.5% 97.8% 0.4% 97.1% 96.6% 97.5% 0.2%
Table 2A: Percent of Private Sector Establishments that Offer Health Insurance and Percent ofEmployees in those Establishments by Firm Size, NJ and US, 1996 – 1998
*Significantly different than previous year (p<.05)† Significantly different than corresponding year in the United States (p<.05)Source: MEPS–IC 1996, 1997, 1998 Tables; www.meps.ahrq.gov/data.htm; Tables II.A.2, II.B.2

9
TABLES 2A AND 2B
In the late 1990s, national reports suggested that the number of employers offering health insurance in-
creased, in part due to the strong economy and the need to attract workers during a period of high employment.
Tables 2A and 2B show national and New Jersey trends across the years 1996–1998 to assess whether the
national patterns are present in New Jersey. Since firm size is a strong predictor of insurance coverage, these
tables and Figures 1 and 2 also examine these trends in small and large businesses.
KEY FINDINGS
� The percentage of firms nationwide offering health insurance to their employees in 1998 rose significantly.
This increase is present for both small and large firms.
� This trend did not result in an increase of the same magnitude in the percent of employees working in
establishments offering health insurance, suggesting that the increase in offerings occurred disproportion-
ately in smaller establishments.
� By 1998, there was an increase in the percent of establishments offering health insurance in New Jersey,
but not at the statistically significant level seen nationally. There was also a slight increase in the percentage
of employees in New Jersey businesses that offer health insurance.
� The percent of New Jersey establishments offering health insurance, particularly in smaller businesses, is
consistently above the United States average, although not at a statistically significant level.
� Similarly, the percentage of New Jersey employees in establishments that offer health insurance is consis-
tently higher than the national average, particularly in small businesses, although not always at a statisti-
cally significant level.
� In New Jersey small businesses, more than two thirds of employees are offered health insurance, and the
rate of coverage has increased between 1996 and 1998, although not at a statistically significant level.

10
NJ US NY PA
% Establishments that Offer Health Insurance
All Establishments 52.8% 52.4% 49.1% 58.0%
< 50 Employees 44.5% 40.4% 40.5% 47.0%
> 50 Employees 93.9% 95.6% 94.3% 93.6%
% Employees in Establishments that Offer Health Insurance
All Establishments 89.0% 85.7%* 86.9% 88.7%
< 50 Employees 67.6% 62.3% 66.6% 70.0%
>50 Employees 98.5% 96.6% 96.9% 97.1%
Table 2B: Percent of Private Sector Establishments that Offer Health Insurance and Percent ofEmployees in those Establishments by Firm Size, NJ/US/NY/PA, 1997
*Significantly different than New Jersey (p<.05)Source: MEPS-IC 1997 Tables; www.meps.ahrq.gov/data.htm; Tables II.A.2, II.B.2

11
� A large majority of employees in New Jersey and nationally work in companies that offer health insurance.
� Almost all employees of large businesses in both New Jersey and the United States are offered
health insurance.
� In 1997, New Jersey employees were more likely than employees nationally to work in a company that
offered health insurance.
.
0%
10%
20%
30%
40%
50%
60%
70%
80%
90%
100%
89.2%87.0%
70.6%64.7%
97.8% 97.5% NJ
US
0%
10%
20%
30%
40%
50%
60%
70%
80%
90%
100%
57.4% 55.2%
43.7%
95.9% 96.3%
49.3%
NJ
US
Figure 1: Percent of Employees in Establishmentsthat Offer Health Insurance by Firm Size, NJ andUS, 1998
Figure 2: Percent of Establishments that OfferHealth Insurance Coverage by Firm Size, NJ andUS, 1998
All Establishments <50 Employees >50 Employees <50 Employees >50 EmployeesAll Establishments

12
NJ US
Avg.Annual Annual
1996 1997 1998 % Change 1996 1997 1998 % Change% Low-wage Employees1
Less than 50% 55.5% 57.1% ~ 3.0% 55.4% 55.9% 56.9% 1.3%50% or More 37.7% 31.0% ~ -17.7% 31.1% 29.4% 30.7% -0.5%
% Part-Time Employees2,3
Less than 25% 63.4% 60.0% ~ -5.4% 62.1% 60.3% 62.7% 0.5%25% or More 41.6% 37.8% ~ -9.0% 36.7% 39.2% 32.6% -5.0%
Type of OwnershipS Corporation4 49.0% 41.9% ~ -14.4% 47.0% 45.4% ~ -3.4%Corporation 70.3% 68.5% ~ -2.5% 71.8% 71.7% ~ 0.1%Partnership/Joint Venture 48.1% 58.4% ~ 21.4% 48.0% 47.3% ~ -1.4%
Sole Proprietorship 30.4% 27.5% ~ -9.6% 23.5% 22.6% ~ -3.8%
IndustryAgriculture/Forestry/Fishing 22.9% NR ~ ~ 29.0% 21.6%* 28.1% 2.3%Mining/ Manufacturing2 68.5% 73.4% ~ 7.1% 70.7% 66.2% 72.4% 1.5%Construction 35.8% 51.4% ~ 43.6% 40.1% 40.5% 43.1% 3.8%Transportation/Communication/Utilities 57.2% 59.6% ~ 4.2% 58.2% 59.1% 64.4% 5.3%Wholesale Trade 69.2% 50.8% ~ -26.6% 67.8% 65.6% 69.6% 1.4%Retail 59.3% 43.9% ~ -26.0% 53.2% 53.5% 54.9% 1.6%Finance/Insurance/Real Estate 45.8% 65.2% ~ 42.3% 62.7% 62.3% 64.4% 1.4%
Services 56.1% 51.6% ~ -8.1% 49.8% 50.5% 53.5%* 3.7%
Table 3A: Percent of Establishments that Offer Health Insurance by Selected Characteristics,NJ and US, 1996 – 1998
1 Low wage is defined as earning <$6.50 per hour2 Due to changes in reporting patterns in 1998, a weighted average was computed3 Reporting in 1998 was changed to “25% or Less” from “Less than 25%”4 A form of corporation allowed by the IRS for most companies with 75 or fewer shareholders* Significantly different than previous year (p<.05)† Significantly different than corresponding year in the United States (p<.05)~ Data not availableNR indicates that the estimate is not reliable using standards established by AHRQ; see “Methods”Source: MEPS Special Request data & MEPS-IC 1998 Tables; www.meps.ahrq.gov/data.htm; Tables I.A.1, I.A.2

13
TABLES 3A AND 3B
While health insurance offer rates overall and in small and large businesses have increased in both New
Jersey and the United States, it is useful to look at other subgroups of private sector establishments to see if this
trend is consistent for different types of businesses. For example, national studies have shown that employers
that rely heavily on low-wage or part-time workers are less likely to offer health insurance. Type of ownership and
industrial sector are also associated with health insurance offer rates. In designing potential policy interventions
to improve coverage, it is useful to know which sectors have low insurance offer rates. Tables 3A and 3B show
offer rates by selected characteristics. Note that while United States estimates are based on data available on
public use tables, the New Jersey figures were specially requested from AHRQ and 1998 data were not available
for this publication.
KEY FINDINGS
� Generally, patterns of offer rates by establishments in New Jersey and the United States were similar
between 1996 and 1998.
� Establishments that use 50% or more low-wage employees, have 25% or more part-time employees,
are sole proprietorships, or are in the agriculture, forestry, and fishing industries are much less likely to offer
health insurance than other businesses, both in New Jersey and nationally.
� In almost all the selected categories, New York businesses were less likely, and businesses in Pennsylvania
were more likely, to offer health insurance than similar businesses in New Jersey. However, these differences
in offer rates were not statistically significant.

14
NJ US NY PA
% Low–wage Employees1
Less than 50% 57.1% 55.9% 52.0% 62.7%50% or More 31.0% 29.4% 29.4% 32.1%
% Part–Time Employees2,3
Less than 25% 60.0% 60.3% 57.2% 69.0%25% or More 37.8% 39.2% 35.0% 42.5%
Type of OwnershipS Corporation4 41.9% 45.4% 45.2% 53.6%Corporation 68.5% 71.7% 60.0% 79.3%Partnership/Joint Venture 58.4% 47.3% 57.4% 54.5%Sole Proprietorship 27.5% 22.6% 26.0% 30.3%
IndustryAgriculture/Forestry/Fishing NR 21.6% 10.3% 31.5%Mining/Manufacturing2 73.4% 66.2% 47.3% 77.2%Construction 51.4% 40.5% 48.2% 40.7%Transportation/Communication/Utilities 59.6% 59.1% 61.1% 61.6%Wholesale Trade 50.8% 65.6% 54.9% 71.1%Retail 43.9% 53.5% 42.6% 51.2%Finance/Insurance/Real Estate 65.2% 62.3% 60.9% 65.2%Services 51.6% 50.5% 49.7% 58.4%
Table 3B: Percent of Establishments that Offer Health Insurance by Selected Characteristics,NJ/US/NY/PA, 1997
1 Low wage is defined as earning <$6.50 per hour2 Due to changes in reporting patterns in 1998, a weighted average was computed3 Reporting in 1998 was change to “25% or Less” from “Less than 25%”4 A form of corporation allowed by the IRS for most companies with 75 or fewer shareholdersNR indicates that the estimate is not reliable using standards established by AHRQ; see “Methods”Source: MEPS Special Request data

15
1 Low wage is defined as earning <$6.50 per hour2 Due to changes in reporting patterns in 1998, a weighted average was computed3 Reporting in 1998 was changed to “25% or less” from “less than 25%”4 A form of corporation allowed by the IRS for most companies with 75 or fewer shareholders† Significantly different than corresponding year in the United States (p<.05)NR indicates that the estimate is not reliable using standards established by AHRQ; see “Methods.”~ Data not availableSource: MEPS Special Request data & MEPS–IC 1998 Tables; www.meps.ahrq.gov/data.htm; Tables I.B.1.a, I.B.2
NJ US
Avg.Annual Annual
1996 1997 1998 % Change 1996 1997 1998 % Change
All Establishments 87.0% 89.0%† 89.2% 1.3% 86.5% 85.7% 87.0% 0.3%
% Low–wage Employees1 Less than 50% 87.8% 88.4% ~ 0.6% 87.4% 87.5% 86.5% -5.3%50% or More 45.1% 64.9% ~ 44.0% 64.0% 61.3% 57.4% -0.5%
% Part–Time Employees2,3 Less than 25% 92.8% 92.4% ~ -0.5% 91.6% 90.0% 91.2% -0.2%
25% or More 67.9% 75.4% ~ 11.2% 72.4% 74.8% 76.4% 2.7%
Type of Ownership S Corporation4 70.3% 67.6% ~ -3.8% 74.6% 72.6% ~ -2.7%Corporation 93.2% 95.1%† ~ 2.1% 92.8% 92.7% ~ 0.0%Partnership/Joint Venture 91.4% 97.5%† ~ 6.7% 81.7% 82.1% ~ 0.6%Sole Proprietorship 51.8% 63.0% ~ 21.4% 43.4% 44.7% ~ 3.2%
Industry
Agriculture/Forestry/Fishing 42.9% NR ~ ~ 60.1% 50.5% 61.4% 2.8%Mining/ Manufacturing 98.1% 96.8% ~ -1.3% 94.8% 95.1% 96.0% 0.6%Construction 49.8% 82.6% ~ 65.8% 73.7% 70.1% 72.4% -0.8%Transportation/Communication/Utilities 78.1% 83.8% ~ 7.4% 91.1% 91.7% 93.3% 1.2%Wholesale Trade 96.2% 84.3% ~ -12.4% 91.6% 91.3% 93.1% 0.8%Retail 79.0% 81.3% ~ 2.9% 81.3% 81.1% 81.9% 0.4%Finance/Insurance/Real Estate 85.7% 93.8% ~ 9.4% 92.4% 92.3% 93.5% 0.6%
Services 85.8% 90.6%† ~ 5.6% 85.1% 84.3% 85.1% 0.0%
Table 4A: Percent of Employees in Establishments that Offer Health Insurance by SelectedCharacteristics, NJ and US, 1996 – 1998

16
NJ US NY PA
All Establishments 89.0% 85.7%* 86.9% 88.7%
% Low-wage Employees1
Less than 50% 88.4% 87.5% 87.1% 90.6%50% or More 64.9% 61.3% 68.4% 62.4%
% Part-Time Employees Less than 25% 92.4% 90.0% 91.0% 93.8%25% or More 75.4% 74.8% 76.8% 79.7%
Type of OwnershipS Corporation2 67.6% 72.6% 68.4% 78.7%Corporation 95.1% 92.7%* 92.4% 94.4%Partnership/Joint Venture 97.5% 82.1%* 92.1% 75.7%*Sole Proprietorship 63.0% 44.7% 42.9% 74.3%
IndustryAgriculture/Forestry/Fishing NR 50.5% 2.9% 40.8%Mining/Manufacturing 96.8% 95.1% 93.2% 92.6%Construction 82.6% 70.1% 67.3% 81.2%Transportation/Communication/Utilities 83.8% 91.7% 91.6% 96.1%Wholesale Trade 84.3% 91.3% 91.9% 88.8%Retail 81.3% 81.1% 76.7% 83.0%Finance/Insurance/Real Estate 93.8% 92.3% 93.1% 93.4%Services 90.6% 84.3% 88.1% 89.9%
Table 4B: Percent of Employees in Establishments that Offer Health Insurance by SelectedCharacteristics, NJ/US/NY/PA, 1997
1 Low wage is defined as earning <$6.50 per hour2 A form of corporation allowed by the IRS for most companies with 75 or fewer shareholders* Significantly different than New Jersey (p<.05)NR indicates that the estimate is not reliable using standards established by AHRQ; see “Methods.”Source: MEPS Special Request data

17
TABLES 4A AND 4B
Policymakers are interested not only in how many businesses offer health insurance but what percent of em-
ployees are employed in those businesses. Since larger businesses are more likely to offer health insurance,
usually a larger percentage of employees are offered health insurance than establishment offer rates might initially
indicate. Tables 4A and 4B show the percent of employees within specific categories of businesses that are offered
health insurance.
KEY FINDINGS
� In 1997, New Jersey employees were more likely to work in establishments that offer health insurance than
the average United States employee.
� In 1997, approximately 95–98% of New Jersey employees in corporations, partnerships, and joint ventures
worked in establishments that offered health insurance. This is significantly higher than the national average.
� The percent of New Jersey employees in establishments that offer health insurance with 50% or more low-
wage workers increased between 1996 and 1997, but not significantly.

18
NJ US
Avg. Avg.Annual Annual
1996 1997 1998 % Change 1996 1997 1998 % Change
Offer Choice of Plans 20.0% 24.4% 33.5% 29.6% 21.5% 28.1%* 32.4%* 23.0%
Family Coverage Offered None 10.4% 10.4% ~ -0.8% 8.4% 8.9% ~ 5.5%
Some/All 89.6% 89.7% ~ 0.1% 91.6% 91.2% ~ -0.5%
Plans Offered Conventional Indemnity 24.3% 19.9% 17.8%† -14.3% 27.9% 25.2%* 22.8%* -9.6%Any Managed Care 82.1% 89.3% 89.2% 4.3% 78.6% 84.4%* 86.4%* 4.9%Exclusive Provider 32.4% 34.3% 35.0% 4.0% 32.4% 37.8%* 38.6% 9.4%Preferred Provider 61.9% 64.6% 62.4% 0.5% 55.1% 61.3%* 60.9% 5.3%
Waiting Period Required 68.0% 70.2% ~ 3.3% 70.6% 69.6% ~ -1.4%
Typical Waiting Period Less than 2 Weeks 1.3% 0.0%† ~ -100.0% 0.6% 0.8% ~ 50.0%Between 2 Weeks and 1 Month 7.5% 8.1% ~ 8.0% 8.5% 8.6% ~ 1.5%One to 3 Months 63.4% 68.1% ~ 7.4% 73.7% 72.7% ~ -1.3%
Greater than 3 Months 27.8% 23.8% ~ -14.3% 17.2% 17.8% ~ 3.3%
Table 5A: Characteristics of Plans Offered at Establishments that Offer Health Insurance,NJ and US, 1996 – 1998
† Significantly different than corresponding year in the United States (p<.05)* Significantly different than previous year (p<.05)~ Data not availableSource: MEPS–IC 1996, 1997, 1998 Tables; www.meps.ahrq.gov/data.htm; Tables II.A.2.b, II.A.2.b(1), II.A.2.b (2), II.A.2.b (3), II.A.2.c, II.A.2.c (1), II.A.2.c. (2), II.A.2.c(3), II.A.2.d

19
TABLES 5A AND 5B
Among establishments offering health insurance, the number and type of plan options offered and the period
that employees may have to wait in order to be eligible for the health plan can vary. Table 5A and Figure 3 show
New Jersey and United States trends and Table 5B shows neighboring state comparisons in 1997. Any managed
care indicates that the business offered at least one managed care plan. Exclusive provider plans are a specific
type of managed care plan that are similar to HMOs in that they restrict members’ access to physicians within their
network. Preferred provider plans include both preferred provider organizations and point-of-service arrange-
ments that encourage members to utilize physicians within their network but also pay some portion of the costs for
providers outside their network. “Conventional indemnity” plans have no network and pay on a fee-for-service basis.
CHOICE OF PLANS—KEY FINDINGS:
� The vast majority of establishments in New Jersey and the United States only offer one plan to their employees.
� The percent of United States establishments offering a choice of plans has increased significantly from 1996
to 1998. It has also increased in New Jersey establishments, but not at a statistically significant level.
� In 1997, New Jersey establishments were significantly less likely to offer a choice of plans than establish-
ments in New York or Pennsylvania.
� Managed care is the predominant type of health plan offered by establishments in New Jersey, New York,
Pennsylvania, and nationwide. In 1997, a higher percent of New Jersey establishments offered at least one
managed care plan.
� The percent of New Jersey establishments that offer conventional indemnity insurance was lower than the
national average in 1998. Nationwide, the percent of establishments offering this type of insurance declined
significantly between 1996 and 1998.

20
NJ US NY PA
Offer Choice of Plans 24.4% 28.1% 32.7%* 34.4%*
Family Coverage OfferedNone 10.4% 8.9% 9.5% 9.7%Some/All 89.7% 91.2% 90.6% 90.3%
Plans OfferedConventional Indemnity 19.9% 25.2% 25.2% 36.8%*Any Managed Care 89.3% 84.4% 88.1% 77.7%*Exclusive Provider 34.3% 37.8% 46.9%* 45.3%Preferred Provider 64.6% 61.3% 57.7% 49.9%*
Waiting Period Required 70.2% 69.6% 58.3%* 60.7%*
Typical Waiting PeriodLess than 2 weeks 0.0% 0.8%* 0.6% 0.0%Between 2 weeks and 1 month 8.1% 8.6% 11.5% 9.1%One to 3 months 68.1% 72.7% 64.4% 72.8%Greater than 3 months 23.8% 17.8% 23.5% 18.1%
Table 5B: Characteristics of Plans Offered at Establishments that Offer Health Insurance,NJ/US/NY/PA, 1997
* Significantly different than New Jersey (p<.05)Source: MEPS–IC 1997 Tables; www.meps.ahrq.gov/data.htm; Tables II.A.2.b, II.A.2.b(1), II.A.2.b (2), II.A.2.b (3), II.A.2.c, II.A.2.c (1), II.A.2.c. (2), II.A.2.c (3), II.A.2.d

21
19980%
10%
20%
30%
40%
50%
60%
70%
80%
90%
100%
1996 1997
Any Managed Care
Preferred Provider
Exclusive Provider
Conventional Indemnity
NJ
US
� New Jersey establishments offering managed care plans are more likely to offer preferred provider than
exclusive provider plans.
� Significantly more New York establishments offer exclusive provider plans and fewer Pennsylvania
establishments offer preferred provider plans than New Jersey establishments.
WAITING PERIODS—KEY FINDINGS:
� More than two-thirds of New Jersey and United States businesses offering health insurance have a waiting
period before an employee is eligible for coverage.
� Most waiting periods in New Jersey and the United States are for one to three months. Approximately one
quarter of New Jersey establishments reported waiting periods of longer than 3 months.
� New Jersey is much more likely than New York and Pennsylvania to impose a waiting period for
insurance coverage.
Figure 3: Plan Types Offered at Establishments that Offer Health Insurance, NJ and US, 1996 — 1998

22
* Significantly different than previous year (p<.05)† Significantly different than corresponding year in the US (p<.05)Source: MEPS Special Request data
NJ US
Annual Annual1996 1997 1998 % Change 1996 1997 1998 % Change
Extent of Self-InsuranceAll 17.7%† 19.8%† ~ 12.0% 25.2% 26.2% ~ 3.8%Some 4.3% 2.9%† ~ -33.6% 3.7% 5.6%* ~ 51.2%None 78.0% 77.3%† ~ -0.8% 71.1% 68.2%* ~ -4.0%
If Self-Insured:
Self-Administration Status
Some/All 36.1% 41.8% ~ 15.8% 31.4% 33.9% ~ 7.7%
None 63.9% 58.2% ~ -8.9% 68.6% 66.2% ~ -3.5%
Stop Loss Coverage
Some/All 75.3% 52.7% ~ -30.1% 62.6% 40.8%* ~ -34.8%
None 24.7% 47.3% ~ 92.0% 37.4% 59.2%* ~ 58.4%
Table 6A: Extent and Type of Self-Insurance at Establishments that Offer Health Insurance,NJ and US, 1996 – 1998

23
TABLES 6A AND 6B
Private establishments sometimes self-insure employee health care costs, rather than purchasing insurance
through an insurance company or health plan. These establishments are usually not regulated by states, but by
the federal government as established under the Employee Retirement Income Security Act (ERISA). Self-insur-
ance can take a number of different forms. Establishments may choose to underwrite the risk but still contract with
a health plan or insurer to administer the benefit. Other companies administer the benefit themselves. For protec-
tion from catastrophic losses, some self-insured companies purchase stop-loss insurance to cover health expenses
that exceed a certain limit. Tables 6A and 6B show the extent of self-insurance by establishments in New Jersey
and the United States as well as neighboring states and for those that are self-insured, whether they self-adminis-
ter and purchase stop-loss insurance.
Figure 4 provides a graphical representation of the extent of self-insurance in New Jersey and the United
States in 1997, and Figure 5 shows the total number of employees in New Jersey enrolled in self-insured and
purchased (non-self-insured) plans in 1998.
KEY FINDINGS
� Approximately one quarter of New Jersey establishments are either fully or partially self-insured.
� New Jersey establishments are significantly less likely to be self-insured than the national average.
� Although New Jersey establishments are significantly below the national average in terms of self-insurance,
they are not significantly different from their neighboring states’ establishments.
� For New Jersey establishments that are self-insured, most contract with an external organization to administer
the benefit.
� Nationally, self-insured companies are significantly less likely to purchase stop-loss insurance than self-
insured companies in New Jersey.
� The majority of New Jersey employees are enrolled in health plans that are purchased by their employer
rather than plans that are self-insured.

24
* Significantly different than New Jersey (p<.05)Source: MEPS Special Request data
NJ US NY PA
Extent of Self-InsuranceAll 19.8% 26.2%* 22.6% 24.8%Some 2.9% 5.6%* 5.8% 6.0%None 77.3% 68.2%* 71.6% 69.1%
If Self-Insured:Self-Administration StatusSome/All 41.8% 33.9% 60.3% 34.6%None 58.2% 66.2% 39.7% 65.4%
Stop-Loss CoverageSome/All 52.7% 40.8% 20.8%* 39.3%None 47.3% 59.2% 79.3%* 60.7%
Table 6B: Extent and Type of Self-Insurance at Establishments that Offer Health Insurance,NJ/US/NY/PA, 1997

25
0
200
400
600
800
1000
1200
Self-Insured Plans
Purchased Plans
¤
Th
ou
sa
nd
s o
f P
ers
on
s
1,195,000
972,000
1,195,000
972,000
No Self-Insurance/ All Purchased
Some Self-Insurance
All Self-Insurance
NJ US
Figure 4: Extent of Self-Insurance in Establishments that Offer Health Insurance, NJ and US, 1997
Figure 5: Employees Enrolled in Purchased Plans vs. Self-Insured Plans, NJ, 1997
19.8%
77.3%
2.9%
26.2%
68.2% 5.6%
Purchased
Plans
Self-Insured
Plans
Source: MEPS Special Request Data

26
* Significantly different than previous year (p<.05)† Significantly different than corresponding year in the US (p<.05)Source: MEPS-IC 1996, 1997, 1998 Tables; www.meps.ahrq.gov/data.htm; Tables II.C.1, II.D.1
NJ US
Avg. Avg.Annual Annual
1996 1997 1998 % Change 1996 1997 1998 % Change
Average Single Premiums
All Establishments $2,354† $2,360† $2,541† 4.0% $1,992 $2,050 $2,174* 4.5%
<50 Employees $2,559† $2,576† $2,802† 4.7% $2,070 $2,107 $2,235* 3.9%
>50 Employees $2,285† $2,291 $2,441 3.4% $1,965 $2,029 $2,151* 4.6%
Average Family Premiums
All Establishments $5,846† $6,228† $6,332† 4.1% $4,954 $5,332* $5,590* 6.2%
<50 Employees $6,218† $6,363† $7,129† 7.2% $4,937 $5,178* $5,442* 5.0%
>50 Employees $5,777† $6,194† $6,155† 3.3% $4,957 $5,366* $5,622* 6.5%
Table 7A: Average Single and Family Premiums in Establishments that Offer Health Insuranceby Firm Size, NJ and US, 1996 – 1998

27
TABLES 7A AND 7B
One factor that influences whether establishments offer health insurance is the health insurance premiums
they must pay. Table 7A and Figures 6 and 7 show trends in New Jersey and the United States in average single
and family premiums between 1996 and 1998. Table 7B and Figures 8 and 9 compare single and family premiums
between New Jersey and neighboring states and 40 states across the country.
KEY FINDINGS
� New Jersey establishments pay the highest premiums in the country for single plans and the third highest in
the country for family plans.
� Mirroring national trends, employer premiums in New Jersey rose between 1996 and 1998 at an average
annual rate that was similar to the national rate.
� While the rate of New Jersey’s premium growth was highest in smaller firms, particularly for family plans, the
difference is not statistically significant.
� Employers in New Jersey have consistently paid higher premiums for both single and family plans than the
rest of the country—17% higher for single plans and 13% higher for family plans.
� Small employers in New Jersey pay even higher premiums than their counterparts in the rest of the country,
paying 25% more for single plans and 31% more for family plans.
� While Pennsylvania establishment premiums are closer to the national average, and thus significantly lower
than New Jersey, New York’s premiums are similar to those in New Jersey.

28
NJ US NY PA
Average Single Premiums
All Establishments $2,360 $2,050* $2,293 $2,036*
<50 Employees $2,576 $2,107* $2,494 $2,146*
>50 Employees $2,291 $2,029 $2,209 $1,989
Average Family Premiums
All Establishments $6,228 $5,332* $5,900 $5,157*
<50 Employees $6,363 $5,178* $6,115 $5,099*
>50 Employees $6,194 $5,366* $5,852 $5,169*
Table 7B: Average Single and Family Premiums in Establishments that Offer Health Insurance byFirm Size, NJ/US/NY/PA, 1997
* Significantly different than New Jersey (p<.05)Source: MEPS–IC 1997 Tables; www.meps.ahrq.gov/data.htm; Tables II.C.1, II.D.1

29
Figure 6: Average Single Premiums in Establishments that Offer Health Insurance by State*, 1998
Figure 7: Average Family Premiums in Establishments that Offer Health Insurance by State*, 1998
* Data reported for 40 individual states and the United States overall
$0
$500
$1000
$1500
$2000
$2500
$3000
�
¤
IAIDKYNCTNLAMOCAGANMSCFLALTXW
AARINKSMN
OKCO AZVAUTMI
PAORDEILWV
NEWI
WY
MDNHNYM
AOHCTNJ
US Ave
rage
$0
$1300
$2600
$3900
$5200
$6500
ARNMNCMN
GATNIDKYIAMOOKKSSCALVAFLAZW
VUT
CANE OHINLACOPATXORW
AILMI
MDW
IDE
WY
MANHNJCTNY
US Ave
rage

30
$0
$500
$1000
$1500
$2000
$2500
$3000> 50 Employees
< 50 Employees
> 50 Employees
< 50 Employees
1996 1997 1998
$0
$1250
$2500
$3750
$5000
$6250
$7500
1996 1997 1998
<50 Employees, NJ
>50 Employees, NJ
<50 Employees, US
>50 Employees, US
<50 Employees, NJ
>50 Employees, NJ
<50 Employees, US
>50 Employees, US
Figure 8: Average Single Premiums in Establishments that Offer HealthInsurance by Firm Size, NJ and US, 1996—1998
Figure 9: Average Family Premiums in Establishments that Offer HealthInsurance by Firm Size, NJ and US, 1996—1998

31
TABLES 8A AND 8B
Workers often cite the high cost of insurance as the primary factor for refusing coverage. Tables 8A and 8B
and Figures 10 and 11 show trends in employee contributions in small and large establishments to assess whether
employers are passing higher premium costs to employees.
� Some workers nationally and in New Jersey are bearing an increasing portion of employers’ rising health
insurance premiums, particularly employees of larger businesses.
� In New Jersey, all of the increase in employee premium shares is borne by employees in large establishments
whose average contribution for single plans rose from $247 to $480 per year, an average annual increase of
nearly 44% from 1996–1998.
� In the past, employees in New Jersey paid a much smaller percentage of the single premiums than their
counterparts nationally. Now they pay an equivalent portion of the premium.
� New Jersey employees in smaller businesses appear to be shielded from the large premium hikes in
single plans.
� Overall, New Jersey families pay a larger percentage of premiums than those with single coverage—24.3%
compared to 17.1% in 1998.
� Family plans cost considerably more than single coverage, with employee contributions more than threefold
higher for family than single plans.

32
Table 8A: Average Single and Family Employee Contributions and Percent of Total Premiums Contributedby Employees in Establishments that Offer Health Insurance by Firm Size, NJ and US, 1996 – 1998
NJ US
Avg. Avg.Annual Annual
1996 1997 1998 % Change 1996 1997 1998 % Change
Average Single Employee ContributionAll Establishments $263† $281 $433 30.5% $342 $320 $383* 6.6%<50 Employees $312 $323 $312 0.1% $304 $284 $308 0.9%>50 Employees $247† $267 $480* 43.9% $355 $333 $411* 8.6%
% Single Employee ContributionAll Establishments 11.2%† 11.9%† 17.1% 25.0% 17.2% 15.6%* 17.6%* 1.8%<50 Employees 12.2% 12.5% 11.1% -4.4% 14.7% 13.5% 13.8% -3.0%>50 Employees 10.8%† 11.7%† 19.7% 38.4% 18.1% 16.4% 19.1%* 3.5%
Average Family Employee ContributionAll Establishments $1,375 $1,429 $1,535 5.7% $1,275 $1,305 $1,382 4.1%<50 Employees $1,631 $1,124 $1,782 13.7% $1,367 $1,426 $1,551 6.5%>50 Employees $1,328 $1,506 $1,481 5.9% $1,255 $1,278 $1,347 3.6%
% Family Employee ContributionAll Establishments 23.5% 22.9% 24.3% 1.8% 25.7% 24.5% 24.7% -1.9%<50 Employees 26.2% 17.7%† 25.0% 4.4% 27.7% 27.5% 28.5% 1.5%
>50 Employees 23.0% 24.3% 24.1% 2.4% 25.3% 23.8% 24.0% -2.5%
† Significantly different than corresponding year in the US (p<.05)* Significantly different than previous year (p<.05)Source: MEPS-IC 1996, 1997, 1998 Tables; www.meps.ahrq.gov/data.htm; Tables II.C.2, II.C.3, II.D.2, II.D.3

33
* Significantly different than New Jersey (p<.05)Source: MEPS-IC 1997 Tables; www.meps.ahrq.gov/data.htm; Tables II.C.2, II.C.3, II.D.2, II.D.3
NJ US NY PA
Average Single Employee ContributionAll Establishments $281 $320 $394 $281<50 Employees $323 $284 $358 $308>50 Employees $267 $333 $410 $270
% Single Employee ContributionAll Establishments 11.9% 15.6%* 17.2%* 13.8%<50 Employees 12.5% 13.5% 14.4% 14.3%>50 Employees 11.7% 16.4%* 18.5% 13.6%
Average Family Employee ContributionAll Establishments $1,429 $1,305 $1,231 $880<50 Employees $1,124 $1,426 $1,499 $1,039>50 Employees $1,506 $1,278 $1,170 $844
% Family Employee ContributionAll Establishments 22.9% 24.5% 20.9% 17.1%<50 Employees 17.7% 27.5%* 24.5% 20.4%>50 Employees 24.3% 23.8% 20.0% 16.3%
Table 8B: Average Single and Family Employee Contributions and Percent of Total Premiums Contributedby Employees in Establishments that Offer Health Insurance by Firm Size, NJ/US/NY/PA, 1997

34
<50 Employees, NJ
<50 Employees, US
$0
$300
$600
$900
$1200
$1500
$1800
1996 1997 1998
Figure 10: Average Annual Employee Contribution for Single Plans, NJ and US, 1996 – 1998
Figure 11: Average Annual Employee Contribution for Family Plans, NJ and US, 1996 – 1998
>50 Employees, NJ
>50 Employees, US
$0
$100
$200
$300
$400
$500
1996 1997 1998
<50 Employees, NJ
>50 Employees, NJ
<50 Employees, US
>50 Employees, US

35
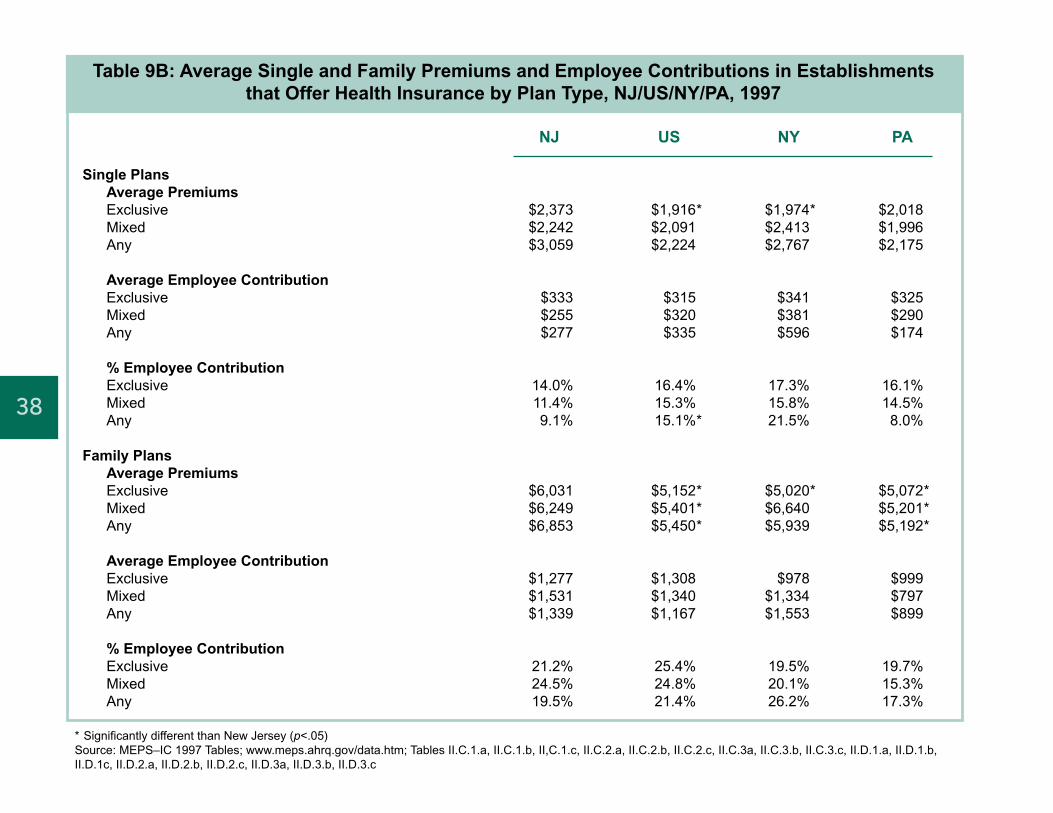
TABLES 9A AND 9B
Premiums and employee contributions vary by plan type. Exclusive plans, which include many HMOs, limit
coverage to doctors that are in the plan, and generally offer the lowest cost plans because they negotiate rates with
network providers and thus have greater control over costs. Mixed plans, which include preferred-provider and
point-of-service plans, provide coverage for all doctors in the plan and partial coverage for visits made to physi-
cians outside of the plan. Mixed plans generally cost more than exclusive plans but less than traditional indemnity
plans, which have no network limits and cover any provider. In New Jersey, despite the high penetration of more
restrictive managed care plans, premiums are the highest in the country. Tables 9A and 9B examine premium and
employee contributions by plan type.
� Nationally, single plan premiums increased across all plan types between 1996 and 1998. Less restrictive
plan costs rose more than other plan types.
� Employee contributions for single plans nationally also increased in all plan types, but only significantly for
mixed provider managed care plans between 1997 and 1998.
� United States family plan premium increases occurred primarily between 1996 and 1997 when premiums
rose significantly in all plan types. While family premiums also rose in all plan types between 1997 and
1998, the increase was only significant for mixed provider managed care plans.
� “Any” provider plans (traditional indemnity) generally charge the highest premiums, mixed provider plans
cost somewhat less, and exclusive provider plans cost the least. But employees tend to pay a larger per-
cent of the premium and sometimes larger out-of-pocket costs for managed care plans (exclusive or mixed)
than for traditional any provider plans.
� Although total employee contributions for family plans nationally increased somewhat across all plan types,
the percent of premium contributions by employees declined in all plan types, particularly for any
provider plans (although not significantly).

36
† Significantly different than corresponding year in the United States (p<.05)* Significantly different than previous year (p<.05)Source: MEPS–IC 1996, 1997, 1998 Tables; www.meps.ahrq.gov/data.htm; Tables II.C.1.a, II.C.1.b, II,C.1.c, II.C.2.a,II.C.2.b, II.C.2.c, II.C.3a, II.C.3.b, II.C.3.c, II.D.1.a, II.D.1.b, II.D.1c, II.D.2.a, II.D.2.b, II.D.2.c, II.D.3a, II.D.3.b, II.D.3.c
NJ USAvg. Avg.
Annual Annual1996 1997 1998 % Change 1996 1997 1998 % Change
Single PlansAverage PremiumsExclusive $2,331† $2,373† $2,384† 1.1% $1,912 $1,916 $2,008* 2.5%Mixed $2,405† $2,242 $2,493† 2.2% $2,019 $2,091 $2,224* 5.0%Any $2,230 $3,059 $3,166† 20.3% $2,050 $2,224* $2,368 7.5%
Average Employee ContributionExclusive $280 $333 $354 12.6% $332 $315 $359 4.4%Mixed $262† $255 $443 35.5% $352 $320 $398* 7.6%Any $246 $277 $544 54.4% $330 $335 $381 7.7%
% Employee ContributionExclusive 12.0% 14.0% 14.9% 11.5% 17.4% 16.4% 17.9% 1.7%Mixed 10.9%† 11.4% 17.8% 30.4% 17.5% 15.3% 17.9%* 2.2%Any 11.0% 9.1%† 17.2% 35.9% 16.1% 15.1% 16.1% 0.2%
Family PlansAverage PremiumsExclusive $5,576† $6,031† $5,806 2.2% $4,868 $5,152* $5,302 4.4%Mixed $6,081† $6,249† $6,431† 2.8% $5,007 $5,401* $5,701* 6.7%Any $5,611 $6,853† $6,699 9.9% $4,924 $5,450* $5,754 8.1%
Average Employee ContributionExclusive $1,175 $1,277 $1,529 14.2% $1,288 $1,308 $1,382 3.6%Mixed $1,680 $1,531 $1,637 –1.0% $1,314 $1,340 $1,431 4.4% Any $894 $1,339 $1,074 15.0% $1,140 $1,167 $1,190 2.2%
% Employee ContributionExclusive 21.1% 21.2% 26.3% 12.3% 26.5% 25.4% 26.1% –0.7%Mixed 27.6% 24.5% 25.5% –3.6% 26.2% 24.8% 25.1% –2.1%
Any 15.9%† 19.5% 16.0% 2.3% 23.2% 21.4% 20.7% –5.5%
Table 9A: Average Single and Family Premiums and Employee Contributions, in Establishmentsthat Offer Health Insurance by Plan Type, NJ & US, 1996 – 1998

37
� New Jersey single and family premiums were generally higher than the national average in all plan types.
This is particularly true for managed care plans. Single and family premiums for both exclusive and
mixed provider plans were significantly higher in New Jersey than the United States for two or all three of
the years.
� While New Jersey employees contributed a significantly lower percentage of the total premium for single
mixed provider plans than employees in the United States in 1996, by 1998 New Jersey employee contribu-
tions for these point-of-service plans were comparable to the rest of the nation.
� In 1998, New Jersey single premiums and employee contributions were higher for plans allowing more
provider choice, but this pattern generally does not hold for family plans.
� Mixed provider plans, which are increasingly popular in the United States and particularly in New Jersey,
are also increasingly costly to employees. For single plans, mixed provider plans have the highest percent
employee contribution. For family coverage, mixed provider plans have the highest out-of-pocket
employee costs.
38
* Significantly different than New Jersey (p<.05)Source: MEPS–IC 1997 Tables; www.meps.ahrq.gov/data.htm; Tables II.C.1.a, II.C.1.b, II,C.1.c, II.C.2.a, II.C.2.b, II.C.2.c, II.C.3a, II.C.3.b, II.C.3.c, II.D.1.a, II.D.1.b,II.D.1c, II.D.2.a, II.D.2.b, II.D.2.c, II.D.3a, II.D.3.b, II.D.3.c
NJ US NY PA
Single PlansAverage PremiumsExclusive $2,373 $1,916* $1,974* $2,018Mixed $2,242 $2,091 $2,413 $1,996Any $3,059 $2,224 $2,767 $2,175
Average Employee ContributionExclusive $333 $315 $341 $325Mixed $255 $320 $381 $290Any $277 $335 $596 $174
% Employee ContributionExclusive 14.0% 16.4% 17.3% 16.1%Mixed 11.4% 15.3% 15.8% 14.5%Any 9.1% 15.1%* 21.5% 8.0%
Family PlansAverage PremiumsExclusive $6,031 $5,152* $5,020* $5,072*Mixed $6,249 $5,401* $6,640 $5,201*Any $6,853 $5,450* $5,939 $5,192*
Average Employee ContributionExclusive $1,277 $1,308 $978 $999Mixed $1,531 $1,340 $1,334 $797Any $1,339 $1,167 $1,553 $899
% Employee ContributionExclusive 21.2% 25.4% 19.5% 19.7%Mixed 24.5% 24.8% 20.1% 15.3%Any 19.5% 21.4% 26.2% 17.3%
Table 9B: Average Single and Family Premiums and Employee Contributions in Establishmentsthat Offer Health Insurance by Plan Type, NJ/US/NY/PA, 1997
39
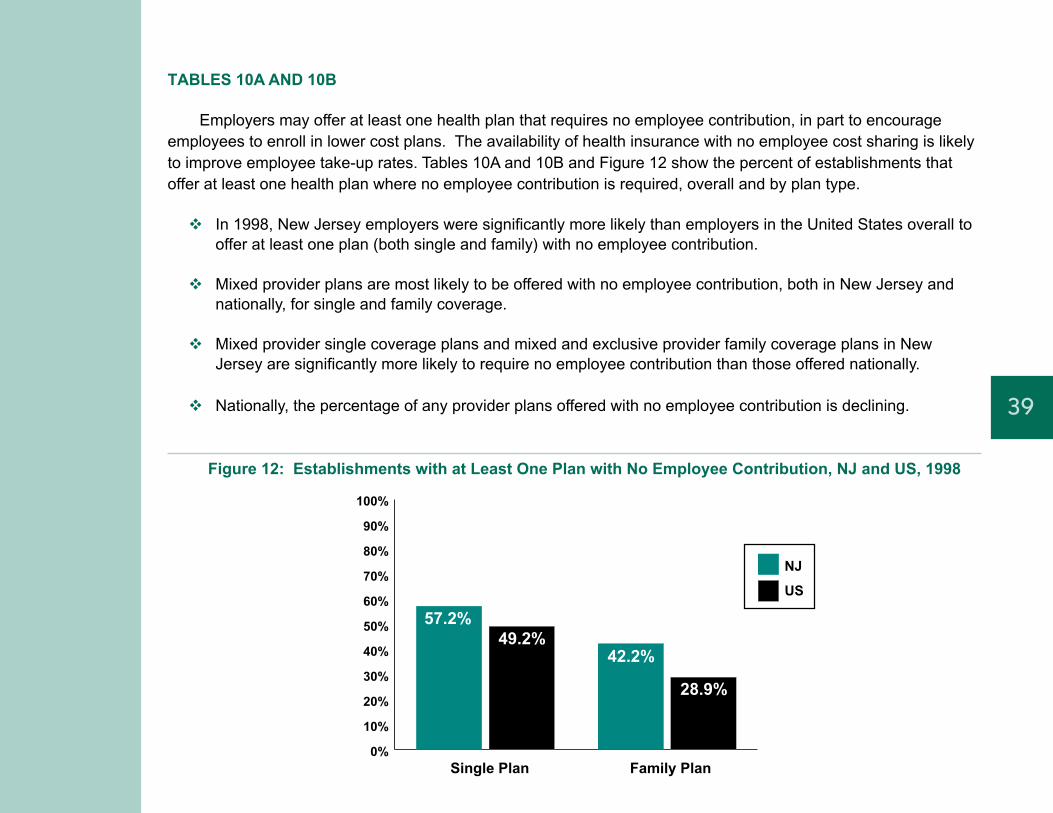
TABLES 10A AND 10B
Employers may offer at least one health plan that requires no employee contribution, in part to encourage
employees to enroll in lower cost plans. The availability of health insurance with no employee cost sharing is likely
to improve employee take-up rates. Tables 10A and 10B and Figure 12 show the percent of establishments that
offer at least one health plan where no employee contribution is required, overall and by plan type.
� In 1998, New Jersey employers were significantly more likely than employers in the United States overall to
offer at least one plan (both single and family) with no employee contribution.
� Mixed provider plans are most likely to be offered with no employee contribution, both in New Jersey and
nationally, for single and family coverage.
� Mixed provider single coverage plans and mixed and exclusive provider family coverage plans in New
Jersey are significantly more likely to require no employee contribution than those offered nationally.
� Nationally, the percentage of any provider plans offered with no employee contribution is declining.
0%
10%
20%
30%
40%
50%
60%
70%
80%
90%
100%
57.2%49.2%
42.2%
28.9%
NJ
US
Single Plan Family Plan
Figure 12: Establishments with at Least One Plan with No Employee Contribution, NJ and US, 1998

40
NJ US
Avg. Avg.Annual Annual
1996 1997 1998 % Change 1996 1997 1998 % Change
Single Coverage
At Least One Plan with No Contribution 56.0% 56.1% 57.2%† 1.1% 50.8% 51.2% 49.2% -1.6%
Exclusive Provider 14.7% 16.8% 16.6% 6.5% 14.5% 16.5%* 16.0% 5.4%
Mixed Provider 31.3% 32.9% 33.8%† 3.9% 24.9% 27.6%* 26.4% 3.2%
Any Provider 15.1% 12.3% 9.6% -20.2% 15.3% 12.9%* 10.6%* -16.8%
Family Coverage
At Least One Plan with No Contribution 33.8% 40.3%† 42.2%† 12.0% 30.9% 28.7%* 28.9% -3.2%
Exclusive Provider 9.0% 13.3% 15.1%† 30.7% 8.0% 8.7% 9.0% 6.1%
Mixed Provider 16.9% 23.2%† 21.3%† 14.5% 14.6% 14.7% 15.1% 1.7%
Any Provider 10.0% NR 7.4% -26.0% ^ 9.9% 7.9%* 6.9% -16.4%
Table 10A: Percent of Establishments that Offer Health Insurance with at Least One Plan RequiringNo Employee Contribution by Plan Type, NJ and US, 1996 – 1998
† Significantly different than corresponding year in the US (p<.05)* Significantly different than previous year (p<.05)NR indicates that the estimate is not reliable using standards established by AHRQ; see methods^Percent change between 1996 and 1998Source: MEPS-IC 1996, 1997, 1998 Tables; www.meps.ahrq.gov/data.htm; Tables II.A.2.b, II.A.2.c

41
* Significantly different than New Jersey (p<.05)NR indicates that the estimate is not reliable using standards established by AHRQ; see methodsSource: MEPS-IC 1997 Tables; www.meps.ahrq.gov/data.htm; Tables II.A.2.b, II.A.2.c
NJ US NY PA
Single Coverage
At least one plan with no contribution 56.1% 51.2% 58.7% 56.5%
Exclusive Provider 16.8% 16.5% 22.1% 20.1%
Mixed Provider 32.9% 27.6% 32.3% 23.5%
Any Provider 12.3% 12.9% 13.2% 21.1%*
Family Coverage
At least one plan with no contribution 40.3% 28.7%* 38.3% 35.1%
Exclusive Provider 13.3% 8.7% 14.5% 11.4%
Mixed Provider 23.2% 14.7%* 20.3% 12.2%*
Any Provider NR 7.9% 8.4% 14.3%
Table 10B: Percent of Establishments that Offer Health Insurance with at Least One Plan RequiringNo Employee Contribution by Plan Type, NJ/US/NY/PA, 1997

42
New Jersey United States
Avg. Avg.Annual Annual
1996 1997 1998 % Change 1996 1997 1998 % Change
% Eligible Employees
All Establishments 81.5% 81.3% 77.4% -2.5% 81.3% 79.2% 77.6% -2.3%
<50 Employees 81.8% 80.8% 72.1% -6.0% 82.2% 79.5% 75.8% -4.0%
>50 Employees 81.4% 81.4% 79.2% -1.4% 81.1% 79.1% 78.1% -1.9%
% Enrolled Employees
All Establishments 72.8% 71.8% 68.1% -3.3% 69.5% 66.7%* 66.2% -2.4%
<50 Employees 64.9% 67.4% 61.4% -2.5% 66.7% 64.8% 60.7%* -4.6%
>50 Employees 75.0% 73.2% 70.3% -3.2% 70.3% 67.3%* 67.9% -1.7%
Table 11A: Percent Employee Eligibility and Enrollment in Establishments that Offer HealthInsurance by Firm Size, NJ and US, 1996 – 1998
* Significantly different than previous year (p<.05)Source: MEPS–IC 1996, 1997, 1998 Tables; www.meps.ahrq.gov/data.htm; Tables II.B.2.a, II.B.2.b

43
TABLES 11A AND 11B
Employer offer rates are an important indicator of access to health insurance. But more important than how
many employers offer health insurance is how many employees actually are eligible for these programs and how
many actually purchase the benefit, given the price they are required to pay out-of-pocket. Tables 11A and 11B
examine employee eligibility and enrollment in establishments that offer health insurance. Figure 13 shows the
distribution of all employees by coverage, eligibility, and enrollment status. It is important to note that persons that
are not insured through their employer—either because their employer does not offer insurance, or they are not
eligible or enrolled in their employer’s plan—are not necessarily uninsured. A spouse’s health plan or a public
insurance program could cover these workers.
KEY FINDINGS
� The percent of employees that work in establishments that offer health insurance and are actually eligible
for those benefits is declining in small and large businesses in both New Jersey and the United States,
although not at a statistically significant level. The percent of eligible employees declined more in small
businesses than large businesses.
� The percent of employees nationally that are enrolled in plans in establishments that offer health
insurance has declined significantly for both large and small businesses between 1996 and 1998.
� The percent of New Jersey employees enrolled in employer-sponsored health plans has also declined but
the declines were not statistically significant.
� There are no significant differences in employee eligibility or enrollment in establishments that offer health
insurance in New Jersey compared to the United States or neighboring states, despite significantly higher
premiums and employee contributions in New Jersey.

44
Source: MEPS-IC 1997 Tables; www.meps.ahrq.gov/data.htm; Tables II.B.2.a, II.B.2.b
NJ US NY PA
% Eligible Employees
All Establishments 81.3% 79.2% 81.6% 78.6%
<50 Employees 80.8% 79.5% 80.8% 78.0%
>50 Employees 81.4% 79.1% 81.8% 78.9%
% Enrolled Employees
All Establishments 71.8% 66.7% 68.1% 65.9%
<50 Employees 67.4% 64.8% 64.5% 63.9%
>50 Employees 73.2% 67.3% 69.3% 66.6%
Table 11B: Percent Employee Eligibility and Enrollment in Establishments that Offer HealthInsurance by Firm Size, NJ/US/NY/PA, 1997

45NJ US
Employer Does Not Offer Health Insurance
Eligible But Not Enrolled Through Own Employer
Enrolled in Health Insurance Through Own Employer
Not Eligible for Health Insurance Through Own Employer
Figure 13: Health Insurance Offer, Eligibility, and Enrollment Status of Employees, NJ and US, 1998
58%
13%
20%
9%
61%
11%
20%
8%

46
NJ US
Avg. Avg.Annual Annual
1996 1997 1998 % Change 1996 1997 1998 % Change
Full-Time Employees% Eligible EmployeesAll Establishments 89.1% 87.7% 84.6% -2.6% 89.7% 88.6% 85.1%* -2.6%<50 Employees 89.3% 90.9% 80.9% -4.6% 90.7% 90.6% 84.7%* -3.3%>50 Employees 89.1% 86.7% 85.8% -1.9% 89.4% 88.0% 85.3%* -2.3%
% Enrolled EmployeesAll Establishments 80.3% 77.9% 75.2% -3.2% 77.9% 76.1%* 73.7%* -2.7%<50 Employees 73.6% 77.1% 69.1% -2.8% 75.3% 75.6% 69.1%* -4.1%>50 Employees 82.1% 78.1% 77.2% -3.0% 78.6% 76.3%* 75.1% -2.2%
Part-Time Employees% Eligible EmployeesAll Establishments 29.8% 36.3% 32.0% 5.0% 33.6% 29.1% 29.2% -6.5%<50 Employees 39.2% NR NR ~ 34.4% 25.8%* 23.7% -16.6%
>50 Employees 26.6% 41.4% 37.7% 23.4% 33.4% 30.2% 31.1% -3.3%
% Enrolled EmployeesAll Establishments 22.1% 29.0% 22.8% 4.9% 21.5% 16.5%* 17.9% -7.4%<50 Employees NR NR NR ~ 18.2% 12.1%* 11.7% -18.4%
>50 Employees 24.4% 35.7% 26.6% 10.4% 22.5% 18.0% 20.0% -4.4%
Table 12A: Full- and Part-time Employee Health Insurance Eligibility and Enrollment inEstablishments that Offer Health Insurance by Firm Size, NJ and US, 1996 – 1998
* Significantly different than previous year (p<.05)NR indicates that the estimate is not reliable using standards established by AHRQ; see “Methods”~ Not applicableSource: MEPS-IC 1996, 1997, 1998 Tables; www.meps.ahrq.gov/data.htm; Tables II.B.3.b.1, II.B.3.b.2, II.B.4.b.1, II.B.4.b.2

47
TABLES 12A AND 12B
Since health insurance eligibility differs significantly by employee hours of work, Tables 12A and 12B examine
employee eligibility for, and enrollment in, health insurance in establishments that offer health insurance by full-time
and part-time employees.
KEY FINDINGS
� Nationally, declines in eligibility and enrollment rates for all employees are also seen in trends for full-time
and part-time employees.
� As expected, part-time employees in New Jersey and the United States are much less likely than full-time
employees to be eligible for employer-sponsored health insurance and to enroll in health plans when they
are eligible.
� There are no apparent differences in patterns of employer-sponsored coverage between New Jersey,
United States, New York, and Pennsylvania for full- and part-time employees.

48
NR indicates that the estimate is not reliable using standards established by AHRQ; see “Methods”Source: MEPS-IC 1997 Tables; www.meps.ahrq.gov/data.htm; Tables II.B.3.b.1, II.B.3.b.2, II.B.4.b.1, II.B.4.b.2
NJ US NY PA
Full-Time Employees% Eligible EmployeesAll Establishments 87.7% 88.6% 90.0% 91.3%<50 Employees 90.9% 90.6% 89.9% 93.1%>50 Employees 86.7% 88.0% 90.1% 90.7%
% Enrolled EmployeesAll Establishments 77.9% 76.1% 77.1% 78.8%<50 Employees 77.1% 75.6% 74.5% 78.2%>50 Employees 78.1% 76.3% 77.9% 78.9%
Part-Time Employees% Eligible EmployeesAll Establishments 36.3% 29.1% 38.0% 26.3%<50 Employees NR 25.8% 34.9% 20.5%>50 Employees 41.4% 30.2% 39.1% 28.4%
% Enrolled EmployeesAll Establishments 29.0% 16.5% 22.2% 12.7%<50 Employees NR 12.1% 14.5% 9.4%>50 Employees 35.7% 18.0% 24.9% 13.9%
Table 12B: Full- and Part-time Employee Health Insurance Eligibility and Enrollment inEstablishments that Offer Health Insurance by Firm Size, NJ/US/NY/PA, 1997

49
TABLES 13A AND 13B
As shown in Table 2A, approximately 43–45% of establishments in New Jersey and the United States did not
offer any health insurance in 1998. These tend to be smaller establishments that employ approximately 20% of all
employees. For these establishments, it is instructive to examine whether they have offered health insurance in the
past or whether they provide alternative assistance to employees to help them pay for their health care costs.
Tables 13A and 13B examine establishments that do not offer coverage.
KEY FINDINGS
� The vast majority of United States and New Jersey businesses that did not offer health insurance in 1997
have not offered health insurance since 1991.
� Very few businesses in New Jersey or the United States provide vouchers or stipends as an alternative
form of coverage to their employees.
� A minority of New Jersey employers that did not offer health insurance in 1997 (9.6%) reported that
they pay medical/hospital bills directly for their employees. While not statistically significant, New Jersey
establishments that did not offer health insurance were more likely to offer this alternative than their
counterparts nationally.

50
Source: MEPS Special Request Data
~ Data not available* Significantly different than previous year (p<.05)† Significantly different than corresponding year in the US (p<.05)Source: MEPS Special Request Data
Table 13A: Health Benefits in Establishments That Do Not Offer Health Insurance,NJ and US, 1996 – 1998
NJ US
1996 1997 1998 % Change 1996 1997 1998 % Change
% Offered Health Insurance Since 1991 16.0%† 7.0% ~ -56.0% 7.2% 5.5%* ~ -23.4%
% Paid Medical/Hospital Bills Directly 10.2% 9.6% ~ -5.6% 5.9% 5.7% ~ -3.1%
% Provided Voucher/Stipend 2.2% 2.0% ~ -10.1% 2.9% 3.2% ~ 8.8%
Table 13B: Health Benefits in Establishments That Do Not Offer Health Insurance,NJ/US/NY/PA, 1997
NJ US NY PA
% Offered Health InsuranceSince 1991 7.0% 5.5% 7.5% 7.1%
% Paid Medical/Hospital Bills Directly 9.6% 5.7% 6.1% 4.5%
% Provided Voucher/Stipend 2.0% 3.2% 3.1% 1.3%

51
SUMMARY
Private-sector employers in New Jersey consistently pay more for health insurance for their employees than
employers nationwide. In 1998, employers in the state paid the highest premiums for single plans and third highest
for family plans out of 40 states studied. Small businesses in the state are at a particular disadvantage, paying
premiums that are more than a fourth to a third higher than their counterparts nationally. The cost of health insur-
ance has increased over time. Mirroring national trends, employer premiums in New Jersey rose at an average
annual rate of four to five percent between 1996 and 1998.
Premium increases occurred despite the increasing reliance on managed care plans, which are designed to
manage costs more aggressively than traditional indemnity plans. In New Jersey, employers are less likely to
offer traditional indemnity coverage than their peers nationally, favoring managed care plans and particularly pre-
ferred provider plans. However, managed care in New Jersey is not inexpensive. Between 1996 and 1998, the
cost of New Jersey managed care plans for both single and family coverage were often significantly higher than
the national average. Despite the high cost of insurance, and perhaps because of anticipated higher risk for em-
ployers to self-insure, New Jersey establishments are much less likely to self-insure than private-sector establish-
ments nationally.
Despite the increasing cost of providing health insurance, employers continue to offer coverage to their em-
ployees. Employers’ continued commitment to offering health insurance in the face of higher costs might be tied to
the tight labor market during this period. In the future, should the economy falter and unemployment rise, it is pos-
sible that higher premiums could result in fewer establishments offering health benefits to their employees and thus
greater rates of uninsured persons over time.
Health insurance premium increases affect the cost to workers as well. Some employees are paying a growing
share of the costs, particularly employees of larger businesses. Nationally and in New Jersey, employees’ share of
individual premiums in larger businesses rose significantly, with employee contributions in New Jersey nearly
doubling. These increases in employee contributions in New Jersey were not matched by a significant decline in
the likelihood that workers enroll in coverage when offered during this period, although eligibility and enrollment did
decline somewhat. Similar declines in enrollment were seen nationally, which were statistically significant between
1996 and 1997 in large firms and between 1997 and 1998 in small firms. The continued high take-up by New

52
Jersey employees may be tied to the high cost of medical care and the fact that, despite rising employee premium
contributions, 57% of New Jersey establishments with health benefits offer at least one single plan and 42% offer at
least one family plan with no employee contribution, a higher percentage than offered nationally. Thus, many
employees in New Jersey can obtain health insurance that requires no out-of-pocket premium expense.
The data presented here are from the federally sponsored Medical Expenditure Panel Survey Insurance Com-
ponent (MEPS-IC). The MEPS-IC cannot explain why premiums have increased, but other reports suggest a
number of factors for the national trend toward higher premiums. These factors include the insurance underwriting
cycle, the increasing cost of prescription drugs, reduced discounting of hospital costs stemming from a consolida-
tion in the hospital industry, rising labor costs for nurses and other medical professionals in short supply, and re-
duced gate-keeping measures and capitation in managed care (Freudenheim, 2001; Gabel et al., 2000; Gabel et
al., 2001; Hogan et al., 2000). Potential reasons for the exceptionally high premiums in New Jersey may include
high demand for coverage because of higher than average wages and high medical costs. Further study is needed
to conclusively identify the factors that are driving increases in the state’s insurance rates.
REFERENCES
Freudenheim, M. (2001). Medical costs surge as hospitals force insurers to raise payments. New York Times, p.1.
Gabel, J. Ginsburg, P, Pickreign, J, Reschovsky, J. (2001). Trends in out-of-pocket spending by insured American
workers, 1990-1997. Health Affairs. Vol. 20:2. p. 47-57.
Gabel, J, Levitt, L, Pickreign J, Whitmore, H, Holve, E, Hawkins, S, Miller, N. (2000) Job-based health insurance in
2000: Premiums rise sharply while coverage grows. Health Affairs. Vol. 19: 5.
p. 144-151.
Hogan, C, Ginsburg, P, Gabel, J. (2000). Tracking health care costs: inflation returns. Health Affairs. Vol. 19:6.
p. 217-223.