employer brand research 2020 greece. - banks.com.gr
TRANSCRIPT
employer brand research 2020
•
greece.

content.
employer brand research 2020, report greece |
introduction1results2
sector insights3top employers4deep dive5methodology6
2

|
introduction.
employer brand research 2020, report greece 3

||
why employer branding matters.
employer brand research 2020, report greece
Companies are overpaying on salaries by 10% if they don’t have a strong brand.1
of candidates say they wouldn’twork for a company with a badreputation – even with a payincrease.2
of workforce leaders agree that a strong employer brand has a significant impact on their ability to hire great workforce.4 As people work for cultures, not companies, their perception of you as an employer is of paramount importance. Both recruiters and candidates cite company culture as one of the most important determinants in employer choice. Also, if your culture is transparent: candidates actively research the culture of companies to understand if they’ll fit. If candidates see positive employee and candidate experiences on review sites, they feel more confident submitting their resume and making a career move.
Companies with a strong employer brand have a 1- 2 x faster time to hire.8
Employees who experience a strong alignment between what their employer says about itself and their experience working there are more likely to recommend their employer as a place to work.9
#1 obstacle to candidates in the application process is not knowing what it’s like to work at an organization.7
50% 80%
52 % of candidates first seek out the company’s website and social media to learn more about an employer.6
52% 1-2x 76%
agree that alignment of personal values with a company’s culture is a key factor in their satisfac-tion working there.3
96%
Only 19% of employees globally perceive a strong alignment between what their employer says about itself and their experience working there.5
19% #1
4
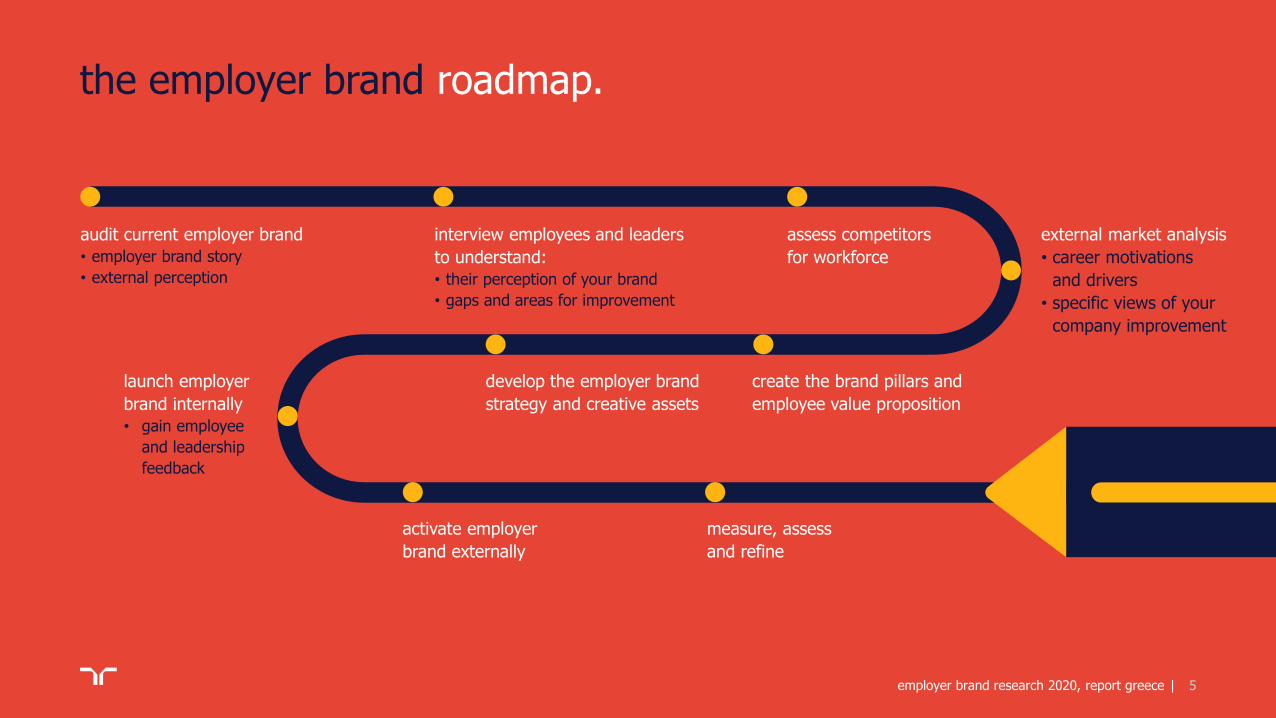
the employer brand roadmap.
employer brand research 2020, report greece |
audit current employer brand
• employer brand story
• external perception
interview employees and leaders
to understand:
• their perception of your brand
• gaps and areas for improvement
assess competitors
for workforce
create the brand pillars and
employee value proposition
develop the employer brand
strategy and creative assets
measure, assess
and refine
activate employer
brand externally
launch employer
brand internally
• gain employee
and leadership
feedback
external market analysis
• career motivations
and drivers
• specific views of your
company improvement
5

||
what is the randstad employer brand research?
• a representative employer brand research based on perceptions of the general audience. Optimizing over 20 years of successful employer branding insights.
• an independent survey with nearly 185,000 respondents in 33 markets worldwide.
• a reflection of employer attractiveness for
employer brand research 2020, report #Country
the market’s 150 largest employers known by at least 10% of the population.
• provides valuable insights to help employers shape their employer brand.
6
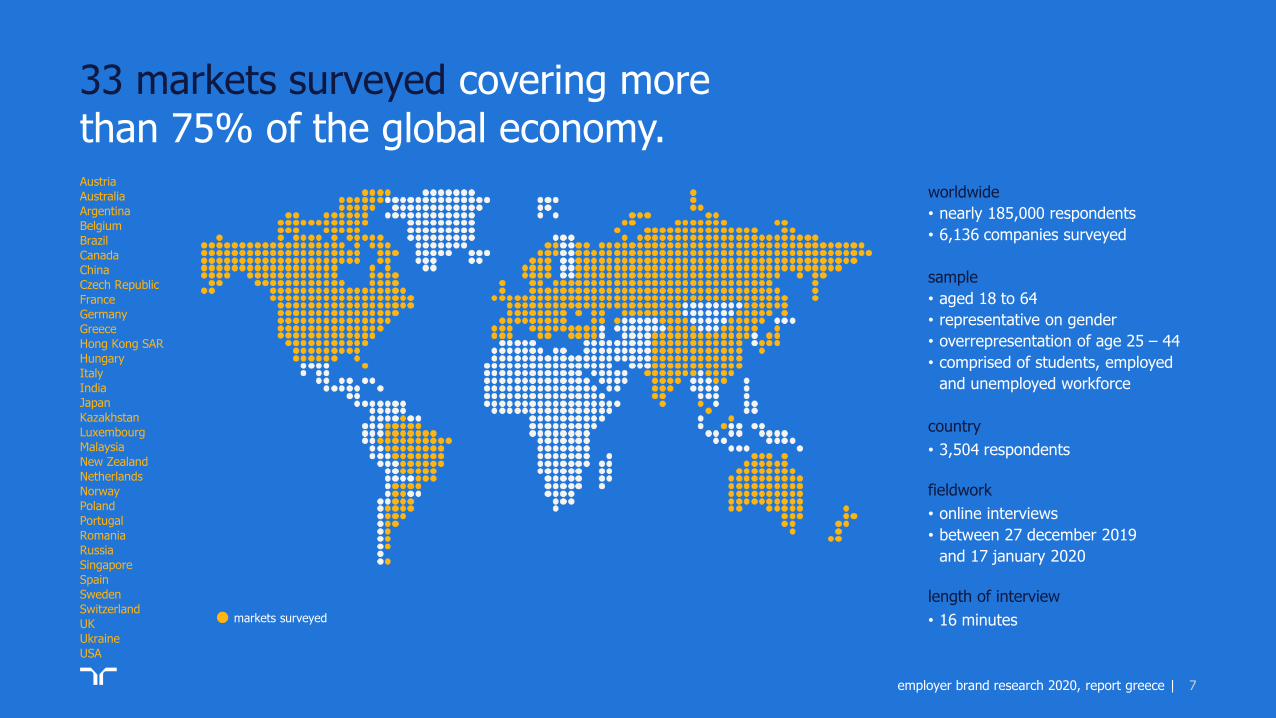
• 3,504 respondents
• online interviews
• between 27 december 2019
and 17 january 2020
• 16 minutes
33 markets surveyed covering morethan 75% of the global economy.
employer brand research 2020, report greece |
Austria
Australia
Argentina
Belgium
Brazil
Canada
China
Czech Republic
France
Germany
Greece
Hong Kong SAR
Hungary
Italy
India
Japan
Kazakhstan
Luxembourg
Malaysia
New Zealand
Netherlands
Norway
Poland
Portugal
Romania
Russia
Singapore
Spain
Sweden
Switzerland
UK
Ukraine
USA
markets surveyed
worldwide
• nearly 185,000 respondents
• 6,136 companies surveyed
sample
• aged 18 to 64
• representative on gender
• overrepresentation of age 25 – 44
• comprised of students, employed
and unemployed workforce
country
fieldwork
length of interview
7

||
employer brand research set up.
employer brand research 2020, report greece
drivers
each company is evaluated on:
01 financially healthy
02 uses latest technology
03 very good reputation
04 job security
05 career progression
06 gives back to society
07 interesting job content
08 pleasant work atmosphere
09 work-life balance
10 attractive salary & benefits
smart sampling
Each respondent is shown 30 companies. Each company is evaluated only by respondents who are aware of that particular brand.
In order to make sure that the less well known brands are assessed by a sufficient number of respondents, we make use of a smart sampling method.
This method ensures that the lesser known companies are shown to more respondents in order to realize a sufficient robust sample. That way the Randstad Employer Brand Research assures dependable insights for both well known and lesser known employer brands.
30 companiesper respondent
‘do you know this company?’:determines awareness.
for each companyknown
‘would you like to work forthis company?’:determines attractiveness.
each companyknown
rating on a set of drivers:determines reason forattractiveness.
For this research, Randstad partners with Kantar, one of the world's largest insight, information and consultancy networks.
8

||
sample compositionsocio-demographics, employment status, region.
employer brand research 2020, report greece
gender
age
education
employment status region
total sample: 3,504fieldwork: between 27 december 2019 and 17 january 2020
45%
26%
10%
19%
Attica (1)
Macedonia and Thrace (2)
Greek Islands (3)
Rest of Greece (4)
46%
12%
10%
14%
2%
14%
2%
working as permanent staff
working as temporary staff
self-employed/freelance
seeking/unemployed
homemaker
student
other
48%
52%
female
male
1%
30%
69%
lower
middle
higher
25%
24%
46%
5%
gen z (18-24)
millennials (25-34)
gen x (35-54)
boomers (55-64)
in greece
1. Attica
2. Central Greece, Epirus, Peloponnese, Thessaly, West Greece
3. Central Macedonia, East Macedonia and Thrace, West Macedonia
4. Crete, Ionian Islands, North Aegean, South Aegean
generation
25%
50%
25%
18-24
25-44
45-64
9

||
3%
1%
7%
2%
5%
14%
0%
4%
10%
5%
1%
5%
6%
7%
9%
5%
2%
4%
agriculture
oil & gas
manufacturing
utilities
construction
trade
transportation & storage
accommodation & food
ict
finance & insurance
real estate
professional & scientific
administration & support
public administration
education
healthcare
social work
arts & entertainment
13%
23%
7%
26%
10%
1%
4%
2%
2%
13%
managers
professionals
technicians
clerks
service / sales
skilled agricultural
craft / trade
machine operators
elementary occupations
armed forces occupations
sample composition
employer brand research 2020, report greece
base: currently employed (n=2,389)
function
in greece.
sector
10
|
EVP drivers.
employer brand research 2020, report greece
greece
11

||
what potential employees wantwhen choosing an employer.
employer brand research 2020, report greece
72%
61%
48%
47%
42%
attractive salary & benefits
pleasant work atmosphere
career progression
job security
work-life balance
click here for a breakdown of all results by socio-demographicprofile and trends for the last 5 years.
europe 2020
greece2019
greece2018
59%
51%
36%
48%
47%
greece 2020
76%
63%
54%
46%
44%
75%
63%
55%
50%
42%
most important criteria
12
||
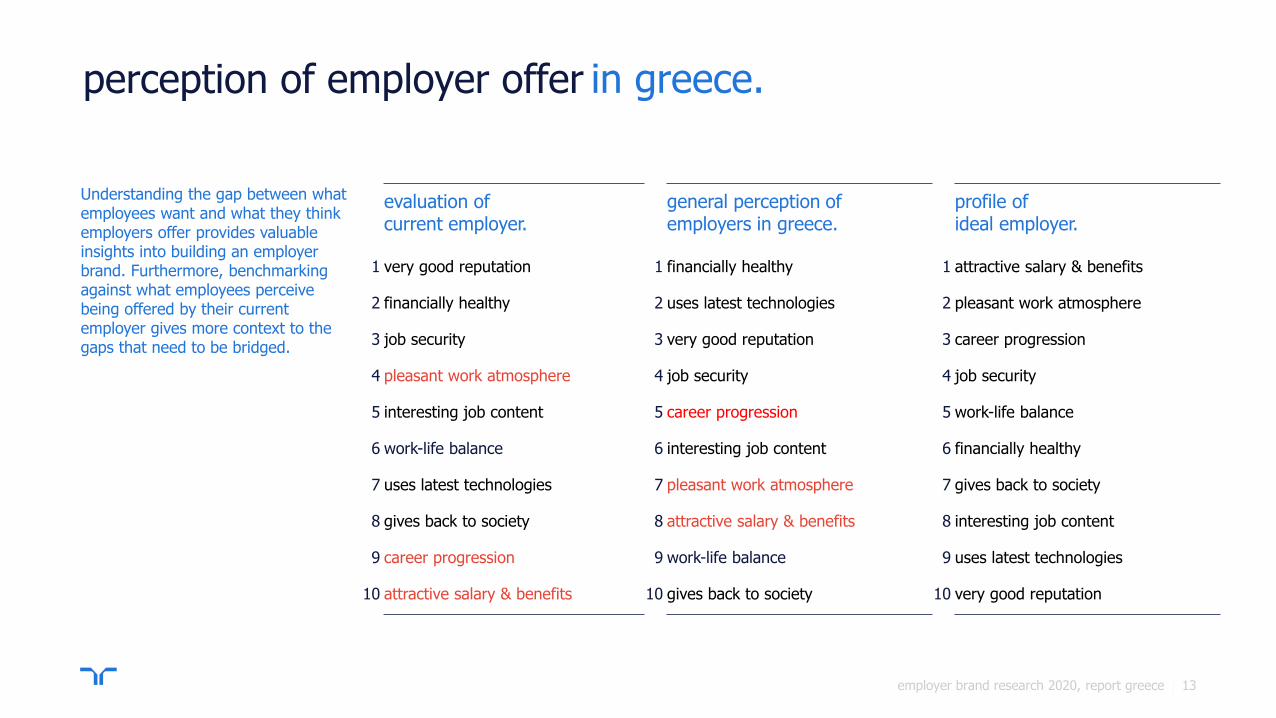
in greece.
employer brand research 2020, report greece |
evaluation ofcurrent employer.
general perception of employers in greece.
profile of ideal employer.
1 very good reputation 1 financially healthy 1 attractive salary & benefits
2 financially healthy 2 uses latest technologies 2 pleasant work atmosphere
3 job security 3 very good reputation 3 career progression
4 pleasant work atmosphere 4 job security 4 job security
5 interesting job content 5 career progression 5 work-life balance
6 work-life balance 6 interesting job content 6 financially healthy
7 uses latest technologies 7 pleasant work atmosphere 7 gives back to society
8 gives back to society 8 attractive salary & benefits 8 interesting job content
9 career progression 9 work-life balance 9 uses latest technologies
10 attractive salary & benefits 10 gives back to society 10 very good reputation
Understanding the gap between what employees want and what they think employers offer provides valuable insights into building an employerbrand. Furthermore, benchmarking against what employees perceive being offered by their current employer gives more context to the gaps that need to be bridged.
perception of employer offer
13

||
and what employees perceive employers to offer in greece.
employer brand research 2020, report greece
Employers in a market may not always be perceived to be offering what (potential) employees are looking for. Below you see the 3 main attributes employees look for but which they believe employers do not sufficiently offer.
|
gap top 3
attractive salary & benefits
pleasant work atmosphere
career progression
gap between what (potential) employees seek
14

||
what do potential employees wantby generational profile.
employer brand research 2020, report greece
click here for a breakdown of all results by socio-demographicprofile and trends for the last 5 years.
of the gen z’s value the opportunity for good training from their ideal employer. This is higher
when compared to gen x (22%) and boomers
(19%).
29%
gen z (18-24)
of the gen x’s find attractive job security a very important pull factor towards an employer. Among
gen z and millennials, this factor is deemed less
important (35% and 45%, respectively).
55%
gen x (35-54)
of the boomers are attracted to a financially healthy employer. This is less so among the other
cohorts (gen z – 20%, millennials - 24% and gen
x- 32%).
45%of the millennials seek flexible arrangements. Gen x and boomers are less interested in this offering
from their employer (22% respectively).
38%
millennials (25-34) boomers (55-64)
15

||
important attributesby type of contract.
employer brand research 2020, report greece
most important attributes
15%
part-time workers full-time workers
68%
64%
45%
46%
41%
74%
60%
50%
51%
44%
attractive salary & benefits
pleasant work atmosphere
career progression
job security
work-life balance
of today’s workforce works part-time.(less than 30 hours per week)
16

|
switchers and stayers
in focus.
employer brand research 2020, report greece 17

||
changing employer
employer brand research 2020, report greece
18%
17%
greece
europe
82%
83%
greece
europe
greece vs europe.
switchers: changed employer in the past year.
stayers: stayed with their employer in the past year.
intenders: plan to change employer within the next year.
29%
25%
greece
europe
employer brand research 2020, report greece 18

||
most important attributesswitchers vs stayers.
employer brand research 2020, report greece
most important attributes
switchers stayers
69%
63%
48%
44%
40%
72%
60%
48%
48%
43%
attractive salary & benefits
pleasant work atmosphere
career progression
job security
work-life balance
20202019
switchers
18%20%
82%20202019
stayers
80%
changed employer in the past year.
stayed with their employer in the past year.
19
||
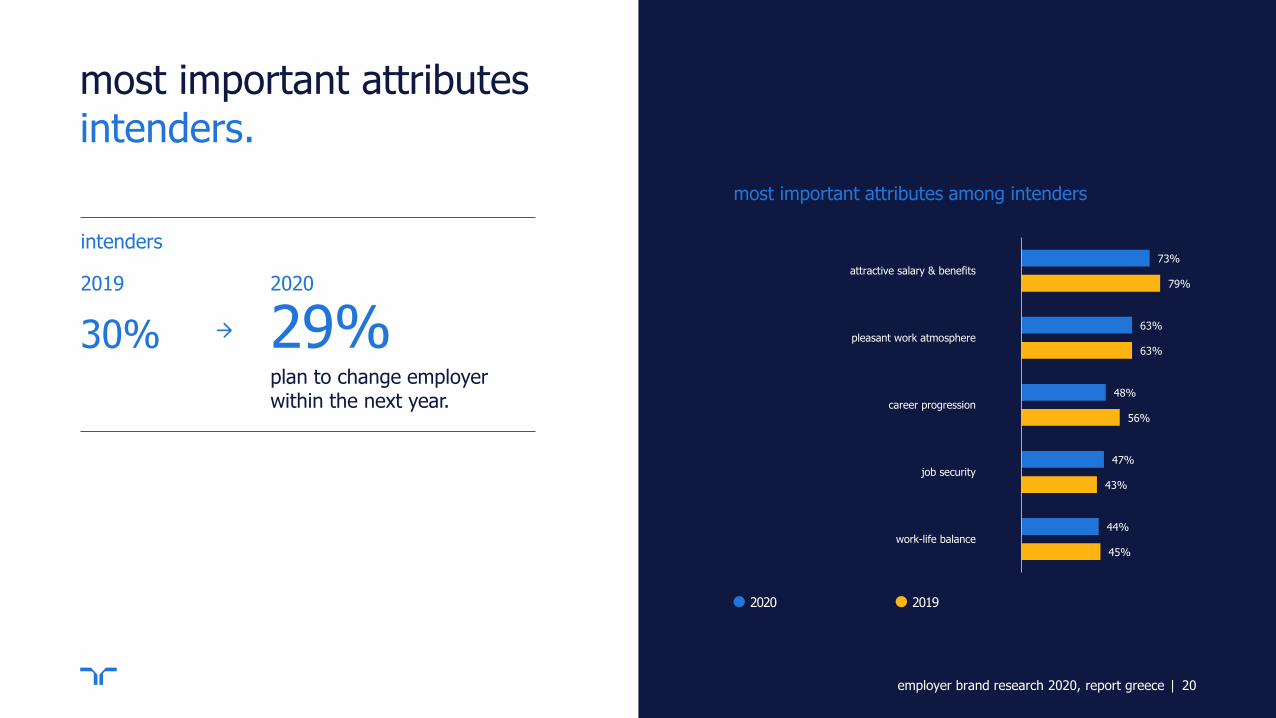
73%
63%
48%
47%
44%
79%
63%
56%
43%
45%
attractive salary & benefits
pleasant work atmosphere
career progression
job security
work-life balance
most important attributesintenders.
employer brand research 2020, report greece
most important attributes among intenders
29%plan to change employer within the next year.
20202019
intenders
30%
2020 2019
20
||
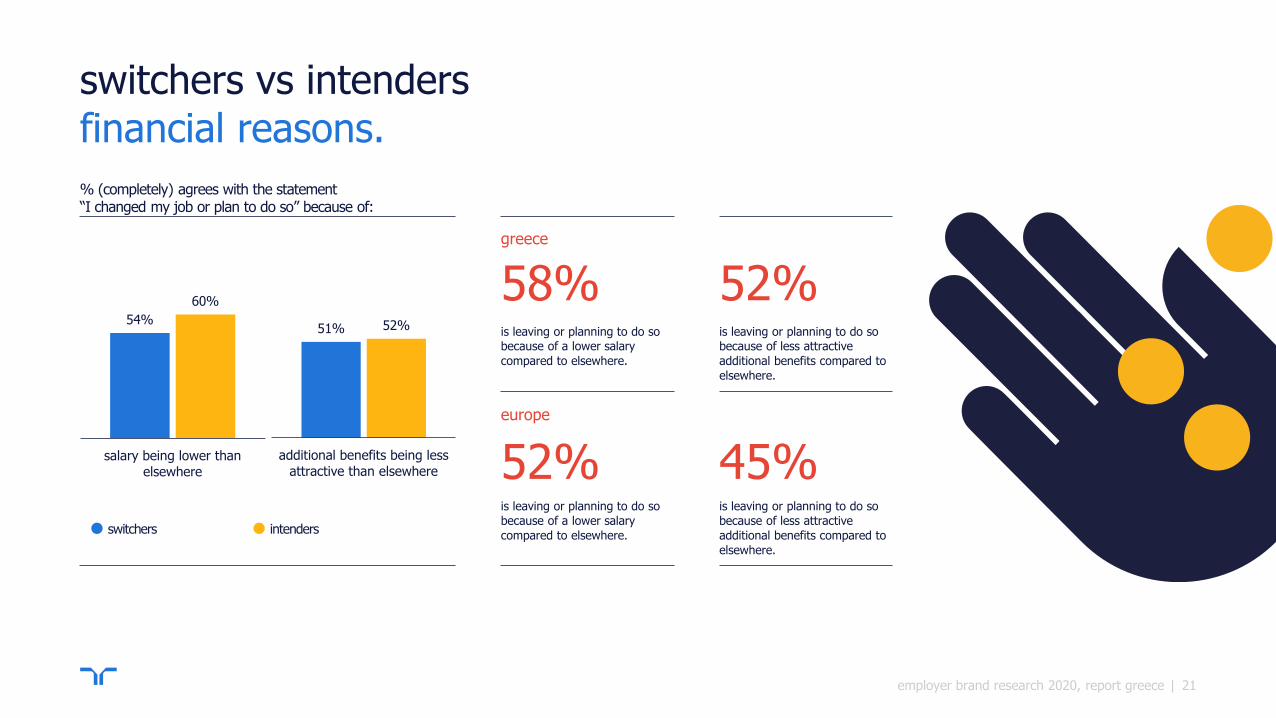
switchers vs intendersfinancial reasons.
employer brand research 2020, report greece
is leaving or planning to do so because of a lower salary
compared to elsewhere.
58%greece
is leaving or planning to do so
because of a lower salary
compared to elsewhere.
52%
europe
is leaving or planning to do so because of less attractive
additional benefits compared to
elsewhere.
52%
is leaving or planning to do so
because of less attractive
additional benefits compared to
elsewhere.
45%
% (completely) agrees with the statement “I changed my job or plan to do so” because of:
switchers intenders
54%
60%
salary being lower thanelsewhere
51% 52%
additional benefits being lessattractive than elsewhere
21

||
switching for higher salary nearly 4 in 10 switchers get a 1 to 10% pay increase.
employer brand research 2020, report greece
15%
10%
18%
21%
11%
19%
3% 3%
salary change after switch
employees who left previous employer for a higher salary
elsewhere saw a salary increase
between 1% and 10%.
39%greece
employees who left previous
employer for a higher salary
else where saw a salary increase
between 1% and 10%.
39%
europe
decreased
no change
increased 1-5%
increased 6-10%
increased 11-15%
increased 16-20%
other
prefer not to answer
22
||
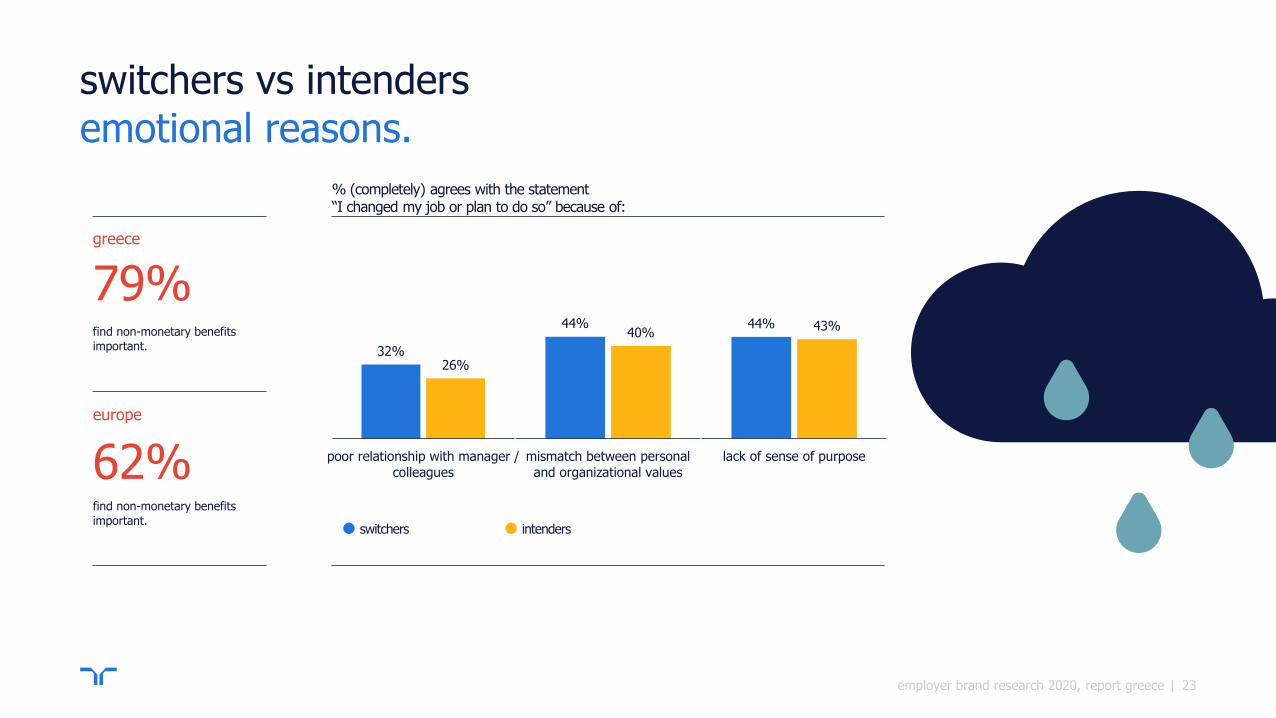
switchers vs intendersemotional reasons.
employer brand research 2020, report greece
find non-monetary benefits important.
79%greece
find non-monetary benefits
important.
62%
europe
% (completely) agrees with the statement “I changed my job or plan to do so” because of:
switchers intenders
32%26%
poor relationship with manager /colleagues
44% 43%
lack of sense of purpose
44%40%
mismatch between personaland organizational values
23

||
reasons to leave by profile.
employer brand research 2020, report greece
of the gen x are likely to leave an employer if they receive a higher salary elsewhere.
61%
salary being lower than elsewhere
of the boomers agree that a poor relationship with their manger is a serious reason to consider
working elsewhere.
35%
poor relationship with manager
of the millennials and gen x are likely to leave their employer if additional benefits offered by
other employers are more attractive.
53%
additional benefits being less attractive
of the boomers would leave their employer if the organizational values do not match their personal
values.
44%
mismatch between personal and organizational values
of the millennials may leave or have left their employer if they lack a sense of purpose in their
job.
45%
lack of sense of purpose
24

|
additional benefits
in focus.
employer brand research 2020, report greece 25

||employer brand research 2020, report greece
top 5 most attractive benefits & received
attractive attractive & received
click here for full results.
workforce in greece finds attractive and are received.
employee benefits that
86% 82% 81% 77% 76%
51%
26% 28% 38% 41%
health care additional vacation benefits(annual leave, sabbatical
leave)
full or partial reimbursementof commuting or mobility
expenses
internal training andsubsidized further education(courses, certificates, etc.)
flexible working hours
26

||
most attractive benefits by profile.
employer brand research 2020, report greece
of the gen z’s find health care attractive as an employment benefit.
78%
gen z (18-24)
of the gen x’s find additional vacation benefits (annual leave, sabbatical leave) attractive as an
employment benefit. This is higher when
compared to gen z (74%) and millennials (80%).
86%
gen x (35-54)
of the boomers find being offered a company phones attractive as an employment benefit.
67%of the millennials find childcare services andsupport attractive as an employment benefit. This
is higher when compared to gen z (57%).
69%
millennials (25-34) boomers (55-64)
27

|
sector
employer brand research 2020, report greece
insights.
28
||
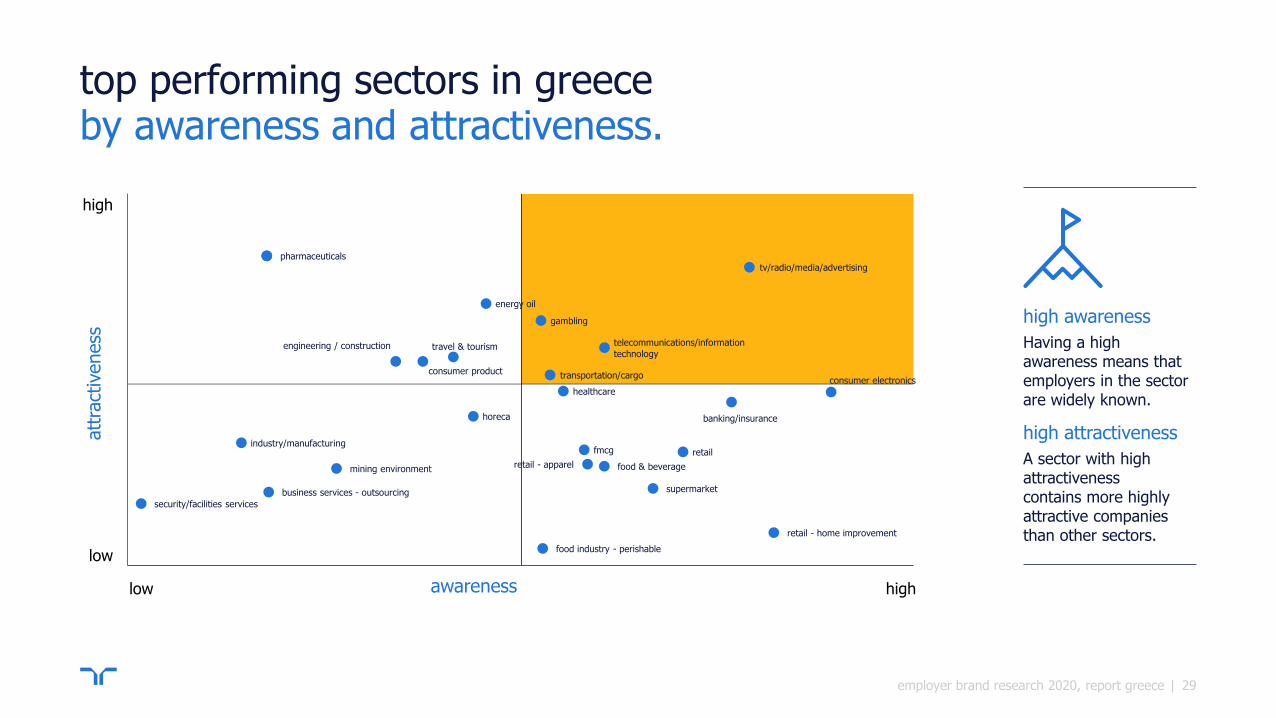
top performing sectors in greece
employer brand research 2020, report greece
high awareness
Having a highawareness means thatemployers in the sectorare widely known.
high attractiveness
A sector with highattractivenesscontains more highly attractive companies than other sectors.
by awareness and attractiveness.
tv/radio/media/advertising
energy oil
gambling
telecommunications/information
technologytravel & tourismengineering / construction
consumer product transportation/cargo
healthcareconsumer electronics
banking/insurancehoreca
industry/manufacturingfmcg retail
retail - apparel
pharmaceuticals
security/facilities services
food & beveragemining environment
supermarketbusiness services - outsourcing
retail - home improvement
food industry - perishable
att
ract
iveness
awareness
high
low
low high
29
||
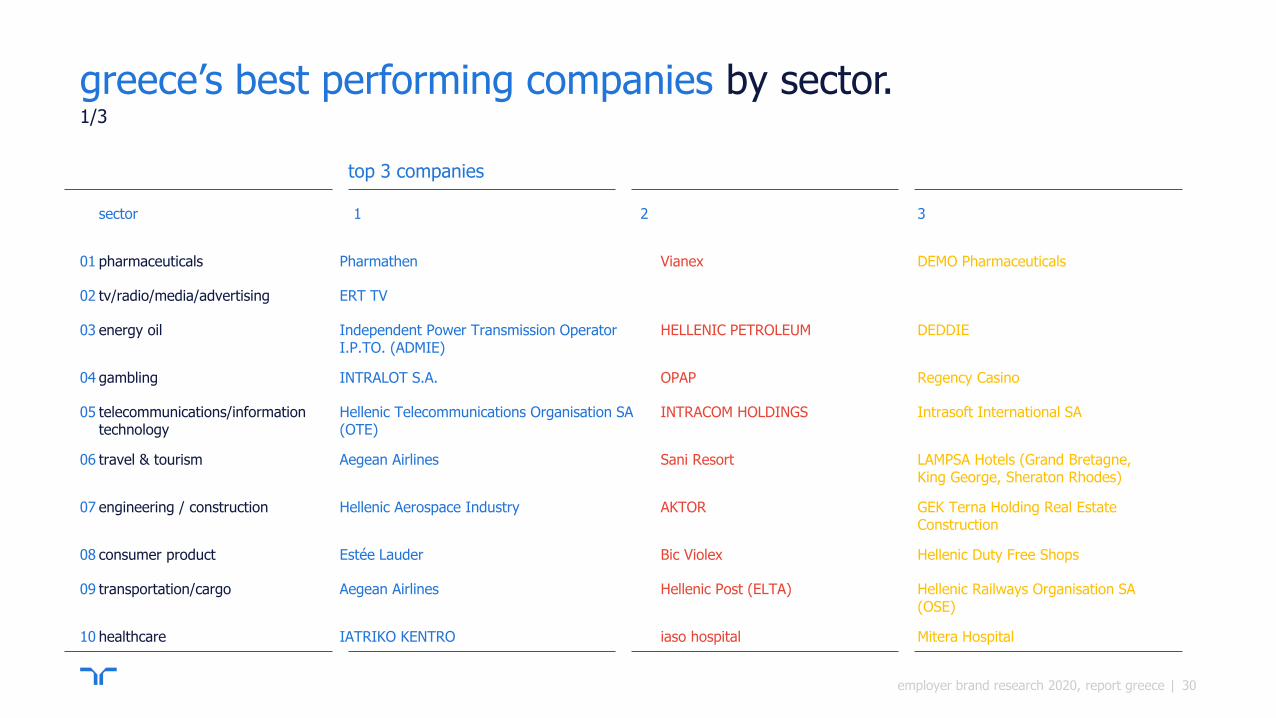
sector 1 2 3
01 pharmaceuticals Pharmathen Vianex DEMO Pharmaceuticals
02 tv/radio/media/advertising ERT TV
03 energy oil Independent Power Transmission Operator I.P.TO. (ADMIE)
HELLENIC PETROLEUM DEDDIE
04 gambling INTRALOT S.A. OPAP Regency Casino
05 telecommunications/information technology
Hellenic Telecommunications Organisation SA (OTE)
INTRACOM HOLDINGS Intrasoft International SA
06 travel & tourism Aegean Airlines Sani Resort LAMPSA Hotels (Grand Bretagne, King George, Sheraton Rhodes)
07 engineering / construction Hellenic Aerospace Industry AKTOR GEK Terna Holding Real Estate Construction
08 consumer product Estée Lauder Bic Violex Hellenic Duty Free Shops
09 transportation/cargo Aegean Airlines Hellenic Post (ELTA) Hellenic Railways Organisation SA (OSE)
10 healthcare IATRIKO KENTRO iaso hospital Mitera Hospital
top 3 companies
greece’s best performing companies by sector.1/3
employer brand research 2020, report greece 30

||
sector 1 2 3
11 consumer electronics Public KOTSOVOLOS DIXON MEDIA MARKT
12 banking/insurance Bank of Greece S.A. National Bank of Greece ALPHA BANK
13 horeca Sani Resort LAMPSA Hotels (Grand Bretagne, King George, Sheraton Rhodes)
Regency Casino
14 industry/manufacturing ELVAL HALCOR Bic Violex Mytilineos Holdings SA (Metka, Aluminium of Greece, Proterga)
15 fmcg ION S.A. Papadopoulou Coca Cola
16 retail Estée Lauder Hellenic Duty Free Shops Public
17 retail-apparel ATTICA DEPARTMENT STORES H & M Notos Galleries
18 food & beverage ION S.A. Papadopoulou Coca Cola
19 mining environment EYDAP SUNLIGHT SYSTEMS Helector
20 supermarket SKLAVENITIS AB Vasilopoulos MASOUTIS
top 3 companies
greece’s best performing companies by sector.2/3
employer brand research 2020, report greece 31

||
sector 1 2 3
21 business services - outsourcing First Data Cosmote E-Value Mellon Technologies
22 security/facilities services ESA SECURITY SOLUTIONS S.A. ICTS Hellas Brink's Security Services S.A
23 retail - home improvement IKEA Praktiker LEROY MERLIN
24 food industry - perishable Delta Foods HELLENIC QUALITY FOODS (KANAKI -MIMIKOS)
HELLENIC DAIRIES S.A. (Olympos, Tyras, Rodopi)
top 3 companies
greece’s best performing companies by sector.3/3
employer brand research 2020, report greece 32

|
top
employers.
employer brand research 2020, report greece 33

top employers to work for
employer brand research 2020, report greece |
top 10 employers 2020 top 10 employers 2019
01 Aegean Airlines 01 SKLAVENITIS
02 Hellenic Aerospace Industry 02 Bank of Greece S.A.
03 SKLAVENITIS 03 Aegean Airlines
04 ION S.A. 04 HELLENIC PETROLEUM
05 Hellenic Telecommunications Organisation SA (OTE) 05 Papadopoulou
06 INTRALOT S.A. 06 ION S.A.
07 Bank of Greece S.A. 07 National Bank of Greece
08 Pharmathen 08 DEMO Pharmaceuticals
09 Papadopoulou 09 DEI
10 Independent Power Transmission Operator I.P.TO. (ADMIE) 10 Vianex
in greece.
34

||
greece’s top 3 EVP drivers
employer brand research 2020, report greece
of the top 5 companies.
top 5 companies 1 2 3
1 Aegean Airlines financially healthy very good reputation uses latest technologies
2 Hellenic Aerospace Industry uses latest technologies financially healthy very good reputation
3 SKLAVENITIS very good reputation financially healthy job security
4 ION S.A. very good reputation financially healthy job security
5Hellenic Telecommunications Organisation SA (OTE)
uses latest technologies financially healthy job security
35

||
greece’s top employers
employer brand research 2020, report greece
EVP driver 1 2 3
attractive salary & benefits ELPEN PHARMACEUTICAL Bank of Greece S.A. Motor Oil Hellas
career progression ELPEN PHARMACEUTICAL Vianex INTRACOM HOLDINGS
financially healthy Coca Cola Motor Oil Hellas OPAP
gives back to society SKLAVENITIS AB Vasilopoulos ELPEN PHARMACEUTICAL
interesting job content ELPEN PHARMACEUTICAL Aegean Airlines iaso hospital
job security Bank of Greece S.A. SKLAVENITIS Motor Oil Hellas
pleasant work atmosphere SKLAVENITIS Aegean Airlines ELPEN PHARMACEUTICAL
uses latest technologies COSMOTE INTRACOM HOLDINGS Intrasoft International SA
very good reputation SKLAVENITIS Aegean Airlines ION S.A.
work-life balance SKLAVENITIS ELPEN PHARMACEUTICAL Bank of Greece S.A.
by EVP driver.
36

|
deep dive EVP drivers
2020 employer brand research.
employer brand research 2020, report greece 37

||
76%
63%
54%
46%
44%
30%
27%
27%
22%
17%
20%
19%
18%
16%
16%
11%
what potential employees wantthe most important criteria when choosing an employer.
employer brand research 2020, report greece
72%
61%
48%
47%
42%
32%
28%
25%
25%
20%
17%
17%
17%
16%
16%
13%
attractive salary & benefits
pleasant work atmosphere
career progression
job security
work-life balance
flexible arrangements
financially healthy
good training
location
gives back to society
interesting job content
quality products
uses latest technologies
very good reputation
strong management
diversity & inclusion
europe2020
greece2018
greece2019
versus 2019important criteria
Characteristics highest rated by the labor force. Stressing these elements or improving them is critical for your EVP because they contribute most to the strength of your employer brand.
75%
63%
55%
50%
42%
30%
21%
26%
21%
18%
20%
20%
17%
16%
16%
10%
59%
51%
36%
48%
48%
47%
31%
25%
28%
19%
31%
31%
16%
13%
18%
16%
16%
38

||
17%
18%
18%
20%
19%
17%
11%
23%
17%
17%
13%
13%
14%
15%
gives back to society
interesting job content
quality products
uses latest technologies
good reputation
strong management
diversity & inclusion
EVP driver importanceby gender.
employer brand research 2020, report greece
69%
58%
48%
48%
42%
30%
30%
25%
24%
74%
64%
47%
46%
43%
35%
25%
25%
27%
attractive salary & benefits
pleasant work atmosphere
career progression
job security
work-life balance
flexible arrangements
financially healthy
good training
location
male
female
39

||
EVP driver importanceby education.
employer brand research 2020, report greece
74%
61%
49%
48%
44%
32%
67%
61%
45%
47%
40%
33%
attractive salary & benefits
pleasant work atmosphere
career progression
job security
work-life balance
flexible arrangements
28%
26%
24%
19%
17%
16%
26%
23%
28%
22%
19%
20%
financially healthy
good training
location
gives back to society
interesting job content
quality products
17%
15%
16%
13%
17%
20%
15%
12%
uses latest technologies
very good reputation
strong management
diversity & inclusion
higher
middle
lower (base too small)
40
||
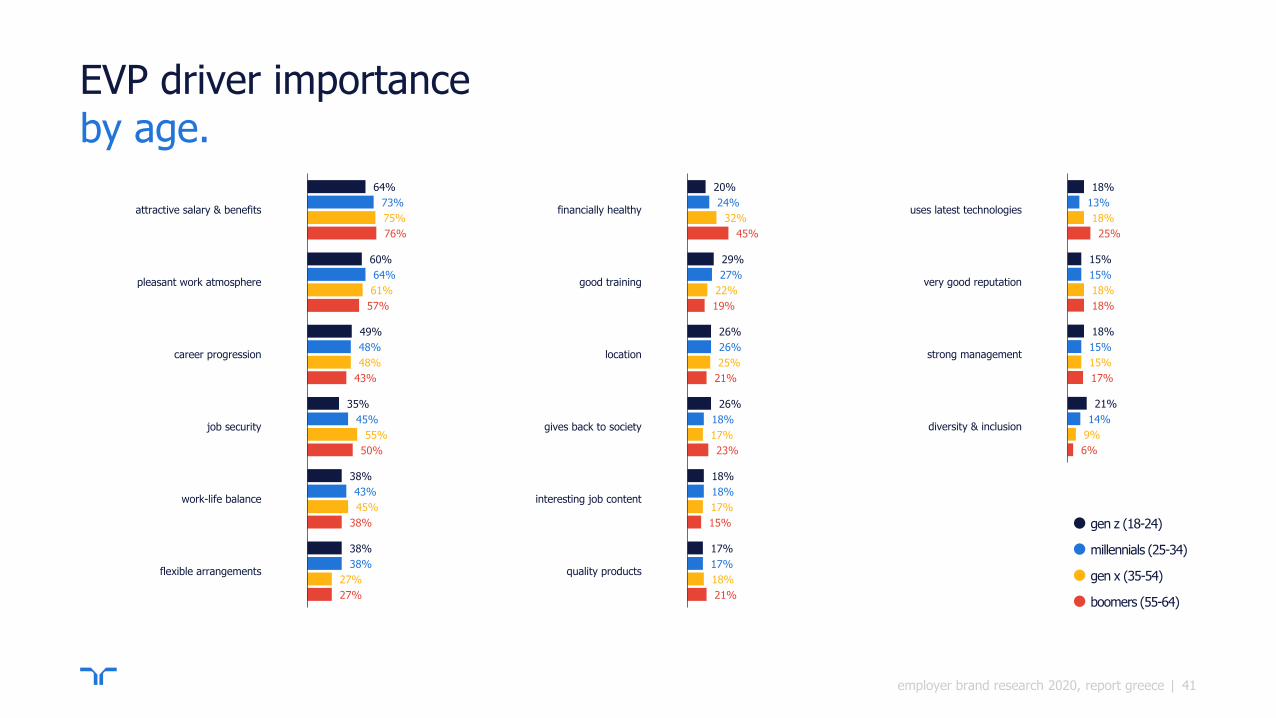
EVP driver importanceby age.
employer brand research 2020, report greece
18%
15%
18%
21%
13%
15%
15%
14%
18%
18%
15%
9%
25%
18%
17%
6%
uses latest technologies
very good reputation
strong management
diversity & inclusion
20%
29%
26%
26%
18%
17%
24%
27%
26%
18%
18%
17%
32%
22%
25%
17%
17%
18%
45%
19%
21%
23%
15%
21%
financially healthy
good training
location
gives back to society
interesting job content
quality products
64%
60%
49%
35%
38%
38%
73%
64%
48%
45%
43%
38%
75%
61%
48%
55%
45%
27%
76%
57%
43%
50%
38%
27%
attractive salary & benefits
pleasant work atmosphere
career progression
job security
work-life balance
flexible arrangements gen x (35-54)
millennials (25-34)
boomers (55-64)
gen z (18-24)
41

||
EVP driver importancetrends, total.
employer brand research 2020, report greece
1/2
0
20
40
60
80
2018 2019 2020
attractive salary & benefits
0
20
40
60
80
2018 2019 2020
pleasant work atmosphere
0
20
40
60
2018 2019 2020
career progression
0
20
40
60
2018 2019 2020
job security
0
20
40
2018 2019 2020
good training
0
20
40
2018 2019 2020
financially healthy
0
20
40
2018 2019 2020
flexible arrangements
0
20
40
60
2018 2019 2020
work-life balance
42

||
EVP driver importancetrends, total.
employer brand research 2020, report greece
2/2
0
20
40
2018 2019 2020
location
0
20
40
2018 2019 2020
gives back to society
0
20
40
2018 2019 2020
interesting job content
0
20
40
2018 2019 2020
quality products
0
20
2018 2019 2020
diversity & inclusion
0
20
2018 2019 2020
strong management
0
20
2018 2019 2020
very good reputation
0
20
2018 2019 2020
uses latest technologies
43

|
deep dive employers
2020 employer brand research.
employer brand research 2020, report greece 44

||
employee benefits that
employer brand research 2020, report greece
attractive benefits
86%
82%
81%
77%
76%
72%
67%
44%
health care
additional vacation benefits (annual leave,sabbatical leave)
full or partial reimbursement of commuting ormobility expenses
internal training and subsidized furthereducation (courses, certificates, etc.)
flexible working hours
group life insurance
discounts on the company’s products
sports and leisure package
75%
68%
68%
62%
60%
58%
42%
possibility of working from home
subsidized meals / cafeteria plan
childcare services and support
full or partial reimbursement of prescriptionglasses or contact lenses
company phone
travel insurance
opportunity to buy company shares
greek find attractive.
*the 15 benefits were shown randomly in two sets of 8 and 7 benefits, respectively, each set shown to 50% of the sample. For each bar chart, the base is respondents who are employed and received that particular set on the screen.
attractive (n=1,062)attractive (n=982)
45
||
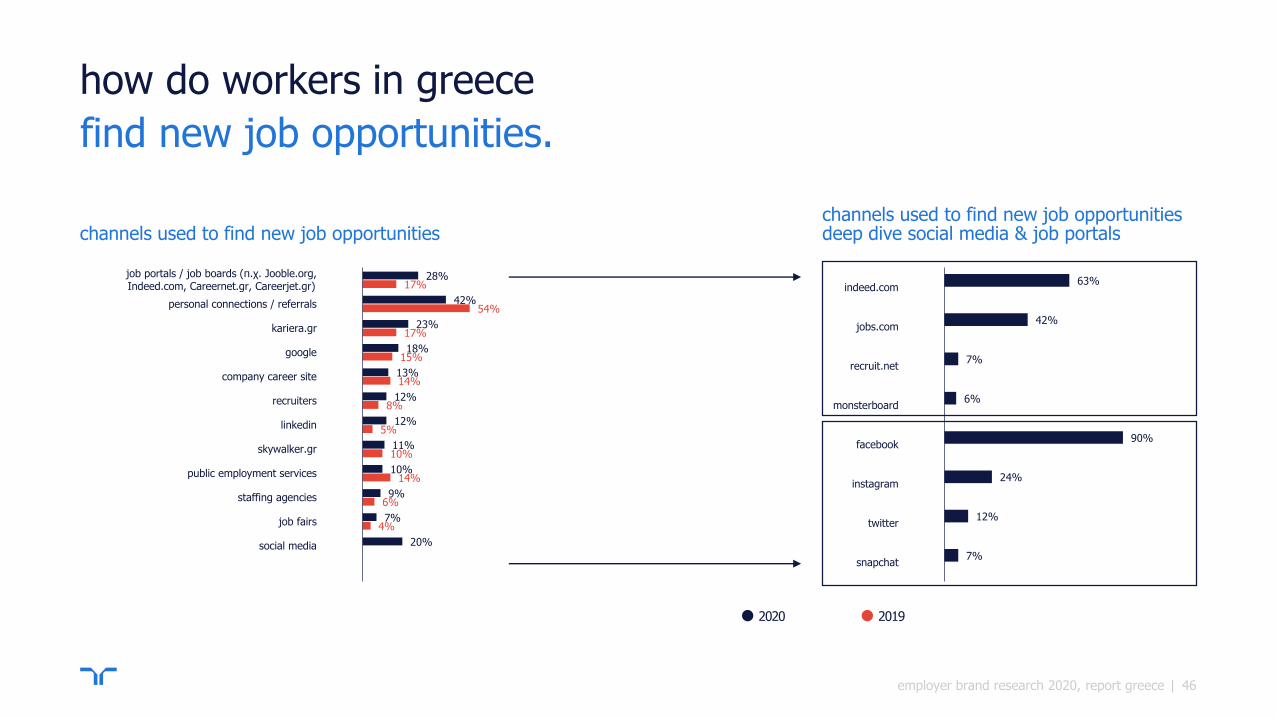
how do workers in greece
employer brand research 2020, report greece
channels used to find new job opportunities
2020 2019
28%
42%
23%
18%
13%
12%
12%
11%
10%
9%
7%
20%
17%
54%
17%
15%
14%
8%
5%
10%
14%
6%
4%
job portals / job boards (π.χ. Jooble.org, Indeed.com, Careernet.gr, Careerjet.gr)
personal connections / referrals
kariera.gr
company career site
recruiters
skywalker.gr
public employment services
staffing agencies
job fairs
social media
find new job opportunities.
63%
42%
7%
6%
90%
24%
12%
7%
indeed.com
jobs.com
recruit.net
monsterboard
snapchat
deep dive social media & job portalschannels used to find new job opportunities
46

||
in greece and the region.
employer brand research 2020, report greece |
Understanding the gap between what employees want and what they think employers offer in greece and in the region provides valuable insights into building an employer brand.
employers in greece are perceived to offer.
employers in europe are perceived to offer.
1 financially healthy 1 financially healthy
2 uses latest technologies 2 uses latest technologies
3 very good reputation 3 job security
4 job security 4 very good reputation
5 career progression 5 career progression
6 pleasant work atmosphere 6 attractive salary & benefits
7 interesting job content 7 pleasant work atmosphere
8 attractive salary & benefits 8 interesting job content
9 work-life balance 9 work-life balance
10 gives back to society 10 gives back to society
perception of employer offer
47

||
sector 1 2 3
01 pharmaceuticals financially healthy uses latest technologies very good reputation
02 tv/radio/media/advertising job security attractive salary & benefits pleasant work atmosphere
03 energy oil financially healthy job security uses latest technologies
04 gambling financially healthy uses latest technologies very good reputation
05telecommunications/information technology
uses latest technologies financially healthy very good reputation
06 travel & tourism financially healthy uses latest technologies very good reputation
07 engineering / construction financially healthy uses latest technologies very good reputation
08 consumer product financially healthy very good reputation uses latest technologies
09 transportation/cargo financially healthy job security very good reputation
10 healthcare uses latest technologies financially healthy very good reputation
top 3 EVP drivers
employer brand research 2020, report greece
greece’s sectors score best on these 3 EVP drivers.1/3
48
||
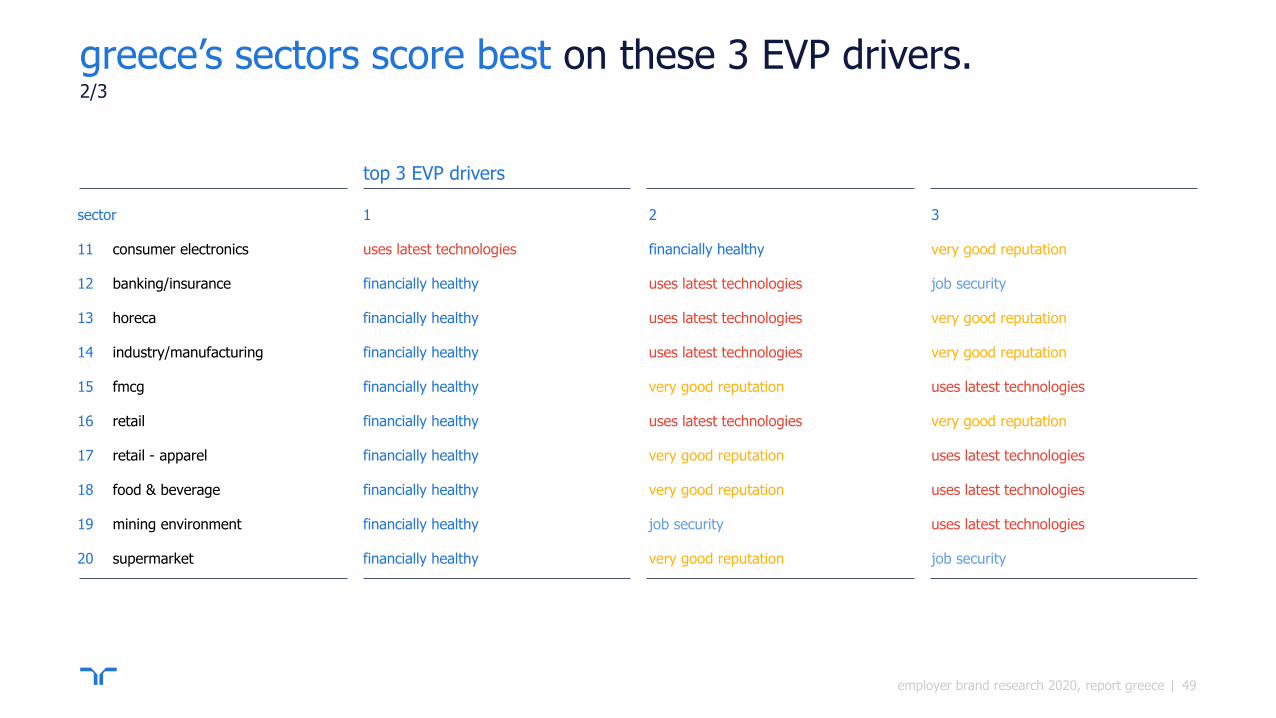
sector 1 2 3
11 consumer electronics uses latest technologies financially healthy very good reputation
12 banking/insurance financially healthy uses latest technologies job security
13 horeca financially healthy uses latest technologies very good reputation
14 industry/manufacturing financially healthy uses latest technologies very good reputation
15 fmcg financially healthy very good reputation uses latest technologies
16 retail financially healthy uses latest technologies very good reputation
17 retail - apparel financially healthy very good reputation uses latest technologies
18 food & beverage financially healthy very good reputation uses latest technologies
19 mining environment financially healthy job security uses latest technologies
20 supermarket financially healthy very good reputation job security
top 3 EVP drivers
employer brand research 2020, report greece
greece’s sectors score best on these 3 EVP drivers.2/3
49

||
sector 1 2 3
21 business services - outsourcing uses latest technologies financially healthy career progression
22 security/facilities services uses latest technologies financially healthy very good reputation
23 retail - home improvement financially healthy uses latest technologies very good reputation
24 food industry - perishable financially healthy very good reputation uses latest technologies
top 3 EVP drivers
employer brand research 2020, report greece
greece’s sectors score best on these 3 EVP drivers.3/3
50
|
methodology
2020 employer brand research.
employer brand research 2020, report greece 51
||
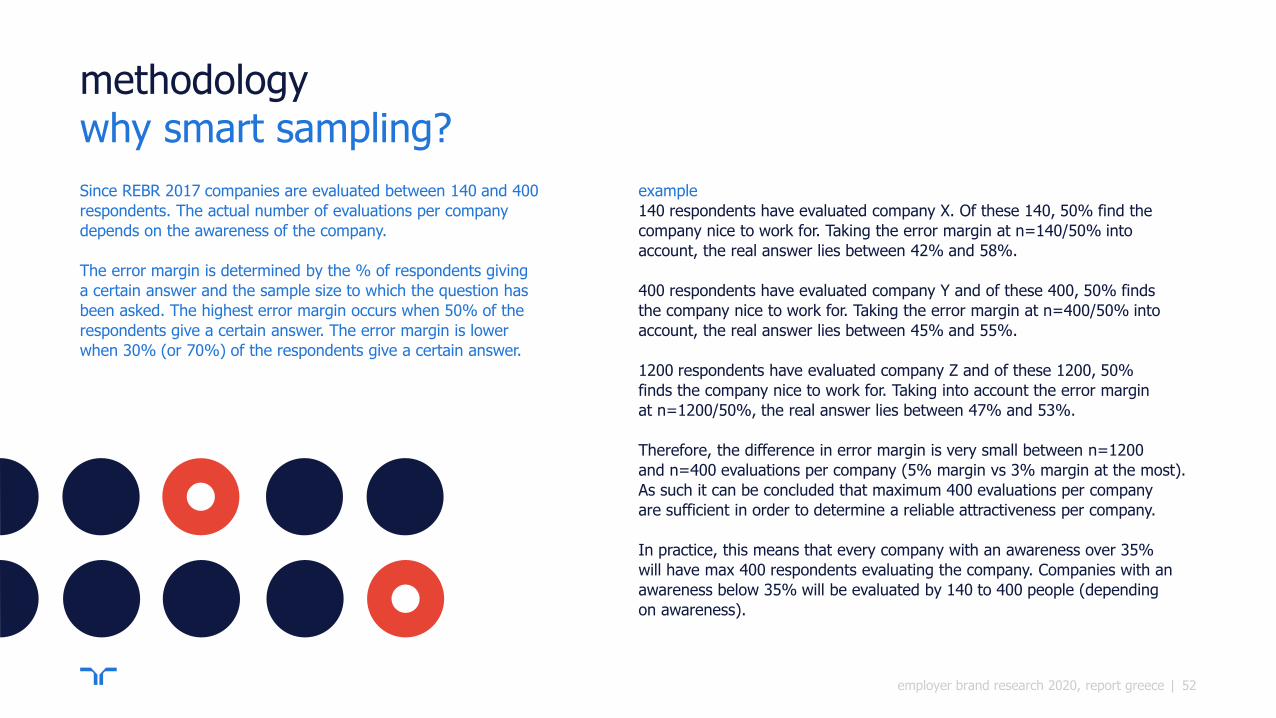
methodologywhy smart sampling?
Since REBR 2017 companies are evaluated between 140 and 400
respondents. The actual number of evaluations per company
depends on the awareness of the company.
The error margin is determined by the % of respondents giving
a certain answer and the sample size to which the question has
been asked. The highest error margin occurs when 50% of the
respondents give a certain answer. The error margin is lower
when 30% (or 70%) of the respondents give a certain answer.
example
140 respondents have evaluated company X. Of these 140, 50% find the
company nice to work for. Taking the error margin at n=140/50% into
account, the real answer lies between 42% and 58%.
400 respondents have evaluated company Y and of these 400, 50% finds
the company nice to work for. Taking the error margin at n=400/50% into
account, the real answer lies between 45% and 55%.
1200 respondents have evaluated company Z and of these 1200, 50%
finds the company nice to work for. Taking into account the error margin
at n=1200/50%, the real answer lies between 47% and 53%.
Therefore, the difference in error margin is very small between n=1200
and n=400 evaluations per company (5% margin vs 3% margin at the most).
As such it can be concluded that maximum 400 evaluations per company
are sufficient in order to determine a reliable attractiveness per company.
In practice, this means that every company with an awareness over 35%
will have max 400 respondents evaluating the company. Companies with an
awareness below 35% will be evaluated by 140 to 400 people (depending
on awareness).
employer brand research 2020, report greece 52
||
source bibliography.
1
https://hbr.org/2016/03/a-bad-reputation-costs-company-at-least-10-more-
per-hire
2 https://www.betterteam.com/blog/employer-branding
3 https://www.slideshare.net/JWTINSIDE/culture-scape-1028-sm
4 https://www.pwc.com/gx/en/ceo-survey/2015/assets/pwc-18th-annual-global-ceo-survey-jan-2015.pdf
5 https://www.webershandwick.com/uploads/news/files/EmployerBrandCredibilityGap.pdf
6
https://business.linkedin.com/content/dam/business/talent-
solutions/global/en_us/c/pdfs/ultimate-list-of-employer-brand-stats.pdf
7
https://business.linkedin.com/content/dam/business/talent-
solutions/global/en_us/job-switchers/PDF/job-switchers-global-report-
english.pdf
8
https://business.linkedin.com/talent-solutions/blog/2011/12/whats-the-value-
of-your-employment-brand
9
https://www.webershandwick.com/uploads/news/files/EmployerBrandCredibilit
yGap.pdf
employer brand research 2020, report greece 53

||
companyspecific slide.
your company• What does it do/ what is it known for• Active in x countries: name countries
few facts about their EVP (if any)• Abc• Abc
how can the RS consultant help them• Ipient re laceatu riateni temquis coraectem volorro
totasi ipsam dis sum quissinvenis enisti ut faccae.• Obita qui qui as modisque pos est re, officataque dem
ut atur sum nis assi nimo vollab ilit ratus, vid ut volo rem la idebis etur ressi deri dolo bearum remporenis.
• Alita ex ellupta tecusam que non repuda nimpe solum am dolecti re il ipsam fugiam volorum quam.
employer brand research 2020, report #Country 54

||
let’s talk.
employer brand research 2020, report greece
Our research has many insightful, but complex insights so we'd love the opportunity to walk you through this document, share our thoughts and answer any questions you might have.
randstad greeceAnna [email protected]
55
