employees satisfaction with performance appraisal … 28th volume/4 performance appraisal.pdf · to...
TRANSCRIPT

International Journal of Information Technology and Business Management 29
th Aug 2014. Vol.28 No.1
© 2012 – 2014 JITBM & ARF. All rights reserved
ISSN 2304-0777 www.jitbm.com
21
EMPLOYEES’ SATISFACTION WITH PERFORMANCE
APPRAISAL (A Case Study of Rwanda Education Board)
Dr Kerosi Josaphat Bosire1. Mukamuhinda Odette
2, Jesse david Kabagambe
3
Départment of Finance, University of Kigali 1, 3
, Department of Human Resource Management IGNOU2
[email protected] , [email protected] , [email protected]
ABSTRACT
This study titled “Employees’ Satisfaction with Performance Appraisal” investigated employees’ reactions
to satisfaction with the existing performance appraisal system as applied in Rwanda Education Board by
utilizing 4Likert’s scale. The study variables included Job Analysis, Performance Measures, Performance
Feedback, Performance Ratings and different decisions related to performance appraisal involving
Trainings and Coaching, performance based Rewards, Transfer, Promotion, and Demotion. The study was
undertaken for first to “present REB appraised employees’ demographic characteristics” with regards to
their Gender, Age, and Marital status, level of education and Working experiences; second to “find out
various in reactions of REB’s employees to the performance appraisal done”; third to “examine the
accuracy of REB’s PA decisions”. From a population of 74 employees, a sample of 62 individual units
representing technical and professional employees of REB was involved. Questionnaire (SAQ) was used for
data collection and data thus collected was analyzed using descriptive statistics. The Cronbach’s
coefficient alpha was calculated to measure internal consistency that is, how closely related a set of items
are as a group. The coefficient of determination was also computed to examine the accuracy of REB’s PA
decisions. The analyses were performed using SPSS program. The main findings that came out of this case
study were that the majority of respondents were male, in group age of (31-40) years, holds bachelor
degree, had working experiences ranging between 6-10 years and reported to be married. Employees were
found to be substantially satisfied with promotion, demotion, transfer, job analysis and performance
measures; and relatively satisfied with performance related feedback, ratings, training, and reward. The
majority of REB employees perform what they are not supposed to do (which are out of their attributions),
and decisions of reward, promotion, demotion, transfer are based on what employees have been achieved;
and the latter is totally different from what they have employed to do.
Keywords: Employee Satisfaction, Performance appraisal, likert scale,
INTRODUCTION
Background of the Study The success of every organization depends
largely on the availability and quality of well-
motivated and satisfied human resource.
Organizations are now more focused on the need
to get more from their employees if they are to
achieve organizational objectives. The tool used
is the performance appraisal. It measures
employees’ skills, knowledge, and attitudes and
determines specific decisions for personnel’s’
improved performance and satisfaction.
Performance appraisal evaluates employee’s job
performance in terms of its requirements - a
process by which employees’ estimation,
judgment of value and excellence are determined

International Journal of Information Technology and Business Management 29
th Aug 2014. Vol.28 No.1
© 2012 – 2014 JITBM & ARF. All rights reserved
ISSN 2304-0777 www.jitbm.com
22
and ranked for the purpose of both employees
and management’s performance and satisfaction.
Therefore, on one side, performance appraisal
(PA) determines reasons why some employees
shall receive merits, be trained, promoted and
counseled, and why others will be transferred,
etc, (Mamoria & Gankar, 2002). On the other
side, it enables management to monitor
performance standards, agree on expectations
and objectives, delegate responsibilities and
tasks, and even take decisions. For that reason,
PA should be fair, comprehensive and agreed
upon by both parties in order to attain a high
level of understanding, acceptance and
satisfaction. As was well said “satisfied
employee commits his or her effort to perform
well (Kazmier & Leonard, 1977), and these
could not be accomplished unless an employee
recognizes accuracy in PA processes and
decisions.
The Problem There is a variety of Performance Appraisal (PA)
systems available such as 360 degree appraisal,
Results-Oriented Appraisal (MBO) and
Traditional Performance Rating (i.e. Critical
Incident Method, Forced Choice Technique,
Forced Distribution Procedure, Paired-
comparison System, Rank-order Procedure, etc).
It is the duty of the organizations’ management
to find an appropriate PA for adoption given
their unique environment.
It is assumed that the PA tools should be
effectively designed, implemented and
administrated properly by the organization
management. The raters and retirees must both
accept it.
Additionally, the PA results generally do not
adequately reflect the ability of employees. This
could be attributed to the subjective nature of the
PA criteria, the irrelevance of the criteria used to
appraise the performance of the employees, lack
of skills and knowledge of the appraisers, the
subjectivity, favoritism and bias of the
appraisers, lack of continuous documentation
and inability to provide feedback as to the results
of the PA.
Moreover, there is more need to harmonize
appraisal process and formats in cases where
different institutions are merged and then come
up with a suitable consolidated PA system which
is fair, honest and participative for both raters
and ratees in order to satisfy the employees and
achieve the institution’s goal and objectives.
Since REB is a product of merged of previously
autonomous institutions, it is necessary to
determine how the performance appraisal used
by REB management affects the employees’
satisfaction.
Studies Objectives The research attempted to determine how
employees are satisfied with PA system.
Satisfaction was measured basing on their
reactions on both PA planning, feedback and
decisions as prescribed in the conceptual
framework for the study in chapter II. To be
more specific, the study was undertaken in order:
(i) To present the REB appraised
employees’ demographic
characteristics.
(ii) To assess various reactions of REB’s
appraised employees from the
performance appraisal done.
(iii) To examine the accuracy (fairness) of
REB’s decisions taken to employees’
appraisals.
Scope of the Study: This research is about
“Employees’ satisfaction with performance
appraisal. It undertakes a case of Rwanda
Education Board (REB). REB headquarters is
located at Remera. The study focused on the last
three years (July 2010- July 2012) performance
evaluation; where REB could draw out a guide
tool to orient, sharpen and retain its employees
even though they possess diverse attitudes and
level of perception acknowledged from their
previous years’ experiences.
LITERATURE REVIEW
Needs and Process of Performance Appraisal
Performance Appraisal (PA) began as a simple
method of income justification and nowadays
seems both inevitable and universal (North,
2005). The business climate has changed. It
seems that no organization is protected to the
consequence of competition. The result of this is
a justified obsession with quality and

International Journal of Information Technology and Business Management 29
th Aug 2014. Vol.28 No.1
© 2012 – 2014 JITBM & ARF. All rights reserved
ISSN 2304-0777 www.jitbm.com
23
productivity. It is therefore more important than ever to accurately measure job performances so
that decisions can be taken fairly and accurately
implemented to solve performance problems
quickly.
In this view, appraisal is done to evaluate
personnel capabilities and judge their value,
excellent qualities, and behavior in relation to
their job performance. It is in view of
determining employees’ accomplishments, to
improve their performance, and to help
organizations manage the world dynamics
(Winston & Creamer, 1997). It is not only in
monitoring staff’s competences, but also
ensuring company’s core success and external
demands” (Ubeda & Santos, 2007, p.110).
Contrary, most of employees have considered
PA as a stressful tool. At worst they have seen it
as a figurative whip in the hands of their
supervisors (Davis, 1999) who sometimes rate to
their own sets of likes, dislikes, and expectations
(Ivancevich, 2001). On the other side, managers
also do not like to sit on the chair of judgment of
others. It is more worth when in so doing they
risk offending someone. They argue to maintain
a continuing enthusiastic environment with their
subordinates. Even though, managers and
employees could have many reasons to drop the
appraisal, it is a mistake to discontinue it
(Kennedy, 1999). Appraisal is a key factor in
achieving a good return on organizations’
“intellectual capital” (Simmons, 2002), reduces
role ambiguity (Petttijohn et al, 2001), secures
employees’ commitment, improvement and
satisfaction (Harrison & Goulding, 1997),
determines pay and other financial compensation
(Murphy & Cleveland, 1997), and is the basis of
other decisions such as promotion, demotion,
transfer, dismissal, etc.
Additionally, Appraisal is important as it helps
employees become aware of how their day-to-
day performance matches the organization goals
(Coutts and Schneider, 2004, p.67) and
motivates them to work harder and thus increase
their productivity (Mound, 2001).
Performance Appraisal: Planning
In an effective organization, work is planned in
advance. The planning takes attention of various
aspects as they impact on how effectively the
system actually measures employees’
contributions in work performances (Buford and
Lindner, 2002). This includes specifying
elements and standards that the employee is
expected to accomplish during the appraisal
period. Therefore, these elements should be
measurable, understandable, verifiable,
equitable, and achievable.
Sometimes, organizations fail to update their
documents and performance measures are set
based on existing organizational documents
describing jobs regardless of the changes
occurring in their working environment, work
policies, labor laws, and etc. As a result, there is
no compliance between the work implementation
and work planning realities. This increases
employees’ fear and keeps them in the dark,
asking themselves on what standards they are
being judged (swan, 1999). Thus, involving
them in the planning process is essential. They
become aware of what needs to be done, why is
it needed to be done, and what is expected from
them.
Therefore, describing and specifying jobs (job
analysis) defines employees’ expectations and
track accomplishments (Fago, 2006), and
ultimately drives actions of employees (Blanchar
& Onton, 2005) with regard to measures
established. So, it is the responsibility of
organizations to clarify the working conditions,
tools and equipment to be used, knowledge and
skills needed, and relationships with other
positions (Mary, Nuernberger, et al, 2010).
Performance Appraisal: Feedback A meaningful performance appraisal is a two-
way process that benefits both the employee and
manager. For employees, appraisal is the time to
find out how the manager thinks they are
performing in the job. For a manager, appraisal
is a good time to find out how employees think
they are performing on the job.
The feedback is given to employees’ input
(Jaworski & Kohli, 1991), either verbally, in
writing, or both to appraise the quality of work
done (Towne, 2006). Therefore, it should be
specific, factual, unemotional, and directed at
performance (Sirota & Mischkind, 2006) with
view of providing information on employees’

International Journal of Information Technology and Business Management 29
th Aug 2014. Vol.28 No.1
© 2012 – 2014 JITBM & ARF. All rights reserved
ISSN 2304-0777 www.jitbm.com
24
actual performance, contrasted with their
expectations (Alvero et al., 2001; Van De Vliert,
2004), and emphasizing comments concerning
improvements.
In addition, feedback is either given formally or
informally and providing it on time enables
employees identify their present status and their
future prospects (Lam, et. al., 2002). The
frequency of feedback brings employees’
happiness and feel more satisfied and accept
recommendations as they know management is
interested in what they do (Sirota & Mischkind,
2006).
Performance Appraisal Decisions Performance appraisal is a motivational tool
(Wilson & Westerns, 2001) which is now still
serving a numbers of organizational purposes
such as assisting in pay promotion, and
termination decisions, identifying training needs
& development opportunities ( Man, B. G.,
2002). The reason behind that is in keeping on
with organizational success and growth.
However, PA as motivational tool incites
employees’ to have feelings of satisfaction -
attitude and feelings employees have about their
work (Armstrong, 2006) explaining the extent to
which they are content (Statt, 2004) – and
perform on their best capabilities. For most of
time, the stimulus lies between the amount and
type of rewards provided to employees and the
amount and type of rewards they expected to
receive (Probst & Brubaker, 2001).
Moreover, rewarding does not only focus on
financial compensation (Dewhurst et al., 2010).
Some other means like praising employees help
them to keep on their performance. This refers to
the treatment of the employees by their managers
in such a manner that the employees feel
considered as useful and capable.
Promotions are obviously the easiest situations to
deal with as most employees are happy to be
provided with a promotion and are generally
eager to accept. In particular, an employer should
ensure that the promotion is provided in writing
with the specific terms and expectations of the
new position laid out, acceptance of which is a
condition of the promotion.
Demotion is a loss of prestige and status as well
as a substantial change to the essential terms of
an employment contract that warrants a finding
that an employee has been constructively
dismissed. Therefore, in the absence of previous
written warnings that; without improvement of
the employee’s performance in his present
position - with specifics as to what needs to be
improved, and a failure of the employee to do so
within a reasonable time - demotions in general
provide an opportunity for an employee to claim
constructive dismissal particularly where, as is
usually the case, there is a remuneration
reduction as part of the demotion.
METHODOLOGY
Research Design The study was based on both descriptive and
qualitative research techniques. Respondents
were requested to describe their satisfaction
toward performance appraisal in Rwanda
Education Board. The reason for selection of
these research techniques is their ability to
provide complex descriptions of how people
experience appraisal systems, processes and
decisions. These methods are effective in
identifying tangible and intangible factors.
Study Population
The population of the study is
technical/professional employees of REB who
participated as ratees in the performance
appraisal process at least in the three consecutive
years. The researcher established this
requirement because “promotion” is among the
research variables and the Labor law of Rwanda
regulates horizontal promotion for those received
appraisal for three consecutive years.
Per now, REB would have a total workforce of
242, but, it has only 166 employees of which 120
are technical/professional employees. The
number of employees who were appraised within
the period of study (July 2010-July 2012) were
74 staff members. Hence, the study concerns
only a population of 74 employees defined as
being technical employees.

International Journal of Information Technology and Business Management 29
th Aug 2014. Vol.28 No.1
© 2012 – 2014 JITBM & ARF. All rights reserved
ISSN 2304-0777 www.jitbm.com
25
Sampling
A sample of 62 employees was drawn from a
population of 74 workforces. In working out the
sample size we have made certain parameter
estimates. For this study the confidence level
was set at 95% and the margin of acceptance
error at 5%. This was Based on the Slovin’s
formula.
Instrumentation and procedures
A survey instrument was established to collect
data in this study from eligible employees
defined as technical and professional officers.
All participants were supposed to think about
performance appraisal administered to them for
three consecutive years and then carefully
respond, in their role as apprasee, to different
structured statements.
Demographic questionnaire in which
respondents were asked their gender, age,
education level, marital status, and their working
experiences in the organization. PA planning,
processes, and decisions which were further
evaluated using 4 Likert scales, where ”1”
indicated strongly agree with the statement, and
”4” referred to strongly disagree with the
statement.
Data Collection Methods
To choose the research respondents from the
whole sample population, the researcher first
randomly selected the 1st item from the sampled
population list and then calculated the sampling
interval named “k”, using modified systematic
random sampling method
)( kn
N
, an integer
which was served as the constant difference
between any two consecutive random units. The
N stands for total targeted population which was
74 employees; n is the Sample size which was
62 employees; and then k calculated was equals
to 1.2; a constant served to select the research
respondents by picking the every consecutive kth
which is 1 from the list starting from the 1st item
selected in the sample size. As long as the k
found was a decimal number, also considering
that targeted population (74) minus sample size
(62) gives twelve (12); and given that 62 divided
by 12 gives almost Five (5), a researcher decided
to take every consecutive kth
(1) item and jump
every fifth item chosen in the list till the whole
sample size of 62 is obtained.
Data Analysis
Analysis is the application of reasoning to
understand and interpret the data that have been
collected (Zkmund, 2003:73
The first objective aimed at presenting the REB
appraised employees’ demographic
characteristics with regards to Gender, Age, and
Marital status, level of education and Working
experiences. Descriptive statistics describing the
characteristics of the population involving
frequencies and percentages were determined
and used to interpret respondents’ demographic
data.
The second objective was aimed at analyzing
various reactions of REB employees from PA.
The variation was measured basing on the REB
technical appraised employees’ views on PA
planning, feedback and PA related decisions.
These include job Analysis, performance
measures, performance feedback, coaching and
trainings, rating performance, performance based
rewards, transfer, promotion and demotion.
The employees’ views were measured on a four
point scale with 1= strongly agree; 2 = agree; 3 =
disagree; and, 4 = strongly disagree. Descriptive
statistics including means and standard deviation
were determined and represented in tables to
depict the variables tendency in a precise way
that exactly maintains the accuracy to which data
values were measured. . To aid in the
interpretation, the researcher established an
interpretive scale based on 4 Likert scales (see
table 3.1) below:

International Journal of Information Technology and Business Management 29
th Aug 2014. Vol.28 No.1
© 2012 – 2014 JITBM & ARF. All rights reserved
ISSN 2304-0777 www.jitbm.com
26
Table 3 1: Interpretive Scale
Moreover,
an overall
score for each
subscale was determined in order to detect the influence between subsets. The Cronbach’s coefficient alpha
cNv
cN
).1(
.
was calculated to measure internal consistency that is, how closely related a set of
items are as a group. Acceptable limits of alpha were set at a minimum of 0.70. Here N is equal to the
number of items, c-bar is the average inter-item covariance among the items and v-bar equals the average
variance. The scale used to describe the internal consistency is that of (Cronbach, 1951) as cited by (George
& Mallery, 2003), and is as in (table 3.2 below):
Table 3 2: Cronbach's alpha interpretive scale
Furthermore, the KMO and Bartlett’s test of adequacy for subscale variables was also used to test variance
between variables and was set at a minimum of 0.50. The associated probability requirement was set at
P<0.001. A check of communalities was performed for only those subscales not fulfilling one or both of the
above requirements.
The third objectives aimed at examining the accuracy of REB’s decisions taken to eemployees’ appraisals.
The coefficient of determination, denoted by
2
2 )(Re
iy
grSSR was used for this purpose and ranges from
zero to one. The interpretation of the magnitude of findings was done based on the descriptors developed
by Davis (1971) as cited in (Walsh, 2003) as follows:
Table 3 3 : Descriptors of Correlation coefficients
Scale Mean Scale
Interpretation
1 1.00 – 1.75 Strongly Agree (SA)
2 1.76 – 2.50 Agree (A)
3 2.51 – 3.25 Disagree (D)
4 3.26 – 4.00 Strongly Disagree (SD).
Cronbach's alpha Internal consistency
α ≥ 0.90 Excellent
0.90 > α ≥ 0.80 Good
0.80 > α ≥ 0.7 Acceptable
0.70 > α ≥ 0.60 Questionable
0.60 > α ≥ 0.50 Poor
0.50 > α Unacceptable
Correlation coefficients Descriptors
0.70 or higher Very strong association
0.50 - 0.69 Substantial association

International Journal of Information Technology and Business Management 29
th Aug 2014. Vol.28 No.1
© 2012 – 2014 JITBM & ARF. All rights reserved
ISSN 2304-0777 www.jitbm.com
27
RESULTS AND DISCUSSION
Demographic Characteristics of Respondents
This aimed at presenting respondents’ demographic characteristics with regards to their Gender, Age, and
Marital status, level of education and Working experiences. Data analysis showed that Fifty eight percent
(58%, n= 36) of the respondents were male. The remaining forty two percent (42%, n =26) of the
respondents were female (see Table 4.1.). This shows clearly that REB has no problem about technical
employees’ gender balance.
Table 4. 1: Gender of respondents
Gender Frequency Percent
Female 26 41.9
Male 36 58.1
Total 62 100.0
Source: primary data,2014
Regarding the ages of respondents, the largest group (n=34, 54.8%) was in the 31-40 years age group. The
second largest group (n=22, 35.5%) indicated their ages as above the 40 years. A very small proportion
(n=6, 9.7%) indicated their ages as fitting between 21-30 years (see Table 4.2.). The researcher noticed
that, the age group of REB’ technical staff shows that, it (REB) has a strong team who may serve for long
before being retired and again who if appraised well can push the Institution to success and growth.
Table 4. 2: Age Group of Respondents
Age Group Frequency Percent
21-30 6 9.7
31-40 34 54.8
above 40 22 35.5
Total 62 100.0
Source:primary data,2014
Eighty Seven percent (87%, n= 54) of the respondents were married whereas thirteen percent (13%, n=6)
reported not to be married (either Single or divorced or widowed) (see table 4.3.). This gives a good picture
to REB by having more than half of staff members being married. It comes much easier to manage problem
if someone is family taker.
Table 4. 3: Marital Status of respondents
Marital Status Frequency Percent
Married 54 87.1
Single 6 12.9
Total 62 100.0
0.30 - 0.49 Moderate association
0.10 – 2.90 Low association
0.01 - 0.09 Negligible association.

International Journal of Information Technology and Business Management 29
th Aug 2014. Vol.28 No.1
© 2012 – 2014 JITBM & ARF. All rights reserved
ISSN 2304-0777 www.jitbm.com
28
Source: Author. Data Analysis, 2012
Concerning respondents Qualifications, the majority (n=49, 79%) reported as holding a Bachelors degree
and a small number, 10% (n=6) and 11% (n=7) said that they possessed Diploma and Master Degree
respectively (see table 4.4 below). This explains that REB does not have any problem related to the staff
level of qualifications. Table 4. 4: Qualification of respondents
Qualification Frequency Percent
High school 0 0
Diploma 6 9.7
Bachelor 49 79.0
Post Graduate 7 11.3
Total 62 100.0
Source: Author. Data Analysis, 2012
Fifty five Percent (55 %, n=33) had work experience of between 6-10 years. Thirty percent (30%, n=18),
had work experience of above ten (10) years and finally the small number (n=9) representing 15% had
between one year and five years of experience (see table 4.5).
Table 4. 5: Working Experience of Respondents
Work Experience Frequency Percent
Year 1-5 17 27.4
6-10 29 46.8
above 10 16 25.8
Total 62 100.0
Source: Author. Data Analysis, 2012
Assessing Reactions of REB’s technical
Appraised Employees from the PA Done.
The assessment was done for both independent
and dependant variables involving job Analysis,
performance measures, performance feedback,
coaching and trainings, rating performance,
performance based rewards, transfer, promotion
and demotion. Using the factor analysis specifically; the principal components factor analysis to determine if the subset items produce factor loadings indicating that they can be considered to be part of a single construct. For the appropriateness of the factor analysis test, the Cronbach’s alpha internal consistency coefficient was used to estimate the reliability of the scale. Acceptable limits of alpha were set at a minimum of 0.70. The Kaiser-Meyer-Olkin and Bartlett’s test of adequacy for subscale
variables was also used to test variance between variables and set at a minimum overall MSA of 0.50. The probability associated with the Bartlett test has to satisfy the requirement of P<0.001. A check of communalities was performed for only those subscales not fulfilling one or both of the above requirements. Job Analysis:-For Job analysis, the following questions were asked and answered by respondents: (1) I have a job that has clear purpose, (2) I’m assigned understandable responsibilities, (3) Working condition is supporting, and (4) I have the required equipments and materials to perform my Job. The items with which they most agreed were “I have a job that has clear purpose” (µ = 1.90) and “the working condition supports my work” (µ = 1.97).

International Journal of Information Technology and Business Management 29
th Aug 2014. Vol.28 No.1
© 2012 – 2014 JITBM & ARF. All rights reserved
ISSN 2304-0777 www.jitbm.com
29
Table 4. 6: KMO and Bartlett’s test for the subset (job analysis) adequacy
Source: primary data,2014 The KMO and Bartlett’s test was determined and found to be 0.63, p=.000 <0.001 (See table 4.6).
The Cronbach’s alpha internal consistency coefficient α was determined and found to be 0.83 which gave
the research a go ahead to determine the factor analysis for this subset.
Table 4. 7: Factor Loading for Items Representing REB employees’ Views on Job Analysis
Source: Author. Data Analysis, 2012
Note: REB= Rwanda Education Board
The factor loadings determined ranged from a high of 0.85 to a low of 0.57 indicating that the four items
could be verified to measure a single construct (See Table 4.7).
Table 4. 8: REB technical employees’ views on Job Analysis
Source: Primary data
Since the four items in the “Job Analysis” scale were determined to measure a single construct, the
researcher computed an overall score for the items in this scale. The overall score was determined and
found to be µ=2.10 (SD = 0.51) which was classified in the “Agree” response category (See Table 4.8).
Performance Measures: For performance measures subset, the following questions were asked and
answered by respondents: (1) I agree with PA expectations; (2) PA process is participatory (3) PA
measures are clear; and (4) PA measures what I really do. Respondents “Agreed” (item scores between
1.76 and 2.50). The items on which the respondents agreed most were in the order: 1) I agree with PA
expectations with mean µ = 1.98, PA measures are clear with mean µ = 2.26 and “PA measures what I
KMO and Bartlett's Test
Kaiser-Meyer-Olkin Measure of Sampling Adequacy. 0.639
Bartlett's Test of Sphericity Approx. Chi-Square 154.014
df 6
Sig. .000
Item Factor Loading
Job with a clear purpose 0.81
Job with clear responsibility 0.85
Supporting working condition 0.87
Required equipment & materials 0.81
Item
Mean
Std.
Dev.
Response
Category
Job with a clear purpose 1.90 .433 A
Job with clear responsibility 2.21 .681 A
Supporting working condition 1.97 .361 A
Required equipment & materials 2.32 .566 A
Overall Score 2.10 .510 A

International Journal of Information Technology and Business Management 29
th Aug 2014. Vol.28 No.1
© 2012 – 2014 JITBM & ARF. All rights reserved
ISSN 2304-0777 www.jitbm.com
30
really do with mean µ = 2.48. The item with which respondents disagreed was “PA process is
participatory” with mean µ = 2.53.
Table 4. 9: KMO and Bartlett’s test for the subset (performance measures) adequacy
KMO and Bartlett's Test
Kaiser-Meyer-Olkin Measure of Sampling Adequacy. 0.658
Bartlett's Test of Sphericity Approx. Chi-Square 27.761
df 6
Sig. .000
Source: Author. Data Analysis, 2012
KMO and Bartlett’s test of adequacy for this set was determined and found to be 0.65, P=.000<0.001(see
table 4.9).
The Cronbach’s alpha internal consistency coefficient α was found to be 0.62. This gave the researcher an
idea to perform first a test of communality among variables before proceeding. The test was done using
Principal Component Analysis with the extraction method; the communalities ranged from a high of 0.62 to
a low of 0.12 (See Table 4.10).
Table 4. 10 : Variance between variables of the subset “Performance Measures”
Communalities
Initial Extraction
I agree with performance expectations 1,000 .628
PA process is participative 1,000 .122
PA measures are clear 1,000 .611
PA measures what i really do 1,000 .506
Extraction Method: Principal Component Analysis.
Source: Author. Data Analysis, 2012
Since, the item “PA process is participatory” did not fulfill the minimum requirement of (0.50), the
researcher decided to remove this item in the scale and then proceed with factor analysis.
Table 4. 11: Factor Loading for Items Representing REB employees’ Views on Performance
measures
Source: Author. Data Analysis, 2012
The factor analysis for this subset was done and factor loaded from a high of 0.85 to a low of 0.57
indicating that the only three items could be verified to measure a single construct (See Table 4.11).
‘
Item Factor Loading
I agree with PA expectations 0.79
PA measures are clear 0.78
PA measures what i really do (reversed coded) 0.69

International Journal of Information Technology and Business Management 29
th Aug 2014. Vol.28 No.1
© 2012 – 2014 JITBM & ARF. All rights reserved
ISSN 2304-0777 www.jitbm.com
31
Table 4. 12: REB employees’ views on the “Performance measures” subscale
Source: Author. Data Analysis, 2012
The researcher computed an overall score for only three items in this scale. The overall score was µ=2.24
(SD = .61) which falls in the “Agree” response category (See Table 4.12).
Performance feedback: For the performance feedback subset, the following questions were asked and
answered by respondents: (1) Feedback is timely; (2) Feedback is given in the best manner (3) I have the
chance to comment on the feedback; and (4) Never receive performance feedback. Respondents “Agreed”
(item scores between 1.76 and 2.50) items as follows: “Feedback is timely” (µ = 2.39), Feedback is given
in the best manner (µ = 2.26), I have the chance to comment on the feedback (µ = 2.16) and “Never
received performance feedback” (µ = 2.90) with a reverse coding.
Kaiser-Meyer-Olkin and Bartlett’s test of adequacy for set of variables was determined to be 0.79 and their
associated probability P=.000<0.001 (see table 4.13) satisfied the requirement.
Table 4. 13: KMO and Bartlett’s test for the subset (performance feedback) adequacy)
KMO and Bartlett's Test
Kaiser-Meyer-Olkin Measure of Sampling Adequacy. .795
Bartlett's Test of Sphericity Approx. Chi-Square 134.336
df 6
Sig. .000
Source: Author. Data Analysis, 2012
The Cronbach’s alpha internal consistency coefficient α was determined and found to be 0.80 which gave
the researcher a go ahead to determine the factor analysis for this subset.
Table 4. 14: Factor Loading for Items Representing REB employees’ Views on performance
feedback
Source: Author. Data Analysis, 2012
Item
Mean
Std.
Dev.
Response
Category
I agree with PA expectations 1.98 .587 A
PA measures are clear 2.26 .599 A
PA measures what I really do 2.48 .646 A
Overall Score 2.24 .610 A
Item Factor Loading
Job with a clear purpose .79
Job with clear responsibility .53
Supporting working condition .78
Required equipment & materials .69

International Journal of Information Technology and Business Management 29
th Aug 2014. Vol.28 No.1
© 2012 – 2014 JITBM & ARF. All rights reserved
ISSN 2304-0777 www.jitbm.com
32
The factor loadings determined fell within the range of a high 0.79 to a low of 0.53 indicating that the four
items could be verified to measure a single construct (See Table 4.14).
Table 4. 15: REB employees’ views on performance feedback subscale
Source: Author. Data Analysis, 2012
The overall score was (mean) µ=2.43 (SD = .70) which falls in the “Agree” response category (See Table
4.15).
Rewarding Performance
For the performance Related Rewards subset, the following questions were asked and answered by
respondents: (1) I have been given intangible rewards; (2) I have been given compensation fairly (3) I have
received benefits reasonably; and (4) I have received required incentives. Respondents disagreed (item
scores between 2.50 and 3.25) with “I have been given compensation fairly” with mean (µ = 2.24) and
agreed (item scores between 1.75 and 2.50) with all three remaining items, that is to say: “I have been
given intangible rewards” with mean (µ = 2.24), “I have received benefits reasonably” with mean (µ =
2.35) and “I have received required incentives” with mean (µ = 2.48).
Kaiser-Meyer-Olkin and Bartlett’s test of adequacy for set of variables determined to be 0.75 and their
associated probability P=.000<0.001 (see table 4.16) satisfied the requirement.
Table 4. 16: KMO and Bartlett’s test for the subset (performance related rewards) adequacy
KMO and Bartlett's Test
Kaiser-Meyer-Olkin Measure of Sampling Adequacy. .725
Bartlett's Test of Sphericity Approx. Chi-Square 94.588
df 6
Sig. .000
Source: Author. Data Analysis, 2012
Here, the Cronbach’s alpha internal consistency coefficient (α) determined was found to be 0.67. It did not
met the minimum requirement of α=0.70. This gave the researcher an idea to perform first a test of
communality among variables before proceeding.
Item
Mean( µ) Std.
Dev.
Response
Category
Feedback is timely 2.39 .686 A
Feedback is given in the best manner 2.26 .599 A
I have the chance to comment on the feedback 2.16 .549 A
Never receive performance feedback (reverse corded) 2.90 .970 A
Overall Score 2.43 .701 A

International Journal of Information Technology and Business Management 29
th Aug 2014. Vol.28 No.1
© 2012 – 2014 JITBM & ARF. All rights reserved
ISSN 2304-0777 www.jitbm.com
33
Table4. 17: Variance between variables of the subset” performance related rewards”
Communalities
Initial Extraction
I have been given intangible rewards. 1.000 .645
I have been given compensation fairly 1.000 .534
I have received benefits reasonably 1.000 .666
I have received required incentives 1.000 .560
Extraction Method: Principal Component Analysis.
Source: Author. Data Analysis, 2012
The test was done using Principal component analysis with the extraction method; the communalities
ranged from a high of .66 to a low of .53 (See Table 4.17) which satisfied the requirement (minimum of
0.50).
Table 4. 18: Principal Component Analysis “reward subset”
As the test of communalities did not show the matter, the researcher decided to rotate component with
Kaiser Normalization rotation method. The results showed that the variables overload on two components
(see table 4.18).
Table 4. 19 : Factor Loading for Items Representing REB employees’ Views on Performance related
rewards
Item Factor loading
I have been given intangible rewards. .80
I have been given compensation fairly .72b
I have received my benefits reasonably .81
I have received required incentives .74 b
b Varimax with Kaiser Normalization rotation method, 2
nd component.
Source: Author. Data Analysis, 2012
Then, factor loading on two components was determined and showed in table 4.19.
Component
1 2
I have been given intangible rewards. .742 .309
I have been given compensation fairly .372 .629
I have received benefits reasonably .766 -.283
I have received required incentives .310 .681
Extraction Method: Principal Component Analysis.
a. 2 components extracted.
Source: Author. Data Analysis, 2012

International Journal of Information Technology and Business Management 29
th Aug 2014. Vol.28 No.1
© 2012 – 2014 JITBM & ARF. All rights reserved
ISSN 2304-0777 www.jitbm.com
34
Table 4. 20: REB technical employees’ views on PA related Rewards
Source: Author. Data Analysis, 2012
The researcher computed an overall score for the items in this scale which was calculated as the mean of
the ratings assigned to the individual items. The overall score was (mean) µ=2.40, (SD = .67) and falls in
the “Agree” response category (See table 4.20).
Coaching & Trainings
For the coaching and trainings subset, the following questions were asked and answered by respondents:
(1) I have been given time to improve unsatisfactory performance; (2) I have been given supporting
documents for job fulfillment (3) I have been given guidance to improve performance; and (4) I have been
given supporting training to improve performance. Respondents agreed (item scores between 1.75 and
2.50) with all four items with mean (µ = 2.44; 1.98; 2.40 and 2.29) respectively.
Kaiser-Meyer-Olkin and Bartlett’s test of adequacy for set of variables determined to be 0.56 and their
associated probability satisfied the requirement of P<0.001 (see table 4.21).
Table 4. 21: KMO and Bartlett’s test for the subset (coaching & trainings) adequacy
KMO and Bartlett's Test
Kaiser-Meyer-Olkin Measure of Sampling Adequacy. 0.563
Bartlett's Test of Sphericity Approx. Chi-Square 64.509
df 6
Sig. .000
Source: Author. Data Analysis, 2012
Here, the Cronbach’s alpha internal consistency coefficient α was determined to be 0.71.
Table 4. 22: Factor Loading for Items Representing REB employees’ Views on coaching &trainings
Item Factor loading
I have been given time to improve unsatisfactory performance .80b
I have been given supporting documents for job fulfillment .76 b
I have been given guidance to improve performance .86
I have been given supporting training to improve performance .84
Source: Author. Data Analysis, 2012
Item
Mean(µ)
Std.
Dev.
Response
Category
I have been given intangible rewards. 2.24 .592 A
I have been given compensation fairly 2.53 .695 D
I have received my benefits reasonably 2.34 .626 A
I have received required incentives 2.48 .784 A
Overall Score 2.40 .674 A

International Journal of Information Technology and Business Management 29
th Aug 2014. Vol.28 No.1
© 2012 – 2014 JITBM & ARF. All rights reserved
ISSN 2304-0777 www.jitbm.com
35
The researcher performed the factor analysis by rotating components and found that variables overlapped
on two components, and ranged from 0.66 to 0.82 (table 4.22 above). Further an overall score for this
subset was computed (see table 4.23).
Table 4. 23: REB employees’ views on PA coaching & trainings
Source: Author. Data Analysis, 2012
The overall score computed was (mean) µ=2.28 (SD = .66) and this falls in the “Agree” response category.
Performance Ratings
For the performance ratings subset, the following questions were asked and answered by respondents: (i)
Ratings were fair; (ii) Ratings were higher (iii) Ratings were attributed sentimentally; and (iv) Rating
system should be changed. Respondents agreed (item scores between 2.51 and 3.25) with the 2nd
, 3rd
and 4th
items with mean µ = 2.68; 2.85; and 2.85 reversed coded respectively. They only disagreed (item scores
between 1.75 and 2.50) with “ratings were fair” (µ = 2.48) reverse coded.
Kaiser-Meyer-Olkin and Bartlett’s test of adequacy for set of variables was determined to be .73; and their
associated probability satisfies the requirements P=.000<0.001 (table 4.24 below).
Table 4. 24: KMO and Bartlett’s test for the subset (PA ratings) adequacy
KMO and Bartlett's Test
Kaiser-Meyer-Olkin Measure of Sampling Adequacy. .725
Bartlett's Test of Sphericity Approx. Chi-Square 94.588
df 6
Sig. .000
Source: Author. Data Analysis, 2012
The Cronbach’s alpha internal consistency coefficient α determined to be 0.82. This satisfied the
requirement of α =0.70 and gave the researcher a go ahead to determine the factor analysis for this subset.
Table 4. 25: Factor Loading for Items Representing REB employees’ Views on performance ratings
Item Factor loading
Ratings were fair .88
Ratings were higher .86
Ratings were sentimental .89
Rating system should be changed .83
Source: Author. Data Analysis, 2012
Item
Mean( µ)
Std.
Dev.
Response
Category
I have been given time to improve unsatisfactory performance 2.44 .692 A
I have been given supporting documents for job fulfillment 1.98 .587 A
I have been given guidance to improve performance 2.40 .735 A
I have been given supporting training to improve performance 2.29 .637 A
Overall Score 2.28 .662 A

International Journal of Information Technology and Business Management 29
th Aug 2014. Vol.28 No.1
© 2012 – 2014 JITBM & ARF. All rights reserved
ISSN 2304-0777 www.jitbm.com
36
The factor loadings determined ranged from a high of .89 to a low of .83 indicating that the four items
could be verified to measure a single construct (See Table 4.25 above).
Table 4. 26: REB employees’ views on performance ratings
Source: Author. Data Analysis, 2012
The overall score was computed to be µ=2.72 (SD = .72) and falls in the “Agree” response category with a
reverse cording (See table 4.26).
Transfer Decision
For the performance related transfer decision subset, the following questions were asked and answered by
respondents: (1) I have been transferred to another job; (2) I have been assigned to a less suitable work (3)
Had a less level of job security; and (4) Obtain a less level of support. Respondents agreed (item scores
between 1.75 and 2.50) with all items (µ = 1.95; 2.13; and 1.95) respectively except the item “Had a less
level of job security” disagreed (scores between 2.51 and 3.25) with (µ = 2.85).
Kaiser-Meyer-Olkin and Bartlett’s test of adequacy for set of variables was determined to be .63 and their
associated probability satisfied the requirement of P<0.001 (see table 4.28).
Table 4. 27: KMO and Bartlett’s test for the subset (PA ratings) adequacy
KMO and Bartlett's Test
Kaiser-Meyer-Olkin Measure of Sampling Adequacy. .635
Bartlett's Test of Sphericity Approx. Chi-Square 64.588
df 6
Sig. .000
Source: Author. Data Analysis, 2012
The Cronbach’s alpha internal consistency coefficient α was found to be .69 and this gave the researcher a
questionable reliability between subscale variables. The researcher decided to test communality between
variables and found to be ranging from a high of .93 to a low of .25 (See Table 4.28 below).
Table 4. 28: Variance between variables for the subset “performance ratings”
Initial Extraction
I have been assigned to a less suitable work 1.000 .806
I have been transferred to another job 1.000 .929
Had a less level of job security 1.000 .251
Obtained a less level of support 1.000 .929
Item
Mean( µ)
Std.
Dev.
Response
Category
Ratings were fair(reverse coded) 2.48 .646 D
Ratings were higher(reverse coded) 2.68 .621 A
Ratings were sentimental(reverse coded) 2.85 .846 A
Rating system should be changed( reverse coded) 2.85 .765 A
Overall Score 2.72 .719 A

International Journal of Information Technology and Business Management 29
th Aug 2014. Vol.28 No.1
© 2012 – 2014 JITBM & ARF. All rights reserved
ISSN 2304-0777 www.jitbm.com
37
Initial Extraction
I have been assigned to a less suitable work 1.000 .806
I have been transferred to another job 1.000 .929
Had a less level of job security 1.000 .251
Obtained a less level of support 1.000 .929
Extraction Method: Principal Component Analysis.
Source: Author. Data Analysis, 2012
Only the item “Had a less level of job security” did not fulfill the requirement (see table 4.28 above) the
researcher removed it from the list and further calculated factor loadings and this ranged from a high of
0.96 to a low of 0.90 (see table 4.29 below).
Table 4. 29: Factor Loading for Items Representing REB employees’ Views on transfer
Item Factor loading
I have been assigned to a less suitable work .90
I have been transferred to another job .96
Obtained less level of support .96
Source: Author. Data Analysis, 2012
The overall score for the three items was computed and found to be 2.01 (SD = .542) and this falls in the
“Agree” response category with a reverse cording (See table 4.30 below).
Table 4. 30: REB employees’ views on PA Transfer decision
Source: Author. Data Analysis, 2012
Demotion decision
For the performance related demotion decision subset, the following questions were asked and answered by
respondents: (1) I have been placed in lower level position; (2) I have been assigned to a less challenging
job (3) Had fewer opportunity to utilize my skills; and (4) I have gotten less pay. Respondents disagreed
(item scores between 2.51 and 3.25) with all items with mean (µ = 2.25; 2.79; 2.95 and 2.84) respectively.
Table 4. 31: KMO and Bartlett’s test for the subset (job analysis) adequacy
Source: Author. Data Analysis, 2012
Item
Mean(µ)
Std.
Dev.
Response
Category
I have been transferred to another job 1.95 .493 A
I have been assigned to a less suitable work 2.13 .640 A
Obtained a less level of support 1.95 .493 A
Overall Score 2.01 .542 A
KMO and Bartlett's Test
Kaiser-Meyer-Olkin Measure of Sampling Adequacy. .755
Bartlett's Test of Sphericity Approx. Chi-Square 285.543
df 6
Sig. .000
International Journal of Information Technology and Business Management 29
th Aug 2014. Vol.28 No.1
© 2012 – 2014 JITBM & ARF. All rights reserved
ISSN 2304-0777 www.jitbm.com
38
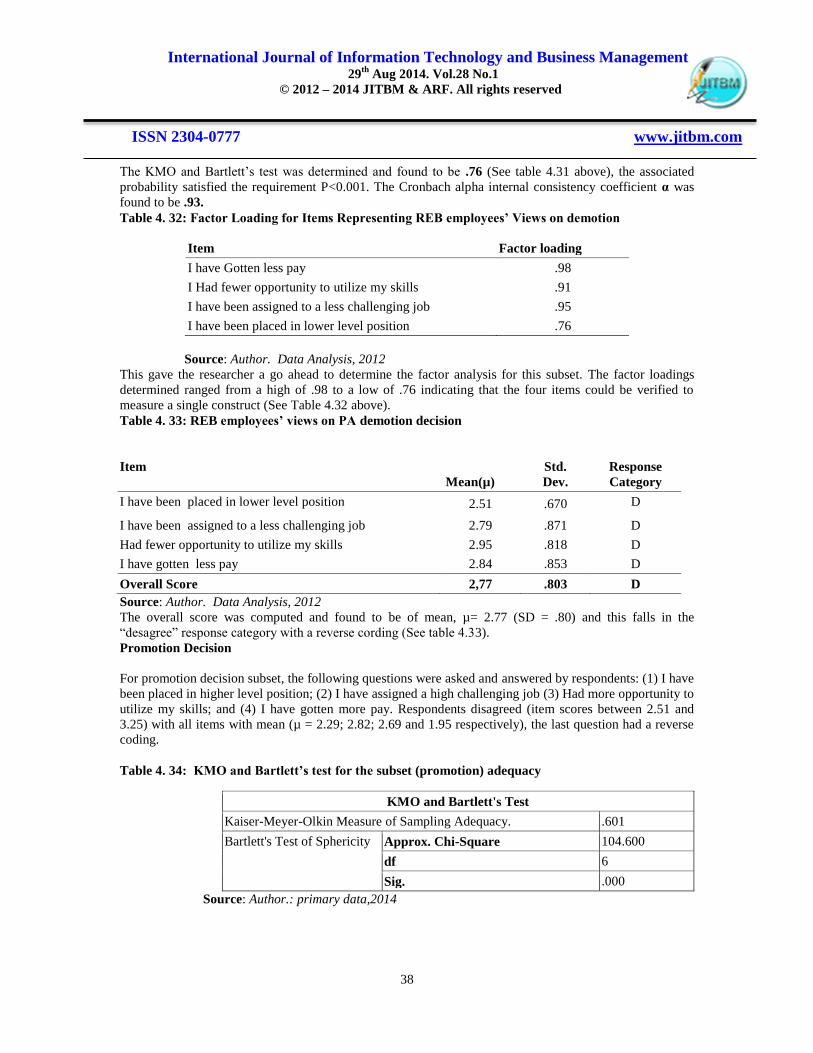
The KMO and Bartlett’s test was determined and found to be .76 (See table 4.31 above), the associated
probability satisfied the requirement P<0.001. The Cronbach alpha internal consistency coefficient α was
found to be .93.
Table 4. 32: Factor Loading for Items Representing REB employees’ Views on demotion
Item Factor loading
I have Gotten less pay .98
I Had fewer opportunity to utilize my skills .91
I have been assigned to a less challenging job .95
I have been placed in lower level position .76
Source: Author. Data Analysis, 2012
This gave the researcher a go ahead to determine the factor analysis for this subset. The factor loadings
determined ranged from a high of .98 to a low of .76 indicating that the four items could be verified to
measure a single construct (See Table 4.32 above).
Table 4. 33: REB employees’ views on PA demotion decision
Source: Author. Data Analysis, 2012
The overall score was computed and found to be of mean, µ= 2.77 (SD = .80) and this falls in the
“desagree” response category with a reverse cording (See table 4.33).
Promotion Decision
For promotion decision subset, the following questions were asked and answered by respondents: (1) I have
been placed in higher level position; (2) I have assigned a high challenging job (3) Had more opportunity to
utilize my skills; and (4) I have gotten more pay. Respondents disagreed (item scores between 2.51 and
3.25) with all items with mean (µ = 2.29; 2.82; 2.69 and 1.95 respectively), the last question had a reverse
coding.
Table 4. 34: KMO and Bartlett’s test for the subset (promotion) adequacy
KMO and Bartlett's Test
Kaiser-Meyer-Olkin Measure of Sampling Adequacy. .601
Bartlett's Test of Sphericity Approx. Chi-Square 104.600
df 6
Sig. .000
Source: Author.: primary data,2014
Item
Mean(µ)
Std.
Dev.
Response
Category
I have been placed in lower level position 2.51 .670 D
I have been assigned to a less challenging job 2.79 .871 D
Had fewer opportunity to utilize my skills 2.95 .818 D
I have gotten less pay 2.84 .853 D
Overall Score 2,77 .803 D

International Journal of Information Technology and Business Management 29
th Aug 2014. Vol.28 No.1
© 2012 – 2014 JITBM & ARF. All rights reserved
ISSN 2304-0777 www.jitbm.com
39
The KMO and Bartlett’s test determined was found to be .60 (See table 4.34 above). The probability
P=.000<0.001 associated with the Bartlett test satisfied the requirement P=<0.001. The Cronbach’s alpha
internal consistency coefficient α determined to be 0.71.
Table 4. 35: Factor Loading for Items Representing REB employees’ Views on promotion
Item Factor loading
I have been placed in higher level position .92
I have been assigned a high challenging job .93
I had more opportunity to utilize my skills .52
I have gotten more pay .54
Source: Author. Primary Data, 2014
This gave the research a go ahead to determine the factor analysis for this subset. The factor loadings
determined ranged from a high of .93 to a low of .52 indicating that the four items could be verified to
measure a single construct (See Table 4.35 above).
Table 4. 36: Summary of REB employees’ views on PA promotion decision
Source: Author. Primary,2014
The overall score was determined and found to be mean =2.61 (SD = .80) (See table 4.36 above), and this
falls in the “disagree” response category (with reverse corded meaning).
However, in order to determine how REB technical appraised employees agree with the PA planning,
feedback and decisions, the researcher summarized the above findings of all subscales in the following
table 4.37.
Table 4. 37: Reaction of Technical Employees from PA done
Item
Mean(µ)
Std.
Dev.
Response
Category
I have been placed in higher level position 2.98 .779 D
I have been assigned a high challenging job 2.82 .840 D
I had more opportunity to utilize my skills 2.68 .621 D
I have gotten more pay (reverse coded) 1.95 .493 D
Overall Score 2.61 .683 D
Subscale
Mean(µ)
Std.
Dev.
Response
Category
Job Analysis 2.10 .510 A
Performance measures 2.24 .610 A
Performance feedback 2.43 .701 A
Performance ratings(Reverse Coded) 2.72 .719 A
Rewards 2.40 .674 A
Transfer 2.01 .542 A
Coaching and training 2.28 .662 A
Promotion 2.61 .683 D
Demotion 2,77 ,803 D

International Journal of Information Technology and Business Management 29
th Aug 2014. Vol.28 No.1
© 2012 – 2014 JITBM & ARF. All rights reserved
ISSN 2304-0777 www.jitbm.com
40
Survey scale: 1= strongly agree; 2 = agree; 3 = disagree; and, 4 = strongly disagree.
Response category: 1.00 – 1.75 =Strongly Agree (SA); 1.76 – 2.50= Agree (A); 2.51 – 3.25 = Disagree
(D); and3.26 – 4.00= Strongly Disagree (SD).
Source: Author. Primary, 2014
The findings clearly showed that respondents
agreed with the process involved in analyzing
jobs i.e. Job description and job specification,
setting PA measures, providing feedback, and
rating, rewarding, transferring, training,
promoting and demoting employees. Both
promotion and demotion were negatively
structured in the survey. This makes their
disagree responses (D) in agree (A) category.
Additionally, the acceptance of PA feedback,
rewards, PA measures, and trainings scales is
closer to the lower limit of disagree scale.
Therefore, their process is not entirely
satisfactory.
Accuracy of REB’s PA Decisions
This objective aimed at examining the accuracy
of REB’s PA decisions. The contribution of
independent variables; of job analysis, job
measures, and performance feedback and
performance ratings was determined using the
coefficient of determination, denoted by R2, with
regression analysis. The interpretation of the
magnitude of findings was done basing on Davis
(1971) descriptors as cited in (Walsh, 2003) and
given in table 3.2. The following section presents
the contribution of these variables to dependent
variables, of rewarding performance, transfer,
promotion and demotion, and coaching and
training.
First, the variation in dependent variable
“reward” (table 4.38 below) was explained by its
linear relationship with the independent variables
of job analysis, PA measures, PA feedback and
PA ratings respectively at 13% ( r2 = 0.134) ,
47% ( r2 = 0.466); 11% ( r
2 = 0.110); and 48% (
r2 = 0.478). This means that reward has a low
association (10-29%) with both job analysis and
performance feedback, and a moderate
association (30-49) with performance measures
and ratings.
However, the employees are rewarded based on
the scores/ratings obtained and performance
measures set at the beginning of the year.
Rewards do not reflect what was expected from
the jobholder, i.e. the employees’ attributions
and responsibilities.
Table 4. 38: Correlation Coefficients for dependent variable “Reward”
Model (r)a (r
2) (ar
2) (e) F Sig.
1 .366 .134 .073 .669 2.200 .080
2 .683 .466 .429 .593 12.443 .000
3 .332 .110 .064 .758 2.389 .078
4 .691 .478 .441 .586 13.025 .000
(r)a=regression coefficient, (r
2)= R Square, (ar
2)= Adjusted R Square, and (e)= Std. Error of the Estimate
1: ((Constant) a : Job Analysis
2. (Constant) a : PA measures
3. (Constant) a : PA feedback
4. ((Constant) a : PA ratings
Dependent Variable: Rewards
Source: Primary ,2014

International Journal of Information Technology and Business Management 29
th Aug 2014. Vol.28 No.1
© 2012 – 2014 JITBM & ARF. All rights reserved
ISSN 2304-0777 www.jitbm.com
41
Therefore, performance measures do not match with both jobholder attributions and performance feedback
given to employees; hence, REB’s employees perform what they are not supposed to do (which are out of
their attributions) and reward is given according to what has been achieved.
Second, the variation in dependent variable “transfer” ( table 4.39 below) was explained by its linear
relationship with the independent variables of job analysis, PA measures, PA feedback and PA ratings
respectively at 18 % (r2 =0.181); 25% ( r
2 =0.247) ; 64% (r
2 =0.639). This means that transfer has a low
association (10-29%) with job analysis, performance measures and ratings, and a substantial association
(50-69%) with performance feedback.
Table 4. 39: Correlation Coefficients for dependent variable “Transfer”
Source: Primary data 2014
However, employees are transferred or rotated
based on their performance feedback without
considering their job attributions or
performance measures set for their appraisals.
Therefore, employees perform what they are not
supposed to do and are transferred/rotated based
on what has been achieved rather than on what
was supposed to be done.
Third, the variation in dependent variable
“promotion” (table 4.40) was explained by its
linear relationship with the independent variables
of job analysis, PA measures, PA feedback and
PA ratings respectively at 23 % (r2 =0.231); 23%
( r2 =0.233) ; 50% (r
2 =0.502), and 84% (r
2
=0.844). This means that promotion has a low
association (10-29%) with job analysis and
performance measures, a substantial association
(50-69%) with performance feedback, and a very
strong association (70-100%) with performance
ratings.
Table 4. 40: Correlation Coefficients for dependent variable “Promotion”
Model (r)a (r
2) (ar
2) (e) F Sig.
1 .425 .181 .123 .462 3.148 .021
2 .497 .247 .194 .443 4.677 .002
3 .799 .639 .613 .307 25.171 .000
4 .394 .156 .096 .469 2.624 .044
(r)a=regression coefficient, (r
2)= R Square, (ar
2)= Adjusted R Square, and (e)= Std. Error of the
Estimate
1: (Constant) a : Job Analysis
2. (Constant) a : PA feedback
3. (Constant) a : PA measures
4. (Constant) a : PA ratings
Model (r)a (r
2) (ar
2) (e) F Sig.
1 .481 .231 .177 .706 4.283 .004
2 .483 .233 .193 .699 5.872 .001
3 .709 .502 .468 .568 14.390 .000
4 .919 .844 .836 .315 104.430 .000
(r)a=regression coefficient, (r
2)= R Square, (ar
2)= Adjusted R Square, and (e)= Std. Error of the Estimate
Source: Primary, 2014

International Journal of Information Technology and Business Management 29
th Aug 2014. Vol.28 No.1
© 2012 – 2014 JITBM & ARF. All rights reserved
ISSN 2304-0777 www.jitbm.com
42
However, employees are promoted based on
rates and performance feedback given to them
regardless to their job measures and attributions.
Therefore, employees perform what they are not
supposed to do and promotion is based on what
has been achieved rather than on what was
supposed to be achieved.
Fourth, the variation in dependent variable
“demotion” (table 4.41) was explained by its
linear relationship with the independent variables
of job analysis, PA measures, PA feedback and
PA ratings respectively at 8 % (r2 =0.089); 86% (
r2 =0.860) ; 14% (r
2 =0.135), and 86% (r
2
=0.858). This means that demotion has a low
association (10-29%) with job analysis and
performance feedback, and a very strong
association (70-100%) with performance
measures and ratings.
However, the employees are demoted based on
the scores/ratings obtained and performance
measures set at the beginning of the year.
Demotion does not reflect what was expected
from the jobholder, i.e. the employees’
attributions.
Table 4. 41: Correlation Coefficients for dependent variable “Demotion”
Therefore, performance measures do not match
with both jobholder’s attributions and
performance feedback given to employees.
Hence, REB’s technical employees perform what
they are not supposed to do (which is out of their
attributions), and demotion is decided in
accordance with what has been achieved.
Lastly, the variation in the dependent variable
“training” (table 4.42 below) was explained by
its linear relationship with the independent
variables of job analysis, PA feedback, PA
measures and PA ratings respectively at 21 % (r2
=0.209); 26% ( r2 =0.263) ; 10% (r
2 =0.102),
and 18% (r2 =0.181). This means that training
has a low association (10-29%) with all
independent variables of job analysis, PA
feedback, PA measures, and PA ratings.
Table 4. 42: Correlation Coefficients for dependent variable “Training”
Model (r)a (r
2) (ar
2) (e) F Sig.
1 .298 .089 .025 .661 1.392 .248
2 .367 .135 .074 .644 2.224 .078
3 .927 .860 .850 .260 87.277 .000
4 .927 .858 .849 .261 86.413 .000
(r)a=regression coefficient, (r
2)= R Square, (ar
2)= Adjusted R Square, and (e)=
Std. Error of the Estimate
1: (Constant)a : Job Analysis
2. (Constant)a : PA feedback
3. (Constant)a : PA measures
4. (Constant)a : PA ratings
Model (r)a (r
2) (ar
2) (e) F Sig.
1 .457 .209 .154 .540 3.766 .009
2 .513 .263 .212 .521 5.091 .001
3 .319 .102 .038 .625 1.611 .184
4 .426 .181 .124 .549 3.152 .021
International Journal of Information Technology and Business Management 29
th Aug 2014. Vol.28 No.1
© 2012 – 2014 JITBM & ARF. All rights reserved
ISSN 2304-0777 www.jitbm.com
43
Therefore, training does not match with employees ‘attributions, measures and feedback for their
performance and rate scores obtained. Hence, training is baseless or sentimental.
CONCLUSIONS AND
RECOMMENDATIONS
Conclusions and Recommendations
1. Based on the findings of the study, the
researcher concludes that: The majority
of REB technical appraised employees
are male, in group age of (31-40), holds
bachelor degrees, has working
experiences ranging between 6-10
years, and they are married.
2. The REB’s technical employees found
to be moderately satisfied with
promotion, demotion, transfer, job
analysis and performance measures; and
little bit satisfied with feedback, rates,
trainings, and rewards provided to them.
3. The REB’s training decisions taken for
technical staffs are baseless or
sentimental. Employees are trained
regardless of their job attributions,
feedback and ratings provided for their
performance.
4. The majority of REB employees
perform what they are not supposed to
do (which is out of their attributions),
and decisions of reward, promotion,
demotion, transfer are based on what
employees have achieved; and the latter
is totally different from what they are
employed for.
5. Informed by the above findings and
conclusions, the following
recommendations are set out for the
satisfactory performance appraisal
system that closes the gap between what
employees expect from the system, and
what they get.
First, REB management has to define
jobs’ attributions and communicate
them to concerned employees.
Second, REB management has to
ensure that every staff understands his
or her responsibilities. This means the
employees’ job attributions.
Third, REB management has to ensure
that performance measures are set in
agreement of both supervisors and
employees, and that they match with the
employees’ attributions;
Fourth, REB management has to be
certain that relevant feedbacks are
provided to employees to overcome
their weaknesses and improve their
strengths so as to enable them to
achieve the desired performance
Fifth, REB management has to be sure
that the employees’ ratings are based on
their achievements, measured on
performance measures, and that they are
in harmony with employees’
attributions.
Sixth, REB management has to be sure
that PA decisions of reward, promotion,
demotion, transfer and training are
based on the employees’ ability and
taken with regards to the feedbacks
provided to them during the appraisal
period and that they are not conflicting
with performance measures and
attributions.
Lastly, the researcher recommends that
further research investigate for example
the harmonized performance appraisal
system relevant for REB employees’
satisfaction.
REFERENCES 1. Ahmed, S. (1999). The Emerging
Effectiveness for Human Resource
Management: An Exploratory Study
with Performance Appraisal. The
Journal of Management Development.
18, 6, 543-556.
(r)a=regression coefficient, (r
2)= R Square, (ar
2)= Adjusted R Square, and (e)= Std. Error of the Estimate

International Journal of Information Technology and Business Management 29
th Aug 2014. Vol.28 No.1
© 2012 – 2014 JITBM & ARF. All rights reserved
ISSN 2304-0777 www.jitbm.com
43
2. Armstrong, M. (2006). A Handbook of
Human resource Management Practice,
Tenth Edition, Kogan Page Publishing,
London, , p. 264
3. Blanchar, C., & Onton, J. (2005).
Performance measures in times of
change. Employment Relations Today,
32(1): 25-34.
4. Boswell, W.R. & Boudreau, J.W.
(2002) Separating the development and
evaluative performance appraisal uses.
Journal of Business and Psychology.
Vol 16, pp391-412.
5. Buford, J.A., Jr., & Lindner, J.R.
(2002). Human resource management
in local government: Concepts and
applications for students and
practitioners. Cincinnati, OH:
Southwestern.
6. Cocanougher, B. A., & Ivancevich, J.
M. (1978), "Bars performance rating for
sales force personnel", Journal of
Marketing, 42, 87-95.
7. Coens, T. and Jenkins, M. (2000).
Abolishing Performance Appraisals.
San Francisco, CA, Berrett-Koehler
Publishers, Inc.Coens & Jenkins, 2002.
8. Coutts and Schneider, 2004, p.67.
Coutts, L.M. and Schneider, F.W.
(2004). Police officer performance
appraisal.
9. Fago, J. (2006). Frequently asked
human resources questions. Illinois
Banker, 91(4): 8-9.
10. George, D., & Mallery, P. (2003). SPSS
for Windows step by step: A simple
guide and reference. 11.0 update (4th
ed.). Boston: Allyn & Bacon.
11. Hall. Ivancevich, J. M. (2001). Human
Resource Management (8th ed.). New
York: McGraw Hill
12. Jawahar, I. M. (2006). Correlates of
satisfaction with performance appraisal
feedback. Journal of Labor Research,
27(2): 213-236.
13. Jaworski, B. J., & Kohli, A. K. (1991).
Supervisory feedback: Alternative types
and their impact on salespeople’s
performance and satisfaction. Journal of
Marketing Research, 28, 190-201.
14. Kazmier and Leonard k. (1992).
Principle of management. New Delhi.
Tata Mac Graw-Hill Book Co
15. Longenecker, C.O. and Goff, S.J.
(1992). Performance Appraisal
Effectiveness: A Matter of Perspective.
Advanced Management Journal. 57, 2,
18-23.
16. Macky, K. & Jonhson, G. (2000). The
Strategic Management of Human
Resource in New Zealand. Auckland,
New Zealand. Irwin/McGraw-Hall.
17. Mamoria, C.B. & Gankar, S.V. (2002).
Personnel Management. 22nd
Edition.
Mumbai: Himalaya Publishing House.
18. Man, B. G., (2002). Performance
Appraisal Stems productivity and
motivation. A case study. Public
Personnel Management.
19. Mary Nuernberger, et al, (2010). Guide
for Writing job descriptions, UC Santa
Cruz.
20. McGregor D. (1960). The Human Side
of Enterprise. New York. McGraw-Hill
21. Mitchell, K D. (2000) "Knowledge
management: the next big thing." Public
Manager, 29 (2), 57-60.
22. Murphy, K.R & Cleveland, J.N. (1995)
Understanding Performance Appraisal;
Social, organizational and goal based
perspectives. California, Sage
Publications.
23. Probst, T. M.& Brubaker, T. L. (2001).
The effects of job insecurity on
employee safety outcomes: Cross-
sectional and longitudinal explorations.
Journal of Occupational Health
Psychology, 6 (2), 139-159.
24. Roberson, Q. M., & Stewart, M. M.
(2006). Understanding the motivational
effects of procedural and informational
justice in feedback processes. British
Journal of Psychology, 97, 281-298.
25. Sirota, D., & Mischkind, L. A. (2006).
Stop demotivating your employees!
Harvard Management Update, 11(1): 3-
6.
26. Spicer, D.P. and Ahmad, R., (2006)
'Cognitive Processing Models in
Performance Appraisal: Cognitive
Mapping Evidence from the Malaysian
International Journal of Information Technology and Business Management 29
th Aug 2014. Vol.28 No.1
© 2012 – 2014 JITBM & ARF. All rights reserved
ISSN 2304-0777 www.jitbm.com
44
Public Sector', Human Resource
Management Journal, 16 (2) pp 214-230
27. Statt, D. (2004). The Routledge
Dictionary of Business Management,
Third edition, Routledge Publishing,
Detroit, p. 78
28. Vance, C.M., McClaine, S.R., Boje,
D.M. and Stage, H.D. (1992). An
examination of the transferability of
traditional performance appraisal
principles across cultural boundaries.
Management International Review, Vol.
32 No. 4, pp. 313-326.
29. Wilson & Westerns, (2001).
Performance Apprasal. An Obstacle to
training and development. Career
development International.
30. Zkmund, William G., 2003. Business
research methods. 7th
edition. USA.
Thomson-South Western