employees influencing change - federal news...
TRANSCRIPT

2013Federal Employee Viewpoint Survey ResultsEmployees Influencing Change
Governmentwide Management Report
United States Office of Personnel Management
A Message from the Director
Since 2002, OPM has called on Federal employees to provide their candid opinions on all aspects of their Federal employment – their supervisors, their work experience, their agency and their senior leaders. This year, 376,577 employees provided their input to the Federal Employee Viewpoint Survey (FEVS) to influence change at their agencies.
The 2013 Federal Employee Viewpoint Survey results present two very clear conclusions.
First, the Federal workforce remains resilient in the face of historic challenges. Over 90 percent continue to be willing to put in extra effort, are constantly looking for ways to do their job better, and feel their work is important. Their levels of engagement are generally holding steady despite declining satisfaction.
Second, despite the tremendous strengths and dedication shown by Federal employees, the 2013 responses demonstrate a significant drop in employee satisfaction and continue last year’s declines across the majority of questions, which are cause for concern. In addition to continued decreases in satisfaction with pay, one of the biggest drops this year was whether employees had sufficient resources needed to get their jobs done. This drop contributed to fewer employees recommending their organizations as good places to work. Any employer seeing this meaningful level of decline would be very concerned.
Factors such as an unprecedented 3-year pay freeze, automatic reductions from sequester that included furloughs for hundreds of thousands of employees, and reductions in training and other areas are clearly taking their toll on the Federal workforce – and this survey was administered prior to the recent Government shutdown. The survey results serve as an important warning about the long-term consequences of the sequestration and budget uncertainty. Without a more predictable and responsible budget situation, we risk losing our most talented employees, as well as hurting our ability to recruit top talent for the future.
Finally, in addition to providing information on broad trends, the FEVS is also an important management tool that allows leaders and managers to receive feedback from their employees and to take actions to increase satisfaction and engagement with the ultimate goal of improving services to the American public. This year, agencies will receive even more granular survey results at manager levels that will allow them to identify challenges and to take specific actions.
Together, Federal employees at all levels face challenges, uncertainties, and changes. Nonetheless, we strongly believe that our agencies are good places to work and that our employees will continue to be dedicated to doing their work, serving the public in the best and most effective way.
I thank all the employees who took the time to make their voices heard and their opinions known. In doing so, they have expressed an ongoing belief in the future of a dedicated and effective Federal workforce.
Katherine ArchuletaDirector

Table of Contents
Introduction ...............................................................................................................................................................1
Results at a Glance.....................................................................................................................................................2
Who Responded? .......................................................................................................................................................3
Indices .......................................................................................................................................................................5
Human Capital Assessment and Accountability Framework Index (HCAAF) ........................................................5
Employee Engagement Index ...............................................................................................................................7
Global Satisfaction Index .....................................................................................................................................9
Leveraging Results-Oriented Performance Culture ..................................................................................................11
Generations in the Workforce .................................................................................................................................13
Supporting Diversity ................................................................................................................................................17
Veterans ............................................................................................................................................................18
LGBT .................................................................................................................................................................20
People with Disabilities .....................................................................................................................................22
Employees Influencing Change ...............................................................................................................................24
Conclusion ..............................................................................................................................................................26
Appendices
Appendix A: 2013 Federal Employee Viewpoint Survey Methods ......................................................................... 27
Appendix B: Trend Analysis .................................................................................................................................. 29
Appendix C: Governmentwide Respondent Characteristics ................................................................................. 33
Appendix D: Agency Response Rates ................................................................................................................... 36
Appendix E: HCAAF Index Trends ........................................................................................................................ 40
Appendix F: Employee Engagement Index Trends ................................................................................................ 48
Appendix G: Global Satisfaction Index Trends ..................................................................................................... 56
Tables
Response Rate for Key Demographics ....................................................................................................................4
Results-Oriented Performance Culture Index Items ............................................................................................. 11
Generation Profiles .............................................................................................................................................. 13
Generation Comparisons ..................................................................................................................................... 14
Top 2013 Items with Greatest Gap by Generation – Percent Positive .................................................................. 16
Comparison of Survey Results for Veterans & Non-Veterans – Percent Positive ................................................... 19
Comparison of Survey Results for LGBT & Heterosexual/Straight – Percent Positive ............................................ 21
Comparison of Survey Results for People With & Without Disabilities – Percent Positive ..................................... 23
National Aeronautics and Space Administration (NASA) ..................................................................................... 24
Department of Agriculture (USDA) ...................................................................................................................... 25
Figures
Governmentwide Response Rate by Year ...............................................................................................................3
Top 2013 Department/Large Agency Response Rates .............................................................................................3
Top 2013 Small/Independent Agency Response Rates ............................................................................................3
HCAAF Indices – Percent Positive ...........................................................................................................................5
Top 2013 Department/Large Agency HCAAF Scores................................................................................................6
Top 2013 Small/Independent Agency HCAAF Scores...............................................................................................6
Employee Engagement Index – Percent Positive .....................................................................................................7
Top 2013 Department/Large Agency Employee Engagement Scores – Percent Positive ..........................................8
Top 2013 Small/Independent Agency Employee Engagement Scores – Percent Positive .........................................8
Global Satisfaction Index – Percent Positive ...........................................................................................................9
Top 2013 Department/Large Agency Global Satisfaction Scores – Percent Positive ............................................. 10
Top 2013 Small/Independent Agency Global Satisfaction Scores – Percent Positive ............................................ 10
Satisfaction Group by Generation ....................................................................................................................... 15
Demographic Profile for Veterans in the 2013 FEVS ............................................................................................ 18
Non-Defense Agencies With the Highest Percentage of Veteran Employees ........................................................ 19
Demographic Profile for LGBT ............................................................................................................................. 20
Demographic Profile for People with Disabilities ................................................................................................. 22
1Introduction
Introduction
The Federal Employee Viewpoint Survey (FEVS) is a tool that allows employees to share their perceptions in many critical areas including their work experiences, their agency, and leadership. The results of the survey provide agency leaders insight into areas where improvement has been made, as well as areas where improvements are needed. Agencies are encouraged to share innovative ideas and practices with one another in order to meet the challenges faced by the Federal Government.
Many respondents voiced concerns that the 2013 FEVS was administered during a less than ideal time. The pay freeze was extended, employee reductions and furloughs were being implemented in many agencies, medical insurance premiums, payroll tax, and employee pension contributions all increased while it appears that the public opinion of the Federal Government is on the decline.
The 2013 FEVS documents the Federal workforce’s resilience and strong commitment to government – employees are willing to put in extra effort to get the job done, find ways to do their job better, and emphasize the importance and quality of their work. However, while still strong, governmentwide results have markedly decreased from 2012. The challenges faced in past years continue to be challenges: insufficient resources, recognition of performance differences, dealing with poor performers, the opportunity to get a better job in the organization, and pay satisfaction.
In a time when agencies have to do more with less, innovation and creativity are critical. Knowledge is a fundamental resource that agencies can share. Sharing successes, as well as lessons learned, with other similar agencies can help develop new programs and policies designed to target issues and increase employee satisfaction.
Change cannot happen overnight, which is why it is extremely important to continue capturing employees’ views. Even less than optimal results tell a story, helping us to understand the past and formulate a plan and direction for the future.
This report will focus on multiple perspectives describing the diverse views of the Federal workforce. The top performing and most improved agencies will be identified throughout various sections of this report.
This and other reports are available on OPM’s Federal Employee Viewpoint Survey website at: www.FedView.opm.gov. Detailed information on the 2013 FEVS Methods and item-by-item trend results can be found in Appendix A and B.
The FEVS was first administered in 2002 as the Federal Human Capital Survey.
Did You Know?
Results at a Glance
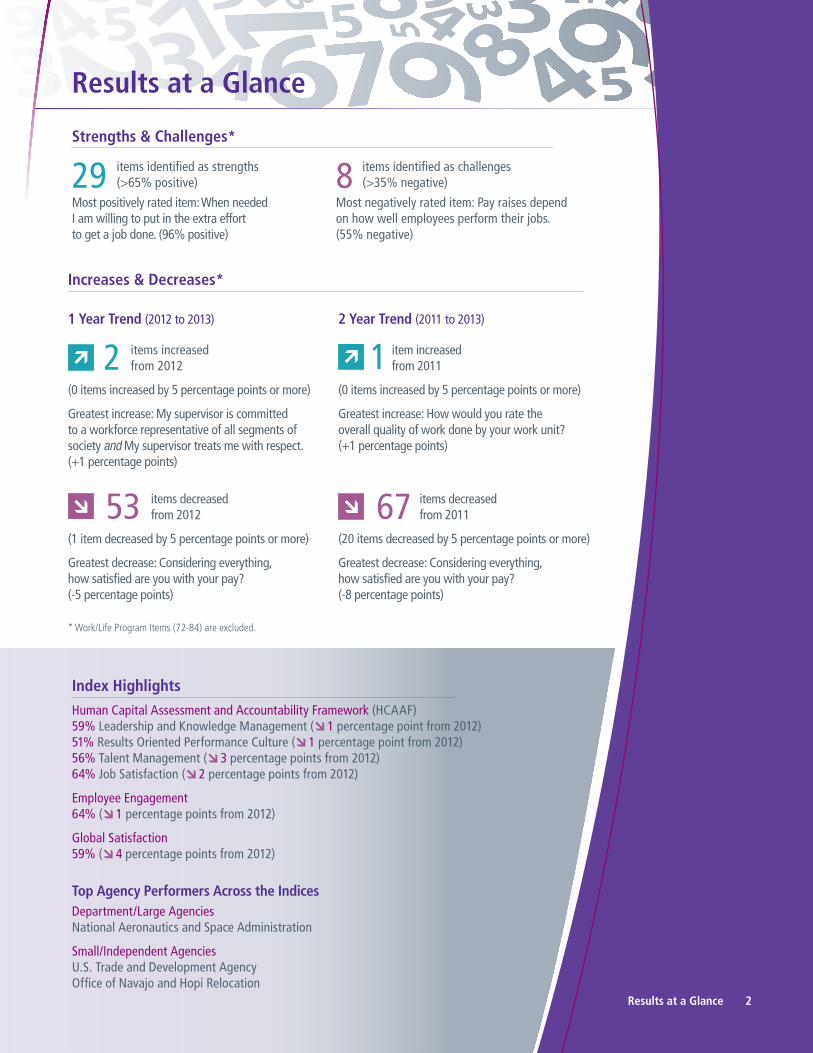
Strengths & Challenges*
29 items identified as strengths (>65% positive)
Most positively rated item: When needed I am willing to put in the extra effort to get a job done. (96% positive)
8 items identified as challenges (>35% negative)
Most negatively rated item: Pay raises depend on how well employees perform their jobs. (55% negative)
Increases & Decreases*
1 Year Trend (2012 to 2013)
2 items increased from 2012
(0 items increased by 5 percentage points or more)
Greatest increase: My supervisor is committed to a workforce representative of all segments of society and My supervisor treats me with respect. (+1 percentage points)
53 items decreased from 2012
(1 item decreased by 5 percentage points or more)
Greatest decrease: Considering everything, how satisfied are you with your pay? (-5 percentage points)
2 Year Trend (2011 to 2013)
1 item increased from 2011
(0 items increased by 5 percentage points or more)
Greatest increase: How would you rate the overall quality of work done by your work unit? (+1 percentage points)
67 items decreased from 2011
(20 items decreased by 5 percentage points or more)
Greatest decrease: Considering everything, how satisfied are you with your pay? (-8 percentage points)
* Work/Life Program Items (72-84) are excluded.
Index HighlightsHuman Capital Assessment and Accountability Framework (HCAAF)59% Leadership and Knowledge Management ( 1 percentage point from 2012) 51% Results Oriented Performance Culture ( 1 percentage point from 2012) 56% Talent Management ( 3 percentage points from 2012) 64% Job Satisfaction ( 2 percentage points from 2012)
Employee Engagement 64% ( 1 percentage points from 2012)
Global Satisfaction 59% ( 4 percentage points from 2012)
Top Agency Performers Across the IndicesDepartment/Large AgenciesNational Aeronautics and Space Administration
Small/Independent Agencies U.S. Trade and Development Agency Office of Navajo and Hopi Relocation
``````
Results at a Glance 2
3
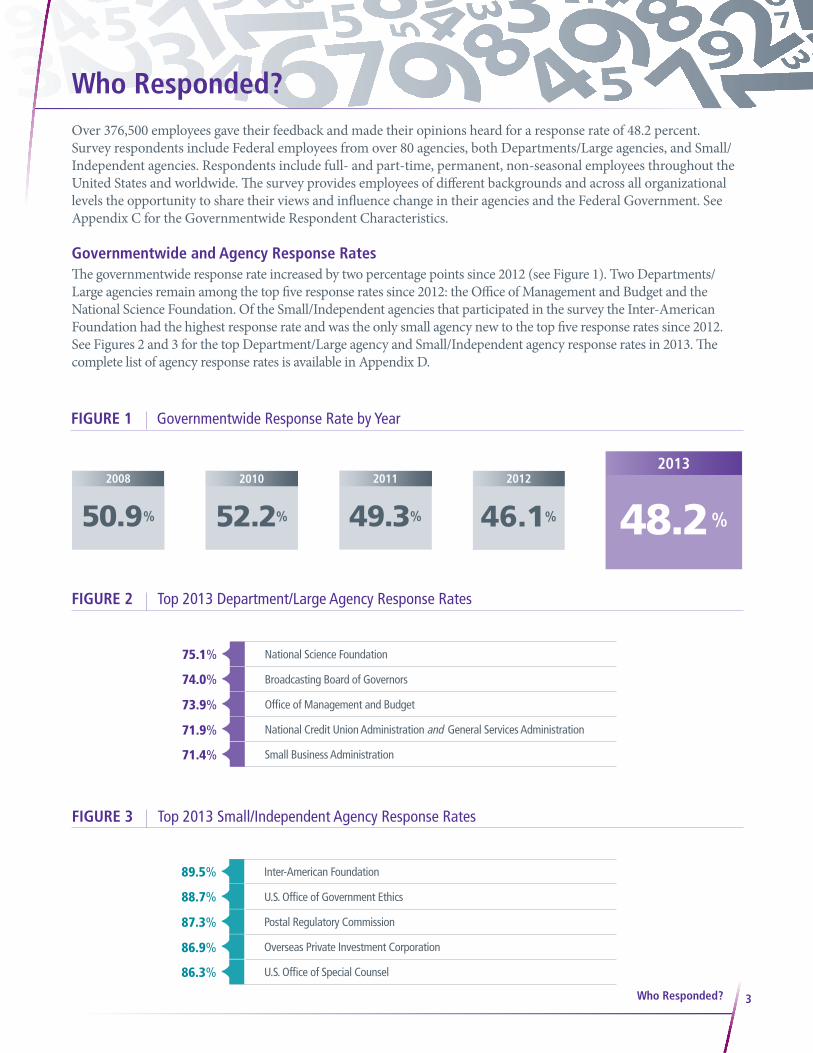
Who Responded?Over 376,500 employees gave their feedback and made their opinions heard for a response rate of 48.2 percent. Survey respondents include Federal employees from over 80 agencies, both Departments/Large agencies, and Small/Independent agencies. Respondents include full- and part-time, permanent, non-seasonal employees throughout the United States and worldwide. The survey provides employees of different backgrounds and across all organizational levels the opportunity to share their views and influence change in their agencies and the Federal Government. See Appendix C for the Governmentwide Respondent Characteristics.
Governmentwide and Agency Response RatesThe governmentwide response rate increased by two percentage points since 2012 (see Figure 1). Two Departments/Large agencies remain among the top five response rates since 2012: the Office of Management and Budget and the National Science Foundation. Of the Small/Independent agencies that participated in the survey the Inter-American Foundation had the highest response rate and was the only small agency new to the top five response rates since 2012. See Figures 2 and 3 for the top Department/Large agency and Small/Independent agency response rates in 2013. The complete list of agency response rates is available in Appendix D.
Who Responded?
FIGURE 1 Governmentwide Response Rate by Year
2008
50.9 %2010
52.2%
2011
49.3 %2012
46.1%
2013
48.2 %
FIGURE 2 Top 2013 Department/Large Agency Response Rates
75.1% National Science Foundation
74.0% Broadcasting Board of Governors
73.9% Office of Management and Budget
71.9% National Credit Union Administration and General Services Administration
71.4% Small Business Administration
FIGURE 3 Top 2013 Small/Independent Agency Response Rates
89.5% Inter-American Foundation
88.7% U.S. Office of Government Ethics
87.3% Postal Regulatory Commission
86.9% Overseas Private Investment Corporation
86.3% U.S. Office of Special Counsel
4
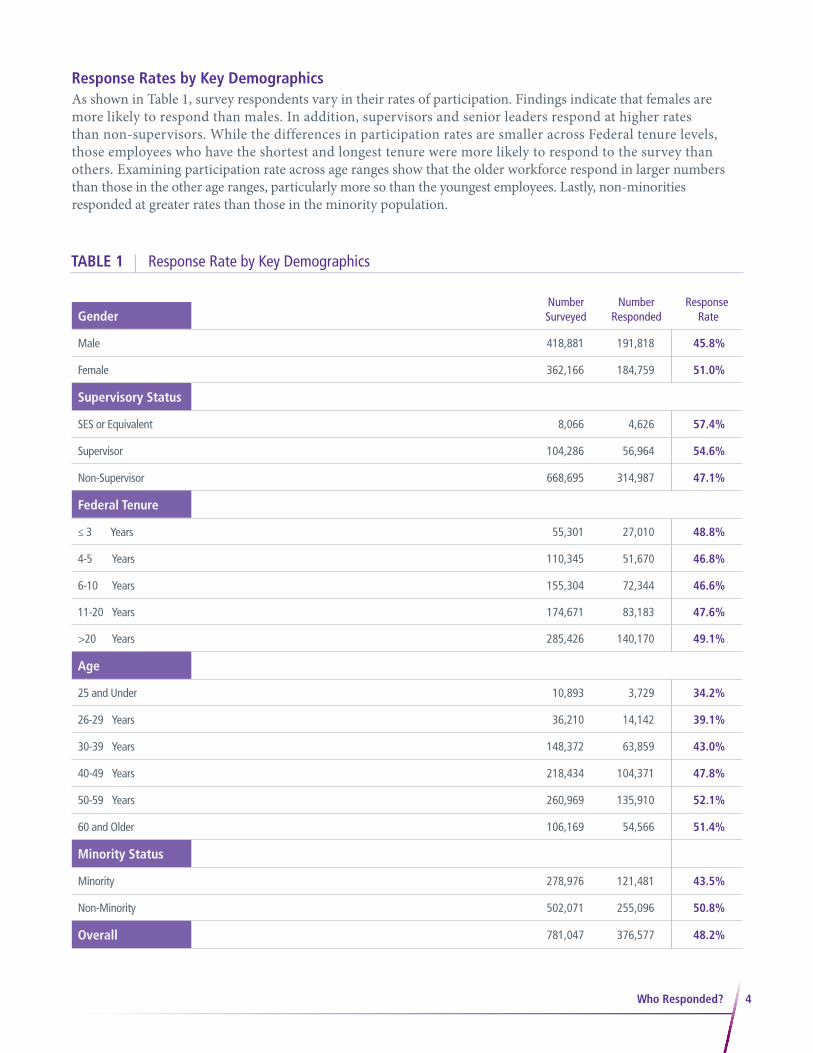
Response Rates by Key DemographicsAs shown in Table 1, survey respondents vary in their rates of participation. Findings indicate that females are more likely to respond than males. In addition, supervisors and senior leaders respond at higher rates than non-supervisors. While the differences in participation rates are smaller across Federal tenure levels, those employees who have the shortest and longest tenure were more likely to respond to the survey than others. Examining participation rate across age ranges show that the older workforce respond in larger numbers than those in the other age ranges, particularly more so than the youngest employees. Lastly, non-minorities responded at greater rates than those in the minority population.
TABLE 1 Response Rate by Key Demographics
GenderNumber Surveyed
Number Responded
Response Rate
Male 418,881 191,818 45.8%
Female 362,166 184,759 51.0%
Supervisory Status
SES or Equivalent 8,066 4,626 57.4%
Supervisor 104,286 56,964 54.6%
Non-Supervisor 668,695 314,987 47.1%
Federal Tenure
≤ 3 Years 55,301 27,010 48.8%
4-5 Years 110,345 51,670 46.8%
6-10 Years 155,304 72,344 46.6%
11-20 Years 174,671 83,183 47.6%
>20 Years 285,426 140,170 49.1%
Age
25 and Under 10,893 3,729 34.2%
26-29 Years 36,210 14,142 39.1%
30-39 Years 148,372 63,859 43.0%
40-49 Years 218,434 104,371 47.8%
50-59 Years 260,969 135,910 52.1%
60 and Older 106,169 54,566 51.4%
Minority Status
Minority 278,976 121,481 43.5%
Non-Minority 502,071 255,096 50.8%
Overall 781,047 376,577 48.2%
Who Responded?
5
Indices
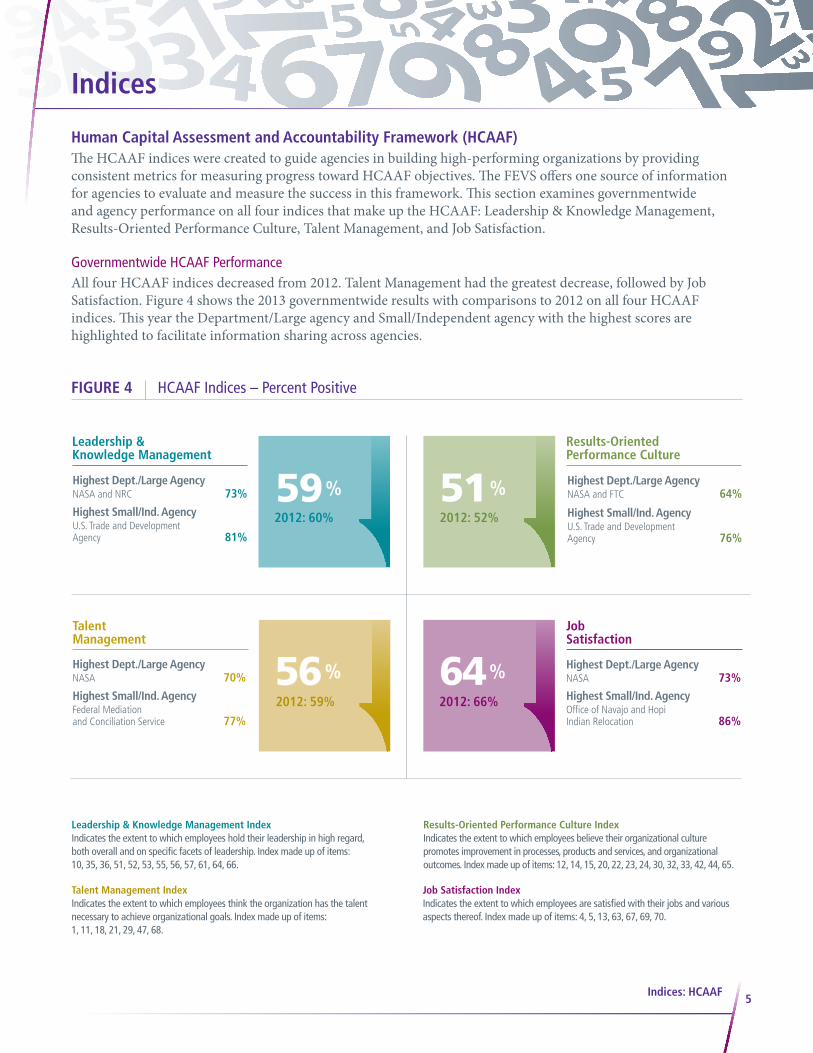
Human Capital Assessment and Accountability Framework (HCAAF) The HCAAF indices were created to guide agencies in building high-performing organizations by providing consistent metrics for measuring progress toward HCAAF objectives. The FEVS offers one source of information for agencies to evaluate and measure the success in this framework. This section examines governmentwide and agency performance on all four indices that make up the HCAAF: Leadership & Knowledge Management, Results-Oriented Performance Culture, Talent Management, and Job Satisfaction.
Governmentwide HCAAF Performance All four HCAAF indices decreased from 2012. Talent Management had the greatest decrease, followed by Job Satisfaction. Figure 4 shows the 2013 governmentwide results with comparisons to 2012 on all four HCAAF indices. This year the Department/Large agency and Small/Independent agency with the highest scores are highlighted to facilitate information sharing across agencies.
FIGURE 4 HCAAF Indices – Percent Positive
Leadership & Knowledge Management
2013:
59 %2012: 60%
Highest Dept./Large AgencyNASA and NRC 73%
Highest Small/Ind. Agency U.S. Trade and Development Agency 81%
Leadership & Knowledge Management Index Indicates the extent to which employees hold their leadership in high regard, both overall and on specific facets of leadership. Index made up of items: 10, 35, 36, 51, 52, 53, 55, 56, 57, 61, 64, 66.
Results-Oriented Performance Culture2013:
51 %2012: 52%
Highest Dept./Large AgencyNASA and FTC 64%
Highest Small/Ind. Agency U.S. Trade and Development Agency 76%
Results-Oriented Performance Culture Index Indicates the extent to which employees believe their organizational culture promotes improvement in processes, products and services, and organizational outcomes. Index made up of items: 12, 14, 15, 20, 22, 23, 24, 30, 32, 33, 42, 44, 65.
Talent Management 2013:
56 %2012: 59%
Highest Dept./Large AgencyNASA 70%
Highest Small/Ind. Agency Federal Mediation and Conciliation Service 77%
Talent Management Index Indicates the extent to which employees think the organization has the talent necessary to achieve organizational goals. Index made up of items: 1, 11, 18, 21, 29, 47, 68.
Job Satisfaction2013:
64 %2012: 66%
Highest Dept./Large AgencyNASA 73%
Highest Small/Ind. Agency Office of Navajo and Hopi Indian Relocation 86%
Job Satisfaction Index Indicates the extent to which employees are satisfied with their jobs and various aspects thereof. Index made up of items: 4, 5, 13, 63, 67, 69, 70.
Indices: HCAAF
6Indices: HCAAF
National Aeronautics and Space Administration
Nuclear Regulatory Commission
Federal Trade Commission
Federal Communications Commission
National Aeronautics and Space Administration
Federal Trade Commission
Nuclear Regulatory Commission
Department of Commerce
National Aeronautics and Space Administration
Federal Trade Commission
Nuclear Regulatory Commission
National Aeronautics and Space Administration
Nuclear Regulatory Commission
Department of State
Talent Management
73% 64%
70% 73%
71%
62%
69% 71%
72%
61%
68% 69%
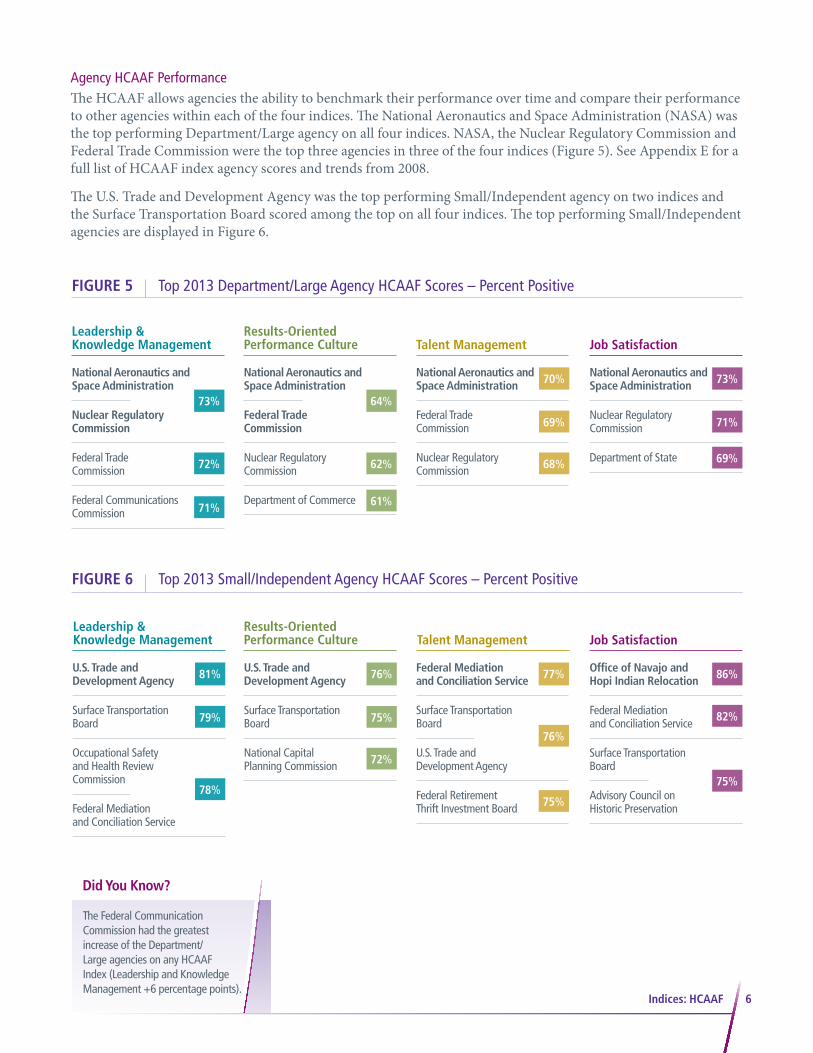
Agency HCAAF Performance The HCAAF allows agencies the ability to benchmark their performance over time and compare their performance to other agencies within each of the four indices. The National Aeronautics and Space Administration (NASA) was the top performing Department/Large agency on all four indices. NASA, the Nuclear Regulatory Commission and Federal Trade Commission were the top three agencies in three of the four indices (Figure 5). See Appendix E for a full list of HCAAF index agency scores and trends from 2008.
The U.S. Trade and Development Agency was the top performing Small/Independent agency on two indices and the Surface Transportation Board scored among the top on all four indices. The top performing Small/Independent agencies are displayed in Figure 6.
FIGURE 5 Top 2013 Department/Large Agency HCAAF Scores – Percent Positive
FIGURE 6 Top 2013 Small/Independent Agency HCAAF Scores – Percent Positive
Leadership & Knowledge Management
Results-Oriented Performance Culture Job Satisfaction
U.S. Trade and Development Agency
Surface Transportation Board
Occupational Safety and Health Review Commission
Federal Mediation and Conciliation Service
U.S. Trade and Development Agency
Surface Transportation Board
National Capital Planning Commission
Federal Mediation and Conciliation Service
Surface Transportation Board
U.S. Trade and Development Agency
Federal Retirement Thrift Investment Board
Office of Navajo and Hopi Indian Relocation
Federal Mediation and Conciliation Service
Surface Transportation Board
Advisory Council on Historic Preservation
Talent Management
81% 76% 77% 86%
79% 75%
76%
82%
75%78%
72%
75%
Leadership & Knowledge Management
Results-Oriented Performance Culture Job Satisfaction
The Federal Communication Commission had the greatest increase of the Department/Large agencies on any HCAAF Index (Leadership and Knowledge Management +6 percentage points).
Did You Know?

7Indices: Employee Engagement
Employee Engagement Index The FEVS Employee Engagement Index is an overarching model comprised of three subfactors: Leaders Lead, Supervisors, and Intrinsic Work Experiences (see Appendix F for the list of subfactor scores by agency). The survey does not directly measure employee engagement. It does, however, cover most, if not all, of the conditions likely to lead to employee engagement. This index provides a guide to the critical components/areas that agencies can focus on to create an engaged workforce. Engaged employees are passionate, energetic, and dedicated to their job and organization, which leads to optimum organizational performance.
Governmentwide Employee Engagement PerformanceAs seen in Figure 7, there were slight decreases on all three subfactors of Employee Engagement. Even with these decreases, Supervisors and Intrinsic Work Experiences subfactors remain strong. This year the Department/Large agency and Small/Independent agency with the highest scores are highlighted to facilitate information sharing across agencies.
FIGURE 7 Employee Engagement Index – Percent Positive
Employee Engagement
2013:
64 %2012: 65%
Highest Dept./Large AgencyNASA 77%
Highest Small/Ind. Agency Advisory Council on Historic Preservation & U.S. Trade and Development Agency 84%
Employee Engagement is comprised of:
Leaders Lead 2013: 53 %2012: 54%
Leaders Lead
Reflects the employees’ perceptions of the integrity of leadership, as well as leadership behaviors such as communication and workforce motivation. It is made up of items 53, 54, 56, 60, and 61.
Supervisors 2013: 70 %2012: 71%
Supervisors
Reflects the interpersonal relationship between worker and supervisor, including trust, respect, and support. It is made up of items 47, 48, 49, 51, and 52.
Intrinsic Work Experiences 2013: 69 %2012: 71%
Intrinsic Work Experiences
Reflects the employees’ feelings of motivation and competency relating to their role in the workplace. It is made up of items 3, 4, 6, 11, and 12.

8Indices: Employee Engagement
Agency Employee Engagement PerformanceWhile 19 of the 37 Department/Large agencies’ scores decreased, 13 agencies’ scores increased from 2012. The Federal Communications Commission had the greatest increase (four percentage points) and the Department of Housing and Urban Development had the greatest decrease (five percentage points). The top performing Department/Large agencies are displayed in Figure 8. For a full list of Employee Engagement agency scores and trends from 2008 see Appendix F.
The Advisory Council on Historic Preservation and the U.S. Trade and Development Agency had the highest Employee Engagement Index score (see Figure 9). The Advisory Council on Historic Preservation had a seven percentage point increase from 2012 (77% to 84%).
FIGURE 8 Top 2013 Department/Large Agency Employee Engagement Scores – Percent Positive
FIGURE 9 Top 2013 Small/Independent Agency Employee Engagement Scores – Percent Positive
The Small agency with the greatest increase from 2012 was the American Battle Monuments Commission (+10 percentage points).
Did You Know?
National Aeronautics and Space Administration
Federal Trade Commission
Nuclear Regulatory Commission
Federal Communications Commission
Federal Energy Regulatory Commission
Advisory Council on Historic Preservation
U.S. Trade and Development Agency
Surface Transportation Board
Office of Navajo and Hopi Indian Relocation
77%
84%
73%
82%
75%
83%
9
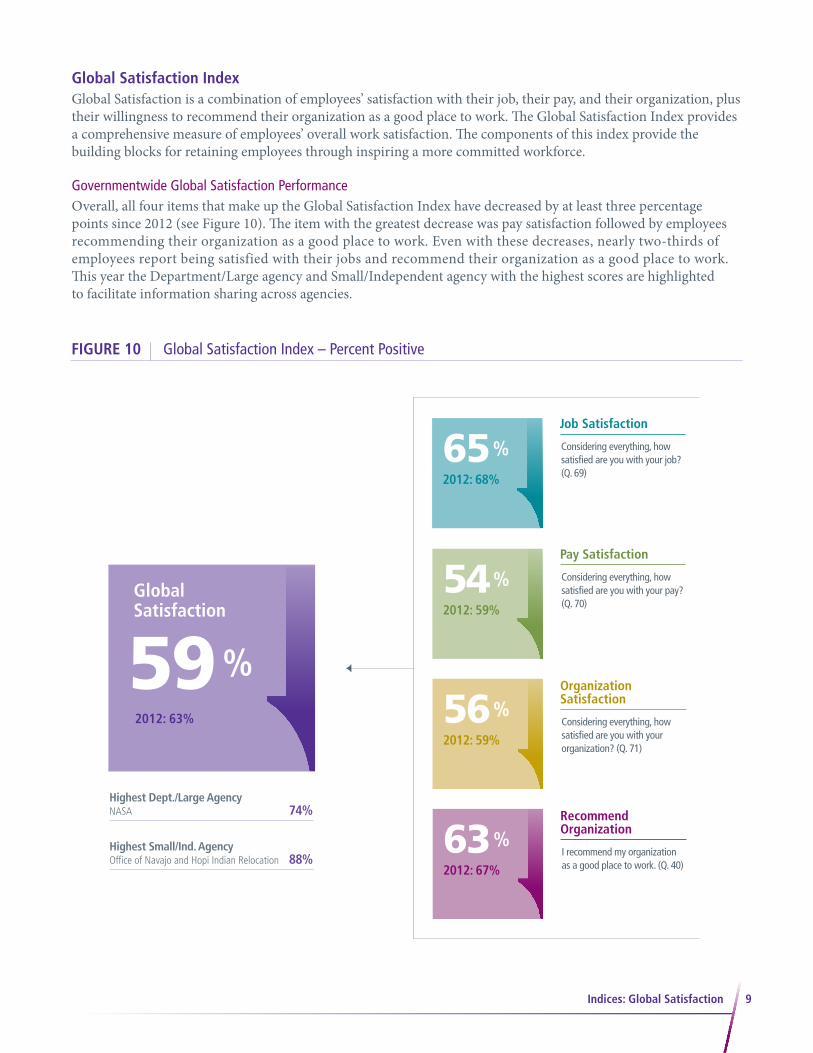
Global Satisfaction Index Global Satisfaction is a combination of employees’ satisfaction with their job, their pay, and their organization, plus their willingness to recommend their organization as a good place to work. The Global Satisfaction Index provides a comprehensive measure of employees’ overall work satisfaction. The components of this index provide the building blocks for retaining employees through inspiring a more committed workforce.
Governmentwide Global Satisfaction PerformanceOverall, all four items that make up the Global Satisfaction Index have decreased by at least three percentage points since 2012 (see Figure 10). The item with the greatest decrease was pay satisfaction followed by employees recommending their organization as a good place to work. Even with these decreases, nearly two-thirds of employees report being satisfied with their jobs and recommend their organization as a good place to work. This year the Department/Large agency and Small/Independent agency with the highest scores are highlighted to facilitate information sharing across agencies.
FIGURE 10 Global Satisfaction Index – Percent Positive
Global Satisfaction
2013:
59 %2012: 63%
Indices: Global Satisfaction
Highest Dept./Large AgencyNASA 74%
Highest Small/Ind. Agency Office of Navajo and Hopi Indian Relocation 88%
Global Satisfaction is comprised of:
Job Satisfaction 2013: 65 %2012: 68%
Job Satisfaction
Considering everything, how satisfied are you with your job? (Q. 69)
Pay Satisfaction 2013: 54 %2012: 59%
Pay Satisfaction
Considering everything, how satisfied are you with your pay? (Q. 70)
Organization Satisfaction 2013:
56 %2012: 59%
Organization Satisfaction
Considering everything, how satisfied are you with your organization? (Q. 71)
Recommend Organization 2013:
63 %2012: 67%
Recommend Organization
I recommend my organization as a good place to work. (Q. 40)

10Indices: Global Satisfaction
Agency Global Satisfaction PerformanceDepartment/Large agency scores ranged from a high of 74 percent positive at the National Aeronautics and Space Administration to a low of 49 percent positive at the Department of Housing and Urban Development and the National Archives and Records. For a full list of Global Satisfaction agency scores and trends from 2008 see Appendix G.
Small/Independent agency scores ranged from a high of 88 percent positive at the Office of Navajo and Hopi Indian Relocation to a low of 29 percent positive at the Office of the U.S. Trade Representative.
Figures 11 and 12 display the top Global Satisfaction scores for both Department/Large and Small/Independent agencies.
Four Department/Large agencies increased in Global Satisfaction: • Federal Communications Commission• Broadcasting Board of Governors• Federal Energy Regulatory Commission• Securities and Exchange Commission
Did You Know?
FIGURE 11 Top 2013 Department/Large Agency Global Satisfaction Scores – Percent Positive
FIGURE 12 Top 2013 Small/Independent Agency Global Satisfaction Scores – Percent Positive
National Aeronautics and Space Administration
Nuclear Regulatory Commission
Federal Communications Commission
Office of Navajo and Hopi Indian Relocation
Federal Mediation and Conciliation Service
Advisory Council on Historic Preservation
74%
88%
71%
81%
72%
82%
11
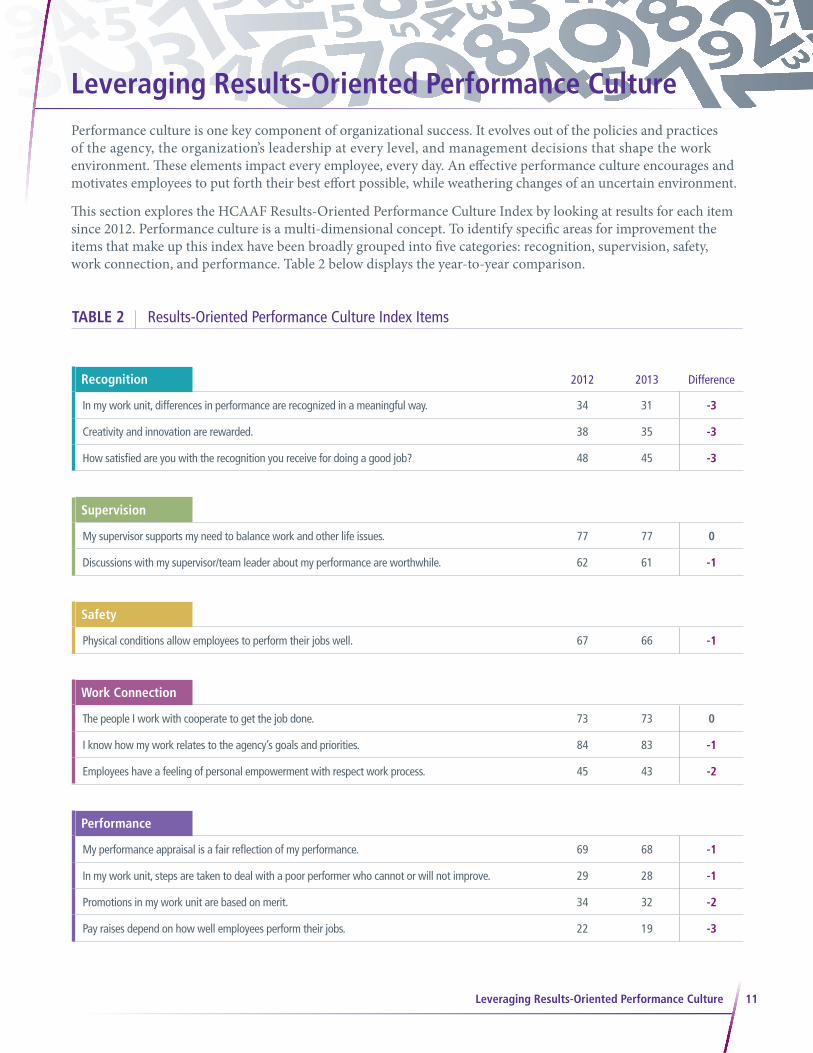
Leveraging Results-Oriented Performance CulturePerformance culture is one key component of organizational success. It evolves out of the policies and practices of the agency, the organization’s leadership at every level, and management decisions that shape the work environment. These elements impact every employee, every day. An effective performance culture encourages and motivates employees to put forth their best effort possible, while weathering changes of an uncertain environment.
This section explores the HCAAF Results-Oriented Performance Culture Index by looking at results for each item since 2012. Performance culture is a multi-dimensional concept. To identify specific areas for improvement the items that make up this index have been broadly grouped into five categories: recognition, supervision, safety, work connection, and performance. Table 2 below displays the year-to-year comparison.
TABLE 2 Results-Oriented Performance Culture Index Items
Leveraging Results-Oriented Performance Culture
Recognition 2012 2013 Difference
In my work unit, differences in performance are recognized in a meaningful way. 34 31 -3
Creativity and innovation are rewarded. 38 35 -3
How satisfied are you with the recognition you receive for doing a good job? 48 45 -3
Supervision
My supervisor supports my need to balance work and other life issues. 77 77 0
Discussions with my supervisor/team leader about my performance are worthwhile. 62 61 -1
Safety
Physical conditions allow employees to perform their jobs well. 67 66 -1
Work Connection
The people I work with cooperate to get the job done. 73 73 0
I know how my work relates to the agency’s goals and priorities. 84 83 -1
Employees have a feeling of personal empowerment with respect work process. 45 43 -2
Performance
My performance appraisal is a fair reflection of my performance. 69 68 -1
In my work unit, steps are taken to deal with a poor performer who cannot or will not improve. 29 28 -1
Promotions in my work unit are based on merit. 34 32 -2
Pay raises depend on how well employees perform their jobs. 22 19 -3
12Leveraging Results-Oriented Performance Culture
Of the 13 items in the Results-Oriented Performance Culture Index, 11 items decreased. The recognition category showed the greatest decreases with all three items decreasing by three percentage points from 2012.
What Can Federal Managers Do? Reversing these declining trends and making improvements in Results-Oriented Performance Culture will take time. Communicating to employees what they are doing well and what changes need to be made is one critical action that can drive effective performance management and recognition. The value of feedback is time-sensitive. Feedback, either positive or constructive when provided immediately to an employee has the most impact. The traditional mid-year and year-end reviews should hold no surprises, as these are for summarizing the day-to-day feedback provided, and mapping out a plan for continuous improvement.
13Generations in the Workforce
Generations in the Workforce
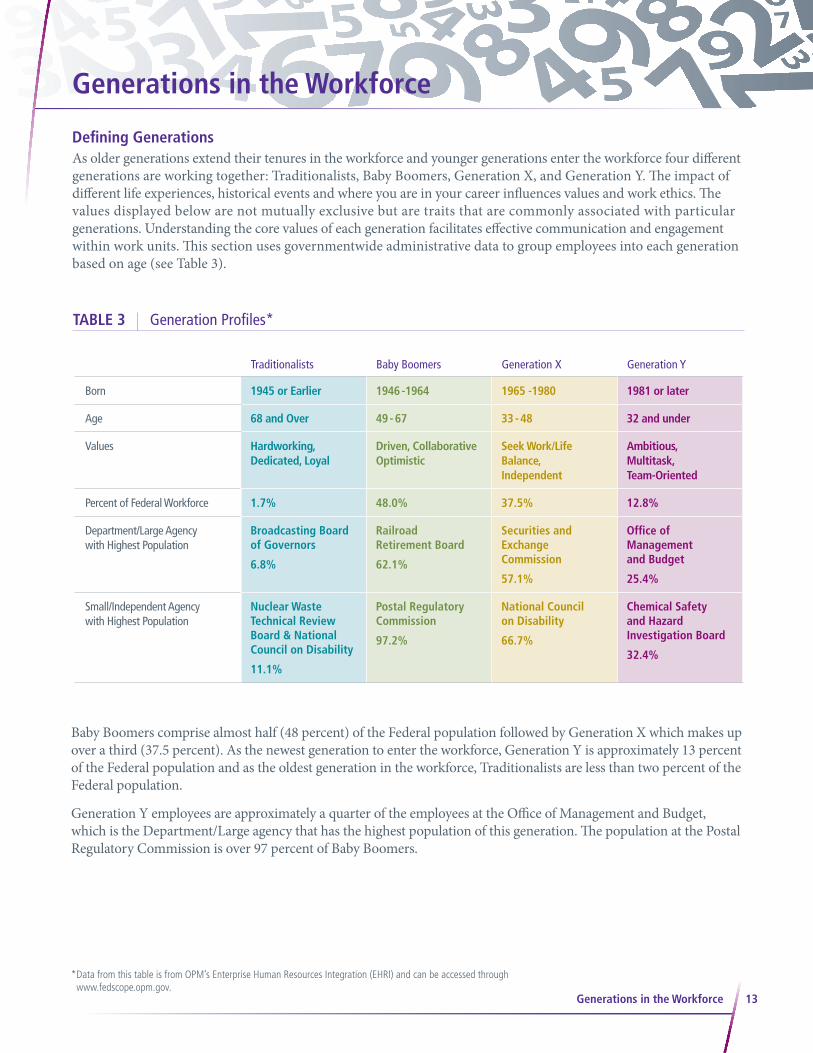
Defining GenerationsAs older generations extend their tenures in the workforce and younger generations enter the workforce four different generations are working together: Traditionalists, Baby Boomers, Generation X, and Generation Y. The impact of different life experiences, historical events and where you are in your career influences values and work ethics. The values displayed below are not mutually exclusive but are traits that are commonly associated with particular generations. Understanding the core values of each generation facilitates effective communication and engagement within work units. This section uses governmentwide administrative data to group employees into each generation based on age (see Table 3).
TABLE 3 Generation Profiles*
Traditionalists Baby Boomers Generation X Generation Y
Born 1945 or Earlier 1946 -1964 1965 -1980 1981 or later
Age 68 and Over 49 - 67 33 - 48 32 and under
Values Hardworking, Dedicated, Loyal
Driven, Collaborative Optimistic
Seek Work/Life Balance, Independent
Ambitious, Multitask, Team-Oriented
Percent of Federal Workforce 1.7% 48.0% 37.5% 12.8%
Department/Large Agency with Highest Population
Broadcasting Board of Governors
6.8%
Railroad Retirement Board
62.1%
Securities and Exchange Commission
57.1%
Office of Management and Budget
25.4%
Small/Independent Agency with Highest Population
Nuclear Waste Technical Review Board & National Council on Disability
11.1%
Postal Regulatory Commission
97.2%
National Council on Disability
66.7%
Chemical Safety and Hazard Investigation Board
32.4%
Baby Boomers comprise almost half (48 percent) of the Federal population followed by Generation X which makes up over a third (37.5 percent). As the newest generation to enter the workforce, Generation Y is approximately 13 percent of the Federal population and as the oldest generation in the workforce, Traditionalists are less than two percent of the Federal population.
Generation Y employees are approximately a quarter of the employees at the Office of Management and Budget, which is the Department/Large agency that has the highest population of this generation. The population at the Postal Regulatory Commission is over 97 percent of Baby Boomers.
* Data from this table is from OPM’s Enterprise Human Resources Integration (EHRI) and can be accessed through www.fedscope.opm.gov.

14Generations in the Workforce
TABLE 4 Generation Comparisons
Traditionalists Baby Boomers Generation X Generation Y Governmentwide
Recognition for Products and Services1 53% 46% 45% 46% 46%
Sufficient Resources2 54% 44% 42% 47% 44%
Satisfaction with Training3 58% 50% 49% 51% 50%
Telework Participation4 23% 27% 27% 25% 27%
Satisfaction with Telework5 74% 75% 76% 78% 76%
Global Satisfaction Score 67% 59% 59% 59% 59%
Employee Engagement Score 70% 64% 64% 65% 64%
Generation Comparison As a way to gain a better understanding of the differences and the similarities of each generation, Table 4 highlights key survey results for each of the four generations with governmentwide results as a comparison.
Traditionalists had the highest Global Satisfaction score (67 percent positive) and the highest Employee Engagement score (70 percent positive). Traditionalists also had the highest percent positive rating for most survey items including recognition, sufficient resources, and satisfaction with training, while Generation X had the lowest percent positive rating for these items. Consistent with Generation X’s value for work/life balance and the idea that Baby Boomers may be caregivers for their aging parents both generations had the highest percent of employees report that they telework (27 percent). While Generation Y did not report the highest telework participation, they are the generation most satisfied (78 percent positive) with telework.
It is important for agencies to know their generational breakdown in order to create a work environment that allows each generation to use their skills effectively. It is also necessary for agencies to encourage the different generations to work and communicate with each other to improve knowledge transfer and make their agency a better place to work.
Satisfaction by Generation: What Drives Employee Satisfaction?Satisfied and engaged employees are in high demand, as satisfied employees are more likely to enjoy the work they do and are more willing to put in extra effort to get the job done. With shrinking budgets and limited resources all during a time of uncertainty, agencies are looking for alternative approaches to help them decide where to focus their attention with the overall goal of increasing employee morale.
By taking a deeper look at the Global Satisfaction Index, this section will identify the key drivers or items that distinguish employees with high satisfaction from those with low satisfaction. This distinction will reveal the satisfaction gap, which will help agencies identify areas where they can make improvements to increase satisfaction.
1 Employees are recognized for providing high quality products and services. 2 I have sufficient resources (for example, people, materials, budget) to get my job done. 3 How satisfied are you with the training you receive for your present job? 4 Please select the response below that BEST describes your current teleworking situation. 5 How satisfied are you with the following Work/Life programs in your agency? Telework.
15Generations in the Workforce
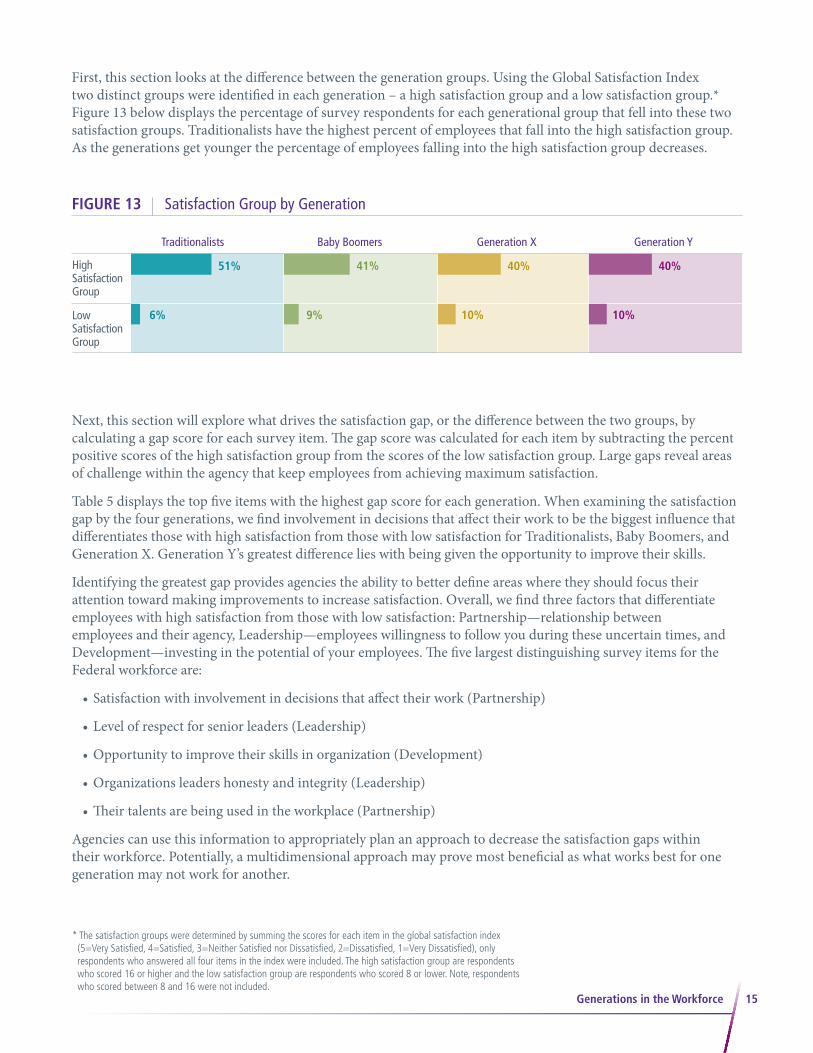
First, this section looks at the difference between the generation groups. Using the Global Satisfaction Index two distinct groups were identified in each generation – a high satisfaction group and a low satisfaction group.* Figure 13 below displays the percentage of survey respondents for each generational group that fell into these two satisfaction groups. Traditionalists have the highest percent of employees that fall into the high satisfaction group. As the generations get younger the percentage of employees falling into the high satisfaction group decreases.
Next, this section will explore what drives the satisfaction gap, or the difference between the two groups, by calculating a gap score for each survey item. The gap score was calculated for each item by subtracting the percent positive scores of the high satisfaction group from the scores of the low satisfaction group. Large gaps reveal areas of challenge within the agency that keep employees from achieving maximum satisfaction.
Table 5 displays the top five items with the highest gap score for each generation. When examining the satisfaction gap by the four generations, we find involvement in decisions that affect their work to be the biggest influence that differentiates those with high satisfaction from those with low satisfaction for Traditionalists, Baby Boomers, and Generation X. Generation Y’s greatest difference lies with being given the opportunity to improve their skills.
Identifying the greatest gap provides agencies the ability to better define areas where they should focus their attention toward making improvements to increase satisfaction. Overall, we find three factors that differentiate employees with high satisfaction from those with low satisfaction: Partnership—relationship between employees and their agency, Leadership—employees willingness to follow you during these uncertain times, and Development—investing in the potential of your employees. The five largest distinguishing survey items for the Federal workforce are:
• Satisfaction with involvement in decisions that affect their work (Partnership)
• Level of respect for senior leaders (Leadership)
• Opportunity to improve their skills in organization (Development)
• Organizations leaders honesty and integrity (Leadership)
• Their talents are being used in the workplace (Partnership)
Agencies can use this information to appropriately plan an approach to decrease the satisfaction gaps within their workforce. Potentially, a multidimensional approach may prove most beneficial as what works best for one generation may not work for another.
FIGURE 13 Satisfaction Group by Generation
Low Satisfaction Group
High Satisfaction Group
41%
6% 9% 10% 10%
51% 40% 40%
Traditionalists Baby Boomers Generation X Generation Y
* The satisfaction groups were determined by summing the scores for each item in the global satisfaction index (5=Very Satisfied, 4=Satisfied, 3=Neither Satisfied nor Dissatisfied, 2=Dissatisfied, 1=Very Dissatisfied), only respondents who answered all four items in the index were included. The high satisfaction group are respondents who scored 16 or higher and the low satisfaction group are respondents who scored 8 or lower. Note, respondents who scored between 8 and 16 were not included.

16
TraditionalistsHigh Sat.
GroupLow Sat. Group Gap
How satisfied are you with your involvement in decisions that affect your work?
82% 2% 80
I have a high level of respect for my organization’s senior leaders.
84% 6% 79
Overall, how good a job do you feel is being done by the manager directly above your immediate supervisor/team leader?
87% 8% 79
I am given a real opportunity to improve my skills in my organization.
88% 8% 78
How satisfied are you with the information you receive from management on what’s going on in your organization?
80% 3% 77
Generations in the Workforce
Baby BoomersHigh Sat.
GroupLow Sat. Group Gap
How satisfied are you with your involvement in decisions that affect your work?
81% 5% 76
I have a high level of respect for my organization’s senior leaders.
81% 7% 74
My organization’s leaders maintain high standards of honesty and integrity.
82% 9% 73
I am given a real opportunity to improve my skills in my organization.
86% 13% 73
My talents are used well in the workplace.
86% 13% 73
Generation XHigh Sat.
GroupLow Sat. Group Gap
How satisfied are you with your involvement in decisions that affect your work?
80% 6% 74
I have a high level of respect for my organization’s senior leaders.
81% 8% 73
I am given a real opportunity to improve my skills in my organization.
86% 13% 73
My organization’s leaders maintain high standards of honesty and integrity.
81% 9% 72
My talents are used well in the workplace.
84% 13% 71
Generation YHigh Sat.
GroupLow Sat. Group Gap
I am given a real opportunity to improve my skills in my organization.
88% 14% 74
I have a high level of respect for my organization’s senior leaders.
83% 11% 72
My work gives me a feeling of personal accomplishment.
90% 18% 72
My organization’s leaders maintain high standards of honesty and integrity.
84% 12% 72
My agency is successful at accomplishing its mission.
95% 25% 70
TABLE 5 Top 2013 Items with Greatest Gap by Generation – Percent Positive
17
Supporting DiversityThe actions of the Federal Government—promoting an inclusive workforce offering a multitude of unique employee experiences, perspectives and knowledge—demonstrates that it values, emphasizes, and supports diversity in the broadest sense. Historically, diversity was viewed through a narrow lens focusing primarily on physical characteristics such as gender, race and age; recently the lens has expanded focusing on other types of diversity in addition to traditional demographic characteristics. Beginning in 2012 and carried forward into 2013, three new demographic items were added to the Federal Employee Viewpoint Survey (FEVS); Veteran Status, the Lesbian, Gay, Bisexual, Transgender (LGBT) Community, and People with Disabilities.
This section provides an overview of findings for and comparisons within each of the three diversity groups (veterans and non-veterans; LGBT and heterosexual/straight; people with disabilities and people without disabilities). Key items with the largest differences are highlighted throughout. These items are displayed with the intention of bringing attention to potential areas of concern and to encourage agencies to explore these findings at the agency level.
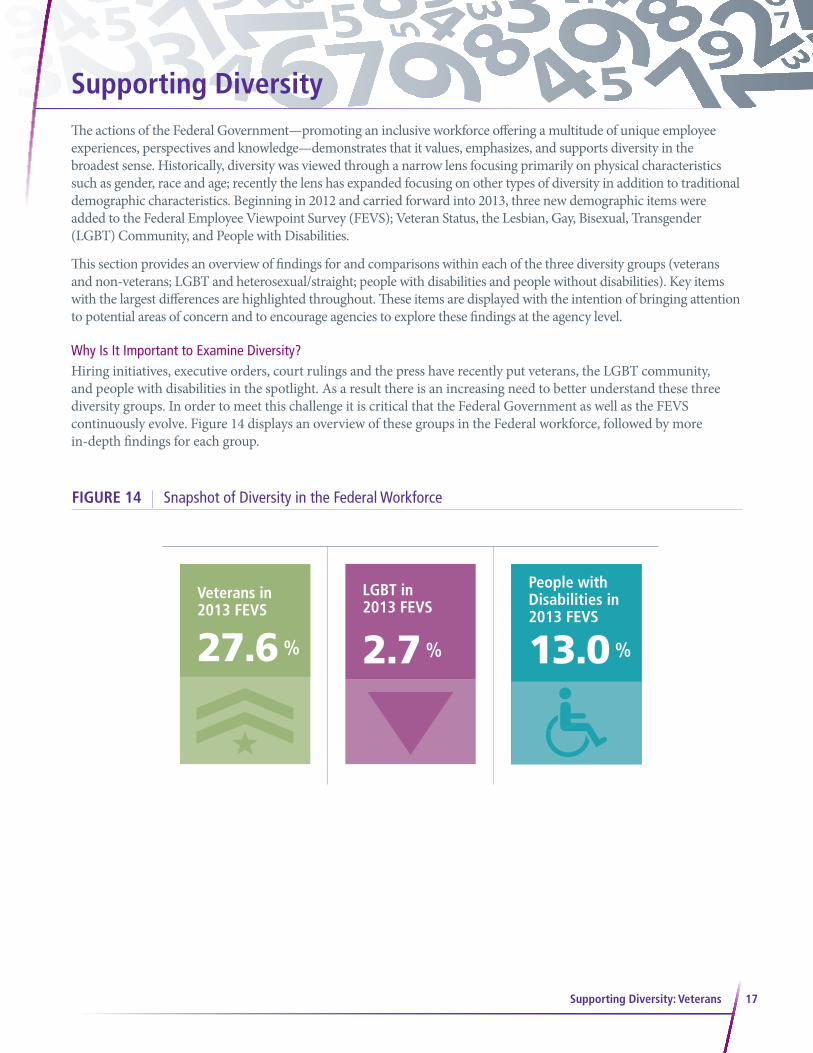
Why Is It Important to Examine Diversity?Hiring initiatives, executive orders, court rulings and the press have recently put veterans, the LGBT community, and people with disabilities in the spotlight. As a result there is an increasing need to better understand these three diversity groups. In order to meet this challenge it is critical that the Federal Government as well as the FEVS continuously evolve. Figure 14 displays an overview of these groups in the Federal workforce, followed by more in-depth findings for each group.
Supporting Diversity: Veterans
2.7 %
LGBT in 2013 FEVS
27.6 %Veterans in 2013 FEVS
13.0 %
People with Disabilities in 2013 FEVS
FIGURE 14 Snapshot of Diversity in the Federal Workforce

1818Supporting Diversity: Veterans
The percentage of veterans in the Federal workforce is very similar in both the 2013 FEVS results (28%) and findings from Feds Hire Vets7 (27%).
Did You Know?
FIGURE 15 Demographic Profile for Veterans in the 2013 FEVS
27.6 %Veterans in 2013 FEVS
Federal Tenure Age
Gender Supervisory Status
< 1 Year 2%
1 - 3 Years 15%
4 - 5 Years 14%
6 - 10 Years 22%
11 - 14 Years 14%
15 - 20 Years 11%
> 20 Years 24%
25 and Under 1%
26 - 29 Years 1%
30 - 39 Years 12%
40 - 49 Years 29 %
50 - 59 Years 39%
60 or Older 18%
Male 81%
Female 19%
Non-Supervisor 64%
Team Leader 15%
Supervisor 13%
Manager 7%
Executive 1%
7More detailed information on Feds Hire Vets can be found: http://www.fedshirevets.gov
Veterans In support of the veteran hiring and retention initiatives, such as Executive Order 135186 signed in 2010, the FEVS started collecting data on veterans status. Understanding the unique characteristics of the veteran population is critical in developing and maintaining effective policies and programs that meet the needs of veterans. With this ongoing focus on veterans in the workforce and the encouragement of agencies across government to ensure fair treatment and equal opportunity, this section offers a snapshot of who these veterans are, where they work, and how their opinions may differ from non-veterans in the workforce.
As shown in Figure 15, the majority of veterans are between 40-50 years old, male, and non-supervisors. Veterans’ Federal tenure is more evenly distributed, with the highest percentage reporting tenure of more than 20 years.
6 More detailed information on Executive Order 13518 can be found: http://www.whitehouse.gov/the-press-office/executive-order-veterans- employment-initiative

19Supporting Diversity: Veterans
TABLE 6 Comparison of Survey Results for Veterans & Non-Veterans – Percent Positive
Several of the items with the greatest differences in percent positive results between veterans and non-veterans are listed in Table 6. Some of the greatest differences were found in items related to the fairness of organizational practices and relationships with supervisors, with veterans’ results consistently lower than non-veterans’ results. Lower results surrounding a specific theme suggest a potential area for improvement, and in this case the results show that veterans’ perceptions of fairness in organizational practices and their relationships with supervisors are areas that could be improved. When compared to non-veterans, 53 items were lower for the veterans group.
Veterans Non-Veterans Difference
Promotions in my work unit are based on merit. 29% 34% -5%
In the last six months, my supervisor/team leader has talked with me about my performance.
74% 79% -5%
Prohibited Personnel Practices are not tolerated. 63% 67% -4%
Policies and programs promote diversity in the workplace. 53% 57% -4%
Managers communicate the goals and priorities of the organization. 59% 63% -4%
Supervisors/team leaders in my work unit support employee development. 62% 65% -3%
29 percent of veterans reported having a disability, as opposed to only 7 percent of non-veterans.
Did You Know?
* Small agencies that have 50 or more eligible employees had the option to include the demographic section on the survey.
FIGURE 16 Non-Defense Agencies with the Highest Percentage of Veteran Employees*
39%
53%
38%
36%
26%
25%
International Boundary and Water Commission
Department of Defense
Department of Transportation
Department of Homeland Security U.S. Department of Veteran Affairs
Department of Energy U.S. Department of Justice
U.S. Department of Labor Office of Personnel ManagementNuclear Regulatory Commission
Figure 16 displays the top five non-defense agencies with the highest proportion of veteran employees. These five agencies vary greatest in size and mission. The Department of Defense is presented for comparison.
20Supporting Diversity: LGBT
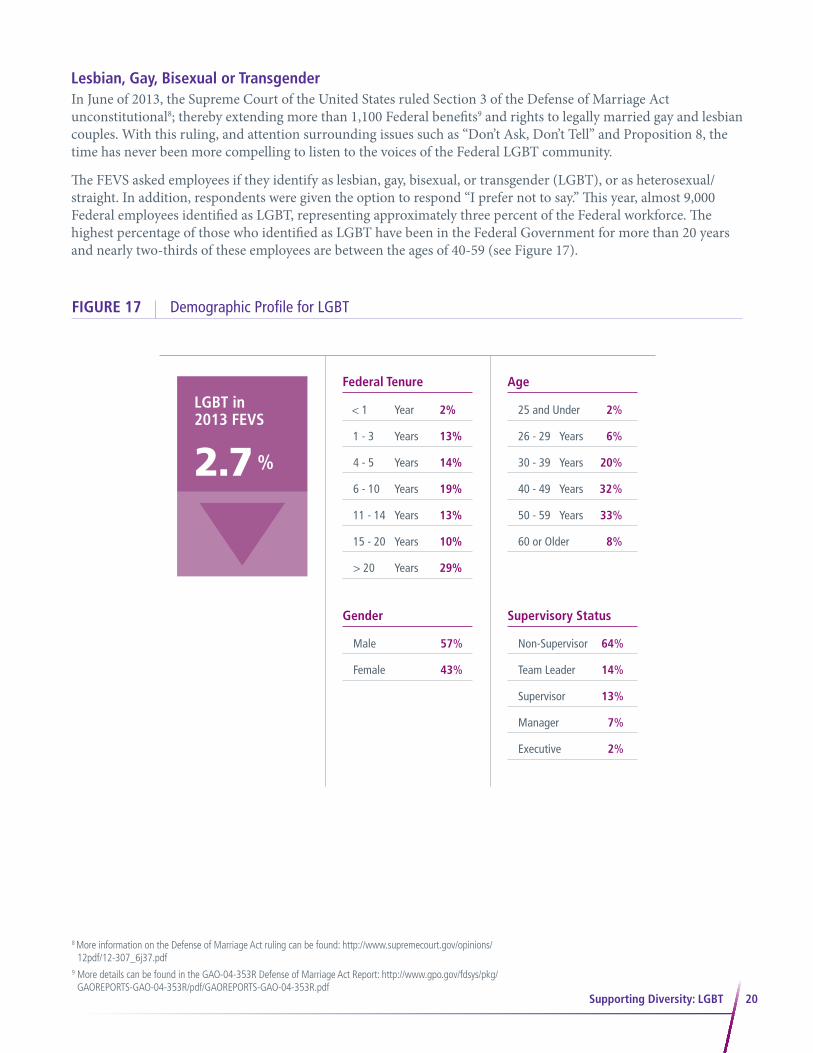
Lesbian, Gay, Bisexual or Transgender In June of 2013, the Supreme Court of the United States ruled Section 3 of the Defense of Marriage Act unconstitutional8; thereby extending more than 1,100 Federal benefits9 and rights to legally married gay and lesbian couples. With this ruling, and attention surrounding issues such as “Don’t Ask, Don’t Tell” and Proposition 8, the time has never been more compelling to listen to the voices of the Federal LGBT community.
The FEVS asked employees if they identify as lesbian, gay, bisexual, or transgender (LGBT), or as heterosexual/ straight. In addition, respondents were given the option to respond “I prefer not to say.” This year, almost 9,000 Federal employees identified as LGBT, representing approximately three percent of the Federal workforce. The highest percentage of those who identified as LGBT have been in the Federal Government for more than 20 years and nearly two-thirds of these employees are between the ages of 40-59 (see Figure 17).
2.7 %
LGBT in 2013 FEVS
FIGURE 17 Demographic Profile for LGBT
8 More information on the Defense of Marriage Act ruling can be found: http://www.supremecourt.gov/opinions/ 12pdf/12-307_6j37.pdf
9 More details can be found in the GAO-04-353R Defense of Marriage Act Report: http://www.gpo.gov/fdsys/pkg/GAOREPORTS-GAO-04-353R/pdf/GAOREPORTS-GAO-04-353R.pdf
Federal Tenure Age
Gender Supervisory Status
< 1 Year 2%
1 - 3 Years 13%
4 - 5 Years 14%
6 - 10 Years 19%
11 - 14 Years 13%
15 - 20 Years 10%
> 20 Years 29%
25 and Under 2%
26 - 29 Years 6%
30 - 39 Years 20%
40 - 49 Years 32 %
50 - 59 Years 33%
60 or Older 8%
Male 57%
Female 43%
Non-Supervisor 64%
Team Leader 14%
Supervisor 13%
Manager 7%
Executive 2%
21Supporting Diversity: LGBT
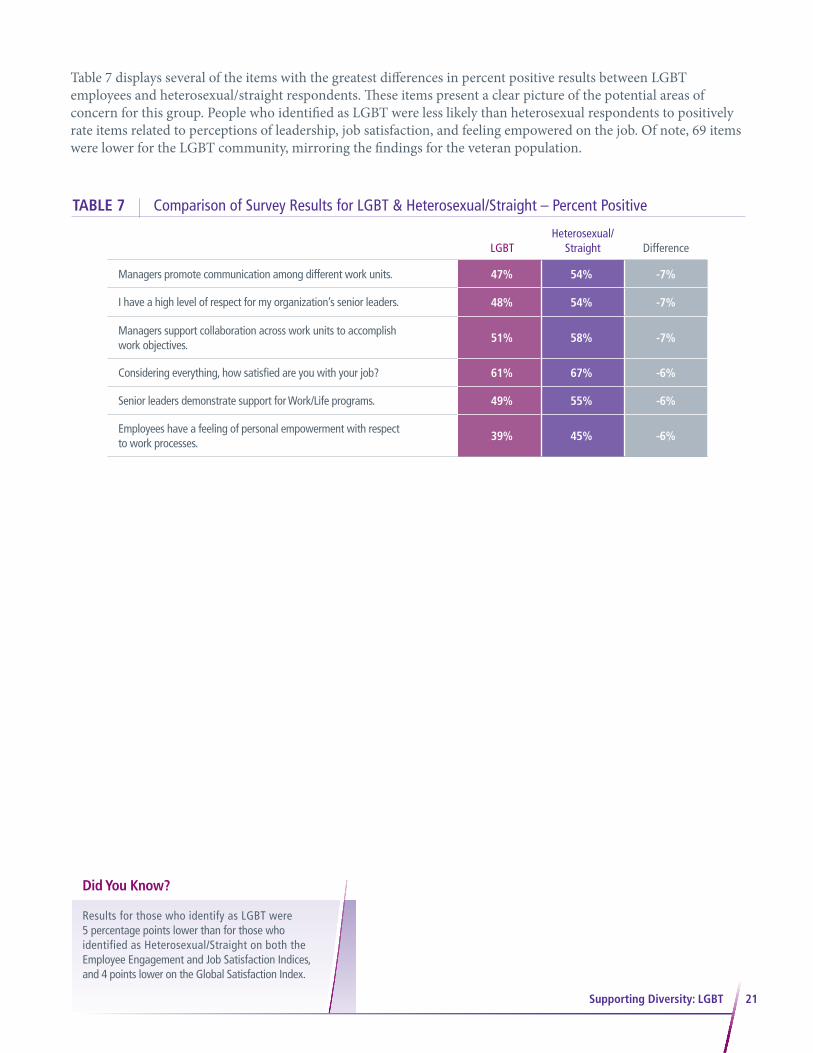
Table 7 displays several of the items with the greatest differences in percent positive results between LGBT employees and heterosexual/straight respondents. These items present a clear picture of the potential areas of concern for this group. People who identified as LGBT were less likely than heterosexual respondents to positively rate items related to perceptions of leadership, job satisfaction, and feeling empowered on the job. Of note, 69 items were lower for the LGBT community, mirroring the findings for the veteran population.
Results for those who identify as LGBT were 5 percentage points lower than for those who identified as Heterosexual/Straight on both the Employee Engagement and Job Satisfaction Indices, and 4 points lower on the Global Satisfaction Index.
Did You Know?
TABLE 7 Comparison of Survey Results for LGBT & Heterosexual/Straight – Percent Positive
LGBTHeterosexual/
Straight Difference
Managers promote communication among different work units. 47% 54% -7%
I have a high level of respect for my organization’s senior leaders. 48% 54% -7%
Managers support collaboration across work units to accomplish work objectives.
51% 58% -7%
Considering everything, how satisfied are you with your job? 61% 67% -6%
Senior leaders demonstrate support for Work/Life programs. 49% 55% -6%
Employees have a feeling of personal empowerment with respect to work processes.
39% 45% -6%
22Supporting Diversity: People with Disabilities
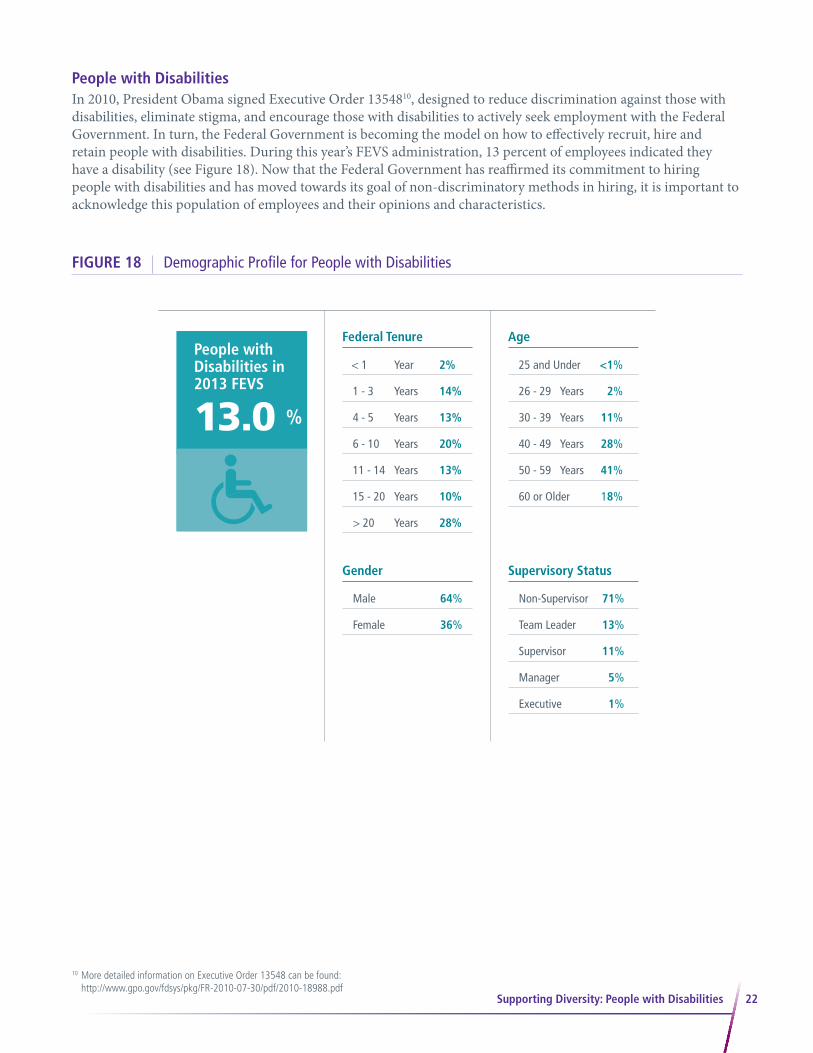
People with Disabilities In 2010, President Obama signed Executive Order 1354810, designed to reduce discrimination against those with disabilities, eliminate stigma, and encourage those with disabilities to actively seek employment with the Federal Government. In turn, the Federal Government is becoming the model on how to effectively recruit, hire and retain people with disabilities. During this year’s FEVS administration, 13 percent of employees indicated they have a disability (see Figure 18). Now that the Federal Government has reaffirmed its commitment to hiring people with disabilities and has moved towards its goal of non-discriminatory methods in hiring, it is important to acknowledge this population of employees and their opinions and characteristics.
FIGURE 18 Demographic Profile for People with Disabilities
13.0 %
People with Disabilities in 2013 FEVS
10 More detailed information on Executive Order 13548 can be found: http://www.gpo.gov/fdsys/pkg/FR-2010-07-30/pdf/2010-18988.pdf
Federal Tenure Age
Gender Supervisory Status
< 1 Year 2%
1 - 3 Years 14%
4 - 5 Years 13%
6 - 10 Years 20%
11 - 14 Years 13%
15 - 20 Years 10%
> 20 Years 28%
25 and Under <1%
26 - 29 Years 2%
30 - 39 Years 11%
40 - 49 Years 28%
50 - 59 Years 41%
60 or Older 18%
Male 64%
Female 36%
Non-Supervisor 71%
Team Leader 13%
Supervisor 11%
Manager 5%
Executive 1%
23Supporting Diversity: People with Disabilities
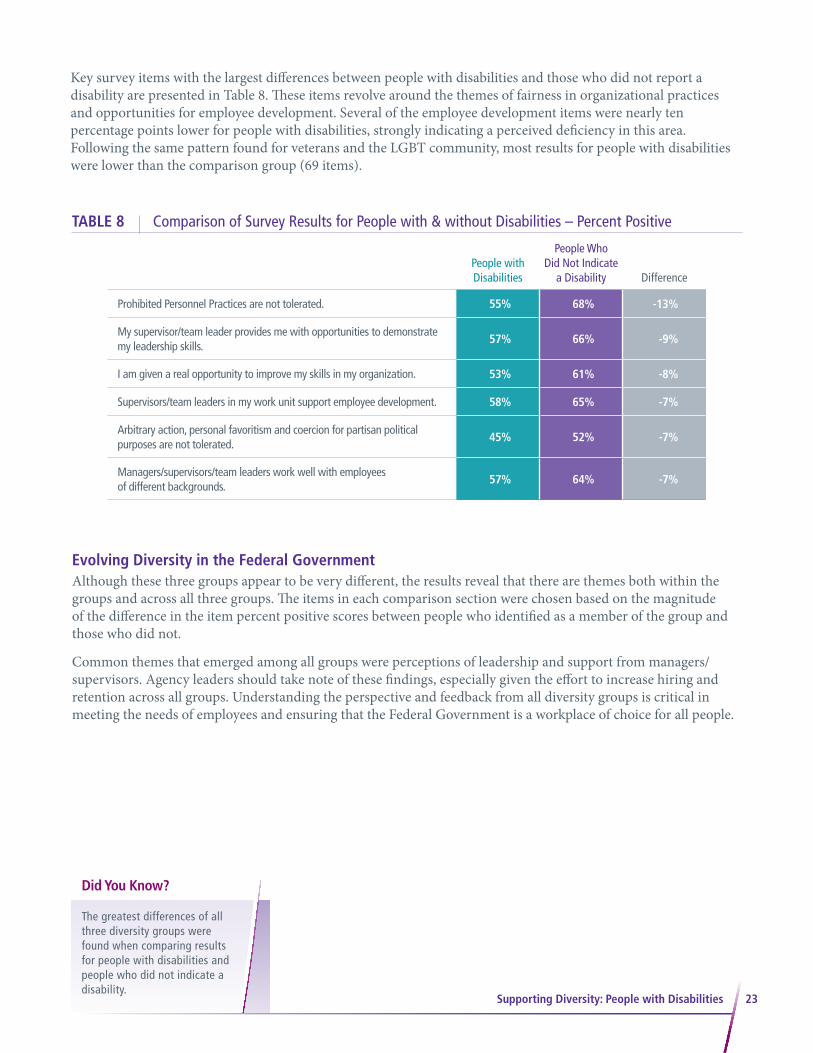
Key survey items with the largest differences between people with disabilities and those who did not report a disability are presented in Table 8. These items revolve around the themes of fairness in organizational practices and opportunities for employee development. Several of the employee development items were nearly ten percentage points lower for people with disabilities, strongly indicating a perceived deficiency in this area. Following the same pattern found for veterans and the LGBT community, most results for people with disabilities were lower than the comparison group (69 items).
Evolving Diversity in the Federal GovernmentAlthough these three groups appear to be very different, the results reveal that there are themes both within the groups and across all three groups. The items in each comparison section were chosen based on the magnitude of the difference in the item percent positive scores between people who identified as a member of the group and those who did not.
Common themes that emerged among all groups were perceptions of leadership and support from managers/supervisors. Agency leaders should take note of these findings, especially given the effort to increase hiring and retention across all groups. Understanding the perspective and feedback from all diversity groups is critical in meeting the needs of employees and ensuring that the Federal Government is a workplace of choice for all people.
TABLE 8 Comparison of Survey Results for People with & without Disabilities – Percent Positive
People with Disabilities
People Who Did Not Indicate
a Disability Difference
Prohibited Personnel Practices are not tolerated. 55% 68% -13%
My supervisor/team leader provides me with opportunities to demonstrate my leadership skills.
57% 66% -9%
I am given a real opportunity to improve my skills in my organization. 53% 61% -8%
Supervisors/team leaders in my work unit support employee development. 58% 65% -7%
Arbitrary action, personal favoritism and coercion for partisan political purposes are not tolerated.
45% 52% -7%
Managers/supervisors/team leaders work well with employees of different backgrounds.
57% 64% -7%
The greatest differences of all three diversity groups were found when comparing results for people with disabilities and people who did not indicate a disability.
Did You Know?

24Employees Influencing Change 24
Employees Influencing ChangeEmployees are the most valuable asset in the Federal Government. Their thoughts and opinions need to be heard. The FEVS is a useful tool for gathering information, empowering employees, and inspiring change, however, this tool is only as effective as the actions agencies take based on the survey results. Agencies must listen to what their employees are saying, implement action plans to improve performance, and convey to their employees the connection between the survey results and the positive actions made by their agency.
This section starts the process of the sharing of information and practices between agencies. Innovative and creative ideas based on survey results will help agencies to improve policies and practices, retain valued employees, and improve the Federal Government as a whole.
Change Into ActionAgencies have shared the practices or actions they took to improve several areas based on their FEVS results. Highlighted below are two agencies that have used employee feedback to create and implement actions in order to make their agency a better place to work. Table 9 and Table 10 display the targeted areas where action was taken to make improvements. Also, displayed are survey items related to the targeted area.
The actions NASA implemented were successful toward making improvements within the agency; in each area NASA targeted there was a positive increase from 2012 to 2013 in related survey items. NASA was most successful in the targeted area of utilizing employee input. As a result, positive responses about “survey results will be used to make the agency better” increased by four percentage points, compared to the governmentwide average this item decreased by four percentage points.
TABLE 9 National Aeronautics and Space Administration (NASA)
• Rebranded telework as “Work from Anywhere.”
• Created an educational messaging approach touching all layers of the organization.
• Targeted communication to all levels of leadership regarding connecting improvements made to specific survey results.
• Supervisors and managers discuss the value of employee input from surveys, and explain to employees how the survey results were used to make agency-wide improvements.
• Leadership and employees have shared understanding of the scope of telework/ “Work from Anywhere..“
• Noteworthy increase in employee perceptions of senior leadership support for work/life issues.
• Employees are more engaged and feel a part of agency change.
ActionTargeted Area
Targeted Area
Leadership
Support for
Work/Life
Balance
Using
Employee
Input
Outcome Related Survey Items
My supervisor supports my need to balance work and other life issues.
I believe the results of this survey will be used to make my agency a better place to work.
Senior leaders demonstrate support for work/life programs.
How satisfied are you with your involvement in decisions that affect your work?
Have you been notified that you are eligible to Telework?
25Employees Influencing Change 25
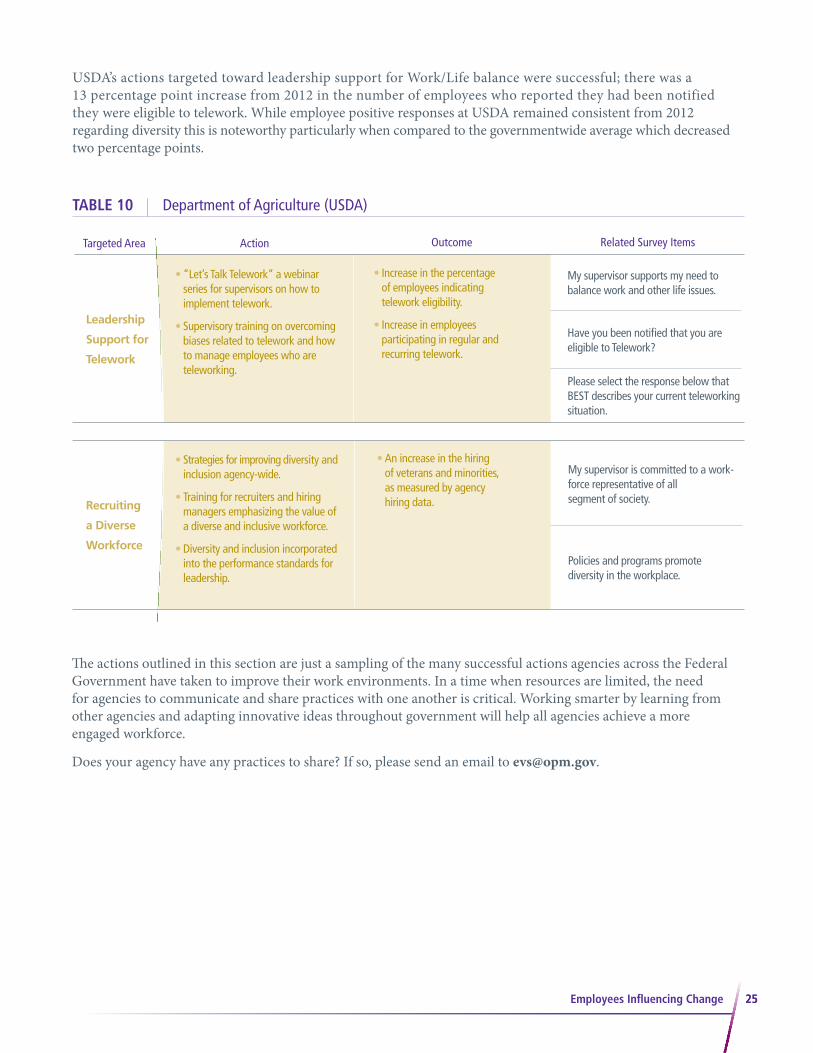
USDA’s actions targeted toward leadership support for Work/Life balance were successful; there was a 13 percentage point increase from 2012 in the number of employees who reported they had been notified they were eligible to telework. While employee positive responses at USDA remained consistent from 2012 regarding diversity this is noteworthy particularly when compared to the governmentwide average which decreased two percentage points.
TABLE 10 Department of Agriculture (USDA)
• “Let’s Talk Telework” a webinar series for supervisors on how to implement telework.
• Supervisory training on overcoming biases related to telework and how to manage employees who are teleworking.
• Strategies for improving diversity and inclusion agency-wide.
• Training for recruiters and hiring managers emphasizing the value of a diverse and inclusive workforce.
• Diversity and inclusion incorporated into the performance standards for leadership.
• Increase in the percentage of employees indicating telework eligibility.
• Increase in employees participating in regular and recurring telework.
• An increase in the hiring of veterans and minorities, as measured by agency hiring data.
ActionTargeted Area
Targeted Area
Leadership
Support for
Telework
Recruiting
a Diverse
Workforce
Outcome Related Survey Items
My supervisor is committed to a work-force representative of all segment of society.
Policies and programs promote diversity in the workplace.
My supervisor supports my need to balance work and other life issues.
Have you been notified that you are eligible to Telework?
Please select the response below that BEST describes your current teleworking situation.
The actions outlined in this section are just a sampling of the many successful actions agencies across the Federal Government have taken to improve their work environments. In a time when resources are limited, the need for agencies to communicate and share practices with one another is critical. Working smarter by learning from other agencies and adapting innovative ideas throughout government will help all agencies achieve a more engaged workforce.
Does your agency have any practices to share? If so, please send an email to [email protected].

26Conclusion
Conclusion
Employees Influencing Change – this is the core purpose of the Federal Employee Viewpoint Survey. From 2002 to 2013, Federal employees in all occupations and at all organizational levels have provided their opinions to leadership. The survey is a powerful tool for evaluating issues and driving success inside an agency, as well as a springboard for the sharing of ideas, practices and innovative methods with other agencies. The results of the survey enable agencies to identify areas where problems have been addressed, as well as areas where improvements are needed. Agencies can look across the years to better understand how internal and external forces have affected their workforce.
This year, the survey results continued the gradual slide first signaled by the 2012 results. All four HCAAF indices, the Employee Engagement Index, and Global Satisfaction index have declined from 2012 to 2013. Ongoing budget cuts, pay freezes and the threats of government shutdown stoke a future of uncertainty that affects each and every Federal employee. In this environment, what is most positive is that overall results have not declined precipitously. The Federal workforce is strong and resolute in their belief that the work they do is important. Federal employees continue to put in the extra effort to get the job done and remain committed to the missions of their organizations. They hold fast to their belief in serving the American public to the best of their abilities.
The items that had notable governmentwide increases dealt with workplace flexibilities and respect from supervisors. Specifically, supervisory support for balancing work and other life issues, employees feeling respected by their managers, and employee satisfaction with telework programs were the only items showing improvement at a govermentwide level. While managers are limited in their ability to provide financial awards and incentives to employees, efforts to support employees using levers under their control such as workplace flexibilities is notable.
In summary, the 2013 FEVS shows a strong and resolute group of employees, who are devoted to their agency and country, but are growing weary due to current policies and practices affecting agency operations and resources.

27
Appendix A
Appendix A
2013 Federal Employee Viewpoint Survey Methods
What Types of Questions are Included in the Survey? The 2013 survey is identical to the 2012 version. The 98-item survey includes 84 items that measure Federal employees’ perceptions about how effectively agencies manage their workforce, as well as 14 demographic items.
The survey is grouped into eight topic areas:
• Personal Work Experiences
• Work Unit
• Agency
• Supervisor/Team Leader
• Leadership
• Satisfaction
• Work/Life Programs
• Demographics
Who Participated? Full-time and part-time permanent, non-seasonal employees were eligible to participate in the survey.
How Many Employees Participated? Employees from 81 agencies, 37 departments/large agencies and 44 small/independent agencies, participated in this year’s survey. Of the 781,047 employees who received the FEVS, 376,577 completed the survey for a governmentwide response rate of 48.2 percent.
How Was the Survey Administered? The survey was a self-administered Web survey.
When Were Employees Surveyed? Agency launch dates were organized in two waves this year, with approximately 6-week administration periods beginning April 23rd and April 30th.
Data Weighting Data collected from the 2013 survey respondents were weighted to produce survey estimates that accurately represent the survey population. Unweighted data could produce biased estimates of population statistics. The weights developed for the 2013 FEVS take into account the variable probabilities of selection across the sample domains, nonresponse, and known demographic characteristics of the survey population. Thus, the final data set reflects the agency composition and demographic makeup of the Federal workforce within plus or minus 1 percentage point.

28Appendix A
Data Analysis In performing statistical analyses for this report, OPM employed a number of grouping procedures to simplify presentations. Most of the items had six response categories: Strongly Agree, Agree, Neither Agree nor Disagree, Disagree, Strongly Disagree, and No Basis to Judge/Do Not Know. In some instances, these responses are collapsed into one positive category (Strongly Agree and Agree), one negative category (Strongly Disagree and Disagree), and a neutral category (Neither Agree nor Disagree). We conducted analyses on all survey items for the various demographic categories. More detailed survey statistics are available in the published Federal Employee Viewpoint Survey Data volumes for this survey and can be downloaded from OPM’s Federal Employee Viewpoint Survey website: www.FedView.opm.gov.
“Do Not Know” and “No Basis to Judge” Responses Responses of Do Not Know/No Basis to Judge were removed before calculation of percentages. In 2006 and 2008, all responses were included in the calculations. To ensure comparability, data from previous years were recalculated, removing Do Not Know/No Basis to Judge responses, before any calculations with prior survey data were carried out.
Index Development The 2013 FEVS includes six indices: the four HCAAF (Human Capital Assessment and Accountability Framework) Indices, the Employee Engagement Index, and the Global Satisfaction Index. These indices provide a dependable and consistent method for Federal agencies to assess different facets of the workforce.
HCAAF Indices The HCAAF Indices were developed to help agencies meet the requirements of OPM’s mandate under the Chief Human Capital Officers Act of 2002 to design systems, set standards, and development metrics for assessing the management of Federal employees. The FEVS provides supplementary information to evaluate Leadership & Knowledge Management, Results-Oriented Performance Culture, and Talent Management, and provides an additional index on Job Satisfaction.
The Index scores were calculated by averaging the percent positive responses on the items within the Index. For example, if the item-level percent positive responses for a four-item Index were 20 percent, 40 percent, 60 percent, and 80 percent, the HCAAF rating would be the average of these four percentages (20 + 40 + 60 + 80) divided by 4 = 50 percent.
Employee Engagement Index The Employee Engagement Index was developed using a combination of theory and statistical analysis. Several items from the FEVS were selected based on a rationalization they would be representative of dimensions similar to other engagement “driver” measures. Items which used a satisfaction scale were excluded so as to differentiate between satisfaction and engagement.
An initial exploratory factor analysis revealed three factors consisting of 16 items (Leaders Lead, Supervision, and Intrinsic Work Experiences) with a single, underlying factor (Conditions Conducive to Employee Engagement). A confirmatory factor analysis was repeated with an independent dataset, which further supported the three-factor model. One item was removed for theoretical and statistical reasons, resulting in the 15-item, three-factor model.
Global Satisfaction Index OPM created the Global Satisfaction Index to provide a more comprehensive indicator of employees’ overall work satisfaction. The index is a combination of employees’ satisfaction with their job, their pay, and their organization, plus their willingness to recommend their organization as a good place to work.
29
Appendix B
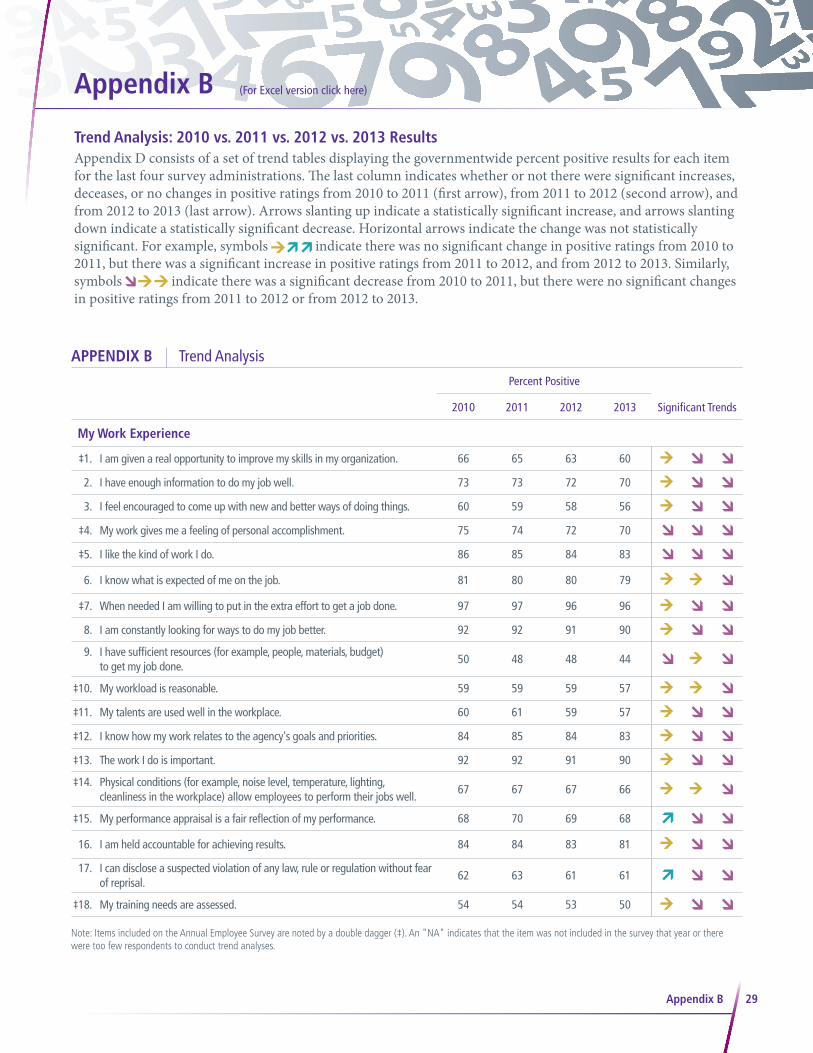
Trend Analysis: 2010 vs. 2011 vs. 2012 vs. 2013 ResultsAppendix D consists of a set of trend tables displaying the governmentwide percent positive results for each item for the last four survey administrations. The last column indicates whether or not there were significant increases, deceases, or no changes in positive ratings from 2010 to 2011 (first arrow), from 2011 to 2012 (second arrow), and from 2012 to 2013 (last arrow). Arrows slanting up indicate a statistically significant increase, and arrows slanting down indicate a statistically significant decrease. Horizontal arrows indicate the change was not statistically significant. For example, symbols indicate there was no significant change in positive ratings from 2010 to 2011, but there was a significant increase in positive ratings from 2011 to 2012, and from 2012 to 2013. Similarly, symbols indicate there was a significant decrease from 2010 to 2011, but there were no significant changes in positive ratings from 2011 to 2012 or from 2012 to 2013.
APPENDIX B Trend Analysis
Percent Positive
2010 2011 2012 2013 Significant Trends
My Work Experience
‡1. I am given a real opportunity to improve my skills in my organization. 66 65 63 60No significant change in positive ratings
from 2010 to 2011.
Significant decrease in positive ratings
from 2011 to 2012.
Significant increase in positive ratings
from 2012 to 2013.
2. I have enough information to do my job well. 73 73 72 70No significant change in positive ratings
from 2010 to 2011.
Significant decrease in positive ratings
from 2011 to 2012.
Significant increase in positive ratings
from 2012 to 2013.
3. I feel encouraged to come up with new and better ways of doing things. 60 59 58 56No significant change in positive ratings
from 2010 to 2011.
Significant decrease in positive ratings
from 2011 to 2012.
Significant increase in positive ratings
from 2012 to 2013.
‡4. My work gives me a feeling of personal accomplishment. 75 74 72 70No significant change in positive ratings
from 2010 to 2011.
Significant decrease in positive ratings
from 2011 to 2012.
Significant increase in positive ratings
from 2012 to 2013.
‡5. I like the kind of work I do. 86 85 84 83No significant change in positive ratings
from 2010 to 2011.
Significant decrease in positive ratings
from 2011 to 2012.
Significant increase in positive ratings
from 2012 to 2013.
6. I know what is expected of me on the job. 81 80 80 79No significant change in positive ratings
from 2010 to 2011.
Significant decrease in positive ratings
from 2011 to 2012.
Significant increase in positive ratings
from 2012 to 2013.
‡7. When needed I am willing to put in the extra effort to get a job done. 97 97 96 96No significant change in positive ratings
from 2010 to 2011.
Significant decrease in positive ratings
from 2011 to 2012.
Significant increase in positive ratings
from 2012 to 2013.
8. I am constantly looking for ways to do my job better. 92 92 91 90No significant change in positive ratings
from 2010 to 2011.
Significant decrease in positive ratings
from 2011 to 2012.
Significant increase in positive ratings
from 2012 to 2013.
9. I have sufficient resources (for example, people, materials, budget) to get my job done.
50 48 48 44No significant change in positive ratings
from 2010 to 2011.
Significant decrease in positive ratings
from 2011 to 2012.
Significant increase in positive ratings
from 2012 to 2013.
‡10. My workload is reasonable. 59 59 59 57No significant change in positive ratings
from 2010 to 2011.
Significant decrease in positive ratings
from 2011 to 2012.
Significant increase in positive ratings
from 2012 to 2013.
‡11. My talents are used well in the workplace. 60 61 59 57No significant change in positive ratings
from 2010 to 2011.
Significant decrease in positive ratings
from 2011 to 2012.
Significant increase in positive ratings
from 2012 to 2013.
‡12. I know how my work relates to the agency's goals and priorities. 84 85 84 83No significant change in positive ratings
from 2010 to 2011.
Significant decrease in positive ratings
from 2011 to 2012.
Significant increase in positive ratings
from 2012 to 2013.
‡13. The work I do is important. 92 92 91 90No significant change in positive ratings
from 2010 to 2011.
Significant decrease in positive ratings
from 2011 to 2012.
Significant increase in positive ratings
from 2012 to 2013.
‡14. Physical conditions (for example, noise level, temperature, lighting, cleanliness in the workplace) allow employees to perform their jobs well.
67 67 67 66No significant change in positive ratings
from 2010 to 2011.
Significant decrease in positive ratings
from 2011 to 2012.
Significant increase in positive ratings
from 2012 to 2013.
‡15. My performance appraisal is a fair reflection of my performance. 68 70 69 68No significant change in positive ratings
from 2010 to 2011.
Significant decrease in positive ratings
from 2011 to 2012.
Significant increase in positive ratings
from 2012 to 2013.
16. I am held accountable for achieving results. 84 84 83 81No significant change in positive ratings
from 2010 to 2011.
Significant decrease in positive ratings
from 2011 to 2012.
Significant increase in positive ratings
from 2012 to 2013.
17. I can disclose a suspected violation of any law, rule or regulation without fear of reprisal.
62 63 61 61No significant change in positive ratings
from 2010 to 2011.
Significant decrease in positive ratings
from 2011 to 2012.
Significant increase in positive ratings
from 2012 to 2013.
‡18. My training needs are assessed. 54 54 53 50No significant change in positive ratings
from 2010 to 2011.
Significant decrease in positive ratings
from 2011 to 2012.
Significant increase in positive ratings
from 2012 to 2013.
Note: Items included on the Annual Employee Survey are noted by a double dagger (‡). An "NA" indicates that the item was not included in the survey that year or there were too few respondents to conduct trend analyses.
Appendix B
(For Excel version click here)

30Appendix B
Percent Positive
2010 2011 2012 2013 Significant Trends
‡19. In my most recent performance appraisal, I understood what I had to do to be rated at different performance levels (for example, Fully Successful, Outstanding).
68 69 68 68No significant change in positive ratings
from 2010 to 2011.
Significant decrease in positive ratings
from 2011 to 2012.
Significant increase in positive ratings
from 2012 to 2013.
‡20. The people I work with cooperate to get the job done. 75 75 73 73No significant change in positive ratings
from 2010 to 2011.
Significant decrease in positive ratings
from 2011 to 2012.
Significant increase in positive ratings
from 2012 to 2013.
‡21. My work unit is able to recruit people with the right skills. 46 46 43 40No significant change in positive ratings
from 2010 to 2011.
Significant decrease in positive ratings
from 2011 to 2012.
Significant increase in positive ratings
from 2012 to 2013.
‡22. Promotions in my work unit are based on merit. 35 36 34 32No significant change in positive ratings
from 2010 to 2011.
Significant decrease in positive ratings
from 2011 to 2012.
Significant increase in positive ratings
from 2012 to 2013.
‡23. In my work unit, steps are taken to deal with a poor performer who cannot or will not improve.
31 31 29 28No significant change in positive ratings
from 2010 to 2011.
Significant decrease in positive ratings
from 2011 to 2012.
Significant increase in positive ratings
from 2012 to 2013.
‡24. In my work unit, differences in performance are recognized in a meaningful way.
36 36 34 31No significant change in positive ratings
from 2010 to 2011.
Significant decrease in positive ratings
from 2011 to 2012.
Significant increase in positive ratings
from 2012 to 2013.
25. Awards in my work unit depend on how well employees perform their jobs.
44 44 41 38No significant change in positive ratings
from 2010 to 2011.
Significant decrease in positive ratings
from 2011 to 2012.
Significant increase in positive ratings
from 2012 to 2013.
26. Employees in my work unit share job knowledge with each other. 73 73 72 72No significant change in positive ratings
from 2010 to 2011.
Significant decrease in positive ratings
from 2011 to 2012.
Significant increase in positive ratings
from 2012 to 2013.
27. The skill level in my work unit has improved in the past year. 56 57 55 52No significant change in positive ratings
from 2010 to 2011.
Significant decrease in positive ratings
from 2011 to 2012.
Significant increase in positive ratings
from 2012 to 2013.
28. How would you rate the overall quality of work done by your work unit? 82 82 83 83No significant change in positive ratings
from 2010 to 2011.
Significant decrease in positive ratings
from 2011 to 2012.
Significant increase in positive ratings
from 2012 to 2013.
My Agency
‡29. The workforce has the job-relevant knowledge and skills necessary to accomplish organizational goals.
72 73 72 70No significant change in positive ratings
from 2010 to 2011.
Significant decrease in positive ratings
from 2011 to 2012.
Significant increase in positive ratings
from 2012 to 2013.
‡30. Employees have a feeling of personal empowerment with respect to work processes.
48 48 45 43No significant change in positive ratings
from 2010 to 2011.
Significant decrease in positive ratings
from 2011 to 2012.
Significant increase in positive ratings
from 2012 to 2013.
31. Employees are recognized for providing high quality products and services. 51 51 48 46No significant change in positive ratings
from 2010 to 2011.
Significant decrease in positive ratings
from 2011 to 2012.
Significant increase in positive ratings
from 2012 to 2013.
‡32. Creativity and innovation are rewarded. 41 41 38 35No significant change in positive ratings
from 2010 to 2011.
Significant decrease in positive ratings
from 2011 to 2012.
Significant increase in positive ratings
from 2012 to 2013.
‡33. Pay raises depend on how well employees perform their jobs. 26 24 22 19No significant change in positive ratings
from 2010 to 2011.
Significant decrease in positive ratings
from 2011 to 2012.
Significant increase in positive ratings
from 2012 to 2013.
34. Policies and programs promote diversity in the workplace (for example, recruiting minorities and women, training in awareness of diversity issues, mentoring).
58 59 57 55No significant change in positive ratings
from 2010 to 2011.
Significant decrease in positive ratings
from 2011 to 2012.
Significant increase in positive ratings
from 2012 to 2013.
‡35. Employees are protected from health and safety hazards on the job. 76 78 77 76No significant change in positive ratings
from 2010 to 2011.
Significant decrease in positive ratings
from 2011 to 2012.
Significant increase in positive ratings
from 2012 to 2013.
‡36. My organization has prepared employees for potential security threats. 76 78 78 76No significant change in positive ratings
from 2010 to 2011.
Significant decrease in positive ratings
from 2011 to 2012.
Significant increase in positive ratings
from 2012 to 2013.
37. Arbitrary action, personal favoritism and coercion for partisan political purposes are not tolerated.
51 52 51 51No significant change in positive ratings
from 2010 to 2011.
Significant decrease in positive ratings
from 2011 to 2012.
Significant increase in positive ratings
from 2012 to 2013.
38. Prohibited Personnel Practices (for example, illegally discriminating for or against any employee/applicant, obstructing a person’s right to compete for employment, knowingly violating veterans’ preference requirements) are not tolerated.
66 67 66 65No significant change in positive ratings
from 2010 to 2011.
Significant decrease in positive ratings
from 2011 to 2012.
Significant increase in positive ratings
from 2012 to 2013.
39. My agency is successful at accomplishing its mission. 78 79 76 74No significant change in positive ratings
from 2010 to 2011.
Significant decrease in positive ratings
from 2011 to 2012.
Significant increase in positive ratings
from 2012 to 2013.
40. I recommend my organization as a good place to work. 70 69 67 63No significant change in positive ratings
from 2010 to 2011.
Significant decrease in positive ratings
from 2011 to 2012.
Significant increase in positive ratings
from 2012 to 2013.
41. I believe the results of this survey will be used to make my agency a better place to work.
45 45 42 38No significant change in positive ratings
from 2010 to 2011.
Significant decrease in positive ratings
from 2011 to 2012.
Significant increase in positive ratings
from 2012 to 2013.
Note: Items included on the Annual Employee Survey are noted by a double dagger (‡). An "NA" indicates that the item was not included in the survey that year or there were too few respondents to conduct trend analyses.
APPENDIX B Trend Analysis (cont’d)
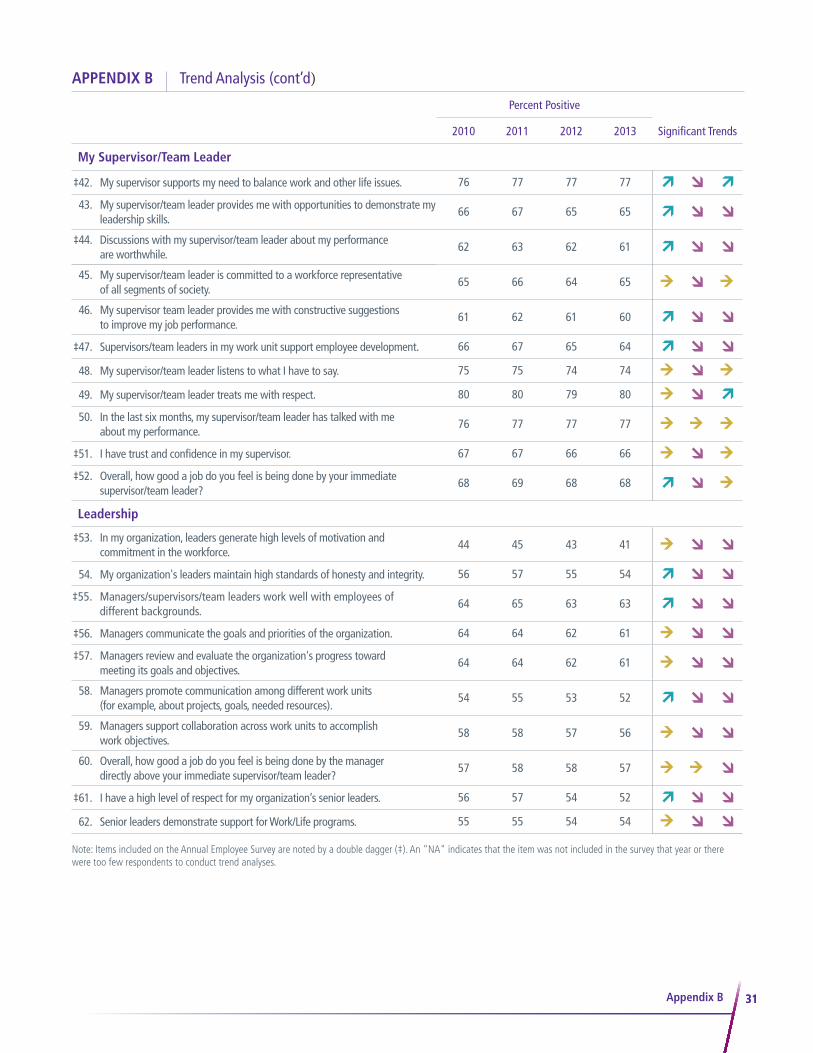
3131Appendix B
Percent Positive
2010 2011 2012 2013 Significant Trends
My Supervisor/Team Leader
‡42. My supervisor supports my need to balance work and other life issues. 76 77 77 77No significant change in positive ratings
from 2010 to 2011.
Significant decrease in positive ratings
from 2011 to 2012.
Significant increase in positive ratings
from 2012 to 2013.
43. My supervisor/team leader provides me with opportunities to demonstrate my leadership skills.
66 67 65 65No significant change in positive ratings
from 2010 to 2011.
Significant decrease in positive ratings
from 2011 to 2012.
Significant increase in positive ratings
from 2012 to 2013.
‡44. Discussions with my supervisor/team leader about my performance are worthwhile.
62 63 62 61No significant change in positive ratings
from 2010 to 2011.
Significant decrease in positive ratings
from 2011 to 2012.
Significant increase in positive ratings
from 2012 to 2013.
45. My supervisor/team leader is committed to a workforce representative of all segments of society.
65 66 64 65No significant change in positive ratings
from 2010 to 2011.
Significant decrease in positive ratings
from 2011 to 2012.
Significant increase in positive ratings
from 2012 to 2013.
46. My supervisor team leader provides me with constructive suggestions to improve my job performance.
61 62 61 60No significant change in positive ratings
from 2010 to 2011.
Significant decrease in positive ratings
from 2011 to 2012.
Significant increase in positive ratings
from 2012 to 2013.
‡47. Supervisors/team leaders in my work unit support employee development. 66 67 65 64No significant change in positive ratings
from 2010 to 2011.
Significant decrease in positive ratings
from 2011 to 2012.
Significant increase in positive ratings
from 2012 to 2013.
48. My supervisor/team leader listens to what I have to say. 75 75 74 74No significant change in positive ratings
from 2010 to 2011.
Significant decrease in positive ratings
from 2011 to 2012.
Significant increase in positive ratings
from 2012 to 2013.
49. My supervisor/team leader treats me with respect. 80 80 79 80No significant change in positive ratings
from 2010 to 2011.
Significant decrease in positive ratings
from 2011 to 2012.
Significant increase in positive ratings
from 2012 to 2013.
50. In the last six months, my supervisor/team leader has talked with me about my performance.
76 77 77 77No significant change in positive ratings
from 2010 to 2011.
Significant decrease in positive ratings
from 2011 to 2012.
Significant increase in positive ratings
from 2012 to 2013.
‡51. I have trust and confidence in my supervisor. 67 67 66 66No significant change in positive ratings
from 2010 to 2011.
Significant decrease in positive ratings
from 2011 to 2012.
Significant increase in positive ratings
from 2012 to 2013.
‡52. Overall, how good a job do you feel is being done by your immediate supervisor/team leader?
68 69 68 68No significant change in positive ratings
from 2010 to 2011.
Significant decrease in positive ratings
from 2011 to 2012.
Significant increase in positive ratings
from 2012 to 2013.
Leadership
‡53. In my organization, leaders generate high levels of motivation and commitment in the workforce.
44 45 43 41No significant change in positive ratings
from 2010 to 2011.
Significant decrease in positive ratings
from 2011 to 2012.
Significant increase in positive ratings
from 2012 to 2013.
54. My organization's leaders maintain high standards of honesty and integrity. 56 57 55 54No significant change in positive ratings
from 2010 to 2011.
Significant decrease in positive ratings
from 2011 to 2012.
Significant increase in positive ratings
from 2012 to 2013.
‡55. Managers/supervisors/team leaders work well with employees of different backgrounds.
64 65 63 63No significant change in positive ratings
from 2010 to 2011.
Significant decrease in positive ratings
from 2011 to 2012.
Significant increase in positive ratings
from 2012 to 2013.
‡56. Managers communicate the goals and priorities of the organization. 64 64 62 61No significant change in positive ratings
from 2010 to 2011.
Significant decrease in positive ratings
from 2011 to 2012.
Significant increase in positive ratings
from 2012 to 2013.
‡57. Managers review and evaluate the organization's progress toward meeting its goals and objectives.
64 64 62 61No significant change in positive ratings
from 2010 to 2011.
Significant decrease in positive ratings
from 2011 to 2012.
Significant increase in positive ratings
from 2012 to 2013.
58. Managers promote communication among different work units (for example, about projects, goals, needed resources).
54 55 53 52No significant change in positive ratings
from 2010 to 2011.
Significant decrease in positive ratings
from 2011 to 2012.
Significant increase in positive ratings
from 2012 to 2013.
59. Managers support collaboration across work units to accomplish work objectives.
58 58 57 56No significant change in positive ratings
from 2010 to 2011.
Significant decrease in positive ratings
from 2011 to 2012.
Significant increase in positive ratings
from 2012 to 2013.
60. Overall, how good a job do you feel is being done by the manager directly above your immediate supervisor/team leader?
57 58 58 57No significant change in positive ratings
from 2010 to 2011.
Significant decrease in positive ratings
from 2011 to 2012.
Significant increase in positive ratings
from 2012 to 2013.
‡61. I have a high level of respect for my organization’s senior leaders. 56 57 54 52No significant change in positive ratings
from 2010 to 2011.
Significant decrease in positive ratings
from 2011 to 2012.
Significant increase in positive ratings
from 2012 to 2013.
62. Senior leaders demonstrate support for Work/Life programs. 55 55 54 54No significant change in positive ratings
from 2010 to 2011.
Significant decrease in positive ratings
from 2011 to 2012.
Significant increase in positive ratings
from 2012 to 2013.
Note: Items included on the Annual Employee Survey are noted by a double dagger (‡). An "NA" indicates that the item was not included in the survey that year or there were too few respondents to conduct trend analyses.
APPENDIX B Trend Analysis (cont’d)

32Appendix B
APPENDIX B Trend Analysis (cont’d)Percent Positive
2010 2011 2012 2013 Significant Trends
My Satisfaction
‡63. How satisfied are you with your involvement in decisions that affect your work?
55 53 52 50No significant change in positive ratings
from 2010 to 2011.
Significant decrease in positive ratings
from 2011 to 2012.
Significant increase in positive ratings
from 2012 to 2013.
‡64. How satisfied are you with the information you receive from management on what's going on in your organization?
51 51 48 48No significant change in positive ratings
from 2010 to 2011.
Significant decrease in positive ratings
from 2011 to 2012.
Significant increase in positive ratings
from 2012 to 2013.
‡65. How satisfied are you with the recognition you receive for doing a good job? 52 51 48 45No significant change in positive ratings
from 2010 to 2011.
Significant decrease in positive ratings
from 2011 to 2012.
Significant increase in positive ratings
from 2012 to 2013.
‡66. How satisfied are you with the policies and practices of your senior leaders? 45 46 43 41No significant change in positive ratings
from 2010 to 2011.
Significant decrease in positive ratings
from 2011 to 2012.
Significant increase in positive ratings
from 2012 to 2013.
‡67. How satisfied are you with your opportunity to get a better job in your organization?
42 40 36 34No significant change in positive ratings
from 2010 to 2011.
Significant decrease in positive ratings
from 2011 to 2012.
Significant increase in positive ratings
from 2012 to 2013.
‡68. How satisfied are you with the training you receive for your present job? 56 55 54 50No significant change in positive ratings
from 2010 to 2011.
Significant decrease in positive ratings
from 2011 to 2012.
Significant increase in positive ratings
from 2012 to 2013.
‡69. Considering everything, how satisfied are you with your job? 72 71 68 65No significant change in positive ratings
from 2010 to 2011.
Significant decrease in positive ratings
from 2011 to 2012.
Significant increase in positive ratings
from 2012 to 2013.
‡70. Considering everything, how satisfied are you with your pay? 66 62 59 54No significant change in positive ratings
from 2010 to 2011.
Significant decrease in positive ratings
from 2011 to 2012.
Significant increase in positive ratings
from 2012 to 2013.
71. Considering everything, how satisfied are you with your organization? 62 62 59 56No significant change in positive ratings
from 2010 to 2011.
Significant decrease in positive ratings
from 2011 to 2012.
Significant increase in positive ratings
from 2012 to 2013.
Work/Life Programs
79 - 84. How satisfied are you with the following Work/Life programs in your agency?*
79. Telework — 70 73 76 NA Significant decrease in positive ratings
from 2011 to 2012.
Significant increase in positive ratings
from 2012 to 2013.
80. Alternative Work Schedules (AWS) — 89 89 89 NA Significant decrease in positive ratings
from 2011 to 2012.
No significant change in positive ratings
from 2010 to 2011.
81. Health and Wellness Programs (for example, exercise, medical screening, quit smoking programs)
— 81 80 80 NA Significant decrease in positive ratings
from 2011 to 2012.
No significant change in positive ratings
from 2010 to 2011.
82. Employee Assistance Program (EAP) — 78 76 74 NA Significant decrease in positive ratings
from 2011 to 2012.
No significant change in positive ratings
from 2010 to 2011.
83. Child Care Programs (for example, daycare, parenting classes, parenting support groups)
— 73 72 70 NA Significant decrease in positive ratings
from 2011 to 2012.
No significant change in positive ratings
from 2010 to 2011.
84. Elder Care Programs (for example, support groups, speakers) — 67 68 66 NA Significant decrease in positive ratings
from 2011 to 2012.
No significant change in positive ratings
from 2010 to 2011.
* The 2011-2013 work/life program satisfaction results only include employees who indicated that they participated in the program. Because participation questions were new in 2011, percentages from 2010 are not displayed.
Note: Items included on the Annual Employee Survey are noted by a double dagger (‡). An “NA” indicates that the item was not included in the survey that year or there were too few respondents to conduct trend analyses.

33
Appendix C (For Excel version click here)
APPENDIX C Governmentwide Respondent Characteristics (unweighted)
Appendix C
Number Responded Percentage
Work Location
Headquarters 137,468 39
Field 212,187 61
Supervisory Status
Non-Supervisor 233,579 66
Team Leader 47,593 14
Supervisor 44,633 13
Manager 21,376 6
Executive 5,408 2
Gender
Male 179,660 52
Female 169,181 49
Ethnicity
Hispanic/Latino 28,904 8
Not Hispanic/Latino 316,530 92
Race or National Origin
American Indian or Alaska Native 7,805 2
Asian 16,310 5
Black or African American 54,014 16
Native Hawaiian or Other Pacific Islander 2,357 1
White 242,974 73
Two or More Races 11,645 4
Age Group
25 and Under 3,469 1
26-29 Years 12,972 4
30-39 Years 58,747 17
40-49 Years 96,647 28
50-59 Years 124,996 36
60 or Older 48,009 14
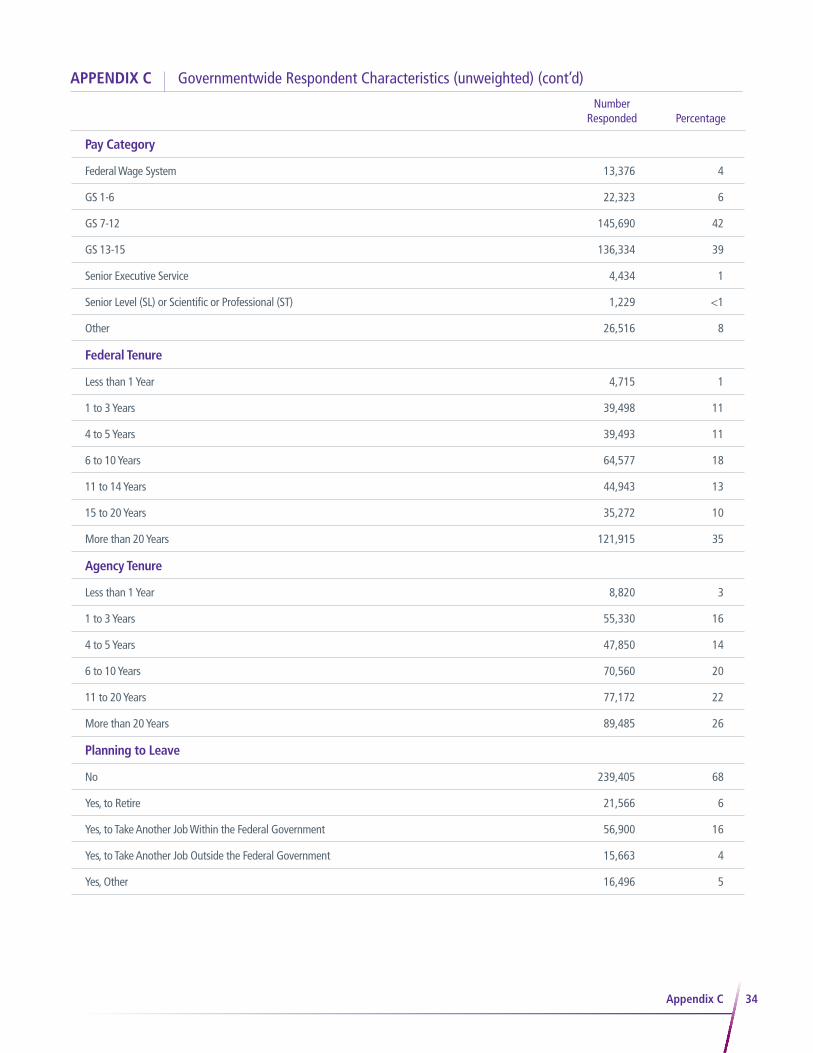
34
APPENDIX C Governmentwide Respondent Characteristics (unweighted) (cont’d)
Number Responded Percentage
Appendix C
Pay Category
Federal Wage System 13,376 4
GS 1-6 22,323 6
GS 7-12 145,690 42
GS 13-15 136,334 39
Senior Executive Service 4,434 1
Senior Level (SL) or Scientific or Professional (ST) 1,229 <1
Other 26,516 8
Federal Tenure
Less than 1 Year 4,715 1
1 to 3 Years 39,498 11
4 to 5 Years 39,493 11
6 to 10 Years 64,577 18
11 to 14 Years 44,943 13
15 to 20 Years 35,272 10
More than 20 Years 121,915 35
Agency Tenure
Less than 1 Year 8,820 3
1 to 3 Years 55,330 16
4 to 5 Years 47,850 14
6 to 10 Years 70,560 20
11 to 20 Years 77,172 22
More than 20 Years 89,485 26
Planning to Leave
No 239,405 68
Yes, to Retire 21,566 6
Yes, to Take Another Job Within the Federal Government 56,900 16
Yes, to Take Another Job Outside the Federal Government 15,663 4
Yes, Other 16,496 5
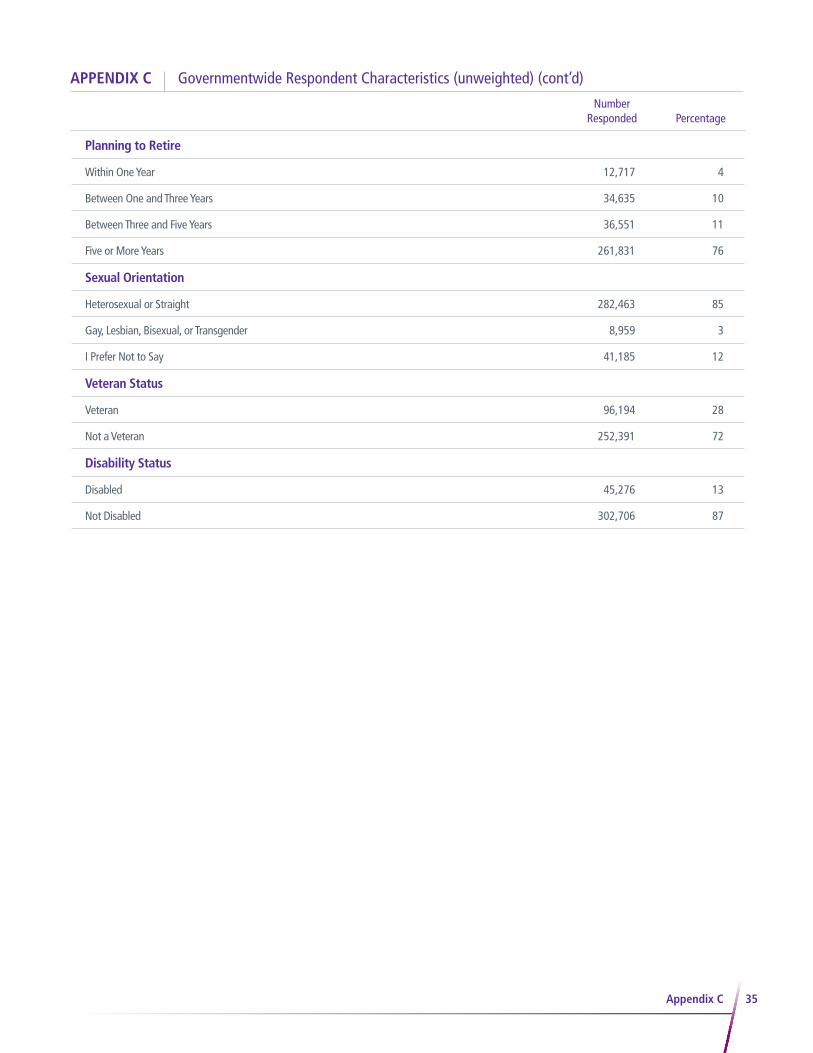
35
APPENDIX C Governmentwide Respondent Characteristics (unweighted) (cont’d)
Appendix C
Planning to Retire
Within One Year 12,717 4
Between One and Three Years 34,635 10
Between Three and Five Years 36,551 11
Five or More Years 261,831 76
Sexual Orientation
Heterosexual or Straight 282,463 85
Gay, Lesbian, Bisexual, or Transgender 8,959 3
I Prefer Not to Say 41,185 12
Veteran Status
Veteran 96,194 28
Not a Veteran 252,391 72
Disability Status
Disabled 45,276 13
Not Disabled 302,706 87
Number Responded Percentage
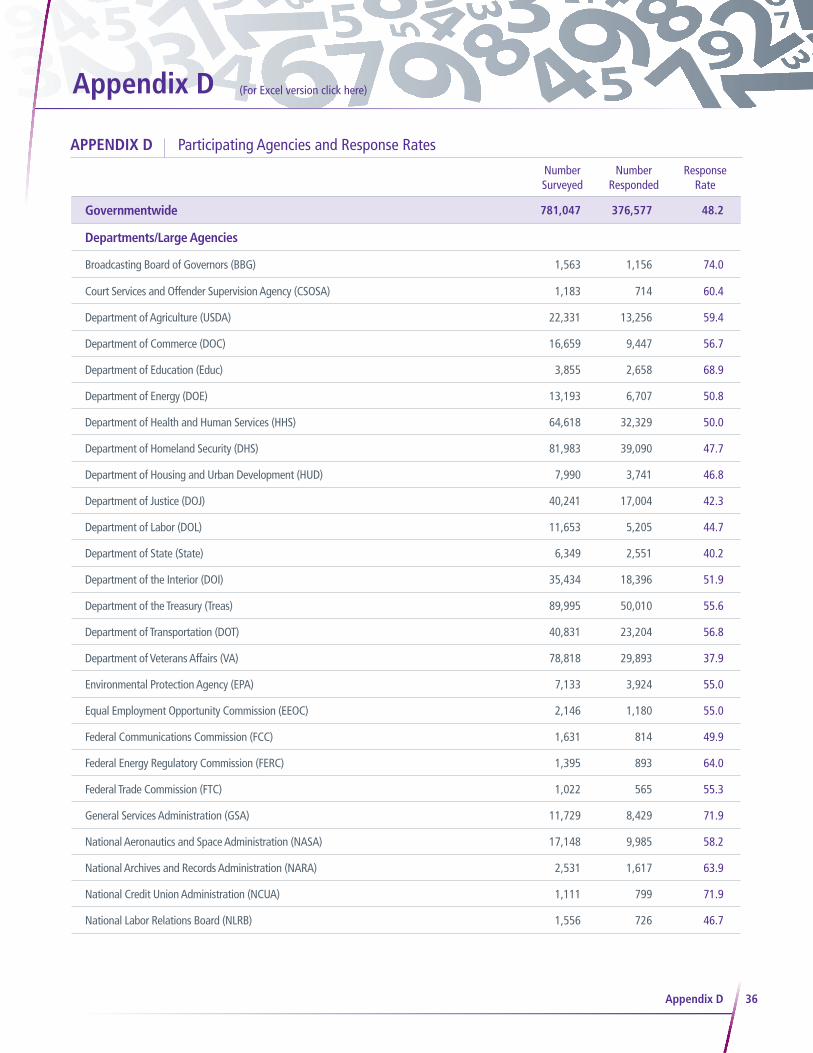
36
Appendix D (For Excel version click here)
APPENDIX D Participating Agencies and Response Rates
Appendix D
Number Surveyed
Number Responded
Response Rate
Governmentwide 781,047 376,577 48.2
Departments/Large Agencies
Broadcasting Board of Governors (BBG) 1,563 1,156 74.0
Court Services and Offender Supervision Agency (CSOSA) 1,183 714 60.4
Department of Agriculture (USDA) 22,331 13,256 59.4
Department of Commerce (DOC) 16,659 9,447 56.7
Department of Education (Educ) 3,855 2,658 68.9
Department of Energy (DOE) 13,193 6,707 50.8
Department of Health and Human Services (HHS) 64,618 32,329 50.0
Department of Homeland Security (DHS) 81,983 39,090 47.7
Department of Housing and Urban Development (HUD) 7,990 3,741 46.8
Department of Justice (DOJ) 40,241 17,004 42.3
Department of Labor (DOL) 11,653 5,205 44.7
Department of State (State) 6,349 2,551 40.2
Department of the Interior (DOI) 35,434 18,396 51.9
Department of the Treasury (Treas) 89,995 50,010 55.6
Department of Transportation (DOT) 40,831 23,204 56.8
Department of Veterans Affairs (VA) 78,818 29,893 37.9
Environmental Protection Agency (EPA) 7,133 3,924 55.0
Equal Employment Opportunity Commission (EEOC) 2,146 1,180 55.0
Federal Communications Commission (FCC) 1,631 814 49.9
Federal Energy Regulatory Commission (FERC) 1,395 893 64.0
Federal Trade Commission (FTC) 1,022 565 55.3
General Services Administration (GSA) 11,729 8,429 71.9
National Aeronautics and Space Administration (NASA) 17,148 9,985 58.2
National Archives and Records Administration (NARA) 2,531 1,617 63.9
National Credit Union Administration (NCUA) 1,111 799 71.9
National Labor Relations Board (NLRB) 1,556 726 46.7
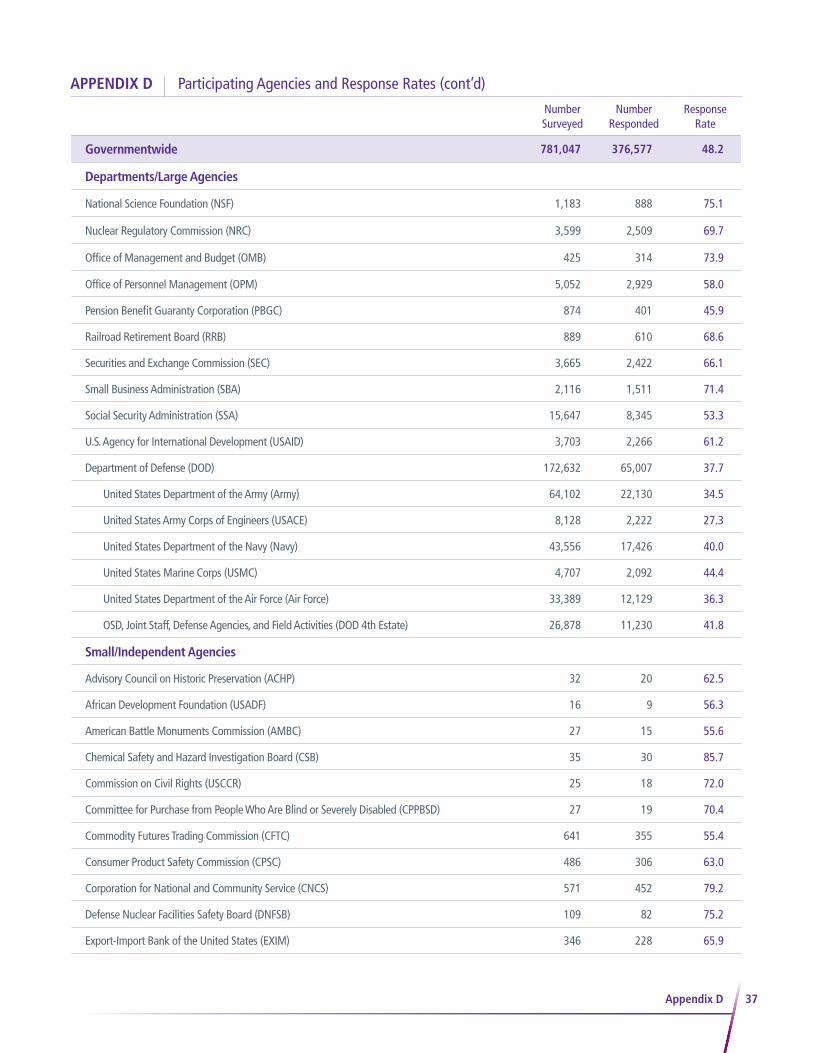
37
APPENDIX D Participating Agencies and Response Rates (cont’d)
Appendix D
Departments/Large Agencies
National Science Foundation (NSF) 1,183 888 75.1
Nuclear Regulatory Commission (NRC) 3,599 2,509 69.7
Office of Management and Budget (OMB) 425 314 73.9
Office of Personnel Management (OPM) 5,052 2,929 58.0
Pension Benefit Guaranty Corporation (PBGC) 874 401 45.9
Railroad Retirement Board (RRB) 889 610 68.6
Securities and Exchange Commission (SEC) 3,665 2,422 66.1
Small Business Administration (SBA) 2,116 1,511 71.4
Social Security Administration (SSA) 15,647 8,345 53.3
U.S. Agency for International Development (USAID) 3,703 2,266 61.2
Department of Defense (DOD) 172,632 65,007 37.7
United States Department of the Army (Army) 64,102 22,130 34.5
United States Army Corps of Engineers (USACE) 8,128 2,222 27.3
United States Department of the Navy (Navy) 43,556 17,426 40.0
United States Marine Corps (USMC) 4,707 2,092 44.4
United States Department of the Air Force (Air Force) 33,389 12,129 36.3
OSD, Joint Staff, Defense Agencies, and Field Activities (DOD 4th Estate) 26,878 11,230 41.8
Small/Independent Agencies
Advisory Council on Historic Preservation (ACHP) 32 20 62.5
African Development Foundation (USADF) 16 9 56.3
American Battle Monuments Commission (AMBC) 27 15 55.6
Chemical Safety and Hazard Investigation Board (CSB) 35 30 85.7
Commission on Civil Rights (USCCR) 25 18 72.0
Committee for Purchase from People Who Are Blind or Severely Disabled (CPPBSD) 27 19 70.4
Commodity Futures Trading Commission (CFTC) 641 355 55.4
Consumer Product Safety Commission (CPSC) 486 306 63.0
Corporation for National and Community Service (CNCS) 571 452 79.2
Defense Nuclear Facilities Safety Board (DNFSB) 109 82 75.2
Export-Import Bank of the United States (EXIM) 346 228 65.9
Number Surveyed
Number Responded
Response Rate
Governmentwide 781,047 376,577 48.2
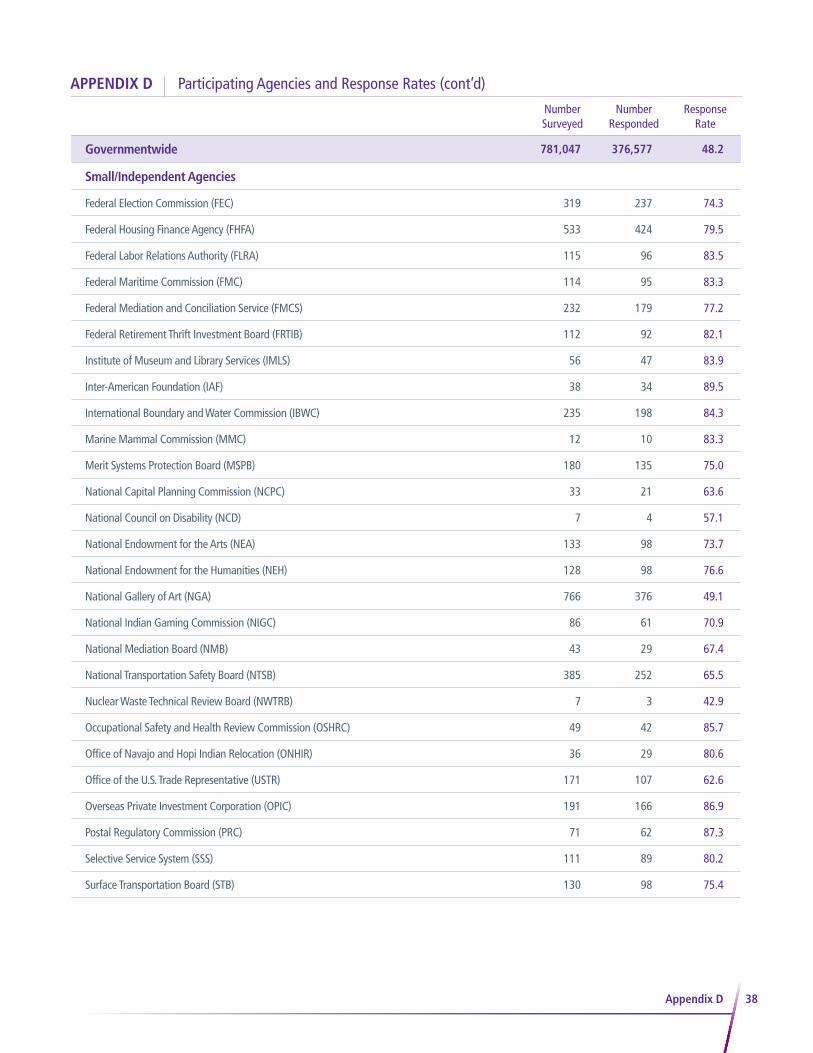
38
APPENDIX D Participating Agencies and Response Rates (cont’d)
Appendix D
Small/Independent Agencies
Federal Election Commission (FEC) 319 237 74.3
Federal Housing Finance Agency (FHFA) 533 424 79.5
Federal Labor Relations Authority (FLRA) 115 96 83.5
Federal Maritime Commission (FMC) 114 95 83.3
Federal Mediation and Conciliation Service (FMCS) 232 179 77.2
Federal Retirement Thrift Investment Board (FRTIB) 112 92 82.1
Institute of Museum and Library Services (IMLS) 56 47 83.9
Inter-American Foundation (IAF) 38 34 89.5
International Boundary and Water Commission (IBWC) 235 198 84.3
Marine Mammal Commission (MMC) 12 10 83.3
Merit Systems Protection Board (MSPB) 180 135 75.0
National Capital Planning Commission (NCPC) 33 21 63.6
National Council on Disability (NCD) 7 4 57.1
National Endowment for the Arts (NEA) 133 98 73.7
National Endowment for the Humanities (NEH) 128 98 76.6
National Gallery of Art (NGA) 766 376 49.1
National Indian Gaming Commission (NIGC) 86 61 70.9
National Mediation Board (NMB) 43 29 67.4
National Transportation Safety Board (NTSB) 385 252 65.5
Nuclear Waste Technical Review Board (NWTRB) 7 3 42.9
Occupational Safety and Health Review Commission (OSHRC) 49 42 85.7
Office of Navajo and Hopi Indian Relocation (ONHIR) 36 29 80.6
Office of the U.S. Trade Representative (USTR) 171 107 62.6
Overseas Private Investment Corporation (OPIC) 191 166 86.9
Postal Regulatory Commission (PRC) 71 62 87.3
Selective Service System (SSS) 111 89 80.2
Surface Transportation Board (STB) 130 98 75.4
Number Surveyed
Number Responded
Response Rate
Governmentwide 781,047 376,577 48.2

39
APPENDIX D Participating Agencies and Response Rates (cont’d)
Appendix D
Small/Independent Agencies
U.S. Access Board (USAB) 27 20 74.1
U.S. International Trade Commission (USITC) 303 258 85.1
U.S. Office of Government Ethics (OGE) 62 55 88.7
U.S. Office of Special Counsel (OSC) 95 82 86.3
U.S. Trade and Development Agency (USTDA) 37 31 83.8
Woodrow Wilson International Center for Scholars (WWICS) 32 20 62.5
Number Surveyed
Number Responded
Response Rate
Governmentwide 781,047 376,577 48.2
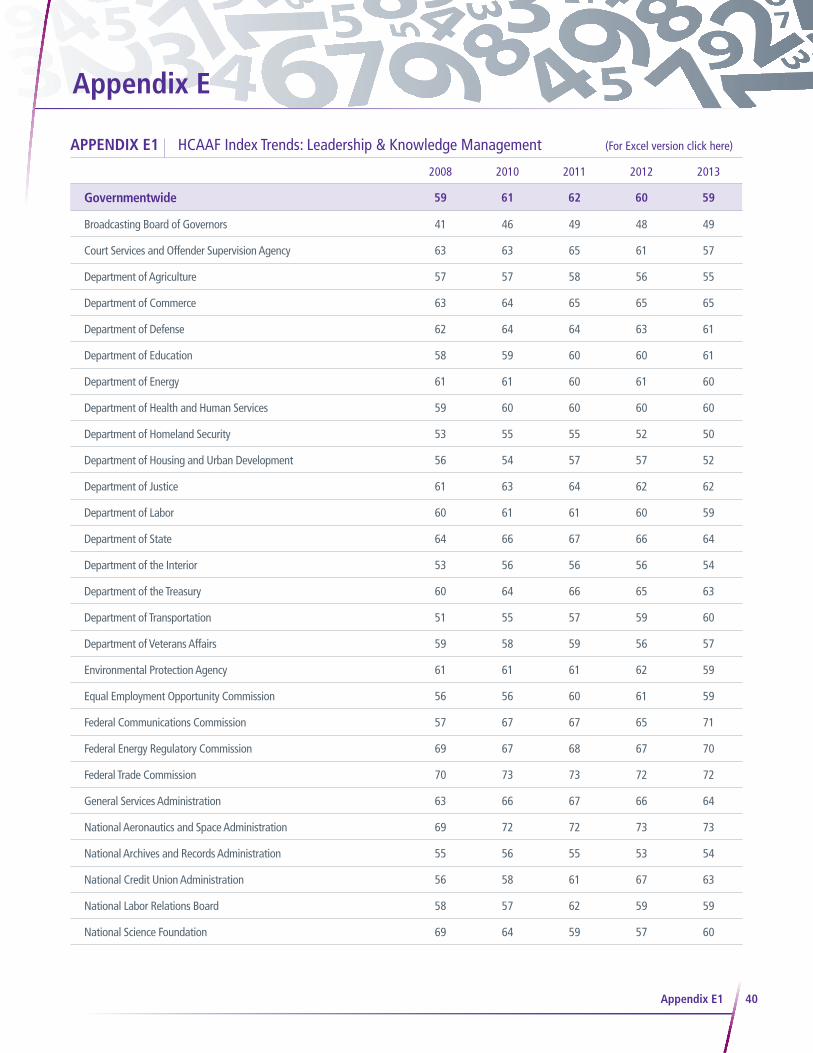
40
Appendix E
APPENDIX E1 HCAAF Index Trends: Leadership & Knowledge Management
Appendix E1
2008 2010 2011 2012 2013
Governmentwide 59 61 62 60 59
Broadcasting Board of Governors 41 46 49 48 49
Court Services and Offender Supervision Agency 63 63 65 61 57
Department of Agriculture 57 57 58 56 55
Department of Commerce 63 64 65 65 65
Department of Defense 62 64 64 63 61
Department of Education 58 59 60 60 61
Department of Energy 61 61 60 61 60
Department of Health and Human Services 59 60 60 60 60
Department of Homeland Security 53 55 55 52 50
Department of Housing and Urban Development 56 54 57 57 52
Department of Justice 61 63 64 62 62
Department of Labor 60 61 61 60 59
Department of State 64 66 67 66 64
Department of the Interior 53 56 56 56 54
Department of the Treasury 60 64 66 65 63
Department of Transportation 51 55 57 59 60
Department of Veterans Affairs 59 58 59 56 57
Environmental Protection Agency 61 61 61 62 59
Equal Employment Opportunity Commission 56 56 60 61 59
Federal Communications Commission 57 67 67 65 71
Federal Energy Regulatory Commission 69 67 68 67 70
Federal Trade Commission 70 73 73 72 72
General Services Administration 63 66 67 66 64
National Aeronautics and Space Administration 69 72 72 73 73
National Archives and Records Administration 55 56 55 53 54
National Credit Union Administration 56 58 61 67 63
National Labor Relations Board 58 57 62 59 59
National Science Foundation 69 64 59 57 60
(For Excel version click here)

41
APPENDIX E1 HCAAF Index Trends: Leadership & Knowledge Management (cont’d)2008 2010 2011 2012 2013
Governmentwide 59 61 62 60 59
Nuclear Regulatory Commission 76 78 78 74 73
Office of Management and Budget 66 54 51 61 57
Office of Personnel Management 62 63 66 65 66
Pension Benefit Guaranty Corporation 62 66 65 63 59
Railroad Retirement Board 59 60 61 63 64
Securities and Exchange Commission 61 57 55 56 57
Small Business Administration 60 59 61 60 60
Social Security Administration 63 66 69 65 62
U.S. Agency for International Development 62 57 60 62 60
The Leadership & Knowledge Management Index indicates the extent to which employees hold their leadership in high regard, both overall and on specific facets of leadership. It is made up of items:
10. My workload is reasonable.
35. Employees are protected from health and safety hazards on the job.
36. My organization has prepared employees for potential security threats.
51. I have trust and confidence in my supervisor.
52. Overall, how good a job do you feel is being done by your immediate supervisor/team leader?
53. In my organization, leaders generate high levels of motivation and commitment in the workforce.
55. Managers/supervisors/team leaders work well with employees of different backgrounds.
56. Managers communicate the goals and priorities of the organization.
57. Managers review and evaluate the organization's progress toward meeting its goals and objectives.
61. I have a high level of respect for my organization’s senior leaders.
64. How satisfied are you with the information you receive from management on what's going on in your organization?
66. How satisfied are you with the policies and practices of your senior leaders?
Appendix E1
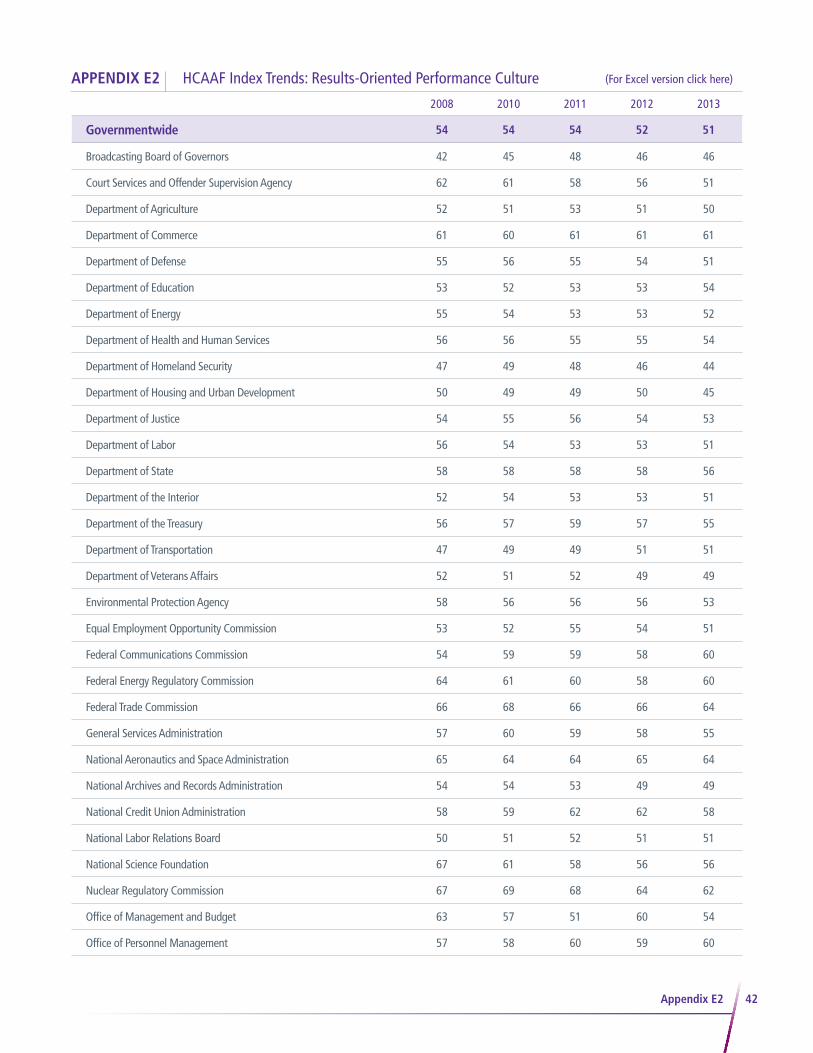
42
APPENDIX E2 HCAAF Index Trends: Results-Oriented Performance Culture
Appendix E2
2008 2010 2011 2012 2013
Governmentwide 54 54 54 52 51
Broadcasting Board of Governors 42 45 48 46 46
Court Services and Offender Supervision Agency 62 61 58 56 51
Department of Agriculture 52 51 53 51 50
Department of Commerce 61 60 61 61 61
Department of Defense 55 56 55 54 51
Department of Education 53 52 53 53 54
Department of Energy 55 54 53 53 52
Department of Health and Human Services 56 56 55 55 54
Department of Homeland Security 47 49 48 46 44
Department of Housing and Urban Development 50 49 49 50 45
Department of Justice 54 55 56 54 53
Department of Labor 56 54 53 53 51
Department of State 58 58 58 58 56
Department of the Interior 52 54 53 53 51
Department of the Treasury 56 57 59 57 55
Department of Transportation 47 49 49 51 51
Department of Veterans Affairs 52 51 52 49 49
Environmental Protection Agency 58 56 56 56 53
Equal Employment Opportunity Commission 53 52 55 54 51
Federal Communications Commission 54 59 59 58 60
Federal Energy Regulatory Commission 64 61 60 58 60
Federal Trade Commission 66 68 66 66 64
General Services Administration 57 60 59 58 55
National Aeronautics and Space Administration 65 64 64 65 64
National Archives and Records Administration 54 54 53 49 49
National Credit Union Administration 58 59 62 62 58
National Labor Relations Board 50 51 52 51 51
National Science Foundation 67 61 58 56 56
Nuclear Regulatory Commission 67 69 68 64 62
Office of Management and Budget 63 57 51 60 54
Office of Personnel Management 57 58 60 59 60
(For Excel version click here)
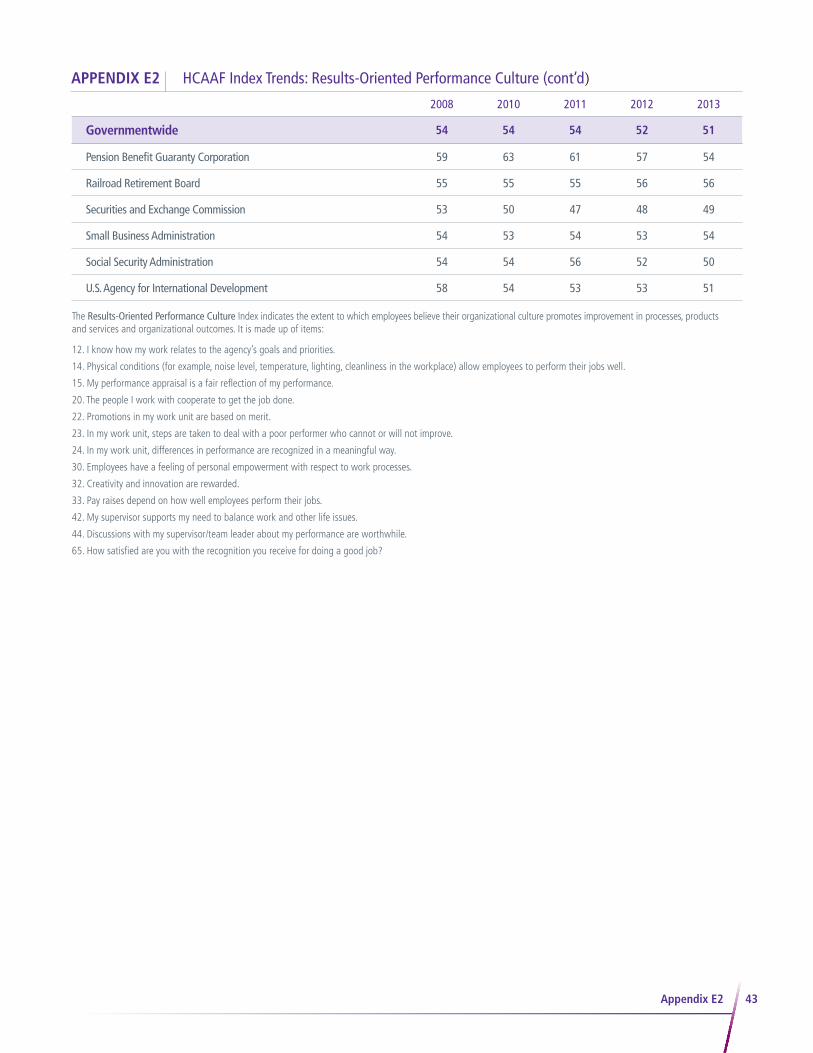
43
APPENDIX E2 HCAAF Index Trends: Results-Oriented Performance Culture (cont’d)
Pension Benefit Guaranty Corporation 59 63 61 57 54
Railroad Retirement Board 55 55 55 56 56
Securities and Exchange Commission 53 50 47 48 49
Small Business Administration 54 53 54 53 54
Social Security Administration 54 54 56 52 50
U.S. Agency for International Development 58 54 53 53 51
The Results-Oriented Performance Culture Index indicates the extent to which employees believe their organizational culture promotes improvement in processes, products and services and organizational outcomes. It is made up of items:
12. I know how my work relates to the agency’s goals and priorities.
14. Physical conditions (for example, noise level, temperature, lighting, cleanliness in the workplace) allow employees to perform their jobs well.
15. My performance appraisal is a fair reflection of my performance.
20. The people I work with cooperate to get the job done.
22. Promotions in my work unit are based on merit.
23. In my work unit, steps are taken to deal with a poor performer who cannot or will not improve.
24. In my work unit, differences in performance are recognized in a meaningful way.
30. Employees have a feeling of personal empowerment with respect to work processes.
32. Creativity and innovation are rewarded.
33. Pay raises depend on how well employees perform their jobs.
42. My supervisor supports my need to balance work and other life issues.
44. Discussions with my supervisor/team leader about my performance are worthwhile.
65. How satisfied are you with the recognition you receive for doing a good job?
Appendix E2
2008 2010 2011 2012 2013
Governmentwide 54 54 54 52 51
2008 2010 2011 2012 2013
Governmentwide 54 54 54 52 51

44
APPENDIX E3 HCAAF Index Trends: Talent Management
Appendix E3
2008 2010 2011 2012 2013
Governmentwide 60 60 60 59 56
Broadcasting Board of Governors 42 46 50 48 48
Court Services and Offender Supervision Agency 70 70 69 65 60
Department of Agriculture 59 57 58 55 54
Department of Commerce 64 62 63 63 62
Department of Defense 61 62 61 60 56
Department of Education 59 54 58 57 58
Department of Energy 62 60 58 59 57
Department of Health and Human Services 60 61 59 59 59
Department of Homeland Security 54 54 53 50 48
Department of Housing and Urban Development 49 46 49 50 44
Department of Justice 61 62 62 60 58
Department of Labor 57 55 54 55 52
Department of State 65 66 65 63 62
Department of the Interior 57 58 57 57 52
Department of the Treasury 60 62 63 61 56
Department of Transportation 54 57 57 59 57
Department of Veterans Affairs 62 58 60 57 58
Environmental Protection Agency 62 60 60 58 51
Equal Employment Opportunity Commission 51 52 56 55 52
Federal Communications Commission 60 63 61 61 63
Federal Energy Regulatory Commission 67 65 65 65 65
Federal Trade Commission 69 72 70 70 69
General Services Administration 65 66 65 64 59
National Aeronautics and Space Administration 71 71 70 71 70
National Archives and Records Administration 57 56 55 51 48
National Credit Union Administration 67 66 66 68 66
National Labor Relations Board 57 58 60 60 58
National Science Foundation 71 64 61 60 60
Nuclear Regulatory Commission 76 77 76 72 68
Office of Management and Budget 69 63 58 65 53
Office of Personnel Management 58 60 63 61 61
(For Excel version click here)

45
APPENDIX E3 HCAAF Index Trends: Talent Management (cont’d)
2008 2010 2011 2012 2013
Governmentwide 60 60 60 59 56
Pension Benefit Guaranty Corporation 64 68 67 63 60
Railroad Retirement Board 55 57 55 58 58
Securities and Exchange Commission 59 53 51 57 60
Small Business Administration 55 50 53 52 52
Social Security Administration 59 61 62 59 55
U.S. Agency for International Development 60 56 58 60 58
The Talent Management Index indicates the extent to which employees think the organization has the talent necessary to achieve organizational goals. It is made up of items:
1. I am given a real opportunity to improve my skills in my organization.
11. My talents are used well in the workplace.
18. My training needs are assessed.
21. My work unit is able to recruit people with the right skills.
29. The workforce has the job-relevant knowledge and skills necessary to accomplish organizational goals.
47. Supervisors/team leaders in my work unit support employee development.
68. How satisfied are you with the training you receive for your present job?
Appendix E3
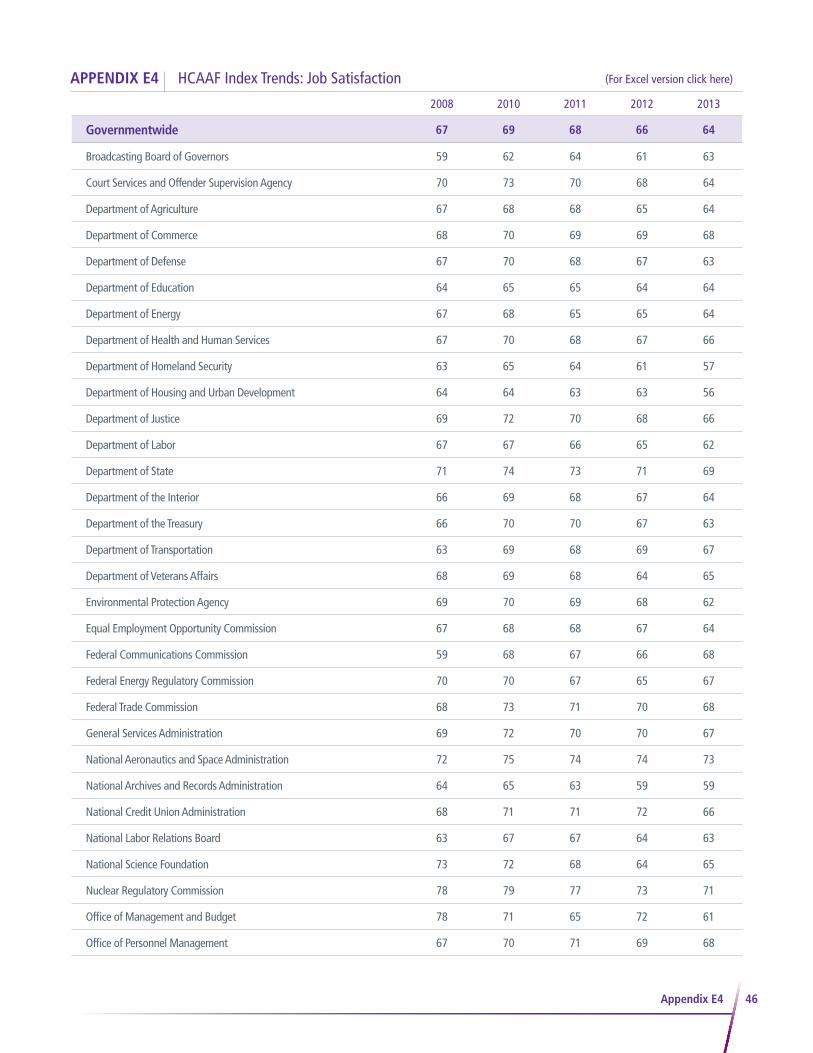
46
APPENDIX E4 HCAAF Index Trends: Job Satisfaction
Appendix E4
2008 2010 2011 2012 2013
Governmentwide 67 69 68 66 64
Broadcasting Board of Governors 59 62 64 61 63
Court Services and Offender Supervision Agency 70 73 70 68 64
Department of Agriculture 67 68 68 65 64
Department of Commerce 68 70 69 69 68
Department of Defense 67 70 68 67 63
Department of Education 64 65 65 64 64
Department of Energy 67 68 65 65 64
Department of Health and Human Services 67 70 68 67 66
Department of Homeland Security 63 65 64 61 57
Department of Housing and Urban Development 64 64 63 63 56
Department of Justice 69 72 70 68 66
Department of Labor 67 67 66 65 62
Department of State 71 74 73 71 69
Department of the Interior 66 69 68 67 64
Department of the Treasury 66 70 70 67 63
Department of Transportation 63 69 68 69 67
Department of Veterans Affairs 68 69 68 64 65
Environmental Protection Agency 69 70 69 68 62
Equal Employment Opportunity Commission 67 68 68 67 64
Federal Communications Commission 59 68 67 66 68
Federal Energy Regulatory Commission 70 70 67 65 67
Federal Trade Commission 68 73 71 70 68
General Services Administration 69 72 70 70 67
National Aeronautics and Space Administration 72 75 74 74 73
National Archives and Records Administration 64 65 63 59 59
National Credit Union Administration 68 71 71 72 66
National Labor Relations Board 63 67 67 64 63
National Science Foundation 73 72 68 64 65
Nuclear Regulatory Commission 78 79 77 73 71
Office of Management and Budget 78 71 65 72 61
Office of Personnel Management 67 70 71 69 68
(For Excel version click here)
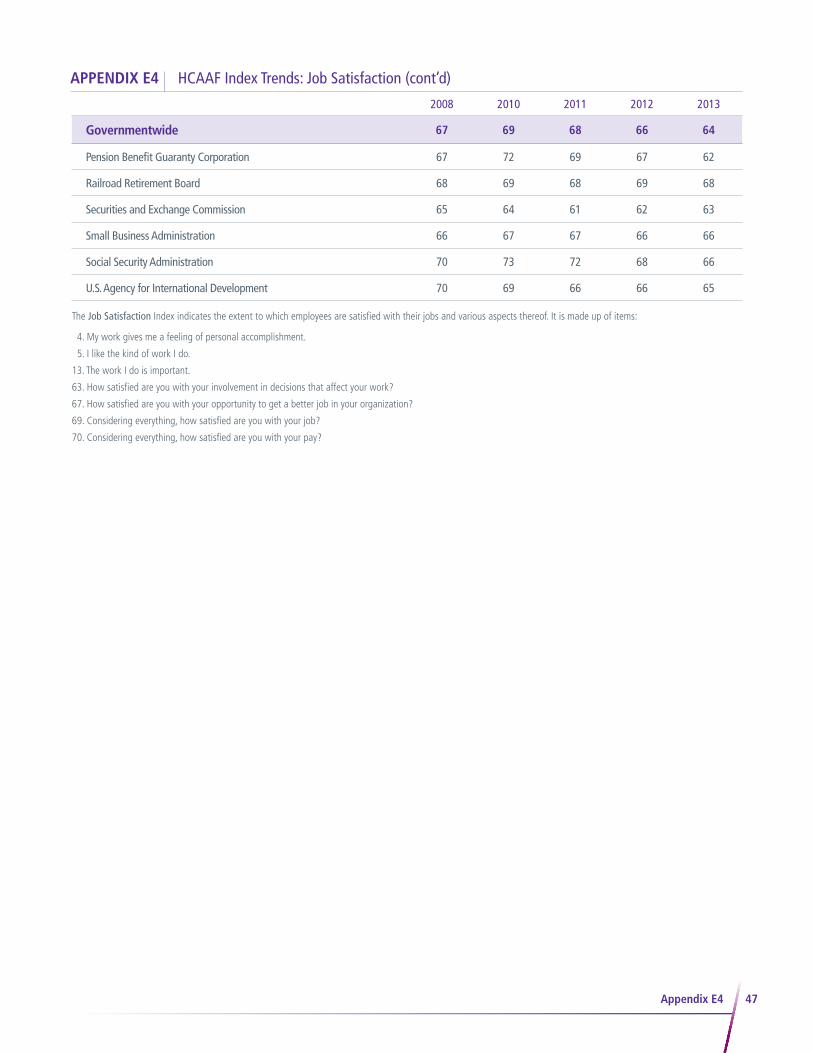
47
APPENDIX E4 HCAAF Index Trends: Job Satisfaction (cont’d)
2008 2010 2011 2012 2013
Governmentwide 67 69 68 66 64
Pension Benefit Guaranty Corporation 67 72 69 67 62
Railroad Retirement Board 68 69 68 69 68
Securities and Exchange Commission 65 64 61 62 63
Small Business Administration 66 67 67 66 66
Social Security Administration 70 73 72 68 66
U.S. Agency for International Development 70 69 66 66 65
The Job Satisfaction Index indicates the extent to which employees are satisfied with their jobs and various aspects thereof. It is made up of items:
4. My work gives me a feeling of personal accomplishment.
5. I like the kind of work I do.
13. The work I do is important.
63. How satisfied are you with your involvement in decisions that affect your work?
67. How satisfied are you with your opportunity to get a better job in your organization?
69. Considering everything, how satisfied are you with your job?
70. Considering everything, how satisfied are you with your pay?
Appendix E4

48Appendix F1
APPENDIX F1 Employee Engagement Index Trends
Appendix F
2010 2011 2012 2013
Governmentwide 66 67 65 64
Broadcasting Board of Governors 56 57 56 58
Court Services and Offender Supervision Agency 71 70 67 65
Department of Agriculture 63 65 63 63
Department of Commerce 69 70 70 70
Department of Defense 68 68 67 65
Department of Education 63 64 65 66
Department of Energy 65 63 65 64
Department of Health and Human Services 66 65 66 66
Department of Homeland Security 61 60 58 56
Department of Housing and Urban Development 59 61 62 57
Department of Justice 68 69 67 66
Department of Labor 64 64 64 62
Department of State 72 72 71 69
Department of the Interior 64 64 64 62
Department of the Treasury 69 70 69 67
Department of Transportation 61 63 64 65
Department of Veterans Affairs 63 65 62 63
Environmental Protection Agency 67 67 68 64
Equal Employment Opportunity Commission 63 65 67 65
Federal Communications Commission 70 69 69 73
Federal Energy Regulatory Commission 71 71 70 73
Federal Trade Commission 76 76 74 75
General Services Administration 70 71 69 69
National Aeronautics and Space Administration 76 75 76 77
National Archives and Records Administration 63 62 59 60
National Credit Union Administration 66 68 73 70
(For Excel version click here)

49Appendix F1
APPENDIX F1 Employee Engagement Index Trends (cont’d)
The Employee Engagement Index assesses the critical conditions conducive for employee engagement (e.g., effective leadership, work which provides meaning to employees, etc.). It is made up of three subfactors: Leaders Lead, Supervisors, and Intrinsic Work Experiences.
2010 2011 2012 2013
Governmentwide 66 67 65 64
National Labor Relations Board 63 66 65 64
National Science Foundation 71 67 65 68
Nuclear Regulatory Commission 80 79 76 75
Office of Management and Budget 66 63 73 68
Office of Personnel Management 69 72 71 72
Pension Benefit Guaranty Corporation 70 69 67 64
Railroad Retirement Board 66 66 68 69
Securities and Exchange Commission 61 61 62 62
Small Business Administration 63 65 64 65
Social Security Administration 70 72 69 67
U.S. Agency for International Development 65 65 67 66

50Appendix F2
APPENDIX F2 Employee Engagement Index Trends: Leaders Lead
2010 2011 2012 2013
Governmentwide 55 56 54 53
Broadcasting Board of Governors 41 43 41 43
Court Services and Offender Supervision Agency 63 64 58 54
Department of Agriculture 50 51 49 48
Department of Commerce 57 60 59 60
Department of Defense 58 58 57 54
Department of Education 53 55 54 56
Department of Energy 53 51 53 52
Department of Health and Human Services 55 55 56 56
Department of Homeland Security 49 48 46 43
Department of Housing and Urban Development 49 53 53 45
Department of Justice 59 59 57 57
Department of Labor 54 54 55 52
Department of State 63 65 63 60
Department of the Interior 50 51 51 48
Department of the Treasury 58 61 60 57
Department of Transportation 45 48 50 52
Department of Veterans Affairs 52 54 50 51
Environmental Protection Agency 54 54 56 50
Equal Employment Opportunity Commission 50 55 56 54
Federal Communications Commission 61 61 60 66
Federal Energy Regulatory Commission 64 65 63 66
Federal Trade Commission 70 72 70 70
General Services Administration 62 62 59 58
National Aeronautics and Space Administration 68 68 68 70
National Archives and Records Administration 49 47 44 45
National Credit Union Administration 54 57 65 61
National Labor Relations Board 52 57 55 53
National Science Foundation 61 56 52 55
Nuclear Regulatory Commission 76 74 69 68
Office of Management and Budget 50 50 62 59
Office of Personnel Management 60 63 62 63

51Appendix F2
APPENDIX F2 Employee Engagement Index Trends: Leaders Lead (cont’d)
2010 2011 2012 2013
Governmentwide 55 56 54 53
Pension Benefit Guaranty Corporation 58 58 57 51
Railroad Retirement Board 55 57 58 60
Securities and Exchange Commission 50 47 49 49
Small Business Administration 52 56 54 54
Social Security Administration 64 66 62 59
U.S. Agency for International Development 52 56 59 54
Leaders Lead reflects the employees’ perceptions of the integrity of leadership, as well as leadership behaviors such as communication and workforce motivation. It is made up of items:
53. In my organization, leaders generate high levels of motivation and commitment in the workforce.
54. My organization’s leaders maintain high standards of honesty and integrity.
56. Managers communicate the goals and priorities of the organization.
60. Overall, how good a job do you feel is being done by the manager directly above your immediate supervisor/team leader?
61. I have a high level of respect for my organization’s senior leaders.
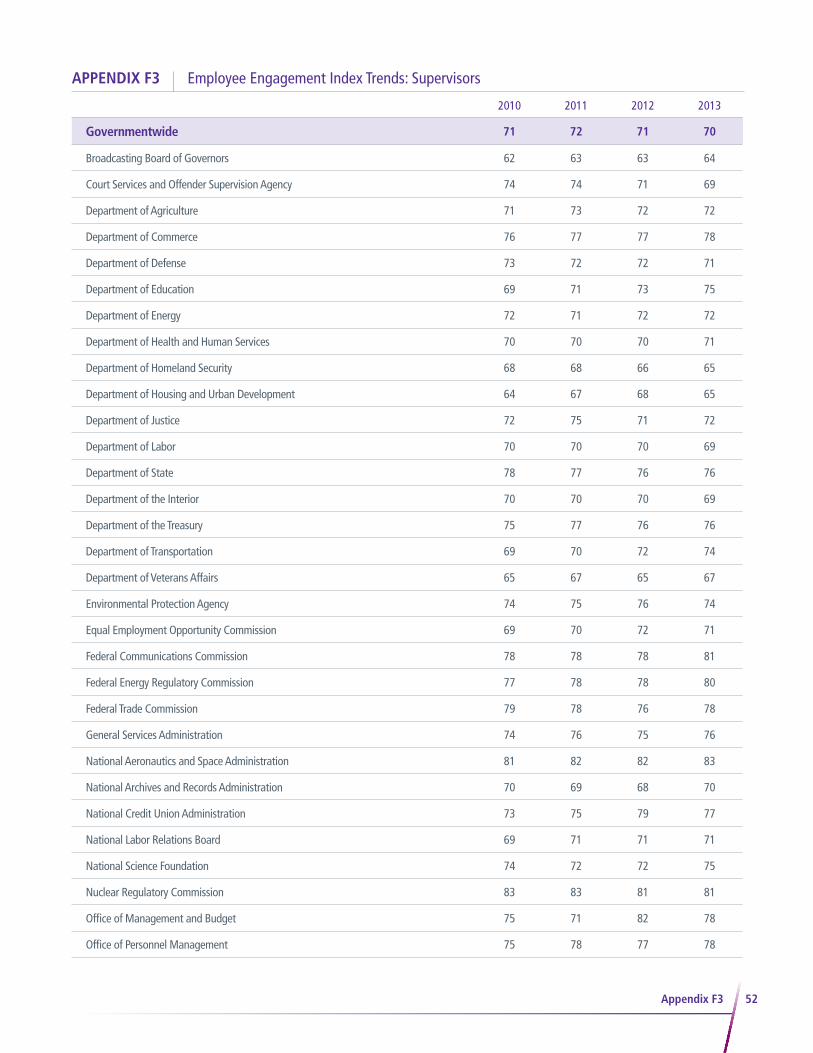
52Appendix F3
APPENDIX F3 Employee Engagement Index Trends: Supervisors
2010 2011 2012 2013
Governmentwide 71 72 71 70
Broadcasting Board of Governors 62 63 63 64
Court Services and Offender Supervision Agency 74 74 71 69
Department of Agriculture 71 73 72 72
Department of Commerce 76 77 77 78
Department of Defense 73 72 72 71
Department of Education 69 71 73 75
Department of Energy 72 71 72 72
Department of Health and Human Services 70 70 70 71
Department of Homeland Security 68 68 66 65
Department of Housing and Urban Development 64 67 68 65
Department of Justice 72 75 71 72
Department of Labor 70 70 70 69
Department of State 78 77 76 76
Department of the Interior 70 70 70 69
Department of the Treasury 75 77 76 76
Department of Transportation 69 70 72 74
Department of Veterans Affairs 65 67 65 67
Environmental Protection Agency 74 75 76 74
Equal Employment Opportunity Commission 69 70 72 71
Federal Communications Commission 78 78 78 81
Federal Energy Regulatory Commission 77 78 78 80
Federal Trade Commission 79 78 76 78
General Services Administration 74 76 75 76
National Aeronautics and Space Administration 81 82 82 83
National Archives and Records Administration 70 69 68 70
National Credit Union Administration 73 75 79 77
National Labor Relations Board 69 71 71 71
National Science Foundation 74 72 72 75
Nuclear Regulatory Commission 83 83 81 81
Office of Management and Budget 75 71 82 78
Office of Personnel Management 75 78 77 78

53Appendix F3
APPENDIX F3 Employee Engagement Index Trends: Supervisors (cont’d)
2010 2011 2012 2013
Governmentwide 71 72 71 70
Pension Benefit Guaranty Corporation 75 76 72 70
Railroad Retirement Board 70 70 72 72
Securities and Exchange Commission 69 70 72 71
Small Business Administration 69 70 70 70
Social Security Administration 70 73 71 70
U.S. Agency for International Development 72 72 74 74
Supervisors reflects the interpersonal relationship between worker and supervisor, including trust, respect and support. It is made up of items:
47. Supervisors/team leaders in my work unit support employee development.
48. My supervisor/team leader listens to what I have to say.
49. My supervisor/team-leader treats me with respect.
51. I have trust and confidence in my supervisor.
52. Overall, how good a job do you feel is being done by your immediate supervisor/team leader?
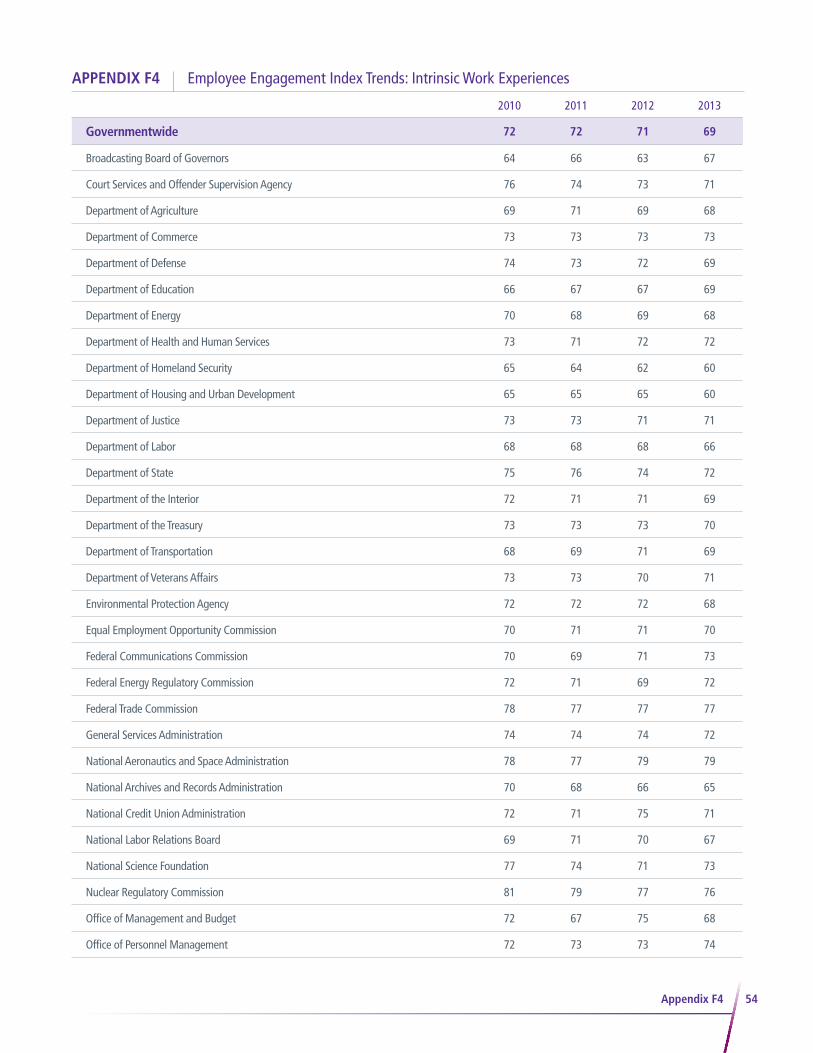
54Appendix F4
APPENDIX F4 Employee Engagement Index Trends: Intrinsic Work Experiences
2010 2011 2012 2013
Governmentwide 72 72 71 69
Broadcasting Board of Governors 64 66 63 67
Court Services and Offender Supervision Agency 76 74 73 71
Department of Agriculture 69 71 69 68
Department of Commerce 73 73 73 73
Department of Defense 74 73 72 69
Department of Education 66 67 67 69
Department of Energy 70 68 69 68
Department of Health and Human Services 73 71 72 72
Department of Homeland Security 65 64 62 60
Department of Housing and Urban Development 65 65 65 60
Department of Justice 73 73 71 71
Department of Labor 68 68 68 66
Department of State 75 76 74 72
Department of the Interior 72 71 71 69
Department of the Treasury 73 73 73 70
Department of Transportation 68 69 71 69
Department of Veterans Affairs 73 73 70 71
Environmental Protection Agency 72 72 72 68
Equal Employment Opportunity Commission 70 71 71 70
Federal Communications Commission 70 69 71 73
Federal Energy Regulatory Commission 72 71 69 72
Federal Trade Commission 78 77 77 77
General Services Administration 74 74 74 72
National Aeronautics and Space Administration 78 77 79 79
National Archives and Records Administration 70 68 66 65
National Credit Union Administration 72 71 75 71
National Labor Relations Board 69 71 70 67
National Science Foundation 77 74 71 73
Nuclear Regulatory Commission 81 79 77 76
Office of Management and Budget 72 67 75 68
Office of Personnel Management 72 73 73 74

55
APPENDIX F4 Employee Engagement Index Trends: Intrinsic Work Experiences (cont’d)
2010 2011 2012 2013
Governmentwide 72 72 71 69
Pension Benefit Guaranty Corporation 77 75 73 71
Railroad Retirement Board 72 71 73 74
Securities and Exchange Commission 64 65 65 67
Small Business Administration 68 69 70 70
Social Security Administration 75 76 73 71
U.S. Agency for International Development 71 67 69 69
Intrinsic Work Experiences reflects the employees’ feelings of motivation and competency relating to their role in the workplace. It is made up of items:
3. I feel encouraged to come up with new and better ways of doing things.
4. My work gives me a feeling of personal accomplishment.
6. I know what is expected of me on the job.
11. My talents are used well in the workplace.
12. I know how my work relates to the agency’s goals and priorities.
Appendix F4
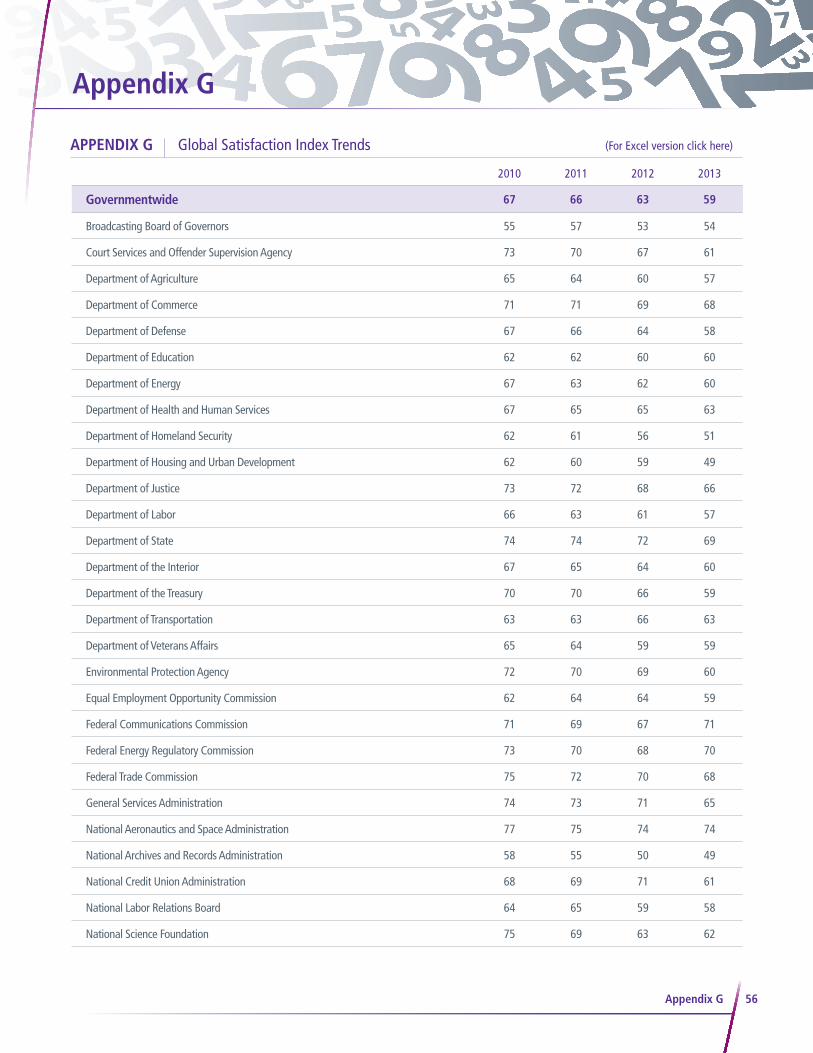
56
Appendix G
APPENDIX G Global Satisfaction Index Trends
Appendix G
2010 2011 2012 2013
Governmentwide 67 66 63 59
Broadcasting Board of Governors 55 57 53 54
Court Services and Offender Supervision Agency 73 70 67 61
Department of Agriculture 65 64 60 57
Department of Commerce 71 71 69 68
Department of Defense 67 66 64 58
Department of Education 62 62 60 60
Department of Energy 67 63 62 60
Department of Health and Human Services 67 65 65 63
Department of Homeland Security 62 61 56 51
Department of Housing and Urban Development 62 60 59 49
Department of Justice 73 72 68 66
Department of Labor 66 63 61 57
Department of State 74 74 72 69
Department of the Interior 67 65 64 60
Department of the Treasury 70 70 66 59
Department of Transportation 63 63 66 63
Department of Veterans Affairs 65 64 59 59
Environmental Protection Agency 72 70 69 60
Equal Employment Opportunity Commission 62 64 64 59
Federal Communications Commission 71 69 67 71
Federal Energy Regulatory Commission 73 70 68 70
Federal Trade Commission 75 72 70 68
General Services Administration 74 73 71 65
National Aeronautics and Space Administration 77 75 74 74
National Archives and Records Administration 58 55 50 49
National Credit Union Administration 68 69 71 61
National Labor Relations Board 64 65 59 58
National Science Foundation 75 69 63 62
(For Excel version click here)
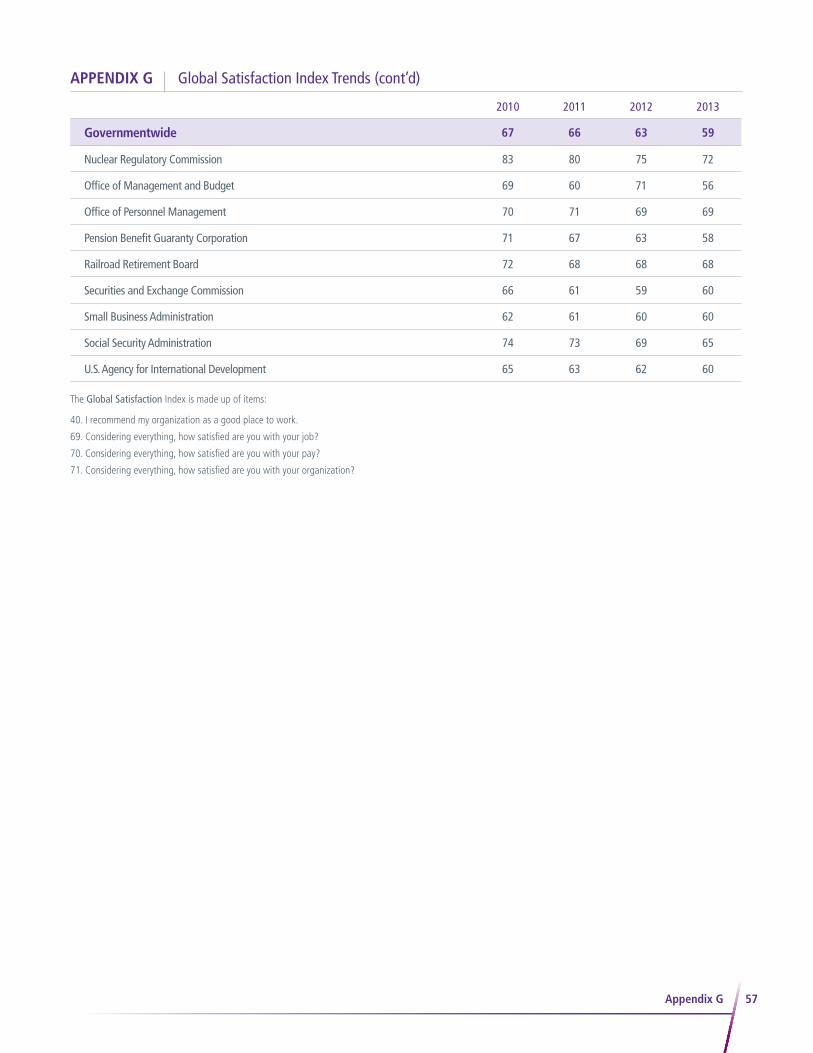
57
APPENDIX G Global Satisfaction Index Trends (cont’d)
Appendix G
2010 2011 2012 2013
Governmentwide 67 66 63 59
Nuclear Regulatory Commission 83 80 75 72
Office of Management and Budget 69 60 71 56
Office of Personnel Management 70 71 69 69
Pension Benefit Guaranty Corporation 71 67 63 58
Railroad Retirement Board 72 68 68 68
Securities and Exchange Commission 66 61 59 60
Small Business Administration 62 61 60 60
Social Security Administration 74 73 69 65
U.S. Agency for International Development 65 63 62 60
The Global Satisfaction Index is made up of items:
40. I recommend my organization as a good place to work.
69. Considering everything, how satisfied are you with your job?
70. Considering everything, how satisfied are you with your pay?
71. Considering everything, how satisfied are you with your organization?
United States Office of Personnel Management
Planning and Policy Analysis
1900 E Street, NW Washington, DC 20415
www.FedView.opm.gov