empirical evaluation of overconfidence hypothesis among...
TRANSCRIPT
EMPIRICAL EVALUATION OF OVERCONFIDENCE HYPOTHESIS
AMONG INVESTORS
THE EVIDENCE IN VIETNAM STOCK MARKET
Phan Nguyen Ngoc Xuan My
Huynh Luu Duc Toan
and Nguyen Thi Kim Cuong
June 2016
EMPIRICAL EVALUATION OF OVERCONFIDENCE HYPOTHESIS
AMONG INVESTORS - THE EVIDENCE IN VIETNAM STOCK MARKET
Phan Nguyen Ngoc Xuan My, Huynh Luu Duc Toan, and Nguyen Thi Kim Cuong
June 2016
ABSTRACT. This paper highlights the role played by overconfidence bias in investors’
behaviors of finance. Using Vietnam stock market data sets during the period 2008 – 2015, this
paper provides the quantitative research of the overconfidence hypothesis in Vietnam: market
gains (losses) increase (decrease) investors’ confidence, and consequently they trade more (less)
in subsequent periods. Overall, we find empirical evidence that an increase in stock returns (VN-
Index) is always followed by an increase in trading volume, as well as an increase in the Vietnam
Investor Confidence Index ® (VICI), as a proxy for investors’ confidence. We further investigate
the contemporaneous relations between the three variables. The analysis shows that the more
confident investors are, the more trading volume they exercise, and unfortunately the less return
they can gain.
Key words: behavioral finance, overconfidence bias.
Phan, Nguyen Ngoc Xuan My Huynh, Luu Duc Toan Nguyen, Thi Kim Cuong
Massey University Toulouse 1 Capitole University Graduate, Foreign Trade University

Page 1
1. Introduction
The important assumption that all investors are rational underlies the conventional asset
pricing models. However, empirical literature consistently illustrate that those models do not
explain some of stylized facts observed in securities markets1. There is currently a growing
concern among researchers who argue that the failure of the conventional asset-pricing model is
critically due to the inappropriateness of the rationality assumption. There are developing
research lines to explain such phenomenon, including models based on special trading strategies
taken by irrational investors2, models of investors’ cognitive bias3, models on “limit to
arbitrage”4, the momentum effect models5, and the negative long-term autocorrelations in many
asset and securities markets6.
Recently, behavioral finance models have been motivated by offering a unified explanation
of short-run underreaction and long-run overreaction. For example, Daniel, Hirishleifer, and
Subrahmanyam (1998) (hereafter, DHS) state that trading volume in speculative market is too
large, and volatility of asset prices relative to fundamentals is also too high. Trading motivated
from hedging and liquidity purposes is likely to explain only a small fraction of the observed
trading activity and fails to support a large amount o f informational trade. Overconfidence has
been advanced as an explanation for the observed trading volume and volatility. Odean (1998b)
and Gervais and Odean (2001) develop models showing that overconfidence increases trading
volume and volatilities (see also Benos (2001) DHS (1998), and Hirshleifer and Luo (2001)).
In short, the overconfidence hypothesis, among other things, offers the following testable
empirical hypothesizes. First, overconfident investors have a tendency to overreact to private
information and underreact to public information. Second, an increase in market gains (losses)
1 Fama (1998) and Daniel, Hirshleifer, and Subrahmanyam (1998) review the literature on those anomalies. Moreover, Daniel, Hirshleifer, and Teoh (2002) and Heaton and Korajezyk (2002) discuss those anomalies. 2 Cutler, Poterba, and Summers (1990, 1991) and De Long et al. (1990b) indicate that some irrational traders do not take negative feedback trading strategy which can help to explain short-term momentum and long-term reversal. Bange (2000),Choe et al. (1999) and Grinblatt and Keloharju (2000) show evidence that certain classes o f investors engage in positive feedback trading. 3 Barberis, Shleifer, and Vishny (1998) provide a model measuring investor sentiment based on two assumptions of cognitive bias: conservatism and representative heuristic; while Daniel, Hirshleifer, and Subrahmanyam (1998) develop a theory based on alternative assumptions: overconfidence and self-attribution bias. Gervais and Odean (2001) propose a muti-period market model showing how a learning bias impacts on overconfident level of traders 4 Delong et al. (1990) state that noise traders can create price risks on risky asset which deters rational arbitrageurs from actively hedging against them. Black (1986) and Barberis and Thaler (2002) discuss about “limits to arbitrage”. 5 Possible explanations for momentum include data mining, risk, and behavioral patterns. However, in some empirical tests, risk and data mining finds it difficult to explain the effect (e.g., Jegadeesh and Titman (1993, 2001, 2002), Fama and French (1996), Conrad and Kaul (1998), and Rouwenhorst (1998, 1999)). 6 DeBondt and Thaler (1985, 1987), Fama and French (1988), Poterba and Summer (1988), Culter et al. (1991), and Richards (1995,1997)

Page 2
leads to an increase (decrease) in investors’ overconfidence, and consequently they trade more
(less) aggressively in subsequent periods. Third, as overconfident investors, they fail to estimate
risk appropriately and, as such, trade riskier securities. Fourth, excessive trading by
overconfident investors in securities markets makes a contribution to the observed excessive
volatility.
Previous empirical studies have found evidence on various implications of the
overconfidence hypothesis. Odean (1998b), and Gervais and Odean (2001) develop their models,
which show evidence of the second hypothesis that implies a positive causality running from
stock return to trading volume.
In Vietnam, there are some studies which indicate the impacts of behavioral finance on
Vietnam Stock Market. Tran Thi Hai Ly (2011)7, and Nguyen Duc Hien (2012)8 shows the
model to measure which factors contribute to investors’ behaviors.
Therefore, on a stock market in general and on the Vietnamese one in particular,
investment decisions are not only affected by conventional financial theories, but also driven by
various factors, among of which is behavioral finance. In other words, investment decisions or
investors’ behaviors rely on psychological factors. Whether or not an investor can constantly
make rational decisions? According to behavioral financial theories, investment decisions are
influenced by psychological factors, namely overconfidence, herd mentality, uncertainty, etc.
Featuring the nature of an immature market where there are numerous individual investors
and speculation frequently happens, Vietnam stock market is subject to behavioral factors,
especially investors’ overconfident level. Therefore, the study of behavioral psychology proves
to be reasonably necessary to the market and investors, particularly in the current period when
Vietnam has finished TPP negotiation and is subject to different opportunities and challenges.
The specific objective of this study is to show the empirical evidence on the second
hypothesis in Vietnam Stock Market over the period 2008 - 2015 by focusing on stock returns,
trading volume and investor behavior. We follow and build upon the approach by Odean
(1998b), and Gervais and Odean (2001), and analyze the link among the three factors mentioned
above. This implication is tested by performing the bivariate Granger causality tests from stock
7 See Tran Thi Hai Ly (2011) – “The impacts of psychology on individual investors’ behavior in Vietnam Stock Market”. The study shows the model to measure the factors contributed to investors’ behavior. 8 See Nguyen Duc Hien (2012) – “The investor behavior on the Vietnamese stock market”. The study uses questionare method to develop a model to measure behaviors of individual investors with five main bias: (1) Overoptimism; (2) Herding mentality; (3) Overconfidence, (4) Risk aversion, and (5) Pessimism.

Page 3
return to trading volume. Our results show that the null hypothesis that stock returns do not
Granger-cause trading volume is rejected.
The Granger-causality tests for the four monthly variables of trading volume, stock returns,
Vietnam Domestic Investor Confidence Index ® (VDIC), and Vietnam Foreign Investor
Confidence Index ® (VFIC), which are used as proxy for investors’ confidence9, are also
performed to indicate evidence that the positive causality running from stock returns to trading
volume is due to investors’ overconfidence enhanced by stock returns. Our results show that
stock returns positively Granger-cause both the VDCI and trading volume, which implies that an
increase in Vietnam stock returns makes only domestic investors become more confident and
consequently trade more aggressively in subsequent periods. This finding is important since it
provides (indirect) evidence to disentangle the overconfidence hypothesis. Furthermore, we find
evidence that the VDIC slight Granger-causes stock returns. Besides, we do not find the evidence
to support the Granger causality between stock returns, trading volume and foreign investors.
This finding seems to suggest that the foreign investors are fairly neutral and the market is still
quite efficient in that investors’ overconfidence doesn’t drive the market.
Although the results from the Granger causality tests are consistent with the prediction of
the overconfidence hypothesis, care must be taken to make a conclusion that our hypothesis is
supported by empirical examination before we find evidence that there exists a positive causal
relation between the lagged Vietnam Confidence Index and current trading volume and stock
returns. By performing the Ordinary Least Squares (OLS) regression on the Vector Autogressive
Model (VAR) and the OLS with HAC – Newey West standard errors and covariance, we find
that the three main following findings.
First, there is the strong positive causal relation between lagged monthly stock returns and
current monthly trading volume, but there is not any causal relation from trading volume to stock
returns. This implies that stock return is not driven by trading volume. We also do not find the
evidence that show causal relation between confident level index of both domestic and foreign
investors, and the trading volume. This implies that, the confidence level index contains no
additional information to predict trading volume. Another explanation is that the influence of the
9 Fisher and Statman (2002) find that there exists a positive and statistically significant relationship between changes in the American Association of Individual Investors (AAII) measure o f investor sentiment and changes in the Index of Consumer Sentiment and that the Index o f Consumer Sentiment goes up and down with stock returns (see also Fisher and Statman (2000)).

Page 4
investors’ confidence index on trading volume lasts faster than one month, and then the use of
monthly variables may fail to capture the relation between them.
Second, there is a negative relation of Vietnam Domestic Investors Confidence to stock
return with the lag of 1 month and a positive relation of trading volume to Vietnam Domestic
Investors Confidence. This indicates that the more confident investors are, the more trading
volume they exercise, and unfortunately the less return they can gain. In previous studies, Barber
and Odean (2002) find that investors who have often earned high returns are more likely to
switch from phone-based to online trading. Online investors trade more frequently and perform
worse. They argue that one important reason for the switch is overconfidence. In retrospect,
Vietnam has changed to launch online trading system in Vietnam stock market since 2008.
Third, we find that domestic investors have a tendency to last the positive effect in the last
one month when the stock return increase, and consequently, they trade more aggressive and
then get loss in the next period (one month), which makes them regret after that (two months).
This is also supporting evidence for the second finding above.
Due to the result of Granger causality and the OLS regression, we find that there is no
relationship between Vietnam Domestic Investor Confidence Index and Vietnam Foreign
Investor Confidence Index. For the purpose to robust the evidence, we perform Quantile
regression. The finding shows that there exits a causal impact from foreign investors to domestic
ones, which is more and more influent on the investors who show high volatility of their
overconfident behavior in the Vietnam stock market. It shows that Investors’ overconfidence is
posited to be stronger in a bull or bear market (DHS (2001)).
The paper is organized as follows. We briefly review related literature in Section 2. Section
3 presents the data and methodology. In section 4, we discuss the empirical results of the tests of
overconfidence hypothesis. Section 5 produces concluding remarks. The final section offers
some implications.
Page 5
2. Literature review
2.1. Overconfidence theory
Overconfidence is the psychological state in which a person’s subjective confidence in his
judgments relies on weak reasoning, evaluation and intuition. Upon estimation of the likelihood
of a certain thing, investors often made inaccurate assessment because they assume themselves
smarter or consider the information they receive as more valuable than other investors on the
market. The reasons for this psychological state are the tendency in which investors find
complementary information to the existing and the desire to become more professional and
proficient than others. Once investors get overconfident about their decisions, they tend to ignore
contrary information. Normally, those too confident conduct trading activities more frequently in
order to take advantage of the material information that they think they are the only to own.
What is more dangerous and causes greater loss to investors due to their overconfidence are their
possession of an undiversified portfolio and their underestimation of the risk they are taking.
2.2. Previous researches on overconfidence hypothesis
The conventional asset pricing models rest on an important assumption that all behaviors
are rational. However, empirical tests, namely Fama (1998) and Daniel, Hirshleifer &
Subramanyam (1998), Hearton and Korajczyk (2002) have showed that those models fail to
explain unusual behaviors on stock market. A growing number of researchers argue that the
failure of the conventional asset pricing models results primarily from the inappropriateness of
investors’ assumption that “people are rational”. Some models are developed based on special
trading strategies. Models by Cutler, Poterba & Summer (1990, 1991) and De Long et al (1990)
show that several investors’ irrational implementation of special trading activities can help
explain short-horizon momentum and long-horizon reversals. Barberis, Shleifer & Vishny (1998)
offers a model for investor sentiment built on two psychological biases: conservatism and
representativeness. Meanwhile, Daniel, Hirshleifer & Subrahmanyam (1998) proposes a theory
based on hypotheses about investor overconfidence and biased self-attribution. Noticeably,
Gervais and Odean (2001) conducts various empirical tests to prove investor overconfidence.
Besides, several behavioral financial models have been supported by offering a unified
explanation of short-term underreaction and long-term overreaction. For example, DHS (1998)
Page 6
argue that if investors are overconfident, they ignore public information in favor of their own
private information. As a consequence, investors overreact to private information and underreact
to public information.
It has been argued that trading in speculative markets is of a greatly large volume, and
volatility of asset prices relative to fundamental indexes is too high. Shiller (1981, 1989)
provides evidence that the volatility resulting from changes in the expected discounted value of
dividends is too high. Overconfidence is considered as an explanation for the trading volume and
volatility. Odean (1998) and Gervais and Ordean (2001) develop some models to show that
overconfidence increases trading volume and volatility of stock prices. Moreover, economists,
namely Benos (1998), De Long et al (1991), Hirshleifer and Luo (2001), Kyle and Wang (1997),
Odean (1998) and Wang (1998) build overconfidence model and argue that investors
overestimate the precision of private information and trade more on risky stocks due to
underestimation of the risks.
Odean (1998) and Gervais & Odean (2001) develops Granger Causality to show that high
market gains make investors more confident and thus, trade with higher volume at greater
frequency in subsequent periods. This implies that there is a positive causality between stock
returns and trading volume. The bivariate Granger causality model that tests the causality from
stock returns to trading volume on the US market is performed to test the above-mentioned
implication. The result shows that the null hypothesis that “Stock returns do not cause trading
volume” is strongly rejected. This result is still correctly applied in three consecutive periods
when weekly variables are employed. The trivariate Granger causality model employs monthly
variables of trading volume, stock returns, and the consumer confidence index that is used as a
proxy for investors’ confidence. This model is performed to test the positive causality running
from stock returns to trading volume due to investors’ overconfidence which is enhanced by
stock returns. The result shows that the stock returns positively Granger-cause both consumer
confidence index and trading volume. This relation implies that stock return increase makes
investors more confident and hence, more frequently conduct trading with higher volume in
subsequent periods. However, there exists no evidence that consumer confidence index Granger
causes stock returns even though there is a simultaneous positive relation between these two
variables. This may suggest that because the market is efficient, investor sentiment cannot drive
the market. It can also be explained that overconfident investors, through their more frequent
Page 7
trading, make private information more publicly available and thus, improve price efficient
(Benos, 1998) (10).
2.3. Factors contributed to overconfident bias
a. External factors
(1) It is the difficulty level of questions. People tend to be overconfident when they encounter
difficult questions – hard-easy effect
People are not always overconfident. Overconfidence often declines when they are faced
with easy questions; this phenomenon is called hard-easy effect. This effect occurs when people
are overconfident for hard questions, but less confident and even underconfident for easy
questions (Lichtenstein and Fischhoff, 1977). A plenty of research shows that the bias due to
overconfidence normally arises when people meet with difficulties (Dawes and Mulford, 1996).
Researchers argue that the hard-easy effect arises because people wrongly calibrate difficulty
levels of questions (Pulford and Colman, 1997).
Evidence and research in Vietnam
On Vietnam stock market, the common investor sentiment among speculators is to infer
from trading activities of foreign investors or ETFs to evaluate the market, creating herd
mentality. Because most Vietnamese investors are individuals and lack the expertise to
reasonably solve difficult problems, or absorb highly specialized information, they tend to follow
actions of foreign investors or ETFs who Vietnamese investors consider as a reliable source to
find solutions to market questions. Another noteworthy point is that Vietnam stock market is of a
small scale, thus it may be driven by foreign investors. Therefore, sometimes investors do not
need technical expertise, but just rely on trends by foreign investors to yield profit, which leads
to the overconfidence about their own ability.
(2) It is the information owned. The degree of confidence rises with the increasing amount of
information
A plenty of research shows that when a person makes decision, his confidence degree
increases with the information amount (Oskamp, 1965) and the observation numbers he gets, but
(10) Benos (1998), from “Aggressiveness and survival of overconfident traders”, Journal of Financial Markets.
Page 8
the accuracy of decisions is not improved in both cases. The amount of information and its
power influence people’s confidence in their decision-making (Koriat, Lichtenstein & Fischhoff,
1980). Sometimes, useless information is used but not re-evaluated. The use of such information
reduces the accuracy but increases the confidence of investors. Klayman & Hastie (2008) offers
three studies to show that when a person receives additional information, his overconfidence
rises faster than the accuracy degree of his decisions, leading to a gap between the confidence
and the accuracy. Because in the evaluation process, people excludes cognitive limitations, and
thus, lower their ability to effectively use complementary information.
Evidence and research in Vietnam
According to the research “Behavior theory on Vietnam stock market” by Msc. Le Thi
Ngoc Lan (2009), 57% of individual investors and 62% of all change their investment decision
upon the appearance of more supporting information, which proves that most of the investors’
decisions are subject to the information amount. Lack of information transparency and insider
trading are among the reasons for Vietnamese investors’ confidence. The criterion that
information must be provided timely and accurately is not satisfied on Vietnam stock market;
investors have no immediate access to updates about listed companies because of their little
focus on information disclosure. The phenomenon of inaccurate, late publicly available
information still exists. Besides, there is a lack of history about the market and listed firms.
Insider trading, rumors and price distortions frequently occur. Those factors result in
overconfidence of investors who own private information and their aggressive trading.
(3) It is the impact by experts
Information from the experts is of great interest to investors. Studies by Kehler et al.
(2002), Glaser et al. (2007), McKenzie, Liersch & Yaniv (2008) prove an equal confidence
degree between professionals and students. Experts perform better stock valuation and increases
chances of correct investment decisions, but they use too much misleading information that
causes a reverse impact. The studies show that overall, confidence and the ability to make correct
investment decisions by professionals are no different from students.
Evidence and research in Vietnam
The influence of experts on investors’ decision exists in almost all markets without
exception in Vietnam. With little experience and investment expertise, investors tend to look for
Page 9
a source to rely on to make decisions – experts’ judgments. This can be seen clearly in 2008
when many securities companies achieved great profits from the services conducted by brokers
and consultants.
(4) It is media impact
Media always has a profound influence on investors’ perception and psychology, which
leads to a better-than-average effect. The media always argue that the information communicated
is objective and verified; however, media are an integral part of market events because it aims to
attract numerous viewers. Market events only make sense when there are large groups with
similar ideas and media plays a critical role in spreading such ideas. Media “accidentally”
contributes to confirming the accuracy of those ideas. The frequent repetition of this process
makes investors believe that their judgments do not result from luck, but from their own abilities.
Evidence and research in Vietnam
Media is among the most powerful factors to affect investors’ confidence. It can be seen
why Vietnamese investors got overconfident during bull markets, e.g. between 2006 and 2009, at
the yearend. Media has repeatedly mentioned market profitability as an inevitable trend.
b. Cultural factors
(1) Culture is the base for a person’s decisions and behavior
Culture may affect individuals’ cognitive processes and the processes create impacts on a
person’s confidence and information processing. On stock market where there is always an
abundant amount of information and decisions may be driven by emotions, cultural factors play a
large part in investors’ overconfidence. There have been several studies on this issue. For
example, Yates, Lee and Bush (1998) argue that the Chinese are more confident than the
Americans, and the Americans are more confident than the Japanese about their overall
knowledge. Noticeably, a recent study by Acker and Duck (2008) shows that the Asians are
more overconfident than the British and the Americans.
Evidence and research in Vietnam
Currently, no studies about effects of cultural factors on investors’ confidence have been
conducted in Vietnam.
(2) It is social classes

Page 10
Basically, all human societies have social classes. Social stratification may feature the form
of a caste system in which members from different classes are intertwined in certain roles and
there are no change among different classes. Social classes are relatively homogeneous and
sustainable in a society, arranged in a hierarchy, and all the members share the same value,
concerns and behaviors.
Social classes are built on the combination of occupations, income, education, wealth and
other factors. Income is the most important element; hence, those who want to be rich quickly
participate in stock market with a ‘quick victory’ desire. Some studies show that overconfident
investors exist across classes and mainly in middle classes where people have their own capital,
knowledge and direction from upper classes, becoming much more confident than those from
other classes.
Evidence and research in Vietnam
During the period of stock market boom, those from middle classes are intellectuals who
participated most actively in the stock market and accounted for almost 76% by Nguyen Duc
Hien, (2012).
c. Personal traits
(1) It is gender. Males are more confident than females
Lunderberg, Fox and Puncochapr (1994) finds out that both males and females may get
overconfident, but the confidence level of men is higher. The impact of gender on confidence
level depends on work nature, especially investment decision making on the stock market.
Studies by Pulford and Colman, Odean argue that the reason is that women suffer from greater
social pressure and this makes them less confident in family and work life, which can be seen
most clearly on the stock market.
Evidence and research in Vietnam
Many studies on behavioral finance on Vietnam stock market affirm that males are more
confident than females, the research by Nguyen Duc Hien (2012), for example.

Page 11
(2) It is personal characteristics
An important part in assumptions of behavioral finance models is whether or not there exist
personal characteristics in confidence level. The famous studies argue that personal traits affect
reasoning skill, decision making skill (Stanovich and West 1998, 2000; Parker and Fischhoff,
2005) or misidentification (Klayman et al., 1999). The empirical evidence is entirely consistent
with the common assumption in behavioral finance models – different confidence level
associated with different types of investors. In addition, several studies that confidence degree
varies with people’s jobs or sectors (Jonsson and Allwood, 2003).
Evidence and research in Vietnam
Age, education and investment experience
Investors change their views and judgments along the stages of their lives. In fact, investors
tend to accept more risk at younger ages and the preference for risk declines with age. Senior
investors have more stable psychological and emotional state. This can fully explain the reason
why Vietnamese seasoned investors have the tendency to be more confident and less concerned
about market short-term fluctuation. Or perhaps, they think that they have much experience from
previous failure when they made investment based on emotions. The dissertation by Dr. Nguyen
Duc Hien shows that Vietnamese investors’ education has a positive correlation with their
confidence at the confidence interval of 95%. Besides, Dr. Nguyen Duc Hien also finds out a
positive correlation between age and investment experience. In detail, older investors are more
optimistic, more confident than the younger ones.
Economic status
A person’s economic status has a large impact on his selection of stocks, especially in such
a country of an average income as Vietnam, only about 1,900USD per capita (General Statistics
Office in Vietnam, 2013). A person with financial autonomy makes more aggressive investment
and often ignores the potential risk, only caring about possible returns. Those who invest to earn
a living make more careful investment decisions because of the subsequent impacts on their
future lives.

Page 12
(3) It is personal motivation
The confidence and certainty levels being considered depend on various factors. Some
memory problems or the power of information may cause a bias in confidence. The influence of
motivation may explain the overestimation of probability of an event under some circumstances.
For example, a weather forecast executive may overestimate the probability of a hurricane
occurrence (Murphu & Winkler, 1974) because people must make the most careful preparation
for the worst possible scenario, or experts’ judgments must sound extremely confident if the
experts want to pass their confidence to other people. We certainly do not expect professionals
such as doctors to give evaluation with a lack of confidence. If so, we will feel anxious to follow
their advice. Lichtenstein, Fischhoff và Phillips (1982) argue that people sometimes do not have
enough motivation to be neutral in their judgments. Therefore, the pressure to agree, create
impression or deny something is the reason for overconfidence in evaluation.
The benefits and risks of being confident in front of the public must also be considered.
That a person has to take responsibility for his judgments can reduce their confidence because he
does not want to express much confidence in his evaluation to avoid subsequent events (Tetlock
& Kim, 1987). This proves that responsibility for a judgment makes changes to cognitive
processes. If a person has to be responsible for the result, their judgments will receive more
careful and accurate research and vice versa. Several conclusions can be drawn. First, people to
take responsibility for the result will handle information in more complex ways, leading to a
lower confidence level. Second, those people may have some ways to limit their overconfidence,
but it cannot be fully eliminated. This implies that responsibility increases personal awareness,
improves the process of information analysis and leads to a person’s examination of the
opposition to realize their wrong position.
(4) It is past success
Overconfidence arises from past success. If a person’s decision leads to profits, it is
considered as the result from his skills and ability. If the decision is incorrect, it is attributed to
bad luck. The more successes a person achieves, the more ability he assume himself to have,
even when such successes are brought about by luck.

Page 13
In a bull market, individual investors will attribute their success to their own ability, which
leads to their overconfidence. As a result, behaviors of overconfidence happen more in a bull
market than in a bear market (11).
d. Cognitive biases that lead to overconfidence (12)
(1) It is availability bias
A main reason for overconfidence in decision making is that it is difficult for people to
predict all the circumstances that may occur. Psychologists call this the availability bias: “What
lies beyond our vision is often beyond our thinking”. Because we cannot envision all important
aspects of a complex series of future events, we become unreasonably overconfident based on a
few aspects being considered. In other words, the expected evidence or beautiful outlooks can be
overused, more than its actual effects.
(2) It is anchoring
The second reason for overconfidence is anchoring, a tendency in which people anchor on
a certain value or opinion without re-assessing its accuracy in a specific confidence interval. For
example, we tend to forecast profit in coming quarters before conducting assessment at a
reasonable confidence interval. Forecasted profit will become an anchoring point and our
predictions will vary around that point.
How to get the best forecast? To answer this question, economists in collaboration with
psychologists carried out a study with questions, e.g. “How long is the Nile River?” among two
groups of investors. The first group gave their guess, which is an anchoring point and afterwards,
offered a confidence interval of 90%. The second group gave a confidence interval with no
previous guess. 61% of members from the first group gave wrong answers while the
corresponding figure for the second group was 48%. Therefore, the researchers believe that
overconfidence decreases significantly by ignoring previous prediction and directly giving the
judgment.
(11) Simon Gervais and Terrance Odean, “Learning to be overconfident” and Kent Daniel, David Hirshleifer and Avanidhar
Subrahmanyam, “Overconfidence, Arbitrage, and Equilibrium Asset Pricing’. (12) A study by J.Edward Russo. Paul J.H.Schoemaker (1990) explains cognitive biases that lead to overconfidence.

Page 14
(3) It is confirmation bias
The third reason for overconfidence is the searching process in mind. When giving out
judgments, we tend to base on only a few viewpoints and find support for our first opinion
without seeking further evidence for the opposite view. Unfortunately, regarding uncertain and
complicated decisions, it is easy for us to seek for outside support; meanwhile, confidence is
built from understanding of evidence of both sides. The amount of information needed to affirm
evidence depends on the influence and creditability of the source. Griffin and Tversky gave
supporting examples that people tend to appreciate the influence of evidence relative to
creditability of the source. Whenever the reliability of information source is low, evidence
influence gets higher and overconfidence arises. Ironically, Griffin and Tversky predicted
confidence in a reverse situation of high creditability of information source and low impact of
the evidence; however, no implication evidence was found.

Page 15
3. Data and methodology
3.1. Data
a. Data description
Our sample consists of all firms listed on Ho Chi Minh Stock Exchange (HOSE) during the
period January from 2008 to December 2015. We exclude Hanoi Stock Exchange (HNX) firms
for our analysis for two reasons. First, HNX firms tend to be smaller, and the market
microstructure of HNX firms may be quite different from HOSE firms. Second, the difference in
historical framework between the two leads to mismatched records of data.
To be included in our selected sample, a stock must have available information on stock
price, trading volume, and market capitalization. We use daily data from the VN-Index file to
construct weekly and monthly observations. The weekly return of each stock is computed as the
return from Wednesday’s closing price to the following Wednesday’s one13. If the following
Wednesday’s price is unrecorded, then Tuesday’s or Thursday’s one is used. Weekly returns are
denominated as follows:
� = ������
����� 14
where R is Return of VN-Index between two weeks, p� Wednesday’s closing price at week
t, and p��� Wednesday’s closing price at week (t-1). Monthly returns are calculated based on
geometric mean of 4 weeks of the month.
We use turnover, which is defined as the ratio of the number of shares traded in a day to the
number of outstanding shares at the end of the day, as a measure of trading volume of a stock
ticker. Based on time-aggregated turnover by Lo and Wang (2000), the weekly raw trading
turnover is computed as a sum from Thursday’s trading turnover to the next Wednesday’s one.
Lo and Wang argue that summed turnover as a measure of trading volume takes advantage of the
fact that it is unaffected by “neutral changes of each stock such as stock dividends and stock
splits. Furthermore, another problem with using number of trading shares as a measure of trading
volume is that it is not scaled, and hence highly correlated with firm size (for example, Chordia 13 It is well-known that asynchronous trading is more serious in daily data. Previous empirical studies illustrate that Wednesday trading volume is higher related to other weekdays’ ones. The use of the Wednesday-to-Wednesday week will alleviate the asynchronous trading problem. (Huber, 1997) 14 Daily VN-Index from January 2008 to December 2015 is used to determine returns. The use of logarithmic data reduces the gap caused by absolute values, and stationary time series. We collect the data of VN-Index return and volume from Ho Chi Minh Stock Exchange

Page 16
and Swaminathan (2000)), especially that the Vietnamese stock market is mostly dominated by
large capital firms. The monthly returns are defined as the same method.
We use the Vietnam Investor Confidence Index ® (VICI)15 as a proxy for the measure of
investors’ confidence. The index is calculated monthly and developed by Woori CBV Securities
Corporation. The index uses the principles of modern financial theory to quantify the behavior of
investors, both domestic and foreign investing into Vietnamese Stock Market. The index is
weighted 50% towards patterns of selling and buying, and the rest 50% towards Vietnamese
Equity Market P/E ratio in terms of 10-year Vietnamese Government Treasury yield. The
monthly VICI is used in this paper. The VICI is a composite index that consists of two separated
sub-indices: (1) The Vietnam Domestic Investor Confidence Index (VDIC), and (2) the Vietnam
Foreign Investor Confidence Index (VFIC). The data on each sub-index is available over the
same period of time.
b. Time-series and stationarity
After processing the primary data, we use the following augmented Dickey-Fuller (ADF
test (1979) to diagnose the presence of a unit root:
∆y� = �� + ����� +���∆y���
�
���
+ ��
∆y� = �� + �� + ����� +���∆y���
�
���
+ ��
The theory of unit root test underlies consideration of the ‘nuisance’ serial correlation. The
null hypothesis of the ADF test is γ = 0 versus the alternative hypothesis γ ≠ 0. Failing to reject
the null hypothesis means that the series under checking is not stationary, and a unit root exists.
The result of the ADF test is presented in Table 1 which shows that the null hypothesis that
the series under consideration are nonstationary (i.e., have a unit root) is significantly rejected at
the 1% level in all cases. The stationary of those variables ensure that our empirical analyses
below would not yield spurious outcomes. More importantly, we do not have to take into account
the possible cointegration problem associated with stock return and trading volume when
performing the (restricted) VAR model.
3.2. Methodology
15 For the detailed methodology of conducting the VICI, please visit the website of Woori bv: http://www.wooricbv.com/. We collect the data from Bloomberg.
Page 17
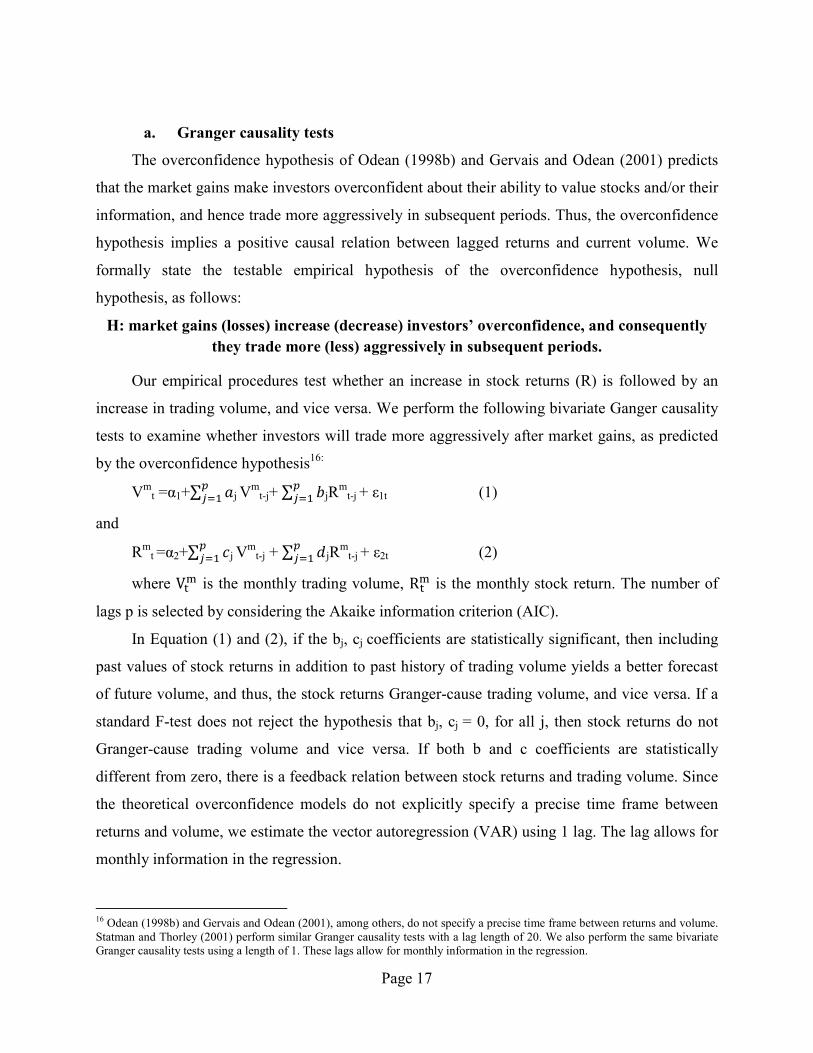
a. Granger causality tests
The overconfidence hypothesis of Odean (1998b) and Gervais and Odean (2001) predicts
that the market gains make investors overconfident about their ability to value stocks and/or their
information, and hence trade more aggressively in subsequent periods. Thus, the overconfidence
hypothesis implies a positive causal relation between lagged returns and current volume. We
formally state the testable empirical hypothesis of the overconfidence hypothesis, null
hypothesis, as follows:
H: market gains (losses) increase (decrease) investors’ overconfidence, and consequently
they trade more (less) aggressively in subsequent periods.
Our empirical procedures test whether an increase in stock returns (R) is followed by an
increase in trading volume, and vice versa. We perform the following bivariate Ganger causality
tests to examine whether investors will trade more aggressively after market gains, as predicted
by the overconfidence hypothesis16:
Vmt =α1+∑ �
���� j V
mt-j+ ∑ �
���� jR
mt-j + ε1t (1)
and
Rmt =α2+∑ �
���� j V
mt-j + ∑ �
���� jR
mt-j + ε2t (2)
where V�� is the monthly trading volume, R�
� is the monthly stock return. The number of
lags p is selected by considering the Akaike information criterion (AIC).
In Equation (1) and (2), if the bj, cj coefficients are statistically significant, then including
past values of stock returns in addition to past history of trading volume yields a better forecast
of future volume, and thus, the stock returns Granger-cause trading volume, and vice versa. If a
standard F-test does not reject the hypothesis that bj, cj = 0, for all j, then stock returns do not
Granger-cause trading volume and vice versa. If both b and c coefficients are statistically
different from zero, there is a feedback relation between stock returns and trading volume. Since
the theoretical overconfidence models do not explicitly specify a precise time frame between
returns and volume, we estimate the vector autoregression (VAR) using 1 lag. The lag allows for
monthly information in the regression.
16 Odean (1998b) and Gervais and Odean (2001), among others, do not specify a precise time frame between returns and volume. Statman and Thorley (2001) perform similar Granger causality tests with a lag length of 20. We also perform the same bivariate Granger causality tests using a length of 1. These lags allow for monthly information in the regression.

Page 18
To test the overconfidence hypothesis, we focus on the null hypothesis in which stock
returns do not Granger-cause trading volume. Rejection of the null hypothesis indicates that
stock returns Granger-cause trading volume, which implies that high (low) stock returns make
investors more (less) confident and consequently more (less) likely to trade aggressively in
subsequent periods.
The observation of positive causality running from stock returns to trading volume is not
adequate enough to provide clear evidence in supporting of the overconfidence hypothesis unless
we find evidence that market gains make investors become more confident. In this paper, we use
the Vietnam Investor Confidence Index (VICI). To directly examine whether the causal relation
between lagged stock returns and current trading volume is attributable to investors’
overconfidence, both foreign and domestic, we perform the following Granger causality tests:
Vmt =α1+ ∑ �
���� j V
mt-j+ ∑ �
���� j R
mt-j +∑ �
���� j VDICm
t-j + ∑ ����� j VFICm
t-j + ε1t (3)
Rmt =α1+ ∑ �
���� j V
mt-j+ ∑ �
���� j R
mt-j +∑ �
���� j VDICm
t-j + ∑ ℎ���� j VFICm
t-j + ε1t (4)
VDICmt =α1+ ∑ �
���� j V
mt-j+ ∑ �
���� j R
mt-j +∑ �
���� j VDICm
t-j + ∑ ����� jVFICm
t-j + ε1t (5)
VFICmt =α1+ ∑ ��
��� j Vm
t-j+ ∑ ����� j R
mt-j +∑ ��
��� j VDICmt-j + ∑ ��
��� j VFICmt-j + ε1t (6)
where VDICmt , and VFICm
t are the monthly Index of Domestic and Foreign Investors
Confidence respectively.
In the Granger causality tests, we focus on the null hypothesis that stock returns do not
Granger-cause trading volume, represented by bj = 0, for all j, and the null hypothesis that stock
returns do not Granger-cause the VDIC, and VFIC, represented by kj, oj = 0, for all j. If the
overconfidence hypothesis holds, it is expected to reject these three null hypothesis mentioned
above. Specifically, rejection of the null hypothesis that stock returns do not Granger-cause the
Index of Investor Confidence will provide direct evidence that market gains make investor,
whether foreign or domestic, become more confident given the identification of causality
running from stock returns to trading volume. On the other hand, rejection of the null hypothesis
that the VDIC and VFIC do not Granger-cause stock returns, represented by gj, hj = 0, for all j,
which provides evidence that Vietnam Investor Confidence Index contains information to predict
stock returns, or equivalently that stock returns are affected by investors’ confidence level.

Page 19
b. The Ordinary Least Squares regression on the Vector Autogressive Model
Due to the lack of capturing the contemporaneous relation by Granger causality tests, we
perform the following regression models to capture the contemporaneous relation between these
variables as Equations from (3) to (6).
This procedure is employed in an attempt to identify whether the VICI for both domestic
and foreign investors contains information to predict trading volume and stock returns.
We perform testing for serial correlation for error terms by Durbin-Watson test. The null
hypothesis, for example, that aj = 0, for all j, is tested by the Wald test statistic, which
asymptotically distributed as chi-squared with degrees of freedom equal to the number of
restriction.
The reason for using the lag length of 2 in Equation from (3) to (6) is due to Statman and
Thorley (2001) show that the most significant causal relation between stocks returns and trading
volume concentrates on the first two periods of past stock returns. Although the results of the
Granger causality tests show the significant power of lagged monthly stock returns for monthly
trading volume up to one past month, we arbitrarily use the lag length of 2.
c. The Ordinary Least Squares regression with HAC – Newey West standard
errors and covariance
As the same purpose of part (b) in section Methodology, we use another way to approach
the OLS in VAR for dynamic data set. In order to compare various methods for VAR to provide
more various aspects about the causality between stock returns – trading volume – overconfident
investors, we employ the Newey-West (1987a) for dynamic time series data.
To be more precise, by using the time-series data of stock returns and trading volume,
previous empirical studies show that the data creates a dynamic time series model17. Considering
the following dynamic time series model:
�� = �� + ����� + ����� + ⋯+ ����� + ����� + ��
17 Hans R. Stoll and Robert E. Whaley (1990) The Dynamics of Stock Index and Stock Index Futures Returns. See also Gong-meng Chen, Michael Firth, and Oliver M.Rui (2005) that show a dynamic positive correlation between trading volume and the absolute value of the stock price change. Granger causality tests demonstrate that for some countries, returns cause volume and volume causes returns.
Page 20
The OLS estimators tend to be bias, and we need to check for serial correlation in time
series models. In this case, we employ the Newey-West (1987a) standard errors to correct for
heteroskedasticity.
In this paper, we also simply conduct OLS as methodology (b), but then, we take advantage
of Newey-West (1987a) to obtain the coefficients and standard error estimated in Equations from
(3) to (6). However, the coefficient and standard errors observed in methodology (b) differ from
those obtained using the OLS in that we use the covariance matrix specified by Newey and West.
This procedure yields a covariance matrix that is more sensible in the presence of dynamic
models. The null hypothesis, for example, that aj = 0, for all j, is tested by the Wald test statistic,
which asymptotically distributed as chi-squared with degrees of freedom equal to the number of
restriction. We use the same lag length as the methodology (b).
Page 21
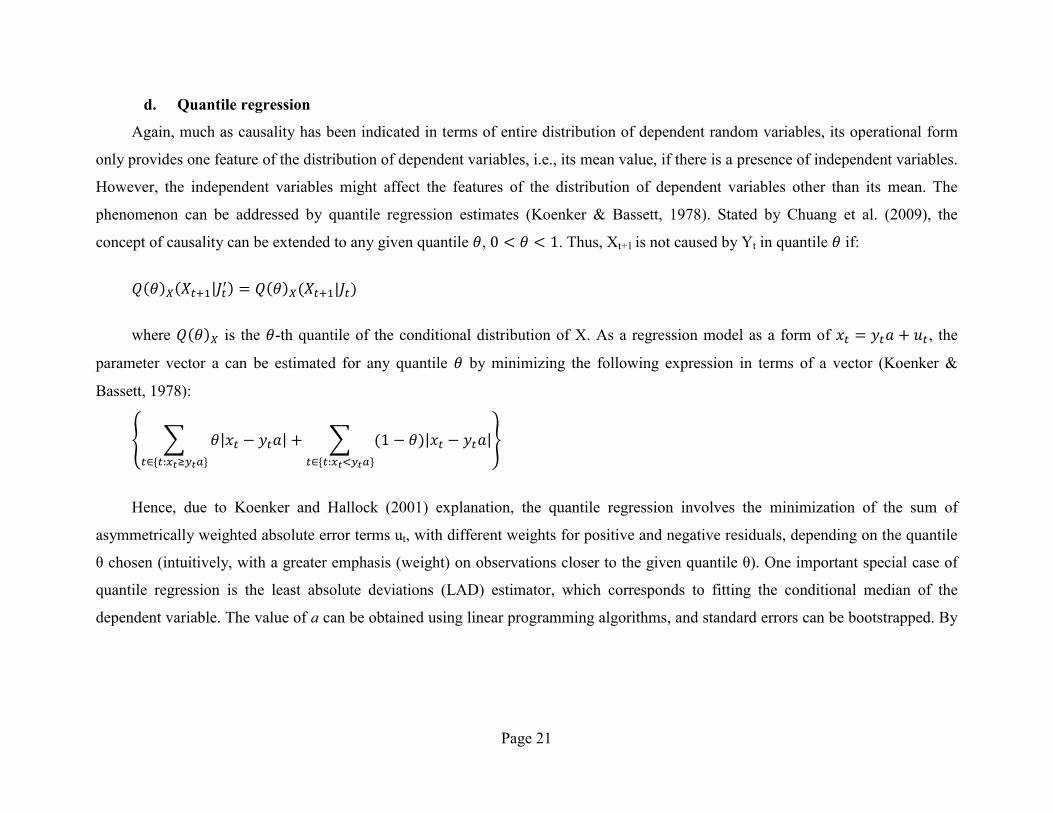
d. Quantile regression
Again, much as causality has been indicated in terms of entire distribution of dependent random variables, its operational form
only provides one feature of the distribution of dependent variables, i.e., its mean value, if there is a presence of independent variables.
However, the independent variables might affect the features of the distribution of dependent variables other than its mean. The
phenomenon can be addressed by quantile regression estimates (Koenker & Bassett, 1978). Stated by Chuang et al. (2009), the
concept of causality can be extended to any given quantile �, 0 < � < 1. Thus, Xt+1 is not caused by Yt in quantile � if:
�(�)�(����|��
�) = �(�)�(����|��)
where �(�)� is the �-th quantile of the conditional distribution of X. As a regression model as a form of �� = ��� + ��, the
parameter vector a can be estimated for any quantile � by minimizing the following expression in terms of a vector (Koenker &
Bassett, 1978):
� � �|�� − ���| + � (1 − �)|�� − ���|
�∈{�:������}�∈{�:������}
�
Hence, due to Koenker and Hallock (2001) explanation, the quantile regression involves the minimization of the sum of
asymmetrically weighted absolute error terms ut, with different weights for positive and negative residuals, depending on the quantile
θ chosen (intuitively, with a greater emphasis (weight) on observations closer to the given quantile θ). One important special case of
quantile regression is the least absolute deviations (LAD) estimator, which corresponds to fitting the conditional median of the
dependent variable. The value of a can be obtained using linear programming algorithms, and standard errors can be bootstrapped. By

Page 22
repeating the estimation for different quantiles θ = 0.05, 0.06,…0.95, we can obtain a full picture of the relationship between
dependent and independent variables across the whole distribution of the former, not just for its mean value.18
In the context of overconfidence bias – volume – returns causality, in a direct analogy to the models (5), the quantile regression
estimates can be obtained:
�(�)���������� ������ � = ��(�) + ��(�)�
�
�� + �� �
�
���
+ ∑ ��(�)����������� + ∑ ��(�)����
���� + ∑ ��(�)����
���� + ∑ ��(�)�������
���� (7)
The parameter estimates are quantile-specific bj(θ) and can differ across quantiles. For each of the quantile θ, the estimated
parameters bj(θ) can be used to test for Granger causality using conventional tests for joint significance such as the likelihood ratio,
Wald, Lagrange multiplier, F-test, or at-test if there is optimally only one lag.
18 Chuang et al. (2009) also propose a test of causality in multiple, or a range of, quantiles, rather than a particular quantile. However, being a test of an aggregate effect it cannot disclose more about causality than tests conducted for individual quantiles separately; therefore we rely on the latter in our analysis
Page 23
4. Results
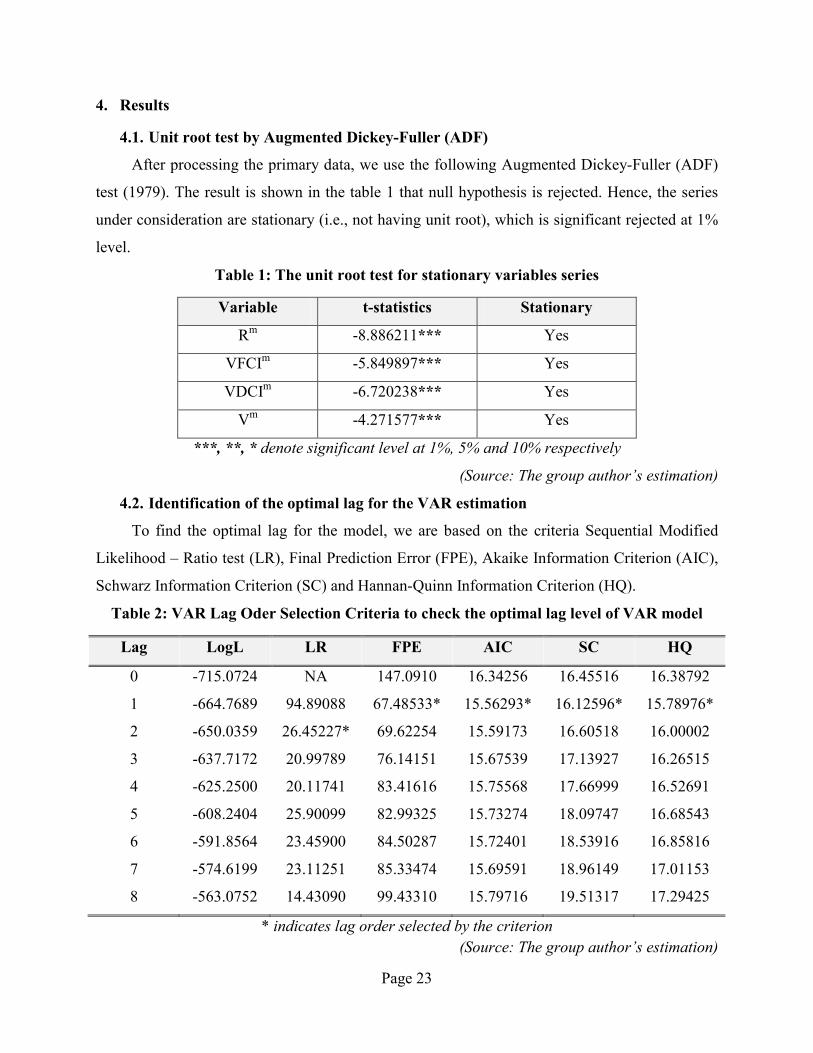
4.1. Unit root test by Augmented Dickey-Fuller (ADF)
After processing the primary data, we use the following Augmented Dickey-Fuller (ADF)
test (1979). The result is shown in the table 1 that null hypothesis is rejected. Hence, the series
under consideration are stationary (i.e., not having unit root), which is significant rejected at 1%
level.
Table 1: The unit root test for stationary variables series
Variable t-statistics Stationary
Rm -8.886211*** Yes
VFCIm -5.849897*** Yes
VDCIm -6.720238*** Yes
Vm -4.271577*** Yes
***, **, * denote significant level at 1%, 5% and 10% respectively
(Source: The group author’s estimation)
4.2. Identification of the optimal lag for the VAR estimation
To find the optimal lag for the model, we are based on the criteria Sequential Modified
Likelihood – Ratio test (LR), Final Prediction Error (FPE), Akaike Information Criterion (AIC),
Schwarz Information Criterion (SC) and Hannan-Quinn Information Criterion (HQ).
Table 2: VAR Lag Oder Selection Criteria to check the optimal lag level of VAR model
Lag LogL LR FPE AIC SC HQ
0
1
2
3
4
5
6
7
8
-715.0724
-664.7689
-650.0359
-637.7172
-625.2500
-608.2404
-591.8564
-574.6199
-563.0752
NA
94.89088
26.45227*
20.99789
20.11741
25.90099
23.45900
23.11251
14.43090
147.0910
67.48533*
69.62254
76.14151
83.41616
82.99325
84.50287
85.33474
99.43310
16.34256
15.56293*
15.59173
15.67539
15.75568
15.73274
15.72401
15.69591
15.79716
16.45516
16.12596*
16.60518
17.13927
17.66999
18.09747
18.53916
18.96149
19.51317
16.38792
15.78976*
16.00002
16.26515
16.52691
16.68543
16.85816
17.01153
17.29425
* indicates lag order selected by the criterion
(Source: The group author’s estimation)

Page 24
All of the tests are performed at significant 5% level. Except LR with different result, the
rest of them are shown that the optimal lag in VAR model is only one period. Hence, we decided
to choose the one-lag (1) for the further empirical tests in this paper.
4.3. Causal Relationship between Trading Volume and Stock Return
According to the previous hypothesis, we perform the bivariate Granger causality tests
related with stock returns and trading volume. After consideration regarding the lags level: 1
period (1 month), this table is demonstrated below to conclude the relationship between trading
volume and stock return.
Table 3: The Granger Causility between trading Volume and Stock Return at lag level 1
Null Hypothesis Observation F-Statistics Prob. Result
Vm does not
Granger Cause Rm 95
0.41083 0.5231 Fail to reject
null hypothesis
Rm doest not
Granger Cause Vm 6.59795** 0.0118
Reject null
hypothesis
***, **, * denote significant level at 1%, 5% and 10% respectively
(Source: The group author’s estimation)
In this case, the null hypothesis that stock returns do not Granger-cause trading volume is
strongly rejected at significant level at 5%, as indicated by the F-statistics, while the null
hypothesis that trading volume does not Granger-cause stock returns can not be rejected. This
can be interpreted that the investors tend to aggressively trade after making a profit from the
market. To be more explicable, if the stock return is contributed to the investors’ gain, they have
a tendency to be more confident of their ability of indicating information; then, it leads to more
volume in the market. All of them accord with the content by Odean (1998b) and Gervais and
Odean (2001) as suggested by the overconfidence hypothesis.
4.4. Causal Relationships among Trading Volume, Stock Returns, Vietnam Domestic
Investor Confidence Index and Vietnam Foreign Investor Confidence Index
Although the above results are consistent with the prediction of the overconfidence
hypothesis associated with the relation between trading volume and stock returns, it is very
unbiased to conclude before finding the components when market gains will directly impact on
the level of confidence by the investors (for both domestic and foreign aspect).

Page 25
Table 4: The Granger Causality between Trading Volume and Stock Return, Vietnam Domestic Investor Confidence Index and Vietnam Foreign Investor Confidence Index at
lag level 1
Null Hypothesis Observation F-Statistics Prob. Result
VDICm does not
Granger Cause Rm 95
4.14921** 0.0455 Reject null
hypothesis
Rm doest not Granger
Cause VDICm 9.00313*** 0.0035
Reject null
hypothesis
VFICm does not
Granger Cause Rm
95 0.16994 0.6811
Fail to reject
null hypothesis
Rm doest not Granger
Cause VFICm 0.28994 0.5916
Fail to reject
null hypothesis
VFICm does not
Granger Cause VDICm
95 0.00082 0.9772
Fail to reject
null hypothesis
VDICm doest not
Granger Cause VFICm 0.29656 0.5874
Fail to reject
null hypothesis
Vm does not Granger
Cause VDICm
95 3.63154* 0.0598
Reject null
hypothesis
VDICm doest not
Granger Cause VFICm 0.34036 0.5611
Fail to reject
null hypothesis
Vm does not Granger
Cause VFICm
95 2.05640 0.1550
Fail to reject
null hypothesis
VFICm doest not
Granger Cause Vm 0.01514 0.9024
Fail to reject
null hypothesis
***, **, * denote significant level at 1%, 5% and 10% respectively
(Source: The group author’s estimation)
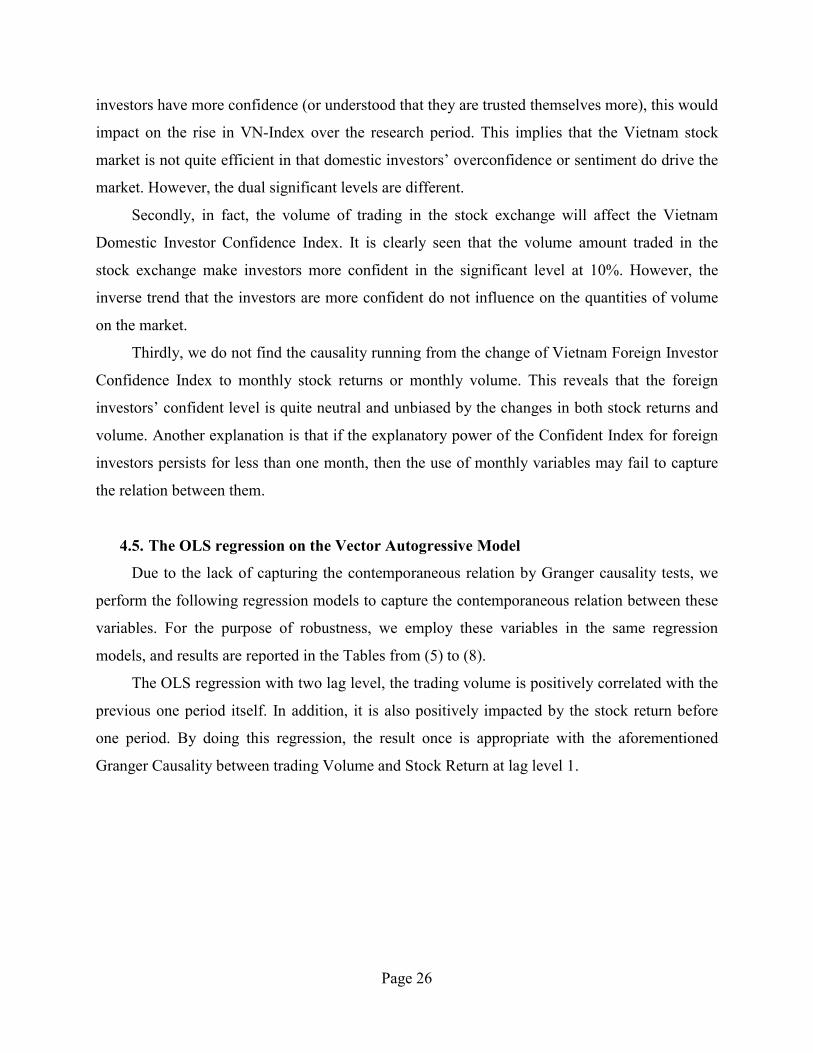
According to the result shown in the table above, there are two noteworthy points regarding
Granger Causality for many variables here. Firstly, there is dual influence between Vietnam
Domestic Investor Confidence Index and Stock Return. This means that when an increase in the
index calculating domestic investor confidence, which impacts on the gain of return for investors
and vice versus in significant level at 5% and 1% respectively. It indicates that when the
Page 26
investors have more confidence (or understood that they are trusted themselves more), this would
impact on the rise in VN-Index over the research period. This implies that the Vietnam stock
market is not quite efficient in that domestic investors’ overconfidence or sentiment do drive the
market. However, the dual significant levels are different.
Secondly, in fact, the volume of trading in the stock exchange will affect the Vietnam
Domestic Investor Confidence Index. It is clearly seen that the volume amount traded in the
stock exchange make investors more confident in the significant level at 10%. However, the
inverse trend that the investors are more confident do not influence on the quantities of volume
on the market.
Thirdly, we do not find the causality running from the change of Vietnam Foreign Investor
Confidence Index to monthly stock returns or monthly volume. This reveals that the foreign
investors’ confident level is quite neutral and unbiased by the changes in both stock returns and
volume. Another explanation is that if the explanatory power of the Confident Index for foreign
investors persists for less than one month, then the use of monthly variables may fail to capture
the relation between them.
4.5. The OLS regression on the Vector Autogressive Model
Due to the lack of capturing the contemporaneous relation by Granger causality tests, we
perform the following regression models to capture the contemporaneous relation between these
variables. For the purpose of robustness, we employ these variables in the same regression
models, and results are reported in the Tables from (5) to (8).
The OLS regression with two lag level, the trading volume is positively correlated with the
previous one period itself. In addition, it is also positively impacted by the stock return before
one period. By doing this regression, the result once is appropriate with the aforementioned
Granger Causality between trading Volume and Stock Return at lag level 1.

Page 27
Table 5: The OLS regression to estimation the relationship between trading Volume and
Stock Return, Vietnam Domestic Investor Confidence Index and Vietnam Foreign Investor
Confidence Index at lag level 1 and level 2
Vmt =α1+ ∑ ��
��� j Vm
t-j+ ∑ ����� j R
mt-j +∑ ��
��� j VDICmt-j + ∑ ��
��� j VFICmt-j + ε1t
Dependent
Variable Vm
t
Independent
Variable Vm
t-j Rmt-j VDICm
t-j VFICmt-j
Lag j
aj
(t-statistics)
bj
(t-statistics)
cj
(t-statistics)
dj
(t-statistics)
1 0.611274***
(5.347198)
71.23333**
(2.153303)
0.057963
(0.684574)
0.030618
(0.743867)
2 -0.003609
(-0.033225)
45.49869
(1.346787)
-0.037570
(-0.436781)
0.042023
(-1.028064)
Adjusted R2 0.485203
Durbin-Watson 2.032302
***, **, * denote significant level at 1%, 5% and 10% respectively
(Source: The group author’s estimation)
In this regression, we completely define that the trend of impact is positive. This means that
when the stock return increase, the quantities of volume in the stock exchange increase with
significant level at 5%. Interestingly, it is noted that the current number of volume is positively
affected by the previous period figures at significant level 1%.
Previous empirical studies have documented that trading volume contemporaneously
increases with the absolute value of stock returns (e.g., Karpoff (1987)). This can be observed in
Table 5.
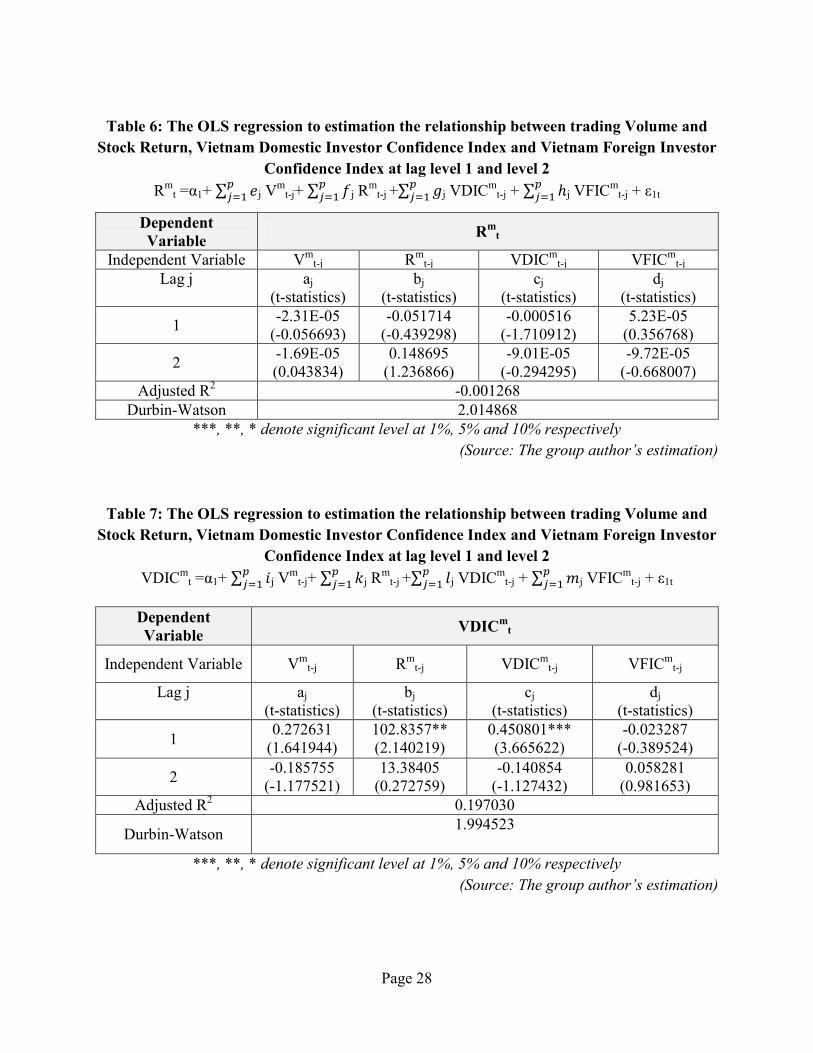
The 6 provides the evidence that these factors such as volume, previous return, domestic
confidence and foreign confidence do not impact on current return at any significant level. Then,
it is not related to the hypothesis which is stated.
Page 28
Table 6: The OLS regression to estimation the relationship between trading Volume and
Stock Return, Vietnam Domestic Investor Confidence Index and Vietnam Foreign Investor
Confidence Index at lag level 1 and level 2
Rmt =α1+ ∑ ��
��� j Vm
t-j+ ∑ ����� j R
mt-j +∑ ��
��� j VDICmt-j + ∑ ℎ�
��� j VFICmt-j + ε1t
Dependent Variable
Rmt
Independent Variable Vmt-j Rm
t-j VDICmt-j VFICm
t-j Lag j
aj
(t-statistics) bj
(t-statistics) cj
(t-statistics) dj
(t-statistics)
1 -2.31E-05
(-0.056693) -0.051714
(-0.439298) -0.000516
(-1.710912) 5.23E-05
(0.356768)
2 -1.69E-05 (0.043834)
0.148695 (1.236866)
-9.01E-05 (-0.294295)
-9.72E-05 (-0.668007)
Adjusted R2 -0.001268 Durbin-Watson 2.014868
***, **, * denote significant level at 1%, 5% and 10% respectively
(Source: The group author’s estimation)
Table 7: The OLS regression to estimation the relationship between trading Volume and
Stock Return, Vietnam Domestic Investor Confidence Index and Vietnam Foreign Investor
Confidence Index at lag level 1 and level 2
VDICmt =α1+ ∑ ��
��� j Vm
t-j+ ∑ ����� j R
mt-j +∑ ��
��� j VDICmt-j + ∑ ��
��� j VFICmt-j + ε1t
Dependent Variable
VDICmt
Independent Variable Vmt-j Rm
t-j VDICmt-j VFICm
t-j
Lag j
aj
(t-statistics) bj
(t-statistics) cj
(t-statistics) dj
(t-statistics)
1 0.272631
(1.641944) 102.8357** (2.140219)
0.450801*** (3.665622)
-0.023287 (-0.389524)
2 -0.185755
(-1.177521) 13.38405
(0.272759) -0.140854
(-1.127432) 0.058281
(0.981653) Adjusted R2 0.197030
Durbin-Watson 1.994523
***, **, * denote significant level at 1%, 5% and 10% respectively
(Source: The group author’s estimation)

Page 29
It is noticeable that both variable return and previous domestic confidence level during one
lag period impact on the current domestic confidence level at significant 5% and 1%
respectively. Hence, when the return on stock market increases, the level of investors’
confidence will rise.
Table 8: The OLS regression to estimation the relationship between trading Volume and
Stock Return, Vietnam Domestic Investor Confidence Index and Vietnam Foreign Investor
Confidence Index at lag level 1 and level 2
VFICmt =α1+ ∑ ��
��� j Vm
t-j+ ∑ ����� j R
mt-j +∑ ��
��� j VDICmt-j + ∑ ��
��� j VFICmt-j + ε1t
Dependent
Variable VFICm
t
Independent
Variable Vm
t-j Rmt-j VDICm
t-j VFICmt-j
Lag j
aj
(t-statistics)
bj
(t-statistics)
cj
(t-statistics)
dj
(t-statistics)
1 0.738213***
(2.623053)
71.57800
(0.878894)
-0.058713
(-0.281668)
0.447354***
(4.414759)
2 -0.527745**
(-1.973761)
-70.76681
(-0.850873)
0.133894
(0.632303)
-0.002300
(-0.022858)
Adjusted R2 0.239483
Durbin-Watson 2.004811
***, **, * denote significant level at 1%, 5% and 10% respectively
(Source: The group author’s estimation)
Interestingly, the level of confidence by foreign investors is affected by the traded volume
within two lag level. In addition, this dependent variable could be explained by previous 1 lag
period itself. Meanwhile, the result can be interpreted that the stock return does not impact on the
level of foreigners’ confidence. There is a contrast between the level of confidence between the
domestic investors and foreign ones. While the return is the significant factor impacting on the
Vietnam Domestic Investor Confidence Index, the volume is considered as the critical factor
influencing on Vietnam Foreign Investor Confidence Index during both two lag level.

Page 30
4.6. The Ordinary Least Squares regression on the Vector Autogressive Model with
dynamic time series model
In order to compare various methods for VAR to provide more various aspects about the
causality between stock returns – trading volume – overconfident investors, we employ the OLS
with Newey-West (1987a) for dynamic time series data. The causal relationships between the
four variables are presented in Tables from (9) to (12).
Table 9: The OLS regression with HAC – Newey West standard errors and covariance to estimation the relationship between trading Volume and Stock Return, Vietnam Domestic Investor Confidence Index and Vietnam Foreign Investor Confidence Index at lag level 1
and level 2
Vmt =α1+ ∑ �
���� j V
mt-j+ ∑ �
���� j R
mt-j +∑ �
���� j VDICm
t-j + ∑ ����� j VFICm
t-j + ε1t
Dependent Variable
Vmt
Independent Variable
Vmt-j Rm
t-j VDICmt-j VFICm
t-j
Lag j
aj
(t-statistics) bj
(t-statistics) cj
(t-statistics) dj
(t-statistics)
1 0.611274*** (7.222983)
71.23333** (2.564956)
0.057963 (1.192327)
0.030618 (0.779878)
2 -0.003609
(-0.046020) 45.49869
(1.654766) -0.037570
(-0.615352) -0.042023
(-0.832740) Adjusted R2 0.485203
Durbin-Watson 2.032302 Wald test X2
(p-value) 1615.017 (0.0000)
***, **, * denote significant level at 1%, 5% and 10% respectively
(Source: The group author’s estimation)
Table 9 shows that the strong positive causal relation between lagged monthly stock returns
and current monthly trading volume is statistically significant in the full period of the sample.
The effect of the last stock returns impacts on trading volume with the lag length of 1, or to put it
another way, this effect focus on within one month. We do not get the evidence that show causal
relation between confident level index of both domestic and foreign investors, and the trading
volume. This implies that the confident level index contains no additional information to predict
trading volume. Another explanation is that the influence of the investors’ confidence index on
trading volume lasts faster than one month, and then the use of monthly variables may fail to
capture the relation between them.

Page 31
However, in the Table 10, the asymmetric response of trading volume to contemporaneous
stock returns is not significant for statistic purposes. Instead, there is a negative relation of
Vietnam Domestic Investors Confidence to stock return with the lag of 1 month. This indicated
that the more confident investors are, the more trading volume they exercise19, and unfortunately
the less return they can gain. This finding is so interesting when the previous study of Barber and
Odean (2002) find that investors who have often earned high returns are more likely to switch
from phone-based to online trading. Online investors trade more frequently and perform worse.
They argue that one important reason for the switch is overconfidence. In retrospect, Vietnam
has changed to launch online trading system in Vietnam stock market since 2008.
Table 10: The OLS regression with HAC – Newey West standard errors and covariance to estimation the relationship between trading Volume and Stock Return, Vietnam Domestic Investor Confidence Index and Vietnam Foreign Investor Confidence Index at lag level 1
and level 2
Rmt =α1+ ∑ �
���� j V
mt-j+ ∑ �
���� j R
mt-j +∑ �
���� j VDICm
t-j + ∑ ℎ���� j VFICm
t-j + ε1t
Dependent Variable
Rmt
Independent Variable Vmt-j Rm
t-j VDICmt-j VFICm
t-j Lag j
aj
(t-statistics) bj
(t-statistics) cj
(t-statistics) dj
(t-statistics)
1 -2.31E-05
(-0.050017) -0.051714
(-0.871978) -0.000516*** (-5.714313)
5.23E-05 (0.331081)
2 -1.69E-05 (0.043876)
0.148695** (3.013389)
-9.01E-05 (-0.616656)
-9.72E-05 (-1.478740)
Adjusted R2 -0.001268 Durbin-Watson 2.014868
Wald test X2
(p-value) 173.7488 (0.0000)
***, **, * denote significant level at 1%, 5% and 10% respectively
(Source: The group author’s estimation)
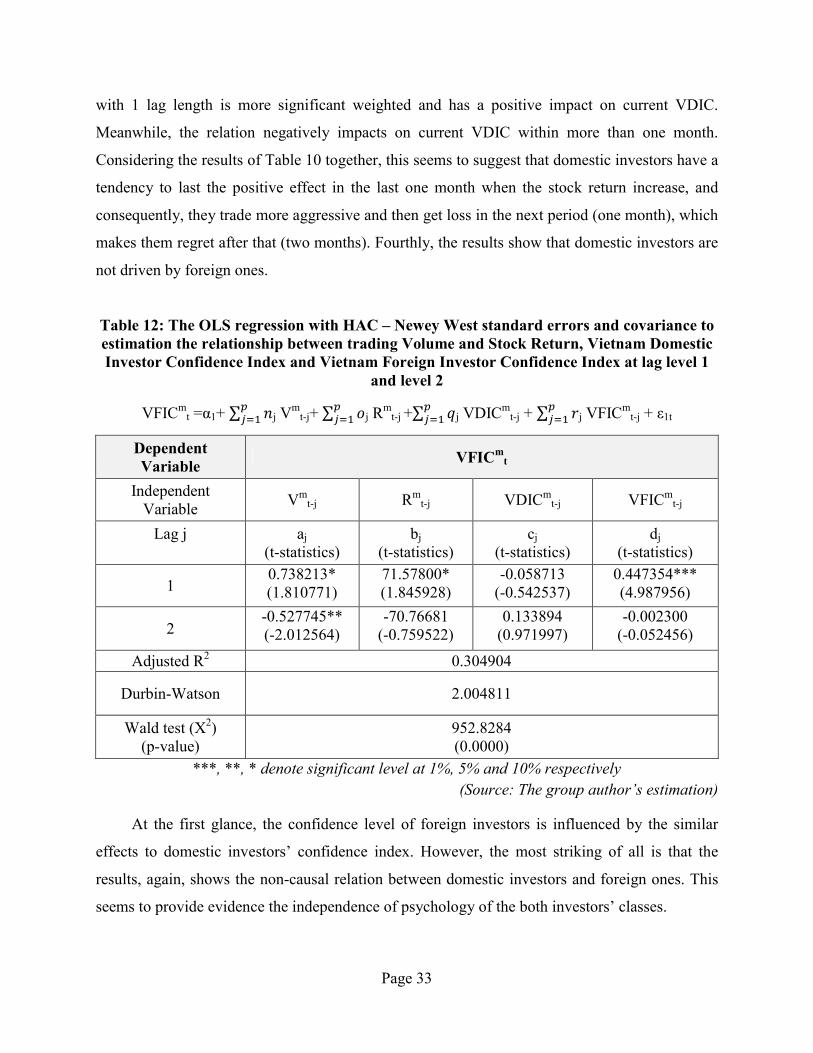
Nonetheless, the model is not completely a strong statistic model – Equation (4) because of
a very small adjusted R2. This seems to suggest that the market is still quite efficient in that
investors’ overconfidence does not drive the market. Hence, we take the finding as an interesting
reference for Vietnam stock market during 2008 – 2015.
19 We find that there is a Granger causality from trading volume to confident level of domestic investors. The result is mentioned in part 4.4

Page 32
Table 11: The OLS regression with HAC – Newey West standard errors and covariance to estimation the relationship between trading Volume and Stock Return, Vietnam Domestic Investor Confidence Index and Vietnam Foreign Investor Confidence Index at lag level 1
and level 2
VDICmt =α1+ ∑ ��
��� j Vm
t-j+ ∑ ����� j R
mt-j +∑ ��
��� j VDICmt-j + ∑ ��
��� j VFICmt-j + ε1t
Dependent Variable
VDICmt
Independent Variable Vmt-j Rm
t-j VDICmt-j VFICm
t-j
Lag j
aj
(t-statistics) bj
(t-statistics) cj
(t-statistics) dj
(t-statistics)
1 0.272631** (2.305401)
102.8357** (3.293819)
0.450801*** (7.260414)
-0.023287 (-1.218172)
2 -0.185755** (-2.031718)
13.38405 (0.765228)
-0.140854** (-2.168532)
0.058281 (1.193888)
Adjusted R2 0.266103
Durbin-Watson 1.994523
Wald test X2
(p-value) 283.6627 (0.0000)
***, **, * denote significant level at 1%, 5% and 10% respectively
(Source: The group author’s estimation)
Table 11 shows the results of regression for Equation (5). In general, the model is quite
sensible when adjusted R2 is around 27% and reject the null hypothesis of Wald test.
It is very interesting to indicate that the confidence level index of domestic investors is
driven by many variables, namely trading volume, stock returns and Vietnam Domestic
Confidence Index with significant statistical level.
Firstly, in terms of the causal relationship from trading volume, we find that there is the
positive relation between the lagged trading volume within one month. However, the relationship
has a negative effect in the last two periods. Secondly, again, we show strong evidence that stock
returns has a positive impact on the level of confidence among domestic investors. Taken
together, this seems to imply that the trading volume and stock return effects play a potential role
in the causal relation between three of them, which is consistent with the overconfidence
hypothesis that we want to test. Thirdly, the lagged Vietnam Domestic Investor Confidence
contains some information to predict the trend of current confidence index of domestic investors.
However, the effect is completely different within two month. Particularly, the lagged VDIC
Page 33
with 1 lag length is more significant weighted and has a positive impact on current VDIC.
Meanwhile, the relation negatively impacts on current VDIC within more than one month.
Considering the results of Table 10 together, this seems to suggest that domestic investors have a
tendency to last the positive effect in the last one month when the stock return increase, and
consequently, they trade more aggressive and then get loss in the next period (one month), which
makes them regret after that (two months). Fourthly, the results show that domestic investors are
not driven by foreign ones.
Table 12: The OLS regression with HAC – Newey West standard errors and covariance to estimation the relationship between trading Volume and Stock Return, Vietnam Domestic Investor Confidence Index and Vietnam Foreign Investor Confidence Index at lag level 1
and level 2
VFICmt =α1+ ∑ ��
��� j Vm
t-j+ ∑ ����� j R
mt-j +∑ ��
��� j VDICmt-j + ∑ ��
��� j VFICmt-j + ε1t
Dependent Variable
VFICmt
Independent Variable
Vmt-j Rm
t-j VDICmt-j VFICm
t-j
Lag j
aj
(t-statistics) bj
(t-statistics) cj
(t-statistics) dj
(t-statistics)
1 0.738213* (1.810771)
71.57800* (1.845928)
-0.058713 (-0.542537)
0.447354*** (4.987956)
2 -0.527745** (-2.012564)
-70.76681 (-0.759522)
0.133894 (0.971997)
-0.002300 (-0.052456)
Adjusted R2 0.304904
Durbin-Watson 2.004811
Wald test (X2) (p-value)
952.8284 (0.0000)
***, **, * denote significant level at 1%, 5% and 10% respectively
(Source: The group author’s estimation)
At the first glance, the confidence level of foreign investors is influenced by the similar
effects to domestic investors’ confidence index. However, the most striking of all is that the
results, again, shows the non-causal relation between domestic investors and foreign ones. This
seems to provide evidence the independence of psychology of the both investors’ classes.

Page 34
4.7. The quantile regression with level (0.25; 0.5 and 0.75) for the Vietnam Domestic
Investor Confidence Index
Due to the result of Granger causality and the OLS regression, we find that there is no
relationship between Vietnam Domestic Investor Confidence Index and Vietnam Foreign
Investor Confidence Index. However, this finding seems to be not sensible when analyzing the
actual cases observed in Vietnam stock market20. Therefore, we continue to use quantile
regression to split this factor (Vietnam Domestic Investor Confidence) by each quantile to
carefully consider the trend of impact. Due to the financial crisis in Vietnam during 2007-2009,
the variance of these variables fluctuated highly (heteroskedasticity). Therefore, the quantile
regression will fix this problem and provide the consistent result.
Table 13: The quantile regression for Vietnam Domestic Investor Confidence Index over Trading Volume and Stock Return, Vietnam Foreign Investor Confidence Index
VDICm Coef. [95% Confident Interval]
q25
Rm -91.82733 -239.6674 56.01275
VFCIm 0.1717591* -0.0196751 -0.3631933
Vm 0.3656993*** 0.0945279 0.6368707
Cons -9.156565 -15.43475 -2.878383
q50
Rm -141.2729 -347.3826 64.83682
VFCIm 0.2239844*** 0.1073586 0.3406101
Vm 0.2905905** 0.0300086 0.5511724
Cons -4.061677 -8.873369 0.750016
q75
Rm -126.061 -273.9038 21.78174
VFCIm 0.1797593*** 0.0452845 0.3142341
Vm 0.351346*** 0.1155227 0.5871692
Cons -0.6232079 -4.026606 2.78019
***, **, * denote significant level at 1%, 5% and 10% respectively
(Source: The group author’s estimation)
20 We mention practical evidence in Vietnam stock market in which the foreign investors, as funds and securities companies, lead the market in literature review. See also “The courage of misguided convictions” by Barber, Odean (1999) state that expert investors tend to be overconfident in their study fields and this effect has a positive causal relationship to others who take part in the market without enough foundation knowledge.

Page 35
According to the result stated in the table above, three factors Trading Volume and Stock
Return, Vietnam Foreign Investor Confidence Index will significantly impact on the Vietnam
Domestic Investor Confidence Index. In particular, to the smallest quantile with τ = 0.25 (the
lowest index), the volume influences in the strongest way at significant level 1% whereas the
foreign investors only contribute at level 10%. To sum up, the domestic investors with low
volatility in overconfident level are mostly guided by the volume. However, at the medium
quantile (τ = 0.5), the impact from foreign investors increases and dominates at the significant
level 1%. This proves that the domestic investors’ confidence is affected by foreign more than
quantity of volume. Finally, at the highest quantile (τ = 0.75), both foreign confidence index
and traded volume are highly contributed to the domestic confidence index. Therefore, the
domestic investors having a large of capital and strong power on stock exchange are influence by
foreign investors and trade volume. The expected way of impact is positive and they are also
appropriate with the literature review stated above. It is also compliant with: “Investors’
overconfidence is posited to be stronger in a bull market” (e.g., DHS (2001)).
Page 36
5. Conclusion remarks
Overconfidence has been proposed as an important explanation for the observed stylized
anomalies in securities markets. Building on previous theoretical works, we derive the testable
empirical hypotheses of the overconfidence hypothesis: market gains (losses) increase (decrease)
investors’ overconfidence, and consequently they trade more (less) aggressively in subsequent
periods.
We find that high stock returns are always followed by high trading volume regardless of
the measure of trading volume. By performing the Granger causality tests in which the Vietnam
Investors Confidence Index is used as a proxy for measuring the level of investors’ confidence,
we provide evidence that the result that high stock returns are followed by high trading volume is
primarily attributable to investors’ overconfidence enhanced by high stock returns in that stock
returns positively Granger-cause the Vietnam Investors Confidence Index (and its two index
factors: the Vietnam Domestic Investors Confidence, and the Vietnam Foreign Investors
Confidence) irrespective of the measure of trading volume.
By performing the Ordinary Least Squares (OLS) regression on the Vector Autogressive
Model (VAR) and the OLS with HAC – Newey West standard errors and covariance, we find
that the three main following findings.
First, there is the strong positive causal relation between lagged monthly stock returns and
current monthly trading volume, but there is not any causal relation from trading volume to stock
returns, which implies that stock return is not driven by trading volume. We also do not the
evidence that show causal relation between confident level index of both domestic and foreign
investors, and the trading volume. This implies that the confident level index contains no
additional information to predict trading volume. Another explanation is that the influence of the
investors’ confidence index on trading volume lasts faster than one month, and then the use of
monthly variables may fail to capture the relation between them.
Second, there is a negative relation of Vietnam Domestic Investors Confidence to stock
return with the lag of 1 month and a positive relation of trading volume to Vietnam Domestic
Investors Confidence. This indicates that the more confident investors are, the more trading
volume they exercise, and unfortunately, the less return they can gain. In previous studies,
Barber and Odean (2002) find that investors who have often earned high returns are more likely
to switch from phone-based to online trading. Online investors trade more frequently and

Page 37
perform worse. They argue that one important reason for the switch is overconfidence. In
retrospect, Vietnam has changed to launch online trading system in Vietnam stock market since
2008. This finding also seems to suggest that the market is not efficient in which the
overconfidence of investors can impact on the market. However, this impact is not significant.
Therefore, it is seen as reference information.
Third, we find that domestic investors have a tendency to last the positive effect in the last
one month when the stock return increase, and consequently, they trade more aggressive and
then get loss in the next period (one month), which makes them regret after that (two months).
This is also supporting evidence for the second finding above.
For the purpose to robust the evidence, we perform Quantile regression. The finding shows
that there exits a causal impact from foreign investors to domestic ones, which creates more and
more influence on the investors who show high volatility of their overconfident behavior in
Vietnam stock market. It indicates that Investors’ overconfidence is posited to be stronger in a
bull or bear market.

Page 38
6. Implications
(1). Building a set of indexes measuring overconfidence of individual investors in Vietnam’s
stock market
The research result confirms the existence of overconfidence of individual investors in
stock market and its impact on investors’ behaviors. Based on the result of this research, we
recommend that Stock Exchange, along with quantitative indexes such as: HNX30 (built by
Hanoi Stock Exchange), VN30 (built by Ho Chi Minh Stock Exchange), VIR50 (built by The
Vietnam Investment Review), should build a set of indexes measuring overconfidence of
individual investors and publish them widely. Stock Exchanges could refer to some public and
highly reliable confidence indexes like ICS – The Michigan Index of Consumer Sentiment, for
example. Nowadays, in Vietnam, some of the confidence indexes have been built such as: VICI
– Vietnam Investment Confident Index (built by Woori Securities Company) – we employ this
index in our research, VCSI – Vietnam Consumer Sentiment Index (built by Nielsen market
researching company) and other indexes built by some organization like ANZ bank and Roy
Morgan market researching company, TNS market researching company. We recommend that
Stock Exchanges should conduct online surveys or statistical collection of intraday transactions
and then analyze based on the data to make reasonable market regulations. In order to ensure that
the gathered information has high reliability (in case of using survey methodology through
questionnaires), we recommend using rotating panel sample design methodology instead of
random sampling.
(2). Building investment managing model based on overconfidence of investors
Research results have shown the psychological impact of overconfidence in the decision-
making behavior of investors and management. In fact, apart from obvious impacts on
investment, overconfidence can also affect capital structure. Based on the study result and
psychological models applying overconfidence theory, we recommend using the model of Dirk
Hackbarth as a reference. Dirk Hackbarth designed model in which the managers are not only
overly optimistic about the prospects of the company, but also excessively certain of their views.
This model proposes that overconfidence in governance is positively correlated with the issuance
of debt, because optimism about future cash flows may lead to a belief that there would be little

Page 39
problem in getting interest coverage. Fortunately, the nature of debt avoiding trend is due to
worry about work neutralized by overconfidence.
(3). The independence between foreign investors and domestic investors
The result has shown that the trading activities between foreign investors and domestic
investors are independent. This means that the group authors do not find any evidence that the
Vietnamese investors are led by the foreigners. Therefore, the Vietnamese investors should
consider the foreigner’s behavior as the reference information about trading in the Vietnam stock
exchange. This will help them to have right decision in the market rather than follow the other
strategies without consideration.
(4). Determination of the gain loss threshold
As analyzed from the result above, online investors trade more frequently and perform
worse (Barber and Odean, 2002), then this theory coincides with the result stating that the stock
return and domestic confidence level is negatively impacted. The group authors suggest that the
investors should set the gain loss threshold instead of trusting in their behavior and feeling. This
leads to the sensible reaction on the stock exchange to help the stock return reflect the true and
fair information on the stock price.
(5). The Vietnamese stock exchange is not efficient
According to the result stated above, the stock return in Vietnam is adversely influenced by
the investors’ behavior. Therefore, the group authors come to conclusion that the Vietnamese
market is not efficient. In the effective market theory, the investors’ behaviors will not earn
abnormal stock return; all the sufficient information regarding bad news or good news will
reflect on the stock market. However, in Vietnam, ‘Vietnam domestic confidence index’ can be
among the key drivers. Hence, the suggestion for the governing authorities is to control the
crowding psychology in investment. In addition, the investors need to consider the technical
analysis along with basics analysis to give the highest return as expected.

Page i
REFERENCES
1. Barber, Brad M, and Odean Terrance (1999), The Courage of Misguided Convictions,
Financial Analysts Journal 55(6).
2. Daniel, Kent, David Hirshleifer, and Avanidhar Subrahmanyam. (1998), Investor psychology
and sercurity marker under and overreactions.
3. Klecka, William R. (1980), Discriminant Analysis Series: Quantitative Applications in the
Social Sciences, USA: SAGE Publications. Inc.
4. Odean Terrance (1998), Volume, Volatility, Price, and Profit When All Traders Are Above
Average.
5. Odean, Terrance (1998), Are investors reluctant to realize their losses, Journal of Finance 53.
6. Shefrin. H (2000), Beyond Greed and Fear: Understanding Behavioral Finance and
Psychology of Investing, Harvard Business School Press, Boston, Massachusetts.
7. Shefrin H. and M. Statman (1985), The disposition to sell winners too early and ride losers
too long: Theory and evidence, Journal of Finance 40.
8. Tversky A. and D. Kahneman (1973), Availability: A heuristic for judging frequency and
probability, Cognitive Psychology 4.
9. Tversky A. and D. Kahneman, (1974), Judgment under uncertainty: Heuristics and biases,
Science 185
10. Chia-Chang Chuang, Chung-Ming Kuan, Hsin-Yi Lin (2008), Causality in quantiles and
dynamics stock return-volume relations, Journal of Finance.
11. Bartosz Gebka, Mark E. Wohar (2011) Causality between trading volume and returns:
Evidence from quantile regressions, Journal of Finance.

Page ii
APPENDIX
1. The test of appropriateness of model
In order to check the appropriateness of model, we perform the test of residual. This means
that we need to consider the residual are white noise.
Figure 1: The autocorrelation for the residual for the VAR model
(Source: The author’s estimation)
We also perform VAR Residual Heteroskedasticity Tests to check the appropriateness of
model. The hypothesis is stated that the residual is white noise. According to the figure above, all
the lines are under the acceptance level (the horizontal line), therefore, the residual of VAR
model is white noise. Table 10 shows the joint test result.

Page iii
Table 14: The result of VAR Residual Heteroskedasticity Tests
Joint test df Prob
Chi-square 231.8751 160 0.0002***
***, **, * denote significant level at 1%, 5% and 10% respectively
(Source: The author’s estimation)
Due to the p-value < α = 0.01, we reject the null hypothesis above. Therefore, the residual
in VAR model is the white noise. Therefore, the model is quite appropriate to estimate result.