empirical analysis of performance of cdm projects: case study india
TRANSCRIPT

Empirical analysis of performance of CDM projects: case study India
Discussion paper CDM-7
February 2008
Paula Castro*, Gudrun Benecke†
Abstract: A sample of 5% of the Indian CDM projects registered until end of June 2007 (11 projects) and 10% of the projects that had been submitted for public comments before June 2006, but not been submitted for registration by June 2007 (12 projects) are evaluated in terms of their lead times and expected CER generation, additionality argumentation, stakeholder participation and sustainability benefits. On average, the forecasted amount of CERs till 2012 is reduced by 23.1% between validation and issuance. As this assessment is based in most cases on data form the first verification report, when project staff is still in a learning phase, the overall performance in terms of CERs till 2012 may still improve. All registered projects claiming CERs after registration experienced a delay of over 6 months in the expected start of the crediting period. While 19 out of 23 projects perform a barrier analysis to demonstrate additionality, 16 PDDs argue having investment barriers, on the basis of the risks borne by the projects, difficulties in achieving financial closure, the higher costs than in the alternative scenario or the low expected returns. In some cases, however, the investment barriers are not totally convincing. 14 projects also mention technological barriers for implementation, and 11 claim having faced prevailing practice barriers. Only five out of the 23 analysed projects consistently cite independent evidence to substantiate the additionality argumentation. 21 out of the 23 analysed projects include a common practice analysis, but a third of them make it very briefly. Only 12 PDDs describe the impact of CDM for project implementation in detail. Six of the projects received public comments criticising their additionality argumentation, and also six had requests for clarifications or corrections from the DOE. In India there is no standard procedure for inviting stakeholders to issue comments on CDM projects, and several PDDs seem to present just the process of acquiring the governmental and local licenses and clearances as stakeholder consultation. The comments received from stakeholders refer mainly to expected local job generation, feared negative environmental and social impacts, and expected contributions to local infrastructure. India’s CDM project approval procedure and sustainable development criteria do not seem sufficient to successfully ensure the delivery of the sustainability benefits expected from the CDM. Thus, although all PDDs describe many benefits, only few of them provide quantitative indicators of their impacts, or include contributions that exceed the normal outcomes of the project activity.
* Research Assistant at the Institute of Political Science, University of Zurich, [email protected] † Research Fellow at Chair of International Politics, Potsdam University / SFB 700, [email protected]

2
Contents Contents...................................................................................................................................... 2 List of acronyms and abbreviations ........................................................................................... 3 1. Introduction....................................................................................................................... 4 2. Project sample................................................................................................................... 5 3. Performance of projects in terms of forecasted amount of CERs till 2012 ...................... 6 4. Delays in the start of the crediting period......................................................................... 8 5. Additionality argumentation ............................................................................................. 8 6. Stakeholder participation and sustainability impacts...................................................... 14 7. Conclusions..................................................................................................................... 19 References ................................................................................................................................ 22
3
List of acronyms and abbreviations CDM Clean Development Mechanism CER Certified Emission Reduction IN1 – IN23 Codes given to the analysed projects CO2 eq. Equivalent to carbon dioxide emissions (in terms of global warming
potential) DNA Designated National Authority DOE Designated Operational Entity EB Executive Board EIA Environmental impact assessment ETS Emissions Trading System EU European Union IRR Internal rate of return NA Not applicable NGO Non governmental organisation PDD Project Design Document ROE Return on equity UNFCCC United Nations Framework Convention on Climate Change WACC Weighted average cost of capital

4
1. Introduction Under the Kyoto Protocol, the Clean Development Mechanism (CDM) is one of the flexibility instruments aimed at helping industrialised countries, so called Annex I countries, to reach their emission reduction commitments in a cost-efficient manner, by purchasing credits from emission reduction projects in developing countries. These credits are less costly than investing in emission reductions within the industrialised countries themselves. At the same time, the CDM has the aim to benefit host developing countries by promoting investment in sustainable development and facilitating technology transfer. Certified Emission Reductions (CERs) coming from CDM projects are not only interesting for government parties under the Kyoto Protocol, who need to meet their emission reduction targets by 2012, but also for private companies covered by the EU Emissions Trading Scheme (EU ETS), which are allowed to use CERs to comply with part of their EU ETS reduction requirements. There are over 1500 CDM projects submitted for validation and almost 1000 already registered at the UNFCCC CDM Executive Board and therefore entitled to generate CERs. A reduction volume of over 1.3 billion tonnes CO2 eq. by 2012 is expected from the registered projects. However, there are still doubts whether these CDM projects will really produce the volumes of CERs estimated during their design and registration and whether they will do it in time for the 2012 targets (Michaelowa, 2007). Moreover, there are also doubts about the environmental and social integrity of several CDM projects, which could reduce their attractiveness for potential buyers (Lohmann, 2006; Boyd et al., 2007; Ghosh, 2007). India, China and Brazil are the developing countries where most CDM projects are being developed. As of end of December 2007, the three countries together account for 63% of all CDM projects registered at the CDM Executive Board and 73% of the projects submitted for validation. Therefore, it is interesting to analyse the performance of projects in these countries in order to try to find answers to the above-mentioned doubts. From the beginning on, India has been very proactive in positioning itself in the CDM market. Its Designated National Authority (DNA) has a very fast project approval process which ensures that projects have their Letter of Approval within 60 days. This has allowed the country to have more projects registered than any other country. It is however second in number of projects submitted for validation, following China, and it also hosts the majority of rejected projects (19 out of 51 as of end of 2007). This paper analyses a sample of CDM projects in India in terms of the barriers they are facing and their impact on lead times and CER generation. It also evaluates three key aspects of project design: additionality argumentation, stakeholder participation and expected sustainability benefits. In Section 2 we present the project sample used for this analysis; Section 3 elaborates on the performance of CDM projects in terms of the amount of CERs they are generating as compared to the previous estimates during validation and registration; in Section 4 we analyse the delays projects have experienced in the start of the crediting period; in section 5 we assess the quality of additionality argumentation in the sample; and in Section 6 we look into the stakeholder consultation process and the expected sustainability benefits of these CDM projects. Section 7, finally, synthesises the findings and draws conclusions.

5
2. Project sample 11 Indian CDM projects registered until end of June 2007 and 12 Indian CDM projects submitted for public comments before June 2006 without having been submitted for registration by June 2007 are evaluated through the analysis of their Project Design Documents (PDDs) submitted for validation and for registration, their validation, monitoring and verification reports, and through interviews with project developers. In the following sections, all data and calculations will be based on data for the Indian CDM pipeline as of end of June 2007. The sample has been chosen so as to include a range of project types, sizes and developers representative of the Indian CDM market, as shown in Table 1:
Table 1: Characteristics of projects selected for the sample
Project characteristics Number of projects
Registered 11 Project status
In validation 12 Unilateral 16
Character Bilateral 7 Renewable electricity for grid – biomass 4 Renewable electricity for grid – wind 4 Renewable electricity for grid – hydro 3 Renewable electricity for grid – landfill gas 1 Renewable electricity for user – hydro 1 Renewable energy for user – biomass 1 Energy efficiency – industry 3 Energy efficiency – cement blending 2 Energy efficiency – electricity generation 1 Fuel switch 2
Project type
Industrial gases – HFC 1 Small 11
Project size Large 12 In-house 81 Ernst & Young 6 Pricewaterhouse Coopers 2 Senergy 2 Zenith Energy 1 Agrinergy 1
Developer
Others 3
1 Some PDDs do not name a consultant in charge of preparing the CDM documentation. In some of these cases
the project is developed by the project owner itself, i.e. in-house, but in others the consultant might want to remain unknown. In some projects, the consultant’s name was found in other documents (validation reports, media articles). The figure given for “in-house” represents thus the projects for which no consultant was found.

6
3. Performance of projects in terms of forecasted amount of CERs till 2012
Many CDM projects have, at their design stage, very optimistic expectations in terms of the amount of emission reductions they will achieve (Castro and Michaelowa, 2007). Project developers might want to show high amounts of CERs in order to be able to find buyers or access financing more easily2, they might not use conservative enough parameters in their calculations, or they might not foresee possible implementation difficulties or delays. This lack of conservativeness is not necessarily attributable to lack of technical capacity of project developers or consultants, but also to the incentive to show that the CDM is a good business, that money can be made from CER revenues, that engaging in this business is promising – especially during the first years, where many people and businesses were still very sceptic about the potential of the CDM. Nowadays, after seeing the outcomes (projects lagging in the pipeline for over a year because of continuous corrections, or projects delivering many less CERs than expected due to over-optimistic projections), quality considerations matter more, and the incentive might have shifted towards more realistic assumptions in project design. In the following paragraphs we assess the performance of the sample of Indian CDM projects in terms of the change in the projects’ forecasted volume of CERs as they move along the project cycle, from validation, through registration to CER issuance. For this purpose, the information provided in the PDDs published during validation and registration is compared. Additionally, where available, the amount of CERs already issued is extrapolated to reach an estimation of the total emission reductions expected once the project is operating. As both the Kyoto Protocol’s first commitment period and the EU ETS second phase finish in 2012, only emission reductions forecasted up to that year are considered in the analysis. We thus define “performance” as the per cent change in forecasted CER generation of a project as compared to the original estimate in the PDD sent for validation (which is then set at 100%). Figure 1 shows this performance in CER generation for all projects in the sample where information is available (this is, projects that have already been registered or have generated CERs). While in the PDDs for registration 45% of project developers expect to achieve a better performance in terms of CER generation than estimated before validation (up to 16.5% higher, in the case of a biomass energy project), in all cases the amount of CERs being actually issued shows a clear reduction in the projects’ expected performance. This demonstrates that initial estimates are indeed generally optimistic. The forecasted amount of CERs till 2012 is reduced by 4.7% (wind project) to 53.8% (HFC-23 destruction project) between validation and issuance, and on average3 23.1%. It should be clarified that projects usually have a poorer performance during the first monitoring period, until the personnel becomes familiar with the monitoring methodology, or until certain technological or implementation barriers are overcome. As the graph shows extrapolations based only on the already verified monitoring reports (in most cases this is just the first report), performance in terms of expected CERs till 2012 may still improve when future CERs are verified and issued and considered in the calculations.
2 Indeed, Indian banks are increasingly willing to provide loans considering CER revenues as collateral. For an
overview of financial instruments used for CDM projects, with focus on India, see e.g. Babakina, 2006 and Kumar , 2007.
3 Simple arithmetic mean of projects’ decrease in performance, not weighted in terms of each project’s CERs.

7
Figure 1: Changes in forecasted amount of CERs along the CDM project cycle
0
20
40
60
80
100
120
140
IN14 -Biomass
IN19 -Biomass
IN20 -Biomass
IN13 -Hydro
IN15 -Hydro
IN16 -Wind
IN21 -Wind
IN17 -Efficiency
IN22 -Efficiency
IN18 -Cement
IN23 -HFC
Project
Cha
nge
in fo
reca
sted
CE
Rs
(val
idat
ion=
100)
Validation Registration Issuance
Sources: Own calculations based on data from PDDs and verification reports. Notes: 1: Projects not shown have not been registered yet, so there is no data on changes in forecasted CERs. 2: Forecasted CERs at issuance are based on the extrapolation of the CERs already verified. Verification reports under review or with request for review are considered in the calculations, but non-verified monitoring reports are not. 3: Although it is not shown in the graph, in the Indian sample 3 of the projects that are still in validation have been re-submitted for a second validation process. In the new version of the PDD, all three forecast less CERs than the original PDDs sent for the first validation process. These are a biomass, a wind and an energy efficiency project, and the amount of CERs forecasted has been reduced to 83.8%, 98.5% and 96.7% of the original value, respectively.
Indeed, the UNFCCC website already shows non-verified monitoring reports for four of the projects in the sample. In three of these cases, the performance improves if these new monitoring reports are used for the extrapolation of CERs till 2012: the HFC-23 project IN23 improves from 46.2% to 92.8% performance, when the 2nd and 3rd monitoring reports are also used; the hydro project IN13 improves from 77.1% to 87.5% when the 2nd monitoring report is included in the calculations; the wind project IN16 improves from 63.8% to 86.2%. However, the hydro project IN15 shows a worse performance if the second monitoring report is included in the calculations (it falls from 74% to 66.5%). Thus, not all projects improve their performance over time. Small hydro projects are especially sensitive to changes in the hydrological and rainfall patters. Biomass project IN14 shows a specific implementation problem: since the monitoring equipment was installed only at a later date, during the first monitoring period 0 CERs were issued. Although this first report has not been used for the extrapolation (the 2nd and 3rd reports are already verified and the CERs issued), its performance is affected by four whole months without certified reductions. These results support the idea that the importance of monitoring is frequently disregarded in CDM projects. Many CDM consultants offer a full CDM management service, from design to issuance, in order to gain clients that otherwise might be scared of the complex approval
8
system. While overcoming institutional barriers, this system may also lead project owners to believe that the consultant will take care of the whole CDM business, and that they just have to wait for the CER revenues to arrive. The problems arise when the project is registered, the consultant is no longer there, and the project owner is in charge of monitoring the emission reductions on his own. This issue is again underscored by the fact that three of the projects shown in Figure 1 (one third of the projects that already have requested CERs to be issued) are facing requests for reviews or corrections for their verification reports. This means that the Executive Board has found deficiencies or mistakes in the reports, and that some of the CERs might not be issued after the corrections are made.
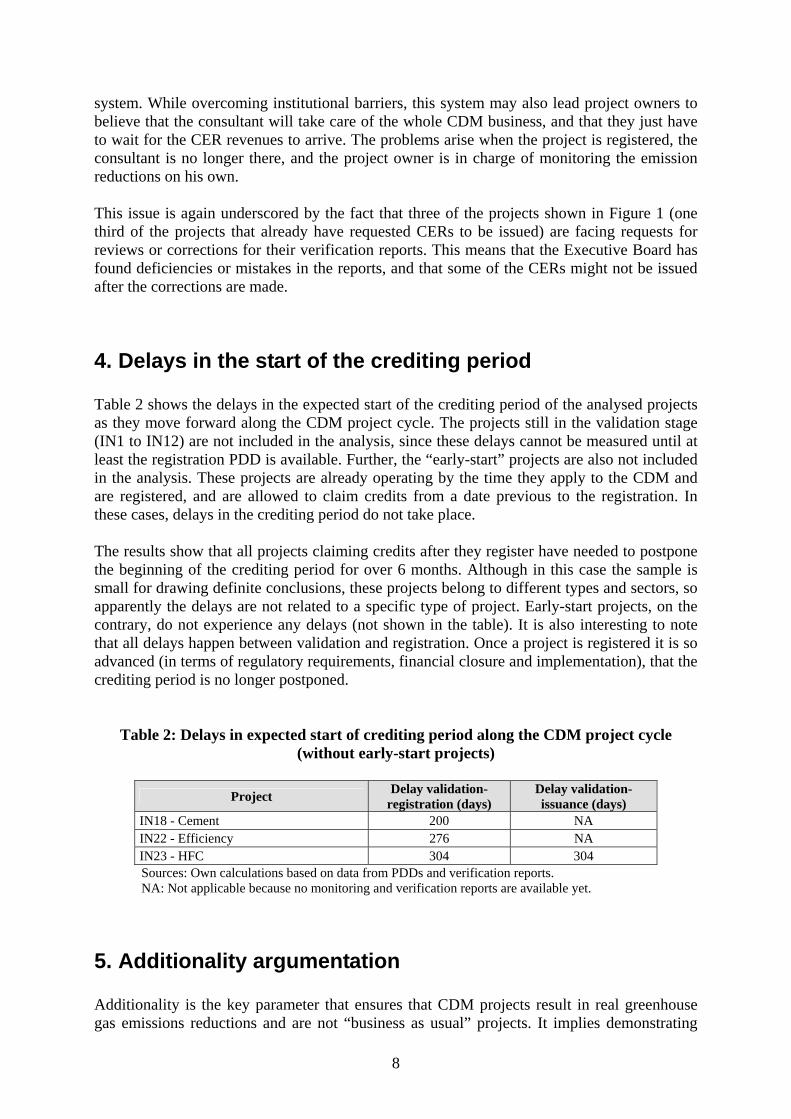
4. Delays in the start of the crediting period Table 2 shows the delays in the expected start of the crediting period of the analysed projects as they move forward along the CDM project cycle. The projects still in the validation stage (IN1 to IN12) are not included in the analysis, since these delays cannot be measured until at least the registration PDD is available. Further, the “early-start” projects are also not included in the analysis. These projects are already operating by the time they apply to the CDM and are registered, and are allowed to claim credits from a date previous to the registration. In these cases, delays in the crediting period do not take place. The results show that all projects claiming credits after they register have needed to postpone the beginning of the crediting period for over 6 months. Although in this case the sample is small for drawing definite conclusions, these projects belong to different types and sectors, so apparently the delays are not related to a specific type of project. Early-start projects, on the contrary, do not experience any delays (not shown in the table). It is also interesting to note that all delays happen between validation and registration. Once a project is registered it is so advanced (in terms of regulatory requirements, financial closure and implementation), that the crediting period is no longer postponed.
Table 2: Delays in expected start of crediting period along the CDM project cycle (without early-start projects)
Project Delay validation-
registration (days) Delay validation-issuance (days)
IN18 - Cement 200 NA IN22 - Efficiency 276 NA IN23 - HFC 304 304 Sources: Own calculations based on data from PDDs and verification reports. NA: Not applicable because no monitoring and verification reports are available yet.
5. Additionality argumentation Additionality is the key parameter that ensures that CDM projects result in real greenhouse gas emissions reductions and are not “business as usual” projects. It implies demonstrating
9
that the project would have not been viable without the positive impact from the CDM registration and CERs sale. This demonstration is usually performed through a standard tool, the “Tool for the demonstration and assessment of additionality”, which includes specific steps that need to be followed in order to substantiate why the project can only happen thanks to the help of the CDM component. Although this tool is required in most consolidated methodologies and is nowadays common practice, it is not formally mandatory. Especially small-scale projects are allowed to follow simplified procedures to demonstrate additionality, and some methodologies for large-scale projects have specific requirements in terms of additionality demonstration. The tool consists of the following steps:
- Step 0: Preliminary screening based on the starting date of the project activity – Only for projects beginning between 1 January 2000 and 18 November 2004, which wish to claim credits for the operation time before their registration under the CDM. This step was removed from the tool in February 2007.
- Step 1: Identification of alternatives to the project activity consistent with current laws and regulations.
- Step 2: Investment analysis. - Step 3: Barrier analysis (only one of steps 2 and 3 needs to be done). - Step 4: Common practice analysis. - Step 5: Impact of CDM registration.
Small-scale projects only have to demonstrate in a qualitative way that they face one of the following types of barriers: investment, technological or common practice. This frequently leads to low quality of additionality argumentation, reinforced by the fact that during validation and registration it is not really “checked whether these barriers are actually prohibitive” for the project to take place without the CDM (Umamaheswaran and Michaelowa, 2006). On the other hand, the Indian DNA has established that CDM projects in the country should demonstrate their “emissions additionality” (real, measurable and long-term GHG emission reductions as compared to a baseline), “financial additionality” (the project’s funding should not divert official development assistance funds), and “technological additionality” (the project should lead to transfer of environmentally sound technologies and know-how) (Gonsalves, 2006). However, the Indian DNA leaves the task of checking the additionality of CDM projects to the Designated Operational Entities (DOEs) in charge of validation. In this section of the paper we assess whether the analysed Indian CDM projects fulfil the criteria of the Tool for the demonstration and assessment of additionality, and the quality of the argumentation brought forward. Eleven of the projects in the sample are small-scale, thus considering the UNFCCC regulations, we try to differentiate the analysis between small and large projects. Also for HFC-23 projects there are simplified additionality demonstration criteria4. 57% of the analysed projects (13 projects) do not go through Step 0. In five of these cases it is not necessary to pass Step 0, as these projects are not claiming carbon credits retroactively. In
4 The HFC destruction facility entails significant capital and operating costs and no benefits (apart from CER
revenues), so the host entity has no direct economic incentive to incur these costs. Therefore, the proponent needs to provide proof that the quantity of HFC-23 destroyed is greater than the quantity required to be destroyed according to the host country’s regulations. In India, there are no regulations requiring HFC-23 to be incinerated.

10
nine of the cases, the project is small-scale, which means that it follows a simplified procedure to demonstrate additionality and thus can skip Step 0. Only one of the large projects claiming credits retroactively fails to include Step 0 in the PDD. This project was submitted for public comments in September 2006 and is still in validation, so this might be one of the deficiencies causing this delay in validation. 61% of projects identify alternative scenarios to the proposed CDM project, taking into account the legal and regulatory requirements for each of them. Most of the projects not identifying alternatives (8 out of 9) are small-scale, and thus following simplified procedures. The only large-scale project not identifying alternatives is the HFC-23 destruction project, which is per se an additional project, since this is not a mandatory measure in India. Out of the 23 projects analysed, 18 (78%) perform a barrier analysis to demonstrate additionality. three projects (13%) perform a full investment analysis, and only one project performs both, investment and barrier analysis. As explained above, the HFC-23 project shortly describes the regulatory and financial reasons why the project would not have been undertaken without the CDM incentive. None of the small-scale projects perform an investment analysis. 16 projects (70%) argue having investment barriers for project implementation, but only four perform a full investment analysis. The investment barriers are not only related to low expected returns on investment in the absence of the CDM component of the project, but also related to perceived project risk and difficulties in accessing financing. Some of the arguments brought forward to substantiate the investment barrier in absence of a full investment analysis refer to the different risks borne by the projects, such as risks related to resource reliability (rainfall – two cases, wind resources – one case, biomass supply – three cases); risks, delays or higher costs associated to changes in energy or related policies (three cases); climatic risks (droughts – one case); unforeseen delays in payments for the power generated (one case); and the perceived higher risks since the owner has no experience in the energy sector (one case). Several PDDs also stated having difficulties in achieving the financial closure of the project (either through equity or debt or both). In three cases, this was due to the low expected returns of the projects. In one of these cases the project idea existed since 2001, but the lacking debt financing prevented its implementation so far. Other factors affecting access to finance are the projects’ high risks (two cases), high investment costs (one case), or the previously existing high risk of the core business (one case). Indeed, access to finance for renewable energy projects is stated by several Indian national banks as a challenge to project activities due to the financial institution’s conservative risk approach. However, companies with existing balance sheets that are known to the banks usually do not encounter severe borrowing constraints, which is the case of several of the analysed projects. Also, local financial institutions are increasingly developing schemes that include CER revenues as collateral for loans (see e.g. Kumar, 2007). The project claiming that the administration was reluctant to provide the finance due to the high investment costs, for example, belongs to an international and renowned company, and thus the argument that its energy efficiency project is not financially attractive does not really convince.

11
Similarly, the project with high risks in the core business is a bagasse co-generation project in a sugar cane processing facility in Uttar Pradesh. Although due to its agricultural and seasonal character sugar cane production can be considered risky, Uttar Pradesh is the biggest sugar cane producing Indian state with the largest sugar cane processors. Bagasse, as a natural by-product in the sugar production process, does not create biomass supply difficulties. Expert interviews confirm a similarity in technologies used. Furthermore, particularly in Uttar Pradesh, government policies and regulations favour sugar cane production and electricity generation from renewable energy resources such as biomass. Co-generation in sugar mills has been practised since the mid-1990s. Due to fluctuations in sugar prices in the global market, revenues from power sales are actually the main source of income for many sugar mills, which would not survive from sugar sales only. Financial institutions are generally less resistant to providing debt financing to a known company with an existing balance sheet, and thus this barrier is not very convincing in this case. Some other projects substantiated the investment barrier by showing that the CDM project entailed higher costs (or less benefits) than one of the alternative, business-as-usual scenarios: a wind project stated that it had higher generation costs than other types of power plants, a biomass plant shows higher running costs than a coal plant, an hydro plant shows a very high investment requirement per MW of installed capacity, a fuel switch project (coal to natural gas) compares the IRR of the natural gas project to the IRR of a coal plant. Finally, in many cases the investment barrier was substantiated in terms of low expected returns from the project. Two projects, already running and claiming credits retrospectively, claim that their returns have not been good enough so far to pay the debt or cover the equity, respectively. Four further projects show low internal rate of return (IRR) as an indicator for this barrier, however, without including the full calculations of the IRR and in two cases even without providing a benchmark indicator. One project, furthermore, simply states that the project has no returns at all apart from the ones derived from the sale of CERs (HFC-23 project). Out of the four projects performing a full investment analysis for substantiating additionality, two (one hydro and one wind project) do not include the full calculations in the PDD, but have them available for the DOE. They compare the IRR with the WACC (weighted average cost of capital) and perform a complete sensitivity analysis. However, one of these projects received a public comment criticising that the IRR calculation does not include the tax breaks available for the project, which could amount to most of the equity required for its financing, and that that the IRR computation should be done for the whole life of the project (30 years), and not only for ten years. In this project, the project owner is one of the leading exporters in the renewable energy sector in the country, known to financial institutions, so that financial barriers should not really constitute a major inhibition to the project. Another project choosing the investment analysis option (energy efficiency project in electricity generation facilities) uses the IRR as financial indicator, comparing it to the IRR of the most likely alternative to the project (coal plant). It does not include the full financial calculations in the PDD, and the sensitivity analysis is not very complete, since it considers just one factor. This project received one public comment criticising that the IRR calculation is not transparent. Finally, the project choosing both investment and barrier analysis (hydro project) uses the IRR as indicator, comparing it to the bank benchmark in the country, and complementing with the ROE (return on equity) for the first operating years of the project. In this case the
12
sensitivity analysis is also not very complete (just one factor considered) and the complete financial calculations are not in the PDD, but available to the DOE. 61% of the projects also describe technological barriers for implementation. These include:
- Requirement of new, more skilled personnel that can be scarce for the new technology. Otherwise, need of training of the existing staff (five cases).
- Higher risks of corrosion, which could affect the operational lifetime of the equipment and cause other operation difficulties (four cases: two waste gas projects, an energy efficiency project in a coal plant, a biomass plant).
- In general, performance and failure risks or technological uncertainty (four cases). - First of its kind project in India or the region (two cases), for which support or service
availability is not sure (two cases). - New technology with low market share and penetration (two cases). - Lack of stable transmission lines, which leads to losses due to evacuation problems
(two cases). - Additional research and development requirements for the new cement product (two
cases). - Risks related to reliability of waste heat quality and supply, which would lead to
reduced life of equipments, poor quality of products, or even closure of power plant and destabilisation of the manufacturing process (two cases).
- Six others. Prevailing practice barriers are claimed by 48% of the projects. Other types of barriers mentioned are: location barriers related to geographical difficulties, hydrological risks, remote location and location away from the main wind zone (five cases); institutional barriers (four projects); regulatory (three projects); managerial (four projects); market barriers (two projects). Important for substantiating the additionality argumentation, especially in the cases where no complete investment analysis is performed, is the reference to third-party, independent evidence and information sources. Only five out of the 23 analysed projects consistently cite independent evidence, while seven cite few, insufficient references and another eleven do not cite any independent source of information at all. In one of these cases it can be argued that the additionality of the project is quite obvious (HFC-23 destruction project), and thus references may not be necessary. Other four projects state in the PDDs that documentary evidence will be available for the DOE upon validation. 21 out of the 23 analysed projects (91%) include a common practice analysis. However, in seven of the PDDs this analysis does not seem detailed enough, providing only a general summary of the sector without sufficient quantitative data of what proportion of the industry uses the technology. In this section, also very few PDDs (four) cite independent sources of reference to support their arguments. Finally, not all the projects describe the way in which they expect the CDM will help to overcome the described barriers. 12 projects (52%) provide a detailed account of the impact of CDM registration on the project, some of them providing some quantitative indicators and others using a descriptive, qualitative approach. Three other projects explain this section very briefly, and another two just show the impact of CDM in terms of IRR improvement. Six of the PDDs do not describe the expected impact of CDM registration at all.

13
It should be emphasised that six of the projects in the sample received public comments during validation criticising their additionality argumentation. The comments were related to:
- Non-transparent IRR calculation, or not including all the benefits available for the project (three cases).
- Unconvincing investment barrier, for different reasons than IRR calculation (one case).
- Observations about the starting date of the project in relation to the initial consideration of CDM (two cases).
- Unconvincing technological barrier (two cases). - Unconvincing additionality due to rising diesel power costs (one case). - Generally poor additionality (raw material supply not problematic, economically
attractive project) (one case). In four of these cases, the projects are still in the validation phase, and thus the answer to the public comments is not yet available. The comment about rising diesel costs was not considered valid, because the person submitting it is “not an accredited observer organisation to the United Nations Framework Convention on Climate Change Conference of the Parties” (cited from the validation report). One of the comments on the starting date of the project was clarified in detail by the project proponent, as shown in the validation report5. One of the comments on the IRR calculation referred that tax benefits and the whole lifetime of the project needed to be considered in the calculation. The answer was that even with tax depreciation benefits, the taxes have to be paid later on, and thus these benefits are limited only to the time deferral for payment, but do not amount to the total tax due. With respect to the lifetime of the project, it was explained that the power purchase agreement and the maintenance service provided to the project are valid only for 10 years, and thus this has been considered as the life of the project. In this case, the DOE also accepted these explanations from the proponent, along with some further clarifications on the investment analysis requested in the validation report. Also, six of the projects received requests for clarifications or corrections from the DOE during validation (this relates only to the 11 already registered projects, since for the other 12 there is no validation report yet. Considering the long time these projects are spending for validation, they very likely have had many corrections to the PDD). These observations required:
- Supporting documentation / additional information or details for additionality argumentation (including several specific barriers) (six cases).
- Additional documentary evidence about CDM consideration during project planning (two cases).
- The argumentation should concentrate on specific project barriers exceeding those due to normal project evolution (two cases).
- Information about the details of the project’s returns and the risks involved considering the CDM revenue (one case).
- Investment barrier should be defined correctly (one case). - Common practice analysis should be in relation with project (one case).
5 In this case, the comment was pointing out to the fact that the board meeting cited in the PDD for
substantiating an early consideration of the CDM took place after the project’s beginning of operations. The proponent clarified that there had been two meetings: the first one a year before, informing about the proposed investment and the CDM component; and the second one at the end of the financial year (after the beginning of operations), reiterating what had been said in the previous one. Further details about previous consideration of the CDM were also provided in the answer. The DOE accepted this answer and the proof provided.

14
- Common practice analysis should focus on the discussion of similar activities in India and their drivers - documented evidence needs to be submitted (one case).
- The PDD should explain how the CDM incentive has helped to overcome the barriers described (one case).
6. Stakeholder participation and sustainability impacts Promoting sustainable development in the host countries is one of the main objectives of CDM projects. Therefore, CDM projects have to receive a national approval from their Designated National Authority (DNA), which is based on the sustainability benefits that the project will achieve in the host country. Moreover, the Project Design Documents have to explicitly detail what are the expected sustainability benefits to be achieved by the projects, they have to present the documentation related to the environmental impact assessment of the project, and they have to describe how the relevant local stakeholders were allowed to participate and issue comments on the project. By engaging in consultation with the relevant stakeholders, projects can demonstrate that they respond to the development demands of the local population, while ensuring social and environmental sustainability. However, there are no specific internationally recognised requirements for ensuring good-quality stakeholder consultation processes in CDM projects. It is up to each host country to establish their own requirements for stakeholder consultation, and some may even not do so at all, leaving it up to the project developer to decide in which manner they invite stakeholders to participate. In the Indian case there are no specific requirements for the CDM stakeholder consultation process. Thus, CDM project developers frequently use the consultation requirements of other instances – EIA approval process, Gram Panchayat6 letter of no objection – as demonstration of the project’s stakeholder consultation process. Assessing the means used for inviting stakeholders to issue comments and participate in project design can provide an idea of how seriously a project developer considers participation and social engagement. Similarly, as established by the Marrakech Accords, it is the host country’s prerogative to define whether a CDM project contributes to sustainable development (UNFCCC, 2001), and thus international sustainable development standards are absent (Sutter and Parreno, 2007). Several studies show that CDM projects are failing to achieve real synergy between emission reductions and sustainable development in the host country (Lohmann, 2006; Boyd et al., 2007; Michaelowa and Michaelowa, 2007; Olsen, 2007; Sirohi, 2007). India’s Designated National Authority (DNA) assesses CDM project’s sustainability contribution under the light of the national priorities set by the Indian five year planning process and according to the general understanding of sustainable development. For the last half century, India’s development guiding principles have been sustained economic growth; poverty alleviation; food, health, education, and shelter for all; containing population growth; generating employment; self-reliance; and public participation in planning, programme implementation, and infrastructure development (IGES, 2005). Its last Five-Year Plan (2002-2007) reinforces India’s commitment to the UN Millennium Development Goals and poverty alleviation.
6 The Gram Panchayat is the elected representative body of the local population, and its permission is needed for
any project being set up in the village’s jurisdiction.
15
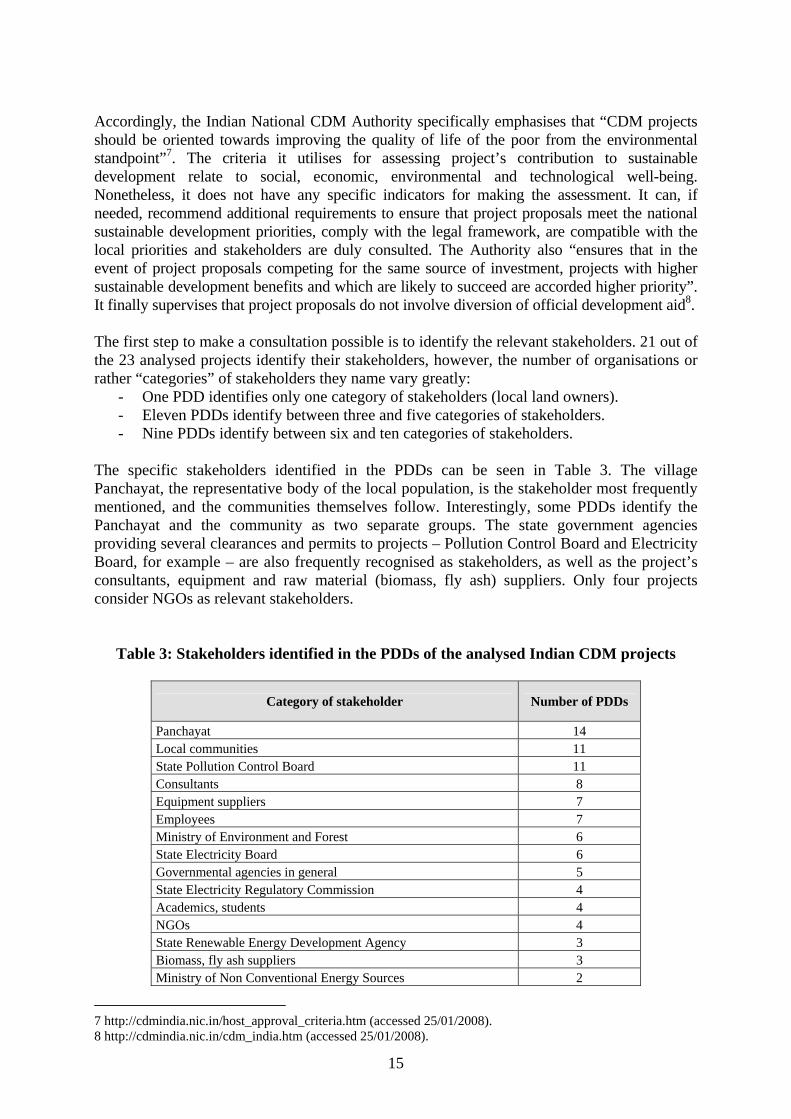
Accordingly, the Indian National CDM Authority specifically emphasises that “CDM projects should be oriented towards improving the quality of life of the poor from the environmental standpoint”7. The criteria it utilises for assessing project’s contribution to sustainable development relate to social, economic, environmental and technological well-being. Nonetheless, it does not have any specific indicators for making the assessment. It can, if needed, recommend additional requirements to ensure that project proposals meet the national sustainable development priorities, comply with the legal framework, are compatible with the local priorities and stakeholders are duly consulted. The Authority also “ensures that in the event of project proposals competing for the same source of investment, projects with higher sustainable development benefits and which are likely to succeed are accorded higher priority”. It finally supervises that project proposals do not involve diversion of official development aid8. The first step to make a consultation possible is to identify the relevant stakeholders. 21 out of the 23 analysed projects identify their stakeholders, however, the number of organisations or rather “categories” of stakeholders they name vary greatly:
- One PDD identifies only one category of stakeholders (local land owners). - Eleven PDDs identify between three and five categories of stakeholders. - Nine PDDs identify between six and ten categories of stakeholders.
The specific stakeholders identified in the PDDs can be seen in Table 3. The village Panchayat, the representative body of the local population, is the stakeholder most frequently mentioned, and the communities themselves follow. Interestingly, some PDDs identify the Panchayat and the community as two separate groups. The state government agencies providing several clearances and permits to projects – Pollution Control Board and Electricity Board, for example – are also frequently recognised as stakeholders, as well as the project’s consultants, equipment and raw material (biomass, fly ash) suppliers. Only four projects consider NGOs as relevant stakeholders.
Table 3: Stakeholders identified in the PDDs of the analysed Indian CDM projects
Category of stakeholder Number of PDDs
Panchayat 14 Local communities 11 State Pollution Control Board 11 Consultants 8 Equipment suppliers 7 Employees 7 Ministry of Environment and Forest 6 State Electricity Board 6 Governmental agencies in general 5 State Electricity Regulatory Commission 4 Academics, students 4 NGOs 4 State Renewable Energy Development Agency 3 Biomass, fly ash suppliers 3 Ministry of Non Conventional Energy Sources 2
7 http://cdmindia.nic.in/host_approval_criteria.htm (accessed 25/01/2008). 8 http://cdmindia.nic.in/cdm_india.htm (accessed 25/01/2008).

16
Category of stakeholder Number of PDDs
State Power Transmission Corporation 2 Land owners 2 Contractors 2 Customers 2 Shareholders 1 Transporters 1 Farmers 1 Other private institutions 1 Other authorities 4
Sources: PDDs. Although so many different stakeholders are identified as relevant to the projects, only four of the PDDs provide information on the actual number of people attending their consultation meetings. Most PDDs just provide a description of the instances through which they have needed to pass in order to get the project approved and running. They mention thus the state Pollution Control Board, which is responsible for the environmental clearances for the projects, or the Electricity Board, with which the Power Purchase Agreement is signed, and the Panchayat, which gives the permission for setting up of the project under the jurisdiction of the village. They frequently also mention the consultants that helped to design the project, and the suppliers of technology and raw materials. Thus, although project developers prove in this way that they have approached several governmental and private instances in order to execute the project, they do not prove that they have undertaken a specific consultation process for the CDM component of the project. With respect to the communication media used for stakeholder consultation, two stages are differentiated for the analysis: the communication media used for inviting stakeholders to make comments, and the media used during the consultation process itself. Ten of the projects do not detail in their PDDs the means of communication used for inviting stakeholders to submit comments. Seven used closed communication media, this is, letters, emails, or other forms of direct communication with specific stakeholders, which limited the range of stakeholders allowed to participate. Only six projects used open communication media to announce the stakeholder consultation process publicly (e.g. adverts in local newspapers, public notices in villages). Almost half of the projects refer to the process of getting the necessary permits and clearances, including the Panchayat’s “no objection certificate”, as the way to engage in public consultation. At the same time, 70% of the project PDDs mention having had some kind of meeting with local population, stakeholders or Panchayat members, in which they presented the project and invited comments and questions. One of these projects organises regular meeting with the identified stakeholders every six months. In several cases it is however not very clear, whether these meetings were organised because the general national environmental or municipal regulations require them, or because of the CDM stakeholder consultation itself. Few PDDs mention different consultation processes, such as outreach and information activities to customers (cement blending project), newspaper invitations to issue comments, or direct approach to stakeholders. One PDD does not really describe the consultation process, but the stakeholders, their importance, the necessity to involve them in the project and the benefits provided to them. Four other PDDs do not describe the consultation process very clearly.

17
In some of the cases where the PDD lacks clarity about the consultation process, the validation report provides more detailed information. In one of them, comments were invited from the employees of the organisation, who are the major stakeholders of the project, through a notice issued by the general manager. The company also interacted with local civil society organisations. In one case, there was a public comment during validation that criticised the consultation process because most of the attendants were the company’s employees, and only three or four were villagers and another three to four were government representatives. It thus demanded a newspaper advertisement to be published to invite stakeholders. The project proponent answered that in reality four consultation meetings had been organised: one with key stakeholders, one with local stakeholders, one with the Panchayat and one with the district collector. The DOE accepted this explanation. Almost 80% of the PDDs state having received positive comments from stakeholders, and 87% state that they did not receive any negative comments. Almost half of the projects received some questions or requests for further action or information from stakeholders, and additionally five projects refer to the permits they needed to obtain in order to be allowed to operate. In all the cases the questions or concerns are addressed by the project proponents. In ten of the PDDs the comments and questions received from stakeholders are detailed, and one of these even provides details on the organisations issuing each comment and includes the letters with the comments as annexes to the PDD. The comments and concerns expressed by stakeholders in India refer mainly to opportunities for local job generation and economy improvement, possible negative environmental and social impacts of the project and possible contributions to the development or improvement of local infrastructure. The details can be found in Table 4.
Table 4: Sustainability benefits expected and concerns expressed by stakeholders
Type of sustainability benefit Number of projects
Job creation 5 Development or improvement of local infrastructure 2 Requested right of way into the project’s roads after its implementation 1 Rural economy improvement (farmers supplying raw material, transporters having more business)
1
Reduced GHG emissions 1 Improved rural waste management 1 Reduced polluting emissions 1 Conservation of furnace oil, use of ecofriendly, renewable fuel 1 Requested to be provided the ash generated by the project to use as fertilizer 1 Enhanced company’s profitability by reducing dependency on coal-based power and utilizing the waste heat potential
1
Suggestion about further expansion of the plant’s capacity and improvement of generation 1
Type of concern Number of projects
Environmental impacts of the project (odour or noise generation, pollutant emissions, solid waste generation and disposal, harms to local people, livelihoods, crops, animals and plants)
4
Submergence of land due to the project 1 Displacement of people 1 Invasion of local people’s rights 1 Questions the use of wind power, if this is not the core business of the enterprise 1

18
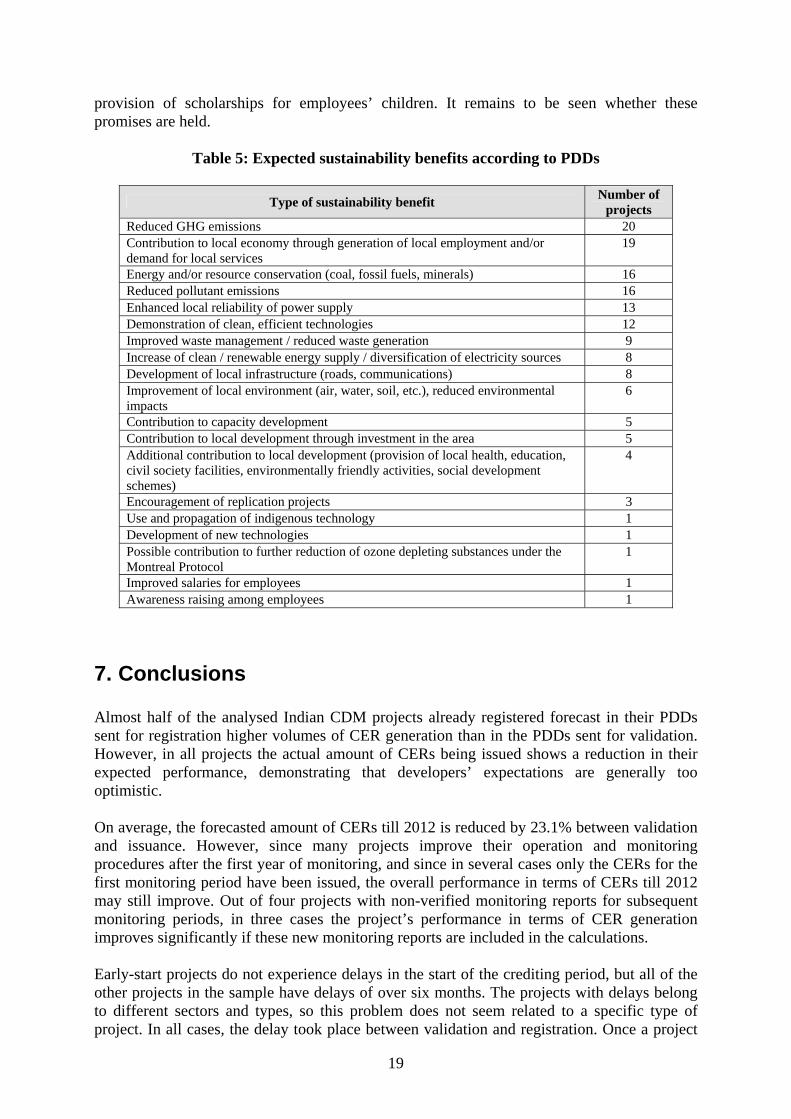
As a comparison, the sustainability benefits that project developers expect to achieve with these projects, as stated in their PDDs, are summarised in Table 5. It can be noted that the project developers’ expectations regarding the sustainability benefits of projects exceed the expectations from the stakeholders whose opinions were gathered in the PDDs. All in all, stakeholders in India appear to express few expectations for direct local benefits from CDM projects, apart from job creation. This might be not because the stakeholders do not have expectations of concerns regarding the projects, but because not all relevant stakeholders participated in the consultation process or because the consultation process is not described with sufficient detail in the analysed PDDs. It also gives the impression that stakeholders are not really informed about the economic benefits (CER revenues) that project developers expect to achieve when registering their projects as CDM. They just see the general benefits brought to the area (more local investment, more local jobs, improved environment), but not the money that the developer will earn and the benefits that could “trickle down” to them from these revenues. The quality of stakeholder consultation processes for CDM projects in India has already been questioned, as well as their compliance with environmental regulations and the effectiveness of the process to ensure sustainability benefits, for example by the online newspaper Down To Earth, issued by the Indian Centre for Science and Environment. In an in-deep investigation of two Indian industrial gases CDM projects, they found out that the questions and answers reported for the consultation process in the PDDs for both projects were exactly the same, even with the same spelling mistakes. “Even if the consultations were held, their record in the documents does not seem credible”. Similarly disappointing results were found after enquiries about the expected sustainability benefits of the projects: not only the villagers around the projects had an history of complaints about the negative environmental impacts caused by the plants (from before the CDM projects), but also none of the promised benefits to be achieved by the CDM projects were evident in the area around the projects or when asking company officials about them. A copy of one of the project’s EIA (environmental impact assessment) could not be produced even after repeated requests, despite the fact that the validation report states having verified the existence of the study (Down To Earth, 2005a). Similar outcomes were found during the investigation of several biomass power projects: the biomass fuel was not being sourced from sustainable sources, and was therefore leading to deforestation and affecting poor people that use biomass as cooking fuel. Projects were also causing pollution problems and deepening the groundwater level, and the promised jobs were given to outsiders and not to local people. In these cases, the stakeholder consultation section of the PDD was also apparently copied from one another (Down To Earth, 2005b). The lack of monitoring guidelines or measurable sustainability indicators contributes to these outcomes. On the other hand, these quality deficiencies need not be generalised. Two PDDs in the sample describe the expected sustainability benefits in detail, providing quantitative indicators of the improvements to be generated, which gives the impression that these project proponents take the sustainability impacts of their projects more seriously. Three other PDDs provide at least some quantitative indicators about the expected benefits. And four projects describe local sustainability contributions that exceed the normal outcomes of the project activities, such as the construction of local health and education facilities, of a meeting hall for local representatives, the development of environmentally friendly activities or the
19
provision of scholarships for employees’ children. It remains to be seen whether these promises are held.
Table 5: Expected sustainability benefits according to PDDs
Type of sustainability benefit Number of projects
Reduced GHG emissions 20 Contribution to local economy through generation of local employment and/or demand for local services
19
Energy and/or resource conservation (coal, fossil fuels, minerals) 16 Reduced pollutant emissions 16 Enhanced local reliability of power supply 13 Demonstration of clean, efficient technologies 12 Improved waste management / reduced waste generation 9 Increase of clean / renewable energy supply / diversification of electricity sources 8 Development of local infrastructure (roads, communications) 8 Improvement of local environment (air, water, soil, etc.), reduced environmental impacts
6
Contribution to capacity development 5 Contribution to local development through investment in the area 5 Additional contribution to local development (provision of local health, education, civil society facilities, environmentally friendly activities, social development schemes)
4
Encouragement of replication projects 3 Use and propagation of indigenous technology 1 Development of new technologies 1 Possible contribution to further reduction of ozone depleting substances under the Montreal Protocol
1
Improved salaries for employees 1 Awareness raising among employees 1
7. Conclusions Almost half of the analysed Indian CDM projects already registered forecast in their PDDs sent for registration higher volumes of CER generation than in the PDDs sent for validation. However, in all projects the actual amount of CERs being issued shows a reduction in their expected performance, demonstrating that developers’ expectations are generally too optimistic. On average, the forecasted amount of CERs till 2012 is reduced by 23.1% between validation and issuance. However, since many projects improve their operation and monitoring procedures after the first year of monitoring, and since in several cases only the CERs for the first monitoring period have been issued, the overall performance in terms of CERs till 2012 may still improve. Out of four projects with non-verified monitoring reports for subsequent monitoring periods, in three cases the project’s performance in terms of CER generation improves significantly if these new monitoring reports are included in the calculations. Early-start projects do not experience delays in the start of the crediting period, but all of the other projects in the sample have delays of over six months. The projects with delays belong to different sectors and types, so this problem does not seem related to a specific type of project. In all cases, the delay took place between validation and registration. Once a project

20
is registered it is so advanced (in terms of regulatory requirements, financial closure and implementation), that the crediting period is no longer postponed. 19 out of the 23 analysed projects perform a barrier analysis to demonstrate additionality, three projects perform a full investment analysis and only one project performs both. Interestingly, 16 projects argue having investment barrier for implementation. The arguments brought forward to substantiate the investment barriers in absence of a full investment analysis refer to the different risks borne by the projects, to difficulties in achieving the financial closure, to the higher costs of the CDM project compared to the alternative scenarios or to the low expected returns. However, although access to finance can be a challenge due to the banks’ conservative risk approach, known companies usually do not find severe borrowing constraints. Some of the projects arguing low returns on investment use the IRR to defend their case, but without showing the detailed calculations or sources of information. Thus, in some cases the investment barriers described in the PDD are not totally convincing. 14 projects also mention technological barriers for implementation, and 11 claim having faced prevailing practice barriers. Other types of barriers mentioned are related to the location of projects and the derived geographical and resource risks, and to institutional, regulatory, managerial and market constraints. In other aspects the quality of the argumentation is also generally poor: Only five out of the 23 analysed projects consistently cite independent evidence to substantiate the additionality argumentation, while seven cite few, insufficient references and another eleven do not cite any. 21 out of the 23 analysed projects include a common practice analysis. However, in seven of the PDDs this analysis does not seem detailed enough. Only 12 PDDs describe the way in which they expect the CDM will help to overcome the described barriers in detail, other three do it very briefly, and another two just show it in terms of IRR improvement. Six of the PDDs do not describe the expected impact of CDM registration at all. Six of the projects in the sample received public comments during validation criticising their additionality argumentation, and also six projects (out of the eleven already registered) received requests for clarifications or corrections from the DOE during validation. In India there is no standard procedure for inviting stakeholders to issue comments to CDM projects. However, there are several procedures that investment projects in general need to follow in order to be allowed to operate, including the approval from the village representative body, the Panchayat. This situation is reflected in the way the stakeholder consultation process is described in the Indian PDDs. 21 out of the 23 analysed projects identify their stakeholders, however, the number of organisations they name vary greatly, between just one stakeholder and ten categories of stakeholders. The village Panchayat is the stakeholder most frequently mentioned, and the communities themselves follow. Some PDDs identify the Panchayat and the community as two separate groups. The state government agencies providing permits to projects are also frequently recognised as stakeholders, as well as the project’s consultants and suppliers. Despite the several stakeholders recognised in most PDDs, only four of them provide information on the actual number of people attending their consultation meetings.

21
Almost half of the projects refer to the process of getting the necessary permits and clearances, including the Panchayat’s no-objection certificate, as the way to engage in public consultation. 70% of the PDDs mention having had some kind of consultation meeting with local population, stakeholders or Panchayat members. In several cases, although project developers prove that they have approached several governmental and private instances in order to execute the project, they do not prove that they have undertaken a specific consultation process for the CDM component of the project. Four PDDs do not describe the consultation process clearly, and one does not describe a real consultation process. In one case there was even a public comment during validation criticising the consultation process. Almost half of the PDDs detail the comments and questions received from stakeholders. These refer mainly to opportunities for local job generation and economy improvement, feared negative environmental and social impacts of the project and expected contributions to the development or improvement of local infrastructure. Indian stakeholders appear to express few expectations for direct local benefits from CDM projects. This gives the impression that stakeholders are not really informed about the economic benefits brought by CER sales and the benefits that could “trickle down” to them from these revenues. India’s sustainability criteria for CDM projects refer to social, economic, environmental and technological well-being, as well as the project’s contribution to the national development priorities set in the national five-year plans. Nonetheless, there are no measurable indicators for assessing this contribution. The sustainability benefits that project developers expect to achieve refer mainly to reduced GHG and pollutant emissions, local job creation and economy improvement, energy and/or resource conservation, enhanced reliability of local power supply, environmental improvements, technology demonstration and local infrastructure development, among others. In accordance to the Indian DNA’s rather simple requirements with respect to sustainability contributions from CDM projects, only few of the PDDs give some special importance to the projects’ sustainability contributions, making the effort to provide quantitative indicators of their impacts, or include local sustainability contributions that exceed the normal outcomes of the project activities, such as the construction of social facilities, the development of environmentally friendly activities or the provision of student scholarships. The quality and legitimacy of the stakeholder consultation section of Indian PDDs has already been questioned, as well as their real impacts on local sustainable development. The lack of monitoring guidelines or measurable sustainability indicators contributes to these outcomes.

22
References Babakina O. (2006). Financing CDM projects: A global approach is required. New York, Columbia: European Institute for Law, Science & Technology. 34 pp. Boyd E., Hultman N.E., Roberts J.T., Corbera E., Ebeling J., et al. (2007). The future of the clean development mechanism: an assessment of current practice and approaches for policy. Tyndall Centre for Climate Change Research Working Paper 114. 55 pp. Castro P., Michaelowa A. (2007). Opinions of project developers regarding performance of CDM projects. Discussion paper CDM-5. London: Climate Strategies. Down To Earth. (2005a). Newest biggest deal. Published online on 07/11/2005. URL: http://csestore.cse.org.in/cover.asp?foldername=20051115&filename=anal&sid=1&page=1&sec_id=7&p=1 (accessed 11/02/2008). Down To Earth. (2005b). Biomass for nothing. Published online on 07/11/2005. URL: http://csestore.cse.org.in/cover.asp?foldername=20051115&filename=anal&sid=2&page=4&sec_id=7&p=1 (accessed 11/02/2008). Ghosh S. (2007). Aid, the Clean Development Mechanism and Some Open Questions. Oslo: Development Today. 3 May 2007. IGES. (2005). CDM country guide for India. Tokyo, Kanagawa and New Delhi: Ministry of Environment (Japan), Institute for Global Environmental Strategies (IGES) and Winrok International India. 194 pp. Kumar U. (2007). Carbon financing – a business perspective. Presentation at the Roundtable meeting on mainstreaming Clean Development Mechanism (CDM) opportunities in Indian insurance sector. Mumbai, 23rd March 2007. Lohmann L. (2006). Carbon trading – A critical conversation on climate change, privatisation and power. Development Dialogue No. 48. Uppsala, Dag Hammarskjöld Foundation. 360 pp. Michaelowa A. (2007). How many CERs will the CDM produce by 2012? Discussion paper CDM-2. London: Climate Strategies. Michaelowa A; Michaelowa K. (2007). Climate or development: is ODA diverted from its original purpose? Climatic Change 84: 5-21. Olsen K.H. (2007). The Clean Development Mechanism’s contribution to sustainable development: a review of the literature. Climatic Change 84: 59-73. Sirohi S. (2007). CDM: Is it a ‘win–win’ strategy for rural poverty alleviation in India? Climatic Change 84: 91-110. Sutter C., Parreno J.C. (2007). Does the current Clean Development Mechanism (CDM) deliver its sustainable development claim? An analysis of officially registered CDM projects. Climatic Change 84: 75-90.

23
Umamaheswaran K., Michaelowa A. (2006). Additionality and sustainable development issues regarding CDM projects in energy efficiency sector. HWWA Discussion Paper 346. Hamburg: Hamburg Institute of International Economics. 45 pp. UNFCCC. (2001). The Marrakech Accords. PDDs, validation reports, monitoring, verification and certification reports of the following CDM projects:
- 4.5 MW Maujhi grid-connected SHP in Himachal Pradesh - 6.6 MW municipal solid waste to electricity generation project in Hyderabad - 10MW Waste Heat Recovery based Captive Power Project based at KSPL - 16.25 MW grid connected electricity generation project at Coimbatore in Tamil Nadu - 20 MW Bagasse based cogeneration project at Sathyamangalam - 20 MW Kabini Hydro Electric Power Project, SKPCL - 125 MW wind power project in Karnataka, India - Boiler fuel switchover from Residual Fuel oil to Briquettes at Color Chem Ltd. Thane
& Roha, Maharashtra, India - Century Textiles & Industries Ltd blended cement projects at: Century cement,
Manikgarh cement, Maihar cement - Deoband bagasse based co-generation power project - DSL biomass based power project at Pagara - Energy Efficiency Measures At a Thermal Power Generating Station Of CESC-
limited, BBGS - Energy efficiency project – Tata Motors Ltd. - Fuel switch from fossil fuels to biomass briquettes for steam generation at the
chemicals manufacturing plant of Lanxess India Pvt. Ltd (LIPL) - Generation of thermal energy utilizing renewable biomass by GIL, Uttaranchal, India - Greenhouse Gas reduction by thermal oxidation of HFC 23 at Navin Fluorine
International Limited (NFIL); Surat, Gujarat, India - Grid connected 220 MW electricity generation plant using Natural Gas as a fuel at
Reliance Energy Limited Samalkot Power Station (REL-SPS) in Andhra Pradesh, India
- Grid-connected electricity generation from renewable sources at Kadavukallu, Andhra Pradesh, India (13.5 MW)
- Kuthungal run of the river 21 MW hydro power plant - MSPSPL waste heat recovery based captive power project - Optimal Utilization of Clinker in a project at J.K. Cement Ltd. (JKCL) at Nimbahera,
Rajasthan - Parpikala Mini Hydel Scheme - Wind electricity generation at Erakandurai by M/s GHCL Ltd.