emodeling of high-velocity flows in itam impulse facilitiesn-avt-186-10
TRANSCRIPT

7/29/2019 EMODELING OF HIGH-VELOCITY FLOWS IN ITAM IMPULSE FACILITIESN-AVT-186-10
http://slidepdf.com/reader/full/emodeling-of-high-velocity-flows-in-itam-impulse-facilitiesn-avt-186-10 1/20
MODELING OF HIGH-VELOCITY FLOWS IN ITAM IMPULSE FACILITIES
Prof. A.M. Kharitonov
Khristianovich Institute of Theoretical and Applied Mechanics SB RAS, Russia
It is well known that wind tunnels widely used at hypersonic velocities, are impulse and
high-enthalpy facilities. These tunnels are based on different operation principles [1÷5, 14]:
Blowdown wind tunnels several seconds;
Ludwieg tubes up to 500 ms;
Hotshot wind tunnels up to 150 ms;
Adiabatic compression wind tunnels up to 100 ms;
Shock tubes up to 10 ms;
Shock tubes with a heavy piston up to 2 ms.
Because of the short test time in these facilities, it is necessary to estimate the times
characterizing the duration of certain events tev in the flow around various models. In the
flow around an oscillating body, for example, tev equals the oscillation period, and tev = • in
the flow around a body moving with a constant velocity. If the model is rapidly inserted into
the test section of the wind tunnel, it is important to determine the time of flow stabilization
tstab. Each wind tunnel (WT) also has its own characteristic time tWT (time during which the
stagnation parameters change by a certain factor). For instance, if the behavior of these
parameters in the settling chamber is close to exponential, tWT may be assumed to be equal to
the time needed for the parameters to change by a factor of е. Interaction between the facility
and the model is characterized by one more characteristic time. The model length being
assumed to be Lmod, the fore and rear parts of the model experience the action of gas portions
that leave the settling chamber at different times (Dt = tin ~ Lmod/υ∞, where υ∞ is the free-
stream velocity in the test section); correspondingly, these gas portions have differentstagnation conditions. Hence, the greater the value of tin, the more non uniform is the flow
around the model. Obviously, the relative non-uniformity is determined by the ratio tin/tWT.
The lower this ratio, the more grounds are for neglecting it. The ratio tstab/tWT is subjected to
similar requirements. If this ratio is small, this means that the flow pattern has enough time to
follow the changing free-stream parameters.
Thus, the conditions tWT>>tin and tWT>>tstab should be always satisfied. Sometimes tin
and tstab can coincide. For instance, in studying non-separated external flow past slender
bodies, tstab is approximately equal to the time of gas-particle flight along the model, i.e.,
tstab≈ Lmod/υ∞ tin. In the flow with boundary-layer separation, gas injection through the
model surface, etc. However, tstab is normally greater than tin. If, in addition, tev >>tstab, the
model can be assumed to be motionless (this is always valid if a steady flow is considered). In
this case, the flow is assumed to be steady, the model is motionless, i.e., the flow parameters
at infinity equal the instantaneous values at the nozzle exit. These features allow for
experimental investigations of static aerodynamic characteristics with a continuous change of
the angle of attack of the model during one run of the wind tunnel, if the model moves rather
slowly (the time of model displacement is much greater than tstab). If the inequality tev >>tstab
is violated, the phenomenon under study is essentially unsteady. For instance, acoustic waves
obey the condition
≈
f aλ = , where λ is the wavelength, f is the frequency, and is theа
RTO-EN-AVT-186 10 - 1
7/29/2019 EMODELING OF HIGH-VELOCITY FLOWS IN ITAM IMPULSE FACILITIESN-AVT-186-10
http://slidepdf.com/reader/full/emodeling-of-high-velocity-flows-in-itam-impulse-facilitiesn-avt-186-10 2/20
velocity of sound. In this case, obviously, tin≈λ / υ∞ or in
а
f τ
υ ∞≈ , and the inequality tin >>
tWT should be satisfied. Bearing in mind that, α/υ∞ ∼ 1 we obtain ƒ >> 1/τWT. For tWT=10÷20
ms, the corresponding value should be ƒ >> 50÷100Гц. Hence, impulse facilities offer areliable possibility of studying the behavior of turbulent oscillations, including acoustic
oscillations with frequencies of about 1000 Hz and higher.
Another specific feature of impulse facilities is the quality of the flow, which includes
the following basic characteristics:
– degree of spatial non-uniformity of parameters in the test section [1, 2];
The non-uniformity of the Mach number distribution should not exceed 1.5–2.0 %.
– size of the core flow, i.e., the region with uniform parameters;
The core flow diameter is estimated as 50 – 70% of the nozzle exit diameter.
– purity of the flow, i.e., degree of contamination of the test gas by foreign particles
(products of electrode erosion, etc.).
Contamination of the air flow by active radicals generated by dissociation andionization of air components at stagnation temperatures higher than ~ 3000 K.
Usually the flow quality is found by both direct measurements of uniformity of
parameters in the core flow, size of the core flow, and degree of flow contamination, and by
indirect methods by testing reference models and comparisons with similar data obtained in
other wind tunnels.
Several impulse wind tunnels are in operation at ITAM SB RAS: IT-302 wind tunnel
with a discharge chamber, AT-303 wind tunnel with adiabatic compression, and shock tubes.
Basic and applied aerodynamic research has been performed in these wind tunnels in the
range of Mach numbers М = 6 20 for many years.÷
1. Hot-shot wind tunnel with a discharge chamber IT-302
It is well known that the main feature of impulse facilities with a discharge chamber is
test-gas exhaustion from a closed volume and, hence, continuously decreasing pressure,
density, and temperature during the test regime. In this case, a question arises on an
admissible degree of quasi-steadiness of the flow. This means that it is necessary to estimate
the relative rate of pressure variation in the test section or the degree of quasi-steadiness
| ( / ) | K dp dt p= in the test regime, which is inversely proportional to the volume of the
settling chamber and directly proportional to the nozzle-throat area. Calculations [3]
performed for different types of tests show that the degree of quasi-steadiness1
50s K −
≤ (or 5% during 1ms) does not induce any noticeable distortions in the flow around the models.
Distinctive features of wind tunnels with a discharge chamber are simplicity of their
structure and compactness. In contrast to classical wind tunnels, the settling chamber of hot-
shot tunnels is first filled by the test gas with a pressure of 100–200 atm, which is then heated
by a pulsed arc discharge. At the beginning, the settling chamber is separated from the test
section by a diaphragm mounted in the subsonic part of the nozzle, while the gas from the
remaining part of the wind tunnel (nozzle, test section, and vacuum tank) is evacuated by
vacuum pumps to a pressure of ~10 –2 mmHg. During the discharge of the capacitor C cap (the
discharge duration is ~0.4–1.5 ms) or inductive accumulator (10÷20 ms), the temperature and
pressure of the test gas drastically increase. When the required pressure is reached, the
Modeling of High-Velocity Flows in ITAM Impulse Facilities
10 - 2 RTO-EN-AVT-186
7/29/2019 EMODELING OF HIGH-VELOCITY FLOWS IN ITAM IMPULSE FACILITIESN-AVT-186-10
http://slidepdf.com/reader/full/emodeling-of-high-velocity-flows-in-itam-impulse-facilitiesn-avt-186-10 3/20
diaphragm breaks down, and the gas starts exhausting through the nozzle into the test section.
After a short transitional process (~ 1 ms), a flow with a prescribed Mach number is
generated. The test time in hotshot wind tunnels depends on the settling chamber volume and
normally reaches 50–150 ms.
Thus, each run of the hot-shot wind tunnel includes four steps: 1 – heating of the testgas by an arc discharge, 2 – reaching a required test regime, 3 – test regime proper, 4 –
breakdown of the test regime.
Several tenths of a millisecond after the discharge, the diaphragm separating the settling
chamber from the remaining part of the wind tunnel is opened and non-stationary exhaustion
of the gas from the settling chamber begins. This flow is accompanied by a system of gas-
dynamic discontinuities moving along the nozzle and passing through the test section where
the model is mounted. The moment when the “last” discontinuity passes through the test
section determines the WT start-up time. This time is characterized by passage of a shock
wave propagating over a cold rarefied gas filling the wind tunnel. When the gas heated in the
shock wave (plug) passes around the model, there appears a contact surface with intense
mixing of the gas. All this time reaches ~ 1.5 ms. The test time in such wind tunnels, i.e., thetime of the quasi-steady flow around the model, is usually 50÷150 ms. As the Mach number
decreases, the test time rapidly decreases because of an increase in the nozzle-throat area and,
correspondingly, flow rate of the gas. The thermodynamic parameters of the flow (pressure,
density, and temperature) and, correspondingly, the Reynolds numbers become lower. At the
same time, the Mach number remains almost unchanged.
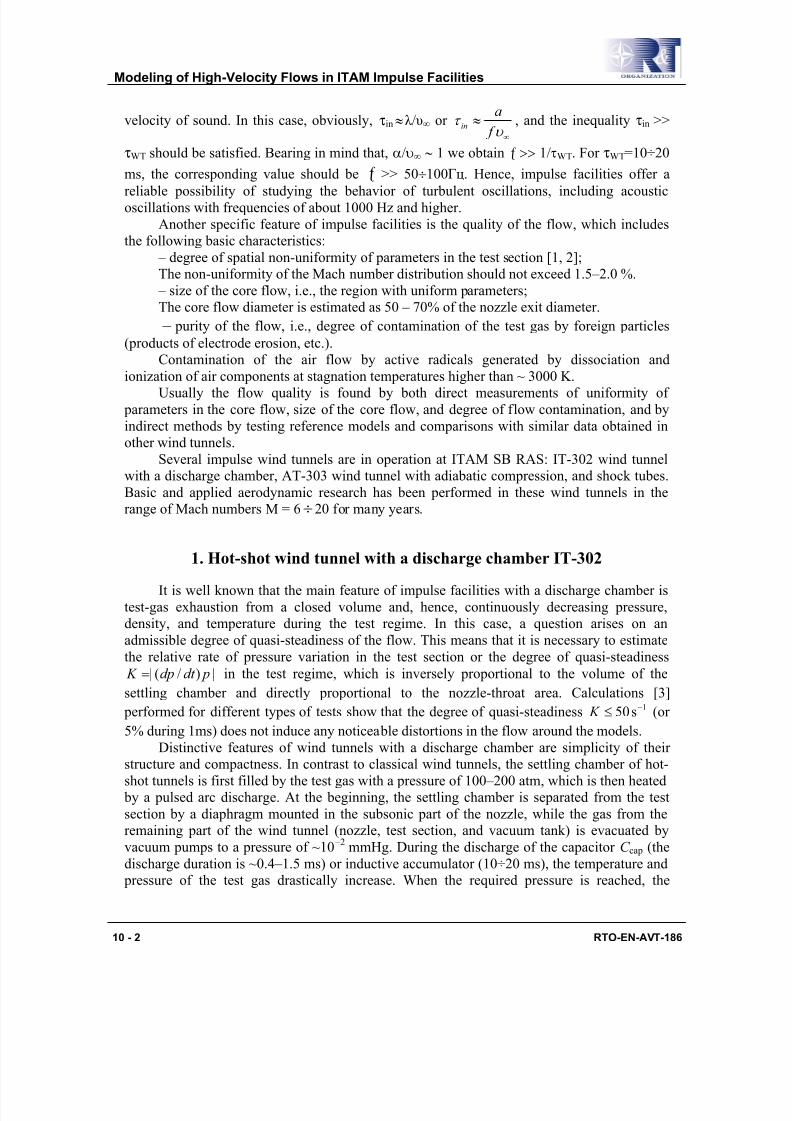
The hot-shot wind tunnel with a discharge chamber consists of the following basic
elements: high-pressure chamber, electric-arc discharge system, settling chamber, nozzle, test
section with an Eiffel chamber, and exhaust system with a vacuum tank.
The main drawback of such type wind tunnels for example like F4 related to a
continuous decrease in P 0, ρ and Re during the test time. But the using pressure multipliers
ensure constant stagnation parameters during WT operation. Such hot shot wind tunnel IT-
302 (Fig. 1) was commissioned at ITAM SB RAS and successfully operates since 1985 [4, 5].
This wind tunnel differs from other available hot-shot wind tunnels because it has a
pressure multiplier 5, which maintains constant flow parameters. The pressure multiplier is a
two-step piston 6 set into motion at the moment the diaphragms 3 and 11 are broken, which
moves in the discharge chamber under the control of a special controller 9. The piston
compresses the exhausting gas, thus, maintaining a constant stagnation pressure during the
Fig. 1 Sketch of the IT-302 hot-shot wind tunnel with a pressure multiplier:1 – gas holder
(4100 liters with a pressure P max= 200 atm); 2 – shutoff valve; 3 – diaphragm 3; 4 – plunger;
5 – pressure multiplier; 6 – two-step piston; 7 – damping fluid; 8 – tank for fluid; 9 –
controller of the flow rate; 10 – discharge chamber; 11 – diaphragm 3; 12 – contoured
nozzle; 10 – discharge chamber; 11 – diaphragm 3; 12 – contoured nozzle; 13 – test section;
14 – vacuum tank
Modeling of High-Velocity Flows in ITAM Impulse Facilities
RTO-EN-AVT-186 10 - 3
7/29/2019 EMODELING OF HIGH-VELOCITY FLOWS IN ITAM IMPULSE FACILITIESN-AVT-186-10
http://slidepdf.com/reader/full/emodeling-of-high-velocity-flows-in-itam-impulse-facilitiesn-avt-186-10 4/20
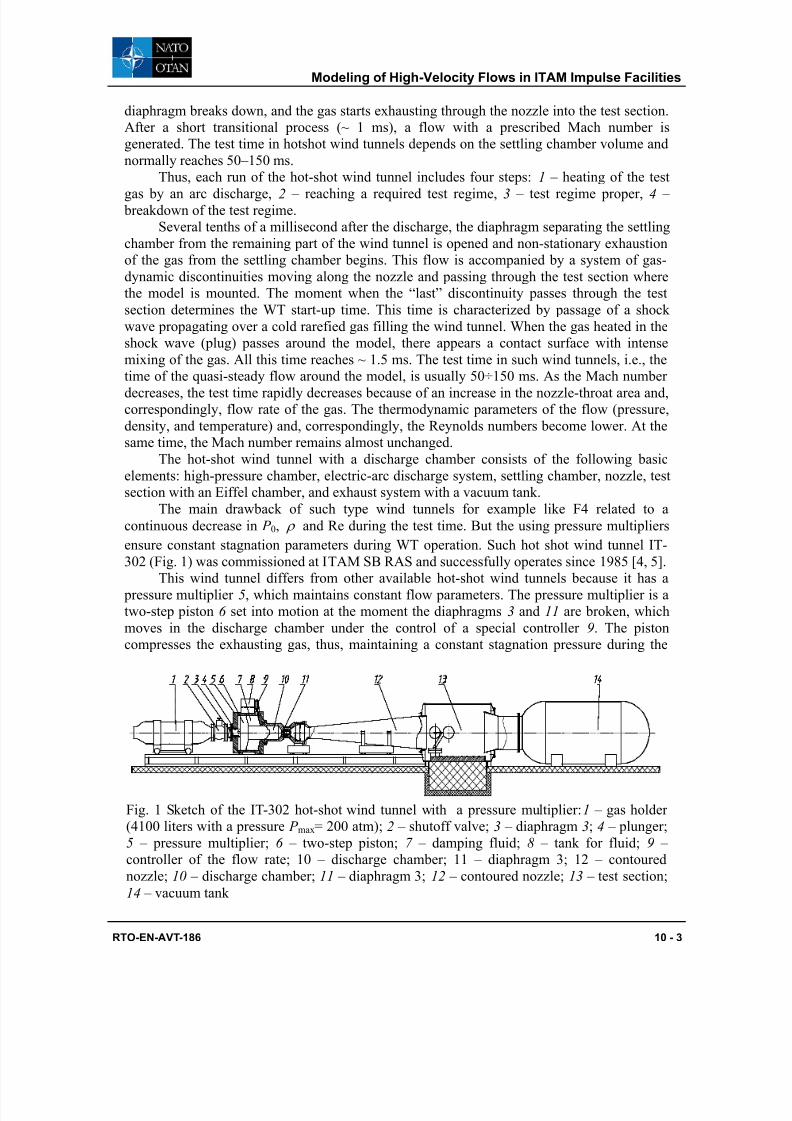
test time until the test regime is terminated. A
typical oscillogram of pressure in the settling
chamber, obtained with the pressure multiplier,
is shown in Fig. 2. The pressure remains
constant during about 0.1 s within 1%. For comparison, the figure also shows the pressure
oscillogram for the case of WT operation
without the pressure multiplier.
±
The Mach number in the test section
remains practically constant, because it is
mainly determined by the ratio of nozzle-exit
and nozzle-throat areas.
This unique WT is used up to now to
study various problems of gas dynamics:
specific features of compression and expansion
flows in inlets and model scramjets, includingthose with combustion of various fuels, characteristics of models of reentry vehicles, various
methods of thermal protection, properties of a hypersonic boundary layer, and interaction of
the latter with shock waves.
Fig. 2 Pressure oscillogram in the settling
chamber with and without the pressure
multiplier.
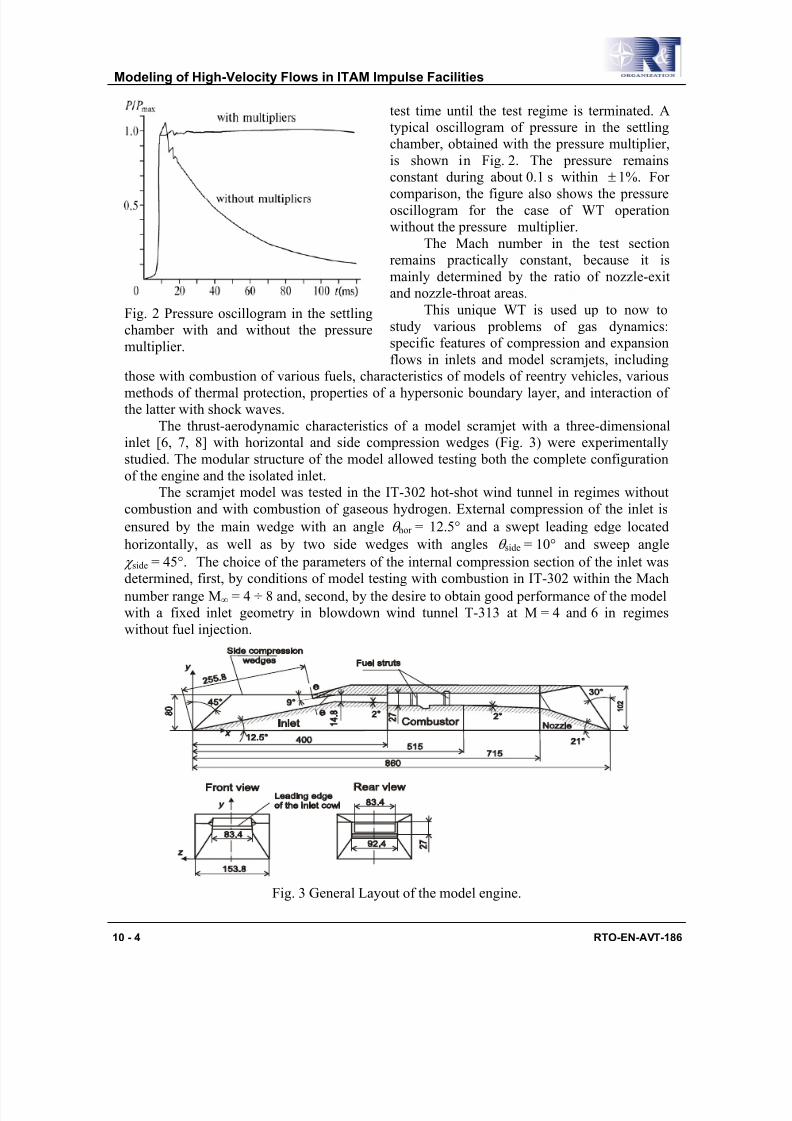
The thrust-aerodynamic characteristics of a model scramjet with a three-dimensional
inlet [6, 7, 8] with horizontal and side compression wedges (Fig. 3) were experimentally
studied. The modular structure of the model allowed testing both the complete configuration
of the engine and the isolated inlet.
The scramjet model was tested in the IT-302 hot-shot wind tunnel in regimes without
combustion and with combustion of gaseous hydrogen. External compression of the inlet is
ensured by the main wedge with an angle θ hor = 12.5° and a swept leading edge located
horizontally, as well as by two side wedges with angles θ side = 10° and sweep angle
χ side = 45°. The choice of the parameters of the internal compression section of the inlet was
determined, first, by conditions of model testing with combustion in IT-302 within the Mach
number range М∞ = 4 ÷ 8 and, second, by the desire to obtain good performance of the model
with a fixed inlet geometry in blowdown wind tunnel T-313 at M = 4 and 6 in regimes
without fuel injection.
Fig. 3 General Layout of the model engine.
Modeling of High-Velocity Flows in ITAM Impulse Facilities
10 - 4 RTO-EN-AVT-186
7/29/2019 EMODELING OF HIGH-VELOCITY FLOWS IN ITAM IMPULSE FACILITIESN-AVT-186-10
http://slidepdf.com/reader/full/emodeling-of-high-velocity-flows-in-itam-impulse-facilitiesn-avt-186-10 5/20
The inner duct of the inlet has a rectangular cross section and is finished by a
downward-facing step with abrupt expansion of the cross-sectional area to a value
corresponding to the initial cross section of the combustion chamber Аcomb/ А0 = 0.2. The
combustor has an initial sector with a constant cross-sectional area, where two rows of
vertical struts for injection of gaseous hydrogen were mounted. The nozzle formed by flatwalls in the simplest manner as an “inverse” inlet ensures expansion of the exhausted jet in
the horizontal and vertical planes. The exit section of the nozzle is made oblique with an
angle χ n = 30° and has a relative area Аn/ А0 = 1.275.
During the experiments, the schlieren pictures of the flow pattern in the duct were
obtained; detailed measurements of static pressure and heat flux distributions on compression
wedges of the inlet and in the scramjet duct and stagnation pressure distributions in the exit
cross section were performed by means of Pitot rakes.
The axial component of the resulting forces acting on the model was measured by a
special external strain-gauge balance located on the sting under a protective shield. The
system of fuel injection into the model did not affect the balance measurements. The drag of
the main components of the scramjet was determined, and the resulting thrust-aerodynamiccharacteristics of the examined model configuration of the scramjet were obtained.
As a whole, the flow pattern in the inlet is characterized by complicated multiple three-
dimensional interactions of shock waves with each other and with the boundary layer.
Glancing shock waves induce numerous three-dimensional separations and reattachments.
The system of shock and expansion waves formed in the inlet is responsible for significant
non-uniformity of the velocity field at the combustor entrance.
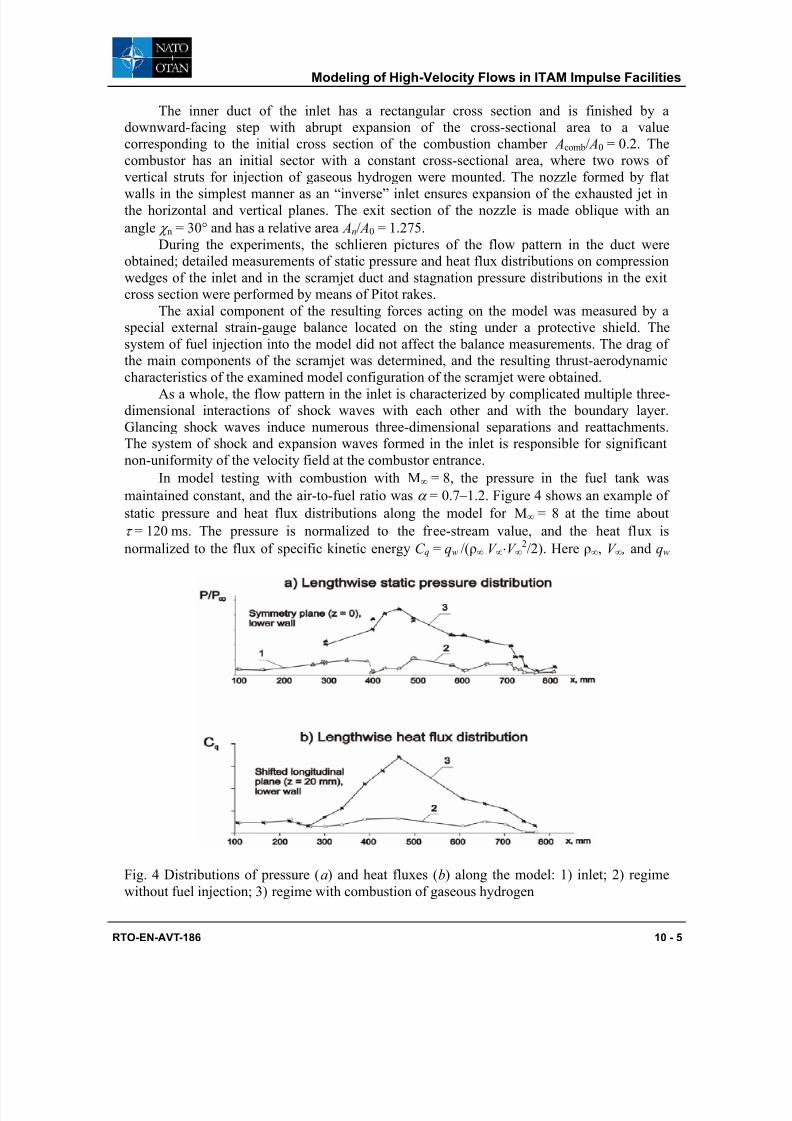
In model testing with combustion with М∞ = 8, the pressure in the fuel tank was
maintained constant, and the air-to-fuel ratio was α = 0.7–1.2. Figure 4 shows an example of
static pressure and heat flux distributions along the model for М∞ = 8 at the time about
τ = 120 ms. The pressure is normalized to the free-stream value, and the heat flux isnormalized to the flux of specific kinetic energy С q = qw /(ρ∞ V ∞⋅V ∞
2/2). Here ρ∞, V ∞ , and qw
Fig. 4 Distributions of pressure (a) and heat fluxes (b) along the model: 1) inlet; 2) regime
without fuel injection; 3) regime with combustion of gaseous hydrogen
Modeling of High-Velocity Flows in ITAM Impulse Facilities
RTO-EN-AVT-186 10 - 5
7/29/2019 EMODELING OF HIGH-VELOCITY FLOWS IN ITAM IMPULSE FACILITIESN-AVT-186-10
http://slidepdf.com/reader/full/emodeling-of-high-velocity-flows-in-itam-impulse-facilitiesn-avt-186-10 6/20
are the free-stream density and velocity
and the specific heat flux, respectively.
The level and behavior of pressure and
heat fluxes along the scramjet duct show
that a flow regime with thermal choking inthe model inlet is obtained.
A flow regime with a system of X -shaped oblique and glancing shock waves
is formed, which can be interpreted as a
pseudoshock [9, 10]. The beginning of
pressure increase in the pseudoshock is
established at the entrance section of the
inlet ahead of the throat by the time
τ = 80 ms, but apparently, the
pseudoshock does not go upstream of the
inlet duct. The quasi-steady flow regimewith thermal choking in the combustor
and a pseudoshock in the model inlet was also observed for М∞ = 6 in the time interval
τ = 80 –120 ms.
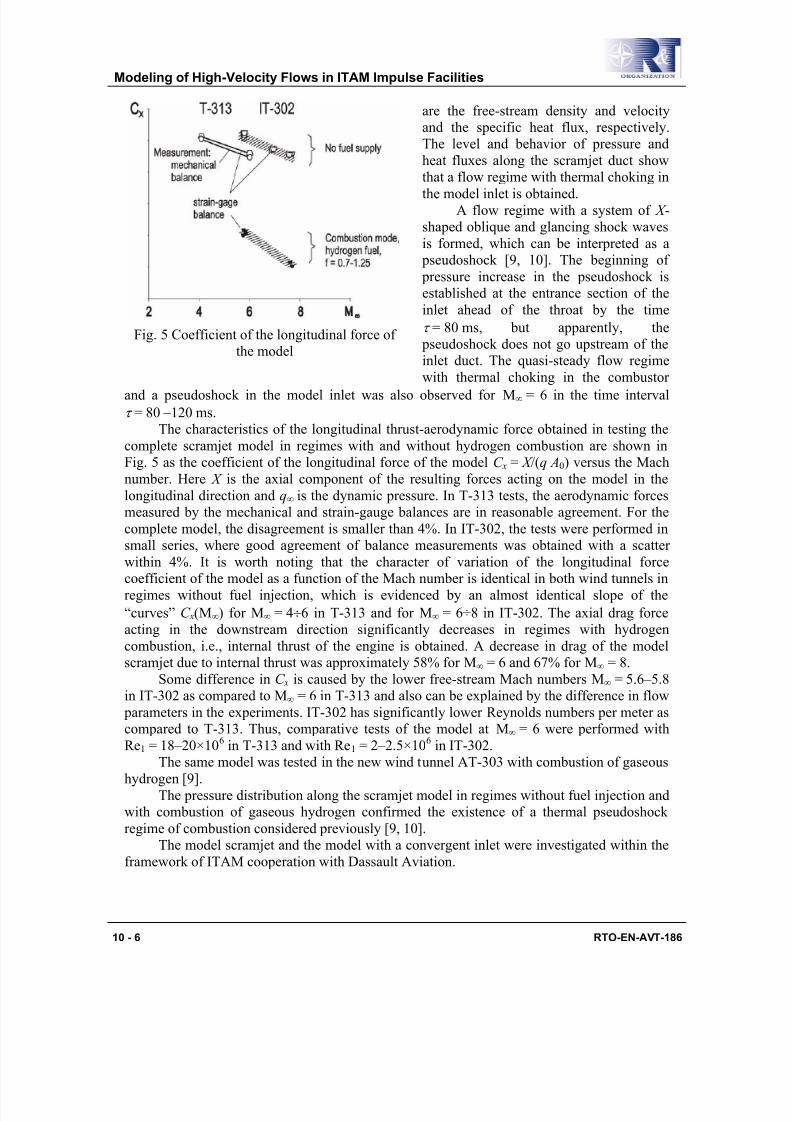
Fig. 5 Coefficient of the longitudinal force of
the model
The characteristics of the longitudinal thrust-aerodynamic force obtained in testing the
complete scramjet model in regimes with and without hydrogen combustion are shown in
Fig. 5 as the coefficient of the longitudinal force of the model С x = Х /(q А0) versus the Mach
number. Here X is the axial component of the resulting forces acting on the model in the
longitudinal direction and q∞ is the dynamic pressure. In T-313 tests, the aerodynamic forces
measured by the mechanical and strain-gauge balances are in reasonable agreement. For the
complete model, the disagreement is smaller than 4%. In IT-302, the tests were performed insmall series, where good agreement of balance measurements was obtained with a scatter
within 4%. It is worth noting that the character of variation of the longitudinal force
coefficient of the model as a function of the Mach number is identical in both wind tunnels in
regimes without fuel injection, which is evidenced by an almost identical slope of the
“curves” С х(М∞) for М∞ = 4÷6 in Т-313 and for М∞ = 6÷8 in IT-302. The axial drag force
acting in the downstream direction significantly decreases in regimes with hydrogen
combustion, i.e., internal thrust of the engine is obtained. A decrease in drag of the model
scramjet due to internal thrust was approximately 58% for М∞ = 6 and 67% for М∞ = 8.
Some difference in С х is caused by the lower free-stream Mach numbers М∞ = 5.6–5.8
in IT-302 as compared to М∞ = 6 in Т-313 and also can be explained by the difference in flow
parameters in the experiments. IT-302 has significantly lower Reynolds numbers per meter ascompared to T-313. Thus, comparative tests of the model at М∞ = 6 were performed with
Re1 = 18–20×106 in Т-313 and with Re1 = 2–2.5×10⁶ in IT-302.
The same model was tested in the new wind tunnel AT-303 with combustion of gaseous
hydrogen [9].
The pressure distribution along the scramjet model in regimes without fuel injection and
with combustion of gaseous hydrogen confirmed the existence of a thermal pseudoshock
regime of combustion considered previously [9, 10].
The model scramjet and the model with a convergent inlet were investigated within the
framework of ITAM cooperation with Dassault Aviation.
Modeling of High-Velocity Flows in ITAM Impulse Facilities
10 - 6 RTO-EN-AVT-186
7/29/2019 EMODELING OF HIGH-VELOCITY FLOWS IN ITAM IMPULSE FACILITIESN-AVT-186-10
http://slidepdf.com/reader/full/emodeling-of-high-velocity-flows-in-itam-impulse-facilitiesn-avt-186-10 7/20
2. Original wind tunnel with adiabatic compression AT-303
The adiabatic compression wind tunnels do not give such high stagnation temperatures
as hot-shot and shock tunnels, but, owing to higher densities and pressures, they ensure high
Reynolds numbers. One of the first tunnels based on this principle is the Long-Shot facility[5, 11] at the Von Karman Institute (Belgium). It is designed for operation with nitrogen with
initial pressures up to 4000 atm and temperatures up to 3000 K.
High pressures can be obtained by using gas sources with a completely adiabatic cycle
of test-gas preparation. Such sources are equipped with pressure multipliers consecutively
compressing and then ejecting the gas at constant pressure. The first source of the test gas of
this kind was created at the Lavrentyev Institute of Hydrodynamics of the Siberian Branch of
the Russian Academy of Sciences (LIH SB RAS) in 1975 [12, 13, 14].
One of the main problems of wind tunnels with adiabatic compression and a free piston
is piston kickback after its stop at the point of the maximum compression. At the maximum
pressures of the test gas of the order of 2000÷4000 atm, almost the entire process of piston
deceleration occurs during the last tens of microseconds (increase in pressure from the halvedto the maximum value) [13]. The piston kickback and the decrease in pressure occur during
the same time period; hence, it is necessary to lock the gas in the settling chamber or to stop
the piston at the point of the maximum compression. Both processes are rather difficult tasks
in the technical aspect. In the first case, it is necessary to ensure a large cross-sectional area,
fast response, and erosion resistance of check valves, which are contradictory requirements. In
the second case, it is necessary to resolve the issue of a very large force acting on the channel,
because the force acting on each square centimeter of the piston area is 2 ÷ 4 tons.
For example in the Long-Shot wind tunnel with adiabatic compression [5], the settling
chamber is equipped with a system of 48 valves preventing the gas backflow into the channel.
At the final stage of compression, the gas with very high parameters penetrates through the
valves, leading to their erosion and rapid failure. It is probably for this reason that Long-Shot
operates with nitrogen only. In the wind tunnel with adiabatic compression, which was
developed at SB RAS, the piston is equipped with a special system of wedges, which
terminate the piston motion without kickback at the point of the maximum pressure, its
seizure, and free motion after the pressure in the settling chamber is released [14]. As a result,
heat losses and gas contamination become lower.
The concept and experience of exploitation of the model facility developed at LIH SB
RAS were used to develop a new wind tunnel with adiabatic compression (AT-303) at ITAM
SB RAS [5, 14]. A sketch of the wind tunnel is shown in Fig. 6. The main element of this wind
tunnel is the source of high-pressure gas with a volume of the settling chamber approximately
equal to 6 dm
3
, which was developed in the 1980s by LIH SB RAS [12, 13]. This sourceallows obtaining pressures up to 3000 atm and temperatures up to 2000 K. The test time is
40÷100 ms, and the nozzle-exit diameters are 0.3-0.6 m. The test gases are nitrogen, air,
helium, or СО2. It is a completely symmetric system with two pressure multipliers, which are
set into motion by eight pneumohydraulic drives. The main pressure multipliers are fed by a
cross scheme providing rigorous hydraulic synchronization of the opposing motion of the
pistons. The gas is injected into the settling chamber through a Cowper-type heater at a
pressure of 170 atm and temperature of 900 K; then it is compressed by the pressure multipliers
to prescribed parameters and is ejected through the nozzle.
At the start-up moment, the gas with a pressure up to 300 atm from receivers enters the
pneumohydraulic drives. The pressure of the fluid increases to 1500 atm, affecting the main
pressure multipliers, which start moving toward each other and adiabatically compress the test
Modeling of High-Velocity Flows in ITAM Impulse Facilities
RTO-EN-AVT-186 10 - 7
7/29/2019 EMODELING OF HIGH-VELOCITY FLOWS IN ITAM IMPULSE FACILITIESN-AVT-186-10
http://slidepdf.com/reader/full/emodeling-of-high-velocity-flows-in-itam-impulse-facilitiesn-avt-186-10 8/20
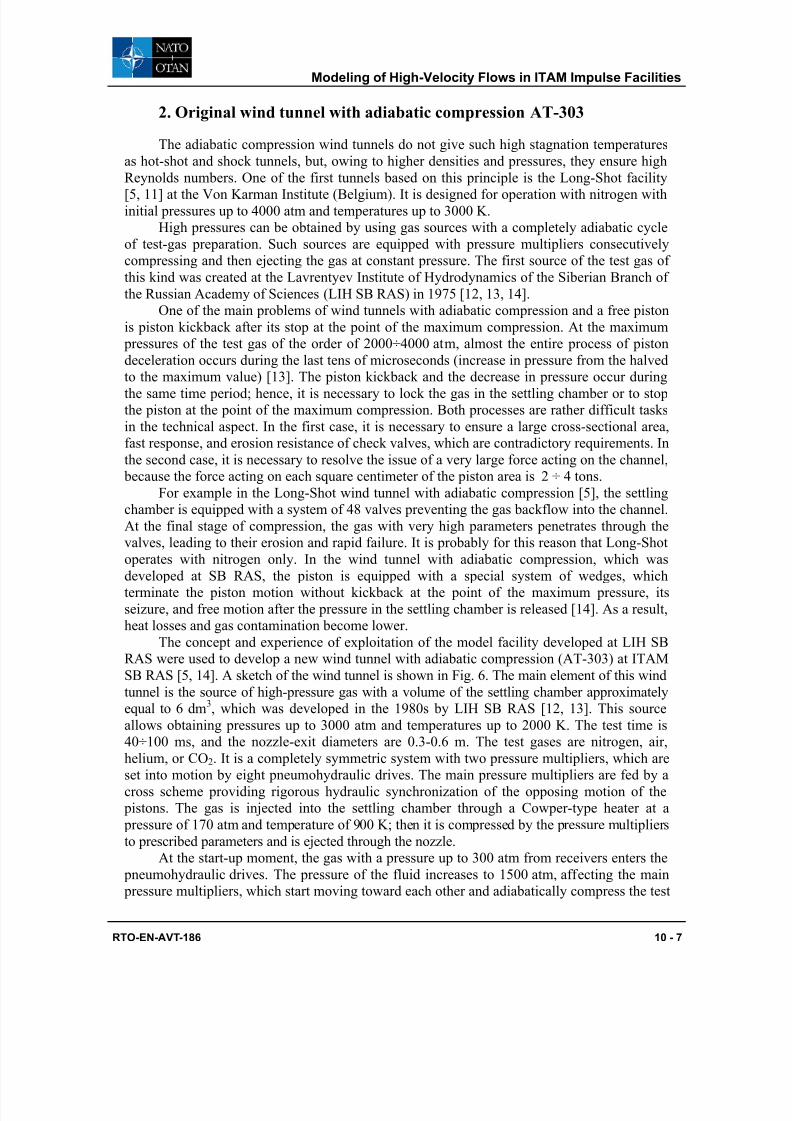
Fig. 6. Sketch of the AT-303 wind tunnel with adiabatic compression at ITAM SB RAS.
gas to prescribed parameters. When a necessary pressure in the settling chamber is reached, a
special valve opens the nozzle throat during ~ ms, and gas exhaustion begins.The remaining elements of AT-303 are typical of hypersonic wind tunnels (see Fig. 6):
nozzle, test section, output diffuser, and vacuum tank with a volume of 250 m3. The wind
tunnel is fed from an in-house compressor station, which provides pressures up to 350 atm
and a total volume of gas holders of 4 m3. By virtue of adiabatic of the test-gas preparation
cycle, the process of gas compression has an isentropic character. Hence, the parameters
reachable in the settling chamber are rigorously
related to the initial parameters. If the initial
parameters are defined, the possible states of the
gas lie on one isentropic in the plane P 0 – T 0.
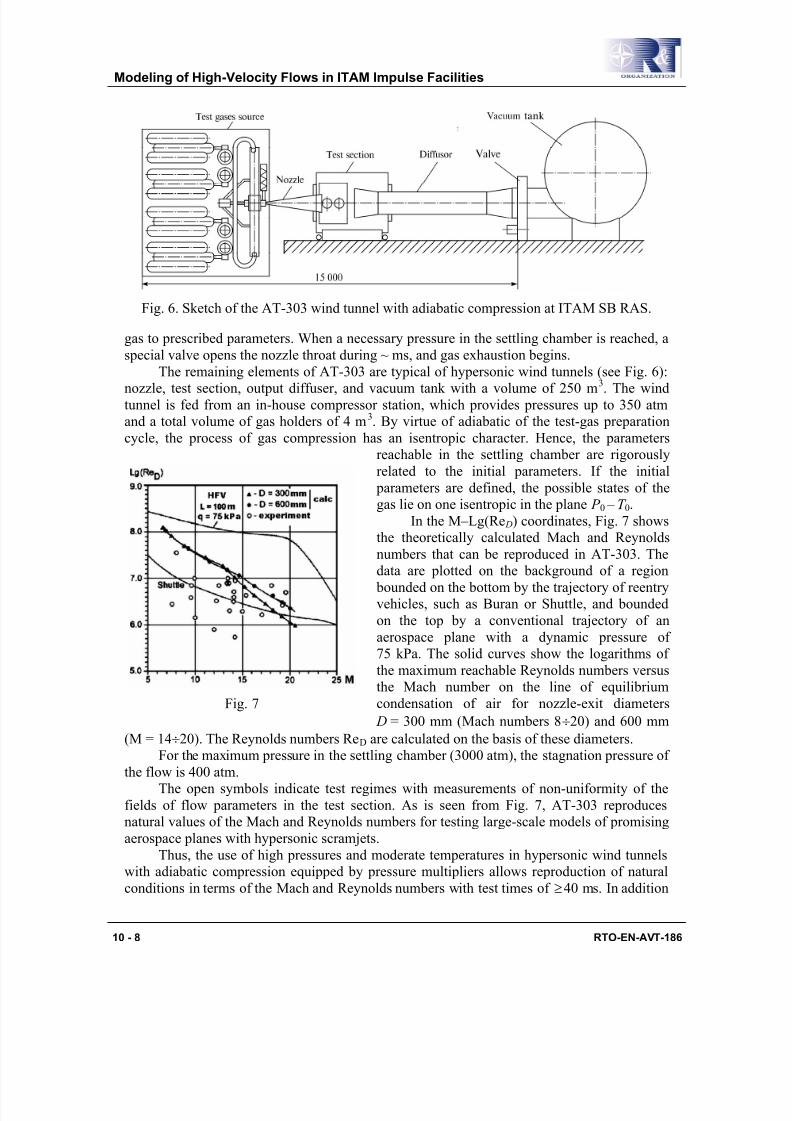
In the M–Lg(Re D) coordinates, Fig. 7 shows
the theoretically calculated Mach and Reynoldsnumbers that can be reproduced in AT-303. The
data are plotted on the background of a region
bounded on the bottom by the trajectory of reentry
vehicles, such as Buran or Shuttle, and bounded
on the top by a conventional trajectory of an
aerospace plane with a dynamic pressure of
75 kPa. The solid curves show the logarithms of
the maximum reachable Reynolds numbers versus
the Mach number on the line of equilibrium
condensation of air for nozzle-exit diameters
D = 300 mm (Mach numbers 8÷20) and 600 mm
(М = 14÷20). The Reynolds numbers ReD are calculated on the basis of these diameters.
Fig. 7
For the maximum pressure in the settling chamber (3000 atm), the stagnation pressure of
the flow is 400 atm.
The open symbols indicate test regimes with measurements of non-uniformity of the
fields of flow parameters in the test section. As is seen from Fig. 7, AT-303 reproduces
natural values of the Mach and Reynolds numbers for testing large-scale models of promising
aerospace planes with hypersonic scramjets.
Thus, the use of high pressures and moderate temperatures in hypersonic wind tunnels
with adiabatic compression equipped by pressure multipliers allows reproduction of natural
conditions in terms of the Mach and Reynolds numbers with test times of 40 ms. In addition≥
Modeling of High-Velocity Flows in ITAM Impulse Facilities
10 - 8 RTO-EN-AVT-186

7/29/2019 EMODELING OF HIGH-VELOCITY FLOWS IN ITAM IMPULSE FACILITIESN-AVT-186-10
http://slidepdf.com/reader/full/emodeling-of-high-velocity-flows-in-itam-impulse-facilitiesn-avt-186-10 9/20
to high purity of the test gas, the wind tunnel makes it possible to test models of hypersonic
flying vehicles with inlets, combustors (with combustion), and nozzles.
Another advantage of facilities of this type is the possibility of separating the influence
of viscosity and real gas effects in studying the flow around models of hypersonic flying
vehicles. This is particularly important for verification of CFD models and methods under development.
Some examples of the hypersonic flows around different models are given below. Hyperboloid flare (HF) model [16] whose profile describes the windward centerline of
the Hermes re-entry vehicle at an angle of attack. The contour is defined by ESA/ESTEC,
Schwane and Muylaert (1994), as matched fourth order polynomials for the axial coordinate X as a function of the surface abscissa Y , including a flare making an angle of 43.60 with X -axis.
The model was instrumented with 20 Kulite pressure transducers, type XCS-093-50D.
Seventeen transducers were located along one generatrix of the model. The model was also
instrumented with 17 ONERA thermocouples.
Figure 8 show the schlieren pictures of the flow around the HF models with small and
big flare at the Mach number equal to 10.
a bFig. 8 Big flare at M = 9.94; ReL=2.8×10⁶ (a); small flare at M = 9.91; ReL=2.62×10⁶ (b).
Fig. 9 Comparisons of the pressure coefficient distributions
Modeling of High-Velocity Flows in ITAM Impulse Facilities
RTO-EN-AVT-186 10 - 9
7/29/2019 EMODELING OF HIGH-VELOCITY FLOWS IN ITAM IMPULSE FACILITIESN-AVT-186-10
http://slidepdf.com/reader/full/emodeling-of-high-velocity-flows-in-itam-impulse-facilitiesn-avt-186-10 10/20
0
0, 5
1
1, 5
2
2, 5
0 0 ,2 0 ,4 0 ,6 0 ,8 1 1 ,2
X /L
q i/q 1
A T - 303 s h o t 910 " s m a l l f l ar e" Ф= 0 M = 1 4 , 9 9 , R e L = 0 , 7 8 * 1 0^ 6 , P o = 6 1 , 1 M P a , T o = 1 5 7 6 K
A T - 303 s h o t 922 " b i g f l ar e " Ф= 0 M = 1 4 , 9 8 , R eL = 0 , 7 8 * 1 0 ^ 6 , P o = 6 2 , 1 M P a , T o = 1 5 8 2 K
L on g s h ot s h o t 1184 " s m al l f l ar e " t= 8 m s Ф= 0 M = 1 4 , 7 9 , R eL = 1 , 0 0 * 1 0 ^ 6 , P o = 1 3 0 , 5 M P a ,
T o = 1 9 7 3 K [ ]
L on g s h ot s h o t 1184 " s m al l f l ar e " t= 11 , 5 m s Ф= 0 M = 1 4 , 6 4 , R e L = 0 , 7 8 * 1 0^ 6 , P o = 1 0 2 , 0 M P a ,T o = 2 0 0 7 K [ ]
F 4 s h o t 5 9 6 " s m a l l f l ar e" M = 1 3 , 8 9 , R eL = 0 , 5 4 * 1 0 ^ 5 , P o = 4 1 ,1 M P a , H o = 9 , 6 M j/ kg [ ]
Fl a re h i n g e l i n e
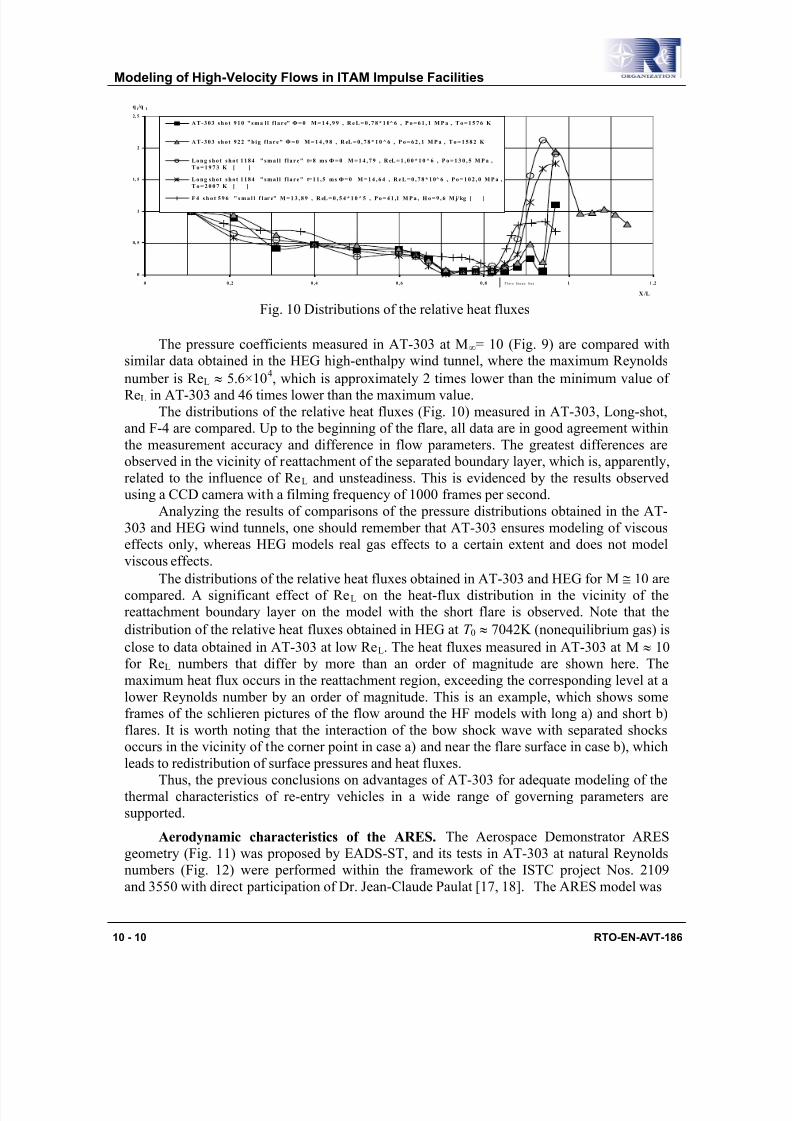
Fig. 10 Distributions of the relative heat fluxes
The pressure coefficients measured in AT-303 at M∞= 10 (Fig. 9) are compared with
similar data obtained in the HEG high-enthalpy wind tunnel, where the maximum Reynoldsnumber is ReL ≈ 5.6×10
4, which is approximately 2 times lower than the minimum value of
ReL in АТ-303 and 46 times lower than the maximum value.
The distributions of the relative heat fluxes (Fig. 10) measured in AT-303, Long-shot,
and F-4 are compared. Up to the beginning of the flare, all data are in good agreement within
the measurement accuracy and difference in flow parameters. The greatest differences are
observed in the vicinity of reattachment of the separated boundary layer, which is, apparently,
related to the influence of ReL and unsteadiness. This is evidenced by the results observed
using a CCD camera with a filming frequency of 1000 frames per second.
Analyzing the results of comparisons of the pressure distributions obtained in the AT-
303 and HEG wind tunnels, one should remember that AT-303 ensures modeling of viscous
effects only, whereas HEG models real gas effects to a certain extent and does not model
viscous effects.
The distributions of the relative heat fluxes obtained in AT-303 and HEG for М ≅ 10 are
compared. A significant effect of ReL on the heat-flux distribution in the vicinity of the
reattachment boundary layer on the model with the short flare is observed. Note that the
distribution of the relative heat fluxes obtained in HEG at Т 0 ≈ 7042K (nonequilibrium gas) is
close to data obtained in AT-303 at low ReL. The heat fluxes measured in AT-303 at М ≈ 10
for ReL numbers that differ by more than an order of magnitude are shown here. The
maximum heat flux occurs in the reattachment region, exceeding the corresponding level at a
lower Reynolds number by an order of magnitude. This is an example, which shows some
frames of the schlieren pictures of the flow around the HF models with long a) and short b)flares. It is worth noting that the interaction of the bow shock wave with separated shocks
occurs in the vicinity of the corner point in case a) and near the flare surface in case b), which
leads to redistribution of surface pressures and heat fluxes.
Thus, the previous conclusions on advantages of AT-303 for adequate modeling of the
thermal characteristics of re-entry vehicles in a wide range of governing parameters are
supported.
Aerodynamic characteristics of the ARES. The Aerospace Demonstrator ARES
geometry (Fig. 11) was proposed by EADS-ST, and its tests in AT-303 at natural Reynolds
numbers (Fig. 12) were performed within the framework of the ISTC project Nos. 2109
and 3550 with direct participation of Dr. Jean-Claude Paulat [17, 18].
The ARES model was
Modeling of High-Velocity Flows in ITAM Impulse Facilities
10 - 10 RTO-EN-AVT-186

7/29/2019 EMODELING OF HIGH-VELOCITY FLOWS IN ITAM IMPULSE FACILITIESN-AVT-186-10
http://slidepdf.com/reader/full/emodeling-of-high-velocity-flows-in-itam-impulse-facilitiesn-avt-186-10 11/20
Fig. 11 Fig. 12
Fig. 13 Aerodynamic characteristics for M∞ = 12 and 18 obtained in a conical nozzle
Modeling of High-Velocity Flows in ITAM Impulse Facilities
RTO-EN-AVT-186 10 - 11
7/29/2019 EMODELING OF HIGH-VELOCITY FLOWS IN ITAM IMPULSE FACILITIESN-AVT-186-10
http://slidepdf.com/reader/full/emodeling-of-high-velocity-flows-in-itam-impulse-facilitiesn-avt-186-10 12/20
tested on some parts of the reentry trajectory at nominal Mach numbers M = 10, 12, and 18 at
angles of attack α = 20º, 30º, and 40º. The aerodynamic characteristics of the ARES model
with allowance for corrections for flow conicity are shown in Fig. 13. The results obtained
characterize the drag, lift, and pitching moment coefficients as functions of the angle of attack
and Reynolds number. A comparison of the moment characteristics shows that the pitching
moment decreases with increasing M (the center of pressure is shifted backward), the static
stability increases, and the balancing angle of attack decreases to α ≈ 40°. The influence of
the Reynolds number on these data is within the measurement error. These are approximate
estimates of their real values under conditions of a parallel flow and can be used in practice
only in this aspect. To obtain more reliable values of aerodynamic characteristics, it is
necessary to perform tests with a contoured nozzle or determine more justified corrections for
flow conicity.
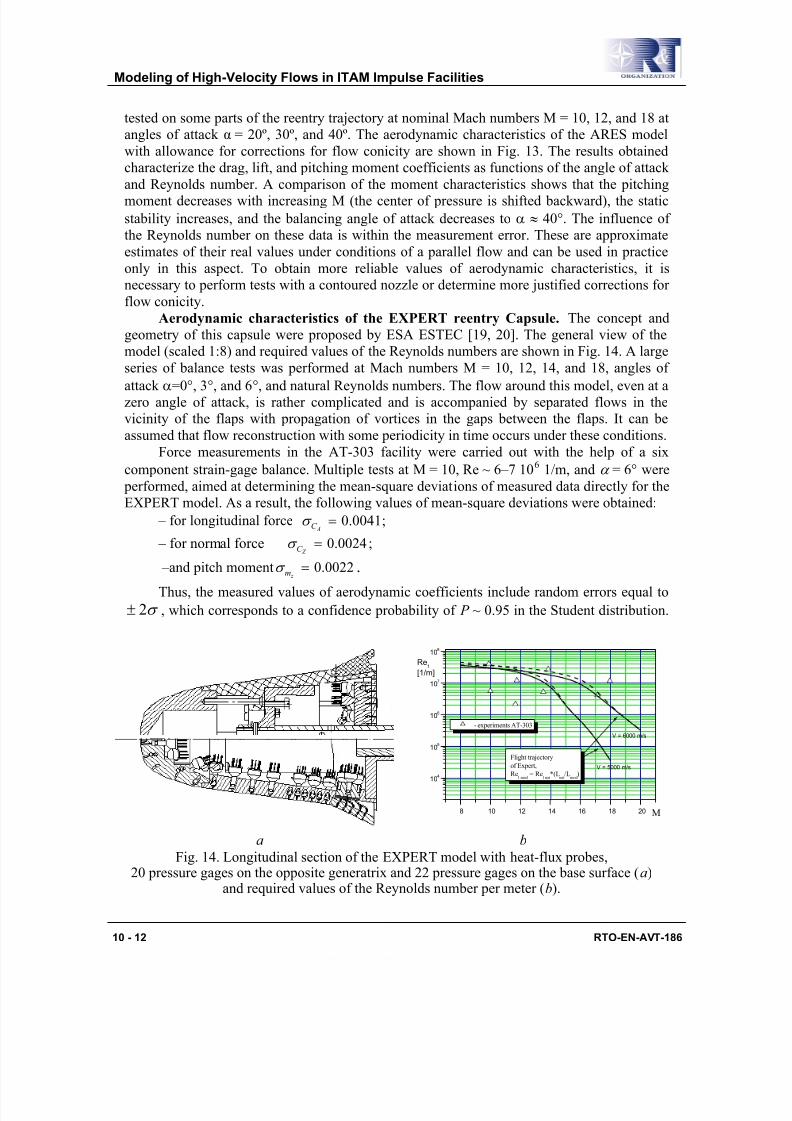
Aerodynamic characteristics of the EXPERT reentry Capsule. The concept and
geometry of this capsule were proposed by ESA ESTEC [19, 20]. The general view of the
model (scaled 1:8) and required values of the Reynolds numbers are shown in Fig. 14. A largeseries of balance tests was performed at Mach numbers М = 10, 12, 14, and 18, angles of
attack α=0°, 3°, and 6°, and natural Reynolds numbers. The flow around this model, even at a
zero angle of attack, is rather complicated and is accompanied by separated flows in the
vicinity of the flaps with propagation of vortices in the gaps between the flaps. It can be
assumed that flow reconstruction with some periodicity in time occurs under these conditions.
Force measurements in the АТ-303 facility were carried out with the help of a six
component strain-gage balance. Multiple tests at М = 10, Re ~ 6–7 106 1/m, and α = 6° were
performed, aimed at determining the mean-square deviations of measured data directly for the
EXPERT model. As a result, the following values of mean-square deviations were obtained:
– for longitudinal force 0.0041 AC σ = ;
– for normal force 0.0024 Z C σ = ;
–and pitch moment 0.0022 z mσ = .
Thus, the measured values of aerodynamic coefficients include random errors equal to
σ 2± , which corresponds to a confidence probability of P ~ 0.95 in the Student distribution.
a b
Fig. 14. Longitudinal section of the EXPERT model with heat-flux probes,20 pressure gages on the opposite generatrix and 22 pressure gages on the base surface (a)
and required values of the Reynolds number per meter (b).
8 10 12 14 16 18 20
104
105
106
107
108
V = 5000 m/s
V = 6000 m/s
Flight trajectory
of Expert,
Re1 mod
= Re1 nat
*(Lnat
/Lmod
)
- experiments AT-303
M
Re1
[1/m]
Modeling of High-Velocity Flows in ITAM Impulse Facilities
10 - 12 RTO-EN-AVT-186
7/29/2019 EMODELING OF HIGH-VELOCITY FLOWS IN ITAM IMPULSE FACILITIESN-AVT-186-10
http://slidepdf.com/reader/full/emodeling-of-high-velocity-flows-in-itam-impulse-facilitiesn-avt-186-10 13/20
This errors were then used to analyze the
test data obtained at М = 14 and 18.
Total aerodynamic characteristics.
The experimental data obtained are shown
in Fig. 15 for aerodynamic-forcecoefficients in the balance-fitted coordinate
system. The same figure shows the probable
level of random errors as predicted from
previous data obtained in multiple tests at
М = 10 [21, 22].
It should be noted that the longitudinal
force coefficient, varying in the interval
C A ~ 0.310–0.335, displays an insignificant
(within 10%) increase over the angle of
attack. Repeated tests at α = 6° show rather good convergence of data, especially for the
longitudinal force coefficient C A. The scatter in the measured values of the normal force and pitching moment coefficients lies within the limits of the square-mean deviation.
0 1 2 3 4 5 6
-0.1
0.0
0.1
0.2
0.3
7
m z
C z
γ = 0
γ = 0
γ = 45o
γ = 90o
- preliminary series
α, deg
C A
Fig. 15 Aerodynamic characteristics at
М = 13.8 and Re1 ~ 1.55 107 1/m
The effect of the rolling angle generated by model rotation with respect to the
longitudinal axis of the balance was investigated at α = 6°. The data were obtained for rolling
angles γ = 0, 45, and 90°. Recall that the angle γ = 0 refers to the open state of one of the flap
pairs in the vertical symmetry plane, and the angle γ = 90°, in the horizontal symmetry plane.
The scatter of СА can be argued to be within 2 AC σ ± . The normal force and pitching moment
coefficients display a similar behavior, although the scatter of experimental values here is
more pronounced.
Pressure distribution over the model surface. The pressure distributions over the
surface of the EXPERT model were measured at the Mach number М = 10 (conical nozzlewith the exit diameter Dn = 400 mm) at the following values of free-stream parameters:
stagnation pressure Р0 = 9850 kPa, stagnation temperature Т 0 =1024 K, and unit Reynolds
number Re1 = 6.8 106 1/m. The obtained pattern of the relative pressure over the generatrix of
the windward and leeward surfaces in the plane of symmetry of the model is shown in Fig. 16
for the angles of attack α = 0, 3, and 6° [22]. The insets in this figure show the pressure
distribution outside the forebody, in the flap region with the origin located at х = 162.5 mm.
As it could be expected, an increase in the angle of attack is accompanied by an increase
in pressure on the windward side and by a decrease in pressure on the leeward side. The
average level of the relative pressure near the stagnation point is about 125, irrespective of the
angle of attack. The most pronounced increase in pressure on the flaps is observed on
0.00 0.05 0 .10 0.15 0.20
0
20
40
60
80
10 0
12 0
14 0
0 .05 0.10 0.15 0.200
5
10
15
20
25
0.00 0.05 0.10 0.15 0.20
0
20
40
60
80
10 0
12 0
14 0
0.05 0.10 0.15 0.200
5
10
15
20
25
X, m
p/ p∞
γ = 0
α = 0
= 3o
= 6o
X, m
p/p∞
a )b )
X, m
p/ p∞ γ = 180
o
α = 0
= 3o
= 6o
X, m
p/p∞
Fig. 16 Distribution of the relative pressure over the windward (a) and leeward (b) surfaces of
the model.
Modeling of High-Velocity Flows in ITAM Impulse Facilities
RTO-EN-AVT-186 10 - 13

7/29/2019 EMODELING OF HIGH-VELOCITY FLOWS IN ITAM IMPULSE FACILITIESN-AVT-186-10
http://slidepdf.com/reader/full/emodeling-of-high-velocity-flows-in-itam-impulse-facilitiesn-avt-186-10 14/20
increasing the angle of attack to six degrees.
Unfortunately, the small number of pressure
taps on the flap provides no clear picture of the
flow around the flaps, including the boundary-
layer separation during the interaction of the boundary layer with the shock wave.
The pressure distribution at a zero angle
of attack computed by the FLUENT software
system based on solving the Euler and Navier –
Stokes equations with the k– ε RNG turbulence
model is shown in Fig. 17. In particular, the
Euler calculations allowed us to evaluate the
flow quantities in front of the flap and the
pressure levels on the flap. For the Mach
number in front of the flap and for the pressure
drop across the shock, the values M1 = 2.8 andwere obtained. A comparison of
the latter pressure level with the simplest estimate of the critical pressure drop
5.3~/ 12 p p
4.25.01 1 =+= M pkr for the turbulent boundary layer points to possible separation of the
boundary layer caused by shock-wave boundary layer interaction. Subsequent Navier –
Stokes calculations confirmed the presence of a separation zone in the flap region. Note also
that the pressure distributions outside the separation region in viscous and inviscid
calculations almost coincide.
0.00 0.05 0.10 0.15 0.20
0
50
100
150
- Euler
- k-ε NRG
experiment
- run 2662
- run 2663
p/p∞
~ 4.8
p/p∞
~ 16.6
shock
wave
p/p∞
X, m Fig. 17 Calculated and experimental
distributions of pressure at zero angle of
attack.
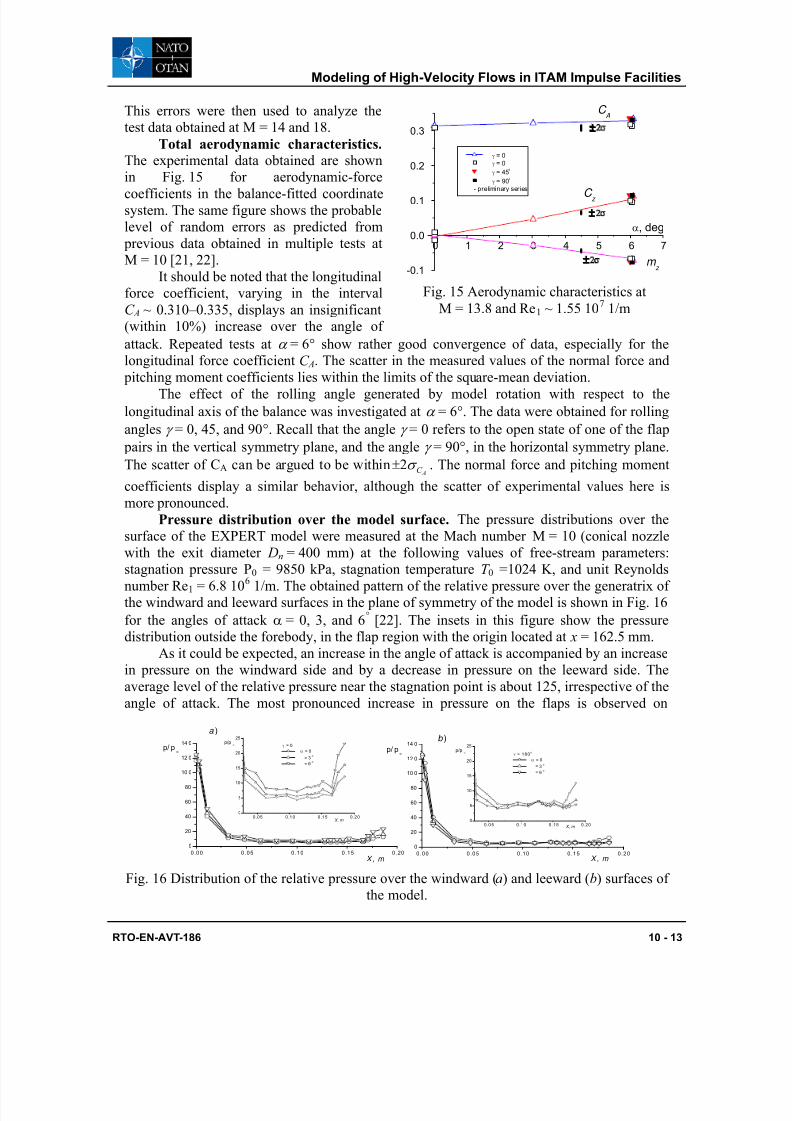
Heat-flux distribution over the surface. The rapidly changing test conditions in
impulse wind tunnels substantially complicate the problem of visualization of the thermal
field on the surface and identification of thermal loads. Therefore, panoramic methods of temperature field visualization are preferable in hypersonic facilities, including shock tubes
[23, 24].
To obtain the maximum possible reliable information, the thermal loads are measured
by calorimetric heat-flux probes and two panoramic methods based on the use of temperature-
sensitive coatings and infrared imaging. By comparing the data obtained by different
methods, it is possible to determine the range of their applicability (in terms of the run time
and the angle of observation of the examined surface) and, thus, obtain reliable distributions
of the thermal loads with a high spatial resolution.
As an example, we show the heat-flux distributions measured in the AT-303 wind
tunnel with a contoured nozzle (exit diameter 400 mm) at the Mach number М∞ = 13.89 and
Reynolds number Re L ≈ 5.42⋅106.A comparison of the results of panoramic measurements obtained by infrared thermography
(IRT) with the data obtained by the calorimetric method shows that the accuracy of the
panoramic method depends substantially on the time of the experimental process and on the
angle of observation of the examined surface. An increase in the model surface temperature in
the course of the experiment above the nominal level leads to significant measurement errors.
Significant distortions are obtained when the angle of observation differs substantially from
the normal direction to the examined surface. Figure 18 shows the distributions of heat fluxes
to the model surface, which were measured by the IRT method at different times. These
results are compared with discrete measurements by calorimetric gauges. The data measured
by these two methods on the main part of the model body in the time interval of 30–40ms are
Modeling of High-Velocity Flows in ITAM Impulse Facilities
10 - 14 RTO-EN-AVT-186
7/29/2019 EMODELING OF HIGH-VELOCITY FLOWS IN ITAM IMPULSE FACILITIESN-AVT-186-10
http://slidepdf.com/reader/full/emodeling-of-high-velocity-flows-in-itam-impulse-facilitiesn-avt-186-10 15/20
in good agreement. The
error of IRT measurements
on the nose part is caused
by the excess of
temperatures over thenominal range of the IR
imager and by significant
variations of the
observation angles. The
scatter of data on the flap is
apparently caused by flow
unsteadiness in the
reattachment region. Based
on results of panoramic
measurements with a high
spatial resolution (in contrast to the discrete method), the sizes of the separation regionsformed ahead of the control flaps and near the junction of the increased-size nose part with
the body were determined. In contrast to the distribution of parameters in one section of the
model (discrete method), panoramic measurements provide much more information about the
formation of the thermal load on the model. It is seen that the separation zone formed by
interaction of the shock wave generated by the flap with the boundary layer on the model
body extends beyond the side edges of the flap. The separation region size which reaches the
maximum value in the plane of symmetry of the flap decreases with distance from this plane.
The maximum size of the separation region (21÷23) mm agrees well with calorimetric
measurements. The maximum levels of temperature are observed near the leading edge of the
flap and its side edges.
Run 2405
0
0,1
0,2
0,3
0,4
0,5
0,6
0 0,2 0,4 0,6 0,8 1
x/L
q ,
M w t / m 2
30 ms
40 ms
терм
Fig. 18 Нeat flux distributions over the surface at М∞ = 14.
Comparisons of infrared and calorimetric methods.
Unfortunately, because of significant variations of the angle of observation of the nose
part of the model, the IRT results do not allow localization of the maximum heat flux region,
which was identified in calorimetric measurements.
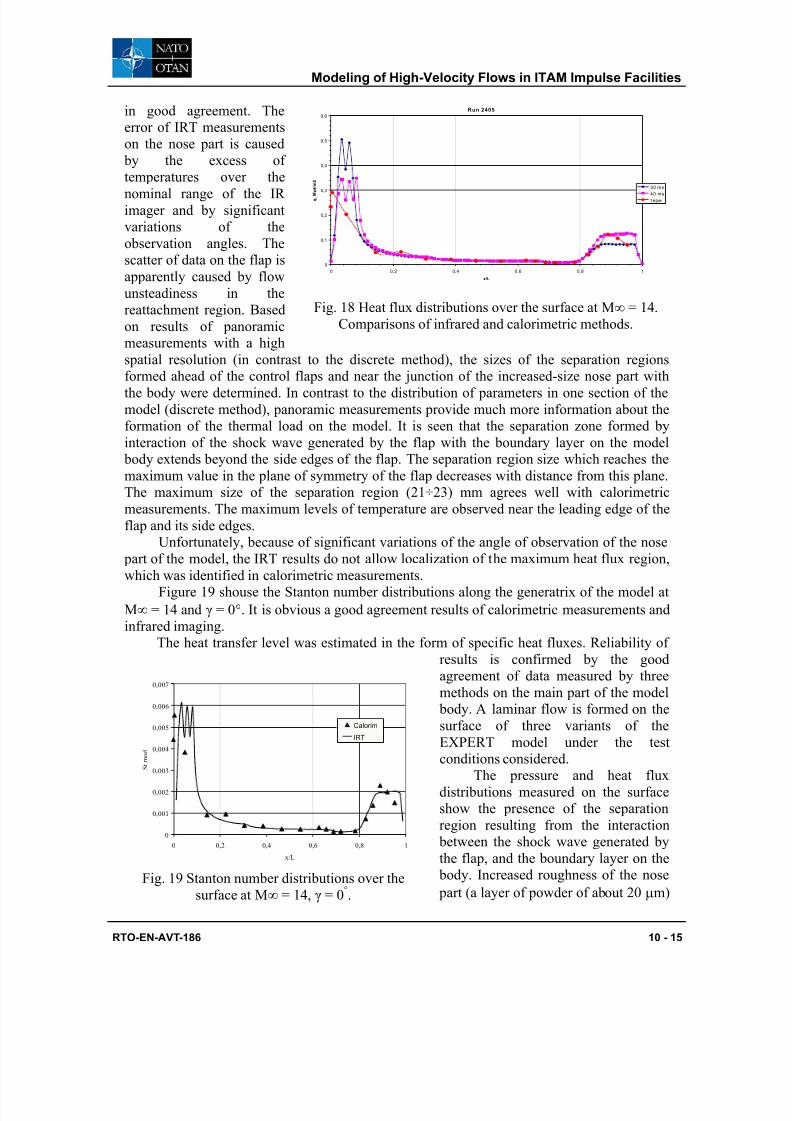
Figure 19 shouse the Stanton number distributions along the generatrix of the model at
М∞ = 14 and γ = 0°. It is obvious a good agreement results of calorimetric measurements and
infrared imaging.
The heat transfer level was estimated in the form of specific heat fluxes. Reliability of
results is confirmed by the good
agreement of data measured by three
methods on the main part of the model
body. A laminar flow is formed on thesurface of three variants of the
EXPERT model under the test
conditions considered.
0
0,001
0,002
0,003
0,004
0,005
0,006
0,007
0 0,2 0,4 0,6 0,8 1
x/L
S t m o d
Calorim
IRT
Fig. 19 Stanton number distributions over the
surface at М∞ = 14, γ = 0°.
The pressure and heat flux
distributions measured on the surface
show the presence of the separation
region resulting from the interaction
between the shock wave generated by
the flap, and the boundary layer on the
body. Increased roughness of the nose
part (a layer of powder of about 20 μm)
Modeling of High-Velocity Flows in ITAM Impulse Facilities
RTO-EN-AVT-186 10 - 15

7/29/2019 EMODELING OF HIGH-VELOCITY FLOWS IN ITAM IMPULSE FACILITIESN-AVT-186-10
http://slidepdf.com/reader/full/emodeling-of-high-velocity-flows-in-itam-impulse-facilitiesn-avt-186-10 16/20
led to a considerable increase in the heat-flux level on the body, reduction of the separation
region size ahead of the flap, and thermal load redistribution over the flap surface with a
decrease in the maximum heat flux level on it. It can be assumed that the surface roughness
changed the flow character in the boundary layer, namely, caused the laminar flow transition
to the turbulent one.This work was sponsored by ISTC within the framework of the projects # 2109, 3151,
and 3550.
3. Special shock tube for studying magnetohydrodynamic (MHD) methods
of flow control
It is well known that the velocity
of hypersonic flying vehicles moving
at altitudes of 30–50 km reaches
2000 m/s, which allows using theLorentz force for flow control with
actually reachable values of magnetic
induction of (2-3)T. A special rig on
the basis of a shock tube was
developed at ITAM SB RAS for
experimental investigations of local
MHD processes in the air flow around
a wedge and in the case with
generation of nonequilibrium
conductivity by a pulse electric
discharge [25–27]. The test rig(Fig. 20) allows to simulate a
hypersonic flow typical of the flight
altitude of 30 to 50 km with Mach
numbers 6, 8, and 10. This is an
impulse-type wind tunnel with
quasistationary parameters during 1÷5ms at M = 6, 8, and 10, P 0 = 5÷20 bar, T 0 =
1500÷3500K, and B = (0.0÷20)T.
Fig. 20 Sketch of the test rig: 1 – high-pressure
chamber, 2 – shock tube, 3 – membrane, 4 – conical
nozzle, 5 – test section, 6 – device for external
ionization, 7 – model, 8 – receiver, 9 –gauge, 10 – amplifier-generator, 11 – ionizer power supply, 12 –
Rogowski coil, 13 – control unit, 14 – CCD camera,
15 – computer, 16 – monitor, 17 – gauge, 18 –
magnet-system.
Ionization of the flow
was performed in the time
interval of 50÷100 μs, and
MHD interaction was studied.Electrodes for initiating local
MHD interaction ahead of the
model and the model itself
(wedge with an angle of 30°
between the faces) were
located at a distance of 50 mm
from the nozzle exit. A specific
feature of operation of the
impulse gas-dynamic facility
based on a shock tube is theFig. 21 Photograph of the test rig.
Modeling of High-Velocity Flows in ITAM Impulse Facilities
10 - 16 RTO-EN-AVT-186

7/29/2019 EMODELING OF HIGH-VELOCITY FLOWS IN ITAM IMPULSE FACILITIESN-AVT-186-10
http://slidepdf.com/reader/full/emodeling-of-high-velocity-flows-in-itam-impulse-facilitiesn-avt-186-10 17/20
possibility of conducting experiments
with almost all cases poured into the
low pressure channel of the shock
tube. Adiabatic compression of these
gases due to deceleration of the shock wave in the settling chamber allows
modeling various hypersonic flows.
A photograph of the test rig is shown
in Fig. 21.
Interaction of the flow with the
magnetic field occurs under
conditions of nonequilibrium
conductivity of the flow, which was
generated by an electron beam or by
an additional electric discharge on
MHD electrodes. The arrangement of experiments is illustrated in Fig. 22.
Tests with an electron beam as
a device for ionization were carried
out at the Mach number of 8. The
static pressure in the flow was about 1.8 Torr, which corresponded to an altitude of about 42
km. The flow velocity was about 2 km per second.
Fig. 22 Schematic of experiments: an E-beam is used
as an ionizer. Wedge angle – 30 degrees, L=80 mm,
L1=5 mm, d = 50 mm, electrodes b×l = 15×20 mm2.
The shock-wave parameters included the pressure and discharge current in the high-
pressure chamber, the initial pressure and the shock-wave velocity in the low-pressure
chamber, based on the signals of two piezoelectric detectors of pressure.
The parameters in the settling chamber Р 0 and Т 0 were determined by calculations based
on the shock-wave velocity in the high-pressure chamber and the pressure behind the reflected
shock wave, which was measured by the piezoelectric detector. The operation parameters of
pre-ionizers were determined from the measurements of the pulse discharge current I and
voltage U . The current was measured by high-frequency current transformers, and the voltage
was measured by a voltage divider with inductive output of the signal.
The parameters of MHD interaction were determined from the measurements of the
total current in the interaction region and the voltage on the MHD electrodes. In experiments
arranged as is shown in Fig. 22, the interaction intensity was determined on the basis of the
Stewart number with the use of the measured current in the circuit of the MHD electrodes,
2
IBS
kb V ρ
= where I is the current, B is the magnetic induction, ρ is the gas density, V is the
flow velocity, b is the electrode size in the direction perpendicular to the flow, and the
coefficient k takes into account the difference between the effective cross-sectional area of the
discharge region and the area of the electrodes, which is equal to the product b·l . The value of
this coefficient is greater than unity. It can be estimated from the size of the luminescent
discharge region in the discharge photographs.
The use of an optical schlieren system with the adaptive visualization transparent
(AVT) [28] as an optical knife made it possible to stabilize the optical system operation and
reduce vibrational noise. Two cameras provided two frames taken at different times, which
allowed us to obtain information about the changes in the flow induced by MHD interaction.
Modeling of High-Velocity Flows in ITAM Impulse Facilities
RTO-EN-AVT-186 10 - 17

7/29/2019 EMODELING OF HIGH-VELOCITY FLOWS IN ITAM IMPULSE FACILITIESN-AVT-186-10
http://slidepdf.com/reader/full/emodeling-of-high-velocity-flows-in-itam-impulse-facilitiesn-avt-186-10 18/20
a b
Fig. 23 Photographs of the flow ionized by a pulse discharge, without the magnetic field (а),
В = 0.0, and with the magnetic field (b), В = 0.34Т. 1 – electrodes, 2 – model (wedge).
Figure 23 shows the schlieren patterns of the flow around a wedge without and with the
magnetic field. The static pressure in the flow is ps = 11.6 torr, the gas density is ρ s =
0.019 kg/m3, the temperature is T s = 287 K, the flow velocity is V = 1983 m/s, and the Mach
number is M = 5.8. The flow parameters are close to the corresponding parameters of the
atmosphere at an altitude of 29 km. The time interval between the frames (а) and (b) is
160 μs. Figure 23b shows reconstruction of the shock wave on the wedge after passing
through the disturbed flow region.
For the flight time of the flow above the wedge equal to 25 μs, the passage of the MHD-
disturbed flow region was registered, and the time of reconstruction of the shock wave on the
wedge was estimated (Fig. 23b). The exposure time was 1.2 μs. The frame rate was 330 kHz.A comparison of these photographs allows us to conclude that the slope of the shock wave
corresponding to the free-stream Mach number is reconstructed after the MHD-disturbed
region passes over the wedge and to determine the relaxation time (~ 3 μs).
Figure 24 shows the shock-wave angle as a function of the MHD interaction parameter
S , with the coefficient k = 1.3. The angle of the oblique shock was also obtained as a function
of the Stewart number for М = 8, static pressure рst =158÷170 Pa (1.2÷1.3 mmHg), density
ρ = 0.0028kg/m3, and velocity V ≈ 2200 m/s.
The parameters of MHD interaction were:
current I = 10÷100А, voltage on the electrodes
U el=190÷700W, magnetic induction
В = 0÷0.4T, flat electrodes, b = 15 mm, and
k = 1.4.
The results of experimental
investigations at M = 8 were compared with
calculations performed for conditions close to
experiments with the use of three-dimensional
equations of magnetic gas dynamics under the
assumption of small values of the magnetic
Reynolds number. Good agreement was
reached [29]. Fig. 24 Shock-wave angle versus the MHD
interaction parameter
Modeling of High-Velocity Flows in ITAM Impulse Facilities
10 - 18 RTO-EN-AVT-186
7/29/2019 EMODELING OF HIGH-VELOCITY FLOWS IN ITAM IMPULSE FACILITIESN-AVT-186-10
http://slidepdf.com/reader/full/emodeling-of-high-velocity-flows-in-itam-impulse-facilitiesn-avt-186-10 19/20
References
1. Korolev A.S., Boshenyatov B.V., Druker I.G., Zatoloka V.V. Impulse Wind Tunnels in
Aerodynamic Research [in Russian], Nauka, Novosibirsk, 1978.
2. Kharitonov A.M. Techniques and Methods of Aerophysical Experiments Part 1. Wind
Tunnels and Gas-Dynamic Facilities [in Russian], NGTU, Novosibirsk, 2005.3. Zatoloka V.V. Impulse Wind Tunnels [in Russian], Nauka, Novosibirsk, 1986.
4. Dmitriev V.K., Puzyrev L.N., Trushnikov Yu.F., Yaroslavtsev M.I. Hotshot wind tunnel,
Authors’ Certificate No. 1156462 dated 15.01 1985.
5 Traineau J.C., Pelissier C., Kharitonov A.M., Fomin V.M., Lapygin V.I., Gorelov V.A.
Review of European Facilities for Space Aerodynamics, Technical Report RT 1/06302
DMAE- May 2003.
6. Goonko Yu.P., Kharitonov A.M., Kudryavtsev A.N., Mazhul I.I, Rakhimov R.D. Euler
simulations of the flow over a hypersonic convergent inlet integrated with a forebody
compression surface, CD-Rom Proc. of European Congress on Computational Methods in
Applied Science and Engineering. Barcelona, 11–14 September, 2000.
7. Chalot F., Rostand P., Perrier P., Goonko Y., Kharitonov A., Latypov A., Mazhul I.,Yaroslavtsev M. Validation of global aeropropulsive characteristics of integrated
configurations, AIAA Paper No. 98-1624, 1998, 8 pp. (AIAA 8th International Space
Planes and Hypersonic Systems, and Technologies Conf., Norfolk, USA, 27-30 April
1998).
8. Adamov N.P., Goonko Y., Kharitonov A., Latypov A., Mazhul I., Yaroslavtsev M. Chalot
F., Rostand P., Perrier P. Study on drag-thrust forces of a scramjet model in blowоdown
and hot-shot wind tunnels, Proc. Int. Conf. on the Methods of Aerophysical Research,
Novosibirsk, Russia, 1998, Part 3, pp.3-9.
9. Goonko Y.P., Kharitonov A.M., Mazhul I.I., Zvegintsev V.I., Nalivaichenko D.G.,
Investigation of a scramjet model at hypersonic velocities and high Reynolds numbers,AIAA/AAAF paper 2002-5273.
10. Tret’yakov P.K. Pseudoshock combustion regime, Comb., Expl. Shock Waves, 1993,
Vol. 29, No. 6, pp. 694-698.
11. Richards B.E., Enkenhus K. R. Hypersonic testing in the VKI Long-Shot free-piston
tunnel, AIAA J., Vol. 8, No. 6, 1969.
12. Pinakov V.I., Rychkov V.N., Topchiyan M.E. Possibility of simulating hypersonic flows
on high-pressure adiabatic gasdynamic compression setups, J. Appl. Mech. Tech. Phys.,
1982, Vol. 23, No. 1, pp. 56-62.
13. Meshcheryakov A.A., Pinakov V.I., Topchiyan M.E. Stress distribution in the wedge-type
piston and the shaft of a system for the adiabatic compression of a gas, J. Appl. Mech.
Tech. Phys., 1980, Vol. 21, No. 2, pp. 284-288.14. Topchiyan M.E., Kharitonov A.M. Wind tunnels for hypersonic research (progress,
problems, prospects), J. Appl. Mech. Tech. Phys., 1994, Vol. 35, No. 3, pp. 383-395.
15. Kharitonov A.M., Zvegintsev V.I., Fomin V.M., Topchiyan M.E., Meshceryakov A.A.,
Pinakov V.I. New-Generation Hypersonic Adiabatic Compression Facilities with Pressure
Multipliers, Chapter 22, Advanced Hypersonic Test Facilities, 2002, pp.583-617.
16. Eitelberg G., Kastell D. Hyperboloid flare experiments in the HEG facility, Report No.
HT-TR-E-1-201-DLRG, part ΙΙ, 1995.
17. Kharitonov A.M., Zvegintsev V.I., Brodetsky M.D., Mazhul I.I, Muylaert J.M., Kordulla
W., Paulat J.C., Aerodynamic investigation of aerospace vehicles in the new hypersonic
wind tunnel AT-303 in ITAM, Proc. 4th Int. Symp. on Atmospheric Re-Entry Vehicles
and Systems, March 21-23, 2005, Arcachon, France.
Modeling of High-Velocity Flows in ITAM Impulse Facilities
RTO-EN-AVT-186 10 - 19
7/29/2019 EMODELING OF HIGH-VELOCITY FLOWS IN ITAM IMPULSE FACILITIESN-AVT-186-10
http://slidepdf.com/reader/full/emodeling-of-high-velocity-flows-in-itam-impulse-facilitiesn-avt-186-10 20/20
18. Adamov N.P., Kharitonov A.M., Mazhul I.I., Zvegintsev V.I., Paulat J.-C. Total
aerogasdynamic characteristics of the ARES aerospace demonstrator, Proc. 3rd European
Conf. for Aerospace Sciences 6–9 July 2009.
19. Walpot L., Ottens H. FESART/EXPERT aerodynamic and aerothermodynamic analysis
of the RAV and KHEOPS configurations, Technical report, TOS-MPA/2718/LW,ESTEC, 2002.
20. Ottens H., Walpot L. EXPERT model 4.2, Model description and trajectory analysis.
Technical report, TOS-MPA/2749/HO, ESTEC, 2003.
21. Kharitonov A.M., Adamov N.P., Brodetsky M.D., Vasenyov L.G., Mazhul I.I.,
Zvegintsev V.I., Paulat J.C., Muylaert J.M., Kordulla W. Investigation of
aerogasdynamics of re-entry vehicles in the new hypersonic wind tunnel at ITAM, Proc.
44th AIAA Aerospace Sciences Meeting and Exhibit, Jan. 9–12, 2006, Reno, Nevada,
USA (AIAA Paper No. 2006-0499).
22. Adamov N.P., Brodetsky M.D., Vasenyov L.G., Mazhul I.I., Zvegintsev V.I.,
Kharitonov A.M., Paulat J.C., Muylaert J.M., Kordulla, W. Aerodynamics of re-entry
vehicles at natural Reynolds numbers. Thermophysics and Aeromechanics , 2006, Vol. 13, No.3, pp.341-351.
23. Mosharov V.Е., Radchenko V.N. Measurement of heat fluxes fields in hot-shot wind
tunnels with the aid of luminescent temperature transducers, Uch. Zap. TsAGI,
Vol. ХХХVIII, No. 1-2, 2007, pp. 94−101.
24. Zharkova G.M., Kovrizhina V.N., Petrov A.P., Smorodsky B.V., Knauss H., Roediger Т.,
Wagner S., Kraemer E. Comparative heat transfer studies at hypersonic conditions by
means of three measurement techniques. Part I: Measurement techniques, experimental
setup and preceding investigations, Proc. Int. Conf. on the Methods of Aerophysical
Research (ICMAR) Pt. I. Novosibirsk, 2007, pp. 221−228.
25. Kovrizhina V.N., Kharitonov A.M., Petrov A.P., Shpak S.I., Zharkova G.M., Zvegintsev
V.I. The study of hypersonic heat transfer by liquid crystals thermography, Proc. 6th
European Symp. on Aerothermodynamics for Space Vehicles, EUCASS, 3-6 November,
2008, Versailles, France.
26. Fomin V.M., Fomichev V.P., Korotaeva T.A., Maslov A.A., Pavlov A.A., Pavlov Al.A.,
Pravdin S.S., Shashkin A.P., Yakovlev V.I., Malmuth N.D., Smereczniak P., Silkey J.S.
Initiation of nonequilibrium conductivity of a hypersonic flow and MHD-interaction,
AIAA 2007-1376, 45th AIAA Aerospace Sciences Meeting and Exhibit, Reno, Nevada,
2007.
27. Korotaeva T.A., Pavlov A.A., Pravdin S.S., Fomichev V.P., Shashkin A.P. MHD-effect
on location of a bow shock generated by a wedge in a supersonic flow, Proc. Int. Conf. on
the Methods of Aerophysical Research (ICMAR), Novosibirsk, 2008, 10 p. CD-ROM.28. Pavlov A.A., Pavlov Al.A., Golubev M .P. and others, Schlieren device with an adaptive
visualization transparent AVT for investigation of flow disturbances creation by optical
pulse discharge in gases, Proc. IX Int. Conf. ОМIP-2007, М., МEI, pp.174-177.
29. Fomichev V.P., Korotaeva T.A., Shashkin A.P., Yadrenkin M.A.. Investigation of the
MHD-interaction in a supersonic flow, Proc. 17th Int. Conf. on MHD Energy Conversion,
Shonan Village Center, Kanagawa, Japan, 14–17 September 2009, 13 p.
Modeling of High-Velocity Flows in ITAM Impulse Facilities
10 - 20 RTO-EN-AVT-186