emission trends and mitigation options for air pollutants in east · pdf file ·...
TRANSCRIPT

Atmos. Chem. Phys., 14, 6571–6603, 2014www.atmos-chem-phys.net/14/6571/2014/doi:10.5194/acp-14-6571-2014© Author(s) 2014. CC Attribution 3.0 License.
Emission trends and mitigation options for air pollutants in EastAsiaS. X. Wang1,2, B. Zhao1, S. Y. Cai1, Z. Klimont 3, C. P. Nielsen4, T. Morikawa 5, J. H. Woo6, Y. Kim 6, X. Fu1, J. Y. Xu1,J. M. Hao1,2, and K. B. He1,2
1State Key Joint Laboratory of Environment Simulation and Pollution Control, School of Environment,Tsinghua University, Beijing 100084, China2State Environmental Protection Key Laboratory of Sources and Control of Air Pollution Complex,Beijing 100084, China3International Institute for Applied System Analysis, Laxenburg, Austria4Harvard China Project, School of Engineering and Applied Sciences, Harvard University, 29 Oxford St,Cambridge, MA 02138, USA5Japan Automobile Research Institute, Tsukuba, Japan6Department of Advanced Technology Fusion, Konkuk University, Seoul, South Korea
Correspondence to:S. X. Wang ([email protected])
Received: 18 December 2013 – Published in Atmos. Chem. Phys. Discuss.: 27 January 2014Revised: 17 May 2014 – Accepted: 19 May 2014 – Published: 1 July 2014
Abstract. Emissions of air pollutants in East Asia play animportant role in the regional and global atmospheric en-vironment. In this study we evaluated the recent emissiontrends of sulfur dioxide (SO2), nitrogen oxides (NOx), par-ticulate matter (PM), and non-methane volatile organic com-pounds (NMVOC) in East Asia, and projected their futureemissions up until 2030 with six emission scenarios. The re-sults will provide future emission projections for the mod-eling community of the model inter-comparison program forAsia (MICS-Asia). During 2005–2010, the emissions of SO2and PM2.5 in East Asia decreased by 15 and 12 %, respec-tively, mainly attributable to the large-scale deployment offlue gas desulfurization (FGD) at China’s power plants, andthe promotion of highly efficient PM removal technologiesin China’s power plants and cement industry. During this pe-riod, the emissions of NOx and NMVOC increased by 25 and15 %, driven by rapid increase in the emissions from Chinadue to inadequate control strategies. In contrast, the NOx andNMVOC emissions in East Asia except China decreased by13–17 %, mainly due to the implementation of stringent vehi-cle emission standards in Japan and South Korea. Under cur-rent regulations and current levels of implementation, NOx,SO2, and NMVOC emissions in East Asia are projected to in-crease by about one-quarter over 2010 levels by 2030, while
PM2.5 emissions are expected to decrease by 7 %. Assum-ing enforcement of new energy-saving policies, emissions ofNOx, SO2, PM2.5 and NMVOC in East Asia are expectedto decrease by 28, 36, 28, and 15 %, respectively, comparedwith the baseline case. The implementation of “progressive”end-of-pipe control measures would lead to another one-third reduction of the baseline emissions of NOx, and aboutone-quarter reduction of SO2, PM2.5, and NMVOC. Assum-ing the full application of technically feasible energy-savingpolicies and end-of-pipe control technologies, the emissionsof NOx, SO2, and PM2.5 in East Asia would account for onlyabout one-quarter, and NMVOC for one-third, of the levelsof the baseline projection. Compared with previous projec-tions, this study projects larger reductions in NOx and SO2emissions by considering aggressive governmental plans andstandards scheduled to be implemented in the next decade,and quantifies the significant effects of detailed progressivecontrol measures on NMVOC emissions up until 2030.
Published by Copernicus Publications on behalf of the European Geosciences Union.

6572 S. X. Wang et al.: Emission trends and mitigation options for air pollutants in East Asia
1 Introduction
Air pollutant emissions in East Asia contribute a large shareof the global emissions. Cofala et al. (2012) reported thatEast Asia contributes about 36, 29, and 36 % to global emis-sions of sulfur dioxide (SO2), nitrogen oxides (NOx), andparticulate matter less than or equal to 2.5 µm (PM2.5), re-spectively, much more than those of the United States andEurope. Moreover, both emission calculations and satelliteobservations indicate that NOx emissions in China have ex-perienced rapid increase during 1995–2010, with annual av-erage growth rates ranging between 5.5 and 7 % (Zhao et al.,2013c; Zhang et al., 2007, 2012a). As a result, emissionsin East Asia have greatly degraded regional air quality andvisibility (Wang and Hao, 2012; X. Y. Zhang et al., 2012)and damaged human health (WB and SEPA, 2007). Theyalso affect air quality and climate forcing beyond the regionthrough the outflow that travels across the Pacific (Liu et al.,2003). In light of this situation, the control of emissions inEast Asia is very important for the improvement of regionaland global atmospheric environment.
With the objectives of air quality improvement and mit-igation of climate change, the countries of East Asia, e.g.,China, Japan, and South Korea, have taken substantial mea-sures to improve energy efficiency and reduce emissions ofair pollutants. These measures have often been stringent andhave been rapidly enhanced. During 2006–2010, China set atarget to reduce energy use per unit of gross domestic product(GDP) and national SO2 emissions by 20 and 10 %, respec-tively (The State Council of the People’s Republic of China,2006). During 2011–2015, China plans additional 16, 10, and8 % reductions for energy use per unit GDP, NOx emissions,and SO2 emissions, respectively (The State Council of thePeople’s Republic of China, 2011). Japan has taken measuresto meet its commitments under the Kyoto Protocol, whichrequire that annual CO2 emissions during 2008–2012 shouldbe 6 % lower than those of 1990 (IEA, 2008). The vehicleemission standards in China, Japan, and South Korea havealso been updated repeatedly in the past decade. A num-ber of studies have investigated the recent emission trendsin East Asia (or specific countries therein) and the effectsof typical control policies (e.g., reductions in China’s SO2emissions since 2005 both by observations from satellites (Liet al., 2010), and by bottom-up emission estimations (Lu etal., 2010, 2011; Klimont et al., 2013)). Some studies alsoestimated the trends of the emissions of NOx (Zhang et al.,2012a; Lin et al., 2010b; Zhao et al., 2013c) and particulatematter (PM) (Lin et al., 2010a; Lu et al., 2011). Kurokawaet al. (2013); Zhao et al. (2013a, d) and estimated the re-cent emission trends of multiple air pollutants. Future emis-sions were also predicted by previous studies (Streets andWaldhoff, 2000; Klimont et al., 2001, 2009; Cofala et al.,2007, 2012; Ohara et al., 2007; Xing et al., 2011; Zhao etal., 2013c). However, most of these projections were basedon emissions for 2005 or earlier and did not consider more
recent, sometimes dramatic, changes. The latest projectionsinclude Cofala et al. (2012) and Zhao et al. (2013c). Cofalaet al. (2012) projected global emissions of SO2, NOx, andPM2.5 for four energy scenarios developed by IEA (2012a),but did not envisage further end-of-pipe mitigation measuresin the future. Zhao et al. (2013c) developed six NOx emissionscenarios for until 2030 based on a 2010 emission inventory,and quantified the effects of various control policies, but didnot analyze other air pollutants.
Although there have been a number of studies of recentand future emission trends in East Asia, they are inadequatefor the development of broadly effective air quality and cli-mate mitigation policies. First, future control measures mustbe developed while taking full account of the latest policies;a comprehensive and up-to-date review for the entire regionis currently lacking in the literature. As described above, thebase year of most projections was 2005 or earlier, and there-fore they underestimated China’s economic growth over thelast decade, especially from 2006 to 2010. These early pro-jections also did not anticipate new emission control policiesannounced in 2011 under China’s 12th Five-Year Plan (forthe period of 2011–2015; The State Council of the People’sRepublic of China, 2011), nor a number of emission stan-dards released after 2010, both of which may fundamentallyalter the future emission pathways. The most recent projec-tions (Cofala et al., 2012; Zhao et al., 2013c) considered onlyspecific pollutants or specific sets of control measures, pro-viding only partial insight into the future trends of all majorair pollutants. Second, the attainment of stringent ambientair quality standards (e.g., China’s standard of 35 µg m−3 forthe annual average PM2.5 concentration, released in 2012)requires simultaneous reductions of multiple pollutants in-cluding SO2, NOx, PM2.5, and non-methane volatile organiccompounds (NMVOC) (Wang and Hao, 2012). Therefore, itis essential to consider a full range of relevant pollutants andscenarios at different stringency levels from the business-as-usual case to the maximum feasible reduction case so thatcost-effective emission controls can balance measures overall pollutants and control levels. Third, most studies focusedon either end-of-pipe or energy-saving measures; their rolesin integrated policies that simultaneously tackle multiple pol-lutants and climate forcers have been insufficiently studied.Considering the above, a comprehensive projection of emis-sions of multiple pollutants that incorporates the latest avail-able base-year data, control measures scheduled for imple-mentation, and other potential energy-saving and end-of-pipemeasures at different stringency levels will contribute to bothair pollution research and future decision making.
This study aims to evaluate the emission trends and mit-igation options for multiple air pollutants in East Asia. Theresults will provide future emission projections for the mod-eling community of the model inter-comparison program forAsia (MICS-Asia), which aims to have a common under-standing of the model performance and uncertainties in Asia.
Atmos. Chem. Phys., 14, 6571–6603, 2014 www.atmos-chem-phys.net/14/6571/2014/
S. X. Wang et al.: Emission trends and mitigation options for air pollutants in East Asia 6573
In Sect. 2, we review major control policies in East Asiaover the last decade and evaluate their impact on air pol-lutant emissions during 2005–2010. Compared with previ-ous studies of emission trends, we are particularly devotedto presenting a comprehensive review of the recent mitiga-tion measures in this region, and illuminating the drivingforces underlying the emission trends. In Sect. 3, we projectfuture emissions of SO2, NOx, NMVOC, and PM up un-til 2030 for six emission scenarios (see Table 1), consider-ing both energy-saving and end-of-pipe measures. In Sect. 4,we compare our results with other emission estimates aswell as observations. In this study, the domain of East Asiaconsists of seven countries/regions, i.e., Chinese mainland,Japan, South Korea, North Korea, Mongolia, Hong Kong andMacao, and Taiwan. In the following text, China is short formainland China. We focus on Japan, South Korea, and es-pecially China, the key energy consumers in the region thatdominate the emissions of air pollutants. Japan and Koreahave relatively long histories of air pollution policies, whileChina has been enhancing its emission regulations in thelast decade at an accelerating rate, has very ambitious futuregoals, and contributes the largest share of regional emissions.Therefore, developments in China are given special attention.
2 Recent control measures and emission trends
Recent control measures not only serve as the major drivingforces of recent emission trends, but also lay the foundationfor the development of future control policies. Control mea-sures contributing to reductions of air pollutant emissionsinclude energy-saving measures, e.g., energy efficiency im-provements, cogeneration of heat and power, fuel substitu-tion, and end-of-pipe control measures such as installationsof dust collectors and flue gas desulfurization systems. Acareful mix of measures to simultaneously address energyconservation, air pollution control and climate change miti-gation is considerably cheaper than tackling each issue sepa-rately (Wang and Hao, 2012). In this section we review bothrecent energy-saving and end-of-pipe measures in East Asia,and then quantify their effects on recent emission changes.
2.1 Energy-saving measures
Japan, South Korea, and China have released a number ofpolicies addressing energy conservation and climate changemitigation. Under the Kyoto Protocol, Japan committed tothe reduction of its greenhouse gas (GHG) emissions by6 % during 2008–2012 from the base year of 1990. In theNew National Energy Strategy formulated in May 2006, theJapanese government set a long-term target to improve en-ergy intensity of GDP by an additional 30 % by 2030 (IEA,2008). The government of South Korea has made a com-mitment to reduce its GHG emissions 30 % by 2020 com-pared to its business-as-usual projection (IEA, 2012b). The
Chinese government has set a target to reduce CO2 emis-sions per unit GDP by 40–45 % by 2020 compared with 2005levels (Wang and Hao, 2012). Total energy consumption inEast Asia increased by 31 % during 2005–2010. China expe-rienced the fastest increase, 43 %, driven by its rapid GDPgrowth rate, while Japan’s energy consumption decreasedduring these five years due to a lower GDP growth rate andstringent energy-saving policies. The growth rate of SouthKorean energy consumption was intermediate those of Chinaand Japan, at 19 %.
2.1.1 Power plants
The energy consumption of China’s power sector increasedsharply, by 35 % during 2005–2010, due to the rapid increasein the demand for electricity (NBS, 2007, 2011a), while theenergy consumption of Japan and South Korea remained rel-atively stable (http://www.iea.org/statistics/).
Up to 75 % of China’s power generation is coal fired(Zhao et al., 2013c). In contrast, the installed capacity inJapan is highly diversified, with coal, oil, natural gas, nu-clear, and hydro contributing about 27, 8, 27, 26, and 8 %of total electricity generation in 2010, respectively (http://www.iea.org/statistics/). In South Korea, fossil fuels ac-counted for 69 % of the total electricity generated, followedby nuclear at 30 %, in 2010 (http://www.iea.org/statistics/).While nuclear power has played central roles in Japan’s andSouth Korea’s low-carbon strategies, its share of Japanesepower generation dropped dramatically to less than 10 % in2011 due to the Fukushima accident in March of that year(http://www.iea.org/statistics/), making the future of nuclearpower in Japan quite uncertain. In South Korea, by contrast,nuclear power generation is expected to keep increasing inthe next decade, with five reactors under construction and sixmore announced (IEA, 2012b). Given China’s coal-intensivepower generation mix, its government has been promotingthe development of cleaner electricity through subsidy poli-cies. By 2010, its capacities of hydro, natural-gas-fired, wind,and solar power generation had increased dramatically to213, 27, 31, and 0.24 GW, respectively, or 1.82, 2.25, 23.8,and 3.43 times those of 2005 (China Electric Power Year-book Committee, 2006, 2011).
China has also undertaken major efforts to improve theefficiency of coal-fired power generation. Its governmentforced the closure of 77 GW of small and inefficient coal-fired units during 2006–2010 (NDRC, 2011), with an addi-tional 20 GW of small units scheduled for early retirementduring 2011–2015 (The State Council of the People’s Re-public of China, 2012). At the same time, the capacities ofmost new units built after 2005 have been≥ 300 MW, drivingtheir capacity share from 50 % in 2005 to 73 % in 2010 (TheState Council of the People’s Republic of China, 2012). Theshare of advanced supercritical and ultra-supercritical units,moreover, rose to over 13 % (Li et al., 2012). As a resultof these changes, the coal consumption per unit electricity
www.atmos-chem-phys.net/14/6571/2014/ Atmos. Chem. Phys., 14, 6571–6603, 2014

6574 S. X. Wang et al.: Emission trends and mitigation options for air pollutants in East Asia
Table 1.Definition of the energy and emission scenarios in this study.
Energy sce-nario name
Energy scenario definition Emissionscenarioname
Emission scenario definition
Business-as-usual(BAU)
The BAU scenario is based on current regula-tions and implementation status (until the endof 2010).
BAU[0] The BAU[0] scenario assumes the energy-savingpolicies of the BAU scenario. For an end-of-pipe control strat-egy, it assumes that all current regulations(until the end of 2010) and the current implementation status inall countries will be continued during 2011–2030.
BAU[1] The BAU[1] scenario assumes the energy-saving policies of theBAU scenario. For an end-of-pipe control strategy in China, itassumes that new pollution control policies will be released andimplemented, representing a progressive approach towards fu-ture environmental protection. For the other countries in EastAsia, the assumptions of the BAU[1] scenario are exactly thesame as the BAU[0] scenario.
BAU[2] The BAU[2] scenario assumes the energy-saving policies ofthe BAU scenario. For an end-of-pipe control strategy, it as-sumes that the maximum technically feasible control technolo-gies would be fully applied by 2030, regardless of the economiccost.
Alternativepolicy(PC)
The PC scenario assumes that new energy-saving policies will be released and morestrongly enforced, resulting in lifestyle changes,structural adjustment, and energy efficiency im-provement.
PC[0] The PC[0] scenario assumes the energy-saving policies of thePC scenario, and the same end-of-pipe control strategy as theBAU[0] scenario.
PC[1] The PC[1] scenario assumes the energy-saving policies of thePC scenario, and the same end-of-pipe control strategy as theBAU[1] scenario.
PC[2] The PC[2] scenario assumes the energy-saving policies of thePC scenario, and the same end-of-pipe control strategy as theBAU[2] scenario.
supplied by thermal power plants decreased from 370 to333 gce kWh−1 during the same period (The State Councilof the People’s Republic of China, 2012).
2.1.2 Industrial sector
During 2005–2010, the energy consumption of China’s in-dustrial sector increased dramatically, at an annual aver-age rate of 9.0 % (cf. 7.4 % for total energy consumption),due largely to the rapid increase of energy-intensive prod-ucts, e.g., cement and steel (NBS, 2007, 2011a). However,driven by a target to reduce energy intensity per unit GDPby 20 % from 2005 to 2010, China mandated widespread re-placement of outmoded production technologies with moreenergy-efficient ones. For example, the share of cement pro-duced by precalciner kilns increased from 45 % in 2005 toabout 80 % in 2010. During the same period, the propor-tion of large units (≥ 4000 t d−1) of all precalciner kilns in-creased from 33 to 60 % (Zhao et al., 2013c, d). The shareof coke produced in machinery coke ovens (vs. traditionalsmall ovens) increased from 82 % in 2005 to 87 % in 2010(NBS, 2007, 2011; Huo et al., 2012); the share of blast fur-naces larger than 1000 m3 increased from 48 to 61 % over thesame time period (The State Council of the People’s Repub-
lic of China, 2012). In effect, the average energy intensityof cement and crude steel production decreased by 29 and12 %, respectively, from 2005 to 2010 (The State Council ofthe People’s Republic of China, 2012).
While China’s industrial sector has grown swiftly but onlyrecently undertaken aggressive energy efficiency improve-ments, Japan’s industrial sector has played a central rolein national energy conservation for several decades (IEA,2008). Major policies have included compulsory submissionof energy-saving plans for large energy consumers, frequenton-site inspections, and subsidies to assist small companiesin introducing energy-efficient equipment (IEA, 2008; En-ergy Conservation Center of Japan, 2011). These measuresdecreased the average energy consumption per ton of pro-duction of cement and crude steel by 6.3 and 5.6 %, respec-tively, from 2000 to 2010 (Wang, 2010). Japan’s industrialenergy use as a proportion of total energy use has declinedfrom 26 % in 2000 to 18 % in 2010 (IEA, 2002, 2012b), andthe share of coal and petroleum products of total energy con-sumption has decreased from 64 to 56 % during 2000–2010(IEA, 2002, 2012b).
Industrial energy consumption in South Korea has in-creased steadily in recent years, in part because its energyintensity (energy consumption per unit GDP) did not notably
Atmos. Chem. Phys., 14, 6571–6603, 2014 www.atmos-chem-phys.net/14/6571/2014/

S. X. Wang et al.: Emission trends and mitigation options for air pollutants in East Asia 6575
improve from the 1990s to 2006 (IEA, 2006). In 2008, SouthKorea set new targets for national energy intensity in its“Strategy for Green Growth”: from 0.328 tonne of oil equiv-alent (toe)/US$1000 in 2007 to 0.290 toe/US$1000 in 2013,and 0.233 toe/US$1000 in 2020. Enforcement of these poli-cies is expected to occur mainly through “voluntary agree-ments” between the government and large companies (IEA,2006, 2012b; UNEP, 2010).
2.1.3 Residential sector
Residential energy consumption in China and South Koreaincreased steadily during 2005–2010, driven by increasesin total building area (NBS, 2007, 2008a, b, 2009, 2011a,b; http://www.iea.org/statistics/). During the same period,Japan’s residential energy consumption decreased slightly,attributed to the stable demand for building space and ag-gressive energy-saving policies (IEA, 2008;http://www.iea.org/statistics/).
By the end of 2006, 96 % of China’s new buildings com-plied with the energy-saving design standard released in1996 (THUBERC, 2009); this was succeeded by a morestringent standard in 2010 (The State Council of the Peo-ple’s Republic of China, 2012). The energy efficiency stan-dards in Japan’s building codes, first released in 1980 andstrengthened in 1992 and 1999, have all been voluntary. As of2005, 30 % of new houses and 85 % of new buildings largerthan 2000 m2 complied with the voluntary standards (IEA,2008). In Korea, energy efficiency codes for buildings hadlong been relatively weak until a strong, performance-baseddesign code applicable to large commercial buildings was is-sued in 2011 (IEA, 2006, 2012b).
Japan is a world leader in the energy efficiency of residen-tial and commercial appliances. The Top Runner Program,which sets energy-efficiency targets for appliances based onthe most energy-efficient products on the market, has beensuccessfully enforced. For example, the efficiency of air con-ditioners and refrigerators increased by 68 % (over 1997–2004) and 55 % (1998–2004), respectively, both exceedingthe targets of 66 and 31 % (IEA, 2008; Energy ConservationCenter of Japan, 2011). Similar programs have recently beenpromoted in South Korea and China (UNEP, 2010).
China has been promoting clean energy in the residentialsector. Direct combustion of biomass in rural areas has beengradually replaced with commercial fuel in the last decade,and its share in rural cooking decreased from 38 % in 2005to 31 % in 2010. The production of biogas for residential useand ownership of solar water heaters both doubled during2005–2010 due to subsidy policies.
2.1.4 Transportation sector
During 2005–2010, the energy consumption of China’s trans-portation sector grew at an annual average rate of 10 %, at-tributed to explosive growth of the vehicle population (NBS,
2007, 2011a). In contrast, the transportation energy con-sumption in South Korea was stable and that of Japan de-clined (http://www.iea.org/statistics/).
The reduction in Japan’s vehicle energy consumption islargely due to its fuel-efficiency standards, which are amongthe most aggressive in the world. For passenger vehicles,there was a consistent improvement in the average fuel econ-omy from 13.5 km L−1 in 2000 to 17.8 km L−1 in 2009 (En-ergy Conservation Center of Japan, 2011). Japan was alsothe first country in the world to implement fuel efficiencystandards for heavy-duty (freight) vehicles, which decreasedfrom 851 kcal t-km−1 in 2000 to 722 kcal t-km−1 in 2008 (In-stitute of Energy Economics of Japan, 2010). Since 2004China has also implemented fuel-efficiency standards forlight-duty vehicles, leading to an increase in the efficiencyof new gasoline passenger cars from 11.0 km L−1 in 2005to 13.5 km L−1 in 2010 (Zhao et al., 2013c). An updatedstandard (14.3 km L−1 by 2015) for passenger cars was is-sued in 2011. In 2006, the South Korean government in-troduced its first mandatory fuel-economy standards, requir-ing car manufacturers to meet average fuel economy stan-dards of 12.4 km L−1 for vehicles with engines of less than1500 cubic centimeters (IEA, 2006). In July 2009, a newfuel-economy standard of 17 km L−1 was announced (IEA,2012b).
China has also launched several initiatives to promoteelectric vehicles, and their numbers reached 12 000 by 2010(Yang, 2012). The most recent development plan for new-energy vehicles (issued in 2012) aimed to increase the popu-lation of electric vehicles to 0.5 million and 5 million in 2015and 2020, respectively, through a series of subsidy policies.
2.2 End-of-pipe control measures
2.2.1 Power plants
Due to their relatively large scales of energy use and emis-sions, power plants are usually subject to the most stringentcontrol measures of all sectors. The penetration of major con-trol technologies in the power sectors of China, Japan, andSouth Korea is summarized in Table 2.
In 2006, China set a target to reduce national SO2 emis-sions by 10 % by 2010 over 2005 levels (Wang and Hao,2012). By 2010, over 83 % of coal-fired power plants (in-cluding about 88 % of pulverized coal combustion plants,representing 560 GW) had installed flue gas desulfurization(FGD) (MEP, 2011). The recently released 12th Five-YearPlan aims for another 8 % reduction in total SO2 emissionsby 2015, which would require nearly all coal-fired powerplants to be equipped with high-efficiency FGD facilities(i.e., with at least 95 % removal efficiency).
Low-NOx combustion technology (mainly low-NOx burn-ers, LNB) was the major NOx control technology used inChina’s coal-fired power plants by 2010. The penetration offlue gas denitrification (selective catalytic reduction, SCR,
www.atmos-chem-phys.net/14/6571/2014/ Atmos. Chem. Phys., 14, 6571–6603, 2014

6576 S. X. Wang et al.: Emission trends and mitigation options for air pollutants in East Asia
Table 2.Propagation of major control technologies in the power sectors in China, Japan, and South Korea (% of fuel use).
Energy Control Base year BAU[0]/PC[0] BAU[1]/PC[1] BAU[2]/PC[2]technology technology
2005 2010 2020 2030 2020 2030 2030
Country China Japan South China Japan SouthChina Japan South China Japan SouthChina Japan South China Japan SouthChina Japan SouthKorea Korea Korea Korea Korea Korea Korea
Grate boilers CYC (PM) 12 – – 12 – – 0 – – 0 – – 0 – – 0 – – 0 – –WET (PM) 88 – – 88 – – 100 – – 100 – – 100 – – 100 – – 0 – –HED (PM) 0 – – 0 – – 0 – – 0 – – 0 – – 0 – – 100 – –
Pulverized coal WET (PM) 8 0 0 0 0 0 0 0 0 0 0 0 0 0 0 0 0 0 0 0 0combustion ESP (PM) 92 3 72 93 2 67 90 0 64 80 0 61 65 0 64 50 0 61 0 0 0
HED (PM) 0 97 28 7 98 33 10 100 36 20 100 39 35 100 36 50 100 39 100 100 100FGD (SO2) 12 97 95 88 98 97 93 100 98 96 100 98 100 100 98 100 100 98 100 100 100LNB (NOx) 53 10 23 75 0 13 82 0 13 84 0 13 8 0 13 0 0 13 0 0 0LNB+SNCR 0 0 5 1 0 5 1 0 5 1 0 5 6 0 5 7 0 5 0 0 0(NOx)
LNB+SCR 1 90 56 12 100 68 12 100 72 12 100 76 86 100 72 94 100 76 100 100 100
Fluidized bed WET (PM) 8 – – 0 – – 0 – – 0 – – 0 – – 0 – – 0 – –(NOx)
combustion ESP (PM) 92 – – 100 – – 90 – – 80 – – 65 – – 50 – – 0 – –HED (PM) 0 – – 0 – – 10 – – 20 – – 35 – – 50 – – 100 – –CFB–FGD 17 – – 53 – – 66 – – 80 – – 100 – – 100 – – 100 – –(SO2)
SNCR (NOx) 0 – – 0 – – 0 – – 0 – – 30 – – 80 – – 70 – –SCR (NOx) 0 – – 0 – – 0 – – 0 – – 5 – – 20 – – 30 – –
Natural gas LNB (NOx) 30 80 20 74 61 15 87 52 15 91 50 15 50 52 15 10 50 15 0 0 0power LNB+SNCR 0 0 0 1 0 0 1 0 0 1 0 0 5 0 0 9 0 0 10 0 0
(NOx)
LNB+SCR 0 20 30 5 39 46 5 48 50 5 50 54 45 48 50 81 50 54 90 100 100(NOx)
Notes: CYC, cyclone dust collector; WET, wet scrubber; ESP, electrostatic precipitator; HED, high efficiency deduster; FGD, flue gas desulfurization; CFB-FGD, flue gas desulfurization for circulated fluidized bed; LNB, low-NOx combustion technology; SCR, selective catalytic reduction;SNCR, selective non-catalytic reduction. The table gives national average penetration of major control technologies. Note, however, that penetration varies by province and is usually larger in key regions as defined by the Chinese government than in other regions.
and/or selective non-catalytic reduction, SNCR) was only1.1 % in 2005 and 12.8 % in 2010 (MEP, 2011). In the 12thFive-Year Plan, the Chinese government aims to reduce na-tional NOx emissions by 10 % from 2010 to 2015, and thekey measure to meet this target is large-scale deployment ofSCR/SNCR facilities. The NOx emission control policies aredescribed in more detail in our previous paper (Zhao et al.,2013c).
The emission control of primary particulate matter inChina’s power sector has achieved noticeable progress inthe last decade. Since 2003, all new and rebuilt units havehad to attain the in-stack concentration standard for PMof 50 mg m−3 (GB13223-2003). As a result, over 92 % ofpulverized coal units had installed electrostatic precipitators(ESPs) by 2005. In addition, fabric filters (FF) have been putinto commercial use in recent years, and their penetration in-creased to 7 % by 2010 (Zhao et al., 2013a). Furthermore,the rapid deployment of wet-FGD also helped to reduce PMemissions due to its ancillary benefit of PM removal (Zhao etal., 2010). In 2011, China’s Ministry of Environmental Pro-tection (MEP) announced a revised in-stack concentrationstandard for PM of 20 mg m−3 for environmentally sensitiveregions and 30 mg m−3 for other regions.
In Japan, the application of best available technologies forcontrolling SO2, NOx, and PM is required for most powergeneration units across the country. The penetration of wet-FGD, LNB+SCR and high-efficiency dedusters (HEDs, e.g.,FF and electrostatic-fabric integrated precipitator) is over90 % for all, having increased slightly during 2005–2010(Klimont et al., 2009).
In South Korea, FGD systems have been installed at mostpower generation units; the penetration increased slightly,
from 95 to 97 %, during 2005–2010. For NOx, SCR has beenthe dominant control technology, with its share increasingfrom 56 % in 2005 to 68 % in 2010. About one-third of coal-fired power generation units had been equipped with HEDsystems by 2010, and the rest was equipped with ESP equip-ment (NIER, 2010; NIER 2013; Clean Air Policy SupportingSystem, CAPSS,http://airemiss.nier.go.kr/).
2.2.2 Industrial sector
The penetrations of control technologies for industrial boilersand industrial processes are presented in Table 3, Table 4 andSupplement Table S1.
In China, SO2 and NOx control technologies have beenrarely installed in the industry sector. In recent years, FGDunits for controlling SO2 have been installed at a small num-ber of coal-fired boilers and sintering plants in selected re-gions. The application of NOx-control technologies is de-scribed in more detail in our previous paper (Zhao et al.,2013c). In contrast with SO2 and NOx, China has been con-trolling PM emissions from industrial sources since the late1980s; the emission standards for industrial sources, how-ever, were updated only gradually until 2010 (see details inLei et al., 2011). The 11th Five-Year Plan promoted high-efficiency FF in some high-emission industries. Most indus-trial boilers were historically equipped with wet scrubbers(WET) and cyclone dust collectors (CYC), while penetrationof high-efficiency FF began recently (Lei et al., 2011; Zhao etal., 2013a). Blast furnaces in China are usually equipped withwashing towers and double venturi scrubbers, which have ap-proximately the same removal efficiency as the combinationof ESP and WET. Electrostatic precipitators and FF hadgradually become the major control technologies applied at
Atmos. Chem. Phys., 14, 6571–6603, 2014 www.atmos-chem-phys.net/14/6571/2014/

S. X. Wang et al.: Emission trends and mitigation options for air pollutants in East Asia 6577
Table 3.Penetrations of major control technologies in industrial and residential combustion sources in China, Japan, and South Korea (% offuel use).
Energy Control Base year BAU[0]/PC[0] BAU[1]/PC[1] BAU[2]/PC[2]technology technology 2005 2010 2020 2030 2020 2030 2030
Country China Japan South China Japan SouthChina Japan South China Japan SouthChina Japan South China Japan SouthChina Japan SouthKorea Korea Korea Korea Korea Korea Korea
Industrial grate CYC (PM) 23 0 25 0 0 23 0 0 20 0 0 17 0 0 20 0 0 17 0 0 0boilers WET (PM) 73 0 12 95 0 9 95 0 9 95 0 9 60 0 9 20 0 9 0 0 0
ESP (PM) 0 50 16 0 50 16 0 50 16 0 50 16 20 50 16 40 50 16 0 0 0HED (PM) 0 50 47 5 50 52 5 50 55 5 50 58 20 50 55 40 50 58 100 100 100FGD (SO2) 0 42 80 1 42 85 1 42 88 1 42 90 40 42 88 80 42 90 100 100 100LNB (NOx) 0 65 0 0 80 0 0 80 0 0 80 0 91 80 0 100 80 0 0 0 0LNB+SCR 0 20 0 0 20 0 0 20 0 0 20 0 0 20 0 0 20 0 100 100 100(NOx)
Residential CYC (PM) 23 50 60 14 50 51 12 50 45 10 50 40 0 50 45 0 50 40 0 50 50boilers WET (PM) 63 0 40 78 0 49 81 0 55 85 0 60 80 0 55 60 0 60 50 0 0
HED (PM) 0 50 0 0 50 0 0 50 0 0 50 0 20 50 0 40 50 0 50 50 50DC (SO2) 0 0 0 0 0 0 5 0 0 10 0 0 20 0 0 40 0 0 100 100 100
Coal stoves STV_ADV_C 0 25 10 0 50 13 0 50 18 0 50 20 10 50 18 30 50 20 100 100 100
Biomass STV_ADV_B 0 35 30 0 48 35 0 70 35 0 78 35 10 70 35 30 78 35 50 50 50stoves STV_PELL 0 0 0 0 0 0 0 0 0 0 0 0 0 0 0 0 0 0 50 50 50
Notes: DC, application of (low-sulfur) derived coal; STV_ADV_C, replacement of advanced coal stove; STV_ADV_B, replacement of advanced biomass stove (e.g., better combustion condition, catalytic stove); STV_PELL, biomass pellet stove.
Table 4a.Penetrations of major control technologies for selected industrial process in China – SO2.
Industrial process Control technology Base year BAU[0]/PC[0] BAU[1]/PC[1] BAU[2]/PC[2]2005 2010 2020 2030 2020 2030 2030
Sintering FGD 0 10 20 40 95 100 100
Coke oven FGD for coal-charging 0 0 0 0 10 10 0processFGD for coke oven gas 0 0 0 0 10 10 0Combination of the 0 0 0 0 30 50 100technologies above
Glass production (float process) FGD 0 0 0 0 50 90 100
Sulfuric acid production Ammonia acid 0 0 0 0 40 80 100desulfurization method
cement plants, sintering plants, and basic oxygen furnaces by2010, while large numbers of electric arc furnaces and cokeovens were still equipped with WET (Lei et al., 2011; Zhaoet al., 2013a).
The only control measures for NMVOC emissions inChina’s industry sector are associated with fossil-fuel ex-ploitation and distribution. Emission standards for gasolinedistribution released in 2007 require the following: (1) in-stallation of vapor-recovery systems and modified loadingtechniques (Stage IA control) for loading and unloading op-erations; (2) improvement in service station tanks (Stage IBcontrol) and installation of vapor-balancing systems betweenvehicles and service station tanks (Stage II control); (3) in-stallation of internal floating covers (IFC) or secondary sealsfor newly built or retrofitted storage tanks. These standardswere scheduled to be implemented in relatively large citiesof key regions (areas defined by the government as environ-mentally sensitive, including the Greater Beijing region, theYangtze River Delta, and the Pearl River Delta) from 2008–2010 onwards, and in relatively large cities in other provincesfrom 2012–2015 onwards. We estimated that vapor-recycling
systems had been installed at about 15 % of all gasolinestorage and distribution operations by 2010 (see Table 4 fordetails).
In Japan, industrial emissions are limited strictly by theAir Pollution Control Act. The thresholds have changed onlyvery slightly since 1995, but are still among the most strin-gent in the world (Ministry of the Environment of Japan,2013). Under such strict regulations, the vast majority ofblast furnaces, basic oxygen furnaces, electric arc furnaces,and cement kilns are controlled with HEDs. The PM con-trol portfolio for industrial boilers, sintering plants, glassproduction plants, and coke ovens is typically a mix ofESPs and HEDs. Effective SO2 removal technologies (70–80 % removal efficiency) are applied in various industries,including sintering, cement production, coke ovens, sulfu-ric acid production, and other industrial processes (Gains-Asia model of the International Institute for Applied Sys-tem Analysis, IIASA,http://gains.iiasa.ac.at/models/). Theaverage efficiency of such removal equipment has increasedgradually as old facilities are retired. The dominant controlsfor NOx emissions as of 2010 were low-NOx combustion
www.atmos-chem-phys.net/14/6571/2014/ Atmos. Chem. Phys., 14, 6571–6603, 2014

6578 S. X. Wang et al.: Emission trends and mitigation options for air pollutants in East Asia
Table 4b.Penetrations of major control technologies for selected industrial process in China – NOx.
Industrial process Control technology Base year BAU[0]/PC[0] BAU[1]/PC[1] BAU[2]/PC[2]2005 2010 2020 2030 2020 2030 2030
Sintering SNCR 0 0 0 0 36 54 20SCR 0 0 0 0 24 36 80
Precalciner cement kiln LNB 30 35 35 35 30 25 0LNB+SNCR 0 0 0 0 30 45 0LNB+SCR 0 0 0 0 20 30 100
Glass production OXFL 0 0 0 0 80 88 70(float process) SCR 0 0 0 0 10 12 30
Nitric acid (dual ABSP 10 12 12 12 18 18 18pressure process) SCR 15 18 18 18 72 82 82
ABSP+SCR 0 0 0 0 0 0 0
Nitric acid ABSP 60 63 66 66 5 5 0(other process) SCR 30 32 34 34 15 15 0
ABSP+SCR 0 0 0 0 80 80 100
Notes: ABSP, absorption method; OXFL, oxy-fuel combustion technology.
Table 4c.Penetrations of major control technologies for selected industrial process in China – PM.
Industrial process Control Base year BAU[0]/PC[0] BAU[1]/PC[1] BAU[2]/PC[2]technology 2005 2010 2020 2030 2020 2030 2030
Sintering (flue gas) CYC 5 0 0 0 0 0 0WET 20 5 0 0 0 0 0ESP 65 75 80 80 70 60 0HED 10 20 20 20 30 40 100
Blast furnace (flue gas) WET 100 100 100 100 100 100 100ESP 100 100 100 100 100 100 100
Basic oxygen furnace ESP 40 30 20 20 10 0 0HED 60 70 80 80 90 100 100
Electric arc furnace WET 60 30 20 20 0 0 0ESP 30 50 50 50 40 20 0HED 10 20 30 30 60 80 100
Coke oven WET 100 100 100 100 50 30 0HED 0 0 0 0 50 70 100
Precalciner cement kiln WET 1 0 0 0 0 0 0ESP 52 40 35 30 20 5 0HED 47 60 65 70 80 95 100
Glass production CYC 5 0 0 0 0 0 0WET 25 20 20 20 0 0 0ESP 68 75 75 75 85 75 0HED 3 5 5 5 15 25 100
Brick production CYC 40 30 30 30 20 0 0WET 8 20 20 20 40 50 0ESP 0 20 20 20 40 50 0HED 0 0 0 0 0 0 100
Notes: CMN, common control of fugitive emissions; HIEF, high-efficiency control of fugitive emissions.
Atmos. Chem. Phys., 14, 6571–6603, 2014 www.atmos-chem-phys.net/14/6571/2014/
S. X. Wang et al.: Emission trends and mitigation options for air pollutants in East Asia 6579
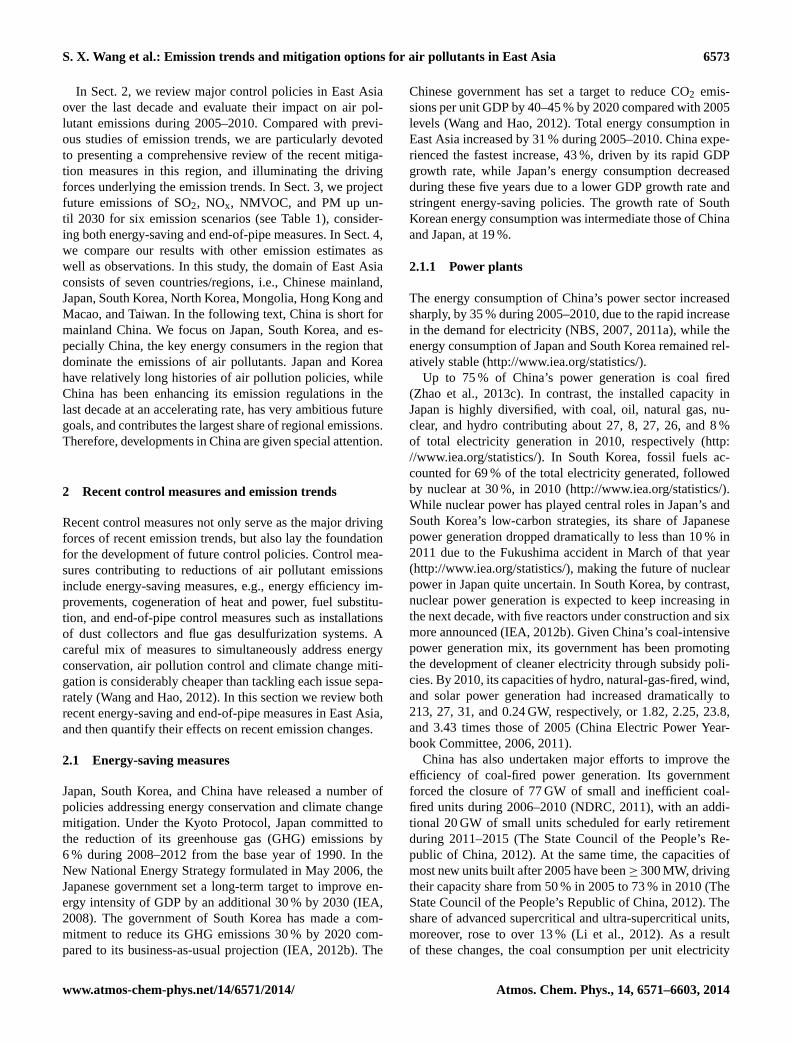
Table 4d.Penetrations of major control technologies for selected industrial process in China – NMVOC.
Industrial process Control technology Base year BAU[0]/PC[0] BAU[1]/PC[1] BAU[2]/PC[2]2005 2010 2020 2030 2020 2030 2030
Coke oven No control 100 100 100 100 55 20 0End of pipe control measures 0 0 0 0 45 80 100
Refinery No control 100 100 87 80 20 0 0Leak detection and repairprogram
0 0 10 15 30 15 0
Covers on oil and waterseparators
0 0 3 5 10 5 0
Combination of the aboveoptions
0 0 0 0 40 80 100
Plant oil No control 95 90 84 80 20 0 0extraction Activated carbon adsorption 5 10 13 15 50 50 0
Schumacher-type DTDC andactivated carbon adsorption
0 0 3 5 25 35 0
Schumacher-type DTDC andnew recovery section
0 0 0 0 5 15 100
Pharmacy No control 100 100 90 85 15 0 0Primary measures andlow-level end-of-pipe measures
0 0 10 15 50 30 0
Primary measures and high-level end-of-pipe measures
0 0 0 0 35 70 100
Gasoline storage No control 100 95 75 60 25 0 0IFC (Internal floating covers orsecondary seals)
0 5 25 40 75 100 100
Gasoline loading No control 100 85 50 50 25 0 0and unloading Stage IA (Vapor recovery
systems and modified loadingtechniques)
0 15 50 50 75 100 100
Service station No control 100 85 50 50 25 0 0Stage IB+ Stage II(Improvement in service stationtank and vapor balancing sys-tem between a vehicle and ser-vice station tank)
0 15 50 50 75 100 100
Crude oil storage No control 100 100 100 100 75 50 0and distribution IFC+ Stage IA+ Stage IB+
Storage II0 0 0 0 25 50 100
technologies; flue gas denitrification has not been widespreaddue to relatively high cost.
Emission standards for industrial sources in South Koreaare generally less stringent than those of Japan but morestringent than those of China (Ministry of Environment ofSouth Korea, 2013). In contrast with Japan, the PM con-trol portfolio for cement kilns is an equal mix of ESPs andHEDs; ESPs still dominate PM removal for industrial boil-ers and sintering machines, and HEDs are not widely ap-plied. Flue gas desulfurization systems were widely appliedat some high-emitting sources such as industrial boilers and
sintering plants by 2010, with penetrations of 85 and 100 %,respectively (NIER, 2010, 2013). Similar to Japan, the dom-inant control measures for NOx emissions were low-NOxcombustion technologies by 2010.
2.2.3 Residential sector
In the three countries there are only limited regulations ad-dressing residential sources. In Japan, about half of residen-tial and commercial boilers are equipped with HEDs, drivenby stringent local government regulations. In South Korea
www.atmos-chem-phys.net/14/6571/2014/ Atmos. Chem. Phys., 14, 6571–6603, 2014
6580 S. X. Wang et al.: Emission trends and mitigation options for air pollutants in East Asia
and China, dominant control technologies are CYC and WET(Table 3).
Compared with boilers, emissions from small stoves aremore difficult to control. In Japan, small incinerators dwin-dled rapidly in the last decade due to a 2000 regulation de-signed to mitigate dioxin pollution (Ministry of the Environ-ment of Japan, 2013; Wakamatsu et al., 2013). A previousstudy found briquette stoves have lower emission factors forSO2 and PM (Lei et al., 2011). We estimate briquette useaccounted for 6–7 % of total residential coal consumptionin China during 2005–2010 (NBS, 2007, 2008a, b, 2009,2011a, b). Emissions from small stoves can be further re-duced by switching to new technologies, e.g., those using cat-alyst or non-catalyst inserts and/or primary and secondary airdeflectors. These types of improved stoves have been spread-ing gradually in Japan and Korea (see Table 3).
2.2.4 Transportation sector
Since 2000, China has issued a series of emission standardsfor new vehicles and engines based on the European Union(EU) “Euro” Standards; the implementation years and pen-etrations of major emission standards are shown in Fig. 1and Table 5. At the national level, Euro I, II, and III stan-dards began to be put into effect in 2000, 2004, and 2007,respectively. The Euro IV standard for light-duty vehicleswas implemented in 2011. The Euro IV standard for heavy-duty diesel vehicles was originally planned for implementa-tion in 2010, but was postponed until July 2013 by the MEPdue largely to an insufficient supply of low-sulfur fuel (Wuet al., 2012). Megacities including Beijing and Shanghai aresubject to greater pressure for regulating vehicle emissions,and are therefore 2–3 years ahead of the national regulation.Recently, the Beijing Environmental Protection Bureau an-nounced enforcement of Euro V in 2012 and Euro VI in2016. Aside from regulations for new vehicles, emission re-ductions are also achieved by the controlling of in-use ve-hicle emissions and improvement of fuel quality (Wang andHao, 2012).
Japan’s emission standards for new vehicles have beenamong the most stringent in the world. Since the introductionof the first regulation in 1981, the standards have been re-peatedly strengthened. For light-duty vehicles, the prevailingemission standards for NOx and NMVOC during 2005–2010(under the “New Long-term Regulation”) was comparable tothat in US (Tier II), and more stringent than that of the EU(Euro IV) before Euro V took effect in the second half of2009. A more recent “Post New Long-term Regulation” re-leased in 2009 added a limit for PM comparable to US TierII, while maintaining the prior limits for other pollutants. Forheavy-duty vehicles, Japan’s NOx emission regulations be-fore 2005 had been stricter than those of Europe and the US(Japan Automobile Manufacturers Association, 2011). Dur-ing 2005–2010, Japan’s prevailing standard was comparableto Euro V (issued in 2008), and between the 2004 and 2007
standards of the US. Since the early 2010s, European, USand Japanese regulatory standards for NOx and PM emis-sions for diesel vehicles have been roughly similar (Ministryof the Environment of Japan, 2013; Delphi Company, 2013a,b).
South Korea has gradually intensified its vehicle emissionstandards to the level of the US and the EU. In Decemberof 2003, Korea issued new vehicle emission standards corre-sponding to the level of ultra-low emission vehicles (ULEV)for gasoline vehicles and the levels of Euro IV for diesel ve-hicles, taking effect in 2007. In 2009, South Korea adoptedCalifornia’s non-methane organic gases (NMOG) fleet av-erage system (FAS) for gasoline-fueled vehicles. The fleetaverage system enables car manufacturers to have a rangeof vehicle models with different emissions levels. However,each carmaker’s fleet is required to meet a prescribed level ofNMOG emissions on average, which has been continuouslylowered since 2009, and will approach California’s by 2014(http://transportpolicy.net/). For diesel vehicles, Euro V wasintroduced starting in September 2009, and the Euro VI stan-dard will be in place by 2014 (Ministry of Environment ofSouth Korea, 2013; Delphi Company, 2013a, b). The pen-etrations of vehicle emission standards in Japan and SouthKorea are given in Table 5.
2.2.5 Solvent use
The Chinese government has released standards to limit thesolvent content of some products, including wood paint, in-terior wall paint, adhesives for shoe production, decorativeadhesives, and printing inks. Driven by these standards, thesolvent content of some products has declined, and the pene-tration of low-solvent products increased during 2005–2010.Table 6 and Supplement Table S2 show the penetrations ofmajor control measures for solvent use; Supplement Table S3shows the changes in the emission factors of typical sources(especially regulated ones) during 2005–2010. Despite theexisting standards, most emissions from solvent use remainuncontrolled in China.
In 2004, Japan’s Ministry of Environment set a target to re-duce the 2000 NMVOC emission levels 30 % by 2010 usingboth regulations (10 %) and voluntary efforts (20 %), with afocus on emissions from solvent use (Ministry of the Envi-ronment of Japan, 2013). The actual reductions are estimatedto be higher, but the O3 and PM concentrations have not de-clined as expected (Wakamatsu et al., 2013).
South Korea issued concentration limits for stack emis-sions of NMVOC for coating plants and more recently forgravure printing facilities. For outdoor application of paints,the government reached agreement with producers regardingthe development of low solvent products as well as improvedapplication methods to minimize NMVOC emissions (Min-istry of Environment of South Korea, 2013).
Atmos. Chem. Phys., 14, 6571–6603, 2014 www.atmos-chem-phys.net/14/6571/2014/

S. X. Wang et al.: Emission trends and mitigation options for air pollutants in East Asia 6581
Response to the remarks from the English Copy-Editor:
CE1: As the word “mainland” is used, it is superfluous to mention any islands.
Response: Please stick to our original description in order to define “mainland China”
precisely.
CE2: Please define “indigenous oven” or use a different term.
Response: Please revise it to “(vs. traditional small ovens)”.
CE3: Do you mean “about 88% of which are pulverized coal combustion plants” OR
“including about 88% of pulverized coal combustion plants”? Please confirm.
Response: The latter.
CE4: Please maintain consistency between “coke ovens” and coking ovens”.
Response: We would like to use “coke oven”. Please replace “coking oven” with
“coke oven” in Page 4, right column, Line 6; Page 6, right column, Line 34; and Page
20, right column, Line 23.
CE5: Do you mean lower energy production processes or less common production
processes? Please confirm.
Response: We mean other industrial processes. Please revise the sentence as follows:
Effective SO2 removal technologies (70–80% removal efficiency) are applied in
various industries, including sintering, cement production, coke ovens, sulfuric acid
production, and other industrial processes.
CE6: The items in this figure are unclear. Please define “rural vehicle”, “machines”,
and “train, inland water”.
Response: Please update Figure 1 as follows. The items in the updated figure have
been revised.
Type 00 01 02 03 04 05 06 07 08 09 10 11 12 13 14 15 16 17 18 19 20 21 22 23 24 25 26 27 28 29 30
Light duty vehicles 1 1 1 1 1 2 2 2 3 3 3 4 4 4 4 4 4 4 4 4 4 4 4 4 4 4 4 4 4 4 4
Heavy duty diesel vehicles 1 1 1 2 2 2 3 3 3 3 3 3 4 4 4 5 5 5 5 5 5 5 5 5 5 5 5 5 5 5
Heavy duty gasoline vehicles 1 2 2 2 2 2 2 2 2 2 2 2 2 2 2 2 2 2 2 2 2 2 2 2 2 2 2 2
Motorcycles (2&4 strokes) 1 2 2 2 2 2 3 3 3 3 3 3 3 3 3 3 3 3 3 3 3 3 3 3 3 3 3 3
Tri-wheel & low-speed goods vehicles 1 2 2 2 2 2 2 2 2 2 2 2 2 2 2 2 2 2 2 2 2 2 2 2 2
Tractors; agricultural machines 1 1 2 2 2 2 2 2 2 2 2 2 2 2 2 2 2 2 2 2 2 2 2
Trains; inland waterway ships
Type 00 01 02 03 04 05 06 07 08 09 10 11 12 13 14 15 16 17 18 19 20 21 22 23 24 25 26 27 28 29 30
Light duty vehicles 1 1 1 1 1 2 2 2 3 3 3 4 4 4 4 4 5 5 5 5 6 6 6 6 6 6 6 6 6 6 6
Heavy duty diesel vehicles 1 1 1 2 2 2 3 3 3 3 3 3 4 4 4 5 5 5 6 6 6 6 6 6 6 6 6 6 6 6
Heavy duty gasoline vehicles 1 2 2 2 2 2 2 2 2 2 2 2 2 2 2 2 2 2 2 2 2 2 2 2 2 2 2 2
Motorcycles (2&4 strokes) 1 2 2 2 2 2 3 3 3 3 3 3 3 3 3 3 3 3 3 3 3 3 3 3 3 3 3 3
Tri-wheel & low-speed goods vehicles 1 2 2 2 2 2 2 3 3 3 3 4 4 4 5 5 5 6 6 6 6 6 6 6 6
Tractors; agricultural machines 1 1 2 2 2 2 3A 3A 3A 3A 3B 3B 3B 4 4 4 4 4 4 4 4 4 4
Trains; inland waterway ships 3A 3A 3A 3A 3B 3B 3B 4 4 4 4 4 4 4 4 4 4
Figure 1. The implementation time of the vehicle emission standards in China:(a) the BAU[0] and PC[0] scenarios;(b) the BAU[1], PC[1],BAU[2], and PC[2] scenarios. The Arabic numbers 1–6 represent Euro I to Euro VI vehicle emission standards. Numbers in black representstandards released by the end of 2010, and those in red represent those to be released in the future.
2.3 Effect of control measures on recent emission trends
The historical emissions of China are estimated using amodel structure developed in our previous paper (Zhao etal., 2013c). The emissions from each sector in each provincewere calculated from data on activities (e.g., energy con-sumption or industrial production), technology-based uncon-trolled emission factors, and penetrations and removal effi-ciencies of control technologies. The data sources for Chinaare also described in Zhao et al. (2013b).
The historical emissions of Japan are consistent with theJATOP Emission Inventory-Data Base (JEI-DB), developedby the Japan Petroleum Energy Center (JPEC) (JPEC, 2012a,b, c). Special attention was paid to on-road vehicle emissions.The basic estimation method is to multiply the traffic volume(considering the vehicle type mix) and emission factors forvehicle types. Thee Japan Petroleum Energy Center adjuststhat value with correction factors to take account of accu-mulated mileage, temperature, and humidity. It also includesdata from original research on start emission factors, evapo-ration emission factors, the ratio of high-emission vehicles,and vehicle usage profile from a questionnaire-based survey(JPEC, 2012c). The emissions from other sources were cal-culated using local statistical information and emission fac-tors, similar to the methodology for the estimation of China’semissions (JPEC, 2012a).
The historical emissions of South Korea were calculatedby the National Institute of Environmental Research (NIER),and the data sources are described in its research reportsand a web-based database (NIER, 2010, 2013; CAPSS,http:
//airemiss.nier.go.kr/). Note that continuous emissions moni-toring systems (CEMSs) were installed at most large pointsources starting in 2002, allowing CEMS-based emissionestimation for 2007–2010, while earlier years were calcu-lated using emission factors. This methodological changeproduced emission discontinuities in 2007, leading us to re-place pre-2007 emissions from those stacks with values ex-trapolated from 2007–2010 CEMS-based estimates, takingaccount of changes of control measures.
The emissions for North Korea, Mongolia, Hong Kong andMacao, and Taiwan are adopted directly from the Gains-Asiamodel of IIASA (http://gains.iiasa.ac.at/models/).
The national energy consumption and air pollutant emis-sions are summarized in Table 7 and Table 8, respectively.The sectoral emissions in China are given in Fig. 2, and thosein Japan and South Korea are shown in Fig. 3. The provincialemissions in China are shown in Supplement Table S4.
2.3.1 NOx
The total NOx emissions in East Asia were 29.7 Mt in 2010and the growth rate was 25 % during 2005–2010. This trendwas dominated by the increase in emissions from China,which contributed 82–88 % of total NOx emissions in EastAsia.
During this period, NOx emissions in China increased by34 %, driven by the rapid increase of industry and trans-portation. The emissions from power plants stopped growingby 2010 due to the application of LNBs and penetration ofnon-fossil energy sources in the sector. But emissions from
www.atmos-chem-phys.net/14/6571/2014/ Atmos. Chem. Phys., 14, 6571–6603, 2014

6582 S. X. Wang et al.: Emission trends and mitigation options for air pollutants in East Asia
Table 5a.Penetrations of vehicle emission standards in China (%).
Vehicle Standard Base year BAU[0]/PC[0] BAU[1]/PC[1] BAU[2]/PC[2]2005 2010 2020 2030 2020 2030 2030
HDT-D NOC 19 1 0 0 0 0 0HDEUI 42 8 0 0 0 0 0HDEUII 39 22 0 0 0 0 0HDEUIII 0 70 7 0 7 0 0HDEUIV 0 0 19 0 19 0 0HDEUV 0 0 75 100 41 0 0HDEUVI 0 0 0 0 32 100 100
HDB-D NOC 28 8 0 0 0 0 0HDEUI 40 18 0 0 0 0 0HDEUII 32 24 3 0 3 0 0HDEUIII 0 51 20 0 22 0 0HDEUIV 0 0 18 2 18 2 0HDEUV 0 0 59 98 32 8 0HDEUVI 0 0 0 0 25 90 100
LDT-D NOC 11 0 0 0 0 0 0MDEUI 65 13 0 0 0 0 0MDEUII 23 30 0 0 0 0 0MDEUIII 0 58 1 0 2 0 0MDEUIV 0 0 99 100 26 0 0MDEUV 0 0 0 0 57 1 0MDEUVI 0 0 0 0 16 100 100
LDT-G NOC 27 0 0 0 0 0 0LFEUI 56 13 0 0 0 0 0LFEUII 16 29 0 0 0 0 0LFEUIII 0 58 2 0 2 0 0LFEUIV 0 0 98 100 28 0 0LFEUV 0 0 0 0 56 1 0LFEUVI 0 0 0 0 14 99 100
LDB-G NOC 31 6 0 0 0 0 0LFEUI 54 22 1 0 1 0 0LFEUII 15 23 4 0 4 0 0LFEUIII 0 48 14 0 15 0 0LFEUIV 0 0 81 100 35 6 0LFEUV 0 0 0 0 36 25 0LFEUVI 0 0 0 0 8 70 100
CAR-G NOC 23 3 0 0 0 0 0LFEUI 55 16 0 0 0 0 0LFEUII 23 28 3 0 3 0 0LFEUIII 0 53 9 0 10 0 0LFEUIV 0 0 88 100 30 1 0LFEUV 0 0 0 0 44 11 0LFEUVI 0 0 0 0 13 87 100
Notes: HDT-D, heavy-duty diesel truck; HDB-D, heavy-duty diesel bus; LDT-D, light-duty diesel truck; LDT-G,light-duty gasoline truck; LDB-G, light-duty gasoline bus; CAR-G, gasoline car; HDEUI∼HDEUIII, EURO I∼IIIstandards on heavy-duty diesel road vehicles; MDEUI∼MDEUIII, EURO I∼III standards on light-duty diesel roadvehicles; LFEUI∼LFEUIII, EURO I∼III standards on light-duty spark ignition road vehicles (4-stroke engines).
industry and transportation continued to grow rapidly due toswiftly expanding industrial energy consumption and vehiclepopulations.
NOx emissions from the rest of East Asia decreased by13 % during the five-year period, mainly attributed to a 21 %reduction in emissions from Japan due chiefly to the imple-
mentation of tight emission standards for new vehicles. Theemissions of South Korea decreased slightly, by 5 %, for thesame reason.
Atmos. Chem. Phys., 14, 6571–6603, 2014 www.atmos-chem-phys.net/14/6571/2014/

S. X. Wang et al.: Emission trends and mitigation options for air pollutants in East Asia 6583
Table 5b.Penetrations of vehicle emission standards in Japan (%).
Vehicle Standard Base year BAU[0]/BAU[1]/ BAU[2]/PC[2] Vehicle Standard Base year BAU[0]/BAU[1]/ BAU[2]/PC[2]PC[0]/PC[1] PC[0]/PC[1]
2005 2010 2020 2030 2030 2005 2010 2020 2030 2030
HDT-D BST 41 % 25 % 0 % 0 % 0 % LDT-G BST 38 % 16 % 1 % 0 % 0 %ST 27 % 19 % 1 % 0 % 0 % ST 4 % 2 % 0 % 0 % 0 %LT 26 % 25 % 22 % 0 % 0 % LT 10 % 6 % 0 % 0 % 0 %NST 7 % 11 % 10 % 0 % 0 % 1998R 14 % 10 % 6 % 0 % 0 %NLT 0 % 20 % 22 % 7 % 0 % NST 34 % 31 % 19 % 0 % 0 %PNLT 0 % 0 % 44 % 93 % 100 % NLT 0 % 34 % 24 % 8 % 0 %
HDB-D BST 52 % 32 % 0 % 0 % 0 % PNLT 0 % 0 % 49 % 92 % 100 %ST 19 % 15 % 2 % 0 % 0 % LDB-B BST 12 % 4 % 0 % 0 % 0 %LT 25 % 24 % 23 % 0 % 0 % ST 4 % 1 % 0 % 0 % 0 %NST 5 % 8 % 8 % 0 % 0 % LT 4 % 1 % 0 % 0 % 0 %NLT 0 % 20 % 22 % 8 % 0 % 1998R 16 % 6 % 3 % 0 % 0 %PNLT 0 % 0 % 45 % 92 % 100 % NST 63 % 35 % 17 % 0 % 0 %
LDT-D BST 41 % 27 % 0 % 0 % 0 % NLT 0 % 52 % 27 % 10 % 0 %ST 27 % 20 % 0 % 0 % 0 % PNLT 0 % 0 % 53 % 90 % 100 %LT 27 % 23 % 22 % 0 % 0 % CAR 1983R 72 % 32 % 8 % 0 % 0 %NST 5 % 11 % 10 % 0 % 0 % NST 28 % 37 % 24 % 0 % 0 %NLT 0 % 20 % 23 % 7 % 0 % NLT 0 % 31 % 23 % 9 % 0 %PNLT 0 % 0 % 46 % 93 % 100 % PNLT 0 % 0 % 46 % 91 % 100 %
Notes: BST, before short term target; ST, short term target; LT, long term target; NST, new short-term target; NLT, new long-term target; PNLT, post new long-term target; 1998R, 1998 regulation;1983R, 1983 regulation.
Table 5c.Penetrations of vehicle emission standards in South Korea (%).
Vehicle Standard Base year BAU[0]/BAU[1]/ BAU[2]/PC[2] Vehicle Standard Base year BAU[0]/BAU[1]/ BAU[2]/PC[2]PC[0]/PC[1] PC[0]/PC[1]
2005 2010 2020 2030 2030 2005 2010 2020 2030 2030
HDT-D NOC 0 0 0 0 0 LDT-G NOC 0 0 0 0 0HDEUI 13 10 0 0 0 LFEUI 15 10 0 0 0HDEUII 15 13 0 0 0 LFEUII 33 12 0 0 0HDEUIII 35 33 0 0 0 LFEUIII 30 28 0 0 0HDEUIV 0 24 10 0 0 LFEUIV 7 38 23 0 0HDEUV 0 12 48 0 0 LFEUV 0 10 77 100 0HDEUVI 0 0 42 100 100 LFEUVI 0 0 0 0 100
HDB-D NOC 0 0 0 0 0 LDB-G NOC 0 0 0 0 0HDEUI 13 10 0 0 0 LFEUI 15 10 0 0 0HDEUII 15 13 0 0 0 LFEUII 33 12 0 0 0HDEUIII 35 33 0 0 0 LFEUIII 30 28 0 0 0HDEUIV 0 24 10 0 0 LFEUIV 7 38 23 0 0HDEUV 0 12 48 0 0 LFEUV 0 10 77 100 0HDEUVI 0 0 42 100 100 LFEUVI 0 0 0 0 100
LDT-D NOC 0 0 0 0 0 CAR-G NOC 0 0 0 0 0MDEUI 30 10 0 0 0 LFEUI 15 10 0 0 0MDEUII 20 17 0 0 0 LFEUII 33 12 0 0 0MDEUIII 35 34 0 0 0 LFEUIII 30 28 0 0 0MDEUIV 0 27 25 0 0 LFEUIV 7 38 23 0 0MDEUV 0 8 35 0 0 LFEUV 0 10 77 100 0MDEUVI 0 0 40 100 100 LFEUVI 0 0 0 0 100
Note: South Korea adopted US emission standards for gasoline vehicles, which were equivalent to the penetrations of European standards above in terms of removal efficiencies.
2.3.2 SO2
The total SO2 emissions in East Asia decreased by 15 %,from 30.4 Mt in 2005 to 25.9 Mt in 2010, with both Chinaand the rest of East Asia experiencing the same 15 % rateof decline and Chinese emissions accounting for as much as94 % of the regional total.
The decline in China’s SO2 emissions is mainly at-tributable to the widespread deployment of FGD at powerplants, even as emissions from China’s industrial sector con-tinued to rise during this period; this is consistent with therecent estimates by Zhang et al. (2012b), Lu et al. (2011),Klimont et al. (2013).
SO2 emissions of Japan decreased by 20 %, mainly at-tributed to the increasing penetration of higher-efficiencydesulfurization technologies in the industrial sector, and the
www.atmos-chem-phys.net/14/6571/2014/ Atmos. Chem. Phys., 14, 6571–6603, 2014
6584 S. X. Wang et al.: Emission trends and mitigation options for air pollutants in East Asia
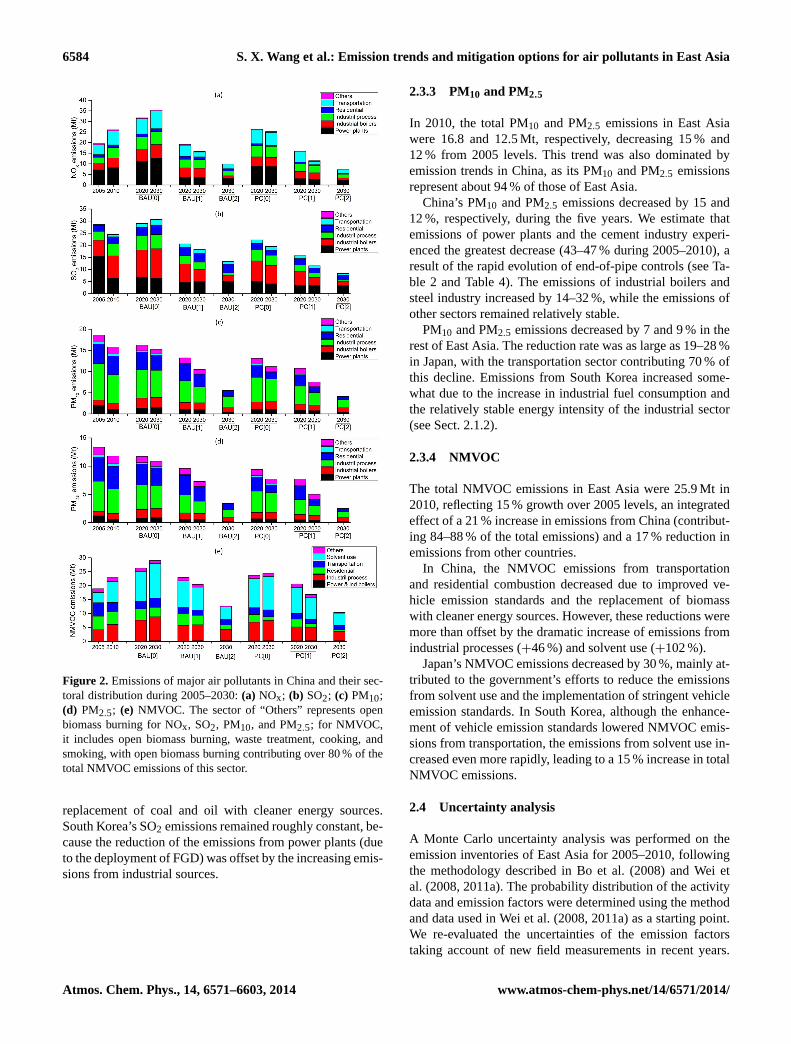
Figure 2. Emissions of major air pollutants in China and their sec-toral distribution during 2005–2030:(a) NOx; (b) SO2; (c) PM10;(d) PM2.5; (e) NMVOC. The sector of “Others” represents openbiomass burning for NOx, SO2, PM10, and PM2.5; for NMVOC,it includes open biomass burning, waste treatment, cooking, andsmoking, with open biomass burning contributing over 80 % of thetotal NMVOC emissions of this sector.
replacement of coal and oil with cleaner energy sources.South Korea’s SO2 emissions remained roughly constant, be-cause the reduction of the emissions from power plants (dueto the deployment of FGD) was offset by the increasing emis-sions from industrial sources.
2.3.3 PM10 and PM2.5
In 2010, the total PM10 and PM2.5 emissions in East Asiawere 16.8 and 12.5 Mt, respectively, decreasing 15 % and12 % from 2005 levels. This trend was also dominated byemission trends in China, as its PM10 and PM2.5 emissionsrepresent about 94 % of those of East Asia.
China’s PM10 and PM2.5 emissions decreased by 15 and12 %, respectively, during the five years. We estimate thatemissions of power plants and the cement industry experi-enced the greatest decrease (43–47 % during 2005–2010), aresult of the rapid evolution of end-of-pipe controls (see Ta-ble 2 and Table 4). The emissions of industrial boilers andsteel industry increased by 14–32 %, while the emissions ofother sectors remained relatively stable.
PM10 and PM2.5 emissions decreased by 7 and 9 % in therest of East Asia. The reduction rate was as large as 19–28 %in Japan, with the transportation sector contributing 70 % ofthis decline. Emissions from South Korea increased some-what due to the increase in industrial fuel consumption andthe relatively stable energy intensity of the industrial sector(see Sect. 2.1.2).
2.3.4 NMVOC
The total NMVOC emissions in East Asia were 25.9 Mt in2010, reflecting 15 % growth over 2005 levels, an integratedeffect of a 21 % increase in emissions from China (contribut-ing 84–88 % of the total emissions) and a 17 % reduction inemissions from other countries.
In China, the NMVOC emissions from transportationand residential combustion decreased due to improved ve-hicle emission standards and the replacement of biomasswith cleaner energy sources. However, these reductions weremore than offset by the dramatic increase of emissions fromindustrial processes (+46 %) and solvent use (+102 %).
Japan’s NMVOC emissions decreased by 30 %, mainly at-tributed to the government’s efforts to reduce the emissionsfrom solvent use and the implementation of stringent vehicleemission standards. In South Korea, although the enhance-ment of vehicle emission standards lowered NMVOC emis-sions from transportation, the emissions from solvent use in-creased even more rapidly, leading to a 15 % increase in totalNMVOC emissions.
2.4 Uncertainty analysis
A Monte Carlo uncertainty analysis was performed on theemission inventories of East Asia for 2005–2010, followingthe methodology described in Bo et al. (2008) and Wei etal. (2008, 2011a). The probability distribution of the activitydata and emission factors were determined using the methodand data used in Wei et al. (2008, 2011a) as a starting point.We re-evaluated the uncertainties of the emission factorstaking account of new field measurements in recent years.
Atmos. Chem. Phys., 14, 6571–6603, 2014 www.atmos-chem-phys.net/14/6571/2014/

S. X. Wang et al.: Emission trends and mitigation options for air pollutants in East Asia 6585
Specifically, we assumed that the uncertainties of the activ-ity data and emission factors had lognormal distributions.The uncertainties of activity levels were rated from level Ito level V, corresponding to coefficients of variation (CVs,defined as the ratio of the standard deviation to the mean ofa probability distribution, indicating the extent of variabilityin relation to the mean of the population) of±30 %,±80 %,±100 %,±150 %, and±300 %, respectively. For example,the activity levels derived directly from statistics were ratedas level I, and those calculated using nonstatistical data andempirical conversion factors were rated as level V. The un-certainties of emission factors were also rated from level Ito level V, with the corresponding CVs of±50 %, ±80 %,±150 %,±300 %, and±500 %, respectively. The emissionfactors for the sources with stable emission rates and over 10local field measurements were rated as level I, while a ratingof level V was assigned when the emission factors for sim-ilar sources were applied due to the lack of measurements.With the determined probability distribution of the activitydata and emission factors of each source, the Monte Carlomethod was used to propagate these uncertainties into an un-certainty for the total inventory. Table S5 shows the calcu-lated uncertainties by sector.
During 2005–2010, the average 90 % confidence intervalof the total NOx emissions is [−31 %, 44 %]. The CV is±25 % on average. The uncertainties of emissions vary withemission sectors (see Supplement Table S5), attributable tothe different magnitudes of uncertainties associated with ac-tivity levels and emission factors. Open biomass burning hasthe largest CV (±177 %) because both the activity levels andthe emission factors are quite uncertain. The transportationsector has the second highest uncertainty (CV= ±66 %), asits fuel consumption is calculated from vehicle population,annual average mileage traveled, and fuel economy, ratherthan from energy statistics.
The average 90 % confidence interval and CV of the totalSO2 emissions are [−29 %, 45 %] and±28 %, respectively,during 2005–2010. Similar to that of NOx emissions, the SO2emissions from open biomass burning have the highest un-certainty (CV= ± 179 %). The uncertainties of the indus-trial, residential, and transportation sectors are quite close toeach other, with CVs in the range of±48–± 51 %.
During 2005–2010, the average 90 % confidence intervaland CV of the total PM2.5 emissions are [−39 %, 49 %] and±39 %, respectively. Open biomass burning is the sector sub-ject to the highest uncertainty (CV= ±216 %). The residen-tial sector has the second highest uncertainty due to the rela-tively few emission factor measurements for coal stoves andbiomass stoves, the dominant PM2.5 emission sources of thissector.
The average 90 % confidence interval and CV of the to-tal NMVOC emissions are [−42 %, 67 %] and±42 %, re-spectively. The “other sectors”, which include open biomassburning (contributing over 80 % of NMVOC emissions inthis category), waste treatment, cooking, and smoking, have
the highest uncertainty (CV= ±184 %). This is followed bysolvent use (CV= ±78 %), for which the activity levels arenot directly available from official statistics and emission fac-tor measurements are lacking. The CVs for the industrial,residential, and transportation sectors are all within the rangeof ±57–± 65 %.
It can be seen that NMVOC is the pollutant subject tothe highest uncertainty, followed by PM2.5. The high uncer-tainty of NMVOC emissions is mainly attributable to the lackof local measurements for many industrial and solvent usesources. The higher uncertainties of PM2.5 emissions com-pared with NOx and SO2 result from the larger uncertain-ties in the emission factors (e.g., uncertainties in the emissionfactors of industrial fugitive dust and in the removal efficien-cies of dust collectors), and a relatively large share of emis-sions from small-scale emission sources (e.g., coal stoves andbiomass stoves).
3 Future emission scenarios for air pollutants
To quantify the effects of various measures on future air pol-lutant emissions, in this study we developed emission sce-narios for SO2, NOx, PM, and NMVOC based on energy-saving policies and end-of-pipe control strategies. The sce-narios are developed with the same model structure as thatused for the estimation of historical emissions developed inour previous paper (Zhao et al., 2013c). The energy servicedemand is estimated based on driving forces (e.g., GDP andpopulation). The future technology distribution and energyefficiencies are assumed and the energy consumption is cal-culated accordingly. Both historical and future emissions arederived from energy consumption, emission factors, and as-sumptions on the penetration of control technologies. For de-tails, see Zhao et al. (2013c).
We developed two energy scenarios, a business-as-usualscenario (BAU) and an alternative policy scenario (PC). TheBAU scenario is based on current regulations and imple-mentation status (as of the end of 2010). In the PC sce-nario, we assume the introduction and strict enforcement ofnew energy-saving policies, including ones leading to a moreenergy-conserving lifestyle, structural adjustment, and en-ergy efficiency improvement. Energy-conserving lifestyle isdefined by a slower growth of energy service demand thatwould result from less building area, a smaller vehicle pop-ulation, and reduced consumption of energy-intensive indus-trial products, electricity, and heat. Structural adjustment in-cludes promotion of clean and renewable fuels and energy-efficient technologies. Examples include renewable energysources and combined heat and power (CHP) for powerplants and heat supply, arc furnaces and large precalcinerkilns for the industrial sector, biogas stoves and heat pumpsfor the residential sector, and electric and biofuel vehiclesfor the transportation sector. Energy efficiency improvement
www.atmos-chem-phys.net/14/6571/2014/ Atmos. Chem. Phys., 14, 6571–6603, 2014

6586 S. X. Wang et al.: Emission trends and mitigation options for air pollutants in East Asia
refers to the improvement of the energy efficiencies of indi-vidual technologies.
We developed three end-of-pipe control strategies for eachenergy scenario, including baseline (abbreviated as [0]), pro-gressive [1], and maximum feasible control [2], thereby con-stituting six emission scenarios (BAU[0], BAU[1], BAU[2],PC[0], PC[1], and PC[2]). The baseline control strategy [0]assumes that all current pollution control regulations (as ofthe end of 2010) and the current implementation status wouldbe followed during 2011–2030. Control strategy [1] assumesthat new pollution control policies would be released and im-plemented in China, representing a progressive approach to-wards future environmental policies. For other countries, weassume the same controls as strategy [0]. Control strategy [2]assumes that technically feasible control technologies wouldbe fully applied by 2030, regardless of the economic cost.The definition of the energy scenarios and emission scenar-ios are summarized in Table 1.
In this paper we focus on the development of energy sce-narios and emission scenarios for China. The scenarios forother countries are adapted from those developed by IIASAin a project funded by United Nations Environment Pro-gramme (UNEP) and World Meteorological Organization(WMO) (Shindell et al., 2012; UNEP and WMO, 2011).Both the energy consumption and air pollutant emissionswere calculated with a five-year time step, although the pa-rameters and results are presented for selected years only.Detailed assumptions of the energy scenarios and emissionscenarios are documented below.
3.1 Development of energy scenarios
For countries other than China, our BAU and PC scenariosare consistent with the energy pathways of the reference and450 ppm scenarios in Shindell et al. (2012) and in UNEPand WMO (2011), which were based on the reference and450 ppm scenarios presented in the World Energy Outlook2009 (IEA, 2009), respectively. While the reference scenariois based on current energy and climate-related policies, the450 ppm scenario explores the global energy consumption ifcountries take coordinated action to restrict the global tem-perature increase to 2◦C. The details of energy scenarios aredescribed in Shindell et al. (2012), UNEP and WMO (2011)and IEA (2009).
For China, we have developed two energy scenarios thatare consistent with our previous paper (Zhao et al., 2013c).Presented below is a brief description of the assumptions andresults of the energy scenarios; see Zhao et al. (2013c) fordetailed information. Note that because that paper focusedon the emission trends of NOx, it did not project activity datain terms of fossil fuel distribution (included in the industrialsector for this study) nor the use of solvents. These two pro-jections are incorporated below.
We assume that the annual average GDP growth rate willdecrease gradually from 8.0 % during 2011–2015 to 5.5 %
during 2026–2030. The national population is projected toincrease from 1.34 billion in 2010 to 1.44 billion in 2020 and1.47 billion in 2030, and the urbanization rate (proportion ofpeople in urban areas) is assumed to increase from 49.95 %in 2010 to 58 and 63 % in 2020 and 2030, respectively.
The total electricity production is projected to be 10–12 %lower in the PC scenario than that of the BAU scenario.The PC scenario considers aggressive development plans forclean and renewable energy power generation; therefore, theproportion of electricity production from coal-fired powerplants is expected to decrease to 57 % in 2030 in the PC sce-nario, contrasted with 73 % in the BAU scenario.
We applied an elasticity coefficient method for the estima-tion of future production of industrial products, the governingequation of which is as follows:
Yt1 = Yt0
(dvt1
dvt0
)δ
(1)
where, t0, t1 are time periods, e.g.,t0 = 2010, andt1 =
2030; Y is the yield of a specific industrial product; dv isthe driving force, namely sectoral value added or population;andδ is the product-specific elasticity coefficient. The val-ues ofδ are determined through (1) historical trends during1995–2010; (2) the experience of developed countries; and(3) projections of industrial associations. Generally speak-ing, production of most energy-intensive commodities usedin construction of infrastructure are expected to increase un-til 2020, and then to stabilize or even decline after 2020,whereas products associated with household consumptionare expected to increase through 2030, although at a declin-ing rate. We projected lower production of industrial prod-ucts in the PC scenario than those of the BAU scenariobecause of more energy-conserving lifestyles. The penetra-tions of less energy-intensive technologies are assumed to behigher in the PC scenario than the BAU scenario.
For the residential sector, China’s building area per capitain the PC scenario is expected to be 3–4 m2 lower than thatof the BAU scenario in both urban and rural areas. The heat-ing energy demand per unit area is somewhat lower in ourPC scenario because of the implementation of new energy-conservation standards in the design of buildings. Replace-ment of coal and direct biomass burning with clean fuels areassumed in both urban and rural areas, with faster progressin the PC scenario.
The vehicle population per 1000 persons is projected at380 and 325 in the BAU and PC scenarios, respectively. ThePC scenario also assumes aggressive promotion of electricvehicles, and a progressive implementation of new fuel effi-ciency standards, resulting in 33 and 57 % improvement inthe fuel economy of new passenger cars and new heavy-dutyvehicles by 2030.
The increase of fossil fuels stored and distributed is ex-pected to be consistent with the increase of total fuel con-sumption in the future. The gasoline or diesel sold at service
Atmos. Chem. Phys., 14, 6571–6603, 2014 www.atmos-chem-phys.net/14/6571/2014/

S. X. Wang et al.: Emission trends and mitigation options for air pollutants in East Asia 6587
stations is expected to have the same growth rate as fuel con-sumption in the transportation sector. Therefore, the activitylevels of fossil fuel distribution are derived from the projec-tions of fuel consumption.
The activity data for the solvent use sector are the con-sumption of products containing solvents. The forecast ap-proach, which is consistent with Wei et al. (2011b), isillustrated as follows:
At1 =
∑j
(At0,j ×
Yt1,j
Yt0,j
)(2)
where, t0, t1 are time periods, e.g.,t0 = 2010, andt1 =
2030; j represents the industries using a specific solventproduct;At1 is the consumption of this solvent product inthe yeart1; At0,j is the consumption of this solvent productin industryj in the yeart0; Yt0,j andYt1,j are the yields ofthe major products (e.g., crude steel for the iron and steel in-dustry) for industryj in the yeart0 andt1, respectively. Theyields of industrial products were projected using the elastic-ity coefficient method as described above.
Table 7 shows current and future energy consumption inEast Asia. Total energy consumption in East Asia was 123 EJin 2005 and 161 EJ in 2010. The energy consumption ofChina accounts for 69–76 % of the total energy amount dur-ing 2005–2010, followed by 13–18 % for Japan, and about7 % for South Korea. By 2030, the total energy consumptionis projected to increase to 243 EJ under the BAU scenarioand to 195 EJ under the PC scenario, 51 and 21 % higherthan that of 2010.
Of all the countries, China is expected to experience thefastest growth rate in energy consumption. By 2030, China’senergy consumption is projected to increase by 64 and 27 %from the 2010 level in BAU and PC scenarios, respectively.Industry fuel consumption is expected to increase notablyslower than the total fuel use in both scenarios, resulting fromthe structural economic adjustment. In contrast, the energyconsumption of transportation is projected to increase dra-matically by 200 and 101 % in the BAU and PC scenarios, re-spectively, measured in 2030 against the 2010 levels, drivenby the swift increase in vehicle population. The growth rateof energy consumption in other sectors is close to that of thetotal amount. Because of the energy-saving measures, the en-ergy consumption of power plants, industry, residential, andtransportation sectors in the PC scenario are 18, 19, 27, and33 % lower than the BAU scenario, respectively. Coal contin-ues to dominate China’s energy mix, but the proportion de-creases from 68 % in 2010 to 60 and 52 % in 2030 under theBAU and PC scenarios, respectively. In contrast, the sharesof natural gas and “other renewable energy and nuclear en-ergy” are estimated to increase from 3.4 and 7.5 % in 2010 to5.5 and 8.9 % in 2030 under the BAU scenario, and 9.3 and15.8 % under the PC scenario, respectively.
We assume a ban of open biomass burning in theBAU[2]/PC[2] scenarios.
3.2 Future emission trends and effects of controlmeasures
The air pollutant emissions in each scenario are estimatedbased on the assumptions in Sects. 3.1 and Sect. 3.2. Table 8shows the national air pollutant emissions in East Asia un-der each scenario. Figure 2 shows the emissions by sectorin China, and Fig. 3 shows the emissions by sector in Japanand South Korea. Supplement Table S4 shows the provincialemissions in China.
3.2.1 NOx
Under current regulations and implementation status (theBAU[0] scenario), NOx emissions in East Asia are projectedto increase by 28 % in 2030 from the 2010 levels. The im-plementation of assumed energy-saving measures (reflectedby the difference between the BAU[0] and the PC[0] scenar-ios) and progressive end-of-pipe control measures (reflectedby the difference between the PC[0] and the PC[1] scenar-ios) are expected to reduce NOx emissions by 28 and 36 %,respectively, from the baseline projection (the BAU[0] sce-nario). With the full enforcement of technically feasible con-trol measures (the PC[2] scenario), the remaining emissionsaccount for only 21 % of the baseline projection, or 27 % ofthe 2010 levels.
China’s emission growth potential under current regula-tions (36 %) is significantly larger than the average of EastAsia (28 %), resulting from a great increase in energy con-sumption and weak existing control measures. China’s sharein East Asia’s NOx emissions would increase to 93 % underthe baseline projection. The enforcement of energy-savingmeasures (the PC[0] scenario) leads to a 29 % reduction fromthe baseline projection. With the implementation of the 12thFive-Year Plan and slowly strengthened end-of-pipe con-trol policies after 2015 (reflected by the difference betweenthe PC[0] and the PC[1] scenarios), China’s NOx emissionscould be reduced by nearly 40 % (compared to the baselineprojection). The most effective control measures are the in-stallation of SCR and SNCR and the application of strin-gent vehicle standards, which together achieve nearly 80 %of this reduction. The full application of technically feasiblecontrol measures (the PC[2] scenario) could reduce China’sNOx emissions to 20 % of the baseline projection, or 28 % ofthe 2010 levels. It should be noted that the NOx emissionsare projected at 22.9 Mt in 2015 under the BAU[1] scenario,12.2 % lower than that of 2010. This implies that if the con-trol policies in the 12th Five-Year Plan can be implementedsuccessfully (as assumed in the BAU[1] scenario), the na-tional target to reduce the NOx emissions by 10 % during2011–2015 would be achieved.
By 2030, the energy consumption of East Asia other thanChina is projected to increase slightly by 12 and 2 % over the2010 level in the BAU and PC scenarios, respectively. Undercurrent policies, Japan’s energy consumption is projected to
www.atmos-chem-phys.net/14/6571/2014/ Atmos. Chem. Phys., 14, 6571–6603, 2014
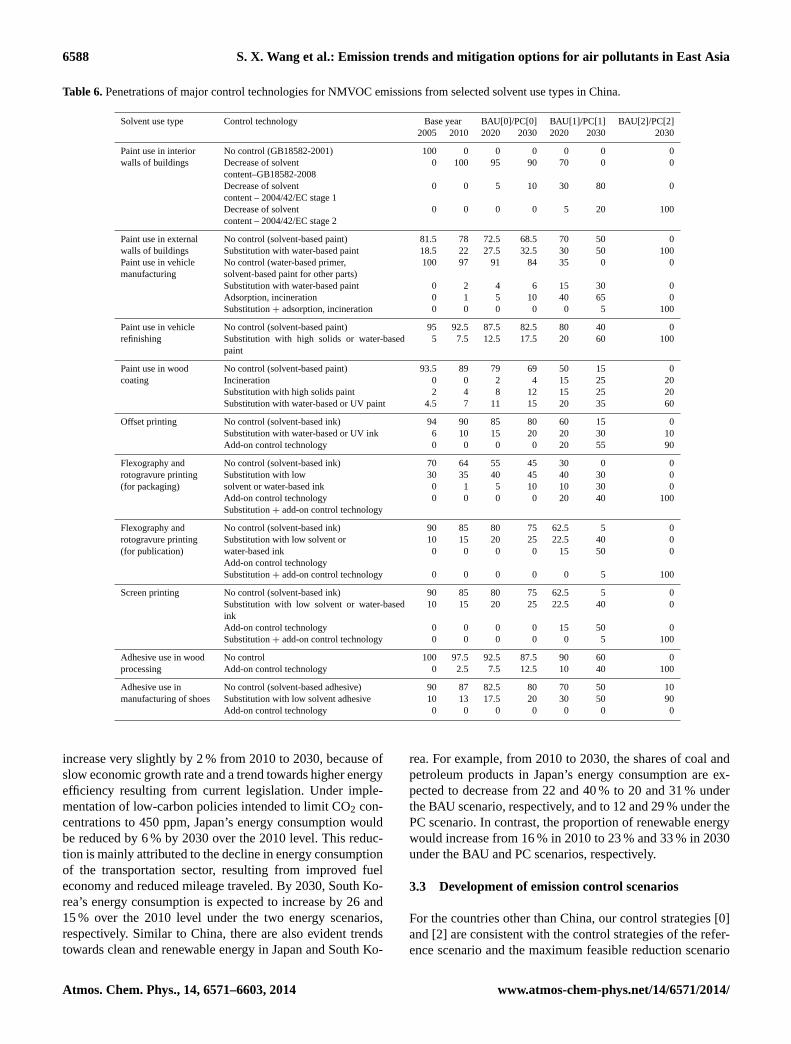
6588 S. X. Wang et al.: Emission trends and mitigation options for air pollutants in East Asia
Table 6.Penetrations of major control technologies for NMVOC emissions from selected solvent use types in China.
Solvent use type Control technology Base year BAU[0]/PC[0] BAU[1]/PC[1] BAU[2]/PC[2]2005 2010 2020 2030 2020 2030 2030
Paint use in interior No control (GB18582-2001) 100 0 0 0 0 0 0walls of buildings Decrease of solvent
content–GB18582-20080 100 95 90 70 0 0
Decrease of solventcontent – 2004/42/EC stage 1
0 0 5 10 30 80 0
Decrease of solventcontent – 2004/42/EC stage 2
0 0 0 0 5 20 100
Paint use in external No control (solvent-based paint) 81.5 78 72.5 68.5 70 50 0walls of buildings Substitution with water-based paint 18.5 22 27.5 32.5 30 50 100Paint use in vehiclemanufacturing
No control (water-based primer,solvent-based paint for other parts)
100 97 91 84 35 0 0
Substitution with water-based paint 0 2 4 6 15 30 0Adsorption, incineration 0 1 5 10 40 65 0Substitution+ adsorption, incineration 0 0 0 0 0 5 100
Paint use in vehicle No control (solvent-based paint) 95 92.5 87.5 82.5 80 40 0refinishing Substitution with high solids or water-based
paint5 7.5 12.5 17.5 20 60 100
Paint use in wood No control (solvent-based paint) 93.5 89 79 69 50 15 0coating Incineration 0 0 2 4 15 25 20
Substitution with high solids paint 2 4 8 12 15 25 20Substitution with water-based or UV paint 4.5 7 11 15 20 35 60
Offset printing No control (solvent-based ink) 94 90 85 80 60 15 0Substitution with water-based or UV ink 6 10 15 20 20 30 10Add-on control technology 0 0 0 0 20 55 90
Flexography and No control (solvent-based ink) 70 64 55 45 30 0 0rotogravure printing Substitution with low 30 35 40 45 40 30 0(for packaging) solvent or water-based ink 0 1 5 10 10 30 0
Add-on control technologySubstitution+ add-on control technology
0 0 0 0 20 40 100
Flexography and No control (solvent-based ink) 90 85 80 75 62.5 5 0rotogravure printing Substitution with low solvent or 10 15 20 25 22.5 40 0(for publication) water-based ink
Add-on control technology0 0 0 0 15 50 0
Substitution+ add-on control technology 0 0 0 0 0 5 100
Screen printing No control (solvent-based ink) 90 85 80 75 62.5 5 0Substitution with low solvent or water-basedink
10 15 20 25 22.5 40 0
Add-on control technology 0 0 0 0 15 50 0Substitution+ add-on control technology 0 0 0 0 0 5 100
Adhesive use in wood No control 100 97.5 92.5 87.5 90 60 0processing Add-on control technology 0 2.5 7.5 12.5 10 40 100
Adhesive use in No control (solvent-based adhesive) 90 87 82.5 80 70 50 10manufacturing of shoes Substitution with low solvent adhesive 10 13 17.5 20 30 50 90
Add-on control technology 0 0 0 0 0 0 0
increase very slightly by 2 % from 2010 to 2030, because ofslow economic growth rate and a trend towards higher energyefficiency resulting from current legislation. Under imple-mentation of low-carbon policies intended to limit CO2 con-centrations to 450 ppm, Japan’s energy consumption wouldbe reduced by 6 % by 2030 over the 2010 level. This reduc-tion is mainly attributed to the decline in energy consumptionof the transportation sector, resulting from improved fueleconomy and reduced mileage traveled. By 2030, South Ko-rea’s energy consumption is expected to increase by 26 and15 % over the 2010 level under the two energy scenarios,respectively. Similar to China, there are also evident trendstowards clean and renewable energy in Japan and South Ko-
rea. For example, from 2010 to 2030, the shares of coal andpetroleum products in Japan’s energy consumption are ex-pected to decrease from 22 and 40 % to 20 and 31 % underthe BAU scenario, respectively, and to 12 and 29 % under thePC scenario. In contrast, the proportion of renewable energywould increase from 16 % in 2010 to 23 % and 33 % in 2030under the BAU and PC scenarios, respectively.
3.3 Development of emission control scenarios
For the countries other than China, our control strategies [0]and [2] are consistent with the control strategies of the refer-ence scenario and the maximum feasible reduction scenario
Atmos. Chem. Phys., 14, 6571–6603, 2014 www.atmos-chem-phys.net/14/6571/2014/

S. X. Wang et al.: Emission trends and mitigation options for air pollutants in East Asia 6589
Table 7.Summary of national energy consumption in East Asia (Unit: EJ/year−1).
2005 2010 BAU PC2020 2030 2020 2030
China, mainland 85.31 121.75 169.41 199.55 144.39 155.01Power plants 18.87 25.52 37.45 43.93 32.23 36.07Other conversion 3.11 5.30 5.98 6.49 5.07 4.84Industry 37.79 58.16 73.64 81.68 62.83 66.51Residential 18.12 20.79 28.05 32.78 22.96 24.01Transportation 6.73 11.00 22.91 33.02 20.04 22.11Loss 0.69 0.98 1.37 1.64 1.26 1.46Coal 58.01 82.93 106.83 118.80 83.84 80.31Oil 12.48 18.28 33.36 45.31 28.62 29.68Gas 1.80 4.19 7.87 10.99 8.40 14.35Biomass 7.60 7.21 7.35 6.74 6.30 6.21Other renewables and nuclear 5.43 9.15 14.01 17.71 17.24 24.45
Japan 22.03 21.36 21.78 21.86 20.93 20.09Power plants 5.59 5.22 5.63 6.07 5.54 5.35Other conversion 1.62 2.25 2.27 2.21 2.13 1.93Industry 5.61 5.32 5.62 5.57 5.45 5.30Residential 5.03 4.86 5.17 5.48 5.02 5.28Transportation 4.17 3.71 3.10 2.53 2.80 2.23Coal 4.23 4.79 4.73 4.47 4.46 2.45Oil 9.97 8.47 7.45 6.70 6.78 5.84Gas 3.79 4.33 4.92 5.12 4.43 4.46Biomass 0.29 0.30 0.42 0.54 0.50 0.68Other renewables and nuclear 3.76 3.50 4.30 5.07 4.82 6.68
South Korea 8.90 10.59 12.33 13.31 11.81 12.22Power plants 2.33 2.85 3.52 4.00 3.40 3.65Other conversion 0.48 0.98 1.03 1.03 0.95 0.89Industry 3.01 3.58 3.99 4.17 3.87 3.95Residential 1.71 1.83 2.19 2.40 2.11 2.25Transportation 1.37 1.34 1.61 1.70 1.48 1.49Coal 2.05 3.17 3.22 3.31 3.00 1.75Oil 3.90 4.10 4.43 4.45 4.26 4.16Gas 1.23 1.59 2.16 2.29 1.93 2.13Biomass 0.09 0.13 0.19 0.28 0.22 0.37Other renewables and nuclear 1.62 1.64 2.37 3.02 2.49 3.91
North Korea 1.42 1.55 1.95 2.51 1.90 1.96
Mongolia 0.12 0.09 0.08 0.08 0.06 0.04
Hong Kong & Macao 0.76 0.93 1.30 1.39 1.16 1.08
Taiwan 4.43 4.24 4.27 4.43 3.94 4.16
Total 122.97 160.51 211.12 243.13 184.20 194.57
Total (except mainland China) 37.66 38.75 41.70 43.59 39.80 39.56
in UNEP and WMO (2011), respectively. While control strat-egy [1] assumes that new pollution control policies wouldbe implemented progressively in China, it has the same as-sumptions as control strategy [0] for the other countries forthe following reasons: (1) China accounts for 88, 94, 94, 95,and 88 % of the total NOx, SO2, PM10, PM2.5, and NMVOCemissions in East Asia in 2010; (2) Japan and South Korea al-
ready have stringent environmental policies in the base year,and the progressive control strategy for countries other thanChina will have negligible effect on the regional outcomes.The major assumptions underlying control strategies [0] and[2] are straightforward: [0] assumes current regulations andimplementation status, while [2] assumes full application ofbest available technologies in the world. Therefore, in the
www.atmos-chem-phys.net/14/6571/2014/ Atmos. Chem. Phys., 14, 6571–6603, 2014
6590 S. X. Wang et al.: Emission trends and mitigation options for air pollutants in East Asia
following text, we will focus on the assumptions for Chinaand omit details for other countries. The penetrations of ma-jor control technologies in China, Japan, and South Korea aresummarized in Table 2 through Table 5.
3.3.1 Power plants
As documented in Sect. 2.2.1, the recently released 12thFive-Year Plan set specific targets and proposed detailedtechnological roadmaps for the reduction of SO2 and NOxemissions from power plants. The government did not seta total PM emission target, but rather a strict in-stack PMconcentration standard in 2011 (30 mg m−3 for the entirecountry except for 20 mg m−3 in key regions, as defined inSect. 2.2.2). Power plants burning coal with low ash con-tent could attain the 30 mg m−3 threshold by installing ESPand wet-FGD simultaneously. For units burning coal withhigh ash content, or when the 20 mg m−3 threshold applies,HEDs (including FF and electrostatic-fabric integrated pre-cipitators) would be the only commercially available controltechnology.
The BAU[0]/PC[0] scenarios consider only the controlpolicies released before the end of 2010. In other words, NOxand PM emissions are mainly controlled with LNB and ESP,respectively. The penetration of FGD would increase quiteslowly. The BAU[1]/PC[1] scenarios are based on the 12thFive-Year Plan (including the 2011 emission standards for2011–2015) and the assumption that high-efficiency controltechnologies will continue to spread gradually after 2015.The penetration of FGD in coal-fired units is assumed to ap-proach 100 % by 2015. All newly built thermal power plantswill be equipped with low-NOx combustion technologies andflue gas denitrification (SCR or SNCR) from 2011 onwards.Existing thermal power plants will be upgraded with low-NOx combustion technologies, and large units (≥ 300 MW)will be upgraded with SCR or SNCR during 2011–2015. Se-lective catalytic reduction and SNCR will gradually spreadto smaller units after 2015. More ambitious measures willbe required in the key regions. For PM, HED will spreadmuch more rapidly, with its share in coal-fired units ap-proaching 35 and 50 % in 2020 and 2030, respectively. Inthe BAU[2]/PC[2] scenarios, the best available technologies(i.e., FGD for SO2, LNB+SCR for NOx, and HED for PM)are assumed to be fully applied by 2030. Table 2 gives the na-tional average penetration of control technologies. Note thatthe penetrations in the key regions are usually larger thanthose of other regions.
3.3.2 Industrial sector
The latest national emission standards for industrial boilerswere released in 2001 (GB13271-2001), although severalprovinces including Beijing and Guangdong have recentlyissued local standards. As the BAU[0]/PC[0] scenarios arebased only on current regulations, i.e., nearly no measures
implemented for controlling SO2 and NOx emissions, andWET remains dominant control technology for PM emis-sions. The BAU[1]/PC[1] scenarios are based on the 12thFive-Year Plan during 2011–2015; progressive control mea-sures would be enforced after 2015 as an extension of the12th Five-Year Plan. For SO2, FGD systems are assumed tobe widely deployed, penetrating 20, 40, and 80 % of the to-tal capacity by 2015, 2020, and 2030, respectively. For NOx,LNB will be required at newly built industrial boilers, andexisting boilers in the key regions will begin to be retrofittedwith LNB during 2011–2015. The vast majority of existingboilers are expected to be equipped with LNB by 2020. ForPM, ESP and HED will be gradually deployed to replace theless efficient WET. In the BAU[2]/PC[2] scenarios, the mostefficient removal technologies, including FGD, LNB+SCR,and HED, will be fully applied.
The emissions from industry processes (i.e., other thanboilers) were mainly regulated by the Emission Standard forIndustrial Kilns and Furnaces before 2010. Standards for spe-cific industries were only issued for cement plants (GB4915-2004) and coke ovens (GB16171-1996). However, new emis-sion standards for a variety of industries were rapidly issuedduring 2010–2012, which may significantly alter their futureemission pathways.
A series of new emission standards for the iron and steelindustry was released in 2012, including the standards forsintering, iron production, steel production, steel rolling, andother processes. Sintering is the main source of SO2 andNOx emissions in the iron and steel industry, and also an im-portant source of PM emissions. Installation of wet-FGD isrequired in order to attain the SO2 concentration standard,and the 12th Five-Year Plan also requires large-scale deploy-ment of FGD. The threshold for NOx concentration can beattained without additional control technologies, but the 12thFive-Year Plan requires newly built sintering facilities to beequipped with SCR or SNCR. Most sintering plants can meetthe PM threshold with simultaneous installation of FGD andESP, but HED is required for those in key regions and thosewith poor raw material quality. The BAU[0]/PC[0] scenar-ios assume only the continuation of the control regulationsas of 2010. The BAU[1]/PC[1] scenarios are developed onthe basis of the 2012 standard and the 12th Five-Year Plan.Flue gas desulfurization would be installed at most sinter-ing facilities, and SCR or SNCR at newly built ones during2011–2015; the penetrations would increase gradually after-wards. While ESP remains the dominant PM-removal tech-nology, it is assumed that HED will be deployed gradually.Flue gas desulfurization, SCR, and HED would be fully ap-plied in the BAU[2]/PC[2] scenarios. Blast furnaces (for pigiron production) in China are usually equipped with washingtowers and double venturi scrubbers, which currently remainthe best available technologies. The 2012 emission standardsfor steel production (with basic oxygen furnaces and electricarc furnaces being the major technologies) imply that low ef-ficiency WET should be phased out, and HED needs to be
Atmos. Chem. Phys., 14, 6571–6603, 2014 www.atmos-chem-phys.net/14/6571/2014/
S. X. Wang et al.: Emission trends and mitigation options for air pollutants in East Asia 6591
installed for newly built facilities. While the BAU[0]/PC[0]scenarios assume emission standards from before 2010, theBAU[1]/PC[1] scenarios assume the retirement of WET andgradual promotion of HED, according to the 2012 emissionstandard. The BAU[2]/PC[2] scenarios assume full utiliza-tion of HED.
Current emission standards for the cement industry werereleased in 2004. The SO2 and NOx standards can be metwithout additional control measures, and the PM standardcan be met with both ESP and HED. Therefore, we as-sume the control technology mix of 2010 would remainthe same as in the BAU[0]/PC[0] scenarios. In 2012, MEPpublished new draft of emission standards for public com-ment. As a cement clinker can absorb most SO2 produceddue to its basic chemistry, even the strengthened SO2 limitmay be attained under favorable technical conditions. Theattainment of the NOx limit requires upgrading with low-NOx combustion technology for existing kilns (or installa-tion of SNCR as an alternative), and simultaneous utiliza-tion of low-NOx combustion technology and SCR/SNCRfor new kilns. The BAU[1]/PC[1] scenarios are based onthe 2012 draft standard and the 12th Five-Year Plan. Newlybuilt precalciner kilns (mostly≥ 4000 t d−1) are required tobe equipped with SCR/SNCR, and existing precalciner kilnsshould be retrofitted with low-NOx combustion technologyduring 2011–2015. Selective catalytic reduction/SNCR areassumed to continue to spread gradually after 2015. HEDwould be deployed gradually to meet the strengthened PMthreshold for new kilns. The BAU[2]/PC[2] scenarios assumefull application of desulfurization facilities, LNB+SCR, andHED.
As for coke ovens, we assume no control measures forSO2 and NOx emissions, and continuous application of WETfor PM emissions in the BAU[0]/PC[0] scenarios. In theBAU[1]/PC[1] scenarios, we assume the installation of FGDin the coal-charging process or coke oven gas exhaust fornewly built plants (contributing about 50 and 30 % of emis-sions, respectively) to meet the requirement of a new stan-dard issued in 2012 (GB16171-2012). In addition, new plantsare assumed to be equipped with HED, also required by thenew standard. The BAU[2]/PC[2] scenarios assume full ap-plication of the best desulfurization, denitrification, and PMremoval facilities available.
As for glass production, the BAU[0]/PC[0] scenarios as-sume no control measures for SO2 and NOx emissions,and the current mix of PM removal technologies. TheBAU[1]/PC[1] scenarios are designed according to the newemission standards released in 2011, though they are en-forced leniently because of difficulty in implementation. Fluegas desulfurization, as well as end-of-pipe NOx control tech-nologies (typically oxy-fuel combustion technology (OXFL)or SCR), would be applied gradually at both existing andnew plants. Outdated PM removal technologies, e.g., WET,would be phased out. For the brick industry, emissions fromabout 30 % of plants remain uncontrolled in 2010. In 2009 a
draft of new emission standards call for a PM removal effi-ciency of over 60 % at existing plants, and over 80 % at newplants. In the BAU[1]/PC[1] scenarios, PM emissions frombrick plants are assumed to be controlled according to thestandard, though enforced leniently due to inspection diffi-culty.
To attain the new emission standards for the nitric acidindustry (GB26131-2010), the dual-pressure process wouldbe equipped with absorption technologies (ABSP) or SCR,while other processes need to adopt both ABSP and SCR.The BAU[0]/PC[0], BAU[1]/PC[1] and BAU[2]/PC[2] sce-narios assume the technology mix of 2010, lenient enforce-ment of the new standard, and stringent enforcement of thenew standard, respectively.
In the BAU[0]/PC[0] scenarios, we assume the emissionstandards for gasoline distribution (GB20950, GB20951, andGB20952) would continue to be enforced in the future. Inthe BAU[1]/PC[1] scenarios, the enforcement of Stage IA,Stage IB, and Stage II controls would be extended to all ofChina, and IFC would be applied for both newly built andexisting storage tanks. In addition, similar control technolo-gies would be applied for crude oil distribution. As a result,the application rate of IFC, Stage IA, and Stage IB+Stage IIcontrol measures in gasoline storage and distribution wouldapproach 75 and 100 % by 2020 and 2030, respectively. Theapplication rate in crude oil distribution would be 25 and50 % by 2020 and 2030, respectively (see Table 4). For theBAU[2]/PC[2] scenarios, these control measures would befully applied by 2030.
For other industries with NMVOC emissions, nearly nocontrol measures are assumed for the BAU[0]/PC[0] sce-narios. In the BAU[1]/PC[1] scenarios, we assume that newNMVOC emission standards (similar to or slightly less strin-gent than the EU Directives 1999/13/EC and 2004/42/EC,depending on specific industry) will be released and imple-mented in key regions as of 2015, and in other provincesas of 2020. Afterwards, the emission standards will becomemore stringent gradually (see Table 4). In terms of technolo-gies, we assume application of basic management techniques(e.g., leakage detection and repair for refineries and improvedsolvent management in paint production) where they are ap-plicable. End-of-pipe controls (condensation, adsorption, ab-sorption, and incineration) are adopted when high removalrate is required. The penetration of selected control measuresassumed for key sources are summarized in Table 4.
3.3.3 Residential sector
Emission control policies have seldom been proposed forthe residential sector in China. In the BAU[0]/PC[0] sce-narios, we assume no control measures except for the con-tinued application of CYC and WET for residential boilers.In BAU[1]/PC[1], HED and low-sulfur-derived coal are as-sumed to be deployed gradually, both penetrating 20 and40 % of the total capacity by 2020 and 2030, respectively.
www.atmos-chem-phys.net/14/6571/2014/ Atmos. Chem. Phys., 14, 6571–6603, 2014
6592 S. X. Wang et al.: Emission trends and mitigation options for air pollutants in East Asia
In addition, we assume gradual adoption of advanced coalstoves and advanced biomass stoves (e.g., those with moreefficient combustion or catalytic devices) where applica-ble, which reduce emissions of PM and NMVOC. TheBAU[2]/PC[2] scenarios assume the application of bestavailable technology without considering economic cost.
3.3.4 Transportation sector
In the BAU[0]/PC[0] scenarios, only the existing standards(released before the end of 2010) are considered. In theBAU[1]/PC[1] scenarios, all of the current standards in Eu-rope are assumed to be implemented in China gradually, andthe time intervals between the releases of standard stageswould be a little shorter than those of Europe. The implemen-tation timeline of the emission standards is given in Fig. 1.The removal efficiencies of the future emission standards arefrom the GAINS-Asia model of IIASA (Amann et al., 2008,2011). The BAU[2]/PC[2] scenarios assume the same imple-mentation timeline for new standards as the BAU[1]/PC[1]scenario. In addition, old vehicles with high emissions arephased out at a faster pace through compulsory measures andeconomic subsidies. The proportions of vehicles subject todifferent emission standards are summarized in Table 5.
3.3.5 Solvent use and open biomass burning
For emissions from solvent use, the BAU[0]/PC[0] scenar-ios consider only several national standards limiting theNMVOC content of some solvent products (see Sect. 2.2.5).Major assumptions for the BAU[1]/PC[1] scenarios areconsistent with the NMVOC emission sources in the in-dustrial sector, i.e., implementation of the EU Directives1999/13/EC and 2004/42/EC as of 2015–2020, followedby gradually strengthened regulations afterwards. Potentialmitigation measures to attain the European standards differgreatly for different emissions sources because of variousspraying technologies and chemical properties of the sol-vent used. However, similar to the industrial sources, thesemeasures can be categorized into two kinds: use of environ-mentally friendly substitutes (e.g., water-based or UV prod-ucts) or end-of-pipe control technologies. Substitution mea-sures are assumed where applicable, while end-of-pipe con-trol technologies would be mainly installed in newly builtfactories. The penetration of selected control measures as-sumed for key sources are summarized in Table 6.
Under current regulations and implementation status, theNOx emissions in East Asia other than China are expectedto decrease by 27 %, with especially rapid decline in Japan(47 %) and South Korea (34 %). The decrease is mainly at-tributable to the continuously increasing proportion of ve-hicles subject to stringent emission standards. With the en-forcement of energy-saving policies intended to limit globaltemperature increase to 2◦C (reflected by the difference be-tween the BAU[0] and the PC[0] scenarios), NOx emissions
in East Asia outside of China, and of the two major energyconsumers therein (Japan and South Korea), are all expectedto decline by 15–17 % in 2030 compared with the baselineprojection. These policies are most effective in the powersector, due to negligible emissions from renewable and nu-clear power generation compared with traditional coal-firedpower. The full application of technically feasible controlmeasures (the PC[2] scenario) would reduce the NOx emis-sions in East Asia except China, and Japan and South Koreaindividually to only 30, 46 and 30 % of the baseline projec-tion, or 22, 24 and 20 % of the 2010 levels, respectively.
3.3.6 SO2
The SO2 emissions in East Asia are predicted to grow 24 %from 2010 to 2030 under current regulations and implemen-tation status (the BAU[0] scenario). The enforcement of ad-vanced energy-saving measures (the PC[0] scenario) couldlead to a substantial 36 % reduction in SO2 emissions fromthe baseline projection, exceeding the effect of progressivelyimplemented end-of-pipe control measures, 25 % (reflectedby the difference between the PC[0] and the PC[1] scenar-ios). Flue gas desulfurization facilities had been intensivelydeployed by 2010 in most industrial sources of Japan and inthe power plants of China and South Korea. Therefore, the re-duction potential through the installation of end-of-pipe con-trol technologies will likely decline in the future, spotlightingthe importance of energy-saving measures for further reduc-tion of SO2 emissions. With the full application of best avail-able technologies (the PC[2] scenario), the remaining SO2emissions in East Asia would account for only 27 % of thebaseline projection, or 34 % of the 2010 levels.
Similar to NOx, China’s SO2 emissions have a largergrowth potential than the average of East Asia during 2010–2030 under the current policy and implementation status. Im-plementation of new energy-saving measures (reflected bythe difference between the BAU[0] and the PC[0] scenarios)and progressive end-of-pipe control measures (reflected bythe difference between the PC[0] and the PC[1] scenarios)could lead to 36 and 26 % reductions of China’s SO2 emis-sions, respectively (compared with the baseline projection).Consistent with the total emissions in East Asia, the contribu-tion of energy-saving measures clearly exceeds the plannedend-of-pipe control policies. As the power sector had largelybeen equipped with FGD facilities by the base year, indus-trial boilers and industrial process contribute 82 % of the SO2emission reduction achieved through progressive end-of-pipecontrol policies. Assuming the full enforcement of techni-cally feasible control measures (PC[2]), SO2 emissions areestimated to reach only 27 % of the baseline projection, or34 % of the 2010 levels.
We also note that China’s SO2 emissions are projected tobe 21.7 Mt in 2015 under the BAU[1] scenario, 11.1 % lowerthan those of 2010. This implies that if the control policies inthe 12th Five-Year Plan could be implemented successfully
Atmos. Chem. Phys., 14, 6571–6603, 2014 www.atmos-chem-phys.net/14/6571/2014/
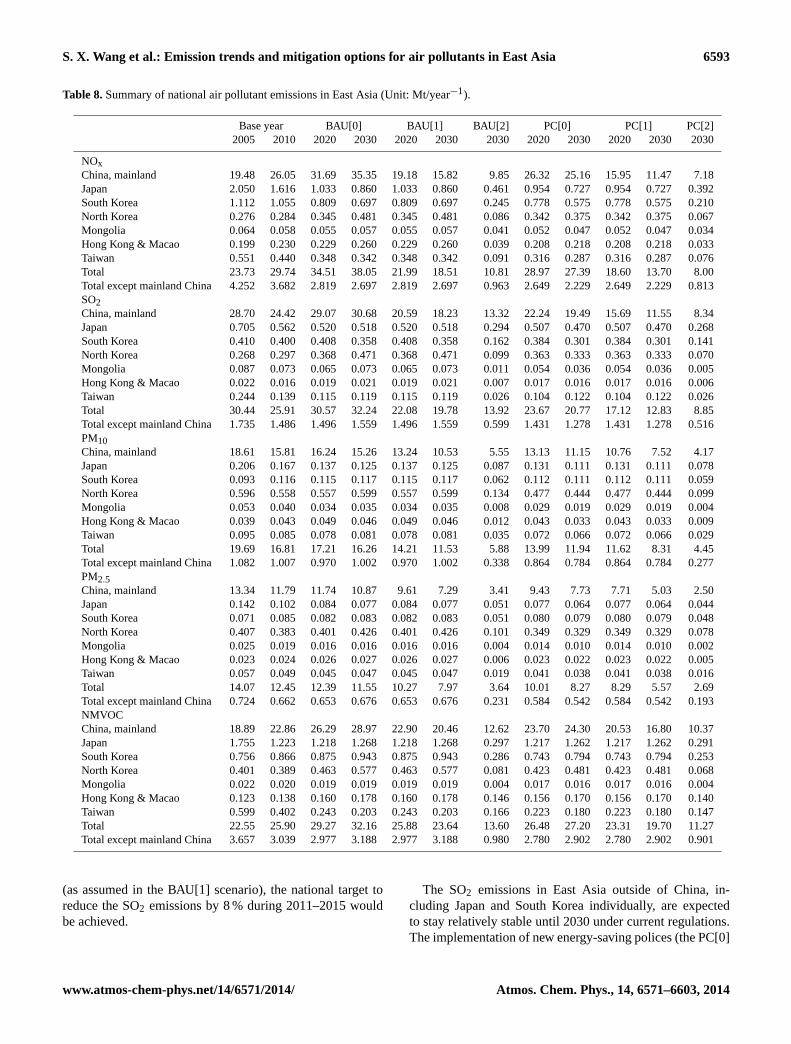
S. X. Wang et al.: Emission trends and mitigation options for air pollutants in East Asia 6593
Table 8.Summary of national air pollutant emissions in East Asia (Unit: Mt/year−1).
Base year BAU[0] BAU[1] BAU[2] PC[0] PC[1] PC[2]2005 2010 2020 2030 2020 2030 2030 2020 2030 2020 2030 2030
NOxChina, mainland 19.48 26.05 31.69 35.35 19.18 15.82 9.85 26.32 25.16 15.95 11.47 7.18Japan 2.050 1.616 1.033 0.860 1.033 0.860 0.461 0.954 0.727 0.954 0.727 0.392South Korea 1.112 1.055 0.809 0.697 0.809 0.697 0.245 0.778 0.575 0.778 0.575 0.210North Korea 0.276 0.284 0.345 0.481 0.345 0.481 0.086 0.342 0.375 0.342 0.375 0.067Mongolia 0.064 0.058 0.055 0.057 0.055 0.057 0.041 0.052 0.047 0.052 0.047 0.034Hong Kong & Macao 0.199 0.230 0.229 0.260 0.229 0.260 0.039 0.208 0.218 0.208 0.218 0.033Taiwan 0.551 0.440 0.348 0.342 0.348 0.342 0.091 0.316 0.287 0.316 0.287 0.076Total 23.73 29.74 34.51 38.05 21.99 18.51 10.81 28.97 27.39 18.60 13.70 8.00Total except mainland China 4.252 3.682 2.819 2.697 2.819 2.697 0.963 2.649 2.229 2.649 2.229 0.813SO2China, mainland 28.70 24.42 29.07 30.68 20.59 18.23 13.32 22.24 19.49 15.69 11.55 8.34Japan 0.705 0.562 0.520 0.518 0.520 0.518 0.294 0.507 0.470 0.507 0.470 0.268South Korea 0.410 0.400 0.408 0.358 0.408 0.358 0.162 0.384 0.301 0.384 0.301 0.141North Korea 0.268 0.297 0.368 0.471 0.368 0.471 0.099 0.363 0.333 0.363 0.333 0.070Mongolia 0.087 0.073 0.065 0.073 0.065 0.073 0.011 0.054 0.036 0.054 0.036 0.005Hong Kong & Macao 0.022 0.016 0.019 0.021 0.019 0.021 0.007 0.017 0.016 0.017 0.016 0.006Taiwan 0.244 0.139 0.115 0.119 0.115 0.119 0.026 0.104 0.122 0.104 0.122 0.026Total 30.44 25.91 30.57 32.24 22.08 19.78 13.92 23.67 20.77 17.12 12.83 8.85Total except mainland China 1.735 1.486 1.496 1.559 1.496 1.559 0.599 1.431 1.278 1.431 1.278 0.516PM10China, mainland 18.61 15.81 16.24 15.26 13.24 10.53 5.55 13.13 11.15 10.76 7.52 4.17Japan 0.206 0.167 0.137 0.125 0.137 0.125 0.087 0.131 0.111 0.131 0.111 0.078South Korea 0.093 0.116 0.115 0.117 0.115 0.117 0.062 0.112 0.111 0.112 0.111 0.059North Korea 0.596 0.558 0.557 0.599 0.557 0.599 0.134 0.477 0.444 0.477 0.444 0.099Mongolia 0.053 0.040 0.034 0.035 0.034 0.035 0.008 0.029 0.019 0.029 0.019 0.004Hong Kong & Macao 0.039 0.043 0.049 0.046 0.049 0.046 0.012 0.043 0.033 0.043 0.033 0.009Taiwan 0.095 0.085 0.078 0.081 0.078 0.081 0.035 0.072 0.066 0.072 0.066 0.029Total 19.69 16.81 17.21 16.26 14.21 11.53 5.88 13.99 11.94 11.62 8.31 4.45Total except mainland China 1.082 1.007 0.970 1.002 0.970 1.002 0.338 0.864 0.784 0.864 0.784 0.277PM2.5China, mainland 13.34 11.79 11.74 10.87 9.61 7.29 3.41 9.43 7.73 7.71 5.03 2.50Japan 0.142 0.102 0.084 0.077 0.084 0.077 0.051 0.077 0.064 0.077 0.064 0.044South Korea 0.071 0.085 0.082 0.083 0.082 0.083 0.051 0.080 0.079 0.080 0.079 0.048North Korea 0.407 0.383 0.401 0.426 0.401 0.426 0.101 0.349 0.329 0.349 0.329 0.078Mongolia 0.025 0.019 0.016 0.016 0.016 0.016 0.004 0.014 0.010 0.014 0.010 0.002Hong Kong & Macao 0.023 0.024 0.026 0.027 0.026 0.027 0.006 0.023 0.022 0.023 0.022 0.005Taiwan 0.057 0.049 0.045 0.047 0.045 0.047 0.019 0.041 0.038 0.041 0.038 0.016Total 14.07 12.45 12.39 11.55 10.27 7.97 3.64 10.01 8.27 8.29 5.57 2.69Total except mainland China 0.724 0.662 0.653 0.676 0.653 0.676 0.231 0.584 0.542 0.584 0.542 0.193NMVOCChina, mainland 18.89 22.86 26.29 28.97 22.90 20.46 12.62 23.70 24.30 20.53 16.80 10.37Japan 1.755 1.223 1.218 1.268 1.218 1.268 0.297 1.217 1.262 1.217 1.262 0.291South Korea 0.756 0.866 0.875 0.943 0.875 0.943 0.286 0.743 0.794 0.743 0.794 0.253North Korea 0.401 0.389 0.463 0.577 0.463 0.577 0.081 0.423 0.481 0.423 0.481 0.068Mongolia 0.022 0.020 0.019 0.019 0.019 0.019 0.004 0.017 0.016 0.017 0.016 0.004Hong Kong & Macao 0.123 0.138 0.160 0.178 0.160 0.178 0.146 0.156 0.170 0.156 0.170 0.140Taiwan 0.599 0.402 0.243 0.203 0.243 0.203 0.166 0.223 0.180 0.223 0.180 0.147Total 22.55 25.90 29.27 32.16 25.88 23.64 13.60 26.48 27.20 23.31 19.70 11.27Total except mainland China 3.657 3.039 2.977 3.188 2.977 3.188 0.980 2.780 2.902 2.780 2.902 0.901
(as assumed in the BAU[1] scenario), the national target toreduce the SO2 emissions by 8 % during 2011–2015 wouldbe achieved.
The SO2 emissions in East Asia outside of China, in-cluding Japan and South Korea individually, are expectedto stay relatively stable until 2030 under current regulations.The implementation of new energy-saving polices (the PC[0]
www.atmos-chem-phys.net/14/6571/2014/ Atmos. Chem. Phys., 14, 6571–6603, 2014
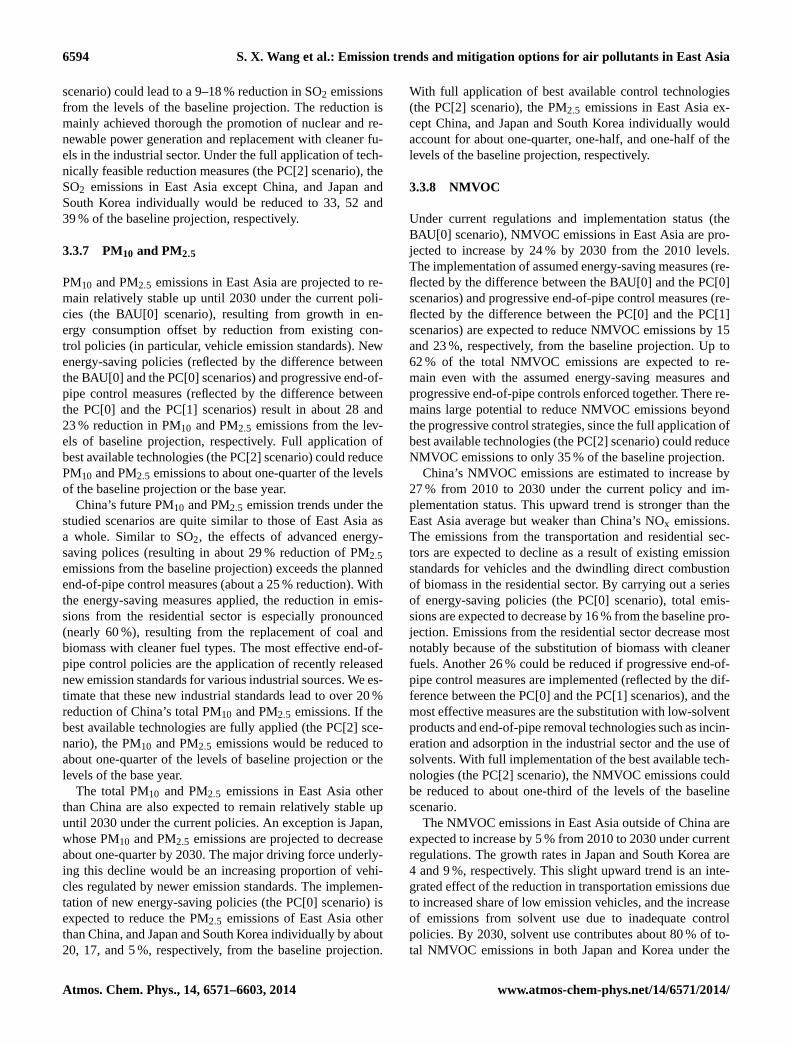
6594 S. X. Wang et al.: Emission trends and mitigation options for air pollutants in East Asia
scenario) could lead to a 9–18 % reduction in SO2 emissionsfrom the levels of the baseline projection. The reduction ismainly achieved thorough the promotion of nuclear and re-newable power generation and replacement with cleaner fu-els in the industrial sector. Under the full application of tech-nically feasible reduction measures (the PC[2] scenario), theSO2 emissions in East Asia except China, and Japan andSouth Korea individually would be reduced to 33, 52 and39 % of the baseline projection, respectively.
3.3.7 PM10 and PM2.5
PM10 and PM2.5 emissions in East Asia are projected to re-main relatively stable up until 2030 under the current poli-cies (the BAU[0] scenario), resulting from growth in en-ergy consumption offset by reduction from existing con-trol policies (in particular, vehicle emission standards). Newenergy-saving policies (reflected by the difference betweenthe BAU[0] and the PC[0] scenarios) and progressive end-of-pipe control measures (reflected by the difference betweenthe PC[0] and the PC[1] scenarios) result in about 28 and23 % reduction in PM10 and PM2.5 emissions from the lev-els of baseline projection, respectively. Full application ofbest available technologies (the PC[2] scenario) could reducePM10 and PM2.5 emissions to about one-quarter of the levelsof the baseline projection or the base year.
China’s future PM10 and PM2.5 emission trends under thestudied scenarios are quite similar to those of East Asia asa whole. Similar to SO2, the effects of advanced energy-saving polices (resulting in about 29 % reduction of PM2.5emissions from the baseline projection) exceeds the plannedend-of-pipe control measures (about a 25 % reduction). Withthe energy-saving measures applied, the reduction in emis-sions from the residential sector is especially pronounced(nearly 60 %), resulting from the replacement of coal andbiomass with cleaner fuel types. The most effective end-of-pipe control policies are the application of recently releasednew emission standards for various industrial sources. We es-timate that these new industrial standards lead to over 20 %reduction of China’s total PM10 and PM2.5 emissions. If thebest available technologies are fully applied (the PC[2] sce-nario), the PM10 and PM2.5 emissions would be reduced toabout one-quarter of the levels of baseline projection or thelevels of the base year.
The total PM10 and PM2.5 emissions in East Asia otherthan China are also expected to remain relatively stable upuntil 2030 under the current policies. An exception is Japan,whose PM10 and PM2.5 emissions are projected to decreaseabout one-quarter by 2030. The major driving force underly-ing this decline would be an increasing proportion of vehi-cles regulated by newer emission standards. The implemen-tation of new energy-saving policies (the PC[0] scenario) isexpected to reduce the PM2.5 emissions of East Asia otherthan China, and Japan and South Korea individually by about20, 17, and 5 %, respectively, from the baseline projection.
With full application of best available control technologies(the PC[2] scenario), the PM2.5 emissions in East Asia ex-cept China, and Japan and South Korea individually wouldaccount for about one-quarter, one-half, and one-half of thelevels of the baseline projection, respectively.
3.3.8 NMVOC
Under current regulations and implementation status (theBAU[0] scenario), NMVOC emissions in East Asia are pro-jected to increase by 24 % by 2030 from the 2010 levels.The implementation of assumed energy-saving measures (re-flected by the difference between the BAU[0] and the PC[0]scenarios) and progressive end-of-pipe control measures (re-flected by the difference between the PC[0] and the PC[1]scenarios) are expected to reduce NMVOC emissions by 15and 23 %, respectively, from the baseline projection. Up to62 % of the total NMVOC emissions are expected to re-main even with the assumed energy-saving measures andprogressive end-of-pipe controls enforced together. There re-mains large potential to reduce NMVOC emissions beyondthe progressive control strategies, since the full application ofbest available technologies (the PC[2] scenario) could reduceNMVOC emissions to only 35 % of the baseline projection.
China’s NMVOC emissions are estimated to increase by27 % from 2010 to 2030 under the current policy and im-plementation status. This upward trend is stronger than theEast Asia average but weaker than China’s NOx emissions.The emissions from the transportation and residential sec-tors are expected to decline as a result of existing emissionstandards for vehicles and the dwindling direct combustionof biomass in the residential sector. By carrying out a seriesof energy-saving policies (the PC[0] scenario), total emis-sions are expected to decrease by 16 % from the baseline pro-jection. Emissions from the residential sector decrease mostnotably because of the substitution of biomass with cleanerfuels. Another 26 % could be reduced if progressive end-of-pipe control measures are implemented (reflected by the dif-ference between the PC[0] and the PC[1] scenarios), and themost effective measures are the substitution with low-solventproducts and end-of-pipe removal technologies such as incin-eration and adsorption in the industrial sector and the use ofsolvents. With full implementation of the best available tech-nologies (the PC[2] scenario), the NMVOC emissions couldbe reduced to about one-third of the levels of the baselinescenario.
The NMVOC emissions in East Asia outside of China areexpected to increase by 5 % from 2010 to 2030 under currentregulations. The growth rates in Japan and South Korea are4 and 9 %, respectively. This slight upward trend is an inte-grated effect of the reduction in transportation emissions dueto increased share of low emission vehicles, and the increaseof emissions from solvent use due to inadequate controlpolicies. By 2030, solvent use contributes about 80 % of to-tal NMVOC emissions in both Japan and Korea under the
Atmos. Chem. Phys., 14, 6571–6603, 2014 www.atmos-chem-phys.net/14/6571/2014/

S. X. Wang et al.: Emission trends and mitigation options for air pollutants in East Asia 6595
Figure 3. Emissions of major air pollutants in Japan and South Korea and their sectoral distributions during 2005–2030:(a) NOx; (b) SO2;(c) PM10; (d) PM2.5; (e) NMVOC. In the legend, JP and SK represent Japan and South Korea, respectively. The sector of “Others” is thesame as in Fig. 2.
baseline projection. As solvent use has little to do with fuelconsumption, the implementation of energy-saving policieshas very limited effects on the reduction of NMVOC emis-sions. In contrast, the full application of end-of-pipe controlmeasures (the PC[2] scenario) would reduce the emissionsfrom solvent use dramatically, to about one-quarter of thebaseline projection.
4 Comparison with other studies and observations
4.1 Comparison with other studies
In 2010, China contributed 88, 94, 94, 95, and 88 % of thetotal NOx, SO2, PM10, PM2.5, and NMVOC emissions inEast Asia, respectively. As a developing country, China hassubstantial potential to reduce air pollutant emissions withthe implementation of aggressive control policies, and com-
bined with its sheer size it is therefore expected to domi-nate the emission trends of East Asia in the next 20 years.Many previous studies projecting emissions have focused onChina. While some Asian and international studies have in-corporated Japan, South Korea, and other countries to pro-duce regional projections, they have seldom disaggregatedemissions by country, making it difficult to review their pro-jections. For these reasons, our comparisons with prior lit-erature in this section are limited to comparisons of China’semission trends.
There are numerous studies estimating historical emis-sions of China. Since this study focuses on temporal trends,we exclude in our comparisons the numerous studies estimat-ing emissions for only a single year.
As for future projections, early studies (reported before2005) of China’s emissions (van Aardenne et al., 1999;Streets and Waldhoff, 2000; Klimont et al., 2001, 2002) werebased on the emissions of 1995 or before. They generally
www.atmos-chem-phys.net/14/6571/2014/ Atmos. Chem. Phys., 14, 6571–6603, 2014

6596 S. X. Wang et al.: Emission trends and mitigation options for air pollutants in East Asia
Response: It should be b. TS4: Please confirm exponent notation. Response: The exponential notation is correct. TS5: Please confirm. Response: It is correct. TS6: Please provide a higher-quality figure.
(a)
(b)
(c)
0
10
20
30
40
2000 2005 2010 2015 2020 2025 2030
NO
Xem
issi
ons
(Mt)
This study-BAU[0]This study-BAU[1]This study-BAU[2]This study-PC[0]This study-PC[1]This study-PC[2]Amann et al. (2008)-current legislationAmann et al. (2008)-advanced control technologyAmann et al. (2008)-optimizedOhara et al. (2007)-policy failureOhara et al. (2007)-best guessOhara et al. (2007)-optimisticXing et al. (2011)-current legislation and implementationXing et al. (2011)-improved energy efficiency and current environmental legislationXing et al. (2011)-improved energy efficiency and better implementation of environmental policyXing et al. (2011)-improved energy efficiency and strict environmental legislationCofala et al. (2007)-current legislationCofala et al. (2007)-maximum feasible reductionCofala et al. (2012)-current policyCofala et al. (2012)-new policyCofala et al. (2012)-high energy efficiencyCofala et al. (2012)-450 ppmZhao et al. (2013d)Kurokawa et al. (2013)
0
10
20
30
40
2000 2005 2010 2015 2020 2025 2030
SO2
emis
sion
s (M
t)
This study-BAU[0]This study-BAU[1]This study-BAU[2]This study-PC[0]This study-PC[1]This study-PC[2]Amann et al. (2008)-current legislationAmann et al. (2008)-advanced control technologyAmann et al. (2008)-optimizedOhara et al. (2007)-policy failureOhara et al. (2007)-best guessOhara et al. (2007)-optimisticXing et al. (2011)-current legislation and implementationXing et al. (2011)-improved energy efficiency and current environmental legislationXing et al. (2011)-improved energy efficiency and better implementation of environmental policyXing et al. (2011)-improved energy efficiency and strict environmental legislationCofala et al. (2007)-current legislationCofala et al. (2007)-maximum feasible reductionCofala et al. (2012)-current policyCofala et al. (2012)-new policyCofala et al. (2012)-high energy efficiencyCofala et al. (2012)-450 ppmZhao et al. (2013d)Kurokawa et al. (2013)Lu et al. (2011)Klimont et al. (2013)
0
5
10
15
20
2000 2005 2010 2015 2020 2025 2030
PM10
emis
sion
s (M
t)
This study-BAU[0]
This study-BAU[1]
This study-BAU[2]
This study-PC[0]
This study-PC[1]
This study-PC[2]
Xing et al. (2011)-current legislation and implementation
Xing et al. (2011)-improved energy efficiency and current environmental legislation
Xing et al. (2011)-improved energy efficiency and better implementation of environmental policy
Xing et al. (2011)-improved energy efficiency and strict environmental legislation
Zhao et al. (2013d)
Kurokawa et al. (2013)
(d)
(e)
TS7: Please provide years. Response: Amann et al., 2008 and Xing et al., 2011 TS8: Please provide article number. Response: Please update the reference as follows: Klimont, Z., Smith, S. J., and Cofala, J.: The last decade of global anthropogenic sulfur dioxide: 2000–2011 emissions, Environ. Res. Lett., 8, 014003, 1–6, doi:10.1088/1748-9326/8/1/014003, 2013. TS9: Please note that the reference has been updated. Response: Thank you for helping us updating this reference. TS10: Please confirm initial. Response: Please replace “Lin, J.-T.” with “Lin, J. T.”. TS11: Please check link. Response: Please update the reference as follows: National Development and Reform Commission (NDRC): Bulletin of the progress in shutting down small power generation units, http://bgt.ndrc.gov.cn/zcfb/201104/t20110422_500043.html (last access: 23 June 2014), 2011 (in Chinese). TS12: Please check link. Response: Please update the reference as follows: State Environmental Protection Administration (SEPA): Administrative regulations for the application of desulfurization electricity price and the operation of flue gas desulfurization facilities in coal-fired power generation units, http://www.zhb.gov.cn/gkml/hbb/gwy/200910/t20091030_180711.htm (last access: 23 June 2014), 2007 (in Chinese).
0
4
8
12
16
2000 2005 2010 2015 2020 2025 2030
PM2.
5em
issi
ons
(Mt)
This study-BAU[0]This study-BAU[1]This study-BAU[2]This study-PC[0]This study-PC[1]This study-PC[2]Amann et al. (2008)-current legislationAmann et al. (2008)-advanced control technologyAmann et al. (2008)-optimizedCofala et al. (2012)-current policyCofala et al. (2012)-new policyCofala et al. (2012)-high energy efficiencyCofala et al. (2012)-450 ppmZhao et al. (2013d)Kurokawa et al. (2013)
0
10
20
30
40
2000 2005 2010 2015 2020 2025 2030
NM
VOC
em
issi
ons
(Mt)
This study-BAU[0]This study-BAU[1]This study-BAU[2]This study-PC[0]This study-PC[1]This study-PC[2]Ohara et al. (2007)-policy failureOhara et al. (2007)-best guessOhara et al. (2007)-optimisticXing et al. (2011)-current legislation and implementationXing et al. (2011)-improved energy efficiency and strict environmental legislationWei et al. (2011)-current legislationWei et al. (2011)-advanced control measuresKurokawa et al. (2013)
Figure 4. Comparison of estimated emissions in this study with those of other studies:(a) NOx; (b) SO2; (c) PM10; (d) PM2.5; (e)NMVOC.The scenarios from the same study are shown with symbols of the same color, and since their historical emissions duplicate each other, weshow just the historical values of one scenario. Some points for the years 2020 and 2030 are shifted slightly to the left or right in order toavoid overlapping representation. Note that the current legislation scenario in Amann et al. (2008) is consistent with the baseline scenario inKlimont et al. (2009), and the historical emission trends of Zhao et al. (2013a) is consistent with this study. Therefore, Klimont et al. (2009)and Zhao et al. (2013a) are not shown in the figures.
substantially underestimated the rapid economic growth dur-ing 2000–2010. In addition, none of them anticipated theaggressive control policies put in place in China startingin 2005. Therefore, these projections deviated greatly fromthe actual trends. In this study, we only compare emissionprojections reported since 2005 (or using the base year of
2000 or later) with our projections, which are shown inFig. 4.
4.1.1 NOx emissions
Y. Zhao et al. (2013) and Kurokawa et al. (2013) evaluatedrecent NOx emission trends in China. They both presented
Atmos. Chem. Phys., 14, 6571–6603, 2014 www.atmos-chem-phys.net/14/6571/2014/

S. X. Wang et al.: Emission trends and mitigation options for air pollutants in East Asia 6597
similar temporal trends to our estimation. The estimatedgrowth rates of China’s NOx emissions are all within therange of 20–23 % for the period 2005–2008, and 34–47 %for the period of 2005–2010.
Ohara et al. (2007) projected NOx emissions in Chinathrough 2020 by using the emissions for 2000 and three sce-narios: a “policy failure” scenario, a “best guess” scenario,and an optimistic scenario. The projections of all the threescenarios for 2010 were much lower than our estimates, in-dicating they underestimated the economic growth during2000–2010. The three scenarios projected growth rates rang-ing between 51 and−10 % for the period 2010–2020. Incontrast, even the progressive control strategy in our studyresults in a larger decline of NOx emissions (−26 % in theBAU[1] scenario and−39 % in the PC[1] scenario) dur-ing the same period, due to the implementation of the con-trol measures scheduled in the 12th Five-Year Plan. Amannet al. (2008) developed three scenarios through 2030 basedon the emissions in 2005. The “current legislation” sce-nario assumed current regulations and enforcement, whilethe “advanced control technology” scenario assumed across-the-board application of such technologies, largely based onexisting German regulations. The optimized scenario was aleast-cost optimization that would achieve the same healthbenefit as the advanced control technology scenario. Xinget al. (2011) projected NOx emissions for 2020 with fourscenarios based on the emissions of 2005, including one as-suming current regulations and implementation status, oneassuming improvement of energy efficiency and current en-vironmental regulations, one assuming improvement of en-ergy efficiency and better implementation of environmentalregulations, and a final scenario assuming improvement ofenergy efficiency and strict environmental regulations. Thesetwo studies (Amann et al., 2008 and Xing et al., 2011) wereconducted cooperatively. Similar to Ohara et al. (2007), theirprojections for 2010 were also significantly lower than ourestimations. As for the growth rates until 2020 and 2030, allthe scenarios in these two studies projected a larger increaseor smaller decline than our progressive control strategy as-suming the enforcement of the 12th Five-Year Plan, indicat-ing these two studies did not anticipate stringent future con-trol policies. Cofala et al. (2012) projected the NOx emis-sions until 2030 based on 2010 emissions and four scenariosenvisaging energy-saving measures at different stringencylevels. The projected rates of change for 2010–2030 rangebetween 16 and−24 %. Since no end-of-pipe control mea-sures beyond the baseline are considered, it is only meaning-ful to compare these scenarios with our BAU[0] and PC[0]scenarios, which projected the growth rates for the same pe-riod at 36 and−3 %, respectively. This study predicted astronger growth potential of China’s energy consumption inthe future, leading to the larger rate of growth or smaller rateof decline above.
4.1.2 SO2 emissions
A number of studies have evaluated China’s recent SO2 emis-sion trends (Klimont et al., 2013; Lu et al., 2011; Y. Zhao etal., 2013; Kurokawa et al., 2013). Although the emission es-timates in different studies differ by up to 30 % during theperiod, all of the reviewed studies and our own show declin-ing SO2 emissions during 2005–2010. This study estimated aslightly stronger decline (13 % for 2005–2008, and 15 % for2005–2010) compared with the previous studies (2–8 % for2005–2008, and 2–12 % for 2005–2010).
Most of the projections reviewed here have more or lessenvisaged China’s recent SO2 control policies. Ohara etal. (2007) predicted that SO2 emissions would change by27, −11, and -23 % during 2010–2020 in their policy fail-ure, best-guess, and optimistic scenarios, respectively, com-parable to our BAU[0], PC[0], and BAU[1] scenarios, respec-tively. Amann et al. (2008) failed to reproduce the decliningtrend during 2005–2010, but the control policies assumed inits most aggressive scenario (the advanced control technol-ogy scenario) resulted in a similar rate of decline as of 2030as our progressive control strategy. The growth rates pro-jected in all four scenarios of Xing et al. (2011) are higherthan our BAU[1] scenario, indicating that their assumptionsof future SO2 control policies are more conservative thanour progressive control strategy based on the 12th Five-YearPlan. Cofala et al. (2012) predicted SO2 emissions to de-crease by 20–40 % during 2010–2030 under four differentenergy-saving policy scenarios, while our BAU[0] and PC[0]scenarios predicted rates of change at 26 and−20 %, respec-tively. As described in Sect. 4.1.1, the differences are alsoattributed to a stronger growth potential of China’s energyconsumption projected in our study.
4.1.3 PM emissions
Y. Zhao et al. (2013) and Kurokawa et al. (2013) have evalu-ated the recent trends of PM10 and PM2.5 emissions in China.While Y. Zhao et al. (2013) and this study both showed a de-clining trend during 2005–2010, Kurokawa et al. (2013) esti-mated a significant upward trend after 2005. The discrepancymay be attributed mainly to the uncertainty in the penetrationlevels of dust collectors at industrial sources.
China has been implementing PM control policies for sev-eral decades. Therefore, all of the projections reviewed herehave assumed the future application of dust collectors tosome extent. The PM10 emissions growth rate until 2020of the least aggressive scenario in Xing et al. (2011) iscomparable to our BAU[0], and the most aggressive one iscomparable to our PC[1], indicating similar stringency lev-els of the control policies assumed in these two studies upuntil 2020. Amann et al. (2008) predicted a slight increaseof PM2.5 emissions during 2005–2010, in contrast with a12 % decline estimated in our study using statistical data.However, the growth rate for the period 2010–2030 in their
www.atmos-chem-phys.net/14/6571/2014/ Atmos. Chem. Phys., 14, 6571–6603, 2014
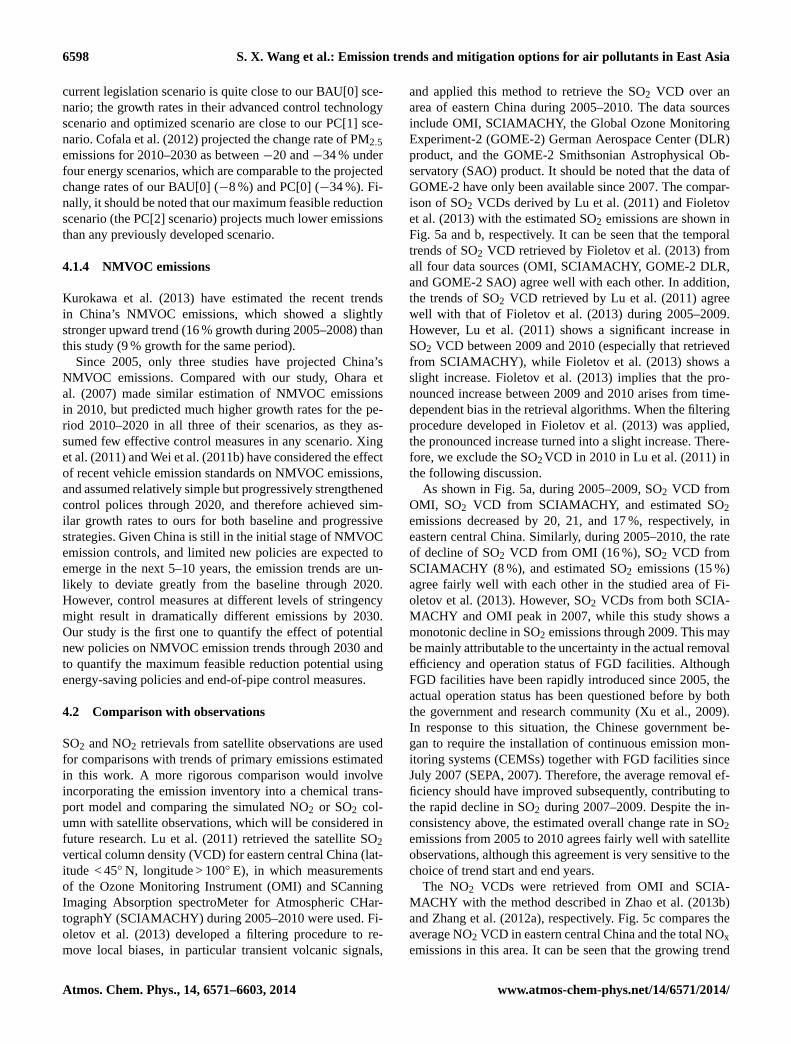
6598 S. X. Wang et al.: Emission trends and mitigation options for air pollutants in East Asia
current legislation scenario is quite close to our BAU[0] sce-nario; the growth rates in their advanced control technologyscenario and optimized scenario are close to our PC[1] sce-nario. Cofala et al. (2012) projected the change rate of PM2.5emissions for 2010–2030 as between−20 and−34 % underfour energy scenarios, which are comparable to the projectedchange rates of our BAU[0] (−8 %) and PC[0] (−34 %). Fi-nally, it should be noted that our maximum feasible reductionscenario (the PC[2] scenario) projects much lower emissionsthan any previously developed scenario.
4.1.4 NMVOC emissions
Kurokawa et al. (2013) have estimated the recent trendsin China’s NMVOC emissions, which showed a slightlystronger upward trend (16 % growth during 2005–2008) thanthis study (9 % growth for the same period).
Since 2005, only three studies have projected China’sNMVOC emissions. Compared with our study, Ohara etal. (2007) made similar estimation of NMVOC emissionsin 2010, but predicted much higher growth rates for the pe-riod 2010–2020 in all three of their scenarios, as they as-sumed few effective control measures in any scenario. Xinget al. (2011) and Wei et al. (2011b) have considered the effectof recent vehicle emission standards on NMVOC emissions,and assumed relatively simple but progressively strengthenedcontrol polices through 2020, and therefore achieved sim-ilar growth rates to ours for both baseline and progressivestrategies. Given China is still in the initial stage of NMVOCemission controls, and limited new policies are expected toemerge in the next 5–10 years, the emission trends are un-likely to deviate greatly from the baseline through 2020.However, control measures at different levels of stringencymight result in dramatically different emissions by 2030.Our study is the first one to quantify the effect of potentialnew policies on NMVOC emission trends through 2030 andto quantify the maximum feasible reduction potential usingenergy-saving policies and end-of-pipe control measures.
4.2 Comparison with observations
SO2 and NO2 retrievals from satellite observations are usedfor comparisons with trends of primary emissions estimatedin this work. A more rigorous comparison would involveincorporating the emission inventory into a chemical trans-port model and comparing the simulated NO2 or SO2 col-umn with satellite observations, which will be considered infuture research. Lu et al. (2011) retrieved the satellite SO2vertical column density (VCD) for eastern central China (lat-itude < 45◦ N, longitude > 100◦ E), in which measurementsof the Ozone Monitoring Instrument (OMI) and SCanningImaging Absorption spectroMeter for Atmospheric CHar-tographY (SCIAMACHY) during 2005–2010 were used. Fi-oletov et al. (2013) developed a filtering procedure to re-move local biases, in particular transient volcanic signals,
and applied this method to retrieve the SO2 VCD over anarea of eastern China during 2005–2010. The data sourcesinclude OMI, SCIAMACHY, the Global Ozone MonitoringExperiment-2 (GOME-2) German Aerospace Center (DLR)product, and the GOME-2 Smithsonian Astrophysical Ob-servatory (SAO) product. It should be noted that the data ofGOME-2 have only been available since 2007. The compar-ison of SO2 VCDs derived by Lu et al. (2011) and Fioletovet al. (2013) with the estimated SO2 emissions are shown inFig. 5a and b, respectively. It can be seen that the temporaltrends of SO2 VCD retrieved by Fioletov et al. (2013) fromall four data sources (OMI, SCIAMACHY, GOME-2 DLR,and GOME-2 SAO) agree well with each other. In addition,the trends of SO2 VCD retrieved by Lu et al. (2011) agreewell with that of Fioletov et al. (2013) during 2005–2009.However, Lu et al. (2011) shows a significant increase inSO2 VCD between 2009 and 2010 (especially that retrievedfrom SCIAMACHY), while Fioletov et al. (2013) shows aslight increase. Fioletov et al. (2013) implies that the pro-nounced increase between 2009 and 2010 arises from time-dependent bias in the retrieval algorithms. When the filteringprocedure developed in Fioletov et al. (2013) was applied,the pronounced increase turned into a slight increase. There-fore, we exclude the SO2VCD in 2010 in Lu et al. (2011) inthe following discussion.
As shown in Fig. 5a, during 2005–2009, SO2 VCD fromOMI, SO2 VCD from SCIAMACHY, and estimated SO2emissions decreased by 20, 21, and 17 %, respectively, ineastern central China. Similarly, during 2005–2010, the rateof decline of SO2 VCD from OMI (16 %), SO2 VCD fromSCIAMACHY (8 %), and estimated SO2 emissions (15 %)agree fairly well with each other in the studied area of Fi-oletov et al. (2013). However, SO2 VCDs from both SCIA-MACHY and OMI peak in 2007, while this study shows amonotonic decline in SO2 emissions through 2009. This maybe mainly attributable to the uncertainty in the actual removalefficiency and operation status of FGD facilities. AlthoughFGD facilities have been rapidly introduced since 2005, theactual operation status has been questioned before by boththe government and research community (Xu et al., 2009).In response to this situation, the Chinese government be-gan to require the installation of continuous emission mon-itoring systems (CEMSs) together with FGD facilities sinceJuly 2007 (SEPA, 2007). Therefore, the average removal ef-ficiency should have improved subsequently, contributing tothe rapid decline in SO2 during 2007–2009. Despite the in-consistency above, the estimated overall change rate in SO2emissions from 2005 to 2010 agrees fairly well with satelliteobservations, although this agreement is very sensitive to thechoice of trend start and end years.
The NO2 VCDs were retrieved from OMI and SCIA-MACHY with the method described in Zhao et al. (2013b)and Zhang et al. (2012a), respectively. Fig. 5c compares theaverage NO2 VCD in eastern central China and the total NOxemissions in this area. It can be seen that the growing trend
Atmos. Chem. Phys., 14, 6571–6603, 2014 www.atmos-chem-phys.net/14/6571/2014/

S. X. Wang et al.: Emission trends and mitigation options for air pollutants in East Asia 6599
Figure 5. Inter-annual relative changes of SO2 and NO2 VCD fromsatellite observations and estimated emissions in this study. AverageSO2 VCD and total SO2 emissions in eastern central China (latitude< 45◦ N, longitude > 100◦ E) (a). SO2 VCD was derived by Lu etal. (2011). All data are normalized to 2005. Average SO2 VCD andtotal SO2 emissions over an area of eastern China (34–38◦ N, 112–118◦ E) (b). SO2 VCD was derived by Fioletov et al. (2013), inwhich a filtering procedure was applied to remove local biases, inparticular volcanic signals. All data are normalized to 2010 becausethe data of GOME-2 have only been available since 2007. AverageNO2 VCD and total NOx emissions in eastern central China(c).NO2 VCD was retrieved from OMI and SCIAMACHY in this study.All data are normalized to 2005.
of NOx emissions are well captured by both the observationsof OMI and SCIAMACHY. The growth rates of NO2 VCDfrom OMI, NO2 VCD from SCIAMACHY, and NOx emis-sions are 27, 34, and 31 %, respectively.
The trends in PM concentrations are not directly compa-rable with primary emissions, as secondary PM is formed
through complex chemical reactions of primary pollutants.Our previous study (Zhao et al., 2013a) simulated the con-centrations of air pollutants in China in 2005 and 2010 us-ing the Community Multi-scale Air Quality (CMAQ) modeland the same emission inventory as presented in this paper.The trends of air pollutant emissions were evaluated by com-paring the trends of simulated air quality with observations.From 2005 to 2010, the simulated PM10 concentrations of58 Chinese cities decreased by 7.3 %, which agreed wellwith the rate of decline of the observations (7.6 %,http://datacenter.mep.gov.cn). In addition, the simulated changes ofaerosol optical depth (AOD) during 2005–2010 can well re-produce the spatial pattern of the AOD changes observed byModerate Resolution Imaging Spectroradiometer (MODIS).During 2005–2010, AOD decreased in some areas such asthe southeast coast of China, but increased over large parts ofChina, with especially pronounced increases in the SichuanBasin and the southern part of the North China Plain (Zhaoet al., 2013a).
As described above, both observation and simulation re-sults indicate that annual average PM10 concentrations inmajor cities of eastern China decreased since 2005. How-ever, based on our simulation results (Zhao et al., 2013a), thecontrol policies had not been successful in reducing concen-trations of fine particles over large parts of China. One ofthe important reasons for the increase of fine particles during2005–2010 is that nitrate concentrations increased in mostof China driven by the increase of NOx and NH3 emissions.Although sulfate concentrations in East China decreased dueto the decline of SO2 emissions, the concentrations of sec-ondary inorganic aerosol (SIA) increased in most of China,especially in the Sichuan Basin and eastern Hubei province.In addition, the increase in the emissions of NMVOC led tothe increase of secondary organic aerosols. The increase insecondary PM2.5 concentrations offset the decline of primaryPM2.5 concentrations and led to the increase of total PM2.5concentrations over large parts of China. Given above, al-though the emissions of primary PM and SO2 decreased inmost of China, the modeling results indicated that total PM2.5concentrations still increased over large parts of China (Zhaoet al., 2013a).
5 Conclusions and policy implications
In this study we reviewed the application status of air pollu-tion control measures in East Asia in the last decade, eval-uated the impact of control policies on the emission trendsduring 2005–2010, and projected future emissions of SO2,NOx, PM10, PM2.5, and NMVOC up until 2030 under sixemission scenarios based on a range of energy-saving andend-of-pipe emission control measures.
During 2005–2010, the emissions of SO2 and PM2.5 inEast Asia decreased by 15 and 12 %, respectively, mainly at-tributable to the large scale deployment of FGD in China’s
www.atmos-chem-phys.net/14/6571/2014/ Atmos. Chem. Phys., 14, 6571–6603, 2014
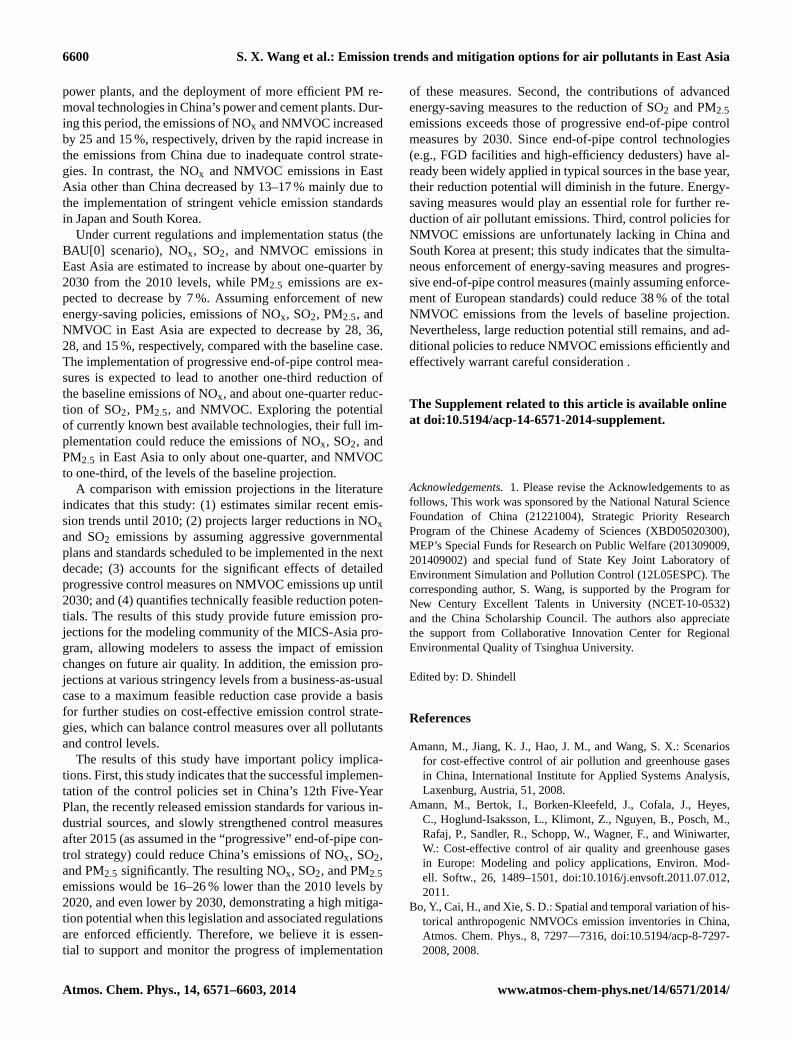
6600 S. X. Wang et al.: Emission trends and mitigation options for air pollutants in East Asia
power plants, and the deployment of more efficient PM re-moval technologies in China’s power and cement plants. Dur-ing this period, the emissions of NOx and NMVOC increasedby 25 and 15 %, respectively, driven by the rapid increase inthe emissions from China due to inadequate control strate-gies. In contrast, the NOx and NMVOC emissions in EastAsia other than China decreased by 13–17 % mainly due tothe implementation of stringent vehicle emission standardsin Japan and South Korea.
Under current regulations and implementation status (theBAU[0] scenario), NOx, SO2, and NMVOC emissions inEast Asia are estimated to increase by about one-quarter by2030 from the 2010 levels, while PM2.5 emissions are ex-pected to decrease by 7 %. Assuming enforcement of newenergy-saving policies, emissions of NOx, SO2, PM2.5, andNMVOC in East Asia are expected to decrease by 28, 36,28, and 15 %, respectively, compared with the baseline case.The implementation of progressive end-of-pipe control mea-sures is expected to lead to another one-third reduction ofthe baseline emissions of NOx, and about one-quarter reduc-tion of SO2, PM2.5, and NMVOC. Exploring the potentialof currently known best available technologies, their full im-plementation could reduce the emissions of NOx, SO2, andPM2.5 in East Asia to only about one-quarter, and NMVOCto one-third, of the levels of the baseline projection.
A comparison with emission projections in the literatureindicates that this study: (1) estimates similar recent emis-sion trends until 2010; (2) projects larger reductions in NOxand SO2 emissions by assuming aggressive governmentalplans and standards scheduled to be implemented in the nextdecade; (3) accounts for the significant effects of detailedprogressive control measures on NMVOC emissions up until2030; and (4) quantifies technically feasible reduction poten-tials. The results of this study provide future emission pro-jections for the modeling community of the MICS-Asia pro-gram, allowing modelers to assess the impact of emissionchanges on future air quality. In addition, the emission pro-jections at various stringency levels from a business-as-usualcase to a maximum feasible reduction case provide a basisfor further studies on cost-effective emission control strate-gies, which can balance control measures over all pollutantsand control levels.
The results of this study have important policy implica-tions. First, this study indicates that the successful implemen-tation of the control policies set in China’s 12th Five-YearPlan, the recently released emission standards for various in-dustrial sources, and slowly strengthened control measuresafter 2015 (as assumed in the “progressive” end-of-pipe con-trol strategy) could reduce China’s emissions of NOx, SO2,and PM2.5 significantly. The resulting NOx, SO2, and PM2.5emissions would be 16–26 % lower than the 2010 levels by2020, and even lower by 2030, demonstrating a high mitiga-tion potential when this legislation and associated regulationsare enforced efficiently. Therefore, we believe it is essen-tial to support and monitor the progress of implementation
of these measures. Second, the contributions of advancedenergy-saving measures to the reduction of SO2 and PM2.5emissions exceeds those of progressive end-of-pipe controlmeasures by 2030. Since end-of-pipe control technologies(e.g., FGD facilities and high-efficiency dedusters) have al-ready been widely applied in typical sources in the base year,their reduction potential will diminish in the future. Energy-saving measures would play an essential role for further re-duction of air pollutant emissions. Third, control policies forNMVOC emissions are unfortunately lacking in China andSouth Korea at present; this study indicates that the simulta-neous enforcement of energy-saving measures and progres-sive end-of-pipe control measures (mainly assuming enforce-ment of European standards) could reduce 38 % of the totalNMVOC emissions from the levels of baseline projection.Nevertheless, large reduction potential still remains, and ad-ditional policies to reduce NMVOC emissions efficiently andeffectively warrant careful consideration .
The Supplement related to this article is available onlineat doi:10.5194/acp-14-6571-2014-supplement.
Acknowledgements.1. Please revise the Acknowledgements to asfollows, This work was sponsored by the National Natural ScienceFoundation of China (21221004), Strategic Priority ResearchProgram of the Chinese Academy of Sciences (XBD05020300),MEP’s Special Funds for Research on Public Welfare (201309009,201409002) and special fund of State Key Joint Laboratory ofEnvironment Simulation and Pollution Control (12L05ESPC). Thecorresponding author, S. Wang, is supported by the Program forNew Century Excellent Talents in University (NCET-10-0532)and the China Scholarship Council. The authors also appreciatethe support from Collaborative Innovation Center for RegionalEnvironmental Quality of Tsinghua University.
Edited by: D. Shindell
References
Amann, M., Jiang, K. J., Hao, J. M., and Wang, S. X.: Scenariosfor cost-effective control of air pollution and greenhouse gasesin China, International Institute for Applied Systems Analysis,Laxenburg, Austria, 51, 2008.
Amann, M., Bertok, I., Borken-Kleefeld, J., Cofala, J., Heyes,C., Hoglund-Isaksson, L., Klimont, Z., Nguyen, B., Posch, M.,Rafaj, P., Sandler, R., Schopp, W., Wagner, F., and Winiwarter,W.: Cost-effective control of air quality and greenhouse gasesin Europe: Modeling and policy applications, Environ. Mod-ell. Softw., 26, 1489–1501, doi:10.1016/j.envsoft.2011.07.012,2011.
Bo, Y., Cai, H., and Xie, S. D.: Spatial and temporal variation of his-torical anthropogenic NMVOCs emission inventories in China,Atmos. Chem. Phys., 8, 7297—7316, doi:10.5194/acp-8-7297-2008, 2008.
Atmos. Chem. Phys., 14, 6571–6603, 2014 www.atmos-chem-phys.net/14/6571/2014/

S. X. Wang et al.: Emission trends and mitigation options for air pollutants in East Asia 6601
China Electric Power Yearbook Committee: China Electric PowerYearbook 2006, China Electric Power Press, Beijing, China,2006 (in Chinese).
China Electric Power Yearbook Committee: China Electric PowerYearbook 2011, China Electric Power Press, Beijing, China,2011 (in Chinese).
Cofala, J., Amann, M., Klimont, Z., Kupiainen, K., and Hoglund-Isaksson, L.: Scenarios of global anthropogenic emissions of airpollutants and methane until 2030, Atmos. Environ., 41, 8486–8499, doi:10.1016/j.atmosenv.2007.07.010, 2007.
Cofala, J., Bertok, I., Borken-Kleefeld, J., Heyes, C., Klimont, Z.,Rafaj, P., Sander, R., Schöpp, W., and Amann, A.: Emissionsof Air Pollutants for the World Energy Outlook 2012 EnergyScenarios, International Institute for Applied Systems Analysis,Laxenburg, Austria, 2012.
Delphi Company: Worldwide Emission Standard: Heavy Dutyand Off-Highway Vehicles, available atwww.delphi.com/emissions-hd(last access: 1 November 2013), Delphi company,Troy, Michigan, US, 100 pp., 2013a.
Delphi Company: Worldwide Emission Standard: PassengerCars and Light Duty Vehicles, available atwww.delphi.com/emissions-pc(last access: 1 November 2013), Delphi company,Troy, Michigan, US, 100 pp., 2013b.
Energy Conservation Center of Japan: Japan Energy ConservationHandbook 2011, available athttp://www.asiaeec-col.eccj.or.jp/databook/2011/(last access: 1 October 2013), Energy Conser-vation Center of Japan, Tokyo, Japan, 145 pp., 2011.
Fioletov, V. E., McLinden, C. A., Krotkov, N., Yang, K., Loyola,D. G., Valks, P., Theys, N., Van Roozendael, M., Nowlan, C. R.,Chance, K., Liu, X., Lee, C., and Martin, R. V.: Application ofOMI, SCIAMACHY, and GOME-2 satellite SO2 retrievals fordetection of large emission sources, J. Geophys. Res-Atmos.,118, 11399–11418, doi:10.1002/jgrd.50826, 2013.
Huo, H., Lei, Y., Zhang, Q., Zhao, L. J., and He, K. B.: China’s cokeindustry: Recent policies, technology shift, and implication forenergy and the environment, Energ. Policy., 51, 397–404, 2012.
Institute of Energy Economics of Japan: Handbook of Energy &Economic Statistics in Japan, Institute of Energy Economics ofJapan, Tokyo, Japan, 370 pp., 2010.
International Energy Agency (IEA): Energy Balances of OECDCountries 1999–2000, International Energy Agency, Head ofPublications Service, Paris, France, 249 pp., 2002.
International Energy Agency (IEA): Energy policy of IEA coun-tries: Korea 2006 Review, International Energy Agency, Paris,France, 2006.
International Energy Agency (IEA): Energy Balances of OECDCountries 2004–2005, International Energy Agency, Head ofPublications Service, Paris, France, 249 pp., 2007.
International Energy Agency (IEA): Energy policy of IEA coun-tries: Japan 2008 Review, International Energy Agency, Paris,France, 2008.
International Energy Agency (IEA): World Energy Outlook 2009,International Energy Agency, Paris, France, 2009.
International Energy Agency (IEA): Energy policy of IEA coun-tries: Korea 2012 Review, International Energy Agency, Paris,France, 2012a.
International Energy Agency (IEA): Energy Balances of OECDCountries 2009–2010, International Energy Agency, Head ofPublications Service, Paris, France, 249 pp., 2012b.
Japan Automobile Manufacturers Association: PM/PM2.5 in Ambi-ent Air & Related Activities in Japan, Japan Automobile Manu-facturers Association, Tokyo, Japan, 51 pp., 2011.
Japan Petroleum Energy Center (JPEC): Emission inventory of roadtransport in Japan, Japan Petroleum Energy Center, Tokyo, 136,2012a (in Japanese).
Japan Petroleum Energy Center (JPEC): Emission inventory ofsources other than road transport in Japan, Japan Petroleum En-ergy Center, Tokyo, 288, 2012b (in Japanese).
Japan Petroleum Energy Center (JPEC): Speciation profiles ofVOC, PM, and NOx emissions for atmospheric simulations ofPM2.5, Japan Petroleum Energy Center, Tokyo, 69, 2012c (inJapanese).
Klimont, Z., Cofala, J., Schopp, W., Amann, M., Streets, D. G.,Ichikawa, Y., and Fujita, S.: Projections of SO2, NOx, NH3 andVOC emissions in East Asia up to 2030, Water. Air. Soil. Poll.,130, 193–198, 2001.
Klimont, Z., Streets, D. G., Gupta, S., Cofala, J., Fu, L. X., andIchikawa, Y.: Anthropogenic emissions of non-methane volatileorganic compounds in China, Atmos. Environ., 36, 1309–1322,doi:10.1016/S1352-2310(01)00529-5, 2002.
Klimont, Z., Cofala, J., Xing, J., Wei, W., Zhang, C., Wang, S., Ke-jun, J., Bhandari, P., Mathur, R., Purohit, P., Rafaj, P., Cham-bers, A., and Amann, M.: Projections of SO2, NOx and car-bonaceous aerosols emissions in Asia, Tellus B, 61, 602–617,doi:10.1111/j.1600-0889.2009.00428.x, 2009.
Klimont, Z., Smith, S. J., and Cofala, J.: The last decade of globalanthropogenic sulfur dioxide: 2000–2011 emissions, Environ.Res. Lett., 8, 014003, doi:10.1088/1748-9326/8/1/014003, 2013.
Kurokawa, J., Ohara, T., Morikawa, T., Hanayama, S., Janssens-Maenhout, G., Fukui, T., Kawashima, K., and Akimoto, H.:Emissions of air pollutants and greenhouse gases over Asian re-gions during 2000–2008: Regional Emission inventory in ASia(REAS) version 2, Atmos. Chem. Phys., 13, 11019–11058,doi:10.5194/acp-13-11019-2013, 2013.
Lei, Y., Zhang, Q., He, K. B., and Streets, D. G.: Primary anthro-pogenic aerosol emission trends for China, 1990–2005, Atmos.Chem. Phys., 11, 931–954, doi:10.5194/acp-11-931-2011, 2011.
Li, C., Zhang, Q., Krotkov, N. A., Streets, D. G., He, K. B.,Tsay, S. C., and Gleason, J. F.: Recent large reduction in sulfurdioxide emissions from Chinese power plants observed by theOzone Monitoring Instrument, Geophys. Res. Lett., 37, L08807,doi:10.1029/2010GL042594, 2010.
Li, Y.: Dynamics of clean coal-fired power generationdevelopment in China, Energ. Policy, 51, 138–142,doi:10.1016/j.enpol.2011.06.012, 2012.
Lin, J. T., Nielsen, C. P., Zhao, Y., Lei, Y., Liu, Y., and McEl-roy, M. B.: Recent Changes in Particulate Air Pollution overChina Observed from Space and the Ground: Effectivenessof Emission Control, Environ. Sci. Technol., 44, 7771–7776,doi:10.1021/Es101094t, 2010a.
Lin, J.-T., McElroy, M. B., and Boersma, K. F.: Constraint ofanthropogenic NOx emissions in China from different sectors:a new methodology using multiple satellite retrievals, Atmos.Chem. Phys., 10, 63–78, doi:10.5194/acp-10-63-2010, 2010b.
Liu, H. Y., Jacob, D. J., Bey, I., Yantosca, R. M., Duncan, B. N., andSachse, G. W.: Transport pathways for Asian pollution outflowover the Pacific: Interannual and seasonal variations, J. Geophys.Res-Atmos., 108, 8786, doi:10.1029/2002JD003102, 2003.
www.atmos-chem-phys.net/14/6571/2014/ Atmos. Chem. Phys., 14, 6571–6603, 2014

6602 S. X. Wang et al.: Emission trends and mitigation options for air pollutants in East Asia
Lu, Z., Streets, D. G., Zhang, Q., Wang, S., Carmichael, G. R.,Cheng, Y. F., Wei, C., Chin, M., Diehl, T., and Tan, Q.: Sulfurdioxide emissions in China and sulfur trends in East Asia since2000, Atmos. Chem. Phys., 10, 6311–6331, doi:10.5194/acp-10-6311-2010, 2010.
Lu, Z., Zhang, Q., and Streets, D. G.: Sulfur dioxide and primarycarbonaceous aerosol emissions in China and India, 1996–2010,Atmos. Chem. Phys., 11, 9839–9864, doi:10.5194/acp-11-9839-2011, 2011.
Ministry of Environment of South Korea: Air & Climate ChangePolicies in South Korea,http://eng.me.go.kr/eng/web/index.do?menuId=64&findDepth=1(last access: 23 January 2014), 2013.
Ministry of Environmental Protection of China (MEP): Bulletinof urban sewage treatment facilities, and flue gas desulfu-rization/denitrification facilities of coal-fired power plants,http://www.mep.gov.cn/gkml/hbb/bgg/201104/t20110420_209449.htm(last access: 5 May 2012), 2011 (in Chinese).
Ministry of the Environment of Japan: Air & Transportation Poli-cies in Japan,http://www.env.go.jp/en/air/, last access: 1 August2013.
National Bureau of Statistics (NBS): China Energy Statistical Year-book 2006, China Statistics Press, Beijing, 2007.
National Bureau of Statistics (NBS): China Energy Statistical Year-book 2007, China Statistics Press, Beijing, 2008a.
National Bureau of Statistics (NBS): China Energy Statistical Year-book 2008, China Statistics Press, Beijing, 2008b.
National Bureau of Statistics (NBS): China Energy Statistical Year-book 2009, China Statistics Press, Beijing, 2009.
National Bureau of Statistics (NBS): China Energy Statistical Year-book 2011, China Statistics Press, Beijing, 2011a.
National Bureau of Statistics (NBS): China Energy Statistical Year-book 2010, China Statistics Press, Beijing, 2011b.
National Development and Reform Commission (NDRC): Bulletinof the progress in shutting down small power generation units,http://bgt.ndrc.gov.cn/zcfb/201104/t20110422_500043.html(last access: 23 June 2014), 2011 (in Chinese).
National Institute of Environmental Research (NIER): The method-ology of national air pollutants emission estimation II, 2010, Na-tional Institute of Environmental Research, Inchon, South Korea,2010 (in Korean).
National Institute of Environmental Research (NIER): A Study onthe Characteristics of the Process Facilities using SEMS Data,National Institute of Environmental Research, Inchon, South Ko-rea, 2013 (in Korean).
Ohara, T., Akimoto, H., Kurokawa, J., Horii, N., Yamaji, K., Yan,X., and Hayasaka, T.: An Asian emission inventory of an-thropogenic emission sources for the period 1980–2020, At-mos. Chem. Phys., 7, 4419–4444, doi:10.5194/acp-7-4419-2007,2007.
Shindell, D., Kuylenstierna, J. C. I., Vignati, E., van Dingenen,R., Amann, M., Klimont, Z., Anenberg, S. C., Muller, N.,Janssens-Maenhout, G., Raes, F., Schwartz, J., Faluvegi, G.,Pozzoli, L., Kupiainen, K., Hoglund-Isaksson, L., Emberson,L., Streets, D., Ramanathan, V., Hicks, K., Oanh, N. T. K.,Milly, G., Williams, M., Demkine, V., and Fowler, D.: Simul-taneously Mitigating Near-Term Climate Change and Improv-ing Human Health and Food Security, Science, 335, 183–189,doi:10.1126/science.1210026, 2012.
State Environmental Protection Administration (SEPA): Adminis-trative regulations for the application of desulfurization electric-ity price and the operation of flue gas desulfurization facilities incoal-fired power generation units,http://www.zhb.gov.cn/gkml/hbb/gwy/200910/t20091030_180711.htm(last access: 23 June2014), 2007 (in Chinese).
Streets, D. G. and Waldhoff, S. T.: Present and future emissions ofair pollutants in China: SO2, NOx, and CO, Atmos. Environ., 34,363–374, 2000.
The State Council of the People’s Republic of China: TheEleventh Five-Year Plan for National Economic and SocialDevelopment of the People’s Republic of China,http://www.gov.cn/gongbao/content/2006/content_268766.htm(last access:2 February 2013), 2006 (in Chinese).
The State Council of the People’s Republic of China: IntegratedWork Plan for Energy Saving and Emission Reduction Duringthe Twelfth Five-Year Plan,http://www.gov.cn/zwgk/2011-09/07/content_1941731.htm(last access: 2 February 2013), 2011 (inChinese).
The State Council of the People’s Republic of China: The TwelfthFive-Year Plan for Energy Saving and Emission Reduction,http://www.gov.cn/zwgk/2012-08/21/content_2207867.htm(last ac-cess: 2 February 2013), 2012 (in Chinese).
Tsinghua University Building Energy Research Center (THU-BERC): Annual Report on China Building Energy Efficiency,China Architecture & Building Press, Beijing, 2009 (in Chinese).
United Nations Environment Programme (UNEP): Overview of theRepublic of Korea’s National Strategy for Green Growth, UnitedNations Environment Programme, Geneva, Switzerland, 54 pp.,2010.
United Nations Environment Programme (UNEP), and World Me-teorological Organization (WMO): Integrated Assessment ofBlack Carbon and Tropospheric Ozone, United Nations Envi-ronment Programme and World Meteorological Organization,Nairobi, Kenya, 2011.
van Aardenne, J. A., Carmichael, G. R., Levy, H., Streets, D., andHordijk, L.: Anthropogenic NOx emissions in Asia in the period1990–2020, Atmos. Environ., 33, 633–646, 1999.
Wakamatsu, S., Morikawa, T., and Ito, A.: Air Pollution Trends inJapan between 1970 and 2012 and Impact of Urban Air Pollu-tion Countermeasures, Asian J. Atmos. Environ., 7, 177–190,doi:10.5572/ajae.2013.7.4.177, 2013.
Wang, Q. Y.: Chinese Energy Data 2010, The Energy Foundation,Beijing, 109 pp., 2010.
Wang, S. X. and Hao, J. M.: Air quality management in China: Is-sues, challenges, and options, J. Environ. Sci.-China, 24, 2–13,doi:10.1016/S1001-0742(11)60724-9, 2012.
Wei, W., Wang, S. X., Chatani, S., Klimont, Z., Cofala, J., and Hao,J. M.: Emission and speciation of non-methane volatile organiccompounds from anthropogenic sources in China, Atmos. Envi-ron., 42, 4976–4988, 2008.
Wei, W., Wang, S. X., and Hao, J. M.: Uncertainty Analysis ofEmission Inventory for Volatile Organic Compounds from An-thropogenic Sources in China, Environ. Sci., 32, 305–312, 2011a(in Chinese).
Wei, W., Wang, S. X., Hao, J. M., and Cheng, S. Y.: Projectionof anthropogenic volatile organic compounds (VOCs) emissionsin China for the period 2010–2020, Atmos. Environ., 45, 6863–6871, doi:10.1016/j.atmosenv.2011.01.013, 2011b.
Atmos. Chem. Phys., 14, 6571–6603, 2014 www.atmos-chem-phys.net/14/6571/2014/

S. X. Wang et al.: Emission trends and mitigation options for air pollutants in East Asia 6603
World Bank (WB), and State Environmental Protection Admin-istration (SEPA): Cost of Pollution in China: Economic Esti-mates of Physical Damages, available atwww.worldbank.org/eapenvironment(last access: 1 October 2013), 2007.
Wu, Y., Zhang, S. J., Li, M. L., Ge, Y. S., Shu, J. W., Zhou, Y., Xu,Y. Y., Hu, J. N., Liu, H., Fu, L. X., He, K. B., and Hao, J. M.: Thechallenge to NOx emission control for heavy-duty diesel vehiclesin China, Atmos. Chem. Phys., 12, 9365–9379, doi:10.5194/acp-12-9365-2012, 2012.
Xing, J., Wang, S. X., Chatani, S., Zhang, C. Y., Wei, W., Hao, J. M.,Klimont, Z., Cofala, J., and Amann, M.: Projections of air pollu-tant emissions and its impacts on regional air quality in China in2020, Atmos. Chem. Phys., 11, 3119–3136, doi:10.5194/acp-11-3119-2011, 2011.
Xu, Y., Williams, R. H., and Socolow, R. H.: China’s rapid deploy-ment of SO2 scrubbers, Energ. Environ. Sci., 2, 459–465, 2009.
Yang, Z. D.: Well-to-wheels analysis of energy consumption andCO2 emissions of electric-powered vehicles in China, Masterthesis, School of Environment, Tsinghua University, Beijing,China, 83 pp., 2012 (in Chinese).
Zhang, Q., Streets, D. G., He, K., Wang, Y., Richter, A., Burrows, J.P., Uno, I., Jang, C. J., Chen, D., Yao, Z., and Lei, Y.: NOx emis-sion trends for China, 1995–2004: The view from the groundand the view from space, J. Geophys. Res-Atmos., 112, D22306,doi:10.1029/2007jd008684, 2007.
Zhang, Q., Geng, G. N., Wang, S. W., Richter, A., and He, K.B.: Satellite remote sensing of changes in NOx emissions overChina during 1996–2010, Chinese Sci. Bull., 57, 2857–2864,doi:10.1007/s11434-012-5015-4, 2012a.
Zhang, Q., He, K. B., and Huo, H.: Cleaning China’s air, Nature,484, 161–162, 2012b.
Zhang, X. Y., Wang, Y. Q., Niu, T., Zhang, X. C., Gong, S.L., Zhang, Y. M., and Sun, J. Y.: Atmospheric aerosol com-positions in China: spatial/temporal variability, chemical sig-nature, regional haze distribution and comparisons with globalaerosols, Atmos. Chem. Phys., 12, 779–799, doi:10.5194/acp-12-779-2012, 2012.
Zhao, B., Wang, S. X., Dong, X. Y., Wang, J. D., Duan, L., Fu,X., Hao, J. M., and Fu, J.: Environmental effects of the recentemission changes in China: implications for particulate matterpollution and soil acidification, Environ. Res. Lett., 8, 024031,doi:10.1088/1748-9326/8/2/024031, 2013a.
Zhao, B., Wang, S. X., Wang, J. D., Fu, J., Liu, T. H., Xu, J. Y.,Fu, X., and Hao, J. M.: Impact of national NOx and SO2 controlpolicies on particulate matter pollution in China, Atmos. Envi-ron., 77, 453–463, 2013b.
Zhao, B., Wang, S. X., Liu, H., Xu, J. Y., Fu, K., Klimont, Z., Hao,J. M., He, K. B., Cofala, J., and Amann, M.: NOx emissions inChina: historical trends and future perspectives, Atmos. Chem.Phys., 13, 9869–9897, doi:10.5194/acp-13-9869-2013, 2013c.
Zhao, Y., Wang, S. X., Nielsen, C. P., Li, X. H., and Hao, J. M.:Establishment of a database of emission factors for atmosphericpollutants from Chinese coal-fired power plants, Atmos. Envi-ron., 44, 1515–1523, doi:10.1016/j.atmosenv.2010.01.017, 2010.
Zhao, Y., Zhang, J., and Nielsen, C. P.: The effects of recent con-trol policies on trends in emissions of anthropogenic atmosphericpollutants and CO2 in China, Atmos. Chem. Phys., 13, 487–508,doi:10.5194/acp-13-487-2013, 2013d.
www.atmos-chem-phys.net/14/6571/2014/ Atmos. Chem. Phys., 14, 6571–6603, 2014