emission ratios for ammonia and formic acid and observations of
TRANSCRIPT

Atmosphere 2011, 2, 633-654; doi:10.3390/atmos2040633
atmosphereISSN 2073-4433
www.mdpi.com/journal/atmosphere
Article
Emission Ratios for Ammonia and Formic Acid and Observations of Peroxy Acetyl Nitrate (PAN) and Ethylene in Biomass Burning Smoke as Seen by the Tropospheric Emission Spectrometer (TES)
Matthew J. Alvarado 1,*, Karen E. Cady-Pereira 1, Yaping Xiao 1, Dylan B. Millet 2 and
Vivienne H. Payne 1
1 Atmospheric and Environmental Research (AER), Lexington, MA 02421, USA;
E-Mails: [email protected] (K.E.C.-P.); [email protected] (Y.X.); [email protected] (V.H.P.) 2 Department of Soil, Water, and Climate, University of Minnesota, St. Paul, MN 55455-0213, USA;
E-Mail: [email protected]
* Author to whom correspondence should be addressed; E-Mail: [email protected];
Tel.: +1-781-761-2330; Fax: +1-781-761-2299.
Received: 26 August 2011; in revised form: 22 October 2011 / Accepted: 1 November 2011 /
Published: 9 November 2011
Abstract: We use the Tropospheric Emission Spectrometer (TES) aboard the NASA Aura
satellite to determine the concentrations of the trace gases ammonia (NH3) and formic acid
(HCOOH) within boreal biomass burning plumes, and present the first detection of peroxy
acetyl nitrate (PAN) and ethylene (C2H4) by TES. We focus on two fresh Canadian plumes
observed by TES in the summer of 2008 as part of the Arctic Research of the Composition
of the Troposphere from Aircraft and Satellites (ARCTAS-B) campaign. We use TES
retrievals of NH3 and HCOOH within the smoke plumes to calculate their emission ratios
(1.0% ± 0.5% and 0.31% ± 0.21%, respectively) relative to CO for these Canadian fires.
The TES derived emission ratios for these gases agree well with previous aircraft and
satellite estimates, and can complement ground-based studies that have greater surface
sensitivity. We find that TES observes PAN mixing ratios of ~2 ppb within these
mid-tropospheric boreal biomass burning plumes when the average cloud optical depth is
low (<0.1) and that TES can detect C2H4 mixing ratios of ~2 ppb in fresh biomass burning
smoke plumes.
OPEN ACCESS
Atmosphere 2011, 2
634
Keywords: biomass burning; satellite; TES; formic acid; ammonia; PAN; ethylene
1. Introduction
Biomass burning is the second largest source of trace gases to the global atmosphere and is an
important part of the interannual variability of atmospheric composition [1-3]. Trace gases from
biomass burning can contribute to the secondary chemical formation of aerosol particles and global
tropospheric ozone, both of which impact upon climate and human health. However, the emissions of
trace gases from biomass burning are highly uncertain. Emission factors for biomass burning are
primarily based on airborne and ground field measurements and measurements from small fires
conducted in laboratories. Laboratory studies have shown that emissions of trace gases and particles
from biomass burning can vary widely based on the type of fuel burned as well as the phase of
combustion (i.e., whether the combustion is in the early “flaming” stages or the later “smoldering”
stages) [4]. However, the size, fuel moisture, and combustion characteristics of laboratory fires may
not be representative of large-scale wildfires. Aircraft and ground studies of biomass burning
emissions can only sample a small number of fires infrequently, making it difficult to understand the
impact that the regional variability of fuel type and combustion phase can have on biomass burning
emissions. Satellite observations, with their extensive spatial and temporal coverage, provide the
opportunity to sample a large number of fires in several different ecosystems, which will help to
characterize the spatial and temporal variability of emissions within a region for use in models of
atmospheric chemistry, air quality, and climate.
Recent investigations have focused on using nadir-viewing satellite observations to estimate
biomass burning emissions of trace gases and particles and study their subsequent chemistry. Examples
of these studies include: estimating the emission rate of fine particles with fire radiative power (FRP)
and aerosol optical depth retrievals from the Moderate-Resolution Imaging Spectroradiometer
(MODIS) [5,6]; estimating emissions of NOx with MODIS FRP and tropospheric NO2 columns from
the Ozone Monitoring Instrument (OMI) [7]; constraining emissions of CO using retrievals from the
Measurements Of Pollution In The Troposphere (MOPITT) instrument, the Atmospheric Infrared
Sounder (AIRS), the Scanning Imaging Absorption Spectrometer for Atmospheric Cartography
(SCIAMACHY), and the Tropospheric Emission Spectrometer (TES) [8]; detecting several trace gases
within smoke plumes using the Infrared Atmospheric Sounding Interferometer (IASI) [9,10]; and
estimating the correlation between CO and O3 in smoke plumes with TES [11-13].
TES made multiple special observations during the summer of 2008 over eastern Siberia, the North
Pacific, and North America as part of the Arctic Research of the Composition of the Troposphere from
Aircraft and Satellites (ARCTAS-B) campaign [14]. This data set includes several observations of
smoke plumes from boreal fires in Siberia and Canada. Alvarado et al. previously analyzed the
correlation between TES retrievals of CO and O3 within these smoke plumes [12]. Here we use nadir
observations from TES to determine the concentrations of the trace gases ammonia (NH3) and formic
acid (HCOOH) within two boreal biomass burning plumes over Canada and determine the emission
ratio of these gases relative to CO. The use of emission ratios relative to CO allows us to build on
Atmosphere 2011, 2
635
previous studies of emissions of CO from biomass burning [8] to estimate emissions of these less
well-studied trace gases. We also present the first TES detections of peroxy acetyl nitrate (PAN), an
important reservoir species of nitrogen oxides (NOx) that is formed chemically within biomass burning
smoke plumes, and the first TES detection of ethylene (C2H4), a reactive hydrocarbon emitted by
biomass burning.
Biomass burning is a significant source of NH3 [15]; other anthropogenic sources are livestock and
chemical fertilizers, while natural sources include oceans, wild animal respiration, and soil microbial
processes [16]. NH3 is an integral component of the nitrogen cycle. It can combine with acidic gases
like H2SO4 and HNO3 to form secondary aerosol, which then can impact climate and human health.
This reactivity leads to a very short lifetime (less than two weeks) and large temporal and spatial
variability. Background summer ammonia mixing ratios in the United States can range from 0.05 to
47 ppbv [17]. In situ observations of atmospheric ammonia are sparse and infrequent, making satellite
observations of tropospheric NH3 highly desirable. Worden et al. derived molar ratios of NH3 to CO in
smoke plumes from forest fires near San Luis Obispo, California, on 15 August 1994 using the
Airborne Emission Spectrometer (AES), the airborne prototype for TES [18]. Beer et al. reported the
first satellite observations of boundary layer NH3 using the TES instrument aboard Aura [19].
Shephard et al. extended this work to a detailed strategy for retrieving NH3 using TES [20].
Pinder et al. showed that the TES NH3 retrievals were able to capture the spatial and seasonal
variability of NH3 over eastern North Carolina and that the retrievals compared well with in situ
surface observations of NH3 [21]. In addition, Clarisse et al. have used the nadir viewing IASI
instrument to retrieve mixing ratios and global distributions of tropospheric NH3 [10,22].
Formic acid (HCOOH) is a significant contributor to the acidity of precipitation and is an important
oxygenated volatile organic compound [23-25]. Formic acid is ubiquitous in the troposphere, with
typical surface concentrations ranging from 0.1 ppbv for “clean” environments to over 10 ppbv in
urban polluted environments (e.g., Table 1 of [26]). The HCOOH lifetime ranges from several hours in
the boundary layer to a few weeks in the free troposphere with wet (precipitation) and dry deposition
the primary sinks, and reaction with OH of lesser importance [27]. There is considerable uncertainty
concerning the origin of formic acid in the atmosphere. Some identified HCOOH sources include
biogenic emissions from vegetation and soils, emissions from motor vehicles, and secondary
production from organic precursors [26-28].
Biomass burning is another major primary source of formic acid, with several airborne studies
showing that secondary production of formic acid also takes place within the aging smoke plume as
the initial organic gases in the smoke are oxidized [29]. Enhanced mixing ratios of formic acid were
measured in TES prototype airborne measurements of western wildfires [18]. The limb-viewing
Atmospheric Chemistry Experiment Fourier Transform Spectrometer (ACE-FTS) observed formic
acid in young and aged biomass burning plumes in the upper troposphere and derived emission ratios
for formic acid to CO [30,31]. Similarly, Grutter et al. used the limb-viewing Michelson Interferometer
for Passive Atmospheric Sounding (MIPAS) to retrieve global distributions of formic acid in the upper
troposphere and stratosphere [32]. Razavi et al. presented global distributions of formic acid retrieved
using the nadir-viewing IASI instrument and showed that the retrieved formic acid is correlated with
CO during the burning season in Brazil, the Congo, and Southeast Asia [33].
Atmosphere 2011, 2
636
PAN is a thermally unstable reservoir for NOx that can be transported over large distances before
converting back into NOx, thereby altering ozone formation far downwind from the original
source [34-36]. The primary NOx emissions from biomass burning are rapidly converted to PAN
within biomass burning plumes [12,37]. Satellite retrievals of PAN could provide substantial
information on the fate of NOx emitted by biomass burning in the atmosphere and the impact of
these NOx emissions on global tropospheric ozone. The limb-viewing sounders MIPAS [38] and
ACE-FTS [39] and the nadir-viewing IASI instrument [9,10] have all previously identified PAN in
biomass burning smoke, but this species had not been previously detected in TES spectra.
Ethylene (C2H4) is a reactive hydrocarbon that is emitted directly by biomass burning [3]. It has a
short lifetime in the summer Arctic troposphere (14–35 h, [12]) due to rapid reaction with OH. As this
rapid oxidation of ethylene impacts the ozone formation rate within young smoke plumes [40], better
estimates of the emissions of ethylene from biomass burning could help to reduce the uncertainty in
the impact of biomass burning on tropospheric ozone. Enhanced mixing ratios of ethylene were
measured in TES prototype airborne measurements of western wildfires [18], and C2H4 has also been
previously identified by ACE-FTS [39] and IASI [9,10], but it had not been previously detected in
TES spectra.
Section 2 describes the methods we used to identify biomass burning plumes from TES spectra, to
retrieve NH3 and HCOOH within the smoke plumes, and to detect PAN and C2H4 in TES spectra.
Section 3 presents the results of this study and Section 4 summarizes our conclusions.
2. Methods
2.1. TES Special Observations During ARCTAS-B
TES is a nadir-viewing Fourier-transform infrared (FTIR) spectrometer aboard the NASA Aura
spacecraft with a high spectral resolution of 0.06 cm−1 and a nadir footprint of 5.3 km × 8.3 km. Here
we use Level 1B spectra (V003) for the 1B2 (950–1150 cm−1) and 2A1 (1100–1325 cm−1) bands of the
TES instrument [41].
TES retrievals of trace gas profiles are based on an optimal estimation approach (with a priori
constraints) that minimizes the differences between the TES Level 1B spectra and a radiative transfer
calculation that uses absorption coefficients calculated with the line-by-line radiative transfer model
LBLRTM [20,42-45]. Current Level 2 products from TES (V004) include retrieved profiles of CO, O3,
H2O, HDO, and CH4. The NH3 retrieval discussed below will be included in the upcoming V005 of
TES products, while the HCOOH retrieval discussed below is a prototype retrieval being developed at
AER. The averaging kernel matrix of the retrieval gives the vertical sensitivity of the retrieved profile
to the true profile, while the trace of the averaging kernel gives the degrees of freedom for signal
(DOFS), which represents the number of independent pieces of information contained in the
retrieval [44]. Cloud properties are retrieved by assuming single layer clouds with an effective optical
depth that accounts for both cloud absorption and scattering [46]. Due to their small size (count median
diameters of ~0.13 μm [47]), biomass burning aerosols are unlikely to significantly impact radiances in
the thermal infrared regions detected by TES, and any impact from larger particles is accounted for by
the retrieved effective cloud optical depth.
Atmosphere 2011, 2
637
The TES special observations during ARCTAS-B included nadir observations over eastern Siberia,
the North Pacific, and North America for every 0.4° latitude. Biomass burning plumes were identified
following the procedure in Alvarado et al. [12], which we briefly outline here. We used maps of Level 3
daily AIRS retrievals of CO at 1° × 1° resolution to identify the transport of CO from major regions of
boreal biomass burning. We then used TES Level 2 retrievals of CO (V003) to identify the
corresponding plumes that were observed by TES. The CO retrievals for TES special observations
between 15 June and 15 July 2008 were filtered for data quality as recommended in the TES Level 2
Data Users Guide [48]. In general, the retrievals had 1 DOFS below 250 hPa with the region of
maximum sensitivity in the troposphere near 500 hPa. We defined a plume in the TES special
observations as an area where the retrieved CO mixing ratio at 510 hPa exceeded 150 ppb. This
threshold ensured that the CO retrievals were significantly different from the a priori values
(~110 ppb). While this procedure will detect thick plumes that are transported between
continents [49], it does not detect plumes near the surface (where the sensitivity is low) or very thin or
dilute plumes. We then used HYSPLIT back-trajectories [50] to determine if the observed air masses
came from boreal biomass burning regions in Siberia (17 plumes) and Canada (5 plumes). The CO and
O3 retrievals for these plumes were analyzed by Alvarado et al. [12]. In this paper, we restrict our
analysis to the fresh plumes from Canadian biomass burning.
2.2. NH3 Retrieval
NH3 retrievals were performed using TES Level 1B spectra (V003) [41] following the method of
Shephard et al. [20], which has been implemented in V005 of the TES Level 2 products. The a priori
profiles and covariance matrices for TES NH3 retrievals are derived from GEOS-Chem model
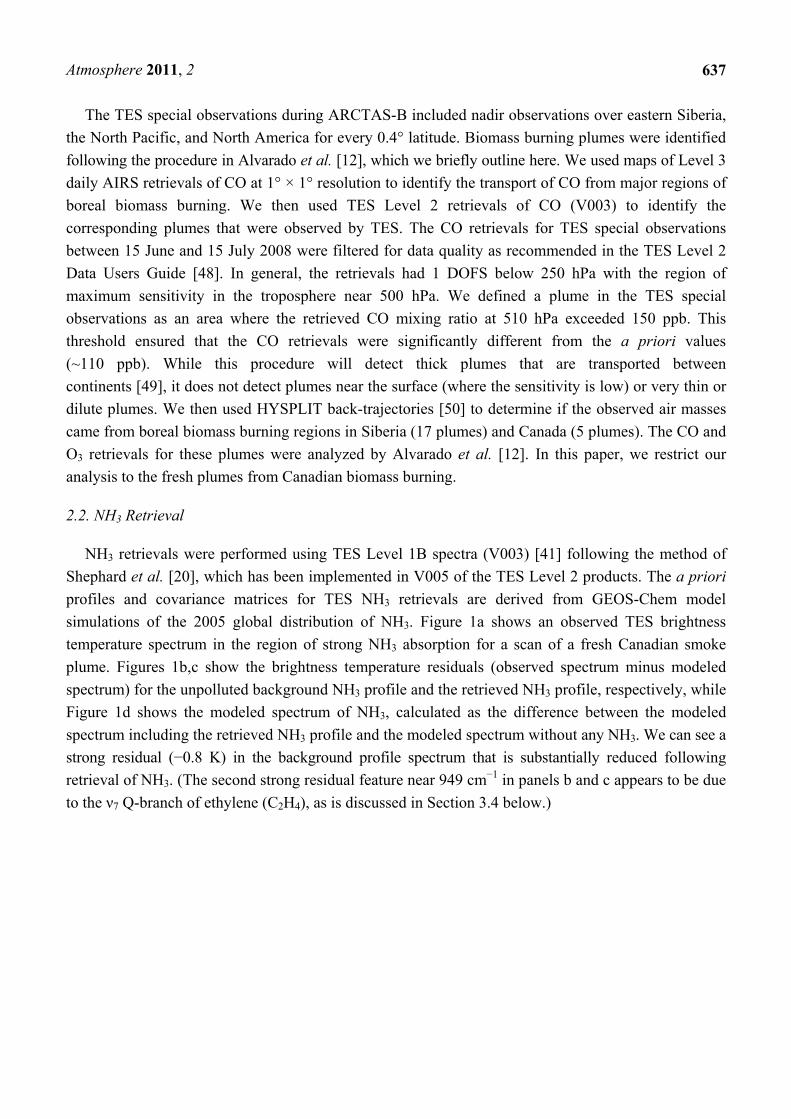
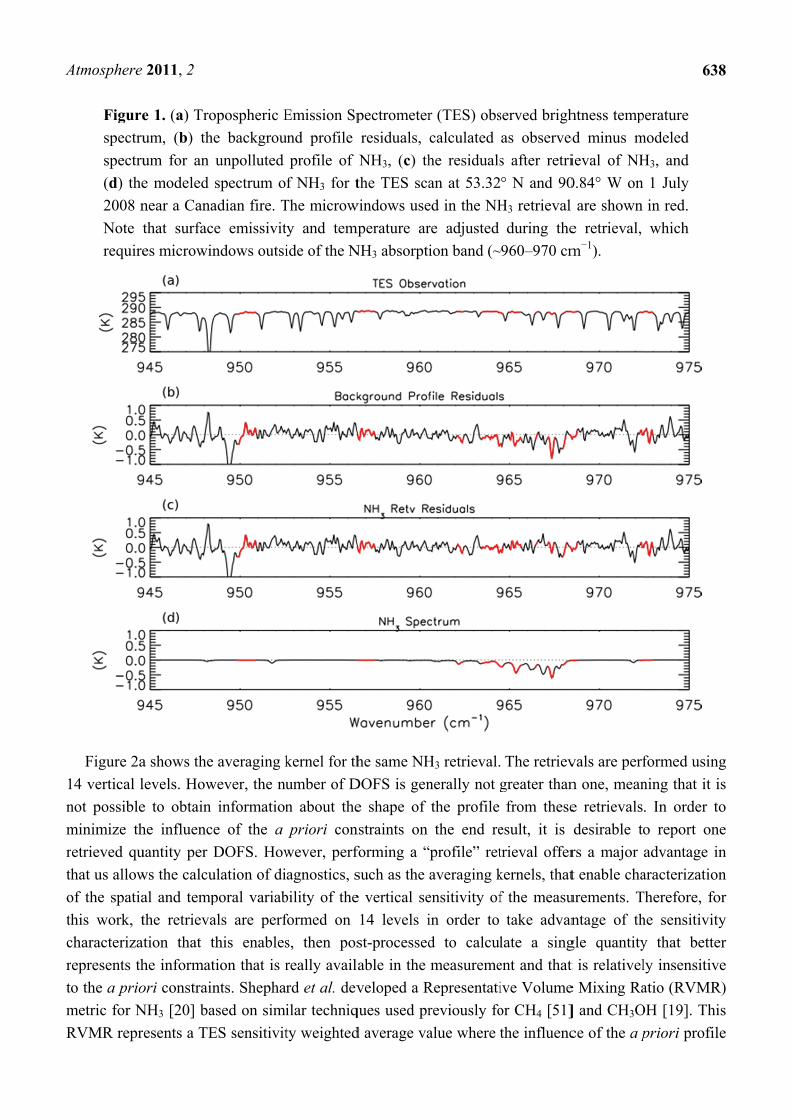
simulations of the 2005 global distribution of NH3. Figure 1a shows an observed TES brightness
temperature spectrum in the region of strong NH3 absorption for a scan of a fresh Canadian smoke
plume. Figures 1b,c show the brightness temperature residuals (observed spectrum minus modeled
spectrum) for the unpolluted background NH3 profile and the retrieved NH3 profile, respectively, while
Figure 1d shows the modeled spectrum of NH3, calculated as the difference between the modeled
spectrum including the retrieved NH3 profile and the modeled spectrum without any NH3. We can see a
strong residual (−0.8 K) in the background profile spectrum that is substantially reduced following
retrieval of NH3. (The second strong residual feature near 949 cm−1 in panels b and c appears to be due
to the ν7 Q-branch of ethylene (C2H4), as is discussed in Section 3.4 below.)
A
1
n
m
r
th
o
th
c
r
to
m
R
Atmosphere
Figure
spectru
spectru
(d) the
2008 n
Note t
require
Figure 2a
14 vertical l
not possible
minimize th
etrieved qu
hat us allow
of the spatia
his work, t
characteriza
epresents th
o the a prio
metric for N
RVMR repr
2011, 2
e 1. (a) Tro
um, (b) the
um for an
e modeled
near a Cana
that surface
es microwin
a shows the
levels. How
e to obtain
he influence
uantity per D
ws the calcu
al and temp
the retrieva
ation that t
he informat
ori constrain
NH3 [20] ba
resents a TE
opospheric E
e backgrou
unpolluted
spectrum o
adian fire. T
e emissivit
ndows outsi
averaging k
wever, the nu
information
e of the a
DOFS. How
ulation of di
poral variab
als are perf
this enables
tion that is r
nts. Shepha
ased on simi
ES sensitivit
Emission Sp
und profile
profile of
f NH3 for t
The microw
ty and temp
ide of the N
kernel for th
umber of D
n about the
priori con
wever, perf
agnostics, s
bility of the
formed on
s, then pos
really availa
rd et al. dev
ilar techniq
ty weighted
pectrometer
residuals,
NH3, (c) th
the TES sca
windows use
mperature ar
NH3 absorpti
he same NH
DOFS is gen
e shape of
nstraints on
forming a “
such as the
e vertical se
14 levels i
st-processed
able in the
veloped a R
ques used pr
d average va
r (TES) obs
calculated
he residuals
an at 53.32
ed in the NH
re adjusted
ion band (~
H3 retrieval.
nerally not g
the profile
the end re
“profile” ret
averaging k
ensitivity of
in order to
d to calcul
measureme
Representati
reviously fo
alue where t
served brigh
as observed
s after retri
° N and 90
H3 retrieval
during the
~960–970 cm
The retriev
greater than
from these
esult, it is
trieval offer
kernels, that
f the measu
take advan
late a sing
ent and that
ive Volume
or CH4 [51]
the influenc
htness temp
d minus m
ieval of NH
0.84° W on
are shown
e retrieval,
m−1).
vals are perf
n one, mean
e retrievals
desirable to
rs a major
t enable cha
urements. T
ntage of th
gle quantity
t is relativel
e Mixing Ra
] and CH3O
ce of the a p
63
perature
modeled
H3, and
1 July
in red.
which
formed usin
ning that it
. In order t
o report on
advantage i
aracterizatio
Therefore, fo
he sensitivit
y that bette
ly insensitiv
atio (RVMR
OH [19]. Th
priori profi
38
ng
is
to
ne
in
on
or
ty
er
ve
R)
his
le

A
is
th
a
N
c
in
a
R
r
a
1
d
s
a
Atmosphere
s reduced a
he signal-to
a priori, sho
NH3 for a f
calculated fr
n the TES s
as the full w
RVMR [20]
oughly 20%
an RVMR o
1–2 ppb [20
detection lev
structure of
are consider
Figure
(b) Ba
(open
Volum
show t
bars en
profile
pseudo
2011, 2
as much as p
o-noise ratio
own as a das
fresh Canad
rom the pro
spectrum, w
width at ha
. With the a
% to 60% of
of approxim
0]. Howeve
vel, which
the atmosph
red valid and
e 2. (a) N
ackground u
blue diamo
me Mixing R
the uncerta
ncompass t
e (open bl
o-RVMR (g
possible. (N
o in the TES
shed blue li
dian smoke
ofile. The ho
while the ve
alf maximu
a priori assu
f the retriev
mately 0.3 p
er, it must
depends st
here for a g
d are includ
NH3 averagi
unpolluted N
onds), retriev
Ratio (RVM
ainty in the
the region o
ack triangl
green invert
Note that fo
S NH3 band
ne in Figure
e plume as
orizontal er
ertical bars e
um (FWHM
umption ab
ved surface v
ppb, corresp
be noted t
trongly on
given scan [
ded in our an
ing kernel
NH3 profile
ved NH3 pr
MR) (red ci
RVMR du
of TES sen
les), retriev
ted triangle)
or NH3, one
d [20]. For th
e 2b, was se
a solid bl
rror bars sh
encompass
M) of the a
bout profile
value for N
ponding to
that this is
the location
[20], and th
nalysis.
for the sa
(open blac
rofile (filled
ircle) for th
ue to noise
nsitivity to N
ved CO pr
) for the sam
of three a p
he scan sho
elected.) Fig
lack line, w
ow the unc
the region
averaging k
shape that w
NH3. The est
a profile w
merely a
n of peak N
us retrieved
ame TES s
k squares),
d black squa
he same sca
in the TES
NH3. (c) Ba
rofile (fille
me scan.
priori profi
own in Figur
gure 2b sho
while the re
ertainty in t
of TES sen
kernel at th
was chosen
timated min
ith a surfac
general est
NH3 mixing
d NH3 RVM
scan as sho
polluted a p
ares) and N
an. The hor
spectrum,
ackground (
ed black tr
files is selec
ures 1 and 2,
ows a retriev
ed circle is
the RVMR
nsitivity to N
he pressure
n here the N
nimum dete
ce mixing r
timate of th
g ratio and
MRs of less
own in Fig
priori NH3
NH3 Represe
rizontal err
while the v
(and a prio
riangles) an
63
cted based o
, the pollute
ved profile o
s the RVM
due to nois
NH3, define
level of th
H3 RVMR
ction level
atio of abou
he minimum
d the therm
than 0.3 pp
gure 1.
profile
entative
or bars
vertical
ori) CO
nd CO
39
on
ed
of
MR
se
ed
he
is
is
ut
m
al
pb

Atmosphere 2011, 2
640
The excess mixing ratio of a trace gas like NH3 (EMR, ∆NH3) is defined as the mixing ratio of the
gas in the smoke plume minus its mixing ratio in the background. This excess mixing ratio can be
normalized using the excess mixing ratio of CO to give the normalized excess mixing ratio (NEMR,
∆NH3/∆CO). The emission ratio (ER) is a special case of the NEMR where the measurements are
made in fresh smoke near the fire source [3]. The NEMR of a trace gas can be highly variable for
reactive gases downwind of fires due to the different rates of deposition and secondary photochemical
production and loss for the trace gas and CO. In this paper, we will refer to our derived NEMRs for
fresh Canadian smoke observed by TES as emission ratios; however, these emission ratios are
inherently convolutions of the initial NEMR and any secondary production and loss processes that
have taken place within the smoke plume during plume lofting and transport from the fire source [28].
Furthermore, the lower sensitivity of the TES retrievals near the surface (see Figure 2a) means that
TES will preferentially sample smoke from the flaming stages of combustion, as these emissions are
more likely to be lofted well above the surface. This lower sensitivity near the surface is due to the
physics of nadir thermal infrared sounding: when the surface and the layers of the atmosphere near the
surface have similar temperatures (low thermal contrast), we cannot distinguish between radiation
emitted by the surface and radiation emitted by the lowest layers of the atmosphere. Similar caution
must be used in interpreting emission ratios measured from other platforms: for example, NEMRs of
NH3 measured at the ground are generally much higher than those measured by aircraft, as the aircraft
does not sample the emissions from residual smoldering combustion very close to the ground
(see Section 3.1 below).
In order to use the TES retrievals of NH3 and CO to calculate the emission ratio of NH3, we first
calculated the RVMR for NH3 following the procedure of Shephard et al. [20]. Since the DOFS for the
CO retrieval are generally higher than for NH3, in order to obtain a comparable metric we transform
the TES CO retrieval using the same grid and weightings as were used to generate the NH3 RVMR to
obtain a pseudo-RVMR for CO. Figure 2c shows the retrieved CO profile for a fresh Canadian smoke
plume as a solid black line while the pseudo-RVMR for CO is shown in green. The emission ratio of
NH3 was then calculated as the slope of a least squares linear regression of the NH3 RVMR and the CO
pseudo-RVMR.
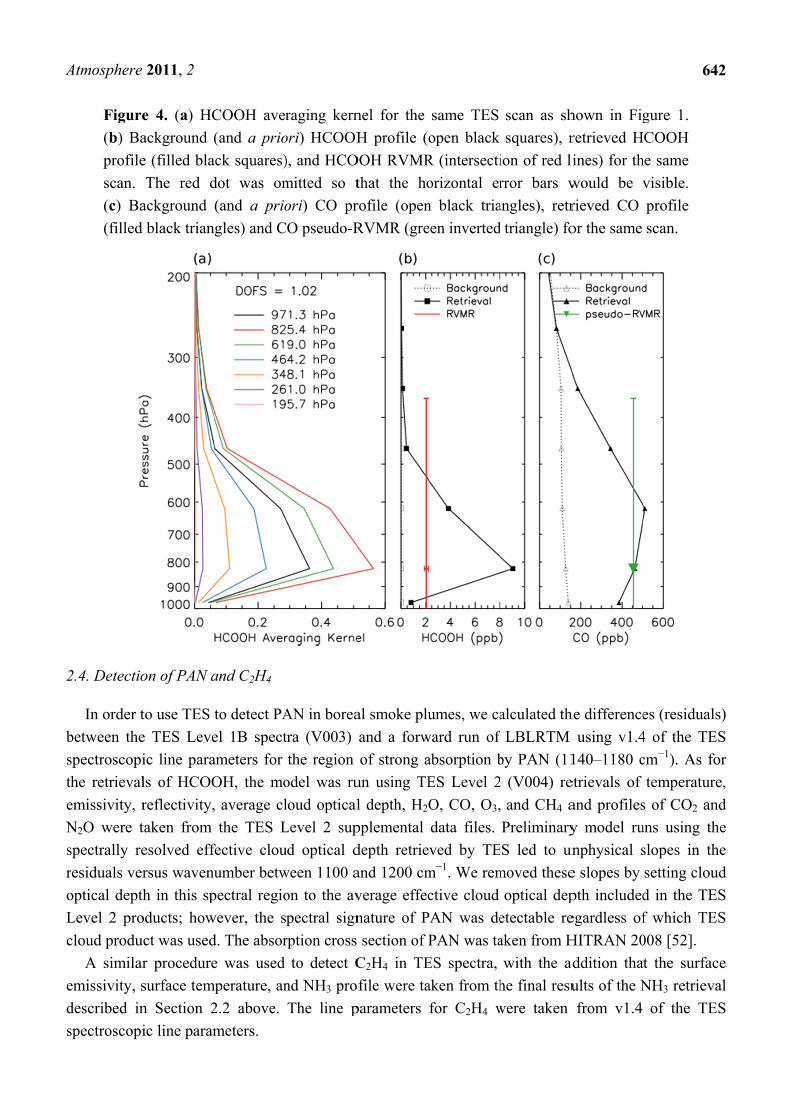
2.3. HCOOH Retrieval
We have developed a prototype retrieval for formic acid (HCOOH) from TES Level 1B spectra.
The retrieval approach is similar to that used for NH3. The spectroscopic parameters for HCOOH were
taken from the HITRAN 2008 database, which substantially improved the estimates of the strengths of
HCOOH lines by removing interference from the formic acid dimer [52]. All other spectroscopic
parameters were taken from v1.4 of the TES spectroscopic line parameters [53]. The a priori constraint
and covariance matrix were compiled from GEOS-Chem model simulations of the 2004 global
background mixing ratios of HCOOH; however, these background profiles may be biased low, as
GEOS-Chem tends to underestimate HCOOH in the northern mid-latitudes [28]. For HCOOH, the
initial guess profile is the same as the a priori constraint vector. LBLRTM was run using TES Level 2
(V004) retrievals of temperature, average cloud optical depth, emissivity, reflectivity, H2O, CO, O3,
and CH4. Profiles of CO2 and N2O were taken from the TES Level 2 supplemental data files. The top

A
p
f
r
in
(
(
s
p
th
s
th
Atmosphere
panel of Fig
for a scan o
ed. Note th
nterfering l
observed sp
−2 K) resid
seen in the th
Figure
(HCOO
after re
as show
An RVM
procedure of
han the retr
sensitivity to
he slope of
2011, 2
gure 3 show
of fresh smo
hat only so
lines from o
pectrum mi
dual in the H
hird panel o
e 3. (a) TE
OH) profile
etrieval of H
wn in Figur
MR for HCO
f Shephard
rieved valu
o HCOOH
the least sq
ws the observ
oke from a
ome section
other speci
inus modele
HCOOH Q-b
of Figure 3.
S observed
e residuals,
HCOOH, an
re 1. The mi
OOH and a
et al. for N
ue at the lev
covers a wi
quares linear
ved TES br
Canadian f
ns of the H
es, principa
ed spectrum
branch (~11
brightness
calculated
nd (d) the m
icrowindow
a correspon
NH3 [20], as
vel of maxi
ide pressure
r regression
rightness tem
fire with th
HCOOH b
ally water v
m) for the b
105 cm−1), w
temperatur
as observed
modeled spec
ws used in th
nding CO p
illustrated
imum sensi
e range. The
n of the HCO
mperature s
he HCOOH
and have b
vapor. The
background
which is rem
re spectrum
d minus mo
ctrum of HC
he HCOOH
pseudo-RVM
in Figure 4
itivity to H
e emission
OOH RVM
spectrum be
retrieval m
been retain
second pan
HCOOH p
moved after
, (b) backg
odeled spect
COOH for t
H retrieval ar
MR were c
. The RVM
COOH, po
ratio of HC
R and the C
etween 109
microwindow
ned in orde
nel shows
profile. We
r retrieval o
ground form
trum, (c) re
the same TE
re shown in
calculated f
MR for HCO
ossibly beca
COOH was
CO pseudo-
64
0–1130 cm
ws shown i
er to remov
the residua
see a stron
f HCOOH a
mic acid
esiduals
ES scan
n red.
following th
OOH is lowe
ause the TE
calculated a
RVMR.
41
−1
in
ve
als
ng
as
he
er
ES
as
A
2
b
s
th
e
N
s
r
o
L
c
e
d
s
Atmosphere
Figure
(b) Ba
profile
scan.
(c) Ba
(filled
2.4. Detectio
In order t
between the
spectroscopi
he retrieval
emissivity, r
N2O were t
spectrally re
esiduals ver
optical depth
Level 2 pro
cloud produ
A similar
emissivity, s
described in
spectroscopi
2011, 2
e 4. (a) HC
ackground (
e (filled bla
The red d
ackground
black trian
on of PAN a
to use TES t
e TES Leve
ic line para
ls of HCOO
reflectivity,
taken from
esolved eff
rsus wavenu
h in this sp
oducts; how
ct was used
r procedure
surface tem
n Section 2
ic line param
COOH aver
(and a prio
ack squares)
dot was om
(and a prio
gles) and C
and C2H4
to detect PA
el 1B spect
ameters for
OH, the mo
, average cl
the TES L
fective clou
umber betw
pectral regio
wever, the s
d. The absor
e was used
mperature, an
2.2 above.
meters.
raging kern
ori) HCOOH
), and HCO
mitted so t
ori) CO pr
CO pseudo-R
AN in borea
tra (V003)
the region
odel was ru
loud optical
Level 2 sup
ud optical d
ween 1100 a
on to the av
pectral sign
rption cross
to detect C
nd NH3 pro
The line p
nel for the
H profile (o
OOH RVMR
that the ho
rofile (open
RVMR (gre
al smoke plu
and a forw
of strong a
un using TE
l depth, H2O
pplemental
depth retrie
and 1200 cm
verage effec
nature of P
section of P
C2H4 in TE
file were ta
parameters
same TES
open black
R (intersecti
orizontal er
n black tria
een inverted
umes, we ca
ward run of
absorption b
ES Level 2
O, CO, O3,
data files.
ved by TE
m−1. We rem
ctive cloud
PAN was de
PAN was ta
ES spectra,
aken from th
for C2H4 w
scan as sh
squares), r
ion of red li
rror bars w
angles), retr
triangle) fo
alculated th
LBLRTM
by PAN (11
2 (V004) re
and CH4 a
Preliminary
ES led to un
moved these
optical dep
etectable re
aken from H
with the ad
he final resu
were taken
hown in Fig
retrieved H
ines) for th
would be v
rieved CO
or the same
he difference
using v1.4
140–1180 c
etrievals of
and profiles
y model ru
unphysical s
e slopes by
pth included
egardless of
HITRAN 20
addition tha
ults of the N
from v1.4
64
gure 1.
COOH
he same
visible.
profile
scan.
es (residual
4 of the TE
cm−1). As fo
temperatur
s of CO2 an
uns using th
slopes in th
setting clou
d in the TE
f which TE
008 [52].
t the surfac
NH3 retriev
of the TE
42
s)
ES
or
re,
nd
he
he
ud
ES
ES
ce
al
ES

A
3
3
b
S
c
th
a
m
s
2
c
o
a
(
c
th
a
d
n
Atmosphere
3. Results a
3.1. Emissio
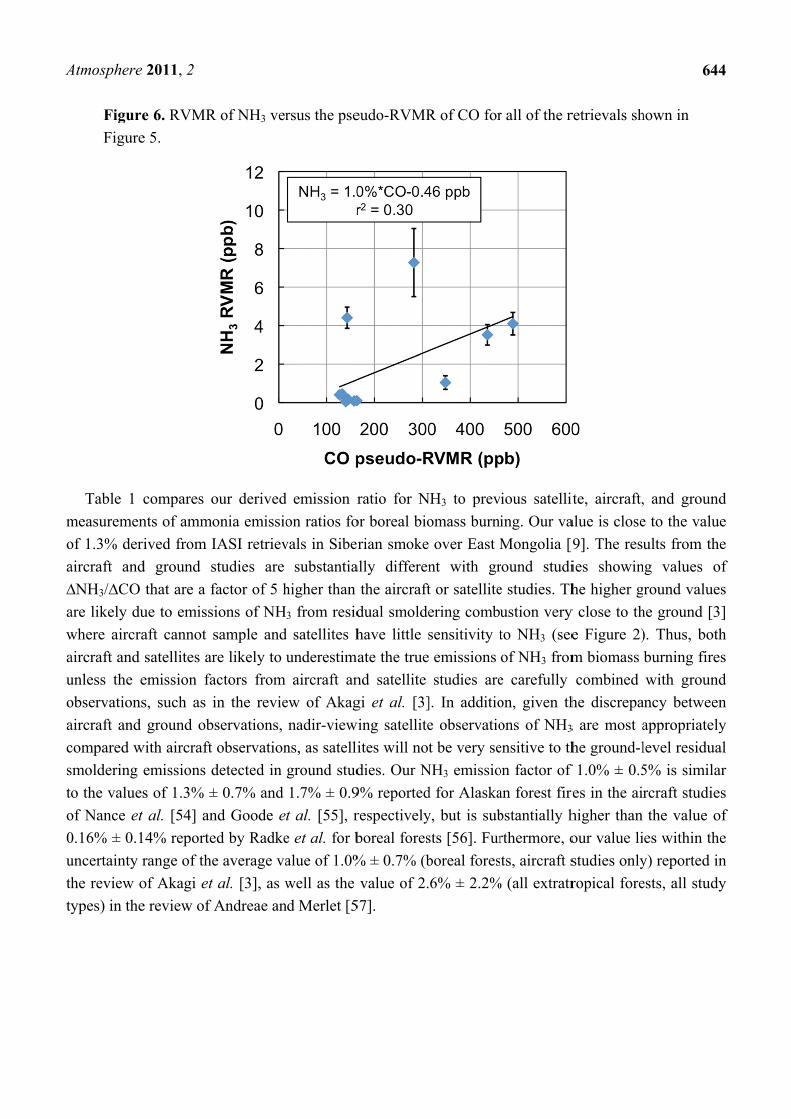
Figure 5
biomass bu
Shephard et
cloud optica
hermal con
and 10 K.
Figure 6
map in Figu
single Canad
2008 (TES R
concentrated
observed bet
We calcu
a large amo
r2 = 0.30).
change the r
he smoke p
and (3) vari
differences i
nitrogen con
Figure
Compo
15 Jun
Canad
2011, 2
and Discuss
on Ratio of N
shows a m
urning in th
t al. [20]. F
al depth is
ntrast betwe
shows the N
ure 5. The m
dian fire ob
Run #7656)
d fresh smo
tween 55.5–
ulate the NH
ount of sca
The scatte
relative sen
plumes, as
iations in th
in the relativ
ntent.
e 5. RVMR
osition of
ne 2008 an
da are shown
sion
NH3
map of the r
he summer
irst, NH3 re
greater than
een the surf
NH3 RVMR
most elevate
served by T
). Due to the
oke. Also i
–59.8°N an
H3 emission
atter in thi
er is likely
sitivity of T
older plum
he initial e
ve fraction
R of NH3 f
the Tropo
nd 15 July
n. Note that
retrieved N
r of 2008.
etrievals are
n 1. Second
face and the
R versus the
ed amounts
TES betwee
e high retrie
included ar
d 88.8–91.4
ratio (∆NH
is plot, wh
due to the
TES to CO
mes could h
missions of
of flaming v
for the TES
sphere from
2008. Onl
t the red poi
NH3 RVMR
We have
e rejected if
d, retrievals
e atmospher
e CO pseudo
of CO and
en 52.5–54.1
eved values
re retrievals
4°W at 18:5
H3/∆CO) for
hich leads t
combinatio
and NH3 in
have lost m
f ammonia
versus smol
S special o
m Aircraft
ly retrievals
int is 7.3 pp
R values wit
filtered the
f the DOFS
s with DOF
ric layer ne
o-RVMR fo
d NH3 come
1°N and 90
for CO (>5
s of NH3 w
51 UTC on
r these fires
to a low c
on of: (1) v
n the smoke
more NH3 to
from the f
ldering com
observations
and Satel
s within bi
pb.
thin smoke
e retrievals
S are less th
FS less than
earest the su
or all of the
e from a fre
.5–91.8°W
500 ppb), th
within a mo
17 June 200
as 1.0% ± 0
correlation
variations in
plume; (2)
o chemical
fires, which
mbustion as w
s for Arctic
lites (ARC
iomass burn
plumes fro
s for qualit
han 0.1 or if
n 0.5 are re
urface is be
e retrievals s
esh smoke p
at 19:03 UT
his plume lik
ore dilute s
08 (TES Ru
0.5%. How
between C
n plume he
) variations
reaction o
h are in tu
well as vari
c Research
CTAS-B) b
ning plume
64
om Canadia
ty followin
f the averag
ejected if th
etween −7 K
shown on th
plume from
TC on 1 Jul
kely contain
moke plum
un #7472).
wever, there
CO and NH
eights, whic
in the age o
or deposition
rn related t
ations in fu
of the
etween
es over
43
an
ng
ge
he
K
he
a
ly
ns
me
is
H3
ch
of
n,
to
el
A
m
o
a
∆
a
w
a
u
o
a
c
s
to
o
0
u
th
ty
Atmosphere
Figure
Figure
Table 1
measuremen
of 1.3% der
aircraft and
∆NH3/∆CO
are likely du
where aircra
aircraft and
unless the e
observations
aircraft and
compared w
smoldering
o the values
of Nance et
0.16% ± 0.1
uncertainty r
he review o
ypes) in the
2011, 2
e 6. RVMR
e 5.
compares o
nts of ammo
rived from I
d ground s
that are a f
ue to emissi
aft cannot s
satellites ar
emission fa
s, such as i
ground ob
with aircraft
emissions d
s of 1.3% ±
t al. [54] an
14% reporte
range of the
of Akagi et
e review of A
R of NH3 ver
our derived
onia emissio
IASI retriev
studies are
factor of 5 h
ions of NH
sample and
re likely to
actors from
in the revie
servations,
observation
detected in
± 0.7% and
nd Goode e
ed by Radke
e average va
al. [3], as w
Andreae an
rsus the pse
d emission r
on ratios fo
vals in Siber
substantia
higher than
3 from resid
d satellites h
underestima
aircraft an
ew of Akag
nadir-view
ns, as satelli
ground stud
1.7% ± 0.9
t al. [55], r
e et al. for b
alue of 1.0%
well as the
nd Merlet [5
eudo-RVMR
ratio for N
or boreal bio
rian smoke
ally differen
the aircraft
dual smolde
have little s
ate the true
nd satellite
gi et al. [3]
wing satellite
ites will not
dies. Our N
9% reported
respectively
boreal fores
% ± 0.7% (b
value of 2.
57].
R of CO for
NH3 to prev
omass burni
over East M
nt with gr
t or satellite
ering combu
sensitivity t
emissions
studies are
]. In additio
e observatio
t be very se
NH3 emissio
d for Alaska
y, but is sub
sts [56]. Fur
boreal fores
6% ± 2.2%
r all of the r
ious satellit
ing. Our va
Mongolia [
round studi
e studies. Th
ustion very
to NH3 (see
of NH3 from
e carefully
on, given th
ons of NH3
ensitive to th
on factor of
an forest fire
bstantially h
rthermore, o
ts, aircraft s
% (all extratr
retrievals sh
ite, aircraft,
alue is close
9]. The resu
ies showin
he higher g
y close to th
e Figure 2)
m biomass
combined
he discrepa
3 are most a
he ground-l
f 1.0% ± 0.5
res in the air
higher than
our value li
studies only
ropical fore
64
hown in
, and groun
e to the valu
ults from th
ng values o
round value
he ground [3
). Thus, bot
burning fire
with groun
ancy betwee
appropriatel
level residu
5% is simila
rcraft studie
the value o
es within th
y) reported i
ests, all stud
44
nd
ue
he
of
es
3]
th
es
nd
en
ly
al
ar
es
of
he
in
dy

Atmosphere 2011, 2
645
Table 1. Ammonia emission ratios (ΔNH3/ΔCO, mol/mol) for boreal biomass burning.
ΔNH3/ΔCO Ecosystem/Fuel Study Type Source 1.0% ± 0.5% Canadian Forest Satellite (TES) This Study
1.3% Siberian Forest Satellite (IASI) [9] 0.16% ± 0.14% Boreal Forests Aircraft [56] 1.3% ± 0.7% Alaskan Forest Aircraft [54] 1.7% ± 0.9% Alaskan Forest Aircraft [55] 6.9% ± 11.1% Boreal Peat Ground [58] 5.9% ± 3.6% Boreal organic soil Ground [58] 6.9% ± 3.2% Boreal organic soil Ground [59] 1.7% ± 2.2% Boreal dead, woody material Ground [59]
3.5% Alaskan Duff Laboratory [4] 1.0% ± 0.7% Boreal Forests Review: Aircraft Only [3] 5.1% ± 5.6% Boreal Forests Review: Ground Only [3] 3.5% ± 3.2% Boreal Forests Review: Aircraft and Ground [3] 2.6% ± 2.2% Extratropical Forests Review: Aircraft, Satellite, and Ground [57]
3.2. Emission Ratio of HCOOH
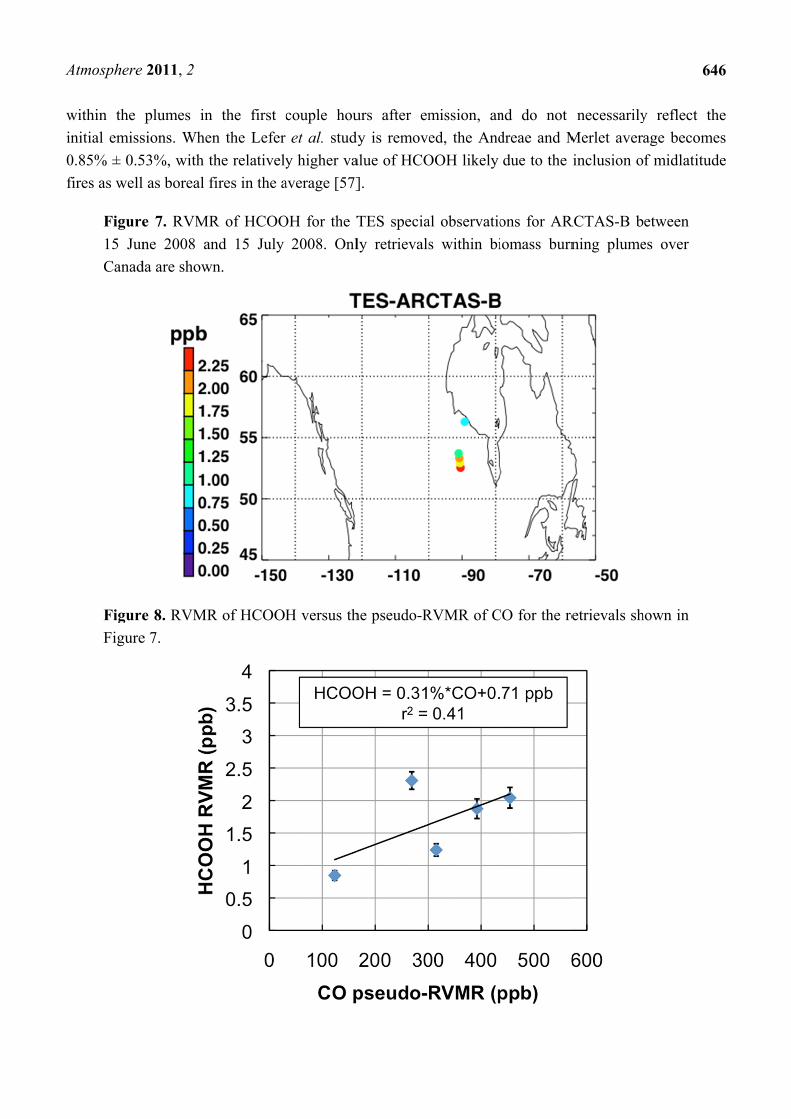
Figure 7 shows a map of the retrieved HCOOH RVMR values within smoke plumes from boreal
biomass burning over Canada. We have removed retrievals with less than 0.5 DOFS for HCOOH,
which also eliminated retrievals with an HCOOH RVMR of less than 0.5 ppbv. The smoke plumes
included in the analysis are the same as described above for NH3. Figure 8 shows the HCOOH RVMR
versus the CO pseudo-RVMR for all of the retrievals shown on the map in Figure 7. We calculate the
emission ratio ∆HCOOH/∆CO for these fires as 0.31% ± 0.21%. As we saw for NH3, there is a large
amount of scatter in this plot that leads to a low correlation between CO and HCOOH (r2 = 0.41).
As discussed above, this scatter is likely due to the combination of variations in (1) plume heights,
(2) plume ages, and (3) initial smoke emissions of HCOOH. The large pressure range of TES
sensitivity to HCOOH may also contribute to the low correlation of HCOOH with CO. It is worth
noting that the ACE-FTS observations of HCOOH within boreal biomass burning plumes showed a
much higher r2 value (0.86), likely due to the fact that the higher vertical resolution of limb retrievals
means that ACE is better able to separate the different vertical layers of the plume which are averaged
together by nadir-viewing sounders like TES and IASI [31].
Table 2 compares our derived emission ratio for HCOOH to previous satellite, aircraft, and ground
measurements of formic acid emission ratios for boreal biomass burning. Our HCOOH emission ratio
is slightly lower than the ratio of 0.38% ± 0.06% derived from ACE-FTS observations [31], possibly
due to the fact that a limb-sounder like ACE is more sensitive to plumes that reach high altitudes; this
type of plume is more common over more flaming fires since fire power output peaks during flaming
combustion [4]. Table 2 shows that our value is similar to the emission ratios for HCOOH derived
from aircraft and ground studies, with the exception of the value of 3.7% ± 2.0% reported for Canadian
forests by Lefer et al. [60], which is about a factor of 10 higher than the average value for boreal
biomass burning in the review of Akagi et al. [3]. However, Lefer et al. note that the elevated
enhancement ratios of HCOOH they observed (0.82% to 6.2%) are likely due to HCOOH production
A
w
in
0
f
Atmosphere
within the
nitial emiss
0.85% ± 0.5
fires as well
Figure
15 Jun
Canad
Figure
Figure
2011, 2
plumes in
sions. When
53%, with th
as boreal fi
e 7. RVMR
ne 2008 an
da are shown
e 8. RVMR
e 7.
the first c
n the Lefer
he relatively
fires in the a
R of HCOO
nd 15 July
n.
R of HCOOH
couple hou
et al. study
y higher va
average [57]
OH for the T
2008. Onl
H versus th
urs after em
dy is remove
alue of HCO
].
TES specia
ly retrievals
he pseudo-R
mission, an
ed, the And
OOH likely
al observatio
s within bi
RVMR of C
nd do not
dreae and M
due to the
ons for AR
iomass burn
CO for the re
necessarily
Merlet avera
inclusion o
RCTAS-B b
ning plume
etrievals sh
64
y reflect th
age become
f midlatitud
etween
es over
hown in
46
he
es
de
A
3
th
Atmosphere
Table
ΔHCOO0.31% ±0.38% ±0.31% ±0.26% ±0.18% ±0.33% ±
0.17% ±
0.30.28% ±
3.7% ±
1.4% ±
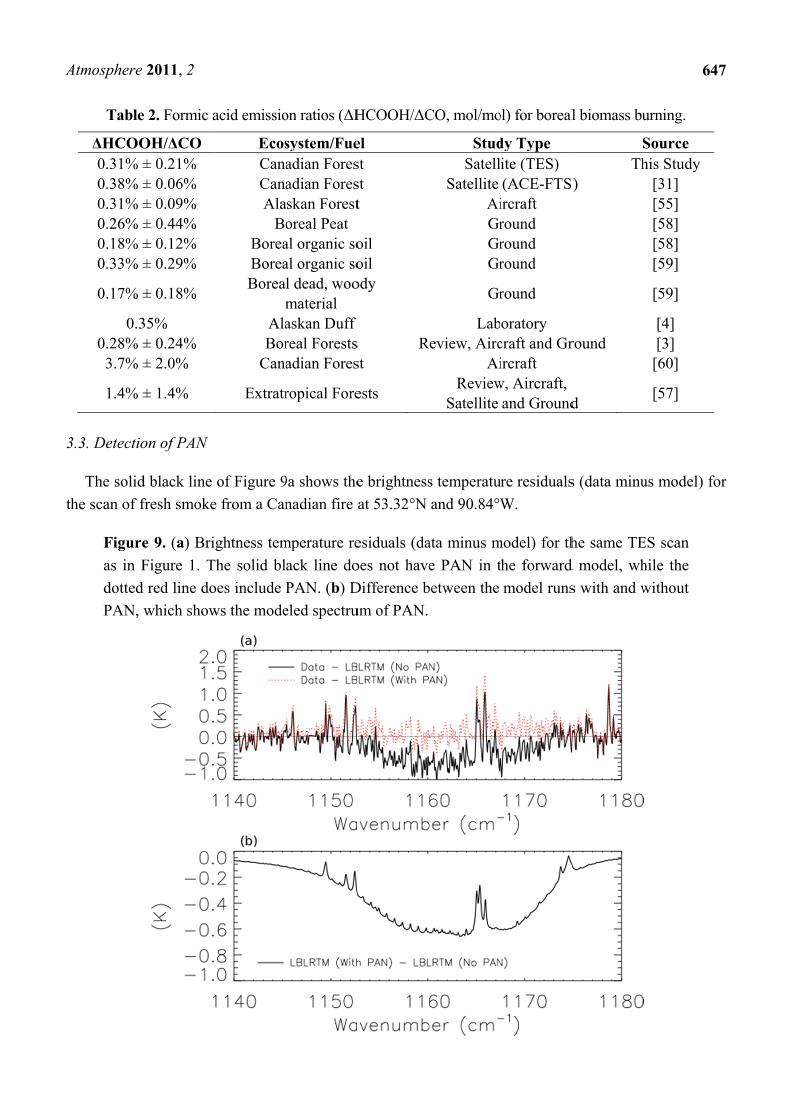
3.3. Detectio
The solid
he scan of f
Figure
as in F
dotted
PAN,
2011, 2
e 2. Formic a
OH/ΔCO ± 0.21% ± 0.06% ± 0.09% ± 0.44% ± 0.12% ± 0.29%
± 0.18%
35% ± 0.24% ± 2.0%
± 1.4%
on of PAN
d black line
fresh smoke
e 9. (a) Bri
Figure 1. T
d red line do
which show
acid emissio
EcosCanaCanaAla
BoBoreaBoreaBorea
mAlaBor
Cana
Extratr
of Figure 9
e from a Can
ightness tem
The solid bl
oes include P
ws the mode
on ratios (ΔH
system/Fueadian Foresadian Fores
askan Forestoreal Peat al organic soal organic sol dead, woomaterial askan Duffreal Forestsadian Fores
ropical Fore
9a shows the
nadian fire
mperature re
ack line do
PAN. (b) D
eled spectru
HCOOH/ΔC
el st st t
oil oil ody
s Rst
ests
e brightness
at 53.32°N
esiduals (da
oes not have
Difference b
um of PAN.
CO, mol/mo
StudSatell
Satellite AiGrGrGr
Gr
LabReview, Airc
AiReview
Satellite
s temperatu
and 90.84°W
ata minus m
e PAN in t
between the
ol) for boreal
dy Type ite (TES) (ACE-FTS
ircraft round round round
round
oratory craft and Grircraft
w, Aircraft, and Ground
re residuals
W.
model) for th
the forward
model runs
l biomass bu
STh
S)
round
d
s (data minu
he same TE
d model, wh
s with and w
64
urning.
Source his Study
[31] [55] [58] [58] [59]
[59]
[4] [3]
[60]
[57]
us model) fo
ES scan
hile the
without
47
or

A
T
1
a
c
P
A
o
r
o
d
3
9
Atmosphere
The two
The dotted r
1.9 ppb at 5
a solid blac
concentratio
PAN observ
ARCTAS-B
observed ne
elatively hi
optical dept
detecting PA
3.4. Detectio
As menti
949 cm−1 tha
Figure
C2H4 p
after a
for the
corresp
2011, 2
lobes of PA
red line sho
60 hPa is ad
ck line. Add
on of PAN
ved 30–60
B [12]. We h
ear Kamcha
igh mixing
th (<0.1). T
AN in bioma
on of C2H4
ioned in Se
at appears t
e 10. (a) T
profile in th
addition of
e same TE
ponding to
AN absorpti
ows the resid
dded to the
ding the PA
in the assu
min down
have also de
atka (not sh
ratios of C
This low clo
ass burning
ection 2.2 a
o be due to
TES observ
he model, c
a hypothet
ES scan as
the ν7 Q-bra
ion are clea
duals when
forward mo
AN profile
umed profile
nwind of th
etected PAN
hown). Thes
CO (mixing
oud optical
g smoke plum
above, ther
absorption
ved brightne
calculated a
tical profile
shown in F
anch, is sho
arly visible o
n a hypothet
odel, and F
substantial
e is about a
he Lake M
N in a scan
se two scan
g ratio > 2
depth may
mes with T
re is a seco
by C2H4.
ess tempera
as observed
e of C2H4,
Figure 1. T
own in red.
on either sid
tical PAN p
igure 9b sh
lly reduces
a factor of
McKay fire
of aged smo
ns shared se
50 ppbv at
y be a nece
ES.
ond strong
ature spectr
d minus mo
and (d) the
The area of
de of the w
profile with
ows the mo
the mean r
2 higher th
in Saskatc
oke from Si
everal comm
510 hPa)
essary but i
residual fea
rum, (b) re
deled spect
e modeled s
f strong abs
water line at
a peak con
odeled PAN
residuals, b
han the con
chewan, Ca
iberian biom
mon featur
and low av
insufficient
ature in Fig
esiduals wit
trum, (c) re
spectrum o
sorption by
64
~1165 cm−
ncentration o
N spectrum a
but this pea
centration o
anada durin
mass burnin
es, includin
verage clou
criterion fo
gure 1c nea
thout a
esiduals
of C2H4
y C2H4,
48
−1.
of
as
ak
of
ng
ng
ng
ud
or
ar
Atmosphere 2011, 2
649
Figure 10b shows this residual feature, which partially overlaps with the strong CO2 line [39] that is
visible in the TES spectrum shown in Figure 10a. Figure 10c shows that the addition of a hypothetical
C2H4 profile to the model (with a peak concentration of 1.9 ppb at the surface) removes this feature.
This peak C2H4 mixing ratio is approximately the 85th percentile of C2H4 observations observed
downwind of the Lake McKay fire in Saskatchewan, Canada during ARCTAS-B [12]. While the scan
in Figure 10 did have a low cloud optical depth, this criterion is likely to be less important for
detecting C2H4 within fresh biomass burning plumes using TES, as the residual feature of C2H4 is both
stronger and sharper than the PAN feature. However, the short lifetime of C2H4 may make it difficult
to detect in smoke that is several hours old.
4. Conclusions
We have retrieved mixing ratios of ammonia (NH3) and formic acid (HCOOH) within biomass
burning smoke plumes over Canada from TES radiance measurements. We have combined these
retrievals with the TES retrievals of CO to calculate molar ratios of NH3 and HCOOH to CO within
biomass burning plumes by calculating representative volume mixing ratios for NH3 and HCOOH and
then mapping the CO retrieval to the same vertical grid. Our estimated emission ratios for NH3
(1.0% ± 0.5%) and HCOOH (0.31% ± 0.21%) for forest fires in Canada are within the range of values
reported in the literature for airborne and satellite studies of boreal biomass burning emissions. This
work thus provides a method for the use of TES spectra to study the emissions of NH3 and HCOOH
from biomass burning. This method, if applied to the entire TES data set, would help to estimate the
spatial and temporal variability of these emissions. This information could then be used, in concert
with the other satellite observations discussed in Section 1 of our manuscript, to provide improved
estimates of the emissions of these trace gases for use in models of atmospheric chemistry, air quality,
and climate.
We have shown that TES can observe peroxy acetyl nitrate (PAN) and ethylene (C2H4) within
boreal biomass burning plumes. A low cloud optical depth (<0.1) appears to be required for successful
detection of PAN by TES within biomass burning smoke plumes. Continuing this line of research
could lead to maps of tropospheric PAN concentrations near source regions, which would help to
constrain the fate of NOx emission within atmospheric chemistry models. These could be combined
with satellite estimates of the emissions of ethylene from biomass burning to help reduce the
uncertainty in the impact of biomass burning on tropospheric ozone.
Acknowledgments
This research was supported by NASA grant NNX10AG65G to the University of Minnesota and
NASA grants to Atmospheric and Environmental Research (AER) including Grant NNH08CD52C.
This work was supported in part by the University of Minnesota Supercomputing Institute. We thank
Eli Mlawer of AER, P. F. Bernath of the University of York, and the anonymous reviewers for their
helpful comments.
Atmosphere 2011, 2
650
References
1. Crutzen, P.J.; Andreae, M.O. Biomass burning in the tropics: Impact on atmospheric chemistry
and biogeochemical cycles. Science 1990, 250, 1669–1678.
2. Bond, T.C.; Streets, D.G.; Yarber, K.F.; Nelson, S.M.; Woo, J.-H.; Klimont, Z. A technology-based
global inventory of black and organic carbon emissions from combustion. J. Geophys. Res. 2004,
109, doi:10.1029/2003JD003697.
3. Akagi, S.K.; Yokelson, R.J.; Wiedinmyer, C.; Alvarado, M.J.; Reid, J. S.; Karl, T.; Crounse, J.D.;
Wennberg, P.O. Emission factors for open and domestic biomass burning for use in atmospheric
models. Atmos. Chem. Phys. 2011, 11, 4039–4072.
4. Burling, I.R.; Yokelson, R.J.; Griffith, D.W.T.; Johnson, T.J.; Veres, P.; Roberts, J.M.;
Warneke, C.; Urbanski, S.P.; Reardon, J.; Weise, D.R.; et al. Laboratory measurements of trace
gas emissions from biomass burning of fuel types from the southeastern and southwestern United
States. Atmos. Chem. Phys. 2010, 10, 11115–11130.
5. Wooster, M.J.; Roberts, G.; Perry, G.L.W.; Kaufman, Y.J. Retrieval of biomass combustion rates
and totals from fire radiative power observations: FRP derivation and calibration relationships
between biomass consumption and fire radiative energy release. J. Geophys. Res. 2005, 110,
doi:10.1029/2005JD006318.
6. Ichoku, C.; Kaufman, Y.J. A method to derive smoke emission rates from MODIS fire radiative
energy measurements. IEEE Trans. Geosci. Rem. Sensing 2005, 43, 2636–2649.
7. Mebust, A.K.; Russell, A.R.; Hudman, R.C.; Valin, L.C.; Cohen, R.C. Characterization of
wildfire NOx emissions using MODIS fire radiative power and OMI tropospheric NO2 columns.
Atmos. Chem. Phys. 2011, 11, 5839–5851.
8. Kopacz, M.; Jacob, D.J.; Fisher, J.A.; Logan, J.A.; Zhang, L.; Megretskaia, I.A.; Yantosca, R.M.;
Singh, K.; Henze, D.K.; Burrows, J.P.; et al. Global estimates of CO sources with high resolution
by adjoint inversion of multiple satellite datasets (MOPITT, AIRS, SCIAMACHY, TES).
Atmos. Chem. Phys. 2010, 10, 855–876.
9. Coheur, P.-F.; Clarisse, L.; Turquety, S.; Hurtmans, D.; Clerbaux, C. IASI measurements of reactive
trace species in biomass burning plumes. Atmos. Chem. Phys. 2009, 9, 5655–5667.
10. Clarisse, L.; R’Honi, Y.; Coheur, P.-F., Hurtmans, D.; Clerbaux, C. Thermal infrared nadir
observations of 24 atmospheric gases. Geophys. Res. Lett. 2011, 38, doi:10.1029/2011GL047271.
11. Verma, S.; Worden, J.; Pierce, B.; Jones, D.B.A.; Al-Saadi, J.; Boersma, F.; Bowman, K.;
Eldering, A.; Fisher, B.; Jourdain, L.; et al. Ozone production in boreal fire smoke plumes using
observations from the Tropospheric Emission Spectrometer and the Ozone Monitoring
Instrument. J. Geophys. Res. 2009, 114, doi:10.1029/2008JD010108.
12. Alvarado, M.J.; Logan, J.A.; Mao, J.; Apel, E.; Riemer, D.; Blake, D.; Cohen, R.C.; Min, K.-E.;
Perring, A.E.; Browne, E.C.; et al. Nitrogen oxides and PAN in plumes from boreal fires during
ARCTAS-B and their impact on ozone: An integrated analysis of aircraft and satellite
observations. Atmos. Chem. Phys. 2010, 10, 9739–9760.
Atmosphere 2011, 2
651
13. Dupont, R.; Pierce, B.; Worden, J.; Hair, J.; Fenn, M.; Hamer, P.; Natarajan, M.; Schaack, T.;
Lenzen, A.; Apel, E.; et al. Reconstructing ozone chemistry from Asian wild fires using models,
satellite and aircraft measurements during the ARCTAS campaign. Atmos. Chem. Phys. Discuss.
2010, 10, 26751–26812.
14. Jacob, D.J.; Crawford, J.H.; Maring, H.; Clarke, A.D.; Dibb, J.E.; Emmons, L.K.; Ferrare, R.A.;
Hostetler, C.A.; Russell, P.B.; Singh, H.B.; et al. The Arctic Research of the Composition of the
Troposphere from Aircraft and Satellites (ARCTAS) mission: Design, execution, and first results.
Atmos. Chem. Phys. 2010, 10, 5191–5212.
15. Hegg, D.A.; Radke, L.F.; Hobbs, P.V.; Riggan, P.J. Ammonia emissions from biomass burning.
Geophys. Res. Lett. 1988, 15, 335–337.
16. Henze, D.K.; Seinfeld, J.H.; Shindell, D.T. Inverse modeling and mapping US air
quality influences of inorganic PM2.5 precursor emissions using the adjoint of GEOS-Chem.
Atmos. Chem. Phys. 2009, 9, 5877–5903.
17. Langford, A.O.; Fehsenfeld, F.S.; Zachariassen, J.; Schimel, D.S. Gaseous ammonia fluxes and
background concentrations in terrestrial ecosystems of the United States. Glob. Biogeochem.
Cycles 1992, 6, 459–483.
18. Worden, H.; Beer, R.; Rinsland, C. Airborne infrared spectroscopy of 1994 western wildfires.
J. Geophys. Res. 1997, 102, 1287–1299.
19. Beer, R.; Shephard, M.W.; Kulawik, S.S.; Clough, S.A.; Eldering, A.; Bowman, K.W.; Sander, S.P.;
Fisher, B.M.; Payne, V.H.; Luo, M.; et al. First satellite observations of lower tropospheric
ammonia and methanol. Geophys. Res. Lett. 2008, 35, doi:10.1029/2008GL033642.
20. Shephard, M.W.; Cady-Pereira, K.E.; Luo, M.; Henze, D.K.; Pinder, R.W.; Walker, J.T.;
Rinsland, C.P.; Bash, J.O.; Zhu, L.; Payne, V.H.; et al. TES ammonia retrieval strategy and global
observations of the spatial and seasonal variability of ammonia. Atmos. Chem. Phys. Discuss.
2011, 11, 16023–16074.
21. Pinder, R.W.; Walker, J.T.; Bash, J.O.; Cady-Pereira, K.E.; Henze, D.K.; Luo, M.; Osterman, G.B.;
Shephard, M.W. Quantifying spatial and seasonal variability in atmospheric ammonia with in situ
and space-based observations. Geophys. Res. Lett. 2011, 38, doi:10.1029/2010GL046146.
22. Clarisse, L.; Clerbaux, C.; Dentener, F.; Hurtsmans, D.; Coheur, P.-F. Global ammonia distribution
derived from infrared satellite observations. Nat. Geosci. 2009, 2, 479–483.
23. Kawamura, K.; Steinberg, S.; Kaplan, I.R. Homologous series of C1-C10 monocarboxylic acids
and C1-C6 carbonyls in Los Angeles air and motor vehicle exhausts. Atmos. Environ. 2000, 34,
4175–4191.
24. Keene, W.C.; Galloway, J.N. The biogeochemical cycling of formic and acetic acids through the
troposphere: An overview of current understanding. Tellus B 1988, 40B, 322–334.
25. Avery, G.B, Jr.; Tang, Y.; Kieber, R.J.; Willey, J.D. Impact of recent urbanization on formic and
acetic acid concentrations in coastal North Carolina rainwater. Atmos. Environ. 2001, 35,
3353–3359.
26. Shephard, M.W.; Goldman, A.; Clough, S.A.; Mlawer, E.J. Spectroscopic improvements providing
evidence of formic acid in AERI-LBLRTM validation spectra. J. Quant. Spectrosc. Radiat.
Transf. 2003, 82, 383–390.
Atmosphere 2011, 2
652
27. Rinsland, C.P.; Mahieu, E.; Zander, R.; Goldman, A.; Wood, S.; Chiou, L. Free tropospheric
measurements of formic acid (HCOOH) from infrared ground-based solar absorption spectra:
Retrieval approach, evidence for a seasonal cycle, and comparison with model calculations.
J. Geophys. Res. 2004, 109, doi:10.1029/2004JD004917.
28. Paulot, F.; Wunch, D.; Crounse, J.D.; Toon, G.C.; Millet, D.B.; DeCarlo, P.F.; Vigouroux, C.;
Deutscher, N.M.; González Abad, G.; Notholt, J.; et al. Importance of secondary sources in the
atmospheric budgets of formic and acetic acids. Atmos. Chem. Phys. 2011, 11, 1989–2013.
29. Yokelson, R.J.; Crounse, J.D.; DeCarlo, P.F.; Karl, T.; Urbanski, S.; Atlas, E.; Campos, T.;
Shinozuka, Y.; Kapustin, V.; Clarke, A.D.; et al. Emissions from biomass burning in the Yucatan.
Atmos. Chem. Phys. 2009, 9, 5785–5812.
30. Rinsland, C.P.; Boone, C.D.; Bernath, P.F.; Mahieu, E.; Zander, R.; Dufour, G.; Clerbaux, C.;
Turquety, S.; Chiou, L.; McConnell, J.C.; et al. First space-based observations of formic acid
(HCOOH): Atmospheric Chemistry Experiment austral spring 2004 and 2005 Southern Hemisphere
tropical-mid-latitude upper tropospheric measurements. Geophys. Res. Lett. 2006, 33,
doi:10.1029/2006GL027128.
31. Tereszchuk, K.A.; González Abad, G.; Clerbaux, C.; Hurtmans, D.; Coheur, P.-F.; Bernath, P.F.
ACE-FTS measurements of trace species in the characterization of biomass burning plumes.
Atmos. Chem. Phys. Discuss. 2011, 11, 16611–16637.
32. Grutter, M.; Glatthor, N.; Stiller, G.P.; Fischer, H.; Grabowski, U.; Höpfner, M.; Kellmann, S.;
Linden, A.; von Clarmann, T. Global distribution and variability of formic acid as observed by
MIPAS-ENVISAT. J. Geophys. Res. 2010, 115, doi:10.1029/2009JD012980.
33. Razavi, A.; Karagulian, F.; Clarisse, L.; Hurtmans, D.; Coheur, P.F.; Clerbaux, C.; Müller, J.F.;
Stavrakou, T. Global distributions of methanol and formic acid retrieved for the first time from
the IASI/MetOp thermal infrared sounder. Atmos. Chem. Phys. 2011, 11, 857–872.
34. Val Martín, M.; Honrath, R.E.; Owen, R.C.; Pfister, G.; Fialho, P.; Barata, F. Significant
enhancements of nitrogen oxides, black carbon, and ozone in the North Atlantic lower free
troposphere resulting from North American boreal wildfires. J. Geophys. Res. 2006, 111,
doi:10.1029/2006JD007530.
35. Leung, F.-Y.T.; Logan, J.A.; Park, R.; Hyer, E.; Kasischke, E.; Streets, D.; Yurganov, L. Impacts
of enhanced biomass burning in the boreal forests in 1998 on tropospheric chemistry and the
sensitivity of model results to the injection height of emissions. J. Geophys. Res. 2007, 112,
doi:10.1029/2006JD008132.
36. Real, E.; Law, K.S.; Weinzierl, B.; Fiebig, M.; Petzold, A.; Wild, O.; Methven, J.; Arnold, S.;
Stohl, A.; Huntrieser, H.; et al. Processes influencing ozone levels in Alaskan forest fire plumes
during long-range transport over the North Atlantic. J. Geophys. Res. 2007, 112,
doi:10.1029/2006JD007576.
37. Jacob, D.; Wofsy, S.C.; Bakwin, P.S.; Fan, S.-M.; Harriss, R.C.; Talbot, R.W.; Bradshaw, J.D.;
Sandholm, S.T.; Singh, H.B.; Browell, E.V.; et al. Summertime Photochemistry of the
Troposphere at High Northern Latitudes. J. Geophys. Res. 1992, 97, 16421–16431.
38. Moore, D.P.; Remedios, J.J. Seasonality of Peroxyacetyl nitrate (PAN) in the upper troposphere
and lower stratosphere using the MIPAS-E instrument. Atmos. Chem. Phys. 2010, 10, 6117–6128.
Atmosphere 2011, 2
653
39. Coheur, P.-F.; Herbin, H.; Clerbaux, C.; Hurtmans, D.; Wespes, C.; Carleer, M.; Turquety, S.;
Rinsland, C.P.; Remedios, J.; Hauglustaine, D.; et al. ACE-FTS observation of a young biomass
burning plume: First reported measurements of C2H4, C3H6O, H2CO and PAN by infrared
occultation from space. Atmos. Chem. Phys. 2007, 7, 5437–5446.
40. Alvarado, M.J.; Prinn, R.G. Formation of ozone and growth of aerosols in young smoke plumes
from biomass burning: 1. Lagrangian parcel studies. J. Geophys. Res. 2009, 114,
doi:10.1029/2008JD011144.
41. Shephard, M.W.; Worden, H.M.; Cady-Pereira, K.E.; Lampel, M.; Luo, M.; Bowman, K.W.;
Sarkissian, E.; Beer, R.; Rider, D.M.; Tobin, D.C.; et al. Tropospheric Emission Spectrometer
nadir spectral radiance comparisons. J. Geophys. Res. 2008, 113, doi:10.1029/2007JD008856.
42. Clough, S.A.; Shephard, M.W.; Worden, J.; Brown, P.D.; Worden, H.M.; Luo, M.; Rodgers, C.D.;
Rinsland, C.P.; Goldman, A.; Brown, L.; et al. Forward model and jacobians for tropospheric
emission spectrometer retrievals. IEEE Trans. Geosci. Remote 2006, 44, 1308–1323.
43. Shephard, M.W.; Clough, S.A.; Payne, V.H.; Smith, W.L; Kireev, S.; Cady-Pereira, K.E.
Performance of the line-by-line radiative transfer model (LBLRTM) for temperature and species
retrievals: IASI case studies from JAIVEx. Atmos. Chem. Phys. 2009, 9, 7397–7417.
44. Rodgers, C.D. Inverse Methods for Atmospheric Sounding: Theory and Practice; World
Scientific: Hackensack, NJ, USA, 2000.
45. Bowman, K.W.; Rodgers, C.D.; Sund-Kulawik, S.; Worden, J.; Sarkissian, E.; Osterman, G.;
Steck, T.; Luo, M.; Eldering, A.; Shephard, M.W.; et al. Tropospheric emission spectrometer:
Retrieval method and error analysis. IEEE Trans. Geosci. Remote 2006, 44, 1297–1307.
46. Kulawik, S.S.; Worden, J.; Eldering, A.; Bowman, K.; Gunson, M.; Osterman, G.B.; Zhang, L.;
Clough, S.A.; Shephard, M.W.; Beer, R. Implementation of cloud retrievals for Tropospheric
Emission Spectrometer (TES) atmospheric retrievals: Part 1. Description and characterization of
errors on trace gas retrievals. J. Geophys. Res. 2006, 111, doi:10.1029/2005JD006733.
47. Reid, J.S.; Koppmann, R.; Eck, T.F.; Eleuterio, D.P. A review of biomass burning emissions part II:
Intensive physical properties of biomass burning particles. Atmos. Chem. Phys. 2005, 5, 799–825.
48. Bowman, K.; Eldering, A.; Fisher, B.; Herman, R.; Jacob, D.; Jourdain, L.; Kulawik, S.; Luo, M.;
Monarrez, R.; et al. Earth Observating System (EOS) Tropospheric Emission Spectrometer (TES)
Level 2 (L2) Data User’s Guide; Osterman, G., Ed.; Jet Propulsion Laboratory (JPL): Pasadena,
CA, USA, 2008.
49. Zhang, L.; Jacob, D.J.; Boersma, K.F.; Jaffe, D.A.; Olson, J.R.; Bowman, K.W.; Worden, J.R.;
Thompson, A.M.; Avery, M.A.; Cohen, R.C.; et al. Transpacific transport of ozone pollution and
the effect of recent Asian emission increases on air quality in North America: An integrated
analysis using satellite, aircraft, ozonesonde, and surface observations. Atmos. Chem. Phys. 2008,
8, 6117–6136.
50. Air Resources Laboratory. HYSPLIT—Hybrid Single Particle Lagrangian Integrated Trajectory
Model. Available online: http://ready.arl.noaa.gov/HYSPLIT.php (accessed on 25 September 2008).
51. Payne, V.H.; Clough, S.A.; Shephard, M.W.; Nassar, R.; Logan, J.A. Information-centered
representation of retrievals with limited degrees of freedom for signal: Application to methane
from the Tropospheric Emission Spectrometer. J. Geophys. Res. 2009, 17, 1095.
Atmosphere 2011, 2
654
52. Rothman, L.; Gordon, I.E.; Barbe, A.; Benner, D.C.; Bernath, P.F.; Birk, M.; Boudon, V.;
Brown, L.R.; Campargue, A.; Champion, J.-P.; et al. The HITRAN 2008 molecular spectroscopic
database. J. Quant. Spectrosc. Radiat. Transf. 2009, 110, 533–572.
53. AER Line Parameter Database. What’s New. Available online: http://rtweb.aer.com/
line_param_frame.html (accessed on 1 August 2010).
54. Nance, J.; Hobbs, P.; Radke, L.; Ward, D. Airborne measurements of gases and particles from an
Alaskan wildfire. J. Geophys. Res. 1993, 98, 14873–14882.
55. Goode, J.G.; Yokelson, R.J.; Ward, D.E.; Susott, R.A.; Babbitt, R.E.; Davies, M.A.; Hao, W.M.
Measurements of excess O3, CO2, CO, CH4, C2H4, C2H2, HCN, NO, NH3, HCOOH, CH3COOH,
HCHO and CH3OH in 1997 Alaskan biomass burning plumes by airborne fourier transform
infraredspectrscopy (AFTIR). J. Geophys. Res. 2000, 105, 22147–22166.
56. Radke, L.F.; Hegg, D.A.; Hobbs, P.V.; Nance, J.D.; Lyons, J.H.; Laursen, K.K.; Weiss, R.E.;
Riggan, P.J.; Ward, D.E. Particulate and Trace Gas Emissions from Large Biomass Fires in North
America. In Global Biomass Burning: Atmospheric, Climatic, and Biospheric Implications;
Levine, J.S., Ed.; MIT Press: Cambridge, MA, USA, 1991; pp. 209–224.
57. Andreae, M.; Merlet, P. Emission of trace gases and aerosols from biomass burning.
Glob. Biogeochem. Cycles 2001, 15, 955–966.
58. Yokelson, R.; Susott, R.; Ward, D.; Reardon, J.; Griffith, D. Emissions from smoldering combustion
of biomass measured by open-path Fourier transform infrared spectroscopy. J. Geophys. Res.
1997, 102, 18865–18877.
59. Bertschi, I.; Yokelson, R.J.; Ward, D.E.; Babbitt, R.E.; Susott, R.A.; Goode, J.G.; Hao, W.M.
Trace gas and particle emissions from fires in large diameter and belowground biomass fuels.
J. Geophys. Res. 2003, 108, doi:10.1029/2002JD002100.
60. Lefer, B.; Talbot, R.W.; Harriss, R.H.; Bradshaw, J.D.; Sandholm, S.T.; Olson, J.O.;
Sachse, G.W.; Collins, J.; Shipham, M.A.; Blake, D.R.; et al. Enhancement of acidic gases in
biomass burning impacted air masses over Canada. J. Geophys. Res. 1994, 99, 1721–1737.
© 2011 by the authors; licensee MDPI, Basel, Switzerland. This article is an open access article
distributed under the terms and conditions of the Creative Commons Attribution license
(http://creativecommons.org/licenses/by/3.0/).