emission controlled profit based unit commitment for ... controlled profit based unit commitment for...
TRANSCRIPT
Emission controlled Profit based Unit commitment for GENCOs using
MPPD Table with ABC algorithm under Competitive Environment
K. ASOKAN and R. ASHOKKUMAR Department of Electrical Engineering,
Annamalai University Annamalai Nagar, Tamil Nadu
INDIA [email protected]
[email protected] Abstract: - The fossil fuelled power plants are discharging green house gases into the atmosphere which leads to the climate change and global warming around the world. Environmental factors become subject of matter for fossil – fuelled power producers and must be considered in the optimization problem. In this article the profit based unit commitment problem has been analyzed with emission limitations using Modified Pre –Prepared power Demand (MPPD) Table with Artificial Bee Colony (ABC) algorithm. An electricity market facilitated by emission minimization is believed to help to reduce the global warming and paves the way to enhance the profit of generation companies. The proposed approach is demonstrated on 10 units 24 hour (IEEE 39 bus system) test systems and numerical results are tabulated. The MPPD-ABC algorithm appears to be robust, simple and reliable optimization algorithm for the solution of PBUC problem with emission constraints.
Key-Words: - Deregulation, Profit based UC, Profit maximization, Emission limitations, MPPD table with ABC algorithm
1 Introduction Electric power plants consuming coal as primary energy source and releases different types of green house gases such as sulphur oxides, nitrogen oxides and carbon di-oxides into atmosphere. Enormous quantity of these contaminants in atmosphere results to a hazardous impact on mankind. Therefore it is mandatory for electric utilities to minimize the pollution level by reducing SO2 and NO2. It is understood that the green house effect can be slowed down only if the emission of CO2 and other green house gases is reduced drastically [1]. That is why the emission limitation is an important aspect of the electric power plants
A major achievement in this scenario is the Kyoto protocol [2], an international treaty and an agreement under which industrialized countries used to reduce the green house gases by 5% over the five year period of 2008-2012. The novelty of this agreement is that, it prescribes the binding strategies for 37 industrialized countries and the European community for reducing green house gas. Based on this agreement spain and Portugal are permitted to increase this carbon emission up to 15% and 27% respectively in the year 2008-2012. The emission has been increased more than 50% in these countries in 2005. One of the major outcomes of the Kyoto protocol is the establishment of a carbon emissions
trading scheme. The emissions trading scheme come into effect from Jan 2005, which includes emissions from plants in the oil refinery, smelting, steel, cement, ceramics, glass, paper mills and permits trading of emission allowances.
The environmental pollution caused by the power generating companies’ raise many queries involving environmental safety and methods of minimizing pollution from power plants either by design or by scheduling strategies. Particularly, the prospects of emissions of fossil fuelled power plants which consume coal, oil, gas or combinations as the primary energy source have to be addressed. These emissions can be minimized, either by using the fuel with low emission capacity or by installing post combustion cleaning system. Also proper scheduling of generators helps to reduce the emission of a power plant.
The major part of the work pertaining to emission limitation are concentrated on the economic dispatch problem [3-7] which decides power contribution of each thermal unit, but not deciding on which unit have to be committed for generation at that particular time period. So it becomes significant to have better emission limitation by proper tuning of UC of generating units [8-15]. Most of the literatures, have discussed the impact of emissions on the global warming by
WSEAS TRANSACTIONS on SYSTEMS K. Asokan, R. Ashokkumar
E-ISSN: 2224-2678 523 Volume 13, 2014

analyzing the Economic Dispatch (ED) problem. However after the advent of emission trading allowances, the researchers renewed their ideologies by including the UC problem in emission limitation strategies [16-20].
Recently, the power industry has moved from vertically integrated utilities to one that has been horizontally integrated electric utilities. Restructuring of power systems has resulted in a market based competition by creating an open market competitive environment [21] & [22]. Hence a generation company (GENCO) has the objective to produce and sell the energy with maximum profit. The objective of the UC is not to minimize the generation cost as previously, but to find the schedule that produces maximum profit for the GENCO and it is referred as Profit Based Unit Commitment (PBUC). This profit based UC problem determines how much power and reserve should be offered on a market for achieving maximum profit. The PBUC is a large scale, non convex, non linear, mixed integer optimization problem. It is well known that the electricity markets are highly volatile, the researcher were documented many techniques to solve the PBUC problem. It includes Lagrangian relaxation [21] & [23]. Mixed-integer programming [24–25], Muller method [26-27], Tabu- search [28], Genetic algorithms [29], Memetic algorithm [30], PSO [31], PPSO [32], Nodal ACO [33], Parallel ABC [34] and Hybrid methods such as LR-MIP [35], LR-GA [36] and LR-EP [37-38] have been used for solving the PBUC problems.
Lagrangian relaxation combined with mixed integer programming method has been analyzed by Tao Li and et al. [35]. The solution seems to be better than LR method, but it takes much time for convergence. In reference [39] Mori and Okawa developed and implemented a new hybrid Meta-heuristic based algorithm. Their algorithm was able to solve profit based unit commitment schedule of generating station having nonlinear cost function. An algorithm based on Parallel PSO, Nodal ant colony optimization and parallel ABC was developed by Christopher Colombus et al. for solving the PBUC problem in workstation cluster [32-34]. Chandram and Subramanian [26-27] formed PBUC problem as stochastic optimization problem for a day-ahead energy market and solved by using a new approach with Muller method. Here the problem is analyzed by the proposed method in two stages. Initially, information concerning committed units is obtained by the IPPD table and
then the sub-problem of Economic Dispatch (ED) is solved by Muller’s method. However, Emission Limitations has not been conceded in this reference.
In recent years, emission limitation has been the subject of intensive researchers. In the era of emission constrained competitive market structure, a GENCO with thermoelectric facilities experiences the optimal tradeoff problem of how to ensure the profit by the management of energy available in fossil fuels for power generation without excessive emission. Since maximizing profit and minimizing emission are conflicting objectives, an innovative approach is need of hour to solve the emission constrained PBUC problem. There are several strategies to reduce gaseous emissions. Out of all, PBUC based emission limitations is the most attractive short term alternatives. Emission constrained PBUC problem solved in the references [40-44]. J. P. S. Catalão et al [40] & [41] was to
consider how the emission limitations could be accommodated within PBUC problem. Here an attempt has been made to solve the problem using multi objective approach. Reference [42], investigates the impacts of carbon policies on a GENCO’s decision making under multimarket environment. A dynamic decision making model is proposed to deal with the multimarket trading problem for a GENCO during each trading period. Differential Evolution (DE) algorithm is employed to solve the multi-period optimization problem for each time interval. The shuffled Frog Leaping algorithm is proposed to solve the Profit Based Unit Commitment problem under deregulated environment with emission limitation by T. Venkatesan et al [43]. The bi-objective optimization problem is formulated to maximize GENCOs profit and minimizing the emission level of thermal units while the prevailing constraints are satisfied.
In this paper, a classic hybrid method is framed by MPPD table with ABC algorithm to solve PBUC with emission limitations. As a first step, the PBUC is formulated by considering emission in the objective function along with standard system constraints. Then MPPD table associated with ABC algorithm is proposed and to derive the solution methodology. Consequently simulation results and comparative studies are made to illustrate the superior performance of the proposed method. Finally relevant conclusions are presented with literature references.
WSEAS TRANSACTIONS on SYSTEMS K. Asokan, R. Ashokkumar
E-ISSN: 2224-2678 524 Volume 13, 2014

2 Problem Formulation 2.1 The objective function The objective is to determine the optimal scheduling of thermal generators for maximizing the profit and to minimize the total emission of Generation Companies (GENCOs) subject to standard system constraints. The term profit is defined as the difference between revenue obtained from sale of energy with market price and total operating cost of the generating company.
The PBUC can be mathematically represented by the following equations.
Maximize TCRVPF −= (1)
∑∑= =
=T
t
N
i
ittit UFMPPRV1 1 (2)
∑∑= =
+=T
t
N
i
ititit USTUPFTC1 1
.)(
(3)
The total operating cost, over the entire scheduling period is the sum of production cost and start-up/shutdown cost for all the units. Here, the shutdown cost is considered as equal to zero for all units. The production cost of the committed units is given by the following quadratic equation.
2)(. itiitiiitit PCPbaPFMin ++= (4)
Emission limitation is the most important optimization function in the electrical power system design, operation and scheduling of thermal power plants. There has been a keen attention for emission control over environmental pollution caused by power plants. Thus, the problem of emission of power plants and its influence on the environment, has been analysed by incorporating the emission in the objective function and it is formulated as follows.
it
N
i
it
T
t
UPEEMEmission ∑∑==
=11
)(min)( (5)
Where 2)( itiitiiit PPPE γβα ++=
(6)
2.2 Constraints In this paper power balance, spinning reserve, generator and reserve power limits, minimum ON/OFF time and emission constraints are
considered to solve the PBUC problem with emission limitations.
1. Power balance constraint
The system power balance constraint is the most important factor in the PBUC problem. The generated power from all committed units must be less than or equal to the system load demand. Hence, the equation becomes
∑=
≤N
i
tDitit PUP1
Ni ≤≤1 and Tt ≤≤1
(7) 2. Spinning reserve constraint
The sum of reserve power of all committed thermal units during the planning period must be less than or equal to total spinning reserve of power plants and it is mathematically defined as
∑=
≤N
i
titit SRUR1
Ni ≤≤1 and Tt ≤≤1
(8) Here, power balance and spinning reserve
constraints are different from traditional UC problem because GENCO can now select to produce demand and reserve less than the forecasted level if it creates more profit.
3. Generator and Reserve power limits
constraint
The generation limits represent the minimum loading limit below which it is not economical to load the unit, and the maximum loading limit above which the unit should not be loaded. Each unit has generation range. Similarly, the sum of power and reserve power generation of each unit must be less than or equal to maximum generation of that plant, which is represented as:
maxmin iii PPP ≤≤ Ni ≤≤1 (9)
minmax0 iii PPR −≤≤
Ni ≤≤1 (10)
maxiii PRP ≤+
Ni ≤≤1 (11)
4. Minimum up/down time constraints
WSEAS TRANSACTIONS on SYSTEMS K. Asokan, R. Ashokkumar
E-ISSN: 2224-2678 525 Volume 13, 2014

Once the unit is running, it should not be turned off immediately. Once the unit is de-committed, there is a minimum time before it can be recommitted. These constraints can be represented as
ii TupTon ≥ Ni ≤≤1 (12)
ii TdownToff ≥ Ni ≤≤1 (13)
5. Emission constraint
The sum of emission of all committed thermal units during the planning period must be less than or equal to total emission allowances, which is given by
tit
N
i
it
T
t
EMUPE ≤∑∑== 11
)(
Ni ≤≤1 and Tt ≤≤1 (14)
3. Proposed methodology It is experienced from the literatures, that most of the prevailing algorithms have limitations to provide optimal solution. Therefore, this paper is focused to derive a simple approach to improve GENCOs profit under deregulated environment. For this, a table namely Modified Pre-prepared Power Demand (MPPD) table is prepared using the unit data, forecasted price and system demand. The MPPD table identifies the commitment of units and then ABC algorithm is prescribed to solve the fuel cost and revenue function. Remaining part of the article is described as follows.
3.1 Mathematical model of Modified Pre-
prepared Power Demand (MPPD) Table The complete algorithmic steps to prepare the MPPD table are enumerated as follows.
1. The minimum and maximum values of lambda are calculated for all generating units at their minimum and maximum output
powers ( )(min iP , )(max iP ).Therefore two
lambda values are possible for each generating units.
The value of lambda (λ) is estimated using the following equations
i
i
i
i
j
c
c
bp
2
1
2min
min
+
=λ (15)
(16) 2. The lambda values are arranged in
ascending order and label them as jλ (where
j =1, 2…2N).
3. The output powers for all generators at
eachjλ value are calculated using the
formulation
(17)
4. The minimum and maximum output power of generators are fixed as follows.
(i) For minimum output power limit
If minij λλ < then set 0=jip
(18)
If minij λλ = then set
miniji pp = (19)
(ii) For maximum output power limit
If maxij λλ > then set
maxiji pp = (20)
5. Lambda (λ) value, output powers (Pji)
and sum of output powers (SOP) for each λ are listed in the table in ascending order. This table is referred as Modified Pre-prepared Power Demand (MPPD) table.
To illustrate the preparation of MPPD table, a typical 10 unit system is considered and unit data are shown in Table -1.
The ascending order values of lambda are given in Table - 2. Finally the MPPD Table is prepared by applying the above algorithmic steps and shown in Table – 3.
i
i
ii
j
c
c
bp
2
1
2max
max
+
=λ
i
iji
c
bp
2
−=λ
WSEAS TRANSACTIONS on SYSTEMS K. Asokan, R. Ashokkumar
E-ISSN: 2224-2678 526 Volume 13, 2014

Table 1. Fuel cost and generator limits data for 10 unit system
Table 2. Values of lambda in ascending order (Ten generating units)
Table 3. Modified Pre-prepared Power Demand (MPPD) table for 10 units 24 hour systems
Unit a
($)
b
($/MW)
c
($/MW2)
Pimin
(MW)
Pimax
(MW)
1 1000 16.19 0.00048 150 455
2 970 17.26 0.00031 150 455
3 700 16.60 0.00200 20 130
4 680 16.50 0.00211 20 130
5 450 19.70 0.00398 25 162
6 370 22.26 0.00712 20 80
7 480 27.74 0.00079 25 85
8 660 25.92 0.00413 10 55
9 665 27.27 0.00222 10 55
10 670 27.79 0.00173 10 55
S.No λ S.No λ S.No λ S.No λ
1 16.33 6 17.12 11 22.54 16 27.51
2 16.58 7 17.35 12 23.48 17 27.78
3 16.63 8 17.54 13 26.00 18 27.82
4 16.68 9 19.90 14 26.37 19 27.87
5 17.05 10 20.99 15 27.31 20 27.98
S.No λ
($/MW)
P1
(MW)
P2
(MW)
P3
(MW)
P4
(MW)
P5
(MW)
P6
(MW)
P7
(MW)
P8
(MW)
P9
(MW)
P10
(MW)
SOP
(MW)
1 16.33 150 455 0 0 0 0 0 0 0 0 605.00
2 16.58 455 455 0 0 0 0 0 0 0 0 910.00
3 16.63 455 455 0 30.80 0 0 0 0 0 0 940.80
4 16.68 455 455 0 42.65 0 0 0 0 0 0 952.65
5 17.05 455 455 112.5 130 0 0 0 0 0 0 1152.50
6 17.12 455 455 130 130 0 0 0 0 0 0 1170.00
7 17.35 455 455 130 130 0 0 0 0 0 0 1170.00
8 17.54 455 455 130 130 0 0 0 0 0 0 1170.00
9 19.90 455 455 130 130 25.12 0 0 0 0 0 1195.12
10 20.99 455 455 130 130 162 0 0 0 0 0 1332.00
11 22.54 455 455 130 130 162 20 0 0 0 0 1352.00
12 23.48 455 455 130 130 162 80 0 0 0 0 1412.00
13 26.00 455 455 130 130 162 80 0 10 0 0 1422.00
14 26.37 455 455 130 130 162 80 0 54.48 0 0 1466.48
15 27.31 455 455 130 130 162 80 0 55 10 0 1477.00
16 27.51 455 455 130 130 162 80 0 55 54.05 0 1521.05
17 27.78 455 455 130 130 162 80 0 55 55 0 1522.00
18 27.82 455 455 130 130 162 80 50.63 55 55 10 1582.63
19 27.87 455 455 130 130 162 80 82.28 55 55 23.12 1627.40
20 27.98 455 455 130 130 162 80 85 55 55 54.91 1661.91
WSEAS TRANSACTIONS on SYSTEMS K. Asokan, R. Ashokkumar
E-ISSN: 2224-2678 527 Volume 13, 2014

3.2. Mathematical model of Reduced
Modified Pre-prepared Power Demand
(RMPPD) table: The Forecasted energy price plays an important role in preparing the RMPPD table. Because GENCO attains profit only when the forecasted price at the given hour is more than the incremental fuel cost of the generators.
There are two ways to form the RMPPD table from the MPPD table.
1. From the MPPD table, two rows are selected for the predicted power and reserve demand, such that the power demand lies within the limits of Sum of Powers (SOP).
The corresponding rows are considered as k
and 1+k ..
2. Here, two rows corresponds to the forecasted price are selected from the MPPD table. So
that forecasted price falls within the incremental cost. The rows are considered
as l and 1+l .
Therefore, the Reduced Modified Pre-prepared Power Demand (RMPPD) table is formed by
a) If the row lk < , then the RMPPD table is
formed by considering the option 1.
b) If the row kl < , then the RMPPD table is
formed by choosing the option 2.
The RMPPD table of 10 unit system for various power demands are developed and shown from Table - 4 to Table – 8.
Table 4. RMPPD Table for Forecasted Demand of 700 MW to 850 MW
λ
($/MW)
P1
(MW)
P2
(MW)
P3
(MW)
P4
(MW)
P5
(MW)
P6
(MW)
P7
(MW)
P8
(MW)
P9
(MW)
P10
(MW)
SOP
(MW)
16.33 150 455 0 0 0 0 0 0 0 0 605.00
16.58 455 455 0 0 0 0 0 0 0 0 910.00
Table 5. RMPPD Table for Forecasted Demand of 950 MW to 1150 MW
Table 6. RMPPD Table for Forecasted Demand of 1200 MW to 1300 MW
Table 7. RMPPD Table for Forecasted Demand of 1400 MW
λ
($/MW)
P1
(MW)
P2
(MW)
P3
(MW)
P4
(MW)
P5
(MW)
P6
(MW)
P7
(MW)
P8
(MW)
P9
(MW)
P10
(MW)
SOP
(MW)
16.68 455 455 0 42.65 0 0 0 0 0 0 952.65
17.05 455 455 112.50 130 0 0 0 0 0 0 1152.50
λ
($/MW)
P1
(MW)
P2
(MW)
P3
(MW)
P4
(MW)
P5
(MW)
P6
(MW)
P7
(MW)
P8
(MW)
P9
(MW)
P10
(MW)
SOP
(MW)
19.90 455 455 130 130 25.12 0 0 0 0 0 1195.12
20.99 455 455 130 130 162 0 0 0 0 0 1332.00
λ
($/MW)
P1
(MW)
P2
(MW)
P3
(MW)
P4
(MW)
P5
(MW)
P6
(MW)
P7
(MW)
P8
(MW)
P9
(MW)
P10
(MW)
SOP
(MW)
22.54 455 455 130 130 162 20 0 0 0 0 1352.00
23.48 455 455 130 130 162 80 0 0 0 0 1412.00
WSEAS TRANSACTIONS on SYSTEMS K. Asokan, R. Ashokkumar
E-ISSN: 2224-2678 528 Volume 13, 2014

Table 8. RMPPD Table for Forecasted Demand of 1500 MW
Now, it is necessary to form the Reduced Committed Units (RCU) table which explains the status of committed units. The RSU table is obtained from RMPPD table by substituting the binary values such a way that if any element in the table is non zero, then it is replaced by 1. Therefore, if binary value is zero, then the corresponding unit is in OFF state. Similarly if binary value is 1, then the unit is in ON state.
For example, the status of generating units for forecasted power demand of 700 MW is as follows
The de-commitment of units, Minimum up time and minimum down time constraints are also incorporated in the PBUC problem.
3.3. De-commitment of units The profit of GENCO depends on the proper scheduling of units. Sometimes, the spinning reserve of the system may increase, due to the large gap between the selected lambda values in the RMPPD table. So, it is important to note that the de-commitment of the unit is necessary to improve the financial benefits of GENCOs. If there is any excessive spinning reserve, the RMPPD table is examined. Then the excessive units in the RMPPD table are de-committed after satisfying the spinning reserve constraints.
3.4. Minimum up time and minimum down
time constraints The OFF time of the unit is less than the minimum down- time, then status of that unit will be OFF. Similarly if ON time of the unit is greater than the up time of the unit, then that unit will be ON. All these useful information are applied in RMPPD table to perform the final unit commitment scheduling.
3.5. ABC Algorithm for solving Economic
and Emission Dispatch problem Artificial Bee Colony (ABC) algorithm has been introduced to solve the Economic and Emission Dispatch(ED) problem so as to determine fuel cost, emission level and revenue function. ABC algorithm is the recently defined algorithms by Dervis Karaboga in 2005, motivated by the intelligent behavior of honey bees [45-46]. It is an optimization tool that provides a population-based search procedure in which individuals called food positions are modified by the artificial bees with time and the bee’s aim is to discover the places of food sources with high nectar amount and finally the one with the highest nectar. In this algorithm, the colony of artificial bees contains three groups of bees: employed bees, onlookers and scouts. The food source represents a possible solution of the optimization problem and the nectar amount of a food source corresponds to the quality (fitness) of the associated solution. Every food source has only one employed bee. Thus, the number of employed bees or the onlooker bees is equal to the number of food sources (solutions). The onlooker bees evaluate the nectar information and choose a food source depending on the probability value associated with that food source (���, calculated by the following expression.
∑=
=SN
n
n
ii
fit
fitp
1
(21)
Where fiti is the fitness value of the solution i which is proportional to the nectar amount of the food source in the position i and SN is the number of food sources is equal to the number of employed bees. The employed bees exchange their information with the onlookers. In order to produce a candidate food position from the old one, the ABC uses the following expression.
)( kjijijijij XXXV −+= φ (22)
λ
($/MW)
P1
(MW)
P2
(MW)
P3
(MW)
P4
(MW)
P5
(MW)
P6
(MW)
P7
(MW)
P8
(MW)
P9
(MW)
P10
(MW)
SOP
(MW)
27.31 455 455 130 130 162 80 0 55 10 0 1477.00
27.51 455 455 130 130 162 80 0 55 54.05 0 1521.05
U1 U2 U3 U4 U5 U6 U7 U8 U9 U10
1 1 0 0 0 0 0 0 0 0
1 1 0 0 0 0 0 0 0 0
WSEAS TRANSACTIONS on SYSTEMS K. Asokan, R. Ashokkumar
E-ISSN: 2224-2678 529 Volume 13, 2014

Yes
0
Yes Yes
Figure 1. Flow chart for proposed method
Start
Yes
No
Yes
Yes
Calculate the nectar amount
Initialize food source positions
Determine a neighbour food
source for the onlooker
Select a food source for on onlooker
Allow a search for
the onlooker bees
Memories the position of best food source
Check for abandoned food source
Replace with a random position
Produce new position for the exhausted food sources
Return
Start
Initialize colony size, food number and food source
position of ABC parameters
Read unit data, Forecasted price and system demand
Start
Calculate lambda values, output powers and Sum of Output Powers (SOP)
to form MPPD table
Time t = 1
Form RMPPD table using MPPD table for
the given time interval of system demand
Form reduced committed units (RCU)
table using RMPPD table
Is maximum time interval reached
Obtain the reduced committed units
(RCU) table for 24 hour interval
Incorporate De-commitment of units, minimum up and down time constraints
Form final unit commitment scheduling for 24 hour interval including all
constraints
Call ABC algorithm to solve economic dispatch (ED) sub-problem
t = t+1 NO
Calculate Total revenue (RV), Total
profit (PF), Total emission (EM)
Print the results
Stop
Start
Print the result
Is optical solution reached
No
No
WSEAS TRANSACTIONS on SYSTEMS K. Asokan, R. Ashokkumar
E-ISSN: 2224-2678 530 Volume 13, 2014

Where, }.,..........2,1{ BNk ∈ and
}.,..........2,1{ Dj ∈ are randomly chosen indexes.
Although k is determined randomly, it has to be
different from i. ijφ is a random number between [0,
1]. It controls the production of a neighbour food source position around
ijX and the modification
represents the comparison of the neighbour food positions visually by the bee. If a predetermined number of trials do not improve a solution representing a food source, then that food source is abandoned and the employed bee associated with that food source becomes a scout. The number of trials for releasing a food source is equal to the value of ‘limit’, which is an important control parameter of ABC algorithm.
The limit value usually varies from 0.001neD to neD. If the abandoned source is
ijX , j (1,2,...D)
then the scout discovers a new food source ijX
calculated by the equation.
)( )1,0( minmaxmin jjjij XXrandXX −×+=
(23)
Where minjX and
maxjX are the minimum and
maximum limits of the parameter to be optimized. There are four control parameters used in ABC algorithm. They are the number of employed bees, number of unemployed or onlooker bees, the limit value and the colony size. Thus, ABC system combines local search carried out by employed and onlooker bees, and global search managed by onlookers and scouts, attempting to balance exploration and exploitation process.
To find the appropriate value of ABC parameters, suitable iterative experiments are performed on the problem. Based on the experimental out come the various parameters are chosen as follows. Colony size = 20; Food number = 10; Food source limit = 100; and maximum number of iterations = 1000.
3.6 Implementation of proposed MPPD-ABC
algorithm for solving PBUC Problem with emission
limitation The proposed algorithm for solving PBUC problem with emission limitations is summarized as follows.
Step 1 Read unit data (cost coefficients, emission coefficients, generator limits, minimum
up/down time limits, startup and shutdown cost) , Forecasted energy price and System demand.
Step 2 Initialize the Artificial Bee Colony (ABC) parameters such as colony size, food number, and food source positions of bees.
Step 3 Calculate the lambda (λ ) values, output
powers (jip ) and Sum of Output Powers
(SOP) to form MPPD Table.
Step 4 From the MPPD Table, evaluate RMPPD Table for the time interval of system demand or forecasted energy price.
Step 5 Form Reduced Committed Units (RCU) Table for a system demand or forecasted energy price using RMPPD table
Step 6 Verify the time interval for 24 hours. If satisfied go to next step otherwise go to step 4.
Step 7 Obtain the reduced committed units (RCU) table for 24 hour interval.
Step8 Incorporate De-commitment of units, minimum up and down time constraints.
Step 9 compute final profit based unit commitment schedule including all constraints.
Step 10 Call ABC algorithm to solve Economic and Emission Dispatch (ED) sub-problem to determine the minimum fuel cost and emission level.
Step11 Evaluate fitness values of objective functions (maximum profit and minimum emission level) of the PBUC problem.
Step 12 If the global optimal solution is reached then the optimization process is terminated or else the procedure is repeated from step 11.
Step 13 Print the simulation results and stop.
4. Numerical results and Discussion The proposed hybrid mppd-ABC methodology is investigated to illustrate its superior performance on ten units twenty four hour (IEEE 39 bus)test
WSEAS TRANSACTIONS on SYSTEMS K. Asokan, R. Ashokkumar
E-ISSN: 2224-2678 531 Volume 13, 2014

Table 9. Comparison of Unit commitment Schedule of Traditional UC and PBUC (Proposed) for ten unit 24 hour system
system with cumulative installed power of about 1662 MW. The proposed method is implemented on a computer with a Pentium IV, Intel Dual core 2.2 GHz, 2 GB RAM and simulated in MATLAB 9.1 platform. The simulations were carried out and numerical results are tabulated. This test system is adopted from [43] comprising of 10 generating units with 24 hour scheduling periods and the fuel cost of each generator is estimated by Quadratic equation. The generator data, forecasted system demand, forecasted market price and data for generator emission coefficients are also considered from the same literature and is given in appendix B (Table B1, Table B2 and Table B3). Table – 9 depicts scheduling of committed units, under traditional UC approach which ensures the equilibrium nature of Generation and Demand. The Table - 9 also provides information for the PBUC in which inequality demand constraint is explained. The power generation pattern for 10 units system is explained in Table 10. The scheduling is designed to maximize the profit and simultaneously
minimize the emission level. The results reiterate the fact that only those required generators allowed to dispatch power while the other units remain idle, paving the way to reduce the emission outbursts. Table – 11 describes the simulation results of Fuel cost, Startup cost, Revenue, Profit and Emission of GENCOs and compared with traditional UC. The result of the proposed method (Total profit and emission) is compared with that of existing methods such a traditional UC and SFLA approach and it is displayed in Table -12. In order to provide more reliable information, Convergence characteristics of best profit for various iterations are displayed in fig. 2. The scheduling pattern of Traditional UC and PBUC is graphically represented in fig. 3.
Hour (h)
Traditional UC PBUC (Proposed Method)
U1 U2 U3 U4 U5 U6 U7 U8 U9 U10 U1 U2 U3 U4 U5 U6 U7 U8 U9 U10
1 1 1 0 0 0 0 0 0 0 0 1 1 0 0 0 0 0 0 0 0
2 1 1 0 0 0 1 0 0 0 0 1 1 0 0 0 0 0 0 0 0
3 1 1 0 0 0 1 0 0 0 0 1 1 0 0 0 0 0 0 0 0
4 1 1 0 1 0 1 0 0 0 0 1 1 0 0 0 0 0 0 0 0
5 1 1 0 0 0 1 0 0 0 0 1 1 0 0 0 0 0 0 0 0
6 1 1 1 1 0 1 0 0 0 0 1 1 0 1 0 0 0 0 0 0
7 1 1 1 1 0 1 0 0 0 0 1 1 1 1 0 0 0 0 0 0
8 1 1 1 1 0 1 0 0 0 0 1 1 1 1 0 0 0 0 0 0
9 1 1 1 1 0 1 0 0 0 1 1 1 1 1 1 0 0 0 0 0
10 1 1 1 1 1 1 0 0 0 1 1 1 1 1 1 1 0 0 0 0
11 1 1 1 1 1 1 0 0 0 1 1 1 1 1 1 1 0 0 0 0
12 1 1 1 1 1 1 1 0 0 1 1 1 1 1 1 1 0 0 0 0
13 1 1 1 1 1 1 1 0 0 1 1 1 1 1 1 1 0 0 0 0
14 1 1 1 1 1 1 1 1 0 1 1 1 1 1 1 0 0 0 0 0
15 1 1 1 1 1 1 1 0 0 1 1 1 1 1 0 0 0 0 0 0
16 1 1 1 1 1 1 0 1 0 0 1 1 1 1 0 0 0 0 0 0
17 1 1 1 1 1 1 0 1 0 0 1 1 0 1 0 0 0 0 0 0
18 1 1 1 1 1 1 0 1 0 0 1 1 0 1 0 0 0 0 0 0
19 1 1 1 1 1 1 0 0 0 0 1 1 0 1 0 0 0 0 0 0
20 1 1 1 1 1 0 1 0 0 0 1 1 0 1 0 0 0 0 0 0
21 1 1 1 1 1 0 1 0 0 0 1 1 0 1 0 0 0 0 0 0
22 1 1 0 1 1 0 1 1 0 0 1 1 0 1 0 0 0 0 0 0
23 1 1 1 0 0 0 0 0 0 0 1 1 0 0 0 0 0 0 0 0
24 1 1 0 0 0 1 0 0 1 1 1 1 0 0 0 0 0 0 0 0
WSEAS TRANSACTIONS on SYSTEMS K. Asokan, R. Ashokkumar
E-ISSN: 2224-2678 532 Volume 13, 2014

Tab
le 1
0. P
ow
er G
ener
atio
n o
f 10 u
nit
s 24 h
our
syst
em
h
PD
(MW
)
Tra
dit
ional
UC
(M
W)
Traditional UC
PB
UC
(M
W)
(Pro
po
sed
met
ho
d)
P1
P2
P3
P4
P5
P6
P7
P8
P9
P1
0
P1
P2
P3
P4
P5
P6
P7
P8
P9
P1
0
1
70
0
45
5
24
5
0
0
0
0
0
0
0
0
45
5
24
5
0
0
0
0
0
0
0
0
2
75
0
45
5
27
5
0
0
0
20
0
0
0
0
45
5
29
5
0
0
0
0
0
0
0
0
3
85
0
45
5
37
5
0
0
0
20
0
0
0
0
45
5
39
5
0
0
0
0
0
0
0
0
4
95
0
45
5
45
5
0
0
0
40
0
0
0
0
45
5
45
5
0
0
0
0
0
0
0
0
5
10
00
45
5
39
5
13
0
0
0
20
0
0
0
0
45
5
45
5
0
0
0
0
0
0
0
0
6
11
00
45
5
36
5
13
0
13
0
0
20
0
0
0
0
45
5
45
5
0
13
0
0
0
0
0
0
0
7
11
50
45
5
41
5
13
0
13
0
0
20
0
0
0
0
45
5
45
5
13
0
11
0
0
0
0
0
0
0
8
12
00
45
5
45
5
13
0
13
0
0
30
0
0
0
0
45
5
45
5
13
0
13
0
0
0
0
0
0
0
9
13
00
45
5
45
5
13
0
13
0
0
80
0
0
0
50
45
5
45
5
13
0
13
0
13
0
0
0
0
0
0
10
14
00
45
5
45
5
13
0
13
0
16
2
58
0
0
0
10
45
5
45
5
13
0
13
0
16
2
68
0
0
0
0
11
14
50
45
5
45
5
13
0
13
0
16
2
80
0
0
0
38
45
5
45
5
13
0
13
0
16
2
80
0
0
0
0
12
15
00
45
5
45
5
13
0
13
0
16
2
80
78
0
0
10
45
5
45
5
13
0
13
0
16
2
80
0
0
0
0
13
14
00
45
5
45
5
13
0
13
0
16
2
33
25
0
0
10
45
5
45
5
13
0
13
0
16
2
68
0
0
0
0
14
13
00
45
5
45
5
13
0
13
0
65
20
25
10
0
10
45
5
45
5
13
0
13
0
13
0
0
0
0
0
0
15
12
00
40
5
45
5
13
0
13
0
25
20
25
10
0
0
45
5
45
5
13
0
13
0
0
0
0
0
0
0
16
10
50
28
0
45
5
13
0
13
0
25
20
0
10
0
0
45
5
33
5
13
0
13
0
0
0
0
0
0
0
17
10
00
23
0
45
5
13
0
13
0
25
20
0
10
0
0
45
5
41
5
0
13
0
0
0
0
0
0
0
18
11
00
33
0
45
5
13
0
13
0
25
20
0
10
0
0
45
5
45
5
0
13
0
0
0
0
0
0
0
19
12
00
45
5
44
0
13
0
13
0
25
20
0
0
0
0
45
5
45
5
0
13
0
0
0
0
0
0
0
20
14
00
45
5
45
5
13
0
13
0
16
2
0
68
0
0
0
45
5
45
5
0
13
0
0
0
0
0
0
0
21
13
00
45
5
45
5
13
0
13
0
10
5
0
25
0
0
0
45
5
45
5
0
13
0
0
0
0
0
0
0
22
11
00
45
5
45
5
0
13
0
25
0
25
10
0
0
45
5
45
5
0
13
0
0
0
0
0
0
0
23
90
0
45
5
45
5
0
0
0
0
0
0
0
0
45
5
44
5
0
0
0
0
0
0
0
0
24
80
0
30
5
45
5
0
0
0
20
0
0
10
10
45
5
34
5
0
0
0
0
0
0
0
0
WSEAS TRANSACTIONS on SYSTEMS K. Asokan, R. Ashokkumar
E-ISSN: 2224-2678 533 Volume 13, 2014

Tab
le 1
1. S
imula
tion R
esult
s fo
r 10 u
nit
s 24 h
our
syst
ems
Tim
e (h
) D
eman
d
(MW
)
Tra
dit
ional
UC
(M
W)
PB
UC
(P
ropo
sed
Met
ho
d)
Fuel
co
st
(Rs)
S
tart
up
co
st (
Rs)
R
even
ue
(Rs)
P
rofi
t (R
s)
Em
issi
on
(to
ns)
F
uel
co
st
(Rs)
S
tart
up
co
st (
Rs)
R
even
ue
(Rs)
P
rofi
t (R
s)
Em
issi
on
(to
ns)
1
70
0
61
574
0.8
4
0
69
772
5.0
0
81
984
.16
68
2.7
66
2
61
574
0.8
4
0
69
772
5.0
0
81
984
.20
68
2.7
66
2
75
0
67
607
1.6
2
76
50
74
250
0.0
0
58
778
.38
84
1.9
32
9
65
495
2.5
0
0
74
250
0.0
0
87
547
.50
75
4.8
14
3
85
0
75
464
8.3
7
0
88
357
5.0
0
12
892
6.6
3
10
20
.89
73
358
5.0
0
0
88
357
5.0
0
14
999
0.0
0
94
5.6
54
4
95
0
83
812
9.1
3
0
96
828
7.5
0
13
015
8.3
7
12
04
.40
3
78
089
8.5
0
0
92
751
7.5
0
14
661
9.0
0
10
90
.11
5
10
00
90
052
8.2
0
24
750
10
462
50
.00
12
097
1.8
1
09
6.5
66
78
089
8.5
0
0
95
208
7.5
0
17
118
9.0
0
10
90
.11
6
11
00
10
056
38
.79
25
200
11
360
25
.00
10
5.1
87
10
65
.88
90
861
7.4
5
25
200
10
740
00
.00
14
024
2.5
5
11
53
.27
0
7
11
50
10
450
17
.84
0
11
643
75
.00
11
935
7.1
6
11
75
.33
8
10
689
30
.67
24
750
11
643
75
.00
70
694
.33
12
00
.69
4
8
12
00
10
867
48
.50
0
11
961
00
.00
10
935
1.5
1
27
2.0
43
10
875
20
.77
0
11
661
97
.5
78
677
.50
12
16
.42
0
9
13
00
12
303
42
.83
27
00
13
338
00
.00
10
075
7.1
7
14
00
.71
7
10
386
03
.80
40
500
12
004
20
.00
12
131
6.2
0
12
56
.95
2
10
14
00
13
265
87
.15
40
500
18
490
50
.00
48
196
2.8
5
14
31
.83
4
12
945
70
.00
76
50
18
490
50
.00
54
683
0.0
0
12
98
.48
11
14
50
13
840
87
.32
0
19
672
87
.50
58
320
0.1
8
14
29
.04
3
13
071
59
.00
0
19
157
31
.00
60
852
2.0
0
13
00
.44
12
15
00
14
687
80
.98
23
400
21
363
75
.01
64
419
4.0
3
14
31
.74
1
13
071
59
.00
0
20
110
41
.00
70
388
2.0
0
13
00
.44
13
14
00
13
536
45
.46
0
15
498
00
.00
19
615
4.5
4
14
26
.69
1
12
945
70
.00
0
15
498
00
.00
25
523
0.0
0
12
98
.78
14
13
00
12
918
51
.09
27
00
14
332
50
.00
13
869
8.9
1
13
87
.08
3
11
770
39
.94
0
14
332
50
.00
25
621
0.0
4
12
56
.95
2
15
12
00
11
759
51
.74
0
12
150
00
.00
39
048
.26
12
00
.53
10
875
20
.77
0
11
846
25
.00
97
104
.23
12
16
.42
0
16
10
50
10
302
03
.78
0
10
536
75
.00
23
471
.22
97
0.7
84
5
96
799
7.1
5
0
10
536
00
.00
85
602
.85
92
6.6
66
17
10
00
99
322
5.4
8
0
10
012
50
.00
80
24
.52
90
3.4
46
87
262
0.6
3
0
10
012
50
.00
12
862
9.3
7
98
4.6
31
18
11
00
10
672
90
.08
0
10
914
75
.00
24
184
.92
10
53
.72
2
90
861
7.4
5
0
10
319
40
.00
12
332
2.5
5
11
53
.27
0
19
12
00
11
072
57
.96
0
11
988
00
.00
91
542
.04
12
28
.53
4
90
861
7.4
5
0
10
389
60
.00
13
034
2.5
5
11
53
.27
0
20
14
00
13
149
71
.23
23
400
14
269
50
.00
88
578
.77
13
36
.85
9
90
861
7.4
5
0
10
660
20
.00
15
740
2.5
5
11
53
.27
0
21
13
00
12
078
95
.94
0
13
513
50
.00
14
345
4.0
6
13
04
.42
6
90
861
7.4
5
0
10
810
00
.00
17
238
2.5
5
11
53
.27
0
22
11
00
10
463
64
.89
27
00
11
360
25
.01
86
960
.12
12
95
.60
1
90
861
7.4
5
0
10
740
60
.00
16
544
2.5
5
11
53
.27
0
23
90
0
77
300
5.9
4
0
92
137
5.0
0
14
836
9.0
6
10
64
.43
8
77
300
5.9
4
0
92
137
5.0
0
14
836
9.1
0
10
64
.47
0
24
80
0
79
061
0.5
2
13
050
81
180
0.0
0
81
39
.48
10
18
.88
6
69
423
3.9
0
8
11
80
0.0
0
11
756
6.1
0
84
2.4
34
Total
25
484
595
.68
16
605
0
29
312
100
.00
36
614
54
.32
28
244
.15
22
,988
,71
2
98
,100
27
,831
,90
0
4,7
45,0
88
26
646
.85
WSEAS TRANSACTIONS on SYSTEMS K. Asokan, R. Ashokkumar
E-ISSN: 2224-2678 534 Volume 13, 2014

Table 12. Comparison of total profits and emission of proposed method with the existing methods
Method Profit (Rs) Emission (tons)
Traditional UC 3661454.32 28244.15
SFLA 4744910.10 26617.56
MPPD - ABC
(Proposed method) 4745088.00 26646.85
Figure 2. Convergence characteristics of best profit for various iterations
Figure 3. Unit commitment schedule of traditional UC PBUC (Proposed method)
4744400
4744500
4744600
4744700
4744800
4744900
4745000
4745100
4745200
1 10 19 28 37 46 55 64 73 82 91 100
Profi…
Iterations
Pro
fit
($
)
WSEAS TRANSACTIONS on SYSTEMS K. Asokan, R. Ashokkumar
E-ISSN: 2224-2678 535 Volume 13, 2014

Figure 4. Revenue, Fuel cost and Profit for the ten unit system
Figure 5. Comparison of power generation and power demand of the ten unit system
Figure 6. Comparison of profit of Traditional UC and PBUC (Proposed) for ten unit system
0
500000
1000000
1500000
2000000
2500000
1
Co
st (R
s)
0
200000
400000
600000
800000
Pro
fit
(Rs)
0
200
400
600
800
1000
1200
1400
1600
1
Po
we
r(M
W)
Revenue, Fuel cost and Profit for the ten unit system
Comparison of power generation and power demand of the ten unit system
Comparison of profit of Traditional UC and PBUC (Proposed) for ten unit system
3 5 7 9 11 13 15 17 19 21 23
Fuel Cost (Rs)
Revenue (Rs)
Profit (Rs)
Hour (h)
18 15
22
Traditional UC
PBUC (Proposed)
1 3 5 7 9 11 13 15 17 19 21 23
Power Demand (MW)
Power Generation (MW)
Hour (h)
Revenue, Fuel cost and Profit for the ten unit system
Comparison of power generation and power demand of the ten unit system
Comparison of profit of Traditional UC and PBUC (Proposed) for ten unit system
22
WSEAS TRANSACTIONS on SYSTEMS K. Asokan, R. Ashokkumar
E-ISSN: 2224-2678 536 Volume 13, 2014

Figure 7.Comparison of Emission level of Traditional UC and
In fig. 4 Revenue, Total cost and Profit of the GENCOs is reported for each hour of the dayelectricity market. The graphical representation of power generation and load demand of referred testsystem is illustrated in fig. 5. A typical comparison is made for profit of Traditional UC and PBUC (proposed method) is given in fig 6emission level of traditional UC and PBUC (proposed method) are compared and are presented in fig. 7. From the results, it is evident that the proposed method improves the profit and minimizes the emission level of the GENCOs than existing methods.
5. Conclusion In this article, the Emission constrained Profit Based Unit Commitment (PBUC) problem is described under competitive environment. A simple and reliable approach of Modified prepower demand (MPPD) table with an Artificial Bee Colony (ABC) algorithm is proposed to solve the PBUC problem with emission limitations. The proposed algorithm improves profit and minimizes the emission level by curtailing and scthermal units in proper manner. To demonstrate the effectiveness and applicability of this method, it has been tested on ten units 24 hour system and numerical results are tabulated. Results are obtained for the optimal profit based unitschedule and MW values for real power, profit and emission of the GENCOs. The experimental result
0
200
400
600
800
1000
1200
1400
1600
Em
issi
on (
tons)
.Comparison of Emission level of Traditional UC and PBUC (Proposed) for ten unit system
Revenue, Total cost and Profit of the GENCOs is reported for each hour of the day-ahead electricity market. The graphical representation of power generation and load demand of referred test
A typical comparison s made for profit of Traditional UC and PBUC
oposed method) is given in fig 6. Finally the emission level of traditional UC and PBUC
ared and are presented . From the results, it is evident that the
roves the profit and minimizes the emission level of the GENCOs than existing
In this article, the Emission constrained Profit Based Unit Commitment (PBUC) problem is described under competitive environment. A simple
approach of Modified pre-prepared power demand (MPPD) table with an Artificial Bee Colony (ABC) algorithm is proposed to solve the PBUC problem with emission limitations. The proposed algorithm improves profit and minimizes
and scheduling of proper manner. To demonstrate the
effectiveness and applicability of this method, it has been tested on ten units 24 hour system and numerical results are tabulated. Results are obtained for the optimal profit based unit commitment schedule and MW values for real power, profit and emission of the GENCOs. The experimental result
has been compared with Traditional method. the results, it is observed that increases the total profit bythe Emission by 5.65% perwith traditional Unit Commitmentoutcome resulted by the proposed technique ensures the robustness, maximized profit, minimized emission with less computational time over other reported algorithms. Therefore it can be concluded that the proposed MPPD-ABC approach paves the best way for solving the power system optimization problems under deregulated environment.
The technique may be reformulated to include optimization strategies such as
• Security Constrained Unit commitment (SCUC)
• Optimal Bidding strategies (OBS) and Risk constrained OBS problems
To improve the profit of GENCOS
Acknowledgement
The authors gratefully acknowledge the aof Annamalai University for the facilities offered to carry out this work. Appendix A: Nomenclature
PF Total profit of GENCOs
1 6 11 16 21
Traditional UC
PBUC (Proposed)
.Comparison of Emission level of Traditional UC and
has been compared with Traditional method. From the results, it is observed that the proposed method
by 22.85% and minimize 5.65% per day when compared
Commitment method. The outcome resulted by the proposed technique ensures the robustness, maximized profit, minimized emission with less computational time over other
. Therefore it can be concluded ABC approach paves the
best way for solving the power system optimization under deregulated environment.
may be reformulated to include optimization strategies such as
Security Constrained Unit commitment
Optimal Bidding strategies (OBS) and Risk problems
To improve the profit of GENCOS
The authors gratefully acknowledge the authorities of Annamalai University for the facilities offered to
Nomenclature
Total profit of GENCOs
21
PBUC (Proposed)
WSEAS TRANSACTIONS on SYSTEMS K. Asokan, R. Ashokkumar
E-ISSN: 2224-2678 537 Volume 13, 2014

RV Total revenue of GENCOs TC Total generation cost of GENCOs EM Total emission of GENCOs Pit Real power output of ith Generator PDt Forecasted system demand during
hour t Pit
max Maximum limit of ith unit during
hour of t Pit
min
Minimum limit of ith unit during hour of t
FMPt Forecasted market price at hour of t ST Start up cost
iTon Time duration for which unit i has
been ON
iToff Time duration for which unit i has
been OFF
iTup Minimum up time of unit i
iTdown Minimum down time of unit i
N Number of generating units considered
T Number of time Periods considered MPPD Modified pre-prepared power
demand table
RMPPD Reduced modified pre-prepared power demand table
λ Incremental cost
N Number of generating units UC Unit commitment ED Economic dispatch PBUC Profit based unit commitment
iii cba ,, Cost co-efficient of ith generator
iii γβα ,, Emission co-efficient of ith
generator GENCO Generation Company TRANSCO Transmission Company
DISCO Distributio0 Company Ri (t) Reserve of i
th generating unit during hour of t
SR (t) Spinning reserve during hour of t Uit Unit status
PSO Particle swarm optimization ACO Ant colony optimization NACO Nodal ant colony optimization
ABC Artificial bee colony
Appendix B: Data for 10 Units 24 hour test System
Table B1 Unit Data for Ten Unit System
Unit 1 Unit 2 Unit 3 Unit 4 Unit 5 Unit 6 Unit 7 Unit 8 Unit 9 Unit 10
Pi(max) 455 455 130 130 162 80 85 55 55 55
Pi(min) 150 150 20 20 25 20 25 10 10 10
Ai 1000 970 700 680 450 370 480 660 665 670
Bi 16.19 17.26 16.60 16.50 19.70 22.26 27074 25.92 27.27 27.79
Ci 0.00048 0.00031 0.002 0.00211 0.00398 0.00712 0.00079 0.00413 0.0022
2 0.00173
MUi 8 8 5 5 6 3 3 1 1 1
MDi 8 8 5 5 6 3 3 1 1 1
Hcost(i) 4500 5000 550 560 900 170 260 30 30 30
Ccost(i) 9000 10,000 1100 1120 1800 340 520 60 60 60
I-State 8 8 -5 -5 -6 -3 -3 -1 -1 -1
WSEAS TRANSACTIONS on SYSTEMS K. Asokan, R. Ashokkumar
E-ISSN: 2224-2678 538 Volume 13, 2014
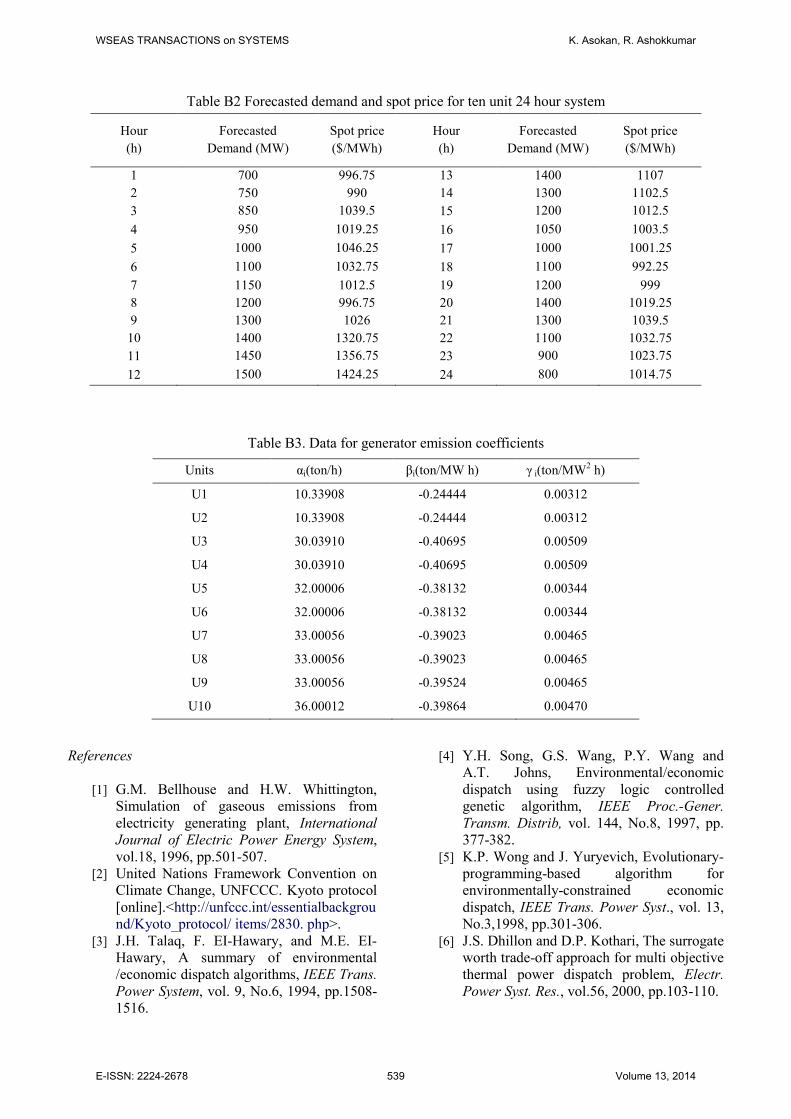
Table B2 Forecasted demand and spot price for ten unit 24 hour system
Table B3. Data for generator emission coefficients
References
[1] G.M. Bellhouse and H.W. Whittington,
Simulation of gaseous emissions from electricity generating plant, International
Journal of Electric Power Energy System, vol.18, 1996, pp.501-507.
[2] United Nations Framework Convention on Climate Change, UNFCCC. Kyoto protocol [online].<http://unfccc.int/essentialbackground/Kyoto_protocol/ items/2830. php>.
[3] J.H. Talaq, F. EI-Hawary, and M.E. EI- Hawary, A summary of environmental /economic dispatch algorithms, IEEE Trans. Power System, vol. 9, No.6, 1994, pp.1508-1516.
[4] Y.H. Song, G.S. Wang, P.Y. Wang and A.T. Johns, Environmental/economic dispatch using fuzzy logic controlled genetic algorithm, IEEE Proc.-Gener.
Transm. Distrib, vol. 144, No.8, 1997, pp. 377-382.
[5] K.P. Wong and J. Yuryevich, Evolutionary-programming-based algorithm for environmentally-constrained economic dispatch, IEEE Trans. Power Syst., vol. 13, No.3,1998, pp.301-306.
[6] J.S. Dhillon and D.P. Kothari, The surrogate worth trade-off approach for multi objective thermal power dispatch problem, Electr. Power Syst. Res., vol.56, 2000, pp.103-110.
Hour
(h)
Forecasted
Demand (MW)
Spot price
($/MWh)
Hour
(h)
Forecasted
Demand (MW)
Spot price
($/MWh)
1 700 996.75 13 1400 1107
2 750 990 14 1300 1102.5
3 850 1039.5 15 1200 1012.5
4 950 1019.25 16 1050 1003.5
5 1000 1046.25 17 1000 1001.25
6 1100 1032.75 18 1100 992.25
7 1150 1012.5 19 1200 999
8 1200 996.75 20 1400 1019.25
9 1300 1026 21 1300 1039.5
10 1400 1320.75 22 1100 1032.75
11 1450 1356.75 23 900 1023.75
12 1500 1424.25 24 800 1014.75
Units αi(ton/h) βi(ton/MW h) γ i(ton/MW2 h)
U1 10.33908 -0.24444 0.00312
U2 10.33908 -0.24444 0.00312
U3 30.03910 -0.40695 0.00509
U4 30.03910 -0.40695 0.00509
U5 32.00006 -0.38132 0.00344
U6 32.00006 -0.38132 0.00344
U7 33.00056 -0.39023 0.00465
U8 33.00056 -0.39023 0.00465
U9 33.00056 -0.39524 0.00465
U10 36.00012 -0.39864 0.00470
WSEAS TRANSACTIONS on SYSTEMS K. Asokan, R. Ashokkumar
E-ISSN: 2224-2678 539 Volume 13, 2014

[7] S. Muralidharan, K. Srikrishna, and S. Subramanian, Emission constrained economic dispatch - A new recursive approach, Electric Power Compon. Syst., vol.34, 2006, pp.343-353.
[8] Narayana Prasad Padhy. Unit Commitment – A Bibliographical Survey. IEEE
Transactions on power systems, Vol.19, No.2, 2004, pp.1196- 1205.
[9] A.J. Wood and B.F. Woolenberg, Power generation, operation and control. New
York, NY: John Wiley Sons; Book, 1996. [10] L. Walter Snyder, H. David Powell and C.
John Rayburn, Dynamic programming approach to unit commitment, IEEE
Transactions on Power System, Vol.2, No.2, 1987, pp.339-348.
[11] A.I. Cohen and M. Yoshimura, A branch and bound algorithm for unit commitment, IEEE Transaction on Power Apparatus
System, Vol.102, No.2, 1983, pp.444-451. [12] M.C. Arroyo and M. Jose, A
computationally efficient mixed-integer linear formulation for the thermal unit commitment problem, IEEE Transactions on Power System, vol.21, No.3, 2006, pp.1371-1348.
[13] V. Sudhir, E.C. Adrian, K. Imhof and M. Shishir, Implementation of a Lagrangian based unit commitment problem. IEEE
Transactions on Power System, Vol.4, No.4, pp.1373-1380.
[14] C. Wang, S.M. Shahidehpour, A decomposition approach to nonlinear multi-area generation scheduling with tie-line constraints using expert systems, IEEE
Trans Power System, Vol.7, No.2, 1992, pp.1409–1418.
[15] KP. Wong, YW. Wong, Thermal generator scheduling using hybrid genetic/simulated annealing approach, IEE Proc Gener
Transm Distrib., vol.142, No.7, 2006 pp.372–380.
[16] S. Kuloor, G.S. Hope, and O.P. Malik, Environmentally constrained unit commitment, IEE Proc.-Gener. Transm.
Distrib., vol. 139, No.5. 1992, pp. 122-128. [17] T. Gjengedal, Emission constrained unit-
commitment, IEEE Trans. Energy
Conversion, vol.11, No.3, 1996, pp.132-138.
[18] D. Srinivasan and A.G.B. Tettamanzi, An evolutionary algorithm for evaluation of emission compliance options in view of the Clean Air Act Amendments, IEEE Trans.
Power Syst., vol.12, No.9, 1997, pp.336-341.
[19] J. Catalão, S. Mariano, V. Mendes, and L. Ferreira, Unit commitment with environmental considerations: a practical approach, 15th PSCC, Liege conference
preceding, Belgium, 2005. [20] H.A. Pulgar-Painemal, Short-term
generation scheduling under a SO emissions allowances market, Electr. Power Syst. Res., vol. 74, 2005, pp. 257-265.
[21] Mohammad Shahidehpour, H. Yamin and Zuyili. Market Operations in Electric Power Systems, Forecasting, Scheduling and Risk Management, Wiley New York, Book, 2002.
[22] Mohammad Shahidehpour, Muwaffaq and Alomoush. Restructured electrical power systems, Operation, Trading, and volatility. New York: Wiley, Book, 2000.
[23] E. Delarue , P.D Van Den Bosch, W.’Haeseleer, Effect of the accuracy of price forecasting on profit in a price based unit commitment, Elect Power Syst Res., Vol. 80, 2010, pp.1306–1313.
[24] S. Bisanovic, M. Hajro and M. Dlakic, Hydrothermal self-scheduling problem in a day-ahead electricity market, Elect Power Syst Res., Vol.78, 2008, pp.1579–1596.
[25] CK. Simoglou, PN. Biskas and AG. Bakirtzis, Optimal self-scheduling of a thermal producer in short-term electricity markets by MILP, IEEE Trans Power Syst., Vol.25, No.19, 2006, pp.65–77.
[26] K. Chandram, N. Subrahmanyam and M. Sydulu, Improved Pre-prepared Power Demand Table and Muller’s Method to Solve the Profit Based Unit Commitment Problem, Journal of Electrical Engineering & Technology, Vol.4, No.2, pp.159-167.
[27] K. Chandram, N. Subrahmanyam and M. Sydulu, New approach with Muller method for profit based unit commitment, Power and Energy Society General Meeting - Conversion and Delivery of Electrical Energy in the 21st Century IEEE, 2008, pp 1-8.
[28] T.A.A Victoire, A.E. Jeyakumar, Unit commitment by a tabu-search-based hybrid optimization technique, IEE Proceedings
Generation. Transmission & Distribution, Vol.15, No.2, pp.563–570.
[29] PS. Georgilakis, Genetic algorithm model for Profit maximization of generating companies in deregulated electricity
WSEAS TRANSACTIONS on SYSTEMS K. Asokan, R. Ashokkumar
E-ISSN: 2224-2678 540 Volume 13, 2014
markets, Application Artificial Intelligence, Vol.23, 2009,pp.538–552.
[30] K. Dionisios, Dimitroulas, S. Pavlos and Georgilakis, A new memetic algorithm approach for the price based unit commitment problem, Applied Energy, Vol.88, No.12, pp.4687–4699.
[31] Jacob Raglend , C. Raghuveer, G. Rakesh Avinash, N.P. Padhy , D.P. Kothari. Solution to profit based unit commitment problem using particle swarm optimization, Applied Soft Computing, Vol.10, No.4, 2010, pp.247–256.
[32] C. Christopher Columbus and Sishaj p. Simon, Profit based unit commitment for GENCOs using Parallel PSO in a distributed cluster, ACEEE Int. J. on
Electrical and Power Engineering, Vol.2, No.37, 2010, pp.670-679.
[33] C. Christopher Columbus, K. Chandra sekaran and Sishaj P.Simon, Nodal ant colony optimization for solving profit based unit commitment problem for GENCOs, Applied soft computing, Vol.12, 2010, pp.145-160.
[34] C. Christopher Columbus and Sishaj P Simon, Profit based unit commitment,A parallel ABC approach using a workstation cluster, Computers and Electrical
Engineering, Vol.38, 2012, pp.724-745. [35] Tao Li and Mohammad Shahidehpour,
Price-Based Unit Commitment A Case of Lagrangian Relaxation Versus Mixed Integer Programming, IEEE Transactions on Power Systems, Vol.20, No.4, 2005, pp.2005-2015.
[36] C.P Cheng, C.WLiu and C.C, Liu, Unit commitment by Lagrangian relaxation and genetic algorithm, IEEE Transactions on Power System, Vol.15, No.2, 2000, pp.707-714.
[37] H.Y. Yamin, Q. El-Dawirin and S.M. Shahidehpour , A new approach for GenCos Profit based unit commitment in day-ahead competitive electricity markets considering reserve uncertainty, Electrical power and energy systems, Vol.29, 2007, pp.609-616.
[38] Pathom attaviriyanupap, Hiroyuki kita, and Jun Hasegawa, A Hybrid LR-EP for Solving New Profit-Based UC Problem Under Competitive Environment, IEEE
Transactions on power systems, Vol.18, No.1, 2003, pp.229-237.
[39] H. Mori and K.A Okawa, New Meta-heuristic Method for Profit-Based Unit
Commitment under Competitive Environment, IEEE conference preceding, 2010, pp.172-178
[40] J.P.S. Catalao, S.J.P.S. Mariano, V.M.F. Mendes and L.A.F.M. Ferreria, A Practical approach for profit-based unit commitment with emission limitations, Electrical power and energy systems, Vol.32, 2010, pp.218-224.
[41] J.P.S. Catalao and V.M.F. Mendes, Influnce of environmental constraints on Profit-Based short - rerm thermal scheduling, IEEE Transactions on power systems, Vol.2, No.2, 2010, pp.131-138.
[42] X.R. Li, C.W. Yu, F.J. Luo, S.Y. Ren Z.Y. Dong, and K.P. Wong, Impacts of emission trading schemes on GENCOs decision making multimarket environment, Electrical power system research, Vol.95, 2013, pp.257-267.
[43] T. Venkatesan, and M.Y. Sanavullah, SFLA approach to solve PBUC problem with emission limitation, Electrical power and energy systems, Vol.46, 2013, pp.1-9.
[44] Smajo Bisanovic, Mensure Hajro and Muris Dlakic, Unit commitment problem in deregulated environment, Electrical power and energy systems, Vol.42, 2012, pp.150-157.
[45] Xiang liao, Jianzhong zhou, Rui zhang and Yongchuan zhang, An adaptive artificial bee colony algorithm for long term economic dispatch in cascaded hydropower systems, Electrical power energy systems, Vol.43, 2012, pp.1340 -1345.
[46] M. Basu, Bee colony optimization for combined heat and power economic dispatch. Expert system with applications, Vol.38, 2011, pp.13527-13531.
[47] S.P Karthikeyan, and F. Neri, Open research
issues on Deregulated Electricity Market. Investigation and Solution Methodologies,
WSEAS Transactions on Systems, Vol.13,
2014, In press.
[48] M. Panoiu and F. Neri, Open research issues on Modelling, Simulation and Optimization in Electrical Systems, WSEAS Transactions
on Systems, Vol.13, 2014, In press. [49] C. Ciufudean and F. Neri, Open research
issues on Multi-Models for Complex Technological Systems, WSEAS
Transactions on Systems, Vol.13, 2014, In press.
[50] F. Neri, Open research issues on Computational Techniques for Financial
WSEAS TRANSACTIONS on SYSTEMS K. Asokan, R. Ashokkumar
E-ISSN: 2224-2678 541 Volume 13, 2014

Applications, WSEAS Transactions on
Systems, Vol.13, 2014, In press. [51] F. Neri, Open research issues on Advanced
Control Methods: Theory and Application, WSEAS Transactions on Systems, Vol.13, 2014, In press.
[52] M. Azzouzi and F. Neri, An introduction to the special issue on advanced control of energy systems, WSEAS Transactions on
Power Systems, Vol.8, No.3, 2013, pp.103-104.
[53] Z. Bojkovic and F. Neri, An introduction to the special issue on advances on interactive multimedia systems, WSEAS Transactions
on Systems, Vol.12, No.7, 2013, pp.337-338.
[54] L. Pekař and F. Neri, An introduction to the special issue on advanced control methods: Theory and application, WSEAS
Transactions on Systems, Vol.12, No.6, 2013, pp.301-303.
[55] P. Hájek, and F. Neri, An introduction to the special issue on computational techniques for trading systems, time series forecasting, stock market modelling, financial assets modelling, WSEAS Transactions on
Business and Economics, Vol.10, No.4, 2013, pp.201 -292.
[56] C. Guarnaccia, and F. Neri, An introduction to the special issue on recent methods on physical polluting agents and environment modeling and simulation, WSEAS
Transactions on Systems, Vol.12, No.2, 2013, pp.53 -54
[57] F. Neri, An introduction to the special issue on computational techniques for trading systems, time series forecasting, stock market modelling, and financial assets modelling, WSEAS Transactions on
Systems, Vol.11, No.12, 2012, pp.559 -560. [58] M. Muntean and F. Neri, Foreword to the
special issue on collaborative systems, WSEAS Transactions on Systems, Vol.11, No.11, 2012, pp.617-618.
[59] L. Pekar and F. Neri, An introduction to the special issue on time delay systems: Modelling, identification, stability, control and applications, WSEAS Transactions on
Systems, Vol.11, No.10, 2012, pp.539-540. [60] C. Volos and F. Neri, An introduction to the
special issue: Recent advances in defence systems: Applications, methodology, technology, WSEAS Transactions on
Systems, Vol.11, No.9, 2012, pp.477-478.
WSEAS TRANSACTIONS on SYSTEMS K. Asokan, R. Ashokkumar
E-ISSN: 2224-2678 542 Volume 13, 2014