emg measurement of the fatigability of paraspinal muscles ... · different curve types. 5) to...
TRANSCRIPT

EMG Measurement of the fatigability of paraspinal muscles of patients with adolescent
idiopathic scoliosis
By
Alan Richter
A thesis submitted in partial fulfillment for the requirements of
Master of Science
in
Rehabilitation Science
Faculty of Rehabilitation Medicine
University of Alberta
© Alan Richter 2014
ii
Abstract
This thesis aimed to address two separate questions, 1) Are current exercise approaches to
scoliosis based on a strong foundation in the literature? And 2) Do the paraspinal muscles of
patients with adolescent idiopathic scoliosis (AIS) differ in endurance properties from controls?
The first question was answered through a systematic review of the literature investigating
functional muscle properties of the paraspinal muscles and reported a summary of findings as
well as recommendations for future research. Results were reported according to 6 objectives: 1)
To describe differences in paraspinal muscle functional properties in patients with AIS compared
to healthy controls. 2) To describe differences in paraspinal muscle functional properties
between concave and convex sides of spinal curvatures in patients with AIS compared to healthy
controls. 3) To describe differences in paraspinal muscle functional properties within patients
with AIS between concave/convex sides at the end vertebrae and apical vertebra of the spinal
curves. 4) To describe differences in paraspinal muscle properties in patients with AIS with
different curve types. 5) To describe the correlation between paraspinal muscle properties of
patients with AIS with different curve characteristics (Cobb angle, apical translation, and
progression). 6) To determine the ability of paraspinal muscle properties to predict curve
progression in patients with AIS. The systematic review demonstrated a large amount of
variation in methodology and heterogeneity in all outcomes. Some limited evidence supported
findings, such as higher activity on the convex side of the curve, overall weakness in patients
with scoliosis, and correlations between EMG activity at the lower end vertebrae and progression
and prolonged latency and progression. However, due to poor reporting of methodology, small
sample sizes, and heterogeneous samples, we concluded that not enough evidence exists to
support many of the findings. Only one study was found on muscular endurance. We suggested

iii
that future rigorous research should include sample sizes large enough to allow for sufficient
power to detect differences, narrow ranges of Cobb angles, and have a sample size big enough to
allow curve type subgroup comparisons. Based on this review, we concluded that while a
number of exercise methodologies exist, these approaches are not yet based on a rationale related
to knowledge of the muscle imbalances specific to idiopathic scoliosis. Exercise prescription
may benefit from a stronger base of knowledge on muscle impairments in scoliosis.
The second question was addressed through a matched case-control study. The endurance
properties of the paraspinal muscles were compared between patients with AIS and controls.
Subjects performed 6 side planks (3 on each side) as well as a Sorensen test. Subjects held each
trial for as long as they could. EMG electrodes were placed at the apex, upper (UEV) and lower
(LEV) end vertebrae, as well as, on the medial deltoid on each shoulder. Controls were matched
for gender, age, BMI and EMG electrode placement sites. Groups were compared based on their
task length as well as the slope of the median frequency of the EMG signal. No significant
interactions involving groups were found, however, both groups performed better on convex
(mostly right) sided planks than left sided planks. For the side planks, more fatigability was
observed using EMG in the control group suggesting a possible difference in muscle activation
strategy in patients with scoliosis. Only 14 subjects were tested for the Sorensen task and no
group interactions were significant. Significantly more fatigue was noted at the LEV than at the
UEV in both groups during the Sorensen test and at the UEV during side planks. This pilot study
did not identify significant differences in endurance properties between the scoliosis and control
groups. This inability to detect some possibly clinically important differences (effect sizes >0.4-
0.66) is partly due to a small sample size, as well as heterogeneity of curve types and severities
in our sample. However, this study provides pilot data to guide future research in terms of task

iv
selection, sample size estimation, and subject recruitment. This thesis demonstrates that more
research is needed on paraspinal muscle impairments in patients with scoliosis to confirm the
limited evidence of an association between such impairments and risk of progression.

v
Preface
This thesis is an original work by Alan Richter. No part of this thesis has yet been previously
published. The research project, of which this thesis is a part, received research ethics approval
from the University of Alberta Research Ethics Board, Project Name “Trunk muscle fatigue and
scoliosis”, No. Pro00031256, 02/12/2013.

vi
Acknowledgments
I would like to acknowledge the Faculty of Rehabilitation Sciences as well as the
Physiotherapy Foundation of Canada, Alun Morgan Memorial Award in Orthopaedic
Physiotherapy Research for grants obtained to fund this study.
Thank you to Angela Libutti for her guidance and efficient administration of the Master’s
program. Thank you to all my coursework instructors for their dedication and for all that I gained
throughout the required coursework.
Thank you to Dr. John Misiaszek for generously allowing me to use his lab space and
EMG equipment.
Thank you to my committee members Dr. Greg Kawchuk and Dr. Marc Moreau for their
guidance.
I would like to thank Dr. Francois Roy and Dr. Juan Forero for giving of their time to
develop the Matlab and Labview programs for data collection and analysis as well as providing
valuable input into the EMG protocol and methodology.
Thank you to Kathleen Shearer for all her help with the project and for her untiring
commitment to patient recruitment.
Thank you to my fellow grad students and colleagues, Sanja Schreiber for her support,
time, guidance, and mentorship throughout the duration of the project. Thank you to Arnold
Wong for providing valuable resources and experience.
Thank you to my wife Orna for her unwavering support, patience, and encouragement as
well as to my children, Jordana & Zac for getting me out of bed in the morning both literally and
figuratively. Thank you to my cheerleaders from across the country, my parents Neville & Lyn
as well as my sister Joanne and her husband Dani.
Finally I’d like to thank my supervisor Dr. Eric Parent for being a tremendous mentor and
professional role model as well as for his never-ending dedication of time to my project and
commitment to my development as a student and researcher.

vii
Table of Contents
List of Tables ix
List of Figures x
List of Symbols and Abbreviations xi
Chapter 1: Introduction to Adolescent Idiopathic Scoliosis 1 Idiopathic Scoliosis .................................................................................................................................................... 1 Treatment of Adolescent Idiopathic Scoliosis ................................................................................................... 4 Exercise approaches to treatment .......................................................................................................................... 6 The Anatomy of Paraspinal Muscles ................................................................................................................... 7 Thesis organization .................................................................................................................................................... 9
Chapter 2: The functional properties of paraspinal muscles in adolescents with idiopathic scoliosis: A systematic review of the literature 11 Abstract ....................................................................................................................................................................... 11 Introduction ............................................................................................................................................................... 13 Methods ...................................................................................................................................................................... 16 Results ......................................................................................................................................................................... 19
Objective 1: To describe differences in paraspinal muscle functional properties in patients with AIS compared to healthy controls.............................................................................................................................. 19 Objective 2: Differences in functional properties convex:concave in AIS vs controls. ............... 21 Objective 3: Differences in functional properties within AIS patients between sides and levels22 Objective 4: Differences in Muscle properties in patients with AIS between different curve types ............................................................................................................................................................................................ 25 Objective 5: Association between muscle properties of patients with AIS and different curve characteristics (location, severity).................................................................................................................... 26 Objective 6: To determine the ability of muscle properties to predict curve progression....... 27
Discussion .................................................................................................................................................................. 27 Objective 1: Differences in functional muscle properties between patients with AIS and controls ............................................................................................................................................................................................ 30 Objective 2: Differences in convex-concave side measurements between AIS and controls ... 31 Objective 3: Differences in functional properties within AIS patients between sides and levels32 Objective 4: Differences in muscle properties in patients with AIS between different curve types ............................................................................................................................................................................................ 33 Objective 5: Correlation between muscle properties of patients with AIS and different curve characteristics ............................................................................................................................................................ 35 Objective 6: To determine the ability of muscle properties to predict curve progression....... 35 Implications for treatment prescription ........................................................................................................ 37 Future research recommendations ................................................................................................................... 39 Strengths & Limitations ......................................................................................................................................... 40
Conclusion ................................................................................................................................................................. 41
Chapter 3: Fatigability of paraspinal muscles in subjects with Adolescent idiopathic scoliosis: A case-control study 80 Abstract ....................................................................................................................................................................... 80 Introduction: .............................................................................................................................................................. 82 Methods ...................................................................................................................................................................... 84 Results ......................................................................................................................................................................... 90

viii
Curve Type .................................................................................................................................................................... 91 Questionnaires ............................................................................................................................................................ 91 Task length ................................................................................................................................................................... 91 Fatigue analysis ......................................................................................................................................................... 92 Correlation ................................................................................................................................................................... 93
Discussion .................................................................................................................................................................. 93 Holding times: ............................................................................................................................................................ 93 Paraspinal Fatigability ........................................................................................................................................... 94
Conclusion .............................................................................................................................................................. 101
Chapter 4: Discussion 113
Reference list 119
Appendix A: Search strategy for Systematic Review 127

ix
List of Tables Chapter 2
Table 2.1 Criteria used by both reviewers for assessing research quality…………………………………………………..…………43
Table 2.2 Summary & scoring of EMG quality criteria ……………………………………………………...……………………….44
Table 2.3 Criteria for drawing conclusions regarding levels of evidence in the included studies…………………………………….45
Table 2.4 EMG methodology used in studies based on ISEK criteria………………………………………………………………...46
Table 2.5 Study type, Inclusion & Exclusion criteria, and Group characteristics of included studies…………………………………….50 Table 2.6 Description of the tasks and measurements used to test muscle function for each study included in the review describing
differences in functional properties between AIS and controls………………………………………………………………………..56
Table 2.7 Description of the tasks and measurements used to test muscle function for each study included in the review describing
differences in functional properties between sides in patients with AIS compared to controls……………………………………….61
Table 2.8 Description of the tasks and measurements used to test muscle function for each study included in the review describing
differences in functional properties between sides and levels in patients with AIS…………………………………………………...63
Table 2.9 Description of the tasks and measurements used to test muscle function for each study included in the review describing
differences in functional properties between patients with AIS with different curve types…………………………………………...69
Table 2.10 Description of the tasks and measurements used to test muscle function for each study included in the review describing
associations between functional muscle properties and different curve characteristics (location, severity)…………………………..71
Table 2.11 Description of the tasks and measurements used to test muscle function for each study included in the review to determine
the associations between muscle properties and curve progression……………………………………………………………………74
Table 2.12 Results of quality assessment based on COSMIN criteria…………………………………………………………………77
Table 2.13 Level of quality of EMG reporting based on the proportion of the ISEK criteria met…………………………………….79
Chapter 3 Table 3.1 Demographic characteristics and questionnaire outcomes in both groups…………………………………………………………………………..104 Table 3.2 Location and frequency of transitional vertebrae in the AIS group………………………………………………………………………………………105 Table 3.3 Average holding time for the most similar 2 out of 3 trials on the planks performed on the convex and concave side and for the Sorensen test…………………………………………………………………………………………………………………………………………………………………………………....106 Table 3.4 Means and Standard deviations of Slope of the Median frequency for side planks on convex & concave sides at each EMG recording location……………………………………………………………………………………………………………………………………………………………………………..107 Table 3.5 Statistical significance of the main effects, interactions for the comparison of fatigue measurements using the groupXtaskXsideXlevel mixed model ANOVA for side planks and a groupXsideXlevel mixed model ANOVA for the Sorensen test………….108 Table 3.6 Mean slope (Hz/sec) of the Median frequency for paraspinals at each tested level on each side of the spine in both groups during the Sorensen Task…………………………………………………………………………………………………………………………………………………………………..109 Table 3.7 Correlations between SRS-22r function scores and task lengths for each side plank and for the Sorensen test………………………1

x
List of Figures
Chapter 1
Fig 1.1 Measurement of the Cobb angle………………………………………………………......2
Fig 1.2 Lonstein & Carlson’s equation to measure the potential for curve progression. .........…..4
Chapter 2
Fig 2.1 PRISMA flow chart of the search process and inclusion/ exclusion numbers from the
initial database search until final synthesis ……………………...........................................……80
Chapter 3 Fig 3.1 Modified beginner side plank…………………………………………………………...110
Fig. 3.2 Sorensen Test…………………………………………………………………………...111
Fig 3.3 EMG output with end of task visible…………………………………………………...112

xi
List of Symbols and Abbreviations
AIS – Adolescent Idiopathic Scoliosis
Ctrl – Control group
D-PMT – Differences in Premotor time
EMG - Electromyography Hz - Hertz IIS – Infantile Idiopathic Scoliosis IS – Idiopathic Scoliosis JIS – Juvenile Idiopathic Scoliosis Lbs - pounds
MF – Median Frequency
MVC – Maximal voluntary contraction
MVIC – Maximal voluntary Isometric contraction
Nm- Newton meters (force)
PMT – Premotor time
Pts – Patients
Reps - Repetitions
RMS – Root mean square
ROM – Range of Motion
Scoli – Overall Scoliosis group
Scoli<x - Cobb angle descriptor
Scolifastprog - fast progressive Scoliosis
Scoli-Nprog - Non progressive Scoliosis
Scolipre-op - preoperative Scoliosis
Scoli-prog - Progressive Scoliosis
Scolislowprog - slow progressive Scoliosis
Sec - Second
sEMG – Surface electromyography
yo= Year old
1
Chapter 1:
Introduction to Adolescent Idiopathic Scoliosis
Idiopathic Scoliosis
Idiopathic Scoliosis is a deformity of the spine of unknown etiology that occurs in 3
planes: a curve in the frontal plane, hypo or hyper kyphosis in the sagittal plane and rotation in
the transverse plane.2 Idiopathic scoliosis makes up 80-85% of all scoliosis cases in the United
States.3 Other types of scoliosis include congenital scoliosis and neuromuscular scoliosis
resulting from neuromuscular or syndromic conditions such as spina bifida or cerebral palsy3.
Idiopathic scoliosis is subdivided into three age-related categories based on peak periods of
onset.4 A curve detected before the age of three is labeled ‘Infantile Idiopathic Scoliosis’ (IIS), a
curve detected between the ages of five and eight is labeled ‘Juvenile Idiopathic Scoliosis’ and a
curve detected from age ten until the end of growth is labeled ‘Adolescent Idiopathic Scoliosis’
(AIS).4 These labels are loosely used, however, as a diagnosis is applied based on the patients
age at detection rather than at onset. A curve that arose in the Juvenile age may not be detected
until the subject is in the age range to be labeled as an AIS patient. As such there may be an
overlap between cases of AIS and JIS when reporting on the prevalence and prognosis of these
types of idiopathic scoliosis.
Prevalence
Eighty percent of cases of idiopathic scoliosis fall into the AIS category,5 and thus,
despite some overlap with JIS cases, AIS is the most prevalent type of idiopathic scoliosis. The
prevalence rate of AIS ranges from 2 to 9% of the population2,6
, however these rates are very
much dependent on curve size cutoffs used for diagnosis. In North America a curvature of 10° is
labeled as scoliosis. At this cutoff the prevalence rate is 2-2.5%.2 The diagnosis of idiopathic
scoliosis is one of exclusion and is given once vertebral malformation, neurological disorders,
and syndromic disorders have been ruled out.2

2
Etiology
As implied by its name, the etiology of AIS is unclear. There is a strong genetic
component to AIS; however, no specific gene has been pinpointed. Metabolic factors such as an
abnormal metabolism of melatonin have also been suggested, however, no specific abnormalities
have been consistently identified in the literature. Results of studies involving pinealectomies are
mixed and other diseases in which melatonin metabolism is affected do not result in scoliosis.2
Links have also been established between the emergence of small curves and elevated levels of
calmodulin, however, the connection between these two factors has not been fully understood.2,7
Abnormalities within the paraspinal muscles themselves have been implicated as
decreased proportions of type I fibres have been identified as well as impaired function of
calcium pumps within the muscles8, however, no evidence exists to claim these as a cause or a
symptom of scoliosis.2 A variety of other etiology hypotheses and evidence have been presented
in the literature9-11
and since no clear consensus has been reached regarding etiology, this type of
scoliosis continues to be labeled as idiopathic.
Measurement
The standard measure for spinal curvature is the Cobb Angle. The Cobb angle is
measured by locating the top endplate of the top vertebrae of the curve, which is identified as the
vertebrae having a superior surface most tilted towards the curve concavity. The bottom endplate
of the bottom vertebra is then located by finding the lowest vertebrae having an inferior surface
most tilted towards the concavity. Lines are drawn along the top and bottom of these endplates
on the radiographic film. Once these lines are drawn, intersecting perpendicular lines are drawn.
The Cobb angle is the resulting angle formed by the perpendicular lines (Fig 1.1).1
Fig 1.1 Measurement of the Cobb angle1

3
Progression
While the Cobb angle will increase over the lifespan of a person with severe scoliosis (roughly
0.76°-1°/year after skeletal maturity in curves >50°)12
there are periods when the curve is at a
higher risk of progression. Risks factors for progression are: lower age at diagnosis, pre-
menarchal status, and a position of the curve apex in the thoracic spine.13
Curve magnitude is
also a factor in curve progression. The larger the Cobb angle, the higher the risk of progression.
Curves less than or equal to 30° are at a lower risk of progression, whereas curves greater than
30° are at a higher risk of progression (~30%).14
This risk of progression increases greatly as the
curve further increases in magnitude. Seventy percent of Curves >50° progress at a rate of 0.76-
1°/year.12
In addition, apical vertebrae with 30% rotation and Mehta angle of 20° or more (rib-
vertebral angle difference) are at a higher risk of progression.13
Generally negative consequences
of scoliosis begin to manifest themselves when curves exceed 40-50°2,15
Skeletal maturity is a strong predictor of the potential for curve progression. The farther
patients are from skeletal maturity the more at-risk they are for progression. The most commonly
used sign to determine skeletal maturity is the Risser sign which divides patients into 5
categories based on the degree of ossification of the illium (0 representing no ossification and a 5
being full ossification). It generally takes two years to reach full ossification from the time
ossification begins.16
Sanders et al proposed an approach dividing skeletal maturity into 8 stages.
Stage 1 is the juvenile slow stage in which digital epiphyses of the hand are not yet covered.
Stage 2 is the preadolescent slow stage in which the digital epiphyses are covered. Stage 3 is the
early adolescent rapid stage in which the second through fifth epiphyses are larger than their
metaphyses. Stage 4 is the adolescent rapid late stage in which any distal phalangeal physis is
beginning to close. Stage 5 is the adolescent steady early stage in which all distal physes are
closed but all others are open. Stage 6 is the late adolescent steady stage in which middle or
proximal phalanges are closing. Stage 7 is the early mature stage where only the distal radial
physis is open. Stage 8 is the final stage in which the distal radial physis is completely
closed.17,18
Thus skeletal maturity can be determined using radiographs of the hand (Sanders) or
pelvis (Risser).16
Sanders et al found that the Tanner-Whitehouse III RUS Scale strongly predicts
the curve acceleration phase (R value of 0.93 p<0.001).17
The juvenile slow and preadolescent
slow phases were observed 6 months before the curve acceleration phase. The rapid adolescent

4
phase of growth described in the Tanner-Whitehouse III RUS scale began within 6 months of the
curve acceleration phase.17
Lonstein and Carlson identified an algorithm to determine the risk of progression using
chronological age, the Cobb angle, and the Risser sign. They demonstrated that a progression
risk factor can be determined using the formula in figure 1.2 and converted to a percent
incidence estimated given the risk factors (fig. 1.2).19
Treatment of Adolescent Idiopathic Scoliosis
In North America, curves are typically observed until they reach 25-30°, after which a
brace is prescribed.2,20
If curves further progress to 45-50° a surgical intervention is generally
Fig 1.2 Lonstein & Carlson’s equation to measure the potential for curve progression. The higher the progression factor, the greater probability of progression.19

5
recommended.2,21
Physical therapy is occasionally advised in smaller, non-progressive curves,
but little evidence exists in the literature to support such an intervention especially with regards
to limiting curve progression.2,22
However, while European approaches and recommendations for
bracing and surgery are similar to North American guidelines, exercises are often recommended
in Europe during periods corresponding to the observation and bracing stages of management in
North America.23
Bracing
The general goal of bracing is to prevent progression of the curve until skeletal maturity
is reached.21
Bracing is the most common non-operative, preventative treatment for idiopathic
scoliosis in North America.21
The most common brace in North America is a rigid
thoracolumbosacral orthosis (TLSO) with the goal of stopping the progression of spinal
misalignment through external pressure. Practitioners differ in opinion as to the quality of the
evidence in favor of bracing.2 In a recent RCT study of 242 subjects undergoing either bracing or
observation, Weinstein et al. noted a significantly decreased incidence of progression in high-risk
curves in the braced group. The odds ratio of successful treatment was 1.93 (1.08-3.46). Brace
wearing demonstrated a strong dose-response relationship, with longer hours of brace wearing
being associated with a greater rate of success. The greatest rate of success was seen in brace-
wearers for 17.7 hours a day or more however, bracing may be effective with just 13 hours of
wear per day.21
In contrast, a review by Weiss & Goodall stated the ideal brace wearing time to
be 23 hours a day15
and, in their meta-analysis, Rowe et al suggest that at least 18 hours of brace
wearing is necessary.24
Surgical intervention
When curves progress to 45-50° surgery is recommended. The spine is fused and held
with rods and pedicle screws inserted along the length of the curve through an incision in the
back (posterior instrumentation). The primary goals of surgery are to stop progression, allow for
maximal permanent correction, improve appearance by balancing the trunk, as well as decreasing
both short and long-term complications from scoliosis such as pain and reduced respiratory
function.2 While reported neurological complications from surgery are low (0.49% from 2001-

6
2003 in patients aged 10-17)25
surgery is a painful and uncomfortable procedure from which
complications such as infection, pseudarthrosis and implant prominence can occur.13
Exercise approaches to treatment
While some research has been published exploring the efficacy of various exercise-based
approaches to scoliosis management, the overall quality of the research is poor and little
evidence exists to support it’s use.2,13,15,22,26,27
This lack of high quality research has kept the
clinical use of exercise based physical therapy approaches to a minimum. While specific
exercises differ among the many methods, the correction principles and the prescription
parameters overlap. Some of the most frequently published approaches to Scoliosis-specific
exercise-based management are discussed below.
1) The Schroth Method
Developed and popularized by Katrina Schroth, the primary goal of the Schroth
method of exercise treatment is to develop the patients ability to maintain and self-correct
their curve independent of visual or therapist feedback.26
This goal is achieved by thorough
patient education of how scoliosis affects each individual subject’s spine and torso posture.
The Schroth approach consists of scoliosis-specific exercises helping maintain correct
posture in daily activities. Schroth exercises focus on endurance and control of postural
muscles and aim to improve postural control by employing repetitive corrective
movements with progressively less external feedback and passive support from trained
therapists. The intensity of the Schroth method ranges from one to two visits a week to an
intensive 4-week inpatient program with daily exercises for as many at 7 hours a day.
2) The Scientific Exercise Approach to Scoliosis (SEAS) Method
One of the primary goals of the SEAS method is increasing spinal stability while
maintaining auto-correction. This is performed by having patients perform tasks that
challenge proper postural alignment while autocorrecting their spinal positioning.
Movements are held for 10 seconds. The SEAS method suggests that spinal collapse is
related to the inability of the surrounding musculature to maintain spinal alignment against
gravity leading, in turn, to skeletal deformity.28
Thus, muscular activation is a priority in

7
realigning the curve. SEAS also employs in-brace exercises to overcome the side-effects of
brace wearing such as the possibility of muscle wasting and breathing impairments. 26
3) The Dobomed Method
The Dobomed method was introduced in 1979. It focuses on management of the spinal
deformity as well as respiratory impairment. The corrective movements focus on spinal
flexion (kyphosis) and derotation in the thoracic region. The exercise protocol initially uses
many exercises in the quadruped position in an attempt to restore and maintain the
vertebrae to their neutral position.26
Dobomed is administered in a 3-week inpatient setting
where patients are monitored and perform exercises daily. After the three weeks they
continue the exercises in an outpatient setting.
4) Side Shift & Hitch exercise
The side shift exercise was introduced in 1985. In involves a side shift of the trunk to the
concavity of the curve, holding for 10 seconds and returning to the original stance. This
movement is repeated 30 times per day. The hitch exercise is used as a treatment for the
lumbar curve. Patients lift the heel on the convex side of the curve with the hip and knee
straight. This is held for 10 seconds and repeated 30 times per day. The hitch shift exercise
is used for double curves in which a combination of the above movements in held for 10
seconds and repeated 30 times per day. This method is recommended in or out of brace.26
The physiological mechanisms by which the previous exercise approaches may correct
curves are not clearly detailed in publications on Schroth,22,26
Integrated scoliosis
rehabilitation,29
Dobomed,26
Side-shift,30
or on the Scientific Exercise Approach to Scoliosis.22,26
Muscle Characteristics
Paraspinal postural muscles are important in maintaining spinal alignment and thus, a
deficit in the physiological properties of these muscles could affect the ability of these muscles to
maintain proper spinal alignment potentially leading to the collapse of the spinal column.
The Anatomy of Paraspinal Muscles
The deep muscles running alongside the spine are numerous with a variety of origins and

8
insertion points as well as overlap. There are three categories of muscle groupings used to
classify spinal muscles, the erector spinae, transversospinalis, and quadratus lumborum
muscles.31
Erector Spinae- The erector spinae group of muscles is subdivided into three subgroups, known
as the illiocostalis group, the longissimus group, and the spinalis group. The three groups flank
the vertebral column, with the illiocostalis group located most laterally, the longisimmus group
more medially and the spinalis group most medially placed of the three groups. All three groups
are responsible for vertebral and neck extension as well as maintenance of posture.
Transversospinalis - This group is subdivided into five categories. The interspinales muscles
are responsible for vertebral extension and connect the spinous process of adjacent vertebrae.
The intertransversarii are involved in lateral flexion and connect the transverse processes of
adjacent vertebrae of each side of the spine. The multifidus muscles are involved in vertebral
extension (if contracting bilaterally) as well as rotation (unilaterally) and side bending
(unilaterally). The rotatores are also involved in extension and rotation. The final group is the
semispinales muscles which are involved in extension of the spinal column and neck as well as
lateral flexion and rotation of the neck.
Quadratus Lumborum - This group is involved in the extension and ipsilateral lateral flexion
of the lumbar spinal vertebrae.
Interestingly, research does not document adequately how patients with scoliosis differ in
terms of paraspinal muscle properties from healthy controls and between curve type and severity
subgroups. Documenting such differences is important as they may affect the patient’s ability to
maintain spinal alignment and stability as well as provide a rationale for selecting specific types
and dosages of exercises. Such an understanding is needed to determine appropriate exercise
goals, refine the exercises themselves as well as identify important outcomes for assessing their
effectiveness.
When studying muscle properties, a number of outcomes are important in measuring
function. Strength is the ability of a muscle group to exert force against an object.32
Flexibility
represents the absolute range of motion in a joint or series of joints.32
Power is defined as the

9
speed at which force can be produced.32
Endurance is defined as the ability of a muscle or series
of muscles to repeatedly exert force against resistance.32
High performance in these regards
represents good overall muscle function.32
Endurance is an important outcome when studying spinal musculature and scoliosis.
These muscles need to have good endurance properties, as they must constantly maintain spinal
alignment during daily activities. Deficiencies in type I fibres (the fibre type necessary to
maintain sustained contractions) have been identified in those with scoliosis and as such may
affect the ability of those muscles to sustain correct posture.8 Postural control indeed requires
long, low intensity contractions from postural muscles. Dejanovic et al, consistent with this
observation, suggest that endurance properties are a better indicator of spinal stability than
strength.33
further highlighting the importance of studying this outcome.
While the aforementioned approaches to exercise, based on our review of how exercises
are prescribed, utilize exercise approaches which encourage the improvement of endurance
properties (using long holds, static contractions, and multiple repetitions), they do not explicitly
suggest that improving this muscle property is a treatment objective. Further, the authors do not
justify prescription of exercises at doses likely to improve endurance with an understanding of
whether endurance deficiencies exist, and if they do, how they manifest themselves.
Thesis organization
This chapter has provided the reader with an overview of the literature on scoliosis; it’s
etiology, diagnosis, prognosis, and background on paraspinal musculature adjacent to the spine.
This introduction provides the context for the studies included in this master program. A number
of methods that can be used to determine the presence of deficits in muscle properties in patients
with AIS were presented such as EMG, ultrasound, and strength. Documenting such deficits may
provide a rationale for studying and improving exercises prescription parameters when aiming to
control curve progression in AIS. The next chapter will therefore systematically review the
literature for various methods of assessing functional muscle properties; review the quality of the
literature; and determine if differences exist between curve type, severity, and healthy controls.
The following chapter will then proceed to report the rationale, methodology and results of a
study performed to examine the endurance properties of paraspinal muscles measured through
EMG at different levels relative to the curves in patients with AIS and comparing them to

10
controls. This thesis will then conclude with a discussion chapter highlighting the significance of
our findings and recommendations for future research.

11
Chapter 2:
The functional properties of paraspinal muscles in adolescents with idiopathic scoliosis: A
systematic review of the literature
Richter, A.; Parent, E.
Abstract
Introduction: Current approaches to scoliosis management in North America consist of
observation, bracing, and surgery. Some exercise-based approaches exist; however, it is unclear
whether these approaches are based on scientific findings in the literature regarding trunk muscle
deficits in scoliosis. The aims of this study were to systematically review the literature to
understand the functional muscular properties of paraspinal muscles in AIS to determine: 1)
differences in functional outcomes between patients with AIS and controls, 2) differences in
functional outcomes between sides (concave and convex) between patients and controls 3)
differences between concave and convex sides as well as levels in subjects with AIS, 4)
differences in functional outcomes between different curve types. 5) Associations between
functional outcomes and curve characteristics, and 6) associations between functional
characteristics and progression
Methods: A search was conducted in EMBASE, MEDLINE, SPORTdiscus, CINAHL,
SCOPUS, and Web of Science, for keywords describing functional properties of paraspinal
muscles and measurement tools including: scoliosis, spinal deformity, spinal muscles, erector,
rotatores, longissimus, spinalis, illiocostalis, forse, strength, endurance, fatigability, and muscle
fatigue. Two reviewers independently reviewed abstracts and then full-text articles to determine
if they met selection criteria. Two reviewers used an extraction form to extract information and
appraise the quality during full text review. Levels of evidence were determined for summarized
results for each of the 6 objectives.
Results: Our search yielded 316 unique records. Abstract selection inter-reviewer agreement was
Kappa = 0.73. Full text review was done for 48 papers and 24 were included. Inter-reviewer
Kappa for the full text review was 0.77. A large amount of heterogeneity was in sample studied
and assessment methodology. Quality appraisal revealed that no study met a minimum of 50% of
the relevant quality criteria. Studies recruited consistently low sample sizes and samples were
largely heterogeneous. Limited evidence was noted supporting, prolonged bilateral EMG
activation during gait between AIS and controls; elevated homolateral:heterolateral activity

12
ratios during side-bending; overall weakness in those with scoliosis compared to controls; no
asymmetry in normalized muscle activity during submaximal isometric contractions; prolonged
latencies on the side of the spine opposite of the curve and bilaterally in response to an unloading
reflex; strength & muscle volume differences are most commonly pronounced in double curves;
Axial rotation of the UEV is correlated with a high convex:concave activity ratio at the LEV; no
correlation between latency and curve severity, but a correlation between latency and
progression and higher EMG ratios convex:concave and progression, this is pronounced in
sitting positions.
Conclusions: Evidence is limited on most objectives due to low quality evidence and lack of
research about muscle impairments in scoliosis. Current exercise-based interventions cannot yet
be based on a strong understanding of muscle impairments in scoliosis. Research is needed using
large, homogenous samples allowing for a comparison between curve types and examining
relation to the risk of progression. While many exercise-based programs focus on addressing
endurance deficits using high repetitions and long holds, no studies were found on endurance
deficits in AIS.

13
Introduction Scoliosis is a three-dimensional deformity of the spine occurring in the frontal,
transverse, and sagittal planes. Adolescent Idiopathic Scoliosis (AIS) describes patients with an
onset of scoliosis from age 10 until the end of growth.13
The magnitude of the curve is
determined by the Cobb angle obtained from two lines drawn on a radiograph, one from the top
of the highest most tilted vertebrae and one from the lowest most tilted vertebrae of the curve
being measured. Intersecting perpendicular lines emanating from these lines are then drawn and
the Cobb angle is the angle between the intersections of these lines.1
The etiology of Scoliosis is unclear; while there is a genetic component to scoliosis there
is no clear pattern of inheritance.13
One of the hypotheses is that the deformity may be due to
muscular deficiencies and imbalances,2 however, it is unclear whether the deformity is caused by
a preexisting muscle imbalance or whether a muscular imbalance is caused by a preexisting
deformity.2
Due to the limited knowledge on etiology, scoliosis management emphasizes the
prevention of curve progression rather than curve reduction. Curves are ‘observed’ for
progression until they reach 25-30° after which a protocol of bracing is recommended.13,20
Curves 30° or more are at a higher risk of progression throughout adulthood while smaller curves
usually do not progress14
and therefore a brace is prescribed to prevent such progression. If
curves reach 45-50° a surgical intervention is often recommended.13
The literature demonstrates that a number of muscular deficits accompany the spinal
deformity in AIS. Muscles in the curve concavity have been found to be shorter than the muscles
running along the convex side of the curve. Fiber type imbalances have been noted on either side
of the curve, with a higher proportion of type I, (endurance) fibers on the side of the curve
convexity in scoliosis patients and a higher number of type II (fast fatigable) fibers on both sides
of the curve when compared to controls.8 Studies have also demonstrated higher EMG activity
on the convex side of the curve when compared to the concave.34
While imbalances in muscle characteristics such as strength, fiber type, and activity
differences have been documented in the deformed spine, no exercise-based approach is
routinely used nor recommended in North America.2 This limited use of exercises is due in part
to the poor quality of the available research investigating the effect of various exercise-based
approaches even though the evidence appears promising.22,26
Scoliosis-specific, exercise-based

14
approaches aim to restore a balanced posture and prevent curvature progression. Scoliosis-
specific approaches use exercises and dosages consistent with improving balance in muscle
characteristics across the spine and improve the endurance properties of paraspinal muscles.
However, none of these approaches have stated the rationale for their approaches in light of
current research into the physiological properties of paraspinal muscles surrounding the
deformed spine. 26
In contrast, studies on low back pain have demonstrated the presence of muscle
imbalance and the potential for therapeutic exercises to help restore balance and function to
paraspinal muscles.35
Studies have demonstrated improvement in endurance properties as well as
the ability to activate stabilizer muscles through the use of therapeutic exercises.36,37
Documenting the presence of deficits in paraspinal muscle characteristics and the possibility of
correcting deficits through exercises are important if a rationale for exercise interventions in
scoliosis is to be developed. The current exercise programs for scoliosis that attempt to correct
posture by targeting paraspinal musculature were not specifically developed to address deficits in
muscle characteristics. A review of the literature is needed on postural muscle deficits present in
AIS.
There are numerous ways to document muscle function. Strength measurements are a useful
measure of function and commonly obtained using dynamometry.38 Electromyography (EMG) is
a useful and versatile tool that can be used to measure muscle latency, activity, as well as
endurance.39 Imaging can be used to measure muscle thickness at rest and during contractions.
Many of these tools have been employed in studies of muscle function in AIS. There are reviews
of the literature reporting promising effects of exercise-based interventions on outcomes other
than muscle characteristics.22,26,27 However, to provide a rationale for exercise based approaches
and possibly inform how to improve exercise prescription, the literature surrounding various
muscular imbalances in AIS that could be targeted by exercises needs to be studied and reviewed
as well.
Objectives
The general study objective was to systematically review the existing literature exploring
functional muscle properties such as activity, latency, strength, and fatigability documented

15
using EMG, imaging and dynamometry in people with Adolescent Idiopathic Scoliosis (AIS).
The specific aims, if literature was sufficiently rich to address them, were:
1) To describe differences in paraspinal muscle functional properties in patients with AIS
compared to healthy controls.
2) To describe differences in paraspinal muscle functional properties between concave and
convex sides of spinal curvatures in patients with AIS compared to healthy controls
3) To describe differences in paraspinal muscle functional properties within patients with
AIS between concave/convex sides at the end vertebrae and apical vertebrae of the spinal
curves
4) To describe differences in paraspinal muscle properties in patients with AIS with different
curve types
5) To describe the correlation between paraspinal muscle properties of patients with AIS
with different curve characteristics (cobb angle, apical translation, and progression)
6) To determine the ability of paraspinal muscle properties to predict curve progression in
patients with AIS.
Hypothesis
As a result of our a priori knowledge of the literature, we expected this review to find
studies highlighting the effects of the aforementioned imbalances. We hypothesized that we
would find:
1) Differences in overall EMG activity, endurance, latency, and strength between patients with
AIS and healthy controls. Higher EMG activity, lower endurance, longer latencies and decreased
strength in the paraspinals is expected in the AIS group.
2) Differences in the overall EMG activity, endurance, latency, and strength between convex and
concave sides of the curve in patients with AIS vs healthy controls. With greater balance of these
outcomes across the spine in the healthy group compared to the AIS group.
3) Differences in the overall EMG activity, endurance, latency, and strength between convex and
concave sides of the curve as well as between levels of the curve in patients with AIS. We
expected greater activity and latency times on the convex side of the curve, and shorter latency

16
times and lower strength on the concave side of the curve. Higher EMG activity was expected at
the endpoints of the deformity compared to the apex.
4) Differences in the overall EMG activity, endurance, latency, and strength between different
curve types and severity with greater imbalances in the musculature surrounding more severe
curves and different patterns of imbalance in multiple curves compared to single curves.
5) Significant correlations between higher muscle activity, endurance, latency and strength and
Cobb angle, apical translation, and progression.
6) We expected the muscle activity and strength to be able to predict curve progression in AIS.
Methods A comprehensive literature search was conducted in April 2013 in EMBASE (1974 –
April 2013), MEDLINE (1946 to April 2013), SPORTdiscus (1975 – April 2013), CINAHL
(1937 – April 2013) SCOPUS, and Web of science (1899 – April 2013) for a set of
predetermined indexed and free text keyword terms describing various functional properties and
measurement tools for paraspinal muscles in AIS. No date limits were applied to the search.
The keywords included in the search were: Scoliosis, spinal deformity, spinal muscles, spinal
musculature, erector, rotatores, longissimus, spinalis, illiocostalis, force, strength, endurance,
fatigability, and muscle fatigue.
The full search strategies for each database were developed with the help of a librarian and can
be found in appendix A
Inclusion criteria
Studies were included if the patient population had AIS, were aged 10-18 years old (with at
least 75% within the age bracket). Included studies focused on paraspinal stabilizer muscles,
functional muscle properties, and conservative management of scoliosis. Studies were included
in the following languages: English, Hebrew, and French based on the fluencies of the reviewers.
Randomized controlled trials, cohort studies, case-control, case series, and prospective controlled
studies were included.
Exclusion Criteria
Studies were excluded if their main outcome was bio molecular analysis as opposed to
functional parameters, if the patient population was post-surgical, had any other type of scoliosis
diagnosis (such as congenital scoliosis), or had scoliosis due to a traumatic incident. Case

17
studies, studies involving less than 10 subjects, or studies that were non-experimental in nature
were excluded.
Screening Process
Once the search was completed, the reference lists from each database were exported to
Refworks. Duplicates were removed using the duplicate removal function in Refworks and two
evaluators assessed the list of titles and abstracts to determine if they met inclusion criteria.
Articles selected by either evaluator were compiled into a final list to be retrieved for full text
review. If disagreement occurred the full texts of the articles were retrieved for further
clarification. Full texts of the articles were obtained. Identifying information (title and author)
were removed by an independent research assistant, and both reviewers used a standard
extraction form to review the blinded full-text version of the papers.
Extraction form
The extraction form was divided into a number of sections. A checklist of study selection
criteria was completed to confirm study eligibility before extraction took place. Study design,
objectives, subject inclusion or exclusion criteria, and follow up details were then recorded.
Characteristics of each subgroup were extracted including sample size, maturity indicators and
curve characteristics. The exercise task used to appraise muscle function, sets/reps, measurement
tool, and outcome variables were recorded as well as any information regarding normative data
referred to in the paper.
Study quality was then assessed. Questions relevant to the present study based on
COSMIN criteria40
were used including questions such as justification of sample size, blinding
of researchers, and procedure replication (Table 1). Each study was given a score for each item
based on the COSMIN criteria relevant to each study. The quality of reporting of EMG study
was assessed using the International Society of Electrophysiology and Kinesiology (ISEK)
checklist (Table 2).41
Results of differences between groups, sides and levels were also extracted along with the
statistical methods used in difference testing. Estimates of associations and variables tested were
also extracted along with the statistical methods used to estimate associations. An extraction
form was prepared based on those used in similar reviews and modified to suit the needs of this

18
review.42
The first reviewer compared extractions performed by both reviewers and consensus
discussions were used to resolve differences.
Reviewer agreement
Agreement between reviewers was determined by comparing the include/exclude
recommendations for the title/abstract and the full-text reviews as well as the rating of the quality
appraisal criteria. A Kappa statistic was calculated to determine a coefficient of agreement
between reviewers and the percent agreement was calculated.
Data Summaries
From the extracted data, summary tables were prepared. A table was prepared to describe
the groups and subgroups as well as inclusion & exclusion criteria of the respective papers.
Another table reports the EMG reporting quality as per the ISEK checklist. The scoring criteria
are listed in table 2. Another table summarizing the quality of the papers as determined by the
COSMIN criteria was prepared. Six different tables were assembled summarizing study results
for each of the six different objectives.
The summary paragraphs for each objective were divided based on measurement tools
and methodology. For each paragraph, results were reported in alphabetical order. The
measurement tools found in the literature and relevant to this review were dynamometry,
imaging, and EMG methodologies. These tools were subdivided into outcomes variables.
Imaging was restricted to muscle thickness measurement, and EMG-related outcomes were
divided into latency, fatigue measurement, and activity.
No meta-analysis was planned in the present study because of the anticipated
heterogeneity in research methodologies. The level of evidence for conclusions related to each
objective was therefore assessed using the criteria adopted in previous prognostic research.43
The
level of evidence (strong, moderate, limited, no, and conflicting evidence) was classified based
on the quality appraisal of the studies and the consistency of the research findings (Table 3). A
high quality study in the present review was defined as a study for which >50% of quality
criteria deemed applicable were met. If >75% of all the included studies reported a factor that
showed a uniform association in the same direction, the evidence was considered consistent.43

19
Results The PRISMA flowchart summarizing this study’s selection strategy and results are
presented in figure 2.1. Web of Science and Scopus returned the most hits. The Kappa
coefficient representing reviewer agreement during abstract review was 0.725. After abstract
review a total of 48 articles were selected for full-text review. A total of 20 articles were
included after the full-text review stage. Kappa coefficient of agreement for full text inclusion
before consensus discussion was 0.768. Full EMG methodologies can be found in table 4. The
samples and subgroups examined in each of the studies are described in table 5.
The study quality assessments can be seen in table 12. Overall study quality was poor as
no studies met greater than 50% of the applicable COSMIN criteria. Out of 25 criteria, 14 criteria
were met by 5 or less studies. These criteria were whether a representative sample and/or
examiners was used (20% & 4% of studies respectively); whether examiners were blinded to
clinical information or other task related information (0% for all four examiner blinding related
criteria); whether consecutive sample of patients were enrolled (20% of studies); what
percentage of missing data was reported (12% of studies) and how this data was handled (12% of
studies).
The most commonly met quality criteria were: adequate study design (met by 88% of
studies); reporting demographic characteristics (met by 64% of studies); and the ability to
replicate the testing methodology (met by 60% of studies). The results of EMG reporting
analysis based on the ISEK criteria can be found in table 13. Criteria that were not reported by
any study were excluded from the list of items. Criteria that were not listed in this table were:
amplification type, impedance, & crosstalk. Only one study reached 80% EMG reporting quality.
Six studies out of 15 reached 60% quality, and eleven out of fifteen reached 50% quality.
Findings related to the six objectives
Objective 1: To describe differences in paraspinal muscle functional properties in patients
with AIS compared to healthy controls.
Eight papers summarizing 8 unique studies addressed objective 1 (Table 6). Six studies
employed EMG methodologies and four employed strength testing through either dynamometry
or manual muscle testing.

20
EMG Methodologies
Those with fast progressive scoliosis demonstrated a longer latency than slow progressive
scoliosis, pelvic tilt scoliosis and controls and less unloading reflex cycles at T8.44 Subjects with
AIS demonstrated higher activity measured using RMS on the heterolateral side of the spine
during side bending compared to controls. These increases in heterolateral to homolateral ratios
in patients compared to controls were more pronounced in left bending tasks than in right
bending specifically at T10, L1, and L3 (Apical sites) and abdominal sites.45 During a lateral step
test, among 4 EMG and 10 ground reaction force discriminating variables considered, the right
and left erector spinae muscles, right gluteus maximus, as well as the latero-lateral ground
reaction force had stronger correlations with the discriminating function correctly classifying
78% of patients with AIS and controls.46 In addition, one study reported a significant difference
in RMS of muscle activity across the spine between patients and controls.47 Muscle activity
duration during gait was significantly prolonged in patients with AIS than controls for the
Erector spinae & Quadratus lumborum.48,49 In contrast, Oliveira et al found no difference in
overall normalized RMS between patients and controls during contraction in extension at 40, 60
and 80% MVIC.50
Due to the heterogeneity of study methodology, evidence is limited (one low quality
study for each variable) suggesting prolonged EMG activation during gait, increased
heterolateral to homolateral activity ratios during side bending tasks, unique EMG response
during lateral step tests and the absence of a difference during extension contractions at different
intensity of contractions in patients with AIS compared to controls. There were no EMG studies
comparing fatigability in patients with AIS to controls.
Dynamometry
Decreased bilateral and unilateral strength measurements were noted for tests of
arm/shoulder muscles in patients with scoliosis compared to healthy controls using tests
suggested to be challenging for the transverse spinal musculature.47 Overall patients with AIS
demonstrated marked deficiencies in isokinetic torso extension and flexion peak torque, total
work at 90o/sec and more significant at 120
o/sec when compared to controls.51 In contrast, no
differences in maximum voluntary isometric contraction torque in extension was observed by
deOliveira et al between patients and controls.50 Patients had lower flexion mean power than

21
CTRL at both 90 and 120O/sec. Patients with AIS also has slower flexion acceleration times and
faster deceleration times in flexion and extension at both 60 and 90O/sec speeds.51 In contrast,
patients with AIS exhibited shorter times to extension at both speed and to flexion peak torque at
90o/sec.51
Manual muscle testing
Mahaudens et al. used manual muscle testing but found no differences in median scores
between groups for erector spinae and both gluteus muscles. However, a strength deficit was
noted in the abdominal muscles of the scoliosis group.48
Three out of four studies of muscle strength found consistent deficiencies in muscular
strength of the abdominal or paraspinal muscles in AIS. However, due to heterogeneous
methodologies (task, outcome, and measurement site) limited evidence exists to support the
conclusion that subjects with AIS demonstrate overall weakness in trunk muscles when
compared to controls.
Objective 2: Differences in functional properties convex:concave in AIS vs controls.
Four papers addressed objective two (Table 7). All four studies employed EMG
methodologies.
EMG Methodologies
Dobosiewicz et al noted symmetrical reflex response in scoliosis and control groups,
however, found prolonged latencies on the side opposite the curve in progressive scoliosis during
unloading of either extremity.44 Feipel et al measured the activity on the heterolateral and
homolateral sides of the spine during various unilateral bending tasks and found larger activity at
the T10, L1 and L3 sites on the heterolateral side of the curve (relative to the bending direction)
during one-way side-bending. This asymmetric activity (heterolateral/ homolateral RMS ratio)
was not as large during the same tasks in the control group.45 In contrast, no differences were
found in corresponding normalized muscle activities between controls and subjects with AIS
during submaximal isometric spinal extension.50 Nevertheless, significantly elevated activity was
noted on the convex side of the spine only at L5 (not T8 or L2) during trunk extension only at
80% of MVIC (not 40 or 60%) in subjects with AIS. Similarly, controls had a significantly
elevated RMS on the left side of the spine only at L5 during extension at 80% MVIC.50

22
Tsai et al did not statistically compare the magnitude of differences between sides
observed in patients with scoliosis to differences observed in controls but tested separately in
each group differences between sides during concentric and eccentric isokinetic extension
contractions at 30 and 90o/sec.52 They found no difference between sides in thoracic medial and
lateral paraspinal muscles activations in both controls and patients with small curves. In contrast,
the AIS group with a Cobb angle between 20-50° demonstrated elevated RMS in medial thoracic
paraspinals on the non-dominant side during concentric (30 and 90O/sec) and eccentric torso
extension contractions (at 90o/sec).52 Controls had higher lumbar paraspinal activity on the
dominant side during all tests. Both controls and patients with small curves had more lumbar
medial paraspinal activity on the dominant side during the eccentric contraction at 90O/sec, and
during concentric contraction at both speeds. Both groups had higher lumbar lateral paraspinal
activity during concentric contraction at 90o/sec. In contrast, patients with larger scoliosis curves
did not have significant differences in lumbar paraspinal activity between sides for any task.52
Limited evidence exists to support the conclusions that subjects with AIS exhibit the
following compared to controls:
Increased heterolateral activity during side-bending tasks,
No differences in the amount of asymmetry in normalized muscles activity during
submaximal isometric contractions
Different patterns of asymmetry during isokinetic contractions of the paraspinals in
patients, which are more important in patients with larger curves.
Prolonged latencies on the side of the spine opposite the curve.
Objective 3: Differences in functional properties within AIS patients between sides and levels
This objective yielded the largest number of included studies with 12 relevant studies (Table 8)
of which, 11 employed EMG methodologies, 2 addressed strength measurements, and one
employed imaging methodologies.
EMG Methodologies
Alexander et al, using needle EMG in paraspinal muscles found muscles at the apex were

23
generally silent bilaterally when subjects lay prone. Higher activity was observed on the convex
side (2/3) or balanced (1/3) during standing.53 Cheung et al reported findings in three studies in
which the same subjects were partially used. They subdivided the curves of patients with AIS
into progressive and non-progressive groups and found a higher asymmetry in activity overall in
subjects with progressive AIS54 and more pronounced convex/concave activity ratios at the upper
and lower end vertebrae depending on whether the patients are tested lying supine, sitting or
standing.34,55 Non-progressive curves had higher ratios at the apex of the curve while ratios at the
upper and lower end vertebrae were not consistently significantly elevated.34,54,55 Only progressive
curves demonstrated increased asymmetry at the LEV (dominant convex).34,54,55 Gram et al tested
the muscles in different positions including standing, sitting erect sitting, and writing. Higher
activity on the convex side was noted in the multifidus but not the iliocostalis in all positions at
L1 & L3. Significantly higher activity on the convex side was noted in the thoracic spine at T6
only during erect sitting.56
Mooney et al reported asymmetries in side-to-side paraspinal muscle activities without
indicating the dominant side. Mooney et al also reported imbalances between paraspinal (lower)
and oblique muscles activities (higher) on the weaker side but did not quantify the differences.57
Dobosiewitz et al demonstrated a prolonged unloading reflex latency in the concave side of the
curve during sudden unloading using a trapdoor platform tilting to either side in the progressive
AIS group.44 Feipel et al found greater RMS on the left side during right bending.45 Similarly, in
Shimode’s work on EMG latency, they found D-PMT ratios significantly different from 0 at the
apex and lower end vertebrae.58
Finally, no difference in duration of activation expressed as a percentage of the gait cycle
for the erector spinae, quadratum lumborum or gluteus medius between the concave and convex
side of the curve was noted in gait analysis.48 Similarly, no difference in activation durations
during gait were found within each of 3 curve severity categories.49
There is conflicting evidence to support the following observations:
Higher activity on the convexity of the curve during postural task
More pronounced activity on the convex side at the UEV, LEV and Apex of the curve.

24
More pronounced activity on the convex side at the LEV only in progressive curves with
only activity at the apex elevated in non-progressive curves.
Limited evidence exists to support the following findings in the research:
Prolonged latency to unloading reflex and
The absence of prolonged activation duration between sides during walking.
Strength Measurements
Two studies measured the asymmetry in rotation strength measurements. 57,59 Mooney et
al. reported strength differences ranging between 12 and 47% with a majority of subjects with
AIS exhibiting weaker paraspinals on the concave side. In contrast, McIntire et al did not find
differences between corresponding rotation strength measurements either towards the midline or
outwards from different pre-rotated positions.59
There is a conflicting level of evidence regarding differences in strength measurements
between the convex and concave side of the spine with some evidence pointing to no differences
between sides in rotational strength and other evidence suggesting weaker paraspinal muscles on
the concave side.
Imaging
MRI measurements indicated no significant differences in overall muscle volume
obtained at rest between the concave and convex side of the curve.60
The percentages of the
sample with mean volume difference index values indicating larger volume on both the concave
and convex side. These were similar over each third of the curve on the concave side (14.3-
15.3%) and more important at the apex (12.1) than above or below (9-9.9%) the apex on the
convex side.
Therefore, there is limited evidence about whether paraspinal muscles volumes at rest differ
between the convex and the concave side of the curve. This depends on the measurement
definition used, with evidence pointing to either no difference between side (overall volume) or

25
to larger proportion of patients with a larger volume on the concave side especially at the upper
and lower third of the curve.60
Objective 4: Differences in Muscle properties in patients with AIS between different curve
types
Three studies were included in this category (Table 9) two of which employed strength
measurement, and one used MRI imaging.
Strength measurements
Peak Torque
No difference in peak torque was found between different postural (kyphotic, lordotic or
equivalent) or curve types (Thoracic, Thoracolumbar).61
Time to Peak Torque
Time to peak torque differed between curve severity subgroups. Those with larger curves
demonstrated longer time to peak torque in extension in sitting at 90°/sec. The discriminant
function demonstrated longer time to peak torque in flexion in sitting at 60°/sec as well as
extension to 120°/sec in semi-sitting in those with a lordotic posture followed by kyphotic
posture, and then equivalent.61
Acceleration time
No difference was found in acceleration time between posture, or curve types, in all positions
and velocities.61
Deceleration time
Those with thoracolumbar curves demonstrated a shorter deceleration time than those with
thoracic curves in sitting at 120°/s while those with thoracic curves demonstrated a shorter
deceleration time than thoracolumbar curves in sitting flexion at 60°/s. All other variables and
outcomes were not significant when analyzed through the discriminant function.61
Mooney et al determined weakness on the convex side of the spine in 2/12 subjects. Both
had double curves.57
Due to the low number of studies in this objective using strength as an outcome, and the
relative heterogeneity of findings and outcomes evidence to support the findings of strength
differences based on curve type is limited.

26
Imaging findings
Zoabli et al found the largest muscle volume difference in double curves.60
Limited evidence exists to support the finding that double curves exhibit the greatest
muscle volume difference. Only one study with a small samples size supports this finding.
Objective 5: Association between muscle properties of patients with AIS and different curve
characteristics (location, severity)
Seven studies were included in this category with five studies employing EMG
methodology and two employing strength measurement.
EMG Methodology
Cheung et al identified a correlation between axial rotation at the upper end vertebrae and a
convex:concave activity ratio at the lower end vertebrae. Higher activity at the LEV is correlated
with lower axial rotation at the UEV.34 Discriminative analysis did not demonstrate any
association between curve severity and EMG results in lateral step tests to either side.46 However,
Odermatt et al did find a linear correlation between the lumbar Cobb angle and lumbar EMG
asymmetry during resisted flexion.62 Finally, Tsai et al did not find any correlation between RMS
on each side of the curve and curve severity.52 Shimode et al did not find a correlation between
D-PMT latency values and curve severity.58
The research is:
Limited that axial rotation at the UEV is correlated with high convex/concave ratio at the
LEV.
Limited that there is no correlation between latency and curve severity.
Conflicting (2 out of 3 studies) in suggesting that there is no correlation between RMS
findings and curve severity.
Strength Methodology
Anwajler et al found peak torque during extension at 60°/sec was higher in those with more
severe curves (31-60°) than those with smaller curves (0-30°). Those with lordotic postures
demonstrated a higher normalized peak torque at flexion at 120°/s.61
Longer time to peak torque

27
was observed in those with thoracic curves compared to thoracolumbar curves in both flexion
and extension at 60° in sitting.61
In contrast, Mooney et al did not find any correlations between
strength differences between sides and curve severity.57
Conflicting evidence exists between two studies regarding the association between
strength differences and curve severity with differences observed in the isokinetic testing in the
sagittal plane but not during testing in the axial plane.
Objective 6: To determine the ability of muscle properties to predict curve progression.
Four studies were included in this category all employing EMG methodologies.
EMG Methodology:
In two studies of a partially similar sample, Cheung et al demonstrated that larger
convex/concave EMG activity ratios at the LEV predicted Cobb angle progression.34 These
correlations were even more pronounced in sitting posture.34 Dobosiewicz et al found that
changes in latency can predict progression, however these latency differences were not
correlated with age.44 These results are further supported by the work of Shimode et al who also
found a correlation between latency values (D-PMT) and progression at the LEV.58
Limited evidence exists to support findings that
Larger convex:concave activity ratios can predict curve progression
These correlations are more pronounced in sitting postures
Prolonged latency can predict progression
EMG Reporting quality
Eleven out of thirteen studies reported 50% of ISEK criteria, 6/16 reported 60%, and 1/16
studies reported 80% of criteria. The results and reporting criteria can be found in tables 3, 13,
and 14.
Discussion
To our knowledge this is the first systematic review surveying the literature on functional
muscle properties of torso muscles in patients with AIS. Our results highlight the need for well-

28
designed research in this area of study as the reviewed studies met at best 50% of the quality
criteria in our appraisal. The small sample sizes, unclear methodology and heterogeneity in
measurement methods and tasks used throughout the 21 papers surveyed indicate that there is a
quality issue within this literature on AIS. After summarizing the most common topic addressed
in the literature and justifying why a meta-analysis was not possible, key findings of this review
are listed by objectives.
There are important gaps in the literature as only a few studies were found studying
endurance (isokinetic approaches51
) and none quantified fatigue by EMG methods. Imaging
studies were rare60
and no studies were found specifically on muscle length/flexibility (reports on
global range of motion were not included as a key finding as such studies were not specific to the
muscles of interest). In addition, even though many studies recorded EMG activity from multiple
trunk muscles, a very limited number of studies analyzed the magnitude and timing of co-
activations of postural trunk muscles beyond the reporting of EMG ratios between the convex-
concave sides of the spine.49,57
The latter may be relevant to provide a rationale for exercise
programs focused on improving the motor control of postural muscles with a scoliosis-specific
program.
Measurement tools:
Overall, 13 studies out of the 21 included in this review used EMG methodology, seven
studies examined strength, and one study used imaging. Thus the overwhelming majority of
studies examining paraspinal (rotatores, spinalis, longissimus, illiocostalis) functional muscular
properties employ EMG as a method of documenting outcomes.
Metanalysis not possible:
While EMG is the most prevalent measurement tool, the EMG outcome variables
reported are quite diverse. We were unable to find two studies homogenous enough in terms of
methodology employed, variable analyzed, or task studied to attempt meta-analysis. Many
studies analyzed EMG ‘activity,’ however, post-processing of the raw signal varied. Some
papers only looked at raw signal,53,56,57
while some papers calculated the Root Mean Squared
over various task durations50,52
(a method of smoothing where the amplitudes are squared,
averaged and then the square root is calculated). Others measured imbalance across the spine by

29
calculating ratios of the RMS obtained on each side of the curvature.34,45,52,55,62,63
Studies
exploring latency and duration of muscle activation during walking added further heterogeneity
in the outcomes.44,48,49,58
The variation in EMG analysis was matched by a large heterogeneity in task. Four EMG
studies examined subjects lying in prone or supine.34,53-55
One study assessed subjects as they
engaged in basic sitting or writing tasks. 56
Six studies had subjects engaging in resisted strength testing tasks, but again, high
variation was observed in both the challenging tasks tested and the parameters analyzed. Some
used dynamic movements (rotation, flexion, extension, neck extension, overhead push and pull,
walking)47,51,61
some isometric (rotation, flexion, extension) 50,57,59
, unilateral (rotation)57
, and
bilateral tasks (flexion, extension, overhead push and pull)47,50,51,59,61
. Parameters tested included
overall strength (lbs lifted)47
, total work & power output51
, acceleration & deceleration time51,61
,
peak torque & normalized peak torque (normalized to body weight) 51,59,64
,and time to peak
torque.51,61
The large variation seen in tasks was also met by a large variation in task duration,
load, and repetitions. These parameters were often not specified.
Two studies employed walking tasks.48,65
Latency tasks involved perturbations in
standing through a trapdoor with a release mechanism as well as neck extension at the sound of a
cue.44,58
Due to the variety and inconsistency found in the results, it is difficult to isolate which
tasks and outcomes were most effective at detecting differences within subjects with AIS and
between subjects and controls. However, consistent results were noted for dynamic strength
measurement demonstrating weakness in patients with scoliosis.47,51,57,61
In addition to overall
weakness, one study found greater weakness on the convex side.57
Isometric strength
measurement was rather inconsistent within the literature as 2/3 studies did not demonstrate
significant results.50,57,59
EMG results were also quite varied making it difficult to recommend specific protocols
for future research, however, the tasks demonstrating the most consistent results were measuring
duration of activation in walking48,49
as well as postural static tasks such as standing, sitting,
lying, and writing.34,54-56
latency findings were noted when using postural pertubations44
as well
as response to an external stimulus.58

30
Since only one study employing imaging was used60
, no recommendations for imaging
type, or positioning can be made.
Summary of findings
Objective 1: Differences in functional muscle properties between patients with AIS and
controls
Due to the heterogeneity of study methodology, evidence is limited regarding
findings of prolonged EMG activation during gait; increased heterolateral to homolateral activity
ratios during side bending tasks; unique EMG response during lateral step tests; and the absence
of a difference during extension contractions at different intensity of contractions in patients with
AIS compared to controls. Subgroups with sample sizes as low as 10 were common within the
papers included45 and Cobb angles included ranged from as low as 11°48 all the way up to 56°.45
There were no EMG studies comparing fatigability in patients with AIS to Controls. Differences
between AIS and control were noted in both EMG and strength outcomes. Only one study
examined muscular co-activation.48 AIS subjects demonstrated higher convex/concave EMG
muscle activity asymmetry ratios during side-bending tasks45 and longer activation durations
during gait than controls.48 The increase in activity of convex sided muscles during lateral
bending to the concave side may be the result of reflex stabilization, suggesting that the activity
may be attributed to the deformity.45 DeOlivieria et al did not find any significant differences in
normalized muscle activity between groups at any percent of MVIC tested.50 Filipovic et al found
differences between scoliosis and controls with the use of a discriminant function46, however, the
results are difficult to interpret as the outcome variable is not defined.
Latency findings suggested that those with scoliosis demonstrate a longer time to respond
to an unloading reflex than controls.44
Patients with scoliosis demonstrated prolonged muscle
activation during walking than controls.49
Mahaudens et al suggested that the prolonged duration
could be a reaction and compensation of muscles to the movement of a deformed spine and
misaligned pelvis, and/or there may be an unknown motor control issue associated with AIS.49
Strength outcomes produced conflicting results, in that some studies found significant
differences between AIS and controls while others found no differences. Two studies found that
the erector spinae in subjects with AIS demonstrate overall weakness when compared to those of

31
controls in both unilateral and bilateral movements66
but a faster time to peak torque.47,51
Faster
time to peak torque is generally associated with muscular efficiency, higher in the scoliosis
group, however, despite this; the girls still exhibited strength deficits. It is not possible to
conclude whether the weakness observed is a causal factor or symptom of the curve. By affecting
the length-tension relationship of paraspinal muscles the spinal deformity may limit the strength
output of the muscles.67,68
Elongated musculature is found on the convexity side and shortened
muscles on the concavity, abdominal muscles tend to be tight.68
While some studies did compare the AIS groups to controls they were not discussed in objectives
1 & 2 if the control sample did not meet our inclusion criteria (<10 subjects, or out of the age
range 10-18).
Objective 2: Differences in convex-concave side measurements between AIS and controls
Reported activity differences between groups were varied between papers however,
limited evidence exist that subjects with AIS exhibit the following compared to controls:
increased heterolateral activity during sidebending tasks45, no differences in the amount of
asymmetry in normalized activity during submaximal isometric contractions50, different patterns
of asymmetry during isokinetic contractions, which are more important in patients with larger
curves52. The conflicting evidence that was found may be attributed to small sample size as well
as methodological reasons. Feipel et al used surface electrodes for dynamic tasks, which can
often interfere with the signal as electrodes may create signal artifact when they move relative to
the skin.39 The increased activity ratio was especially pronounced around the curve apex45 and
even more so in the lumbar spine.50 A number of explanations have been given for this,
including, greater need for muscle activation in the scoliosis groups as their muscles struggle to
maintain alignment.69 In addition Riddle et al suggest that differences seen are a result of stronger
musculature on the convexity of the curve in the AIS group.67 Despite these trends, the large
heterogeneity in measurement sites, results, and sample limits the ability to draw more
generalized conclusions. Better quality research is required to confirm these findings.
Investigations into latency did not yield any significant differences between unloading
tests to the left or the right sides when comparing AIS to controls. In patients with scoliosis the
latency of the reflex response was prolonged on the side opposite to the curve.44
Cobb angles

32
tended to be more homogenous than in Objective 1, however sample size was still low (3 out of
4 studies test subgroups with less than 15 subjects)45,50,52
Objective 3: Differences in functional properties within AIS patients between sides and levels.
The presence of higher activity on the side of the convexity of the curve was further
observed in papers addressing this objective.34,53-56
All sites on the curve (UEV, APEX, & LEV)
demonstrated significantly higher EMG ratios on the convexity compared to the concavity in
progressive AIS curves whereas this ratio was only elevated at the APEX in non-progressive AIS
curves.34,55
A number of explanations are proposed in the literature. Cheung et al suggest that the
high levels of activation seen on the convexity are the result of musculature trying to maintain
alignment against gravity. This imbalance would be further elevated at the most severely
deviated part of the curve (the apex). Due to the need to constantly maintain alignment, muscles
would contract more strongly resulting in an elevated EMG signal.54
Feipel et al agree with
Cheung et al’s rationale for elevated signals representing the heightened need for postural
alignment when discussing the rationale for their findings of high RMS ratios on the heterolateral
side during right-side (convex) bending.45
However, Zoabli et al propose two other suggestions
based on their MRI findings. They suggest that EMG activity on the convexity of the curve could
be a result of 1) greater neural feedback in muscles that are stretched (as suggested by the MRI
findings) or 2) closer proximity of the stretched convex muscles to the surface leading to a
smaller skinfold thickness, resulting in greater sEMG signal.60
Zoabli et al suggest further
research combining MRI imaging and EMG to determine whether the elevated EMG signal is
due to a more superficial position of the muscles and therefore an artificial finding, or one
resulting from increased neural feedback due to stretched muscles60
. The absence of differences
using normalized EMG to MVIC provides indirect evidence in support of Zoabli’s hypothesis.50
Reflex responses tended to be symmetrical on both sides of the spine in side bending,
however the time from stimulus to unloading reflex was prolonged on the side opposite the curve
in progressive scoliosis.44
Similarly, latency differences across the spine were significantly
different from 0 at the apex and lower end vertebrae reflecting longer latencies on the concave
side in response to neck extension.58
Dobociewicz et al explain that there may be a deficiency in
the functioning of muscle spindles, but do not elaborate on how the deficiency expresses itself.
In contrast, during gait no differences in duration of activation were noted by Mahaudens et al

33
between sides in the scoliosis group.48,65
They propose that the prolonged duration of activation
observed is a co-contraction of concave and convex muscles in an attempt to stabilize the spine
and pelvis.
Conflicting study findings were observed regarding rotation strength asymmetries
relative to the curve direction with some evidence pointing to no differences between sides59
and
other evidence suggesting weaker paraspinal muscles on the concave side.57
Nevertheless,
studies under objective 1 suggested an overall weakness in the erector spinae muscles of the
scoliosis group and thus it would be important for further research to address how weakness
manifests itself along the curve at transition sites and between the convex and concave sides.
This would help pinpoint the movements to include in an exercise program to improve strength
of the paraspinal muscles. Both Mooney et al and Mcintire et al were able to reduce weakness
with their rotation-based strengthening programs.57,59
The conflicting findings may be due to a
small sample size(<20), insufficient power and a lack of homogeneity in curve type (ranging
from 10-60° in some cases) and direction among the patients tested.
The only imaging study demonstrated more patients with increased muscle volume on the
concavity of the curve.60
This imbalance would be expected due to compression on the concave
side and stretching on the convex as a result of the geometry of the spinal deformity. 60
.
However, the concave:convex differences were not tested for significance making it difficult to
draw conclusions from this paper.
This is the objective with the largest number of included papers; however, it is difficult to
draw conclusions about whether these characteristics are unique to patients with scoliosis as no
comparisons to controls were performed. More comparisons between scoliosis subgroups would
also be informative as very few papers grouped subjects by progressiveness, curve severity, or
location.
Objective 4: Differences in muscle properties in patients with AIS between different curve
types
While different curve types are likely to exhibit different imbalances in functional muscle
properties there is a gap in the literature addressing this question with only 3 studies reporting
related evidence.57,60,61 In addition, sample sizes of subgroups were as low as 10 in one study.61
Examples of curve types possibly impacting the length, activity and strength of the surrounding
musculature could include curve direction, location, and number of curves. While not present in

34
their final analysis, many studies acknowledge the relevance of curve type to muscle properties
by limiting their recruitment to specific curve types. Six studies specifically recruited individual
curve types ranging from left thoracolumbar or lumbar curves49, single right curves58, as well as
one study which listed left thoracic curves as an exclusion criteria.59 If feasible, studies should
aim to recruit single curve types or have sufficient sample size to allow for comparisons of
sufficiently large subgroups of curve types.
Limited evidence exists to support findings regarding muscle properties in
different curve types. Very few studies exist and outcomes and methodology are heterogenous.
Of the three studies addressing objective 4, no study used EMG methodologies, one study
analyzed peak torque,61 one studied isometric rotational strength,57 and one used imaging finding
the largest muscle volume differences between sides in double curves.60 Of the two studies
employing strength as an outcome the different curve types analyzed were heterogeneous.
Mooney et al reported on curve number, reporting weakness in double curves on the convexity.57
Anwajler et al focused on curve location and reported thoracic curves as demonstrating the
lowest peak torque and longest time to peak torque.61 However, further evidence is needed to
understand how paraspinal muscles differ in functional properties based on location and number
of curves. Anwajler et al suggest that differences in the biomechanical nature of the spine in
various curve types will cause a difference in muscle properties. For example shorter time to
reach peak torque in extension and a corresponding longer time to reach peak torque in flexion in
primary thoracic curves may be explained by increases in the tone of the spinal extensors due to
a larger lordosis, often associated with primary thoracic curves. This increased tone in the
extensors would be met with decreased activation of the flexors.61 This example highlights the
differences that exist in muscle properties between curve types, and the importance of
understanding the muscle properties of each curve.
Curve type is an important factor to consider when studying muscle properties, as
muscles will behave differently based on the curve. The musculature on the convex and concave
side differs in both activity and fibre type. Thus, the direction of the curve must be taken into
account when analyzing the musculature. The number of curves adds complexity because with
multiple convexities identifying the convex vs concave side at transitional vertebrae is an issue.
In a double curve the muscles on the convexity of the thoracic curve at the lower end vertebrae

35
would also be classified as being on the concavity of the upper endpoint of the lower curve. The
current literature does not provide sufficient evidence to understand how muscles are affected by
their positions within multiple curves. It is also too early to understand how imbalance in muscle
properties within different curve types could inform exercise interventions for all patients with
AIS. One important characteristic of scoliosis-specific exercise prescription is the fact that
specific auto correction exercises are prescribed depending on curve types. Providing evidence
that muscle characteristics differ at baseline, and possibly respond differently to exercises,
between curves types therefore appears important.
Objective 5: Correlation between muscle properties of patients with AIS and different curve
characteristics
Limited EMG findings suggest a negative correlation between axial rotation at the UEV
and muscle activity at the LEV.34 In addition, Odermatt et al found a linear correlation between
EMG imbalance in the lumbar spine and Cobb angle severity, implying greater asymmetry in
more severe lumbar curves.62 However, two other studies did not find any correlations therefore
the level of evidence on this question is conflicting. Tsai et al did not find any such correlation
when analyzing paraspinal EMG on each side of the spine during concentric an eccentric
extension contractions.52 Filipovic et al did not find any correlation between EMG activity during
a step test and curve severity, although their specific EMG outcome is unclear. Similarly,
strength did not correlate with curve severity57 and no correlation between latency ratios and
curve severity were noted by Shimode et al.58 No explanation for this lack of correlation between
curve severity and latency ratios was given in the literature. The evidence related to correlations
between strength or latencies and curves severity is thus limited. This lack of correlation may be
due to samples with a very broad range of severities (10-60°)54, small sample sizes (as low as 10
in some subgroups)61, and high variability due to not controlling for curve type.
Objective 6: To determine the ability of muscle properties to predict curve progression.
Due to the low quality of studies but consistent findings among the studies on this topic,
there is limited evidence of a correlation between EMG activity asymmetry and progression.
Cheung et al found correlations between increased convex/concave EMG ratio at the lower end
vertebrae and progression.34 They also found higher EMG ratios in the progressive group at all
sites (UEV, Apex, LEV) compared to the non-progressive group which only demonstrated

36
elevated EMG activity at the apical vertebrae.54,55 Cheung et al also created a nomogram
suggesting that a spine growth velocity of more than 15mm/year and an EMG activity ratio of
greater than 2 has an 89% chance of progression.54 The correlation between progression, spine
growth velocity, and EMG activity was not explained in the literature.
Further, there is conflicting evidence of correlations between increased latency and
progression. Dobosciewicz et al reported that latency changes correlate with disease progression
without providing correlation estimates.44 They suggest that this is due to defects within the
muscle spindles, however, do not elaborate on the mechanism behind these defects. In contrast,
Shimode et al found a correlation between the differences in latency across the spine and
progression at the lower end vertebrae (0.432).58 However, as in previous objectives, this
objective included studies with small sample sizes (n=11 in one subgroup)34 and a wide variety
of curve severities.34
These differences may imply that inherent markers of progression may be present in at-
risk curves. However, most studies do not propose a mechanism or explanation for these
differences. Cheung et al discuss the importance of recognizing that elevated EMG at the lower
end vertebrae is in no way a prognostic factor, but may present a potential risk factor for more
intense supervision.55 In addition to a risk factor to inform observation, differences in muscle
function associated with curve progression may be used to identify exercise priorities for curves
exhibiting greater risk of progression if those specific risk factors (higher activity at the LEV,
longer latency) can be modified with specific movements. There is a gap in the literature
regarding whether many of the muscle impairments considered under previous objectives exhibit
an association with curve progression.
Study quality
Overall, the quality of the included studies was poor. A number of quality issues plagued
the research. Small sample sizes were insufficient to power studies to detect possibly clinically
important differences (14/24 studies had less than 20 subjects). Studies were prone to type 2
errors, and may have limited external generalizability. Study methodology was often unclear,
making it difficult to reproduce protocols and adequately judge quality. In the future, to ensure
that studies on muscle properties can inform treatment, methodologies must be clearly outlined

37
and sample sizes of sufficient sizes must be recruited to detect differences. For this review we
used applicable criteria of the COSMIN checklist to evaluate what percentage of quality criteria
were met by each study.40
Out of the 25 criteria for quality papers included in the study 14
criteria were met by ≤5/20 papers (Table 2.12). The most common criteria missed related to
blinding of examiners to patient data, to comparator tests results, and to previous muscle
measurements. No studies reported information to meet these criteria. It is possible that
examiners were blinded, but this must be reported in order to give the reader confidence in the
methodology. The criteria fulfilled by the most number of papers related to appropriate study
design and reporting of demographic information in which criteria were met on 92% and 67% of
occasions respectively. The COSMIN checklist was compiled in 2005 meaning that 14 of our
included studies preceded its publication. While it does not change the ability to rely on poorly
reported methodologies, it is important to note that no methodological guidelines had been
published to allow for better quality reporting in these studies. Future researchers could use the
relevant sections of the COSMIN criteria based on their study objectives as a guide when
designing and reporting research. EMG studies should use the ISEK criteria to assist with the
design and with preparing complete and adequate reporting of results of EMG studies.41
However, it is possible that some high quality studies may rank poorly due to poor reporting of
methodologies as the criteria are based on whether key elements are adequately reported.
Implications for treatment prescription
While some significant impairments were noted in paraspinal muscle characteristics
between patients and controls and between different curve types or muscles sites, since the
etiology of scoliosis is unclear, it is not sufficiently clear whether the differences arise as an
adaptation to the curve or whether they play a causal role in the development and progression of
scoliosis. These noted impairments include higher EMG activity at the apex of the curve on the
convexity, higher EMG activity asymmetry in progressive curves, prolonged latency in patients
with AIS, and overall weakness in the extensors of patient with AIS. These observations provide
a list of potential treatment goals. However, before making any specific treatment
recommendations, research should clarify whether differences arise as an adaptation to the
curvature or whether they play a causal role in the development and progression of scoliosis.
Very few studies have demonstrated that purposefully targeting a specific muscle imbalance can
38
change the natural progression of scoliosis57,59
and very few longitudinal studies have
demonstrated that some muscle impairment variables are predictive of progression.
The effects of strengthening, modifying activation balance, modifying timing of
activation or the length of the muscles surrounding the curve could alternatively potentially
exacerbate the problem. For example, the increased activation ratio on the convex side may be a
biomechanical adaptation to prevent further bending of the spine to occur under the influence of
gravity. Further activation of muscles on the concave side may in fact lead to increased curvature
if the origin and insertion of muscles on the concave side get pulled closer during contraction.
Future exercise studies should monitor how torso muscles are influenced by exercise programs
as well as the effect of exercises on curvatures. Such measurements would allow for the
determination of a relationship between the effects of targeted exercises on musculature as well
as the effects on curvatures. This data could lead to refining exercise prescription to maximize
treatment effects. Improving the curve through addressing muscle imbalance has been attempted
in the past. A number of studies found promising results through the use of muscle
stimulation.70,71
However, much like current exercise approaches to scoliosis management, these
stimulation programs were developed without a good knowledge of underlying muscle
properties. In a meta-analysis by Rowe et al, bracing was identified as having a better success
rate than observation and muscle stimulation. There was no statistical difference for treatment
success between muscle stimulation and observation.24
This highlights the need for a strong base
of knowledge when discussing interventions for scoliosis management that target muscular
imbalances.
That being said, despite the poor quality, and gap in the literature, certain consistent
observations do exist within the research. Imbalances between curve sides and between groups
were fairly consistent and may be adequate targets to be investigated for therapy programs
aiming to limit curve progression.
Other exercise related outcomes
Only one paper found during our full text review measured fatigability. This
paper did not meet our inclusion criteria as it only involved 6 subjects (n<10).72
Skrzek et al
analyzed endurance parameters, but did not find any differences in peak torque between 10
repetitions at 120° and 20 repetitions at 120° for all four tasks. However, this difference was not

39
tested statistically and he did not compare the subjects with scoliosis to controls or between
sides. Therefore his findings did not fit into our objectives.51
Another important study goal would
be measuring a correlation between endurance and progression. If the paraspinal musculature is
lacking in endurance and is therefore unable to support the spine effectively throughout daily
activities, this may be a factor to consider when determining methods to prevent further
progression. Thus fatigability needs to be studied as a potential therapy goal.
In addition, in studies that measured EMG and/or strength methodology, physical activity
levels and types were not taken into account in either group, possibly explaining the differences
observed. The identification of an existing weakness in the paraspinal muscles of patients with
AIS suggests the existence of an important clinical goal. However, further research needs to
identify the most effective exercise prescription (duration, sets, and repetitions) to address
weaknesses. In addition further research can help determine whether correcting differences
observed in muscle characteristics relative to controls can lead to improvement in curve
characteristics or prevent curve progression.
Future research recommendations
This review has identified gaps in the research needing to be addressed in order to gain a full
understanding of paraspinal muscle characteristics in scoliosis. Exercise approaches consider
curve types during exercise prescription, however, the exact characteristics of paraspinal
musculature and the effect of curve type needs to be understood to guide concrete
recommendations related to curve types. Thus research must focus either on a homogeneous
curve type, or recruit sample sizes big enough to allow for subgroups comparisons.
Endurance is a strong predictor of spinal stability within the field of low back pain33
and
therefore the endurance properties of paraspinal musculature must be understood in order to
understand whether there are deficits that must be addressed, and if so, whether these deficits
manifest themselves differently on the concavity, convexity, or vertebral levels in various curve
types.
Muscle characteristics with implications for motor control such as muscle co-activation
and latency need to be studied as well in order to guide exercise prescription targeting muscular
recruitment and coordination. If therapists have knowledge of muscle recruitment patterns in
patients with scoliosis that are associated with progression, they can focus on correct muscle
recruitment as a treatment goal.

40
Imaging techniques are often used in studying muscle properties and back pain.42,73,74
Outcomes like muscle thickness and volume are useful in understanding the characteristics of
paraspinal musculature. Our review only identified one paper using imaging as an outcome. This
is an area in need of further study.
The tasks used in the majority of studies were shorter duration tasks. The role of
paraspinal musculature is to constantly maintain alignment in all positions during long periods.
Research should be done to investigate how the paraspinal musculature responds to long-term
tasks, mimicking the real-world role of these muscles. The cumulative findings of this review
provide the therapist with an understanding of the current state of literature regarding the
physiology of paraspinal muscles and orients the researcher for further research.
Strengths & Limitations
Strengths
This systematic review maintained a high standard for quality appraisal and relied on the
agreement of 2 reviewers. The agreement between the reviewers was high (0.77). This review
effectively highlights gaps in the research and demonstrates a deficiency in the pool of research
relating to paraspinal muscle properties in AIS. This review suggests that current exercise-based
interventions cannot yet be based on quality scientific inquiry and stresses that a larger pool of
research is necessary before the rationale for using exercises is based on objective documentation
of muscle impairments.
Limitations
This systematic review only focused on adolescent idiopathic scoliosis and excluded any
paper in which 25% of the sample was over the age of 18 or under the age of 10. This limited the
scope of the paper, however, it was justified in light of the fact that the rapid growth phase seen
in adolescent is critical to curve progression55
and thus this age range is a population at risk. It
may be worth looking at a population no longer at risk of progression in order to understand
muscle characteristics when the curve has stabilized. Only English and French papers were
included, limiting the scope of the review. As exercise interventions are more commonly used in
Europe, it would have been beneficial to include other languages. However, given the added
cost, limited resources, and often-poor translation quality it was not feasible to expand our search
strategy. With a large heterogeneity in methodology and outcomes, meta-analysis was not
possible.
41
Conclusion
The quality of research into functional characteristics of paraspinal musculature is poor as
none of the studies met 50% of our quality criteria. Despite quality issues and relative
heterogeneity in findings and methodology some key findings were observed. Overall, higher
RMS ratio asymmetries were observed in patients with AIS than controls34,45,54,55
, and higher
activity was noted on the convex side of the curve, specifically in patients with progressive
curves.34,54,55
Prolonged latencies were observed in AIS groups especially on the concave side
and prolonged durations of activation were noted during gait.44,48,49,58
Correlations between
muscle impairments and progression or curve severity were noted as well.54,55
Those with
scoliosis tended to demonstrate weakness in the paraspinal muscles when compared to
controls51,66
, however no correlation was found between strength and curve severity.46
More quality research needs to be done in order to draw definitive conclusions about the findings
reported above for which, at best, limited evidence exists. More broadly, research is required
regarding which muscle impairments characterize scoliosis and are associated with curve
progression. Such research is needed to provide a rationale to inform scoliosis-specific exercise
prescription. Specific research gaps were identified with a need to explore functional
characteristics based on curve types and examine additional muscle properties for their
relationship to progression. Research into the fatigability/endurance of postural muscles that
maintain posture over long durations in daily life is necessary. Finally, the coordination of
postural trunk muscles needs be studied to provide an understanding of the patterns of muscle
recruitment needed to maintain posture as well as those deficits affecting the ability of patients
with scoliosis to maintain spinal alignment.

42
Table 2.1 Criteria used to appraise research quality Criteria Score
Methodological quality 1 Was a representative sample of participants used? +/-/?/ ≠ 2 Was a representative sample of examiners used? +/-/?/ ≠ 3 Is replication of the assessment procedure possible? +/-/?/ ≠ 4 Were participants’ characteristics stable during research? +/-/?/ ≠ 5 Were examiners blinded to clinical information from participants? +/-/?/ ≠ 6 Can non-random loss to follow up be ruled out? +/-/?/ ≠ Study design 7 Was the study design adequate? (eg prospective, RCT, case control etc) +/-/?/ ≠ Population selection 8 Was the sample size justified? +/-/?/ ≠ 9 Were the inclusion and exclusion criteria of participants stated clearly? +/-/?/ ≠ 10 Was a consecutive of random sample of patients enrolled? +/-/?/ ≠ 11 Were the demographic characteristics of the sample reported? +/-/?/ ≠ Hypotheses 12 Were hypotheses regarding the associations between subjective and physical
exams formulated a priori? +/-/?/ ≠
13 Was the expected direction of the association or mean differences included in the hypothesis?
+/-/?/ ≠
14 Was the expected absolute or relative magnitude of associations included in the hypotheses?
+/-/?/ ≠
15 For convergent validity: was an adequate description provided of the comparator instrument(s) (including measurement properties)?
+/-/?/ ≠
16 For convergent validity: Were the measurement properties of the comparator instrument(s) adequately described (including measurement properties)?
+/-/?/ ≠
Raters & testing procedures 17 Were the trainings and qualifications of the rater(s) reported? +/-/?/ ≠ 18 Was/were the rater(s) blinded to the results of the comparator test when
assessing the muscle function test measurements? +/-/?/ ≠
19 Was/were the rater(s) blinded to the results of previous measurements performed by the same or different rater(s)?
+/-/?/ ≠
20 Was the time interval between physical examinations and comparison measurement appropriate?
+/-/?/ ≠
21 Were standardized and valid test procedures adopted for both the subjective and physical examinations?
+/-/?/ ≠
22 If anything occurred in the interim period between repeated measurements (e.g. intervention, other relevant events), was it adequately described?
+/-/?/ ≠
Missing data 23 Was the percentage of missing data given? +/-/?/ ≠ 24 Was there a description of how missing items were handled? +/-/?/ ≠ 25 Were the reasons for missing data given? +/-/?/ ≠ Confounding factors 26 Were the confounders defined clearly (e.g. comorbidity, work compensation,
litigation, ceiling or floor effect…)? +/-/?/ ≠
27 Were the confounders measured by reliable and valid tools? +/-/?/ ≠ Statistical analyses 28 Were design and statistical methods adequate for the hypotheses to be tested? +/-/?/ ≠ 29 Were correlations calculated? +/-/?/ ≠
+ Yes, - No, ? Unclear, ≠ Not Applicable. Quality was assessed based on the sum of the yes (+)
scores out of the total relevant scores.

43
Table 2.2 Summary & scoring of EMG quality criteria
Criteria Score
1 EMG methods stated? +/-
Electrodes 2 Electrode type? +/- 3 Electrode size? +/- 4 Skin preparation? +/- 5 Inter electrode distance? +/- 6 Electrode location? +/- Settings 7 Low pass filter? +/- 8 High pass filter? +/- Processing 9 Type of processing used? +/- 10 Sampling frequency? +/- (+) Yes, (-) No

44
Table 2.3 Criteria for drawing conclusions regarding levels of evidence
Levels of evidence (Adopted from Cornelius et al.)43
Strong Consistent results (≥80%) from at least 2 high-quality studies
Moderate 1 high quality study and consistent findings (≥75%) in 1 or more low-
quality studies
Limited Findings in 1 high-quality cohort or consistent results among low-quality
studies
No No study
Conflicting Inconsistent results irrespective of study quality

45
Table 2.4 EMG methodology in the included studies
Study
Electrode type
Electrode size
Skin preparation
Inter-electrode distance
Electrode location
Low pass filter
High pass filter
Processing Sampling frequency
Alexander et al. (1978)53
Teflon coated monopolar
Missing Missing Missing Concave & convex sides of the spine
Not specified Not
specified Not specified
Missing
Cheung et al. (2006)55
Bipolar 10mm Missing Missing 30mm from spinous process of primary curve at UEV, apex, and LEV
1000Hz 16Hz Rectification 800Hz
Cheung et al. (2004)54
Bipolar 10mm Missing Missing 30mm from spinous process of primary curve at UEV, apex, and LEV
1000Hz 16Hz Rectification 800Hz
Cheung et al. (2005)34
Missing 10mm Missing 25mm Superficial erector spinae (longissimus)
30mm from spinous process parallel to UEV, apex, LEV (six pairs of electrodes)
1000Hz 16Hz Rectification 800Hz
Dobosiewicz et. al (1997)44
Bipolar Missing Missing Missing 15-20mm from spinous process at T8, L1, & L3
Not specified Not
specified Not specified
Missing
Feipel et al Ag/AgCl 10mm Mild 10mm T6, T8, T10, L1, L3, L5. 3 and 1000Hz 1Hz RMS 2000Hz

46
(2002)45 abrasion 6cm from the spinous process
Rectus abdominus: 3cm from umbilicus obliquii: 2cm above iliac crest.
Filipovic et al (2006)46
Missing Missing Missing Missing Gluteus
maximus (left & Right) Erector spinae (left & right)
Missing Missing Missing Missing
Gram et al. (1999)56
Missing Missing Missing Missing 2cm on either side of T6 & L1
6cm either side of L1
2cm both sides of L3
Not specified Not
specified Not specified
Not specified
Mahaudens et al (2005)48
Missing Missing Missing Missing Gluteus maximus, Gluteus medius, Quadratus lumborum, erector spinae (no levels listed)
25Hz
300Hz Rectification 1000Hz
Mahaudens et al
Missing Missing Missing Missing On muscle bellies of
25Hz 300Hz Rectification 1000Hz

47
(2009)49 quadratus lumborum, erector spinae, gluteus medius, rectus femoris, semitendinosus, tibialis anterior, and gastrocnemius
Odermatt et al (2003)62
Paper-thin Missing Missing Missing 22 Pairs of electrodes:
Thoracic apex, curve change site, lumbar apex, L5, rectus abdominus, obliquis externis
3Hz 1000Hz RMS 2000Hz
Shimode et al (2003)58
Plate Missing Missing 2cm
AIS: UEV, apex, LEV
Controls: T5, T8, T12, L2, L5
Not specified
Not specified
Not specified
Not specified
de Oliveiria et al (2011)50
Ag/AgCl 10x2x1mm Alcohol, shaving
10mm 2.5cm bilateral of spinous: T8, L2, L5.
Not specified Not
specified RMS Missing
Tsai et al (2010)52
Missing 11.4mm Alcohol 2cm Medial paraspinals: T7 & L2 bilaterally (2cm from spinous process
Not specified
Not specified RMS
Not specified

48
Lateral paraspinals: T7 & L2 (4cm lateral to spinous)
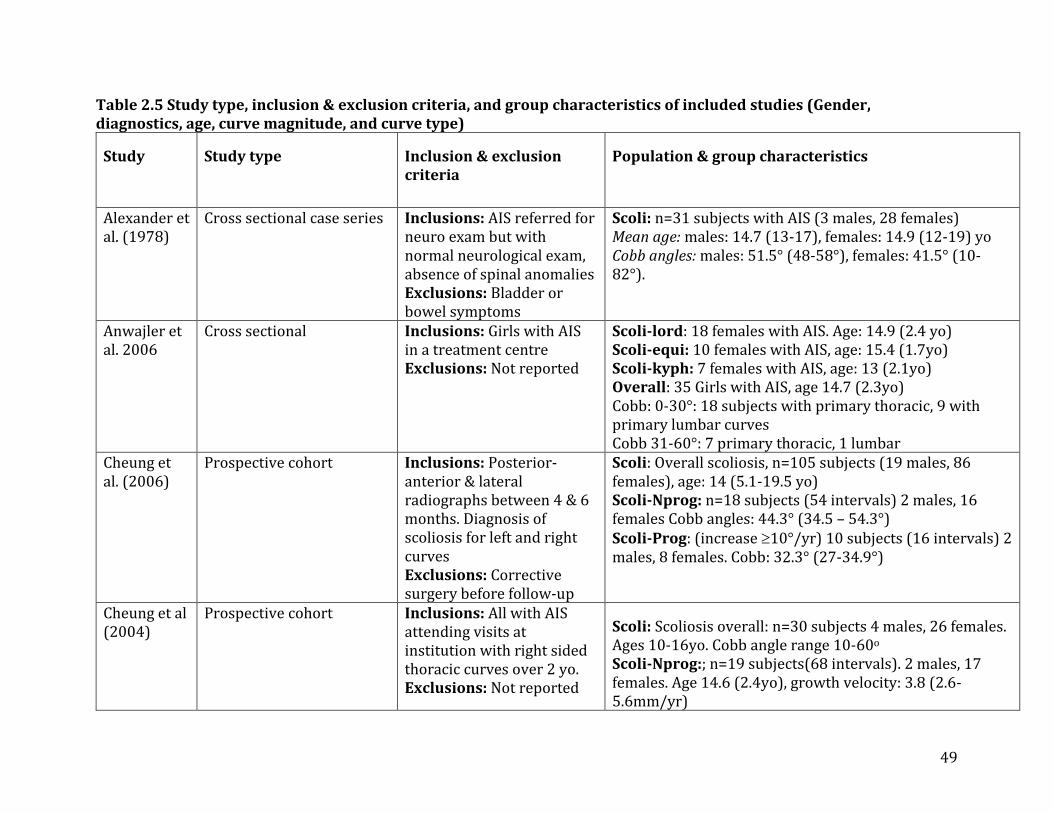
49
Table 2.5 Study type, inclusion & exclusion criteria, and group characteristics of included studies (Gender, diagnostics, age, curve magnitude, and curve type)
Study Study type Inclusion & exclusion criteria
Population & group characteristics
Alexander et al. (1978)
Cross sectional case series Inclusions: AIS referred for neuro exam but with normal neurological exam, absence of spinal anomalies Exclusions: Bladder or bowel symptoms
Scoli: n=31 subjects with AIS (3 males, 28 females) Mean age: males: 14.7 (13-17), females: 14.9 (12-19) yo Cobb angles: males: 51.5° (48-58°), females: 41.5° (10-82°).
Anwajler et al. 2006
Cross sectional Inclusions: Girls with AIS in a treatment centre Exclusions: Not reported
Scoli-lord: 18 females with AIS. Age: 14.9 (2.4 yo) Scoli-equi: 10 females with AIS, age: 15.4 (1.7yo) Scoli-kyph: 7 females with AIS, age: 13 (2.1yo) Overall: 35 Girls with AIS, age 14.7 (2.3yo) Cobb: 0-30°: 18 subjects with primary thoracic, 9 with primary lumbar curves Cobb 31-60°: 7 primary thoracic, 1 lumbar
Cheung et al. (2006)
Prospective cohort Inclusions: Posterior-anterior & lateral radiographs between 4 & 6 months. Diagnosis of scoliosis for left and right curves Exclusions: Corrective surgery before follow-up
Scoli: Overall scoliosis, n=105 subjects (19 males, 86 females), age: 14 (5.1-19.5 yo) Scoli-Nprog: n=18 subjects (54 intervals) 2 males, 16 females Cobb angles: 44.3° (34.5 – 54.3°) Scoli-Prog: (increase 10°/yr) 10 subjects (16 intervals) 2 males, 8 females. Cobb: 32.3° (27-34.9°)
Cheung et al (2004)
Prospective cohort Inclusions: All with AIS attending visits at institution with right sided thoracic curves over 2 yo. Exclusions: Not reported
Scoli: Scoliosis overall: n=30 subjects 4 males, 26 females. Ages 10-16yo. Cobb angle range 10-60o
Scoli-Nprog:; n=19 subjects(68 intervals). 2 males, 17 females. Age 14.6 (2.4yo), growth velocity: 3.8 (2.6-5.6mm/yr)

50
Scoli-Prog: n=11 subjects (17 intervals). 2 males, 9 females. Age 13.2 (1.5yo), growth velocity 20.5 (14.6 – 28.6 mm/yr)
Cheung et al (2005)
Prospective cohort Inclusions: AIS visit at dept with right sided curves Exclusions: No history of other physical disorders
Scoli: Overall scoliosis: n=23 subjects. Cobb angle 10-60o. 3 males 20 females. Risser sign 1-4 Scoli-Nprog:: n=15 subjects 2 males, 13 females. Ages 14.6 (11-16yo). Cobb 9.8 (11.1o). Scoli-Prog: n=8 subjects, 1 male 7 females. Age: 13.6 (12-16yo), Cobb: 39.2 (18.3o).
Dobosiewicz et al (2002)
Cross sectional case/control
Inclusions: Not reported Exclusions: Not reported
Scoli: Scoliosis overall: n=394 subjects, 83 males. 311 females. Age 12.5 (9-18yo). 9 cervico-thoracic (mean Cobb 30.9o) 111 with thoraco lumbar (mean Cobb 26.8o), 63 with lumbar scoliosis (mean Cobb 27.9o), 90 with double major (mean cobb: 29.2o and 28.5o) 231 right sided and 163 left sided curves. Scolifastprog n=112 subjects. Cobb 36.1 (8-77o). 76 right sided and 36 left sided curves Scolislowprog: n=182 subjects. Cobb 20.3 (3-48o), 113 right sided and 69 left sided curves Pelvic tilt scoli: n=100. Cobb 8.2 (2-25o). 42 right and 58 left sided curves Ctrl: n=70. 10 males, 60 females. Age: 12.8 (10-17yo)
Feipel et al (2002)
Cross sectional case/control
Inclusions: Scoli: Indications for surgical correction for AIS. Ctrl: matched (criteria for
matching unclear) group of
non-scoliotic teenagers Exclusions: Not reported
Scoli: n=10. 4 males, 6 females. Age 16 (2yo;14-19 yo). Cobb 56 (15o). 5 right thoracic, 2 right thoracic left lumbar, 2 left thoracolumbar, 1 right thoracolumbar curve types. Ctrl: n=10. 3 males, 7 females. Age 13 (2yo; 11-19 yo).
Filipovic et al (2006)
Cross sectional case/control
Inclusions: Scoli (all) AIS with not indication for surgery. Ctrl. Elementary school
Scoli: n=36. 4 males, 34 females. Age (9-14yo). Cobb (18-42o). Scoli≤25: n=21. Ages 9-14yo. Scoli≥26: n=17. Ages 9-14yo.

51
students in Zagreb and surroundings. Exclusions: Not reported
Ctrl: n=38. 7 males 29 females. Age 9-14yo
Fuller et al (1991)
Cross sectional case/control
Inclusions: Scoli. Girls with AIS and structural curvatures of the spine. Ctrl. Girls with normal spines. Exclusions: No other known disabilities
Scoli: Overall scoliosis: n=48 females. Age 12.3 (1.2yo). 37 right, 11 left curves. Scoli-11-12yo: n=19 females Scoli-13yo: n=15 females Scoli-14-15yo: n=14 females Ctrl n=48 females. Age 12.8 (1.2yo) Ctrl-11-12yo: n=20 females Ctrl-13yo: n=12 females Ctrl 14-15yo: n=16 females.
Gram et al (1999)
Cross sectional Inclusions: AIS from 2 clinics in Chicago metropolitan area Exclusions: <6 yo, >17 yo old, Cobb<10o
Scoli: Scoliosis: n=19. 2 males 17 females
Mahaudens et al (2005)
Cross sectional case/control
Inclusions: Scoli.: Progressive AIS with lumbar or thoraco-lumbar curve (>10°/yr ) Matched controls (for age, height, weight) Normal x-ray of spine, 12-14 yo old Exclusions: Both: <6 yo old, >17 yo old Cobb<10°. central or peripheral disorders or other spinal disorder. Scoli. previous conservative or surgical treatment, Ctrl. spinal disorders, orthopedic surgery.
Scoli: n-=12. Age 13.2 (0.8yo). Risser 1 (0-2). Thoracic curve: 11.9° (7o), Lumbar curve 22.5° (4o) Ctrl: n=12. Age 12.9 (0.9yo). Risser 1 (0.25-1)

52
Mahaudens et al (2009)
Cross sectional case/control
Inclusions: Scoli. Untreated girls with AIS attending outpatient clinic. Left thoracolumbar or lumbar primary curves (Lenke 5,6) Ctrl. healthy girls Exclusions: Scoli. Leg length discrepancies > 1cm, locomotor disorders, low back pain, neurological abnormalities, previous tx for scoliosis. Ctrl. spinal deformation or disease affecting gait.
Scoli<20: n=12 females. Age 14 (13-14yo). All post-menarche. Risser Mdn 2 [1-2]. Cobb 15.3° (5o). All with left thoracolumbar or lumbar primary curve (Lenke 5 or 6) Scoli20-40 n=13 females. Age 14 (12-15 yo). All post-menarche. Risser Mdn 2 [2-3]. All with left thoracolumbar or lumbar primary curve (Lenke 5 or 6) Scoli>40: n=16 females. Age 16 (14-17yo). Cobb: 44.3° (8.1o). All post-menarche. Risser Mdn 3 [3-4]) All with left thoracolumbar or lumbar primary curve (Lenke 5 or 6) Ctrl: n=13 females. Age 16 (15-16yo). All post-menarche. Risser Mdn 4 [3-4]. Cobb 0.8° (1.6O)
Mcintire et al (2008)
Prospective cohort Inclusions: AIS Cobb 20-60o, Risser ≤3. Age 10-17yo. Exclusions: Any diagnosable cause of scoliosis. left thoracic curves, hyperkyphosis (prior MRI for chiari malformation, syringomerlia, structural neural abnormality)
Scoli: n=17, 12 females, 3 males. Age 13.9 (1.7yo). Cobb 33° (12o). Post-menarche in 5/12 girls. Risser 0 in 7/14, Risser 1 in 3, Risser 2 in 3 and Risser 3 in 1 (1 missing). 8 thoracic, 2 double thoracic, 5 thoracolumbar/lumbar curves.
Mooney et al (2000)
Prospective case series Inclusion: Not reported Exclusion: Not reported
Scoli: n=12, 2 males, 10 females. Age 13.1 (1.6yo). Cobb 33.5° (12.8o; 20-60o). Risser 2.4 (1.4; 0-4). 3 left thoracic, 6 right thoracic, 2 right thoracic lumbar, 1 left thoracic lumbar curves.
Odermatt et Cross-sectional case series Inclusion: Diagnosis of AIS, Scoli: n=11 females. Age 13.2 (1.2yo; 12-16yo). Thoracic
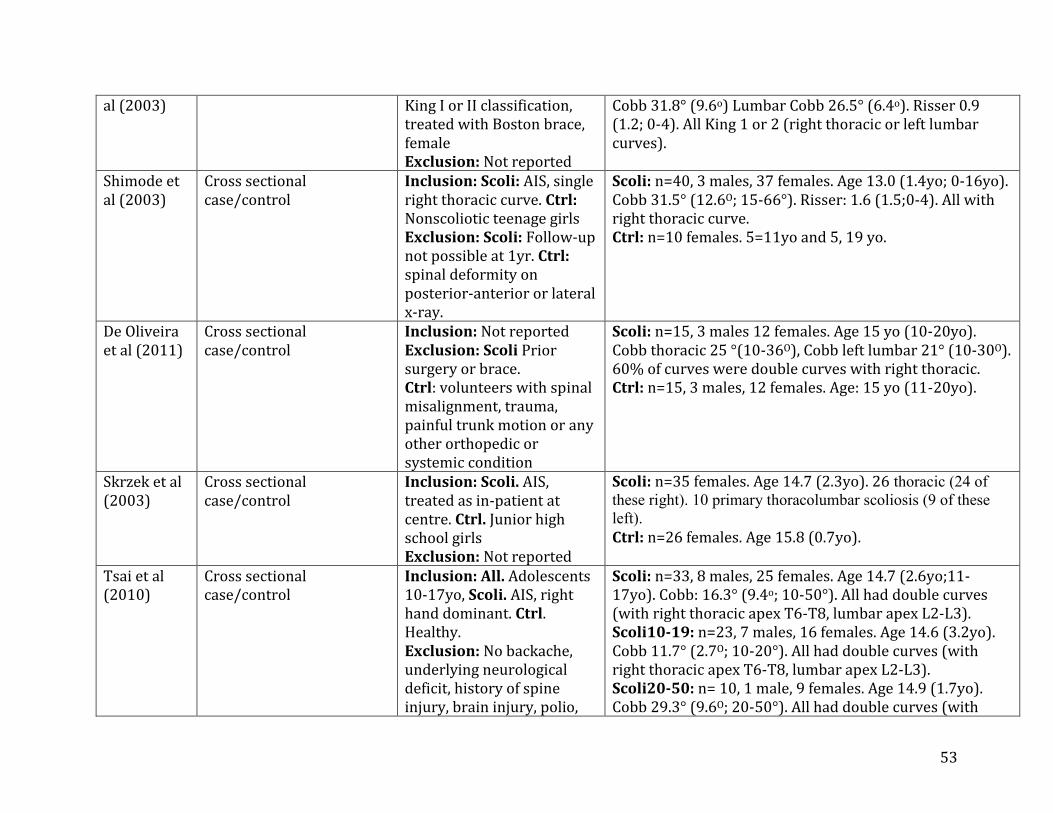
53
al (2003) King I or II classification, treated with Boston brace, female Exclusion: Not reported
Cobb 31.8° (9.6o) Lumbar Cobb 26.5° (6.4o). Risser 0.9 (1.2; 0-4). All King 1 or 2 (right thoracic or left lumbar curves).
Shimode et al (2003)
Cross sectional case/control
Inclusion: Scoli: AIS, single right thoracic curve. Ctrl: Nonscoliotic teenage girls Exclusion: Scoli: Follow-up not possible at 1yr. Ctrl: spinal deformity on posterior-anterior or lateral x-ray.
Scoli: n=40, 3 males, 37 females. Age 13.0 (1.4yo; 0-16yo). Cobb 31.5° (12.6O; 15-66°). Risser: 1.6 (1.5;0-4). All with right thoracic curve. Ctrl: n=10 females. 5=11yo and 5, 19 yo.
De Oliveira et al (2011)
Cross sectional case/control
Inclusion: Not reported Exclusion: Scoli Prior surgery or brace. Ctrl: volunteers with spinal misalignment, trauma, painful trunk motion or any other orthopedic or systemic condition
Scoli: n=15, 3 males 12 females. Age 15 yo (10-20yo). Cobb thoracic 25 °(10-36O), Cobb left lumbar 21° (10-30O). 60% of curves were double curves with right thoracic. Ctrl: n=15, 3 males, 12 females. Age: 15 yo (11-20yo).
Skrzek et al (2003)
Cross sectional case/control
Inclusion: Scoli. AIS, treated as in-patient at centre. Ctrl. Junior high school girls Exclusion: Not reported
Scoli: n=35 females. Age 14.7 (2.3yo). 26 thoracic (24 of
these right). 10 primary thoracolumbar scoliosis (9 of these
left). Ctrl: n=26 females. Age 15.8 (0.7yo).
Tsai et al (2010)
Cross sectional case/control
Inclusion: All. Adolescents 10-17yo, Scoli. AIS, right hand dominant. Ctrl. Healthy. Exclusion: No backache, underlying neurological deficit, history of spine injury, brain injury, polio,
Scoli: n=33, 8 males, 25 females. Age 14.7 (2.6yo;11-17yo). Cobb: 16.3° (9.4o; 10-50°). All had double curves (with right thoracic apex T6-T8, lumbar apex L2-L3). Scoli10-19: n=23, 7 males, 16 females. Age 14.6 (3.2yo). Cobb 11.7° (2.7O; 10-20°). All had double curves (with right thoracic apex T6-T8, lumbar apex L2-L3). Scoli20-50: n= 10, 1 male, 9 females. Age 14.9 (1.7yo). Cobb 29.3° (9.6O; 20-50°). All had double curves (with

54
CP or congenital or acquired bone deformities
right thoracic apex T6-T8, lumbar apex L2-L3). Ctrl: n=41, 12 males, 29 females. Ages 14.7 (2.8yo; 11-17yo).
Zoabli et al (2007)
Retrospective cohort Inclusion: AIS where the entire span of the curve had been imaged using SE_T1 MRI images Exclusion: Not reported
Scoli: n=17patients (25 curves), 4 males, 13 females. Age 11.6 (3.2yo). 9 single, 7 double, 1 triple curve. 2 proximal thoracic, 14 main thoracic, 9 thoracolumbar/lumbar curves.
*Group characteristics not reported were not reported in the paper Abbreviations: Ctrl – control group; Lbs – pounds, Reps – repetitions, Scoli – overall Scoliosis group; Scoli-prog = progressive Scoliosis; Scoli-Nprog = non progressive Scoliosis; Scoli<x –Cobb angle descriptor; Scolipre-op- preoperative Scoliosis; Scolifastprog- fast progressive Scoliosis; Scolislowprog- slow progressive Scoliosis, yo = Years old, Symbols: *p<0.05, ~ p<0.01, Ŧ p<0.001, § p<0.10, Symbols are reported when exact p value was not reported in the reviewed paper. ±X=SD ()= range []=median/interquartile range

55
Table 2.6 Description of the tasks and measurements used to test muscle function for each study included in the review describing differences in functional properties between AIS and controls.
Study Measurement and task (dose)
Muscle groups & outcomes
Differences in functional properties in AIS vs. controls
Dobosiewicz et al (1997)44
EMG latency Standing on a box with a trapdoor allowing the box to tilt 8 ° to either side. (4 times on each side. 30 seconds between recordings)
Paraspinal muscles EMG Latency at T8 (time from stimulus to the unloading reflex response in ms) Number of rebound/silent reflex cycles
Mean latency of unloading reflex
Scoli FastProg (73 to 94 ms) larger than
ScoliSlowProg (51 to 60 ms)*,
Pelvic tilt Scoli (41 to 50 ms,) ŧ and
CTRL(47 to 49 ms, p<0.001)ŧ
The number of unloading reflex cycles at T8
Scoli FastProg (1.5 to 2.1) smaller than ScoliSlowProg (3.0
to 3.8) ŧ, CTRL (4.1 to 4.3)ŧ and Pelvic tilt Scoli (4.2 to 4.7)ŧ Feipel et al (2002)45
EMG activity: 1) isometric contraction of heterolateral obliques, 25kg in opposite hand 3reps/side (1min rest between sides) 2) one way bending with arm swing 3) one way bending without arm swing 4) bending and return without arm swing 5) bending and return with 2kg in each hand Tasks 2-5: 5 reps/side (30sec rest)
Rectus abdominii, obliques, spine extensors RMS ratio calculation: Heterolateral RMS /Homolateral RMS
Group by side interaction: A significantly larger RMS ratio and asymmetry (larger during left tasks) in Scoli compared to CTRL. Group by muscle interaction: Differences between groups at recording sites at T10 and L1(both 3 and 6cm from midline), L3 (6 cm), and abdominal sites. Group by Task interaction: Not significant p>0.05 Pairwise comparisons missing for all interactions and main effects involving factors with more than 2 levels. Means provided for all group, muscles, sides and tasks even though 3 way interactions were not reported and the 4 way interaction was not significant.
Filipovic et al (2006)46
EMG activity Two different step tests, left
Erector spinae, gluteus maximus
Mean during the left step test Erector spinae Scoli: left: 0.141±0.047; right: 0.140±0.051

56
& right. Subjects stepped up to a 16 inch tall bench and stepped down on a force plate. Subjects stepped alternating left and right at the sound of a signal for 15 seconds
Undefined parameter to quantify EMG activity
CTRL: Left: 0.220±0.238; Right: 0.245±0.249 Gluteus maximus Scoli: left 0.448±0.299; right: 0.096±0.049 CTRL: left: 0.414±0.251; right: 0.187±0.242 A significant discriminating function between the Scoli vs CTRL (Wilks lambda, 0.639*, canonical correlation coefficient = 0.60)*. Among 14 discriminating variables considered, there were somewhat more significant correlation (0.26 – 0.45) for the function of the variables of the right and left erector spinae muscles, right gluteus maximus, as well as the latero-lateral ground reaction force. The discriminative function successfully classified 78.7% of all subjects. The classification was more successful in Scoli (90.6% identified as Scoli) than Ctrl(53.3% identified as Ctrl). The right step test did not show any significant discriminative value.
Fuller et al (1991)66
Spring scale dynamometer, Leighton flexometer, Overhead pull, overhead push, press of arms and shoulders, knee extension. (3 reps bilaterally, then 3 reps unilaterally) ROM for trunk lateral flexion
and rotation.
Dynamometer “tests for
shoulders and arms require
the action of transverse
spinal muscles.”
Best score of 3 trials in lbs of weight lifted ROM (units not specified)
Significant group by age interaction in MANOVA of 4 strength variable using ɑ<0.10 (p=0.0989) Of 4 post-hoc ANOVA, 2 had significant group by age interactions (strength both arms p=.0252, strength dominant arm p=.0462). Scoli-14-15yo had significantly lower strength in unilateral and bilateral movements, regardless of dominance than Ctrl 14-15yo Arm Shoulder Strength scores: Bilateral Scoli- 2.10 vs Ctrl 2.43lbs§ Dominant: Scoli- 1.23 vs Ctrl- 1.45lbs§ Non-dominant: Scoli: 1.16 vs Ctrl: 1.41lbs § No significant differences in overall strength tests in Scoli vs. Ctrl for age 11-12 and age 13 subgroups.
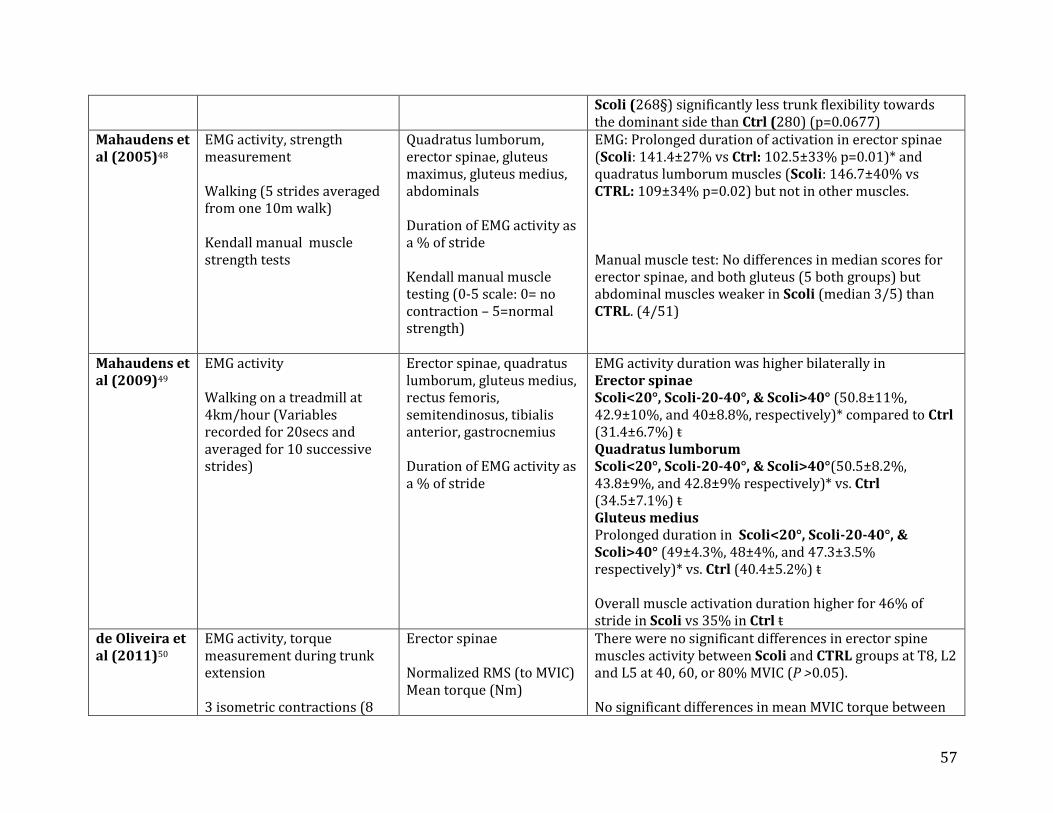
57
Scoli (268§) significantly less trunk flexibility towards the dominant side than Ctrl (280) (p=0.0677)
Mahaudens et al (2005)48
EMG activity, strength measurement Walking (5 strides averaged from one 10m walk) Kendall manual muscle strength tests
Quadratus lumborum, erector spinae, gluteus maximus, gluteus medius, abdominals Duration of EMG activity as a % of stride Kendall manual muscle testing (0-5 scale: 0= no contraction – 5=normal strength)
EMG: Prolonged duration of activation in erector spinae (Scoli: 141.4±27% vs Ctrl: 102.5±33% p=0.01)* and quadratus lumborum muscles (Scoli: 146.7±40% vs CTRL: 109±34% p=0.02) but not in other muscles. Manual muscle test: No differences in median scores for erector spinae, and both gluteus (5 both groups) but abdominal muscles weaker in Scoli (median 3/5) than CTRL. (4/51)
Mahaudens et al (2009)49
EMG activity Walking on a treadmill at 4km/hour (Variables recorded for 20secs and averaged for 10 successive strides)
Erector spinae, quadratus lumborum, gluteus medius, rectus femoris, semitendinosus, tibialis anterior, gastrocnemius Duration of EMG activity as a % of stride
EMG activity duration was higher bilaterally in Erector spinae Scoli<20°, Scoli-20-40°, & Scoli>40° (50.8±11%, 42.9±10%, and 40±8.8%, respectively)* compared to Ctrl (31.4±6.7%) ŧ Quadratus lumborum Scoli<20°, Scoli-20-40°, & Scoli>40°(50.5±8.2%, 43.8±9%, and 42.8±9% respectively)* vs. Ctrl (34.5±7.1%) ŧ Gluteus medius Prolonged duration in Scoli<20°, Scoli-20-40°, & Scoli>40° (49±4.3%, 48±4%, and 47.3±3.5% respectively)* vs. Ctrl (40.4±5.2%) ŧ Overall muscle activation duration higher for 46% of stride in Scoli vs 35% in Ctrl ŧ
de Oliveira et al (2011)50
EMG activity, torque measurement during trunk extension 3 isometric contractions (8
Erector spinae Normalized RMS (to MVIC) Mean torque (Nm)
There were no significant differences in erector spine muscles activity between Scoli and CTRL groups at T8, L2 and L5 at 40, 60, or 80% MVIC (P >0.05). No significant differences in mean MVIC torque between

58
seconds for each of 3 MVIC percentages: 40%, 60%, and 80%)
Scoli 12.9 ± 4.2Nm and Ctrl 14.2 ± 5.7Nm p>0.05
Skrzek et al (2003)75
Strength measurement Maximal extension/flexion strength tests (from 20
O
hyperextension to 50O flexion
in sitting) @ 90o/s and 120o/s in both groups Max strength (10 reps)
Trunk flexors and extensors Extension peak torque (Nm) Flexion peak torque (Nm) Extension peak torque/body mass (%), Flexion peak torque/body mass (%), Extension time to peak torque (ms) Flexion time to peak torque (ms) Extension total work (J) Flexion total work (J) Extension mean power (W) Flexion mean power (W)
Significant differences in most outcomes 90° Scoli: 133.8±37.2Nm, CTRL: 157.8±27.9Nm, p=0.008 120° Scoli: 110.4±41.2Nm, CTRL: 146.2±31.4Nm p=0.000 90O Scoli: 101.9±25.9Nm, CTRL116.0±19.1Nm, p=0.022 120° Scoli: 83.9±27.2 Nm, CTRL: 115.1±20.3Nm p=0.000 90° Scoli: 278.1±77.3%, CTRL: 294.5±57.2% p>0.05 120° Scoli: 230.1±91.2%, CTRL: 273.9±66.2% p=0.042 90O Scoli: 211.8±53.8%, CTRL: 217.0±42.1% p>0.05 120O Scoli: 174.6±55.9%, CTRL: 215.9±46.1% p=0.003 90° Scoli: 255.4± 131.8, CTRL: 428.5± 202.7ms p<0.001 120° Scoli: 195.1 ±62.8, CTRL: 120°: 365.8± 131.0 p<0.001 90° Scoli: 238.6± 61.5ms, CTRL: 324.6± 200.0ms p=0.0019 120° Scoli: 262.6±75.7ms, CTRL: 309.6± 150.8ms p>0.05 90° Scoli: 333.4± 112.6J, CTRL: 396.1± 88.8J p=0.022 120° Scoli: 240.7± 123.0J, CTRL: 316.9± 111.3J p=0.016 90° Scoli: 234.8± 59.8J, CTRL: 328.9± 72.3J p<0.001 120° Scoli: 193.4± 66.2J, CTRL: 291.9± 73.7Jp<0.001 90° Scoli: 127.0± 43.7W, CTRL: 129.7± 30.6W p>0.05 120° Scoli: 110.8± 59.0W, CTRL: 125.1± 43.9W p>0.05 90° Scoli: 88.6± 27.5W, CTRL: 117.8± 23.8W p<0.001

59
Extension acceleration time (ms) Flexion acceleration time (ms) Extension deceleration time (ms) Flexion deceleration time (ms)
120° Scoli: 89.1± 32.4W, CTRL: 127.8± 31.2W p<0.001 90O Scoli: 53.7± 14.0ms, CTRL: 55.8± 21.9ms p>0.05 120° Scoli: 63.7± 17.5ms, CTRL: 65.0± 22.1ms p>0.05 90O Scoli: 119.7± 37.9ms, CTRL: 84.2± 26.3ms p<0.001 120° Scoli: 127.4± 30.0ms, CTRL: 94.2± 30.1ms p<0.001 90O Scoli: 145.4±27.3ms, CTRL: 266.5± 36.3ms p<0.001 120° Scoli: 146.3±16.5ms, CTRL: 273.1± 36.0ms p<0.001 90O Scoli: 72.0±9.9ms, CTRL: 148.1± 38.9ms p<0.001 120° Scoli: 77.4±8.5ms, CTRL: 163.5± 30.6ms p<0.001
Abbreviations: Ctrl – control group; Lbs – pounds, Reps – repetitions, Scoli – overall Scoliosis group; Scoli-prog = progressive Scoliosis; Scoli-Nprog = non progressive Scoliosis; Scoli<x –Cobb angle descriptor; Scolipre-op- preoperative Scoliosis; Scolifastprog- fast progressive Scoliosis; Scolislowprog- slow progressive Scoliosis, yo = Years old, Symbols: *p<0.05, ~ p<0.01, Ŧ p<0.001, § p<0.10, Symbols are reported when exact p value was not reported in the reviewed paper. ±X=SD ()= range []=median/interquartile range

60
Table 2.7 Description of the tasks and measurements used to test muscle function for each study included in the review with results describing differences in functional properties between sides in patients with AIS compared to controls.
Study Measurement and task (dose) Muscle groups & outcome
Differences in functional properties convex VS concave in AIS vs controls
Dobosiewicz et al (1997)44
EMG latency Standing on a box with a trapdoor allowing the box to tilt 8 ° to either side. (4 times on each side. 30 seconds between recordings)
Paraspinal muscles EMG Latency at T8 (time from stimulus to the unloading reflex response in ms)
In ScoliFastProg, ScoliSlowProg, Pelvic Tilt Scoli and CTRL,
The reflex response was found to be symmetrical on both sides
of the body when tilting to the right or left.
In patients with progressive idiopathic Scoliosis,
the latency was prolonged on the side opposite the
curve during both left and right step tests. Feipel et al (2002)45
EMG activity: 1) isometric contraction of heterolateral obliques, (25kg in opposite hand, 3reps/side, 1min rest between sides) 2) one way bending with arm swing 3) one way bending without arm swing 4) bending and return without arm swing 5) bending and return with 2kg in each hand (Tasks 2-5: 5 reps/side, 30sec rest)
Rectus abdominii, obliques, spine extensors
RMS ratio calculation: Heterolateral RMS /Homolateral RMS
Group by side interaction: A significantly larger RMS ratio and asymmetry (larger during left tasks) in Scoli compared to CTRL. Group by muscle interaction: Differences between groups at recording sites at T10 and L1(both 3 and 6cm from midline), L3 (6 cm), and abdominal sites. Group by Task interaction: Not significant p>0.05 Pairwise comparisons missing for all interactions and main effects involving factors with more than 2 levels. Means provided for all group, muscles, sides and tasks even though 3 way interactions were not reported and the 4 way interaction was not significant.
de Oliveira et al (2011)50
EMG activity, 3 isometric extension contractions (8 seconds for each of 3 MVIC percentages: 40%, 60%, and 80%)
Erector spinae Normalized RMS (to MVIC)
There were no significant differences in normalized erector spine muscles activity between Scoli and Ctrl groups at T8, L2 and L5 at 40, 60, or 80% MVIC (P >0.05). Within each group, no significant differences between sides at T8, L2 and L5 at 40 and 60% MVIC and at T8 and L2 at 80% MVIC. At 80% MVIC Scoli: greater normalized RMS at L5 on the convex side 129±26.9 vs the concave side 76.53±6.7* Ctrl: greater normalized RMS at L5 on the left side 129±32.6 vs the right side 77.85±11.4*
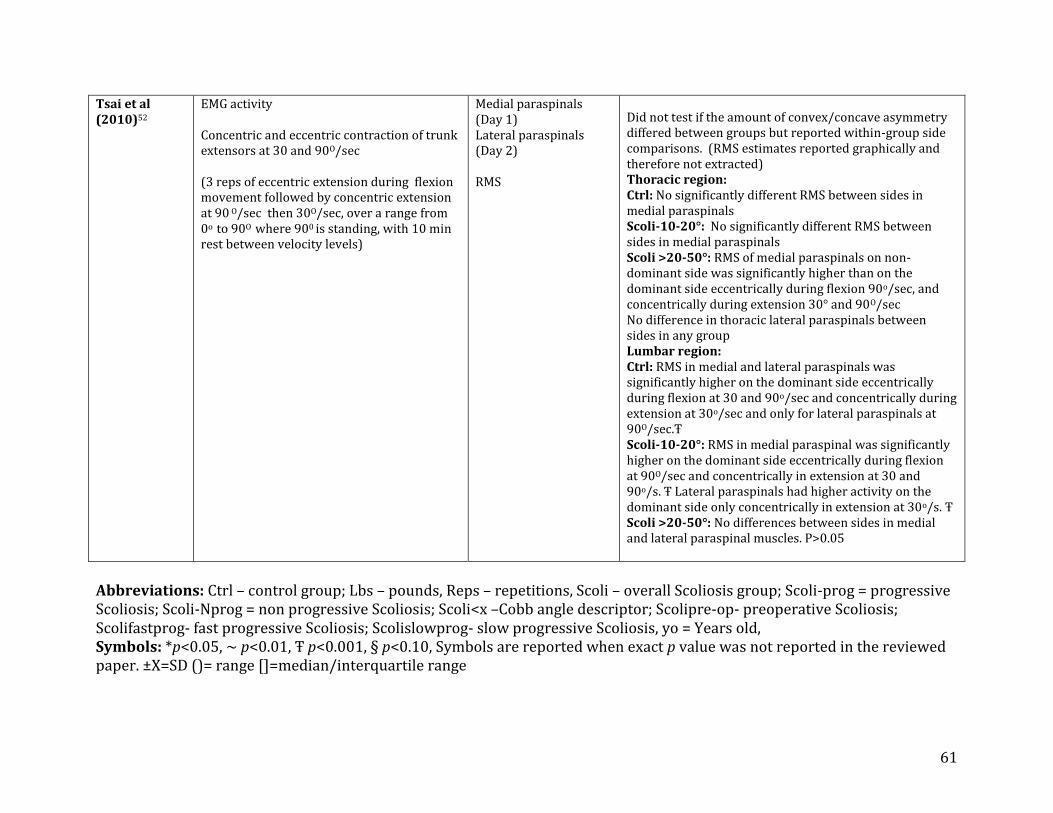
61
Tsai et al (2010)52
EMG activity Concentric and eccentric contraction of trunk extensors at 30 and 90O/sec (3 reps of eccentric extension during flexion movement followed by concentric extension at 90 O/sec then 30O/sec, over a range from 0o to 90O where 900 is standing, with 10 min rest between velocity levels)
Medial paraspinals (Day 1) Lateral paraspinals (Day 2) RMS
Did not test if the amount of convex/concave asymmetry differed between groups but reported within-group side comparisons. (RMS estimates reported graphically and therefore not extracted) Thoracic region: Ctrl: No significantly different RMS between sides in medial paraspinals Scoli-10-20°: No significantly different RMS between sides in medial paraspinals Scoli >20-50°: RMS of medial paraspinals on non-dominant side was significantly higher than on the dominant side eccentrically during flexion 90o/sec, and concentrically during extension 30° and 90O/sec No difference in thoracic lateral paraspinals between sides in any group Lumbar region: Ctrl: RMS in medial and lateral paraspinals was significantly higher on the dominant side eccentrically during flexion at 30 and 90o/sec and concentrically during extension at 30o/sec and only for lateral paraspinals at 90O/sec.Ŧ Scoli-10-20°: RMS in medial paraspinal was significantly higher on the dominant side eccentrically during flexion at 90O/sec and concentrically in extension at 30 and 90o/s. Ŧ Lateral paraspinals had higher activity on the dominant side only concentrically in extension at 30o/s. Ŧ Scoli >20-50°: No differences between sides in medial and lateral paraspinal muscles. P>0.05
Abbreviations: Ctrl – control group; Lbs – pounds, Reps – repetitions, Scoli – overall Scoliosis group; Scoli-prog = progressive Scoliosis; Scoli-Nprog = non progressive Scoliosis; Scoli<x –Cobb angle descriptor; Scolipre-op- preoperative Scoliosis; Scolifastprog- fast progressive Scoliosis; Scolislowprog- slow progressive Scoliosis, yo = Years old, Symbols: *p<0.05, ~ p<0.01, Ŧ p<0.001, § p<0.10, Symbols are reported when exact p value was not reported in the reviewed paper. ±X=SD ()= range []=median/interquartile range

62
Table 2.8 Description of the tasks and measurements used to test muscle function for each study included in the review with results describing differences in functional properties between sides and levels in patients with AIS
Study Measurement and task Muscle groups & outcomes Differences in functional properties within AIS patients between sides and levels
Alexander et al (1978)53
EMG Activity Lying prone and standing (unspecified duration)
Paraspinal muscles i) Insertional activity- muscle activity (raw signal) at rest. ii) Activity vs silence during tasks
No overall abnormal insertional activity. In prone: 30/31 patients had EMG silence on both sides of curve at the apex. 1 patient had activity at the apex In standing: In 20/31 subjects EMG activity was higher on the convex side and activity was minimal (or silence) on the concave side. In 6 patients there was silence on both sides of the curve, 2 of these were balanced curves. 2 subjects had balanced activity on both sides of the curve.
Cheung et al (2004) 63
EMG activity Standing upright in a relaxed posture, with arms along the body and feet together (unspecified duration)
Erector spinae bilaterally at UEV, apex, and LEV Convex/concave EMG activity ratio
Ratios of convex:concave activity: Scoli-Nprog: UEV: 0.96 (0.81:1.15) p=N/A APEX: 1.30 (1.10:1.54) p=0.033 LEV1.09 (0.93:1.26) p=N/A Significant asymmetry only at apex Scoli-Prog: UEV: 1.47 (1.08:2.00) p=0.033 APEX: 1.94 (1.46:2.57) p=0.033 LEV: 2.23 (1.60:3.11)p=0.000 Significant asymmetry at all levels Significantly higher asymmetry in Prog vs Nprog curves at all levels.
Cheung et al (2005) 34
EMG activity 1) lying supine head straight, feet together and arms alongside the body, 2) sitting relaxed with hands on lap feet on ground
Erector spinae bilaterally at UEV, Apex, and LEV Convex/concave activity ratio (of absolute summated EMG amplitude of the total recording time.)
Scoli-Nprog mean (95%CI) UEV Supine: 0.69 (0.47:1.02) UEV Sitting: 0.87 (0.56:1.36) UEV Standing: 0.74 (0.55:1.00) * APEX Supine: 1.83 (0.58:6.26)* APEX Sitting: 2.51 (0.34:14.4)*

63
3) standing relaxed arms at side, feet together (unspecified duration)
APEX Standing: 2.10 (0.58:6.26)* LEV Supine: 0.91 (0.74:1.13) LEV Sitting: 1.09 (0.77:1.55) LEV Standing: 0.96 (0.80:1.15) Scoli-Prog: UEV Supine: 0.97 (0.64:1.47) UEV Sitting: 2.00 (0.98:4.06) UEV Standing: 1.88 (1.00:3.55) * APEX Supine: 0.90 (0.62;1.33) APEX Sitting: 2.13 (1.33;3.43)* APEX Standing: 1.65 (1.15:2.36)* LEV Supine: 1.74 (1.10:2.76) * LEV Sitting: 3.37 (1.84:6.15)* LEV Standing 2.55 (1.50:4.34)* NProg curves have higher ratios than Prog for Apex supine. Prog curves have higher ratios than NProg curves for LEV supine, as well as for UEV and LEV sitting and standing.
Cheung et al (2006) 55
EMG activity Standing upright in a relaxed posture, with arms along the body and feet together (unspecified duration)
Erector spinae bilaterally at UEV, apex, and LEV Convex/concave EMG activity ratio (measured as the area under the curve)
Ratios of convex:concave activity Scoli-Nprog UEV=0.92 (0.90:1.38) APEX=1.15 (1.06:1.67)* LEV= 1.10 (0.94-1.25) Significant asymmetry only at apex Scoli-Prog UEV=1.34 (1.06:1.94)* APEX=1.73 (1.43-2.86)* LEV=2.13 (1.36:2.60)* Significant asymmetry at all levels Levels were not compared statistically. Significant higher asymmetry in Prog vs Nprog

64
curves at UEV and LEV levels. Dobosiewicz et al (1997)44
EMG latency Standing on a box with a trapdoor allowing the box to tilt 8 ° to either side. (4 times on each side. 30 seconds between recordings)
Paraspinal muscles EMG latency (time from stimulus to the unloading reflex response in ms)
In ScoliFastProg, ScoliSlowProg, Pelvic Tilt
Scoli the reflex response was found to be
symmetrical on both sides of the body when
tilting to the right or left.
In patients with progressive idiopathic Scoliosis,
the latency was prolonged on the side opposite
the
curve when tilting to the right or left. Means and
significance not reported.
Feipel et al (2002)45
EMG activity: 1) isometric contraction of heterolateral obliques, 25kg in opposite hand 3reps/side (1min rest between sides) 2) one way bending with arm swing 3) one way bending without arm swing 4) bending and return without arm swing 5) bending and return with 2kg in each hand Tasks 2-5: 5 reps/side (30sec rest)
Rectus abdominii, obliques, spine extensors RMS ratio calculation: Heterolateral RMS /Homolateral RMS
Main effects for side (greater RMS ratios on the left side during right-bending), muscle, and task all significant on RMS ratios (p<0.01). Post Hoc tests demonstrated significance in all tasks exept for task 5.
Mean only reported for all muscles, all tasks and
sides individually not specific to the significant
main effects.
Gram et al (1999)56
EMG activity Relaxed standing, sitting, erect sitting, and writing while seated (3 trials of 2 seconds for each position. Rest between positions)
Multifidus, illiocostalis, longissimus Activity, in microvolts
Standing: T6 multifidus convex 26.0 μv, concave 34.2 μv L1 multifidus convex 34.1μv, concave 20.7 μv L3 multifidus convex 59.6μv > concavity 31.3μv* L1 illiocostalis convex 54.7μv > concave 25.8μv* Relaxed sitting: T6 multifidus convex 41.4 μv, concave 48.4 μv L1 multifidus convex 29.5μv > concave: 22.1μv* L3 multifidus convex: 44.6μv > concave 19.4μv* L1 iliocostalis convex: 28.8μv, concave 20.9 Erect Sitting:
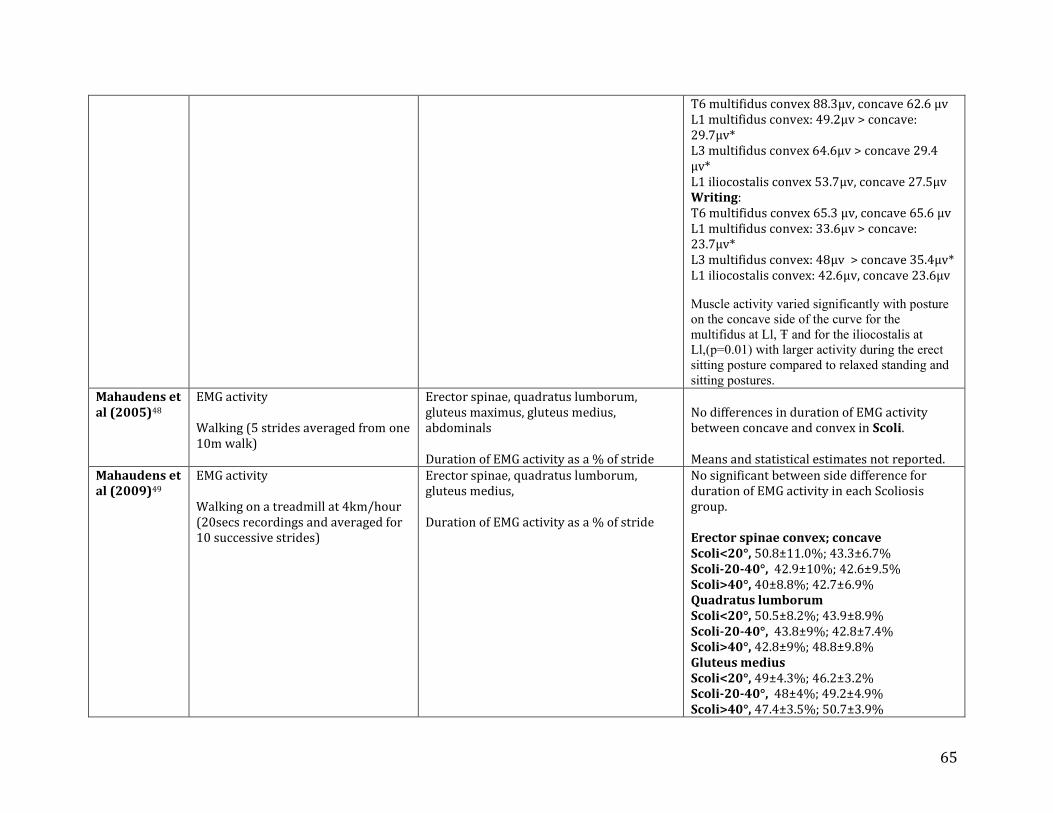
65
T6 multifidus convex 88.3μv, concave 62.6 μv L1 multifidus convex: 49.2μv > concave: 29.7μv* L3 multifidus convex 64.6μv > concave 29.4 μv* L1 iliocostalis convex 53.7μv, concave 27.5μv Writing: T6 multifidus convex 65.3 μv, concave 65.6 μv L1 multifidus convex: 33.6μv > concave: 23.7μv* L3 multifidus convex: 48μv > concave 35.4μv* L1 iliocostalis convex: 42.6μv, concave 23.6μv
Muscle activity varied significantly with posture
on the concave side of the curve for the
multifidus at Ll, Ŧ and for the iliocostalis at
Ll,(p=0.01) with larger activity during the erect
sitting posture compared to relaxed standing and
sitting postures.
Mahaudens et al (2005)48
EMG activity Walking (5 strides averaged from one 10m walk)
Erector spinae, quadratus lumborum, gluteus maximus, gluteus medius, abdominals Duration of EMG activity as a % of stride
No differences in duration of EMG activity between concave and convex in Scoli. Means and statistical estimates not reported.
Mahaudens et al (2009)49
EMG activity Walking on a treadmill at 4km/hour (20secs recordings and averaged for 10 successive strides)
Erector spinae, quadratus lumborum, gluteus medius, Duration of EMG activity as a % of stride
No significant between side difference for duration of EMG activity in each Scoliosis group. Erector spinae convex; concave Scoli<20°, 50.8±11.0%; 43.3±6.7% Scoli-20-40°, 42.9±10%; 42.6±9.5% Scoli>40°, 40±8.8%; 42.7±6.9% Quadratus lumborum Scoli<20°, 50.5±8.2%; 43.9±8.9% Scoli-20-40°, 43.8±9%; 42.8±7.4% Scoli>40°, 42.8±9%; 48.8±9.8% Gluteus medius Scoli<20°, 49±4.3%; 46.2±3.2% Scoli-20-40°, 48±4%; 49.2±4.9% Scoli>40°, 47.4±3.5%; 50.7±3.9%

66
No significant difference between the three Scoliosis groups for the EMG variables.
Mcintire et al (2008)59
Isometric trunk rotation strength Isometric rotation both toward and away from midline at starting positions of 36 , 18, 0, -18, and -36 ° (negative numbers indicate starting positions in rotation to the convex side) using Biodex Multijoint System 3 Pro testing machine.
Trunk rotators Torque normalized to lean body weight (Newton.meters/ kg)
No difference in normalized strength between corresponding contractions on the convex and concave side at any prerotated trunk position from neutral position - contractions towards concave (0.81± 0.25) vs convex (0.93± 0.23Nm/kg)
contractions towards midline: -from an 18O pre-rotated position to the convex side (0.94 ± 0.17) vs to concave (1.00 ± 0.27) - from a 36O pre-rotated position to the convex side (1.07 ± 0.23) vs to concave (1.08 ± 0.25) contractions towards outside (lateral): -from an 18O pre-rotated position to the convex side (0.67 ± 0.20) vs to concave (0.62 ± 0.22) - from a 36O pre-rotated position to the convex side (0.55 ± 0.17) vs to concave (0.53 ± 0.25)
Mooney et al (2000)57
EMG activity & isometric trunk rotation strength Isometric rotation both toward and away from midline at starting positions of 36 , 18, 0, -18, and -36 ° (negative numbers indicate starting positions in rotation to the convex side) using MedX Torso Rotation Unit.
Paraspinal muscles, obliques EMG activity (raw), Isometric rotation torque (N.m)
In patients with AIS, EMG activity was asymmetric (between lumbar paraspinal muscle sides with direction not specified, higher activity in oblique, diminished in paraspinal. Mean activity not quantified. All participants with AIS had strength differences between sides ranging from 12-47% with 10/12 subjects weaker on concave side. (means reported graphically only.)
Shimode et al (2003)58
EMG latency Neck extension in prone position following a sound cue provided with random delays. ( 30-50 repetitions)
Erector spinae Difference in side to side premotor time in ms (D-PMT = Left PMT- Right PMT)
Mean values of D-PMT UEV = 1.17 ± 3.81ms p>0.05 APEX = 2.60 ±5.59ms p=0.007 LEV = 3.34 ± 6.72ms p=0.004 All ratios of D-PMT were significantly different

67
from 0ms Zoabli et al (2007)60
MRI
None (Position when MRI captured)
Erector spinae Muscle volume, Muscle difference index MDI %= 1 / N Sum (I,N)(1-(volumeconcave/volumeconvex)x100
% of sample with MDI values larger than 5% on each side: Upper third of curve concave side : 15.3% vs convex 9.9% Middle third of curve (apex) concave: 15.8% vs convex 12.1% Lower third of curve concave: 14.3% vs convex: 9% -Similar over each third on the concave side and more important at the apex than above or below on the convex side. Largest muscle difference index more prevalent on concave side. Muscle volume overall: Concave: 103.3±51.3cm3 Convex: 102.8±52.8cm3 (Not significant)
Abbreviations: Ctrl – control group; Lbs – pounds, Reps – repetitions, Scoli – overall Scoliosis group; Scoli-prog = progressive Scoliosis; Scoli-Nprog = non progressive Scoliosis; Scoli<x –Cobb angle descriptor; Scolipre-op- preoperative Scoliosis; Scolifastprog- fast progressive Scoliosis; Scolislowprog- slow progressive Scoliosis, yo = Years old, Symbols: *p<0.05, ~ p<0.01, Ŧ p<0.001, § p<0.10, Symbols are reported when exact p value was not reported in the reviewed paper. ±X=SD ()= range []=median/interquartile range

68
Table 2.9 Description of the tasks and measurements used to test muscle function for each study included in the review with results describing differences in functional properties between patients with AIS with different curve types
Study Measurement and task Muscle groups & outcome Differences in muscle properties in patients with AIS between different curve types
Anjwaler et al (2006)61
Isokinetic torque Flexion and extension in sitting and semi sitting. (Strength testing: 10 reps each, ROM from 20° hyperextension to 50° flexion or 70° overall, 1-3 min rest between tests at different speeds. Movement speeds for concentric strength testing at 60, 90 and 120°/s in both groups.)
Spinal flexors and extensors 1) Peak torque (N.m) & normalized peak torque (N.m/kg) 2) Time to peak torque (ms)
Peak torque: did not differ by posture type (kyph, lord, equi), scoliosis type (Th vs ThL) or by size for all velocities and test positions. Means only reported graphically for posture subgroups for sitting. Normalized peak torque for flexion at 120O/s in sitting entered a discriminant function to identify posture types. Scoli-lord 273.2 ± 70.2; Scoli-kyph 252.9 ± 99.8; Scoli-equi 224.0 ± 56.0Nm/kg Time to peak torque entered discriminant functions to identify posture types, scoliosis location, and curve size. Time to peak torque discriminated between posture types: for flexion in sitting at 60O/s Scoli-lord 273.3 ± 70.2ms; Scoli-kyph 252.9 ± 99.8 and Scoli-equi 224 ±56.0ms. For extension at 120O/s in the semi-sitting position Scoli-lord 182.2 ± 60.0ms; Scoli-kyph 242.0 ± 60.2ms and Scoli-equi 214.0 ±35.7ms.
Mooney et al (2000)57
Isometric trunk rotation strength Isometric rotation both toward and away from midline at starting positions of 36 , 18, 0, -18, and -36 ° (negative numbers indicate starting positions in rotation to the convex
Paraspinal muscles, obliques Isometric rotation torque (N.m)
The only 2/12 subjects demonstrating weakness on the convex side had double curves. The other 10 subjects had weakness on the concavity.

69
side) using MedX Torso Rotation Unit. Zoabli et al (2007)60
MRI
None (Position when MRI captured)
Erector spinae Muscle volume (cm3), Muscle difference index MDI %= 1 / N Sum (I,N)(1-(volumeconcave/volumeconvex)x100
For the 9 single curves, muscle volume was: Concave= 116 ± 64 cm3 , Convex = 109 ± 64 cm3. For the 7 double curves, muscle volume was: Concave = 103± 46 cm3, convex= 105± 50 cm3 For the triple curve, muscle volume was: concave = 67±9 cm3, convex = 73±14 cm3. None of the side to side difference were significant, differences between curve types were not tested. 6/9 with a single curve had their largest differences on the concave side, but only two at the apical level. In 7/7 double curves, the largest difference of both deviations was always on the same side of the spine (4 left and 3 right). In 9/14 thoracic curves, largest MDI was also on the concave side and 5 times in the apex region.
Abbreviations: Ctrl – control group; Lbs – pounds, Reps – repetitions, Scoli – overall Scoliosis group; Scoli-prog = progressive Scoliosis; Scoli-Nprog = non progressive Scoliosis; Scoli<x –Cobb angle descriptor; Scolipre-op- preoperative Scoliosis; Scolifastprog- fast progressive Scoliosis; Scolislowprog- slow progressive Scoliosis, yo = Years old, Symbols: *p<0.05, ~ p<0.01, Ŧ p<0.001, § p<0.10, Symbols are reported when exact p value was not reported in the reviewed paper. ±X=SD ()= range []=median/interquartile range
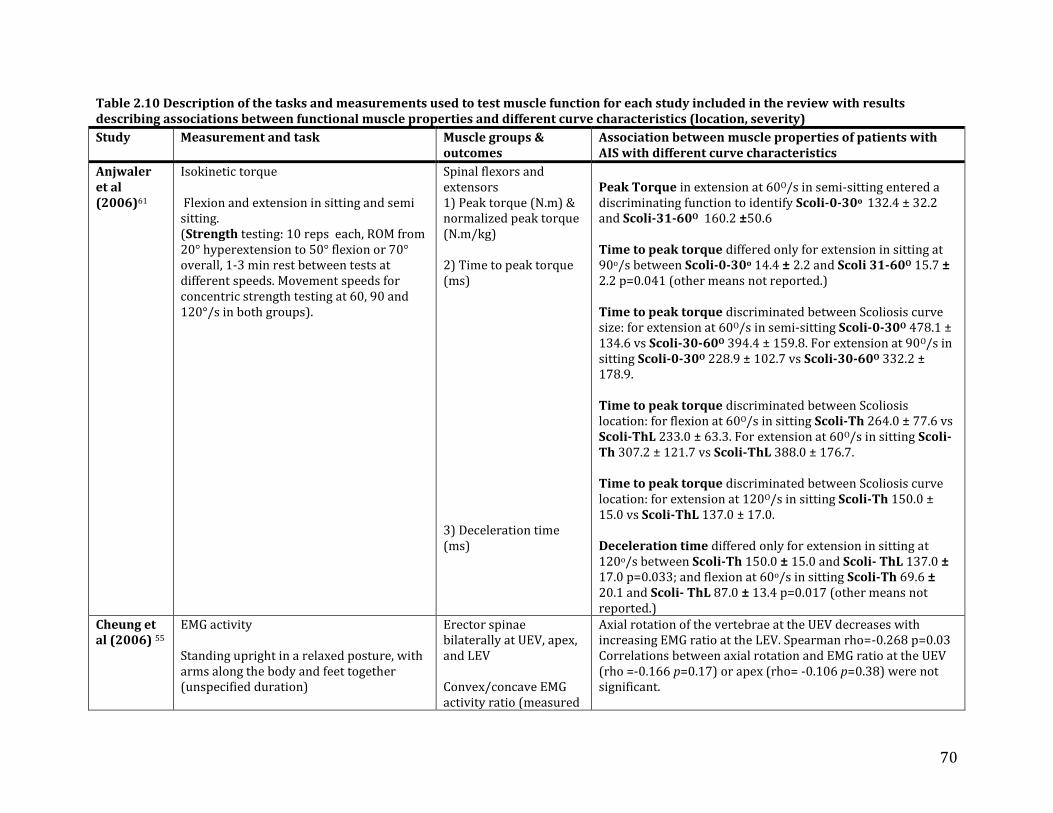
70
Table 2.10 Description of the tasks and measurements used to test muscle function for each study included in the review with results describing associations between functional muscle properties and different curve characteristics (location, severity)
Study Measurement and task Muscle groups & outcomes
Association between muscle properties of patients with AIS with different curve characteristics
Anjwaler et al (2006)61
Isokinetic torque Flexion and extension in sitting and semi sitting. (Strength testing: 10 reps each, ROM from 20° hyperextension to 50° flexion or 70° overall, 1-3 min rest between tests at different speeds. Movement speeds for concentric strength testing at 60, 90 and 120°/s in both groups).
Spinal flexors and extensors 1) Peak torque (N.m) & normalized peak torque (N.m/kg) 2) Time to peak torque (ms) 3) Deceleration time (ms)
Peak Torque in extension at 60O/s in semi-sitting entered a discriminating function to identify Scoli-0-30o 132.4 ± 32.2 and Scoli-31-60O 160.2 ±50.6 Time to peak torque differed only for extension in sitting at 90o/s between Scoli-0-30o 14.4 ± 2.2 and Scoli 31-60O 15.7 ± 2.2 p=0.041 (other means not reported.) Time to peak torque discriminated between Scoliosis curve size: for extension at 60O/s in semi-sitting Scoli-0-30O 478.1 ± 134.6 vs Scoli-30-60O 394.4 ± 159.8. For extension at 90O/s in sitting Scoli-0-30O 228.9 ± 102.7 vs Scoli-30-60O 332.2 ± 178.9. Time to peak torque discriminated between Scoliosis location: for flexion at 60O/s in sitting Scoli-Th 264.0 ± 77.6 vs Scoli-ThL 233.0 ± 63.3. For extension at 60O/s in sitting Scoli-Th 307.2 ± 121.7 vs Scoli-ThL 388.0 ± 176.7. Time to peak torque discriminated between Scoliosis curve location: for extension at 120O/s in sitting Scoli-Th 150.0 ± 15.0 vs Scoli-ThL 137.0 ± 17.0. Deceleration time differed only for extension in sitting at 120o/s between Scoli-Th 150.0 ± 15.0 and Scoli- ThL 137.0 ± 17.0 p=0.033; and flexion at 60o/s in sitting Scoli-Th 69.6 ± 20.1 and Scoli- ThL 87.0 ± 13.4 p=0.017 (other means not reported.)
Cheung et al (2006) 55
EMG activity Standing upright in a relaxed posture, with arms along the body and feet together (unspecified duration)
Erector spinae bilaterally at UEV, apex, and LEV Convex/concave EMG activity ratio (measured
Axial rotation of the vertebrae at the UEV decreases with increasing EMG ratio at the LEV. Spearman rho=-0.268 p=0.03 Correlations between axial rotation and EMG ratio at the UEV (rho =-0.166 p=0.17) or apex (rho= -0.106 p=0.38) were not significant.
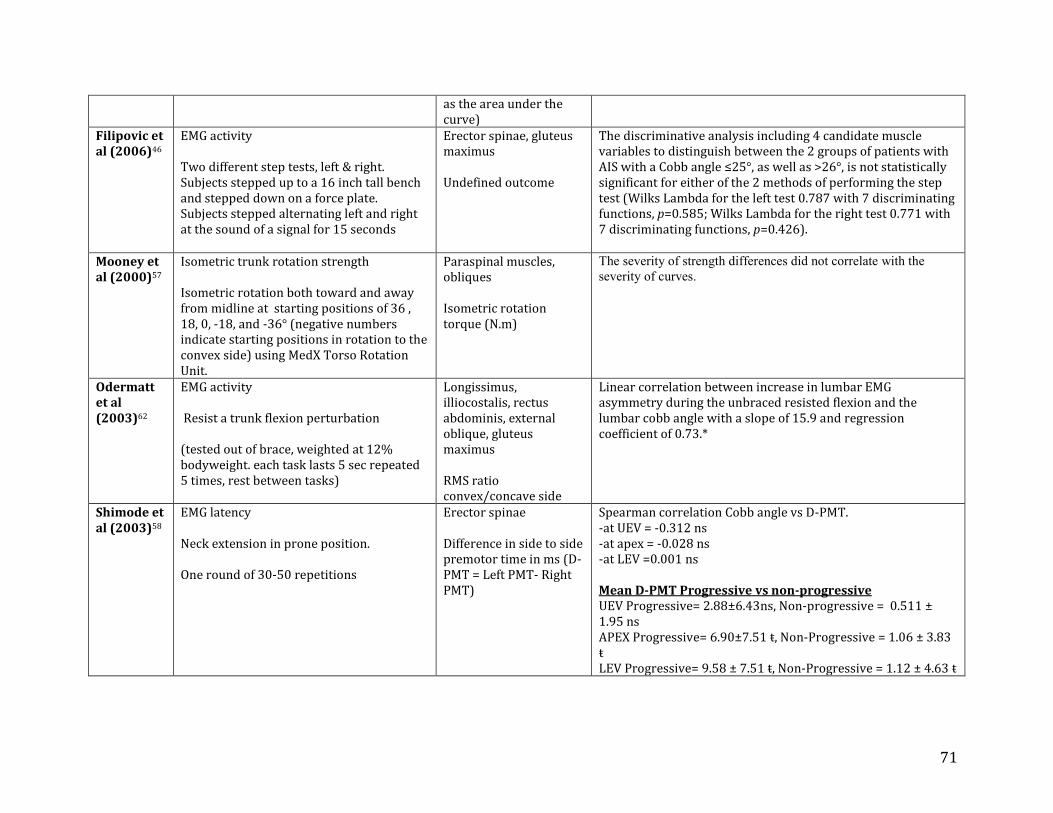
71
as the area under the curve)
Filipovic et al (2006)46
EMG activity Two different step tests, left & right. Subjects stepped up to a 16 inch tall bench and stepped down on a force plate. Subjects stepped alternating left and right at the sound of a signal for 15 seconds
Erector spinae, gluteus maximus Undefined outcome
The discriminative analysis including 4 candidate muscle variables to distinguish between the 2 groups of patients with AIS with a Cobb angle ≤25°, as well as >26°, is not statistically significant for either of the 2 methods of performing the step test (Wilks Lambda for the left test 0.787 with 7 discriminating functions, p=0.585; Wilks Lambda for the right test 0.771 with 7 discriminating functions, p=0.426).
Mooney et al (2000)57
Isometric trunk rotation strength Isometric rotation both toward and away from midline at starting positions of 36 , 18, 0, -18, and -36° (negative numbers indicate starting positions in rotation to the convex side) using MedX Torso Rotation Unit.
Paraspinal muscles, obliques Isometric rotation torque (N.m)
The severity of strength differences did not correlate with the
severity of curves.
Odermatt et al (2003)62
EMG activity Resist a trunk flexion perturbation (tested out of brace, weighted at 12% bodyweight. each task lasts 5 sec repeated 5 times, rest between tasks)
Longissimus, illiocostalis, rectus abdominis, external oblique, gluteus maximus RMS ratio convex/concave side
Linear correlation between increase in lumbar EMG asymmetry during the unbraced resisted flexion and the lumbar cobb angle with a slope of 15.9 and regression coefficient of 0.73.*
Shimode et al (2003)58
EMG latency Neck extension in prone position. One round of 30-50 repetitions
Erector spinae Difference in side to side premotor time in ms (D-PMT = Left PMT- Right PMT)
Spearman correlation Cobb angle vs D-PMT. -at UEV = -0.312 ns -at apex = -0.028 ns -at LEV =0.001 ns Mean D-PMT Progressive vs non-progressive UEV Progressive= 2.88±6.43ns, Non-progressive = 0.511 ± 1.95 ns APEX Progressive= 6.90±7.51 ŧ, Non-Progressive = 1.06 ± 3.83 ŧ LEV Progressive= 9.58 ± 7.51 ŧ, Non-Progressive = 1.12 ± 4.63 ŧ
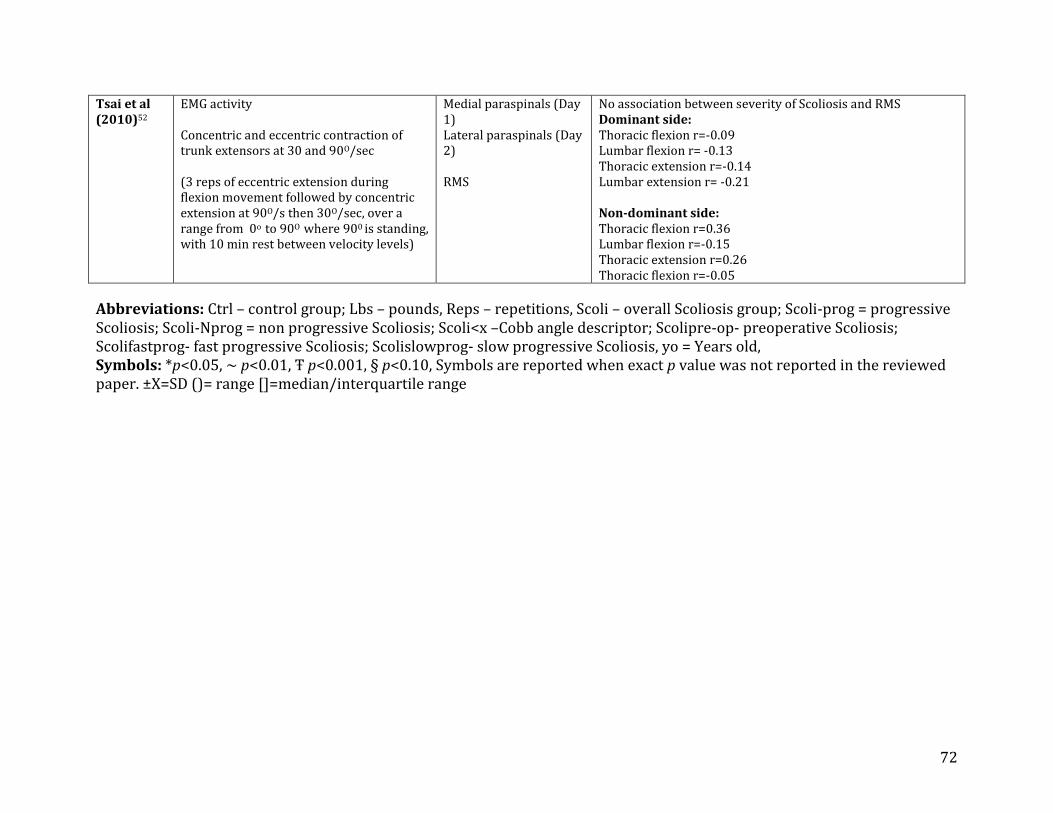
72
Tsai et al (2010)52
EMG activity Concentric and eccentric contraction of trunk extensors at 30 and 90O/sec (3 reps of eccentric extension during flexion movement followed by concentric extension at 90O/s then 30O/sec, over a range from 0o to 90O where 900 is standing, with 10 min rest between velocity levels)
Medial paraspinals (Day 1) Lateral paraspinals (Day 2) RMS
No association between severity of Scoliosis and RMS Dominant side: Thoracic flexion r=-0.09 Lumbar flexion r= -0.13 Thoracic extension r=-0.14 Lumbar extension r= -0.21 Non-dominant side: Thoracic flexion r=0.36 Lumbar flexion r=-0.15 Thoracic extension r=0.26 Thoracic flexion r=-0.05
Abbreviations: Ctrl – control group; Lbs – pounds, Reps – repetitions, Scoli – overall Scoliosis group; Scoli-prog = progressive Scoliosis; Scoli-Nprog = non progressive Scoliosis; Scoli<x –Cobb angle descriptor; Scolipre-op- preoperative Scoliosis; Scolifastprog- fast progressive Scoliosis; Scolislowprog- slow progressive Scoliosis, yo = Years old, Symbols: *p<0.05, ~ p<0.01, Ŧ p<0.001, § p<0.10, Symbols are reported when exact p value was not reported in the reviewed paper. ±X=SD ()= range []=median/interquartile range

73
Table 2.11 Description of the tasks and measurements used to test muscle function for each study included in the review to determine the associations between muscle properties and curve progression
Study Measurement and task Muscle groups & outcome The associations between muscle properties and curve progression
Cheung et al (2004) 54
EMG activity Standing upright in a relaxed posture, with arms along the body and feet together (unspecified duration)
Erector spinae bilaterally at UEV, apex, and LEV Convex/concave EMG activity ratio
Scoli-Nprog: UEV: 0.96 (0.81:1.15) APEX: 1.30 (1.10:1.54)* LEV1.09 (0.93:1.26) Significant asymmetry only at apex Scoli-Prog: UEV: 1.47 (1.08:2.00)* APEX: 1.94 (1.46:2.57)* LEV: 2.23 (1.60:3.11)* Significant asymmetry at all levels Significant difference between Prog vs Nprog curves at all levels. The EMG ratio at the LEV at the start of the period was significantly associated with progression (r = 0.371ŧ). Multiple Regression with a standard error 4.4O predicted change in Cobb angle ° = -0.882 + 1.177*ln (spinal growth velocity) + 2.403*ln (EMG ratio at LEV). Using ROC curve analysis, a cutoff point for the EMG ratio at the LEV of 1.25 yielded an equal sensitivity and specificity of 68.9%. A cutoff point for the EMG ratio of 0.79 showed a sensitivity of 95% but only 28.0% accuracy. A specificity of 95% could be achieved at a cutoff point for an EMG ratio of 2.91 with an accuracy of 82.1%. ROC data was used to create a nomogram to demonstrate the ability of spinal growth velocity (SGV) and EMG ratio to establish the probability of progression over the next 4-5 months. EMG Ratio <0.8 SGV<8mm/yr=0% SGV 8-15mm/yr=0% SGV>15mm/yr=0% EMG Ratio 0.8-2.0 SGV<8mm/yr=0% SGV 8-15mm/yr=20% SGV>15mm/yr=43% EMG Ratio>2

74
SGV<8mm/yr=0% SGV 8-15mm/yr=60% SGV>15mm/yr=89% (sensitivity and specificity: 79.1%)
Cheung et al (2005) 34
EMG activity 1) lying supine head straight, feet alongside the body, 2) sitting relaxed with hands on lap feet on ground 3) standing relaxed arms at side feet together
Erector spinae bilaterally at UEV, Apex, and LEV Convex/concave activity ratio (of absolute summated EMG amplitude of the total recording time.)
NProg curves have higher ratios than Prog at the apex supine. (p=0.021) Prog curves have higher ratios than NProg curves for LEV supine (p=0.009), sitting (p=0.003) and standing (p<0.001). Prog curves have higher ratios than Nprog curves at the UEV in standing (p= 0.007). (see means reported under objective 3 in table 3) Larger convex/ concave EMG ratios at the LEV in the sitting posture correlated with greater change in Cobb angle. (correlation estimates not reported)
Dobosiewicz et al (1997)44
EMG latency Standing on a box with a trapdoor allowing the box to tilt 8 ° to either side. (4 times on each side. 30 seconds between recordings)
Paraspinal muscles EMG latency (time from stimulus to the unloading reflex response in ms) Mean number of unloading reflex cycles
Mean latency of the unloading reflex at T8 Scoli-fastprog (73-94ms)* Scoli-slowprog (51-60ms)* Scoli-pelvtilt (41-50ms)~ Mean number of cycles Scoli-fastprog (1.5- 2.1 cycles) ~ Scoli-slowprog (3.0- 3.8 cycles) ~ Scolipelvtilt (4.2-4.7 cycles) ~ For both variables all groups were significantly different from Scoli-fastprog Changes in latency correlated with disease progression and not age. (correlation estimates not reported)
Shimode et al (2003)58
EMG latency Neck extension in prone position. One round of 30-50 repetitions
Erector spinae Difference in side to side premotor time in ms (D-PMT = Left PMT- Right PMT)
Correlation between D-PMT at LEV and progression Spearman correlation: Change of Cobb angle vs D-PMT. -at UEV rho = 0.212 ns -at apex rho = 0.219 ns -at LEV rho =0.432 p= 0.009 Mean D-PMT in Progressive vs non-progressive UEV : Progressive= 2.88±6.43ns, Non-progressive = 0.511 ± 1.95 ns APEX : Progressive= 6.90±7.51 ŧ, Non-Progressive = 1.06 ± 3.83 ŧ LEV : Progressive= 9.58 ± 7.51 ŧ, Non-Progressive = 1.12 ± 4.63 ŧ

75
Abbreviations: Ctrl – control group; Lbs – pounds, Reps – repetitions, Scoli – overall Scoliosis group; Scoli-prog = progressive Scoliosis; Scoli-Nprog = non progressive Scoliosis; Scoli<x –Cobb angle descriptor; Scolipre-op- preoperative Scoliosis; Scolifastprog- fast progressive Scoliosis; Scolislowprog- slow progressive Scoliosis, yo = Years old, Symbols: *p<0.05, ~ p<0.01, Ŧ p<0.001, § p<0.10, Symbols are reported when exact p value was not reported in the reviewed paper. ±X=SD ()= range []=median/interquartile range

76
Table 2.12 Results of quality assessment based on COSMIN criteria
Study 1 2 3 4 5 6 7 8 9 10
11
12
13
14
15
16
17
18
19
20
21
22
23
24
25
26
27
28
29
Total
Alexander et al (1978)
? - - ? ? ≠ + + - ? - - - - ≠ ≠ - - - ? ? ≠ + - + - - - - 4/25
Anwajler et al (2006)
+ - + + ? + + - - ? + - ? ? ≠ ≠ - ? ? ? + - - - - - - + - 8/27
Cheung et al (2004)
+ - + ? - ? + - + + - - - - + + - - - + + - - - - - - + + 11/29
Cheung et al (2004)
+ - - - - ≠ + + - + + + + - ≠ ≠ - - - + + - - - - - - + + 11/26
Cheung et al (2005)
- - - + - ≠ + - + + + + + - + + - ? ? + + - - - - - - + - 12/28
Dobosiewicz et al (22)
+ - - + - - + + - - - - - - - - - - - ? ? - - - - - - - - 4/29
Feibel et al (2002)
- - + ≠ - ≠ + - - - + - - - ≠ ≠ - - - + + ≠ - - - - - + - 6/24
Filipovic et al (2006)
- - - ? - ≠ + - ? - - + - - - - - - - ? ? ? - - - - - + + 4/28
Fuller et al (1991)
+ - + + ? + + - + - - - - - ≠ ≠ - ? ? + + ≠ - - - - ≠ + - 9/25
Gram et al (1999)
- - + ? - ≠ + - + - - - - - ≠ ≠ - - - + + - - - - - - + - 6/26
Mahaudens et al (2005)
- - - ≠ - ≠ + + - + ? - - - ≠ ≠ - - ≠ + + ≠ ≠ ≠ ≠ - - + - 6/20
Mahaudens et al (2009)
- - + + - ≠ + - + ? + + + - ≠ ≠ - - ≠ + + ≠ - - - + + + - 12/24
Mcintire et al (2010)
- ? + + - - + + - ? + + + - - - - ? ? ? ? - + + + + + + + 14/29
Mooney et al (2000)
? - - ? ? + - - - ? + - - - ≠ ≠ - - - + + + - - - - - + + 7/27
Odermatt et al (2003)
- - + + ? + + - + ? + - - - - - - ? ≠ ? + ≠ + - + - - + + 11/27
Shimode et al (2003)
+ + + + - ? + - + ? + + ? + ≠ ≠ - - - + + - + - - - - + + 14/27

77
de Oliveira et al (2011)
- - + + - + + - ? - + - - - ≠ ≠ - - - ≠ + ≠ - - - - - + - 7/25
Skrzek et al (2003)
? - + ≠ - ≠ + - - - - - - - ≠ ≠ - - - ≠ + ≠ - - - - - + + 5/23
Tsai et al (2010)
? - + + - ≠ + - - ? + + + - - - - ? - + + ≠ - - - - - + + 10/27
Zoabli et al (2007)
- - ? + ? + - - - + + + - - ? ? - ? ? ≠ + ≠ - - - - - + + 8/27
+ yes; - no; ? Unclear; ≠ Not applicable. Refer to table 1 for a listing of numbered criteria

78
Table 2.13 level of quality of EMG reporting based on the proportion of the ISEK criteria met
Study 1 2 3 4 5 6 7 8 9 Total score
EMG quality 50%
EMG quality 60%
EMG quality 80%
Alexander et al. (1978) + - - - + - - - - 2/9 Low Low Low Cheung et al. (2004) + + - - + + + + + 7/9 High High Low
Cheung et al. (2004) + + - - + + + + + 7/9 High High Low
Cheung et al. (2005) - + - + + + + + + 7/9 High High Low
Dobosiewicz et. al (2002) + - - - + - - - - 2/9 Low Low Low
Feipel et al (2002) + + + + + + + + + 9/9 High High High Gram et al. (1999) - - - - + - - - - 1/9 Low Low Low Mahaudens et al (2005) - - - - + + + + + 5/9 High Low Low Mahaudens et al (2009) - - - - + + + + + 5/9 High Low Low Odermatt et al (2003) - - - - + + + + + 5/9 High Low Low Shimode et al (2003) + - - + + - - - - 3/9 Low Low Low De Oliveira et al (2011) + + + + + - - + - 6/9 High High Low Tsai et al (2010) - + + + + - - + - 5/9 High Low Low *Refer to table 3 for list of ISEK Criteria corresponding to numbering + yes; - no
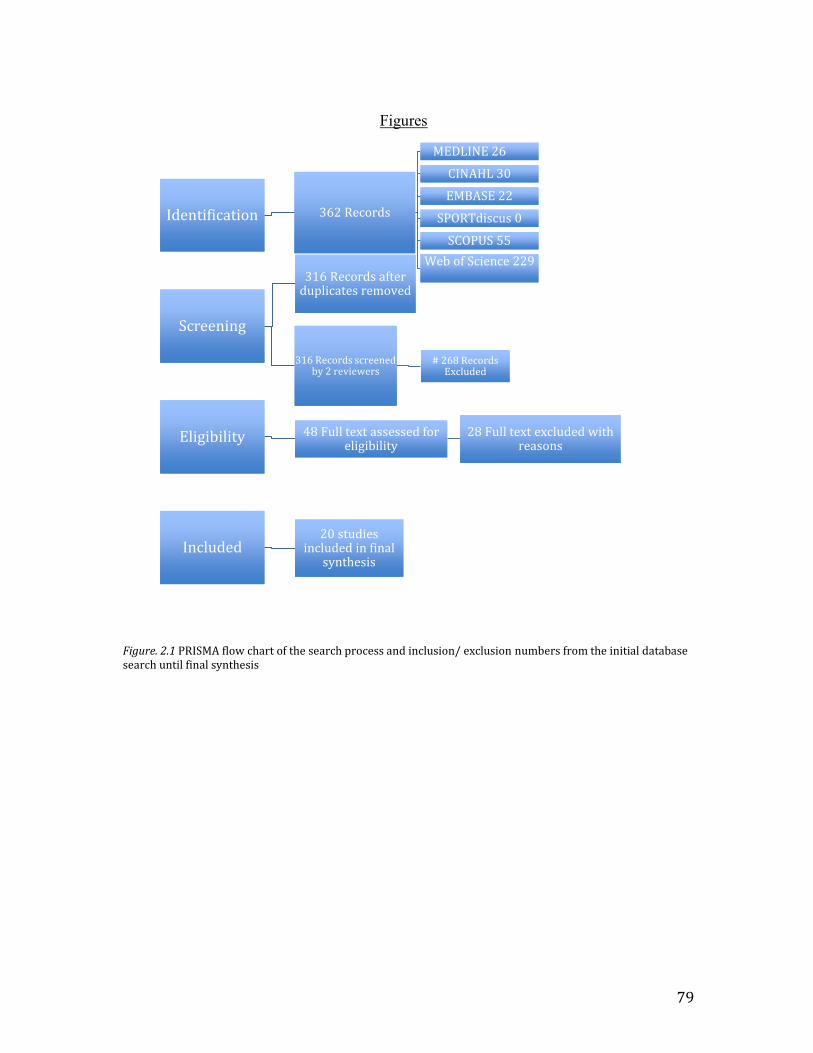
79
Figures
Identification
Identification
362 Records 362 Records
MEDLINE 26 MEDLINE 26
CINAHL 30 CINAHL 30
EMBASE 22 EMBASE 22
SPORTdiscus 0 SPORTdiscus 0
SCOPUS 55 SCOPUS 55
Web of Science 229
Web of Science 229
Screening Screening
316 Records after duplicates removed 316 Records after
duplicates removed
316 Records screened by 2 reviewers
316 Records screened by 2 reviewers
# 268 Records Excluded
# 268 Records Excluded
Eligibility Eligibility 48 Full text assessed for eligibility
48 Full text assessed for eligibility
28 Full text excluded with reasons
28 Full text excluded with reasons
Included Included 20 studies
included in final synthesis
20 studies included in final
synthesis
Figure. 2.1 PRISMA flow chart of the search process and inclusion/ exclusion numbers from the initial database search until final synthesis
80
Chapter 3:
EMG Measurement of the fatigability of paraspinal muscles of patients
with adolescent idiopathic scoliosis: A case-control study Richter, A.; Parent, E.; Roy, F.; Kawchuk, G.; Moreau, M.; Norton, J.;
Abstract
Introduction: Current exercise-based approaches to scoliosis management employ
approaches to improve the endurance characteristics of paraspinal muscles. Our systematic
literature review found no studies of paraspinal muscle endurance, however, a
histochemical difference implying decreased endurance specific fibre types was previously
reported on the curve concavity. This study aimed to determine differences in paraspinal
muscle fatigability between patients with scoliosis and controls, between sides and
between vertebral levels.
Methods: Adolescents with AIS treated non-operatively were recruited from a specialized
scoliosis clinic and matched for age, gender and recording levels with healthy volunteers
from the community. Subjects performed 3 'modified side planks' on both left and right
sides as well as a Sorensen test. Bipolar sEMG electrodes were placed on either side of the
spine at the upper end vertebrae(UEV), apex, and lower end vertebrae(LEV). The slope of
the median frequency of the EMG power spectrum was extracted. A group by task by side
by level repeated measures ANOVA was performed to detect differences in the average of
the closest 2 out 3 fatigue trials. A group by task ANOVA was performed to determine if
there were differences in trial duration between left and right planks and a t-test was
performed to determine if there were differences between Sorensen durations.
Results: Twenty-one participants with scoliosis (age: 13.8±1.6 years, 18 females Cobb
24.2±9.9, BMI 19.7±3.5kg/m2) were matched to control subjects (age 13.9±2.2 years,
BMI:20.7±3.3kg/m2). Fourteen subjects and controls also performed the Sorensen test. No
interactions involving groups were found significant; the main effect of task on trial length
was significant (longer on convex side in scoliosis and the corresponding right side in
controls p=0.02). For side plank median frequencies, controls demonstrated more fatigue
overall during planks compared to controls (p=0.046) and both groups demonstrated more
fatigue on convex (right) sided planks p=0.045 and more fatigue at the UEV (p=0.007). In

81
contrast, both groups demonstrated more fatigue at the LEV during the Sorensen test
compared to the UEV (p=0.015). Other effects did not reach significance.
Conclusions: While the hypothesized differences between patients and controls and
between sides of the curves were not found, this study provides pilot information for
future research by illustrating the variability resulting from heterogeneous curve types (13
double major, 5 triple major, 3 single curves) and severity (12-44°). Our sample size may
have been too small to detect differences given the heterogeneity in curve types and
recording levels in our sample. The tasks selected did not ensure as stable contraction and
did not provide feedback to the examiner or patient on strength of contraction output or
stability. As such it is unclear whether tasks elicited sufficient fatigue to detect differences.
Future work should aim to use a stable task and measure activity in possible compensatory
muscles in patients with scoliosis to understand their lower fatigability during side-planks.

82
Introduction:
Adolescent Idiopathic Scoliosis (AIS) is a 3-dimensional deformity of the spine
diagnosed between the age of 10 and the completion of growth.13
The cause of AIS is
unknown but possibilities range from genetic influences, hormonal imbalances, and
muscular imbalances.2 However, it is unknown whether these factors are causes or effects
of scoliosis.
Treatments for scoliosis within North America fall into one of three areas
depending on the curve severity (measured by the Cobb angle) and progression (degrees
of change in Cobb angle within a 6 month period). Adolescents with idiopathic scoliosis
are simply observed periodically until their curve reaches 25° at which point a brace is
prescribed. If progression continues and the curve reaches 45-50°, surgery is
recommended.2,13
Exercise approaches to scoliosis management exist, however, due to a
lack of scientific quality of this literature22,27
exercises have not made their way into
North American guidelines for scoliosis management.23
One of the struggles facing advocates of exercise-based approaches for scoliosis
is a lack of knowledge regarding the functional properties of paraspinal muscles and how
imbalances in these properties affect patients with idiopathic scoliosis. Regardless of
whether these imbalances are a cause or effect of the curvature, exercises should be
justified by a rationale such as targeting the correction of known imbalances. The lack of
knowledge on muscle functional properties makes it difficult to provide justification for
exercises prescription parameters.
Our systematic review summarized in the previous chapter identified 20 studies o
impairments related to the functional properties of paraspinal muscles. However, study
quality was poor. The literature review highlighted a gap in documenting endurance as a
functional property of paraspinal muscles in AIS. With such a gap there is poor
background literature guiding investigation of endurance as a functional property of
paraspinal muscles. Nevertheless, studying endurance is still important to understanding
AIS especially in light of multiple scoliosis-specific exercise interventions using
prescription parameters consistent with promoting endurance gains. The endurance
abilities of paraspinal muscles have only been investigated with EMG methods in one

83
study with less than 6 subjects. Endurance is relevant also because paraspinal muscles
require endurance in order to maintain spinal alignment throughout the day and as such
studying these muscles and their ability to perform their task is an important outcome to
consider. Further contributing to the priority of studying endurance properties, prior
research has identified imbalances in fiber type across the spine (decreased type 1 fibres),
suggesting a deficiency in endurance properties of paraspinal muscles and their ability to
maintain spinal alignment over a long period of time. In addition, McGill et al report that
paraspinal muscle endurance is a better marker of spinal stability than strength, a more
extensively studied outcome in the literature.33,76
To our knowledge scoliosis-specific
approaches do not state a rationale for their exercise parameters selection based on
muscle impairments.26
Nevertheless, an analysis of the prescription parameters used in
different scoliosis-specific approaches shows that in the pursuit of better spinal
alignment, postural muscles are challenged with high number of sets and repetitions are
submaximal intensities consistent with targeting endurance capabilities. Thus research on
scoliosis must explore whether a deficiency in muscular endurance exists in patients with
scoliosis, and, if so, verify if it is an important target for exercise interventions. We
postulate it is important due to the role of paraspinal musculature in maintaining
alignment, and prior research findings into fibre type imbalances. Recommending
exercise interventions before deficiencies have been confirmed and their manifestations
understood might be suboptimal as the selected exercise parameters cannot be guided by
documented muscle impairments.
Objectives
The aim of our study is to determine the differences in paraspinal muscle fatigability
between patients with adolescent idiopathic scoliosis and matched healthy controls as
measured by surface electromyography (sEMG) during side planks & the Sorensen test at
the vertebral levels corresponding to the apex, upper and lower endpoint of the scoliosis
curve on each side of the spine.
Based on fiber type research results on the paraspinals8, we hypothesized that paraspinal
muscles in patients will be generally more fatigable than controls and that the concave
side will be more fatigable than the convex side at all levels.

84
Methods Study design: A cross-sectional matched case-control study
Sample Size
Twenty-one adolescents with idiopathic scoliosis and 21 healthy controls were recruited
for this project. This sample size was estimated to allow sufficient power (0.8) to detect
an effect size of 0.6 for differences in fatigability (as measured by the slope of the median
frequency in the EMG signal) between concave and convex sides of the curve within the
patients with scoliosis using a bilateral hypothesis test and alpha level of 0.05. For
comparisons between matched groups (related), with 21 subjects per group, with power
of 0.80, an effect size of 0.60 could also be detected between patients and their matched
controls.
Subject characteristics
Consecutive patients meeting the following selection criteria who attended the
Edmonton Scoliosis Clinic were invited to participate. Participants with idiopathic
scoliosis between the ages of 10 and 18 years old, with any scoliosis curve pattern and
Cobb angles between 10O and 50
o were included. Subjects having completed a scoliosis-
specific exercise program, for whom surgery had been recommended, or those who had
prior surgery were excluded. These selection criteria are consistent with patients eligible
for scoliosis-specific exercises.77
Consecutive healthy teenage volunteers were matched to patients for age (±2
years), gender, and body mass index (BMI ± 5kg/m2). Healthy subjects were excluded if
they presented with back pain (>2 pts on NPRS), leg length discrepancies (>2.5 cm),
prior torso or lower extremity surgeries, contractures (>15o), or a positive Adam’s
forward bending test (scoliometer>7o). Any subject with low back pain due to a spinal
fracture, tumor, infection, or signs of cauda equina compression; or pregnancy was
excluded as these factors would affect the generalizability of the results.
Subject recruitment

85
Volunteers with AIS were recruited consecutively from the Edmonton Scoliosis Clinic by
a research coordinator explaining the study to all eligible participants. Control volunteers
were recruited consecutively from mailings to large local companies, local schools, as
well as from posters and e-mailings on and nearby the University of Alberta campus.
Patients with scoliosis participating in the trial were asked to invite friends without
scoliosis to participate. The local health research ethics board approved the study.
Informed consent was obtained from participants over 14 years old. Subjects under 14
signed an assent form while their parents signed a parental consent form.
Protocol
Volunteers attended one testing session. Both controls and volunteers with scoliosis were
tested using the same protocol. Subjects first filled out questionnaires and underwent a
physical examination to confirm eligibility. EMG electrode placement sites, identified by
locating the vertebral level of the apex, upper and lower endpoints on recent radiographs
from patients with AIS, were then located using ultrasound for both the patient and their
matched control. EMG electrodes were placed on both sides of the spine at the identified
levels corresponding to the curve apex, lower, and upper end vertebrae. Patients were
instructed on proper execution while performing a 10 second modified beginner’s side
plank to warm up. After the warm-up, patients performed a modified beginner’s side
plank38
(Fig. 1) on the left side.
Patients rested for 1 minute between trials. After three trials were performed on the left
side, patients rested for 5 minutes before performing another three side planks on the
right side. Continuous EMG recordings were taken as the plank position was maintained
as long as the participants tolerated or until the patient had been instructed to correct their
body positioning on two occasions. If a participant was able to maintain the plank
position for 3 minutes, fatigue was assumed to be present and the test was ended. After
completing the 3 side planks on each side, subjects rested for 5 minutes to allow muscles
to recover from the side plank protocol. After 5 minutes, muscle recovery was assumed.
Subjects were instructed on the Sorensen test (Fig. 2) and body position. Their legs were
secured to the bed in two locations, on the thigh below the buttocks and on the calf

86
muscles. Subjects were instructed to perform a 5 second practice hold to familiarize
themselves with the movement. Subjects then held the Sorensen position for as long as
they could. Subjects were reminded to maintain body positioning if their body dropped
below parallel. If they were instructed to correct their positioning twice or they exceeded
4 minutes, fatigue was assumed to be present and the test was terminated. Subjects only
performed the Sorensen test once.
Questionnaires
Physical Activity
Subjects reported their physical activity levels by filling out the 3-day physical activity
recall (3DPAR) questionnaire. This questionnaire consists of listing which physical
activities out of 55 possible activities participants engaged in primarily for each period of
30 minutes over the course of the last 3 days along with a specification of whether each
of the listed activity was deemed light, moderate, or vigorous. The 3DPAR score is based
on Metabolic Equivalent (MET) scores.78
MET scores were determined based off of
previous research exploring quantifying the kcal/kg expended during the listed physical
activity in the 3DPAR.79
Results were analyzed by averaging the number of 30 min
blocks of activities rated at 3 METs or more (moderate to vigorous) over the 3 reported
days, as well as, the total METs per day averaged over the 3 days. The 3DPAR results
were used to explore any differences in physical activity levels between groups.
Quality of life
The Scoliosis Research Society questionnaire (SRS-22r), containing 22 questions relating
to scoliosis related quality of life, was also filled out by each participant. Questions focus
on 5 domains: pain, self-image, mental health, function with 5 questions each and
satisfaction with treatment (2 questions). The SRS-22r has good test-retest reliability
(ICC 0.95-0.85), internal consistency (Cronbachs α = 0.92 to 0.75) and concurrent
validity with the SF-36 (≥0.70 P < 0.0001).80
The total score and the function domain
score were used to describe our sample.

87
Pain
A numeric pain rating scale (NPRS) from 0-10 was used together with a pain diagram for
subjects to report pain intensity and location.81
This helped confirm eligibility and
describing the participants’ pain.
Physical Assessment
A physical examination was performed to describe the participants, determine
eligibility and the safety of participation. Measurements included scoliometer
measurements82
, Schroth curve type assessment83
, pain-free range of motion assessments
of the shoulders (ensuring minimum abduction to 90°), elbows, (flexion to 90°), lower
extremities (full squat), spine (full flexion and extension) as well as an assessment of
pain-free side-bending. Scoliometer measurements were obtained by asking patients to
bend forward with their arms stretched forward with palms pressed together while
keeping the legs straight. The scoliometer (an angle measurement tool) is placed across
the back to determine the extremes of rotations to each side at the most prominent points
on either side of the spine during the test.82
Patients also demonstrated the ability to
maintain the side plank position without shoulder or arm pain (no exclusions). The
Schroth scoliosis curve type83
was determined to explore whether results may be curve
type specific to provide pilot information for a follow-up study.
EMG Assessment
EMG Set-Up
Ag/AgCl surface electrodes (Vermed A10040-60) with an active diameter of 10mm were
placed at the upper and lower endpoints of the curve, as well as, at the apex of the curve
on both sides of the spine. Skin was prepared by rubbing the site with an alcohol swab
and electrodes were placed after alcohol had vaporized from the skin as per SENIAM
guidelines.84
Hair was shaved if present on the placement site. Electrodes were placed on
the erector spinae muscles as well as on the medial deltoid muscle with an inter-electrode
distance of 20mm. Electrode placement was determined as per SENIAM guidelines.84
Placement on the medial deltoid muscle was in line with the acromion and lateral
epicondyle of the elbow on the bulge of the deltoid muscle.

88
The levels of the apex, upper, and lower end vertebrae measured from the latest
out of brace radiograph were extracted from the scoliosis clinic database and used to
determine electrode placement levels for the volunteer with scoliosis and their matched
control. The electrodes were placed 2cm lateral from the spinous process of these
vertebrae. These levels were located using ultrasound imaging before placing electrodes.
A Sonosite M-Turbo ultrasound imager was used in B-mode to locate vertebra levels. A
2-5MHz curvilinear probe was oriented parasagittally over the lumbar spine with the
sacrum in view. The probe was then moved superiorly while counting vertebrae until
each of the three target levels (LEV, Apex, UEV) were reached. These transitional levels
of the curve were marked on patients and their respective matched controls. A reference
electrode was placed on the middle third of the left clavicle. Girls were tested wearing a
bikini top. Boys were tested with their shirt off for the duration of the study.
Fatiguing task
Participants were positioned in a side lying position. Each participant first performed
three modified beginners side plank (Fig. 1) on their left side with their legs bent and
body weight resting on their knees with a 1 minute rest in between each plank.38
Patient’s
thighs and torso were elevated until torso and thighs formed a straight line while resting
on their elbow flexed to 90O. The non-weight-bearing arm was placed across the subject’s
chest with the hand resting on the weight-bearing shoulder. Subjects were instructed to
perform the side plank for as long as possible or until up to the 180 seconds limit stated
earlier. Normative values for left and right side planks are 83.4-104.1 seconds for men
and 55.2-75.1 seconds for women, respectively.33
Proper body position was determined
using an adjustable tennis ball suspended from the ceiling. Proper positioning was
indicated when the patient’s hip was in contact with the tennis ball. The first time
patients deviated from the target position patients were reminded to keep their body
aligned. The test was terminated after the second ‘deviation.’ Subjects rested for 5
minutes after which they were asked to perform another three side planks on the opposite
side following the same protocol for termination as above. A 60 seconds rest was taken
between each trial. Patients with scoliosis and their matched controls completed the side
plank tests in the same order.
89
After completing the side planks, patients rested for 5 minutes and performed the
Sorensen test. The Sorensen test was added after we noted a lack of fatigue in a
preliminary analysis of our side plank data in the initial group of subjects with scoliosis.
We then added the Sorensen as a stable task directly challenging the paraspinal
muscles.85
Only one Sorensen test was performed. Subjects were asked to stop the
Sorensen testing once they deviated from the correct body alignment on two occasions or
they maintained the position for 4 minutes.
Data Processing
The EMG signals for all 8 sites were amplified 5000×, low pass filtered at 1kHz
and high pass filtered at 10Hz (Grass Model P511) before being digitized at 4000 Hz and
stored to computer using an analog–digital converter (BNC 2090, National Instruments)
using Labview 8.2 software. Raw sEMG signal were monitored in real time to ensure an
appropriate signal quality during acquisition. The EMG data was analyzed within the
Matlab programming environment using custom written software. The first 5 seconds of
the recording were discarded to control for movement artefact while subjects adopted the
test position and immediately before the spike of activity corresponding to when they let
go of the side plank (fig 3).
The power spectrum was calculated using the fast Fourier transform. Temporal
changes to the power spectrum were characterized using a 1.5 second sliding window
(6000 points) which provided 83% overlap (5000 points) between consecutive windows.
The median frequency was calculated from each window. These median frequency
estimates were plotted against time and the slope of the median frequency was estimated
using linear regression.
Once the median frequency slope data was extracted for each trial, the slopes of the best
2 out of 3 fatiguing trials were averaged. The best two trials were identified by finding
the closest 2 slopes out of the 3 trials. Data from left and right planks as well as the
Sorensen test were recoded as concave or convex to ensure that fatigue measurement was
associated with side relative to the curve characteristics in all subjects regardless of curve
direction. A side plank was deemed performed on the convex side when during the

90
performance the convex side was closest to the table. For healthy subjects, the right side
was always considered to be the convex side. No averaging was done for the Sorensen as
subjects only performed one trial.
Statistical Analysis
Descriptive statistics were used to report the characteristics of both groups of subjects.
A group (control vs patients) by task (convex vs concave plank) by recording side
(convex vs concave) by site (apex, upper and lower curve endpoints) mixed model
ANOVA was performed to quantify differences in EMG indicators of fatigue. Bonferoni
post hoc tests were planned as needed. All factors were considered dependent including
groups because subjects were matched in this study.
Further, a group by side by task mixed-model ANOVA was used to quantify differences
in indicators of deltoid muscle fatigue and another analysis was used to compare holding
times between the two side planks.
A group (control vs patients) by recording side (convex vs concave) by site (apex, upper
and lower curve endpoints) mixed model ANOVA was performed to quantify differences
in EMG indicators of fatigue during the Sorensen test. Bonferoni post hoc tests were
planned as needed. A paired T-test was used to compare the Sorensen holding times
between the groups.
Spearman Rank Correlation tests were performed to determine the association between
SRS-22 function scores and time to fatigue.
Results Forty-two subjects were recruited for this study. The groups consisted of 21 patients and
21 controls. Both groups consisted of 3 males and 18 females. The control group’s age
(13.9 ± 2.2 yo) was closely matched to that of the scoliosis group (age 13.8 ± 1.6 yo). In
the scoliosis group, the mean Cobb angle was 24.2±9.9° and ranged from 12o to 44°. In
controls, the mean Body Mass Index (BMI = weight(kg)/(height(m))2) was 19.7
±
3.5kg/m2 which is similar to 20.7 ± 3.3kg/m
2 in the scoliosis group. The demographic
information is presented in table 1.

91
Curve Type
Only two out of the 21 participants with scoliosis had left thoracic convex curves.
Thirteen subjects had double major curves, three had triple major curves, and five had
single right thoracic curves. The most common spinal upper end vertebral level tested
was T6, T8 for the apex, and T12 for the lower end vertebrae. Schroth curve
classifications yielded 15 subjects who were classified as 3c, 2 as 3cp, and 3 as 4cp.
Questionnaires
SRS-22 function domains scores were high in both groups (control=4.89±0.20 Scoliosis=
4.66±0.38 out of 5). Total SRS-22 Scores were high as well (Control = 4.66 ± 0.03
Scoliosis = 4.30 ± 0.51). Pain levels were low in both groups (Scoliosis= 0.84 ± 1.06,
Control = 0.27 ± 0.43). The 3DPAR physical activity questionnaires demonstrated
consistent results between groups. The control group had a mean MET score of 1.85
±0.21 METS per day with an average of 3.72 ± 1.65 30min blocks of activities per day at
over 3 METS. The scoliosis group had a mean MET score of 1.89 ± 0.31 METS per day
with 3.61 ± 1.98 30min blocks of activities per day at over 3 METS (Table 1).
Task length
Side Plank
The group by task interaction was not statistically significant (p=0.58). The difference
between groups in holding time was also not statistically significant (main effect of group
p=0.114). However, a significant difference was found between plank holding time in
both groups with a greater holding time on the convex side (58.9 ± 4.3sec) than on the
concave side (50.5 ± 4.3 sec) (p=0.02).
Sorensen
Only 14 participants with scoliosis performed the Sorensen test, and their 14 matched
controls were included in the analysis. The difference in holding times between groups
did not reach significance (p=0.52). The control group trial length was 108.79 ± 50.79 sec
and the Scoliosis group trial length was 91.36 ± 66.8 sec.

92
Fatigue analysis
Side Plank
The mean median frequency slopes indicating paraspinal fatigue estimated for each
group, each side plank task at all the levels on each side of the spine are reported in Table
3. Results of the group by task by side by levels mixed model ANOVA for the side plank
fatigue analysis are presented in Table 4. There were no significant interactions. All the
main effects were significant (group p=0.046 task p=0.045, level p=0.007) with the
exception of side (p=0.816). The control group expressed more fatigue overall (MDF
slope -0.114) than the scoliosis group (-0.019), the concave plank elicited significantly
more fatigue than the convex plank in all groups at all levels (concave: -0.110 vs convex:
-0.023), and the upper end vertebrae presented significantly more fatigue than the lower
end vertebrae (UEV= -0.166 APEX=-0.048 LEV= .015). Other pairwise differences
between levels were not significant.
Shoulder fatigue
A significant effect for the shoulder fatigue measurement was only observed for the
interaction between task and side p=0.036 and not for the other main effects (p>0.365) or
interactions(p>0.293). Significantly more fatigue was observed for the shoulder on the
concave side when performing the thoracic concave plank compared to the thoracic
convex shoulder. Means and standard deviation of the median frequency slopes at the
shoulder in both groups during both tasks can be found in table 3.
Sorensen test
The mean median frequency slopes for each group, side and levels tested during the
Sorensen test are reported in Table 5. No significant interactions were present for the
fatigue mixed model ANOVA for the Sorensen test (p>0.112).(Table 4) The main effects
for group and side were also not significant (p>0.350). However, the main effect of level
was significant, demonstrating significantly larger fatigue at the lower end (-0.368 CI= -

93
0.497 to -0.239)) compared to upper end vertebrae (-0.109 CI = -0.227 to 0.060)
p<0.05.(Table 4)
Correlation
In patients with AIS, the Spearman’s rank correlation coefficients between SRS-22
function scores and each task length for Sorensen or the Plank tasks were not statistically
significant (Table 6).
Discussion Summary of whether hypotheses are supported.
Holding times:
Contrary to our hypothesis about task duration, no significant differences were
observed between groups for the Sorensen test or the side planks. However, a significant
difference in holding time was observed between side planks with prolonged holding
times on the convex side plank in both groups. Since all but two curves were right
thoracic curves and subjects were able to hold for longer when their right side (controls)
or convex side (scoliosis) faced down during the plank. The longer hold times may be
attributable to side dominance rather than curve characteristics. It may be important to
account for side dominance in future comparisons of fatigability between sides.
In this small pilot sample, controls had over 8 sec or 14% longer average side
planks holding times, however this difference did not reach statistical significance
possibly because of the relatively high variability observed among our control subjects.
The Sorensen holding times noted in our groups were shorter than the means in other
studies employing the Sorensen test.33,86
Dejanovic et al found a range of 163 to 185
second for mean Sorensen holding times for male adolescents and 147 to 227 seconds in
female adolescents. For left side bridges (concave side in right sided thoracic curves)
mean values ranged from 80.7 to 102.4 seconds for males and 55.7 to 73.5 seconds for
females. For right side bridges (convex side in right sided thoracic curves) mean values
ranged from 83.4 to 104.1 seconds for males and 55.2 to 75.1 seconds for females.33
The
side planks we used were beginner side planks that we felt were more stable than the
94
regular side bridge. Therefore, while similar mean holding times were obtained, in fact,
the subjects in our study performed poorly compared to the mean time for the more
difficult task. The subjects in our study performed poorly in both the Sorensen and side
plank task when compared to normative values.
Paraspinal Fatigability
We hypothesized that there would be significant fatigue differences between
groups based on earlier fiber type research suggesting that patients with scoliosis would
demonstrate more fatigue overall and more pronounced fatigue on the side of the curve
concavity.8 The link between median frequency measurement of fatigue and fibre type
can be understood through the underlying causes of neuromuscular fatigue. A number of
potential reasons for fatigue exist, ranging from increased lactate concentration within the
muscle fibres decreasing the overall pH as well as decreased blood flow and thus
decreased oxygen delivery to the muscle.87
Both these factors affect the efficiency of
energy systems and channels within the muscle fibre leading to a decreased conduction
velocity.87
This affects the shape of the waveforms measured by EMG, lowering the
median frequency of the signal measured by EMG.87
Other explanations for the decreases
seen in median frequency are the remaining activity of slow motor units as the fast twitch
units are shut off as well as a potential change in the time synchronization in the activity
of motor units.87
Some muscle fibre types are specialized to withstand the effects of
muscle fatigue (with more efficient energy systems) and thus different fiber types can
tolerate increased lactate concentration and decreased oxygen delivery before conduction
velocity is affected. These fibre types are commonly found in muscles that maintain
prolonged contractions, such as the paraspinal muscles. Thus the documented decrease in
type I fibres should be associated with a marked decrease in endurance measured by
EMG.
Main effects for group, task and level factors but not side were significant for the
side plank tasks. However, contrary to expectations, the scoliosis group demonstrated less
fatigue in the paraspinals than the control group. This may suggest that the scoliosis
group uses a different recruitment strategy involving compensatory muscle activations
involving muscles such as the obliques, trasverse abdominis, or intercostal muscles to

95
maintain alignment during the side plank. The need to monitor this potentially
compensatory muscles in the future is highlighted in Mooney et al’s findings of elevated
EMG activity in the oblique muscles in patients with scoliosis when compared to
controls.57
Another hypothesis was not supported, as we did not observe more fatigue in
muscles on the concave sites in the group with scoliosis than in controls. However, as
expected, more fatigability was observed during the plank performed with the concave
side (left side in controls) facing down. We did not expect to record a difference in
fatigability between tasks in controls but they also exhibited more fatigue when doing the
side plank on their left side (corresponding to the concave side in scoliosis). As
suggested, to explain holding time differences, we may need to consider upper limb
dominance or control for participation in asymmetric physical activities in future studies.
In addition, overall (for both groups, planks and sides) significant differences
between levels were observed during the side planks with the strongest expression of
fatigue at the upper end vertebrae compared to the lower end vertebrae. This may be due
to the activity in the multiple layers of muscles at the upper end vertebrae (trapezius and
rhomboids) working to maintain scapular stability during these tasks.
Contrary to our expectations, we did not observe any significant interactions,
main effect of group or a main effect of recording side during the Sorensen test. We
expected a difference between levels but with difference between groups. The lack of
significant interactions noted in our study may be due to the pilot nature of this analysis
which included only 14 matched pairs of subjects and a heterogeneous group of scoliosis
curves. For muscles on the convex side (right side for controls) of the spine the
differences in point estimates at all levels were not statistically significant and also
clinically insignificant between patients and controls (effect size <0.12). However, on the
concave side, although differences did not reach statistical significance, patients with
scoliosis compared to controls exhibited more fatigability at the apex level (effect size =
0.57) and less fatigability at the UEV (effect size = 0.48). These differences may not have
reached statistical significance due to the high variability seen among curve types and
severity in the scoliosis group and among controls when using only one repetition of the
Sorensen test to estimate fatigue.

96
Additional comparisons may reach statistical significance if our sample size was
increased. Smaller effect sizes than this study was powered to detect may be considered
clinically important. The 21 subjects per group powers this study to detect moderate
Cohen’s d effects sizes of 0.66 for paired subject comparisons. Only effect sizes
exceeding 0.81 could be detected as statistically significant with 14 paired subjects. The
observed effect size may become significant with a larger sample size and with efforts to
reduce the sample variability. Variability can be reduced by selecting more stable tasks,
averaging multiple trials, and forming subgroups more homogenous for curve types and
recording sites. While groups were matched for age, BMI, and measurement location,
there may also be differences between groups based on their sport specific training, limb
dominance and activity levels. A subject who regularly engages in a sport activating
paraspinal muscles may exhibit performance differences when compared to another
active subject whose sports participation does not activate the paraspinal muscles to the
same extent. This distinction is not possible when using the 3D PAR to document
physical activity levels.88
The literature sparsely reports fatigue characteristics of paraspinal muscles. In our
review of the literature, two studies measuring endurance properties were reviewed. One
was excluded as the sample size was too small (n=6), the other measured endurance
through the use of isokinetic measurement rather than EMG. Gaudreault et al found no
fatigue differences in the slopes of the median frequency between scoliosis and
controls.72
However, with such a small sample size it is difficult to draw conclusions
from this paper. The other paper examined the endurance of paraspinal muscles during
isokinetic tasks, however no comparison was done with controls. Patients with scoliosis
performed similarly on strength tests (10 reps at 120°/sec) and the endurance test (20 reps
at 120°/s). These differences were not tested statistically.51
Population
Both patients with AIS and controls scored highly on function scores in the SRS-
22 measurement and on their physical activity levels. The literature on the 3DPAR
recommends interpreting a daily METS output of more than 2 as meeting physical
activity standards. Both groups expended a mean of more than 3 METS per day. Thus

97
both groups exceeded minimal requirements for physical activity by more than 1 MET
and can be considered physically active samples.89,90
It is not possible to say exactly,
however, how being more physically active affects muscular fatigue outcomes as the
activity type may make a difference in muscular recruitment and activation. Other studies
using the SRS-22 in patients with scoliosis treated non-surgically have also found high
level of function.22,91,92
In the future, it would be relevant to separately document the
level of physical activity participation for activities providing endurance challenges to the
spinal muscles and activities that don’t. Stratifying the sampling to ensure adequate
representation of patients within different physical activity level strata may be of interest.
Task selection
We had initially chosen the side plank as our measurement task, as we wanted a
task hat would unilaterally challenge the paraspinal muscles. We postulated that a
unilateral challenge would demonstrate deficits in the paraspinal musculature based on
the finding of Mooney et al who found asymmetries between left and right rotation
efforts.57
This postulate was also based on the fact that scoliosis-specific exercise
programs aiming to limit curvature progression, such as the Schroth approach, teach
asymmetric corrections in the frontal and transverse planes.26
After analyzing a sample of
the first 10 scoliosis patients in the present study, we determined that the side plank task
did not elicit the anticipated levels of paraspinal fatigue measurements. Subjects needed
to constantly reposition themselves to maintain the side plank and had to be reminded to
maintain adequate body position regularly. Fatigue was apparent in shoulder muscles as
measured by median frequency slopes but not in paraspinal muscles. This suggests
deltoid muscle fatigue may limit our ability to detect paraspinal muscle fatigue in patients
using the side plank task. In future research on paraspinal muscle fatigability to
understand whether patients with scoliosis rely on compensatory muscles to perform side
bending tasks we recommend recording EMG from possible compensatory muscles such
as gluteus muscles, quadratus lumborum, abdominal obliques, intercostals, and transverse
and rectus abdominal muscles. Unfortunately, the depth of some of these muscles
requires invasive needle EMG recordings. The need for position correction introduced
variability in the EMG measurements of the paraspinals. In addition, possibly due to the

98
lack of familiarity with the side plank, some subjects took longer to reach a stable
position at the onset of the task and would return to a side lying position without warning
when they felt they could not continue. Thus, the examiners had to determine task
initiation and termination cutoff times when performing EMG analysis based on
detecting and excluding the initial and final activity spikes in the raw EMG signal
corresponding to the repositioning efforts. In our systematic review of the literature we
were unable to find other studies measuring EMG fatigue employing the side plank.
Gaudreault et al used a static contraction in extension at 75% MVIC72
while Anwajler et
al and Skrzek et al used a biodex dynamometer with 120°/s angular velocity performing
flexion and extension in sitting and semi-sitting.51,61
We attempted to limit the variability
in our results by averaging the 2 most similar out of every 3 side plank trials completed in
the present study.
The Sorensen test was therefore introduced partway through the study because it
is a more stable task focused more specifically on the paraspinal muscles, is not limited
by the fatigue observed in the shoulder, and it generated more fatigue in both groups.
However, our results showed that the test poses more of a challenge to the lower levels of
the spine rather than the higher levels where the thoracic curve of interest is located.
Indeed, the lower paraspinal muscles resist larger loads because of the distance of the
LEV from the centre of mass and proximity to the center of rotation during the Sorensen
task. However, the Sorensen test is also prone to similar variability in muscle activations
as the side planks as subjects are able to reposition themselves freely throughout testing.
A more suitable methodology to apply resistance would be an extension, rotation, or side-
bending task utilizing a dynamometer or load cell device in which the subject would be
secured and asked to maintain a constant isometric force against a stable resistance. Thus,
the ability of patients to reposition themselves during both tasks may have led to
variability in the EMG recordings and hindered the detection of clinically important
findings between groups.

99
Curve type
By recoding trials based on convexity, our analysis took curve direction into
account and the curve direction was fairly homogenous in the sample (19/21 curves were
right thoracic). We also only measured the thoracic curves and standardized the vertebral
levels evaluated relative to their position in the thoracic curve. We matched the vertebral
levels tested in patients and their matched controls. However, we did not consider the
number of curves present for each patient in our final analysis. Paraspinal muscles were
classified as concave and convex relative to the thoracic curve but this distinction may be
problematic when at level of transition between two curves. The musculature on the
convexity of the lower end vertebrae of a thoracic curve may be considered the
musculature on the concavity of the upper end vertebrae on the lumbar curve. It is unclear
whether the fatigue properties of the musculature at the transitional vertebrae between
curves differ from those in single curves. Thirteen subjects had double curves, three had
triple curves, and five had single curves. Future research should investigate fatigability
within different curve type subgroups. While the apices of the thoracic curves in our
study are similar to those used in Mannion’s study of fiber type (T9-T11), it is unclear
whether their subjects had single or multiple curves. In our systematic review, 3 studies
created subgroups based on curve type57,60,61
and some studies recruited only one curve
type. Due to the differences in the biomechanics of different curve severities, number,
and location, it is important to take these curve differences into account when
investigating muscle properties in adolescent idiopathic scoliosis. The data from this
study will provide preliminary estimates of the effect of curve type to justify the planning
of a larger study considering differences between curve type subgroups.
Cobb angle and progression
Mannion’s work on fiber type imbalance, which influenced the formulation of our
hypotheses, was performed in surgical candidates with a Cobb angle range of 40-75°. Our
range of Cobb angles were quite broad but included much smaller curves (15-44°) in
order to determine whether fatigability could be an impairment logically targeted by
scoliosis specific exercise programs indicated in smaller curves. Indeed, the exercise
prescription parameters of many scoliosis-specific exercise approaches suggest that

100
reducing fatigability in paraspinal muscles may be a goal pursued with the exercises. This
observation is based on the dose of the exercises prescribed (high repetitions at
submaximal intensities). These exercise programs for Schroth vary from 30min 2x/week
to 6-7 hours daily over a long period of time). The exercise schools do not specify the
muscle impairments targeted by the exercises beyond targeting the straightening of the
alignment of the spine.26
In contrast to Mannion’s work, being a surgical candidate was
an exclusion criteria for our study. It is unknown, therefore, how these fiber type
imbalances express themselves in smaller curves.
Further, we did not take curve progression into account. While Cheung et al did
not investigate the paraspinal muscle fatigability they demonstrated that patients with
progressive curves exhibited the following characteristics compared to patients without
progression: higher activity at the lower end vertebrae was correlated with increased cobb
angle and progression.34,55
Future longitudinal fatigability testing may be able identify
whether fatigability measurements at different levels and in different curve types may
help predict which curves progress over time. Treatment studies addressing these deficits
could then be planned to examine the effect of correcting the fatigability impairments on
curve progression in order to finally provide a physiological rationale for the mechanism
of action of scoliosis-specific exercises.
As part of our systematic review on paraspinal muscle function characteristics, we
found papers providing limited evidence that there are correlations between increase in
muscle activity asymmetry and Cobb angle61,62
, as well as between increased muscle
activity at the lower end vertebrae and curve progression.34,54,55
Similar analyses are
needed involving fatigue measurements.
Strengths & Limitations
To our knowledge this is the first study examining paraspinal muscle fatigue
differences between those with scoliosis and healthy controls and with a sample size of
more than 10 participants. The study enrolled a sample with broad inclusion criteria
representative of patients likely to meet indications for scoliosis-specific exercises.23
To
maximize study quality, EMG methods were planned and clearly stated following ISEK
criteria.41
The standardized study protocol included repeated measurements of the side

101
plank tasks, localization of vertebra levels using ultrasound and matched control
recording sites to account for variability in curve location between subjects. Subjects
were matched for BMI, age, and measurement location allowing for a rigorous
comparison between patients with scoliosis and controls. Nevertheless the variability
detected for each measurement in both groups suggest there is a need to create subgroups
sufficiently large and homogeneous to understand the differences due to curve type,
curve location and possibly history of progression.55
The present study provides data to
justify planning such studies and suggests that tasks ensuring stable contractions may be
worth considering to minimize variability in fatigue estimates.
Unfortunately, due to the short timeline and difficulty in recruiting subjects, our
study was limited by similar pitfalls observed in our systematic review. We were unable
to create large subgroups based on curve type, severity, or risk of progression. It would
be possible to perform an analysis based on subgroups for curve type and severity
however, these results would be underpowered due to the low sample size of each
subgroup. Nevertheless, the present study provides the largest sample of data on
paraspinal muscle endurance in patients with scoliosis. Data from the present study will
be used as pilot data to plan a larger study investigating differences between curve types
and provided information on the ability of the investigated tasks to elicit fatigue in our
target sample.
Conclusion
This study provides pilot information and informs future research into the fatigue
characteristics of paraspinal muscles. No significant interactions between task
performance were noted between groups with AIS or controls. Both groups
demonstrated longer holding times on the convex sided planks but no differences in
Sorensen hold times. Controls demonstrated more fatigue overall during side planks than
the scoliosis group and more fatigue was expressed at the UEV compared to the LEV.
The opposite differences were noted in the Sorensen test where significantly more fatigue
was noted at the LEV compared to the UEV. The lack of significance in the interactions
for some of the hypothesized differences may have been due to an insufficient sample

102
size, the variability in the muscle activation during the task selected as the subjects
struggled to maintain positions, and the variability in the curve types and vertebral levels
corresponding to the UEV, apex and LEV. Observations from the present study suggest it
would be useful to measure fatigue in paraspinal muscles through the use of median
frequency slope as an outcome employing a more stable task, a larger sample size, and
subgroups homogenous for curve types and sites of the UEV, apex and LEV recorded.

103
Table 3.1 Demographic characteristics and questionnaire outcomes in both groups Scoliosis Control
Age 13.8 ± 1.6 years 13.9 ± 2.2 years
Gender Males: N=3
Females: N=18
Males: N=3
Females: N=18
Cobb Angle 24.2 ± 9.9° Not Applicable
Scoliometer Max-=7.9 ± 3.17°
Min= -6.15 ± 3.52°
Sum= 14.05 ±4.01°
Not applicable
BMI 19.7 ± 3.5kg/m2 20.7 ± 3.3kg/m2
Pain Ratings /10 0.84 ± 1.06 0.27 ± 0.43
3DPAR Mean METS /day 1.89 ± 0.31 METS 1.85 ±0.21 METS
3DPAR Mean # of 30min blocks of
activities at >3 METS/day
3.61 ± 1.98 activities
>3 METS
3.72 ± 1.65
activities >3 METS

104
Table 3.2 Location and frequency of transitional vertebrae in the AIS group
UEV APEX LEV
T3 2 T7 2 T9 2
T5 2 T8 6 T10 3
T6 12 T9 5 T11 3
T7 1 T10 3 T12 5
T9 1 T12 4 L1 3
T10 2 L1 1 L3 3
T11 1 L4 2

105
Table 3.3 Average holding time for the most similar 2 out of 3 trials on the planks
performed on the convex and concave side and for the Sorensen test.
N Control* Scoliosis
Convex Plank (sec) 21 65.5 ± 36.2‡ 52.3 ± 17.7‡
Concave Plank (sec) 21 54.3 ±33.6‡ 46.6 ± 20.7‡
Sorensen test (sec) 14 108.42 ± 50.79 91.36 ± 66.8
*the right side was recoded as convex in CTRL.
‡ In group by task ANOVA, no significant difference between groups (p=0.114) or for the
group by task interaction (p=0.518). Significant difference between planks (p=0.02).

106
Table 3.4 Means and Standard deviations of Slope of the Median frequency for side
planks on convex & concave sides at each EMG recording location
Scoliosis Control
Plank Direction Side Level Mean Std. Dev Mean Std. Dev
Plank with thoracic
convex side facing
down
Thoracic
Convex
UEV -.030 .258 -.026 .517
Apex .057 .556 -.097 .356
LEV .015 .486 -.040 .334
Thoracic
Concave
UEV -.013 .362 -.252 .478
Apex .104 .466 -.103 .415
LEV .087 .341 .023 .380
Plank with thoracic
concave side facing
down
Thoracic
convex
UEV -.283 .516 -.278 .573
Apex -.067 .289 -.128 .552
LEV .107 .434 .023 .635
Thoracic
Concave
UEV -.229 .451 -.220 .372
Apex .035 .385 -.184 .443
LEV -.007 .320 -.092 .355
Plank with Thoracic
convex side facing
down
Convex
shoulder
-0.091 0.532 -0.075 0.3284
Plank with Thoracic
concave shoulder
facing down
Concave
shoulder
-0.286 0.256 -0.198 0.299

107
Table 3.5 Statistical significance of the main effects, interactions for the comparison
of fatigue measurements using the groupXtaskXsideXlevel mixed model ANOVA for
side planks and a groupXsideXlevel mixed model ANOVA for the Sorensen test.
Effect Side plank tasks
p value*
Sorensen
p value*
Group .046 .929
Task .045
Side .816 .350
Level .007 .015
Group * Task .658
Group * Side .257 .988
Task * Side .950
Group * Task * Side .704
Group * Level .380 .112
Task * Level .172
Group * Task * Level .688
Side * Level .798 .214
Group * Side * Level .707 .391
Task * Side * Level .102
Group * Task * Side * Level .394
*p value corresponding to Pillai’s trace test of the effect

108
Table 3.6 Mean slope (Hz/sec) of the Median frequency for paraspinals at each tested
level on each side of the spine in both groups during the Sorensen Task.
Scoliosis Controls
Recording Side Level Mean Standard.
Deviation
Mean Standard.
Deviation
Thoracic convex
UEV -.150 .564 -.156 .359
Apex -.201 .306 -.119 .428
LEV -.279 .293 -.325 .457
Thoracic concave
UEV .051 .556 -.179 .407
Apex -.408 .337 -.167 .505
LEV -.441 .326 -.426 .462

109
Table 3.7 Correlations between SRS-22r function scores and task lengths for each
side plank and for the Sorensen test.
Holding time
variables
Spearman correlation
coeffficients vs SRS-
22r Function
p values (exact)
Convex side plank 0.088 p=0.517
Concave side plank 0.085 p=0.737
Sorensen -0.219 p=0.728

110
Fig. 3.1: Modified beginner side plank

111
Fig. 3.2 Sorensen Test

112
Fig 3. Raw signal of Sorensen test. A visible drop in signal can be seen when subject
terminated the test. Channel 1,3,5= UEV, APEX, LEV on the left side. Channel 2,4,6=UEV, APEX, LEV on the right side. Channel 7,8= left and right shoulder respectively

113
Chapter 4: Discussion
This thesis sought to investigate the functional properties of paraspinal muscles in
patients with adolescent idiopathic scoliosis. The thesis introduction and the chapter 2
and 3 discussions emphasized that endurance characteristics of paraspinal musculature in
maintaining spinal alignment appear important to help prevent scoliosis progression.
Histological analysis of paraspinal muscles has demonstrated that patients with scoliosis
have type I muscle fibre deficiencies on the concavity of their curve, and a reduced
proportion of type I fibres overall.8 This deficiency may indicate a deficit in the
endurance properties of paraspinal muscles in AIS. Due to the role of paraspinal muscles
in maintaining spinal alignment, deficiencies in endurance may prevent them from
maintaining alignment in response to postural demands over a long period of time.
Current approaches to exercise appear to target endurance deficiencies26,77
, however,
based on our systematic review in chapter 2, no specific impairments have been clearly
documented to provide rationale for interventions targeting endurance. In summary,
researchers and therapists need to be aware of the lack of research into the rationale
behind current exercise interventions before recommending these approaches.
Our systematic review of the literature determined that exercise-based
approaches were not yet based on a strong documentation of paraspinal muscle
impairments within the literature. The scoliosis literature offers limited evidence to
understand muscle properties, deficits, and imbalances.
Indeed for each of the 6 systematic review objectives at best limited evidence
supported conclusions to understand differences between patients and controls, sides,
curve location and severity, as well as the influence of muscle properties on progression
risk within patients with AIS. The quality of research was poor. The reporting of EMG
studies was relatively better in comparisons but still generally did not meet all ISEK
criteria.41
The level of evidence for each objective is only limited not only because of the
study quality but also because of the heterogeneous methodology, subject characteristics,
and outcomes studied to date. Interestingly, only one study was found that examined

114
EMG endurance properties72
but unfortunately this study did not meet our inclusion
criteria of a minimum of 10 subjects. Also for the only included study focused on testing
endurance using isokinetic dynamometry unfortunately the analyses reported did not
address the review objectives.51
We therefore concluded that current exercise-based
approaches to scoliosis management are not yet based on quality scientific inquiry.
Specifically, the prescription of endurance-focused movements (high repetitions, long
duration holds) often employed by popular exercise interventions are not yet based on
scientific literature.
Overall, from our systematic review, we found that limited evidence existed to
support the findings that:
A prolonged bilateral EMG activation exists during gait between
scoliosis & controls
Elevated homolateral:heterolateral activity ratios exist during side-
bending tests.
Overall weakness in trunk extensor muscles between scoliosis and
controls
No asymmetry in normalized muscle activity during submaximal
isometric contractions
Prolonged latencies are present on the side of the spine opposite
the curve and bilaterally in response to an unloading reflex
Strength & muscle volume differences are present based on curve
type with weakness and lower muscle volume present on the
convexity in double curves.
Axial rotation at the UEV is correlated with a high convex:concave
ratio at the LEV
No correlation exists between latency and curve severity, but
prolonged latency can predict curve progression
Larger convex:concave ratios can predict curve progression with
correlations more pronounced during sitting postures
Conflicting evidence exists to support the findings that:

115
Higher activity on the convexity of the curve exists during postural
tasks in patients with AIS
More pronounced activity on the convex side of the curve at the
UEV, LEV, & APEX of the curve within patients
More pronounced activity on the convex side of the curve at the
LEV in progressive curves, and consistently pronounced activity at
the APEX in non-progressive curves in patients.
Strength differences exist between convex and concave sides of the
curve in rotational strength.
Muscle volume differences exist between concave and convex
sides of the curve
Correlations exist between RMS findings and curve severity and
strength differences and curve severity
There are a number of outcomes that did not appear in the literature. As
mentioned above endurance is an important marker of muscle function and as such
should be studied further. In addition, muscle co-activations were studied by very few
papers57
and need to be studied further as they may shed light into compensatory patterns
of muscle recruitment used by those with AIS.
To our knowledge this is the first review of paraspinal muscle functional
properties in AIS. This review specifically aimed to document muscular deficits but did
not aim to address the specific efficacy of treatment approaches at modifying these
deficits. Future study of exercise interventions should aim to document muscle deficits at
baseline and track changes in muscular properties throughout the treatment. This would
allow for an understanding of the intermediate effect of exercises on physiological
properties of muscle targeted by exercise interventions aiming to prevent curve
progression.
With the documented lack of research into endurance outcomes related to the
paraspinal musculature, a case-control study was designed to address this deficiency in
the literature. Fatigability of paraspinal muscles was investigated through the use of the
median frequency of the EMG signal over time to determine if differences exist between

116
subjects with scoliosis and controls, overall, between sides, and levels of the spine.
Subjects performed 3 side planks on each side as well as a Sorensen test. These were
performed for as long as the subjects could hold the tasks. We expected to find
differences between subjects and controls with greater fatigue expressed in subjects and
more pronounced on the concave side of the curve. This was based on the findings of
Mannion et al in which a lower proportion of type I (endurance specific) fibres were
noted on the concavity. 8 However our hypothesis was not supported as we did not find
any interaction between group, side, or level. Contrary to our expectations we noted that
those without scoliosis demonstrated more EMG recorded fatigue than those with
scoliosis during the side planks. We hypothesize that this result may be due to a different
recruitment patterns of co-activations used by patients with scoliosis compared to
controls. To confirm this hypothesis, in the future, it would be relevant to record activity
in the abdominal, intercostal and possibly hips muscles which may have been
compensatory muscles used by patients with scoliosis. Alternatively, this may also be due
to our selection of an unstable task during which subjects could reposition themselves
introducing variability in the EMG recordings, or to our small sample size combined with
the heterogeneity in curve types and levels examined. For a follow up experiment, it may
be more effective to use a task where subjects are stable and secured, such as a
dynamometer in which the force exerted can be controlled and kept consistent between
subjects. Our results suggest that to reduce variability in EMG estimates of fatigue, in the
future, subjects could be recruited with only one curve type, preferable single main
thoracic curves as a first attempt, in order to maintain a level of homogeneity between
subjects and avoid the complexity in defining whether a muscles is on the convex or
concave side of the curve due to the presence of other curves. In addition the time series
measured as a part of the EMG signal analysis may play a role in the results of the
median frequency. Certain factors such as de-recruitment of type II fibres,93
or additional
recruitment of type I fibres94
may affect the consistency of the signal over time.
Nevertheless, there is a possibility that no difference in muscular endurance exists
between those with scoliosis and controls, however, more vigorous inquiry with higher
methodological standards must be performed before that conclusion may be drawn as

117
point estimates for some of our fatigue analyses appear clinically important although not
yet statistically significant.
Fatigue is not present as an outcome in the systematic review, however
measurement of EMG activity is common. Few studies measure this through a resisted
task. Many studies employ short duration submaximal postural tasks34,53-56
but these may
not be effective at measuring fatigue to reflect the demand of daily tasks over long
periods of time. Studies employing isometric holds often reported elevated EMG
activity.45,50,59
Despite conflicting results as to finding differences between patients and
controls as well as sides, this elevated activity indicates that paraspinal muscles are firing
and it would be useful to mimic these tasks in a prolonged activity in an attempt to induce
and measure fatigue corresponding to daily challenges. Most commonly used tasks were
isometric side-bending, rotation, and extension in a dynamometer.45,50,57,62
Other studies
used isokinetic movements, however, these are inadvisable when using sEMG as a
measurement tool as EMG electrodes move relative to the muscles of interest throughout
the dynamic ROM.95
EMG measurement of fatigue is used extensively in back pain research and it may
be useful to employ methods of fatigue measurement used by back pain researchers.96,97
Back pain studies have found consistent associations with back muscle extensor fatigue
and trunk extension movements measured in a dynamometer at 25%, 50%, and 75% of
MVC with an optimal MVC of 50%. Van Dieen et al also recommend fitting the slope of
the median frequency to half of the total holding time in order to effectively assess the
endurance capacity of trunk extensors.96
It would be advisable for future research into
paraspinal muscle fatigue in patients with scoliosis to examine the effect of adopting the
methodologies used in the study of low back pain.
If no fatigue differences exist between patients and controls, as our pilot study
results suggest, then another rationale must be given for justifying the use of exercise-
based interventions to successfully limit curve progression. While not explicitly stated,
the current application of exercise principles while analysis the dosage of exercises
prescribed suggests that these interventions are aiming to improve endurance outcomes.
If there is no endurance impairment, then exercise must achieve their effect on spinal
alignment by targeting another outcome such as the latency, co-activation imbalances, the

118
side-to-side strength differences or the strength differences documented related to
controls.47,51,57,58,61
However, as seen in the literature review, the research is still too
limited to clearly identify a muscle impairment that would be applicable to prescribing
targeted exercise interventions. At this point only the following impairments have
demonstrated limited evidence of an association with risk of progression: Prolonged
latencies and elevated convex:concave activity ratios particularly in sitting postures.
These impairments may be primary targets to investigate to provide a rational to justify
exercise interventions. While the current exercise-based approaches largely target
endurance properties of paraspinal muscles, a number also address motor-control
deficiencies. Prolonged latency is an indicator of poor motor control and therefore
exercise interventions such as SEAS which aim to improve motor control26
are consistent
with this finding in our review.
Thus, this thesis has aimed to present a muscle impairment-based rationale for
current providers of exercise-based therapy for scoliosis by systematically reviewing the
literature and documenting paraspinal endurance impairments. Unfortunately, our review
showed that currently the muscle impairment-based rationale is supported only by limited
and conflicting evidence of generally poor quality. Our review also found no studies on
endurance deficits. Nevertheless, this review’s important findings of a lack of research on
many muscle impairments and the limited quality of the available evidence, provides
important guidance for future research on this topic. Gaps in the literature were clearly
detailed in Chapter 2 and will help inform the planning of future research. Our
investigation into the endurance properties of paraspinal muscles while aiming to match
cases and controls, as well as control for physical activity levels, did not find the
hypothesized lower endurance in patients with scoliosis compared to controls, possibly
due to small sample size, unstable task selection, and not controlling for curve type.
However, this pilot inquiry does open the door to study the endurance properties of
paraspinal scoliosis by providing variability estimates for the planning of future studies of
deficits of the paraspinal musculature in adolescent idiopathic scoliosis. Improving this
body of evidence should guide the development of exercise protocols that are logically
targeted to impairments related to curve progression.

119
Reference list 1. Kittleson AC, Lim LW. Measurement of Scoliosis. American Journal of
Roentgenology. 1970;108(4):775–777. doi:10.2214/ajr.108.4.775.
2. Weinstein SL, Dolan LA, Cheng JC, Danielsson A, Morcuende JA. Adolescent
idiopathic scoliosis. The Lancet. 2008;371(9623):1527–1537. doi:10.1016/S0140-
6736(08)60658-3.
3. Aaos. Burden of Musculoskeletal Diseases in the United States: Prevalence,
Societal and Economic Cost. 2011.
4. James JI. Idiopathic scoliosis; the prognosis, diagnosis, and operative indications
related to curve patterns and the age at onset. J Bone Joint Surg Br. 1954;36-
B(1):36–49.
5. Riseborough EJ, Wynne-Davies R. A genetic survey of idiopathic scoliosis in
Boston, Massachusetts. J Bone Joint Surg Am. 1973;55(5):974–982.
6. Nissinen M, Heliövaara M, Ylikoski M, Poussa M. Trunk asymmetry and
screening for scoliosis: a longitudinal cohort study of pubertal schoolchildren. Acta
Paediatr. 1993;82(1):77–82. doi:10.1111/j.1651-2227.1993.tb12521.x.
7. Lowe TG, Burwell RG, Dangerfield PH. Platelet calmodulin levels in adolescent
idiopathic scoliosis (AIS): can they predict curve progression and severity?
Summary of an electronic focus group debate of the IBSE. Eur Spine J.
2004;13(3):257–265. doi:10.1007/s00586-003-0655-3.
8. Mannion AF, Meier M, Grob D, Müntener M. Paraspinal muscle fibre type
alterations associated with scoliosis: an old problem revisited with new evidence.
Eur Spine J. 1998;7(4):289–293.
9. Burwell RG, Dangerfield PH, Moulton A, Anderson SI. Etiologic theories of
idiopathic scoliosis: autonomic nervous system and the leptin-sympathetic nervous
system concept for the pathogenesis of adolescent idiopathic scoliosis. Stud Health
Technol Inform. 2008;140:197–207.
10. Burwell RG, Dangerfield PH. Etiologic theories of idiopathic scoliosis:
neurodevelopmental concepts to be evaluated. Stud Health Technol Inform.
2002;91:15–19.
11. Burwell RG, Dangerfield PH, Freeman BJC. Etiologic theories of idiopathic
scoliosis. Somatic nervous system and the NOTOM escalator concept as one
component in the pathogenesis of adolescent idiopathic scoliosis. Stud Health
Technol Inform. 2008;140:208–217.
12. Weinstein SL. Natural history. Spine. 1999;24(24):2592–2600.

120
13. Asher MA, Burton DC. Adolescent idiopathic scoliosis: natural history and long
term treatment effects. Scoliosis. 2006;1(1):2. doi:10.1186/1748-7161-1-2.
14. Weinstein SL, Ponseti IV. Curve progression in idiopathic scoliosis. J Bone Joint
Surg Am. 1983;65(4):447–455.
15. Weiss H-R. Adolescent idiopathic scoliosis (AIS) - an indication for surgery? A
systematic review of the literature. Disabil Rehabil. 2008;30(10):799–807.
doi:10.1080/09638280801889717.
16. Greiner KA. Adolescent idiopathic scoliosis: radiologic decision-making. Am Fam
Physician. 2002;65(9):1817–1822.
17. Sanders JO, Browne RH, McConnell SJ, Margraf SA, Cooney TE, Finegold DN.
Maturity assessment and curve progression in girls with idiopathic scoliosis. J
Bone Joint Surg Am. 2007;89(1):64–73. doi:10.2106/JBJS.F.00067.
18. Greulich WW, Pyle SI. Radiographic Atlas of Skeletal Development of the Hand
and Wrist. 1959.
19. Lonstein JE, Carlson JM. The prediction of curve progression in untreated
idiopathic scoliosis during growth. J Bone Joint Surg Am. 1984;66(7):1061–1071.
20. Scoliosis Research Society. Reference Manual for the Boston Scoliosis Brace.
srsorg. 2003. Available at:
http://www.srs.org/professionals/education_materials/SRS_bracing_manual/sectio
n5.pdf. Accessed October 31, 2012.
21. Weinstein SL, Dolan LA, Wright JG, Dobbs MB. Effects of Bracing in
Adolescents with Idiopathic Scoliosis. N Engl J Med. 2013;369(16):1512–1521.
doi:10.1056/NEJMoa1307337.
22. Romano M, Minozzi S, Bettany-Saltikov J, et al. Exercises for adolescent
idiopathic scoliosis. Cochrane Database Syst Rev. 2012;8:CD007837.
doi:10.1002/14651858.CD007837.pub2.
23. Negrini S, Aulisa AG, Aulisa L, Circo AB. 2011 SOSORT guidelines:
Orthopaedic and Rehabilitation treatment of idiopathic scoliosis during growth.
Scoliosis. 2012.
24. Rowe DE, Bernstein SM, Riddick MF, Adler F, Emans JB, Gardner-Bonneau D. A
meta-analysis of the efficacy of non-operative treatments for idiopathic scoliosis. J
Bone Joint Surg Am. 1997;79(5):664–674.
25. Coe JD, Arlet V, Donaldson W, Berven S, Hanson DS. Complications in spinal
fusion for adolescent idiopathic scoliosis in the new millennium. A report of the
Scoliosis Research Society Morbidity and Mortality Committee. Spine. 2006.

121
26. Fusco C, Zaina F, Atanasio S, Romano M, Negrini A, Negrini S. Physical
exercises in the treatment of adolescent idiopathic scoliosis: An updated systematic
review. Physiother Theory Pract. 2011;27(1):80–114.
doi:10.3109/09593985.2010.533342.
27. Mordecai SC, Dabke HV. Efficacy of exercise therapy for the treatment of
adolescent idiopathic scoliosis: a review of the literature. Eur Spine J.
2012;21(3):382–389. doi:10.1007/s00586-011-2063-4.
28. Stokes IA, Burwell RG, Dangerfield PH. Biomechanical spinal growth modulation
and progressive adolescent scoliosis-a test of the“vicious cycle”pathogenetic
hypothesis: Summary of an electronic …. Scoliosis. 2006.
29. Weiss H, M H, R K. ADL based scoliosis rehabilitation--the key to an
improvement of time-efficiency? Stud Health Technol Inform. 2005;123:594–598.
30. Maruyama T, Takeshita K, Kitagawa T. Side-shift exercise and hitch exercise.
Stud Health Technol Inform. 2008;135:246–249.
31. Bogduk N, Twomey LT. Clinical Anatomy of the Lumbar Spine. 1991.
32. Powers SK, Howley ET. Exercise Physiology. McGraw-Hill Higher Education;
2012.
33. Dejanovic A, Cambridge E. Isometric torso muscle endurance profiles in
adolescents aged 15-18: normative values for age and gender differences. Annals
of human …. 2013;41(2):153–158. doi:10.3109/03014460.2013.837508.
34. Cheung J, Halbertsma JPK, Veldhuizen AG, et al. A preliminary study on
electromyographic analysis of the paraspinal musculature in idiopathic scoliosis.
Eur Spine J. 2004;14(2):130–137. doi:10.1007/s00586-004-0780-7.
35. Hides JA, Richardson CA, Jull GA. Multifidus Muscle Recovery Is Not Automatic
After Resolution of Acute, First-Episode Low Back Pain. Spine.
1996;21(23):2763–2769. doi:10.1097/00007632-199612010-00011.
36. Arokoski JP, Valta T, Airaksinen O, Kankaanpää M. Back and abdominal muscle
function during stabilization exercises. Archives of Physical Medicine and
Rehabilitation. 2001;82(8):1089–1098. doi:10.1053/apmr.2001.23819.
37. Kankaanpää M, Taimela S, Airaksinen O, Hänninen O. The efficacy of active
rehabilitation in chronic low back pain. Effect on pain intensity, self-experienced
disability, and lumbar fatigability. Spine. 1999;24(10):1034–1042.
38. McGill SM. Low Back Disorders. 2007.
39. González-Izal M, Malanda A, Navarro-Amézqueta I, et al. EMG spectral indices
and muscle power fatigue during dynamic contractions. Journal of

122
Electromyography and Kinesiology. 2010;20(2):233–240.
doi:10.1016/j.jelekin.2009.03.011.
40. Mokkink LB, Terwee CB, Knol DL, et al. The COSMIN checklist for evaluating
the methodological quality of studies on measurement properties: A clarification of
its content. BMC Medical Research Methodology. 2010;10(1):22.
doi:10.1186/1471-2288-10-22.
41. Hermens HJ, Freriks B, Disselhorst-Klug C, Rau G. Development of
recommendations for SEMG sensors and sensor placement procedures. J
Electromyogr Kinesiol. 2000;10(5):361–374.
42. Wong AYL, Parent EC, Funabashi M, Kawchuk GN. Do changes in transversus
abdominis and lumbar multifidus during conservative treatment explain changes in
clinical outcomes related to nonspecific low back pain? A systematic review. The
Journal of Pain. 2014;15(4):377–335. doi:10.1016/j.jpain.2013.10.008.
43. Cornelius LR, van der Klink JJL, Groothoff JW, Brouwer S. Prognostic Factors of
Long Term Disability Due to Mental Disorders: A Systematic Review. J Occup
Rehabil. 2011;21(2):259–274. doi:10.1007/s10926-010-9261-5.
44. Dobosiewicz KK. Neurophysiological mechanism of the unloading reflex as a
prognostic factor in the early stages of idiopathic adolescent scoliosis. Eur Spine J.
1997;6(2):93–97.
45. Feipel VV, Aubin CEC, Ciolofan OCO, Beauséjour MM, Labelle HH, Mathieu
PAP. Electromyogram and kinematic analysis of lateral bending in idiopathic
scoliosis patients. Med Biol Eng Comput. 2002;40(5):497–505.
46. Filipovic VV, Viskic-stalec NN. The mobility capabilities of persons with
adolescent idiopathic scoliosis. Spine. 2006;31(19):2237–2242.
doi:10.1097/01.brs.0000232821.00521.f9.
47. Fuller BJ, Bishop PA, Mansfield ER. Strength, muscle symmetry, and flexibility in
young female idiopathic scoliotics. Journal of Orthopaedic & …. 1991;14(4):144–
148. doi:10.2519/jospt.1991.14.4.144.
48. Mahaudens P, Thonnard J-L, Detrembleur C. Influence of structural pelvic
disorders during standing and walking in adolescents with idiopathic scoliosis.
Spine J. 2005;5(4):427–433. doi:10.1016/j.spinee.2004.11.014.
49. Mahaudens P, Banse X, Mousny M, Detrembleur C. Gait in adolescent idiopathic
scoliosis: kinematics and electromyographic analysis. Eur Spine J.
2009;18(4):512–521. doi:10.1007/s00586-009-0899-7.
50. de Oliveira ASA, Gianini PESP, Camarini PMFP, Bevilaqua-Grossi DD.
Electromyographic analysis of paravertebral muscles in patients with idiopathic
scoliosis. Spine. 2011;36(5):E334–E339. doi:10.1097/BRS.0b013e3181f516cd.

123
51. Skrzek A, Anwajler J, Mraz M, Woźniewski M. Evaluation of force-speed
parameters of the trunk muscles in idiopathic scoliosis. Isokinetics and exercise ….
2003.
52. Tsai Y-T, Leong C-P, Huang Y-C, et al. The electromyographic responses of
paraspinal muscles during isokinetic exercise in adolescents with idiopathic
scoliosis with a Cobb's angle less than fifty degrees. Chang Gung Med J.
2010;33(5):540–550.
53. Alexander MA, Season EH. Idiopathic scoliosis: an electromyographic study.
Archives of physical medicine and …. 1978.
54. Cheung J, Veldhuizen AG, Halbertsma J. The relation between electromyography
and growth velocity of the spine in the evaluation of curve progression in
idiopathic scoliosis. Spine. 2004.
55. Cheung J, Veldhuizen AG, Halberts J, Sluiter WJ. Geometric and
electromyographic assessments in the evaluation of curve progression in idiopathic
scoliosis. Spine. 2006.
56. Gram MC, Hasan Z. The spinal curve in standing and sitting postures in children
with idiopathic scoliosis. Spine. 1999.
57. Mooney V, Gulick J, Pozos R. A preliminary report on the effect of measured
strength training in adolescent idiopathic scoliosis. J Spinal Disord.
2000;13(2):102–107.
58. Shimode M, Ryouji A, Kozo N. Asymmetry of premotor time in the back muscles
of adolescent idiopathic scoliosis. Spine. 2003;28(22):2535–2539.
doi:10.1097/01.BRS.0000092375.61922.D1.
59. McIntire KL, Asher MA, Burton DC, Liu W. Treatment of adolescent idiopathic
scoliosis with quantified trunk rotational strength training: a pilot study. J Spinal
Disord Tech. 2008;21(5):349–358. doi:10.1097/BSD.0b013e318145b7e9.
60. Zoabli G, Mathieu PA, Aubin C-E. Back muscles biometry in adolescent
idiopathic scoliosis. Spine J. 2007;7(3):7–7. doi:10.1016/j.spinee.2006.04.001.
61. Anwajler J, Skrzek A, Mraz M, Skolimowski T. The size of physiological spinal
curvatures and functional parameters of trunk muscles in children with idiopathic
scoliosis. Isokinetics and exercise …. 2006.
62. Odermatt D, Mathieu PA, Beauséjour M, Labelle H, Aubin C-E.
Electromyography of scoliotic patients treated with a brace. J Orthop Res.
2003;21(5):931–936. doi:10.1016/S0736-0266(03)00038-X.
63. Cheung J, Veldhuizen AG, Halbertsma JPK, et al. The relation between
electromyography and growth velocity of the spine in the evaluation of curve

124
progression in idiopathic scoliosis. Spine. 2004;29(9):1011–1016.
64. Anwajler J, Skrzek A, Mraz M. The size of physiological spinal curvatures and
functional parameters of trunk muscles in children with idiopathic scoliosis.
Isokinetics and exercise …. 2006.
65. Mahaudens P, Detrembleur C, Mousny M, Banse X. Gait in adolescent idiopathic
scoliosis: energy cost analysis. Eur Spine J. 2009;18(8):1160–1168.
doi:10.1007/s00586-009-1002-0.
66. Fuller BJB, Bishop PAP, Mansfield ERE, Smith JFJ. Strength, muscle symmetry,
and flexibility in young female idiopathic scoliotics. J Orthop Sports Phys Ther.
1991;14(4):144–148.
67. Riddle H, Roaf R. MUSCLE IMBALANCE IN THE CAUSATION OF
SCOLIOSIS. The Lancet. 1955;265(6877):1245–1247. doi:10.1016/S0140-
6736(55)91020-5.
68. Roaf R. The basic anatomy of scoliosis. J Bone Joint Surg Br. 1966.
69. Zuk T. THE ROLE OF SPINAL AND ABDOMINAL MUSCLES IN THE
PATHOGENESIS OF SCOLIOSIS. Journal of Bone and Joint Surgery-British
Volume. 1962.
70. Axelgaard J, Brown JC. Lateral electrical surface stimulation for the treatment of
progressive idiopathic scoliosis. Spine. 1983;8(3):242–260.
71. Eckerson LF, Axelgaard J. Lateral electrical surface stimulation as an alternative
to bracing in the treatment of idiopathic scoliosis. Treatment protocol and patient
acceptance. Phys Ther. 1984;64(4):483–490.
72. Gaudreault N, Arsenault AB, Larivière C, DeSerres SJ, Rivard C-H. Assessment
of the paraspinal muscles of subjects presenting an idiopathic scoliosis: an EMG
pilot study. BMC Musculoskelet Disord. 2005;6:14–14. doi:10.1186/1471-2474-6-
14.
73. Hebert JJ, Koppenhaver SL, Parent EC, Fritz JM. A systematic review of the
reliability of rehabilitative ultrasound imaging for the quantitative assessment of
the abdominal and lumbar trunk muscles. Spine. 2009;34(23):E848–56.
doi:10.1097/BRS.0b013e3181ae625c.
74. Koppenhaver SL, Hebert JJ, Parent EC, Fritz JM. Rehabilitative ultrasound
imaging is a valid measure of trunk muscle size and activation during most
isometric sub-maximal contractions: a systematic review. Aust J Physiother.
2009;55(3):153–169.
75. Skrzek A, Anwajler J, Mraz M, niewski MW, Skolimowski T. Evaluation of force-
speed parameters of the trunk muscles in idiopathic scoliosis.

125
webebscohostcomloginezproxylibraryualbertaca. Available at:
http://web.ebscohost.com.login.ezproxy.library.ualberta.ca/ehost/pdfviewer/pdfvie
wer?sid=2c801637-6257-4087-bbe5-
de06b5fcb274%40sessionmgr14&vid=2&hid=14. Accessed May 30, 2013.
76. McGill SM. Low back stability: from formal description to issues for performance
and rehabilitation. Exercise and Sport Sciences Reviews. 2001;29(1):26.
77. Negrini S, Fusco C, Minozzi S, Atanasio S, Zaina F, Romano M. Exercises reduce
the progression rate of adolescent idiopathic scoliosis: Results of a comprehensive
systematic review of the literature. Disabil Rehabil. 2008;30(10):772–785.
doi:10.1080/09638280801889568.
78. Motl RW, Dishman RK, Dowda M, Pate RR. Factorial validity and invariance of a
self-report measure of physical activity among adolescent girls. Res Q Exerc Sport.
2004;75(3):259–271.
79. AINSWORTH BE, HASKELL WL, WHITT MC, et al. Compendium of Physical
Activities: an update of activity codes and MET intensities. Med Sci Sports Exerc.
2000;32(Supplement):S498–S516. doi:10.1097/00005768-200009001-00009.
80. Asher M, Min Lai S, Burton D, Manna B. The reliability and concurrent validity of
the scoliosis research society-22 patient questionnaire for idiopathic scoliosis.
Spine. 2003;28(1):63–69. doi:10.1097/01.BRS.0000047634.95839.67.
81. Childs JD, Piva SR, Fritz JM. Responsiveness of the numeric pain rating scale in
patients with low back pain. Spine. 2005;30(11):1331–1334.
82. Amendt LE, Ause-Ellias KL, Eybers JL, Wadsworth CT, Nielsen DH, Weinstein
SL. Validity and reliability testing of the Scoliometer. Phys Ther. 1990;70(2):108–
117.
83. Schreiber S, Parent EC, Watkins EM, Hedden DM. Scoliosis | Full text | An
algorithm for determining scoliosis curve type according to Schroth. Scoliosis.
2012.
84. Merletti R, Hermens H. Introduction to the special issue on the SENIAM European
Concerted Action. Journal of Electromyography and Kinesiology.
2000;10(5):283–286. doi:10.1016/S1050-6411(00)00019-5.
85. Latimer J, Maher CG, Refshauge K, Colaco I. The reliability and validity of the
Biering-Sorensen test in asymptomatic subjects and subjects reporting current or
previous nonspecific low back pain. Spine. 1999;24(20):2085–2090.
86. Andersen LB, Wedderkopp N, Leboeuf-Yde C. Association between back pain
and physical fitness in adolescents. Spine. 2006.
87. Cifrek M, Medved V, Tonkovic S. ScienceDirect.com - Clinical Biomechanics -

126
Surface EMG based muscle fatigue evaluation in biomechanics. Clinical
Biomechanics. 2009.
88. Raudsepp L, Neissaar I. Brief report: Relationships between physical activity and
depressive symptoms in adolescent girls. J Adolesc. 2012.
doi:10.1016/j.adolescence.2012.04.003.
89. US department of Health and Human Services. 2008 Physical Activity Guidelines
for Americans. Government Printing Office
90. Strong WB, Malina RM, Blimkie CJ, et al. Evidence Based Physical Activity for
School-age Youth. J Pediatr. 2005;146(6):732–737.
doi:10.1016/j.jpeds.2005.01.055.
91. Parent EC, Hill D, Mahood J, Moreau M, Raso J, Lou E. Discriminative and
predictive validity of the scoliosis research society-22 questionnaire in
management and curve-severity subgroups of adolescents with idiopathic ….
Spine. 2009.
92. Parent EC, Hill D, Moreau M, Mahood J, Raso J, Lou E. Score distribution of the
Scoliosis Quality of Life Index questionnaire in different subgroups of patients
with adolescent idiopathic scoliosis. Spine. 2007.
93. Cooper RG, Stokes MJ. Load-induced inflexion of the surface electromyographic
signal during isometric fatiguing activity of normal human paraspinal muscle.
Electromyogr Clin Neurophysiol. 1994;34(3):177–184.
94. van Dieën JH, Heijblom P, Bunkens H. Extrapolation of time series of EMG
power spectrum parameters in isometric endurance tests of trunk extensor muscles.
Journal of Electromyography and Kinesiology. 1998;8(1):35–44.
doi:10.1016/S1050-6411(97)00003-5.
95. González-Izal M, Malanda A, Gorostiaga E, Izquierdo M. Electromyographic
models to assess muscle fatigue. J Electromyogr Kinesiol. 2012.
doi:10.1016/j.jelekin.2012.02.019.
96. van Dieën JH, Toussaint HM, Thissen C, van de Ven A. Spectral analysis of
erector spinae EMG during intermittent isometric fatiguing exercise. Ergonomics.
1993;36(4):407–414. doi:10.1080/00140139308967898.
97. Dedering Å, Harms-Ringdahl K, Nèmeth G. Back extensor muscle fatigue in
patients with lumbar disc herniation. Eur Spine J. 2005;15(5):559–569.
doi:10.1007/s00586-005-0934-2.

127
Appendix A:
Search strategy for Systematic Review
MEDLINE April 24, 2013
1. Scoliosis/
2. scoliosis.mp. [mp=title, abstract, original title, name of substance word, subject heading word, keyword heading word,
protocol supplementary concept, rare disease supplementary concept, unique identifier]
3. 1 or 2
4. spinal deformit*.mp. [mp=title, abstract, original title, name of substance word, subject heading word, keyword heading
word, protocol supplementary concept, rare disease supplementary concept, unique identifier]
5. 3 or 4
6. spinal muscl*.mp. [mp=title, abstract, original title, name of substance word, subject heading word, keyword heading word,
protocol supplementary concept, rare disease supplementary concept, unique identifier]
7. spinal musculature.mp. [mp=title, abstract, original title, name of substance word, subject heading word, keyword heading
word, protocol supplementary concept, rare disease supplementary concept, unique identifier]
8. erector.mp.
9. exp Spine/
10. exp Muscles/
11. 9 and 10
12. rotatores.mp.
13. longissimus.mp.
14. spinalis.mp.
15. iliocostalis.mp.
16. 6 or 7 or 8 or 11 or 12 or 13 or 14 or 15
17. force.mp.
18. strength.mp. or exp Muscle Strength/
19. exp Muscle Fatigue/
20. endurance.mp.
21. fatigability.mp.
22. muscle activity.mp.
23. exp Electromyography/
24. electromyogra*.mp. [mp=title, abstract, original title, name of substance word, subject heading word, keyword heading
word, protocol supplementary concept, rare disease supplementary concept, unique identifier]
25. muscle latency.mp.
26. latenc*.mp. [mp=title, abstract, original title, name of substance word, subject heading word, keyword heading word,
protocol supplementary concept, rare disease supplementary concept, unique identifier]
27. co-contraction.mp. [mp=title, abstract, original title, name of substance word, subject heading word, keyword heading
word, protocol supplementary concept, rare disease supplementary concept, unique identifier]
28. muscle timing.mp.
29. or/17-28
30. 5 and 16 and 29
31. limit 30 to humans
32. limit 31 to (("child (6 to 12 years)" or "adolescent (13 to 18 years)") and (english or french) and journal article)