emerging trends in the refining industry and … · · 2015-06-17... prevention of significant...
TRANSCRIPT

Copyright of COMPANY NAME
EMERGING TRENDS IN THE REFINING INDUSTRY AND THEIR IMPACT ON CAPITAL PROJECTS
NWCCC Annual Conference November 2, 2011
Tom RizzoGeneral Manager – Shell Puget Sound Refinery
1October 2011
Use this area for cover image(height 6.5cm, width 8cm)

Copyright of COMPANY NAME
US REFINING OVERVIEW
2October 2011
As of January 1, 2011
• 148 Operable Refineries
• 17.7 million barrels per calendar day capacity
On January 1, 2001
• 153 Operable Refineries
• 16.6 million barrels per calendar day capacity
Source: NPRA website
Copyright of COMPANY NAME
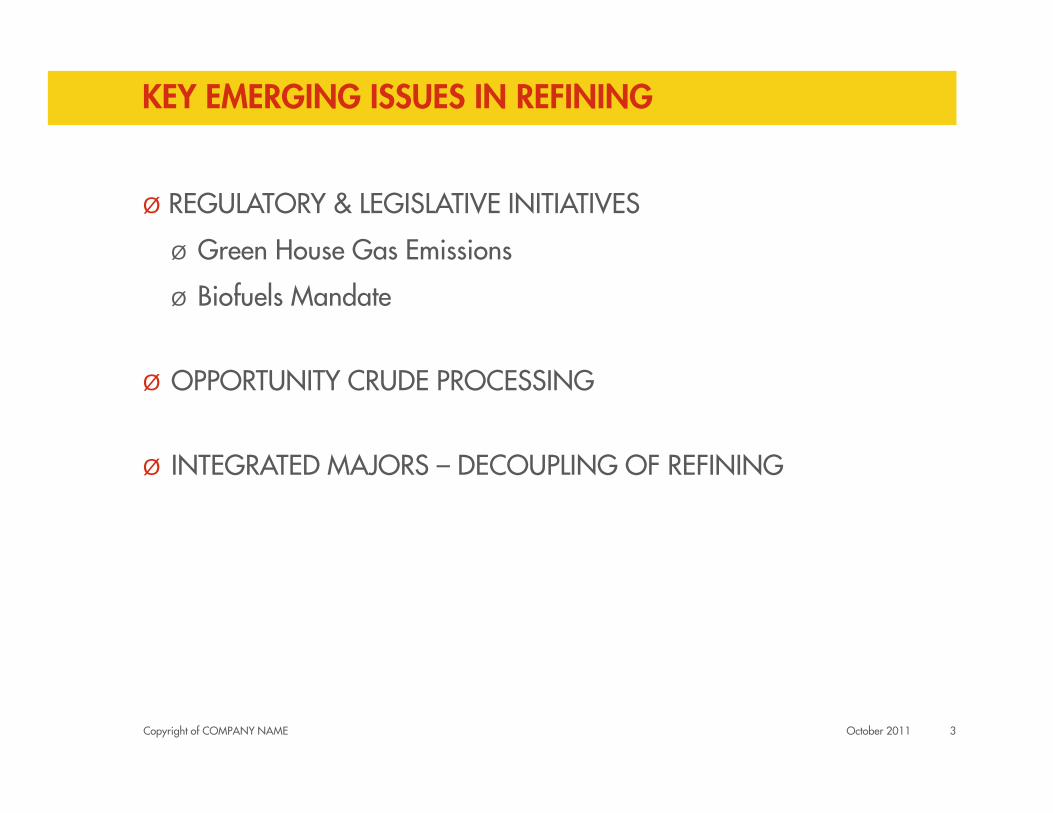
KEY EMERGING ISSUES IN REFINING
Ø REGULATORY & LEGISLATIVE INITIATIVES
Ø Green House Gas Emissions
Ø Biofuels Mandate
Ø OPPORTUNITY CRUDE PROCESSING
Ø INTEGRATED MAJORS – DECOUPLING OF REFINING
October 2011 3

Copyright of COMPANY NAME
REGULATORY AND LEGISLATIVE INTIATIVES
October 2011 4

Copyright of COMPANY NAME
2010 – 2011 LEGISLATIVE AND REGULATORY ISSUES POTENTIALLY IMPACTING THE US REFINING INDUSTRY
• Reformulated Fuel Standard (RFS2)
• Flex Permitting
• TSCA Reform
• Boiler MACT
• CFATS / IST
• Keystone Pipeline
• Personal Surety Program
• E15 Partial Waiver
• Green House Gases
Prevention of Significant Deterioration
Tailoring Rule
Stationary Source Regulations / NSPS
New Source Performance Standards
Cap and Trade
§ Low Carbon Fuel Standard
§ NAAQS (ozone regulation)
§ Oil Spill Liability Trust Fund Tax
October 2011 5

Copyright of COMPANY NAME
GREEN HOUSE GAS REGULATION
Background
q US Supreme Court ruled in Massachusetts vs. EPA that the EPA can regulate Green House Gases (GHG’s) under the existing Clean Air Act (CAA)
q EPA has started to propose regulation of GHG’s under existing CAA programs such as Vehicle Emissions standards rule, Prevention of Significant Deterioration, and New Source Performance Standards
q Under these regulations, permits will be required for projects that emit threshold levels of CO2 (regardless of emissions of other criteria pollutants such as SOx, NOx, etc.
October 2011 6

Copyright of COMPANY NAME
GREEN HOUSE GAS SOURCES
7October 2011
Source - WIkipedia

Copyright of COMPANY NAME
IMPLICATIONS
o Significantly more permits will be required for refinery modifications
o Require installation of BACT (Best Available Control Technology) for managing CO2 emissions. BACT to be determined on case-by-case basis.
o EPA is currently working on approach for refinery GHG measures:
Energy management
Command and control (source specific emission limits)
Benchmarking
In any case, greater focus on energy reduction projects will likely be required.
October 2011 8

Copyright of COMPANY NAME
BIOFUELS
Background
q RFS program was created under the Energy Policy Act of 2005. Established first renewable fuel mandate – 7.5 billion gallons by 2012
q RFS program expanded in 2007 under the Energy Independence and Security act (RFS2). Key changes: included diesel, established new categories of renewable fuel and mandates for each, and increased volumes of renewable fuel (9 billion gallons in 2008 to 36 billion gallons by 2022)
October 2011 9
Copyright of COMPANY NAME
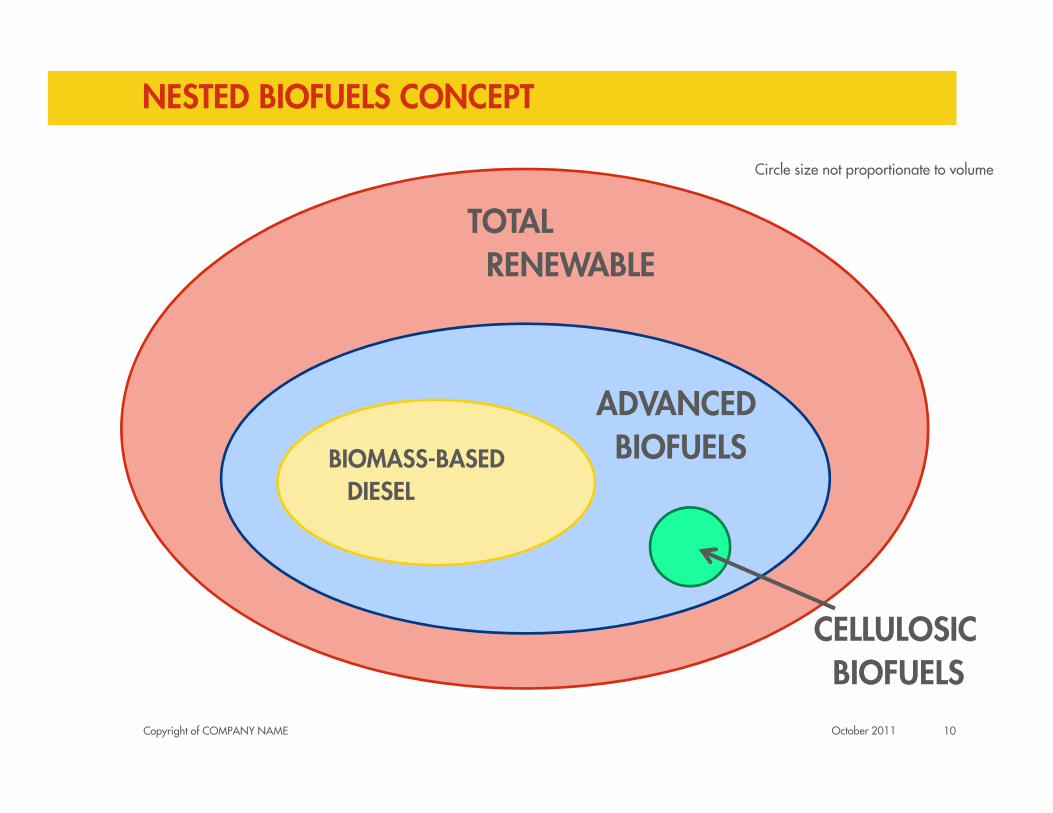
NESTED BIOFUELS CONCEPT
10October 2011
TOTAL RENEWABLE
ADVANCED BIOFUELSBIOMASS-BASED
DIESEL
Circle size not proportionate to volume
CELLULOSIC BIOFUELS

Copyright of COMPANY NAME
RFS2 YEARLY BIOFUELS REQUIREMENTS (IN BGY)Total Renewables
YEAR Total Advanced Biofuels
Cellulosic Biofuels
Biomass-BasedBiofuels
2007 4.7 (4.02%)
2008 9.0 (7.76%)
2009 .50 .6 11.1 (10.21%)
2010 .0065 .65 .95 12.95 (8.25%)
2011 .006 .80 1.35 13.95 (8.01%)
2012 .50 1.00 2.00 15.20 (est 9.31%)
2013 1.00 1.00 2.75 16.55 (est 10.09%)
2014 1.75 1.00 3.75 18.15 (est 11.05%)
2015 3.00 1.00 5.50 20.50 (est 12.48%)
2016 4.25 1.00 7.25 22.25 (est 13.49%)
2017 5.50 1.00 9.00 24.00 (est 13.49%)
2018 7.00 1.00 11.00 26.00 (est 14.56%)
2019 8.50 1.00 13.00 28.00 (est 17.11%)
2020 10.50 1.00 15.00 30.00 (est 18.50%)
2021 13.50 1.00 18.00 33.00 (est 20.54%)
2022 16.00 1.00 21.00 36.00 (est 22.65%)11October 2011

Copyright of COMPANY NAME
IMPLICATIONS
o Growth in biofuels exceeds overall growth in transportation fuels –increased pressure on refining
o Significant expansion in facilities required to manufacture, store, transport, and blend biofuels
o Impact of increasing biofuels volumes will result in changes to mix of fuel blending components – refinery configuration and/or new technologies
October 2011 12

Copyright of COMPANY NAME
OPPORTUNITY CRUDE PROCESSING
October 2011 13
Copyright of COMPANY NAME
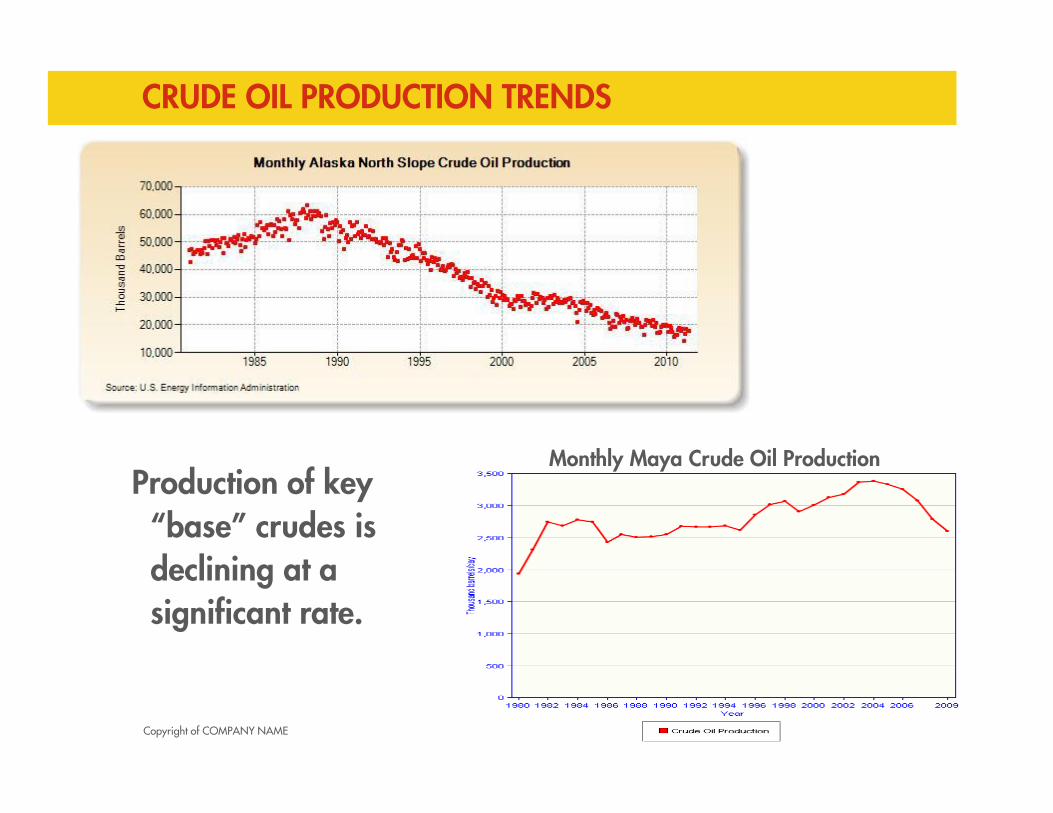
CRUDE OIL PRODUCTION TRENDS
14October 2011
Monthly Maya Crude Oil ProductionProduction of key
“base” crudes is declining at a significant rate.

Copyright of COMPANY NAME
OPPORTUNITY CRUDES KEY CHARACTERISTICS
APITotal Acid Number
(TAN)
Sulfur (%) Total N2 (ppm)
Pitch Vanadium
(ppm)
Pitch Nickel (ppm)
Alaska North Slope
31 0.23 0.9 1725 32 93
Crude 1 31 0.49 1.5 1268 35 45
Crude 2 31 0.56 2.6 1551 250 92
Crude 3 19 0.34 2.1 4678 241 135
Crude 4 20 0.12 3.9 1114 180 49
Crude 5 22 0.97 3.7 3164 348 141
15October 2011

Copyright of COMPANY NAME
IMPLICATIONS
o Refiners will increasingly rely on “opportunity crudes” as production rates of “base crudes” continue to decline.
o Most refiners will have to “metal up” to accommodate increasing amounts of these crudes – not just in crude distillation units but throughout refinery.
o Technology / facilities to monitor “real time” corrosion rates will be a focus in coming years
October 2011 16

Copyright of COMPANY NAME
INTEGRATED MAJORS – DECOUPLING OF REFINING
October 2011 17

Copyright of COMPANY NAME
REFINING CAPACITY CHANGES FOR INTEGRATED MAJORS
CompanyPeak Refining Capacity (mbpd)
Peak Year 2009 Refining Capacity (mbpd)
Percentage Change
Exxonmobil 6,666 1999 6,232 - 6.5%
Royal Dutch Shell 4,387 2003 3,639 - 17.1%
ConocoPhillips 2,831 2006 2,657 - 6.1%
BP 3,111 2002 2,666 - 14.3%
Total 2,708 2005 2,594 - 4.2%
Chevron 2,400 2001 2,158 - 10.1%
18October 2011
Copyright of COMPANY NAME
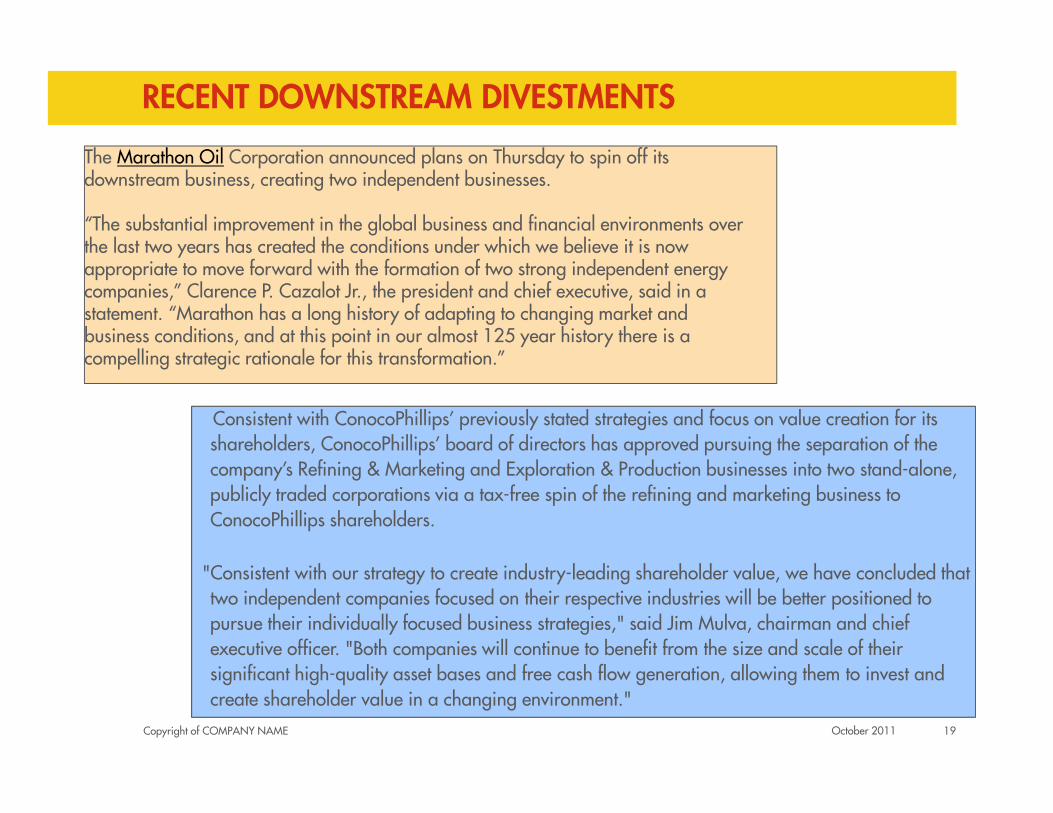
RECENT DOWNSTREAM DIVESTMENTS
19October 2011
The Marathon Oil Corporation announced plans on Thursday to spin off its downstream business, creating two independent businesses.
“The substantial improvement in the global business and financial environments over the last two years has created the conditions under which we believe it is now appropriate to move forward with the formation of two strong independent energy companies,” Clarence P. Cazalot Jr., the president and chief executive, said in a statement. “Marathon has a long history of adapting to changing market and business conditions, and at this point in our almost 125 year history there is a compelling strategic rationale for this transformation.”
Consistent with ConocoPhillips’ previously stated strategies and focus on value creation for its shareholders, ConocoPhillips’ board of directors has approved pursuing the separation of the company’s Refining & Marketing and Exploration & Production businesses into two stand-alone, publicly traded corporations via a tax-free spin of the refining and marketing business to ConocoPhillips shareholders.
"Consistent with our strategy to create industry-leading shareholder value, we have concluded that two independent companies focused on their respective industries will be better positioned to pursue their individually focused business strategies," said Jim Mulva, chairman and chief executive officer. "Both companies will continue to benefit from the size and scale of their significant high-quality asset bases and free cash flow generation, allowing them to invest and create shareholder value in a changing environment."

Copyright of COMPANY NAME
IMPLICATIONS
o Integrated majors continuing to exit refining business – some through divestment of refining assets and some through spinning off of Downstream business as a separate corporate entity. Result is that refinery ownership is moving away from integrated majors towards non-integrated companies.
o To remain viable, refining businesses will need to be able to generate sufficient cash to provide an adequate return to their owners. Since capital expenditures are a significant part of the “cash equation”, these expenditures will come under increasing pressure.
o In addition, focus of capital expenditures will be more weighted toward projects that have a monetary return.
October 2011 20

Copyright of COMPANY NAME
SUMMARY
Ø The Refining business is facing key challenges on several fronts –regulatory, legislative, and economic.
Ø Refiners will increasingly be facing these challenges in world where they will have to ”stand own their own two feet” from a cash perspective.
Ø Projects for refiners will become more complex, need to be planned further in advance, and as lean as possible to be viable
Ø Continued partnership (albeit in perhaps a different way) will be the key to success for both refiners and engineering / construction firms
October 2011 21

Copyright of COMPANY NAME
Q & A
October 2011 22
