emerging technologies in instrumentation and controls: an - ccadet
TRANSCRIPT

NUREG/CR-6888 ORNL/TM-2005/75
Emerging Technologies inInstrumentation and Controls: An Update
Oak Ridge National Laboratory
U.S. Nuclear Regulatory CommissionOffice of Nuclear Regulatory ResearchWashington, DC 20555-0001

NUREG/CR-6888 ORNL/TM-2005/75
Emerging Technologies inInstrumentation andControls: An Update
Manuscript Completed: November 2005Date Published: January 2006
Prepared byK. Korsaha, R. Wetheringtona, R. Wooda
L.F. Millerb , K. Zhaob, A. Paulb
a Oak Ridge National LaboratoryManaged by UT-Battelle, LLCOak Ridge, TN 37831
b University of Tennessee315 Pasqua Engineering BuildingKnoxville, TN 37996-2300
C. E. Antonescu, NRC Project Manager
Prepared forDivision of Engineering TechnologyOffice of Nuclear Regulatory ResearchU.S. Nuclear Regulatory CommissionWashington, DC 20555-0001NRC Job Code Y6962

This Page Intentionally Left Blank

iii
ABSTRACT This report is a summary of advances in eight instrumentation and control (I&C) technology focus areas that have applications in nuclear power plant digital upgrades as well as in new plants. It is the second in a series of planned update reports (the first one was NUREG/CR-6812) in an NRC-sponsored Emerging Technologies study. This study is designed to provide “heads-up” information that will make the NRC better prepared to make regulatory decisions in these areas. This study update focuses on advances in sensors (e.g., temperature, neutron and thermal power sensors) and their potential regulatory impact. Highlights of the findings and conclusions in this report are as follows: 1 The silicon carbide neutron detector has advanced past the developmental stage. However, important
information such as long-term performance (degradation information), drift, etc., could not be adequately assessed. While the detector has a wide dynamic range (with potential for replacing present-day startup, intermediate, and power range monitors), it is important that a combined neutron monitor based on this technology not only exhibit the full dynamic range from startup to 100% power, but also be shown to maintain performance over the long term when at 100% power. Progress in the development of these detectors should continue to be monitored, because of the potential for improved operating and safety margins that such detectors will provide, should they also meet the criteria mentioned above.
2. The Johnson noise thermometer could be commercially available for nuclear power plant applications
within 5 years. A temperature sensor based on Johnson noise is immune to the drift that plagues thermocouples and resistance thermometers. The lack of drift has advantages that could have regulatory implications such as extending calibration intervals. The technology should continue to be monitored.
3. Sensors that are less developed and therefore will require a longer time to reach commercialization
are scintillation-based sensors for in-core temperature and flux measurements and vacuum nanotriodes. In the case of scintillation-based sensors, the primary deficiencies in the technology preventing its use for in-core measurements have been the lack of an effective technique for measuring light within reactor core environments and the rapid darkening of fiber-optic light pipes in high radiation fields. Additionally, scintillation materials darken too rapidly to be useful in bulk form near a nuclear reactor core. For the purposes of this update, no significant progress in overcoming these problems were identified. In the case of vacuum nanotriodes, the technology is also still in early research. However, because of the advantages that advances in both technologies could provide for nuclear power plant I&C, both scintillation-based sensors and vacuum nanotriodes should continue to be monitored.
4. Variability in the radiation response of COTS devices is a significant radiation hardness assurance
(RHA) issue. Approaches such as radiation-hard technologies and improved manufacturing processes may overcome this impediment. For example, advances in radiation-hardened electronics are giving rise to technologies such as phase transition-based random access memories (P-RAMs), which may make application of I&C in harsh environments such as containment possible. These technologies should be monitored.
5. A set of best practices in digital communication in nuclear power plant safety I&C systems should be
developed to support the review of digital I&C system upgrades in current generation plants, as well as in Generation III and Generation IV plants.

This Page Intentionally Left Blank

v

This Page Intentionally Left Blank
vii
TABLE OF CONTENTS ABSTRACT.................................................................................................................................................iii FOREWORD ................................................................................................................................................ v LIST OF FIGURES ..................................................................................................................................... ix EXECUTIVE SUMMARY .........................................................................................................................xi ABBREVIATIONS AND ACRONYMS ................................................................................................... xv 1. INTRODUCTION ................................................................................................................................ 1
1.1 Scope of Study ............................................................................................................................ 1 1.2 Research Approach ..................................................................................................................... 1 1.3 Structure of Report...................................................................................................................... 1
2. SUMMARY UPDATE OF INSTRUMENTATION AND CONTROLS (I&C) TECHNOLOGIES ..3
2.1 Sensors and Measurement Systems ............................................................................................ 3 2.1.1 Silicon Carbide Flux Monitor .................................................................................................. 4 2.1.2 Solid-State Neutron Flux Monitor ........................................................................................... 4 2.1.3 Fuel Mimic Power Monitor (or Constant Temperature Detector) ........................................... 4 2.1.4 Scintillation-Based Measurements for Temperature and Flux ................................................ 7 2.1.5 Johnson Noise Thermometry ................................................................................................... 7 2.1.6 Magnetic Flowmeter for Measurement of Primary Coolant Flow........................................... 7 2.1.7 Fabry-Perot Fiber-Optic Temperature Sensor ......................................................................... 8 2.1.8 Optical Pressure Sensors.......................................................................................................... 8 2.1.9 Gamma Ray Tomographic Spectrometry ................................................................................ 8 2.1.10 Hydrogen Sensor ..................................................................................................................... 9 2.1.11 Smart Sensors .......................................................................................................................... 9
2.2 Communication Media and Networking................................................................................... 10 2.2.1 Sensor Buses.......................................................................................................................... 10 2.2.2 OLE for Process Control ....................................................................................................... 13
2.3 Microprocessors and Other Integrated Circuits ........................................................................ 14 2.3.1 Radiation-Hardened Integrated Circuits ................................................................................ 14 2.3.2 System on a Chip ................................................................................................................... 15 2.3.3 Optical Processors ................................................................................................................. 15 2.3.4 Vertically Stacked Integrated Circuits ................................................................................... 16 2.3.5 Nanotriodes............................................................................................................................ 17 2.3.6 Microelectromechanical Systems (MEMS)........................................................................... 17 2.3.7 Molecular-Scale Electronics .................................................................................................. 18
2.4 Computational Platforms .......................................................................................................... 19 2.4.1 Application-Specific Integrated Circuits (ASICs) and Application-Specific Software......... 19 2.4.2 Real-Time Operating Systems ............................................................................................... 20
2.5 Surveillance, Diagnostics, and Prognostics .............................................................................. 22 2.5.1 Model-Based Techniques ...................................................................................................... 22 2.5.2 Fault Detection for Field Devices .......................................................................................... 23 2.5.3 Forewarning of Failure in Critical Equipment....................................................................... 23 2.5.4 Control Loop Performance Monitoring ................................................................................. 23 2.5.5 Vision-Based Diagnostics...................................................................................................... 24 2.5.6 Laser-Based Alignment Monitoring ...................................................................................... 24
2.6 Control and Decision ................................................................................................................ 25 2.6.1 Data Acquisition and Control in Industrial Plants ................................................................. 25 2.6.2 Supervisory Control System .................................................................................................. 28 2.6.3 Intelligent Agent-Based Control............................................................................................ 28 2.6.4 Non-Mathematical Flow Methods ......................................................................................... 29

viii
2.7 Human-System Interface........................................................................................................... 29 2.7.1 Control and Monitoring Systems........................................................................................... 29 2.7.2 Software Agent-Based Operational Support Systems ........................................................... 30 2.7.3 Virtual Collaborators ............................................................................................................. 30 2.7.4 Biometrics.............................................................................................................................. 32 2.7.5 Automated Visual Surveillance for Facility Monitoring ....................................................... 32 2.7.6 Virtual Reality ....................................................................................................................... 33
2.8 High-Integrity Software ............................................................................................................ 33 2.8.1 Software Development Technologies, Methodologies, and Tools ........................................ 33 2.8.2 Object-Oriented Language: Real-Time Java ......................................................................... 36
3. DETAILED INVESTIGATION OF ADVANCED SENSORS......................................................... 37
3.1 Silicon Carbide Flux Monitor ...................................................................................................37 3.1.1 Basic Principles of the Technology ....................................................................................... 37 3.1.2 Maturity of the Technology ................................................................................................... 38 3.1.3 Potential Regulatory Impact .................................................................................................. 39
3.2 Solid-State Neutron Flux Monitor ............................................................................................ 39 3.2.1 Basic Principles of the Technology ....................................................................................... 39 3.2.2 Maturity of the Technology ................................................................................................... 39 3.2.3 Potential Regulatory Impact .................................................................................................. 40
3.3 Fuel Mimic Power Monitor (or Constant-Temperature Power Sensor).................................... 41 3.3.1 Basic Principles of the Technology ....................................................................................... 41 3.3.2 Maturity of the Technology ................................................................................................... 43 3.3.3 Potential Regulatory Impact .................................................................................................. 43
3.4 Johnson Noise Thermometry .................................................................................................... 43 3.4.1 Basic Principles of the Technology ....................................................................................... 43 3.4.2 Maturity of the Technology ................................................................................................... 46 3.4.3 Potential Regulatory Impact .................................................................................................. 46
3.5 Magnetic Flowmeter for Primary Coolant Flow Measurement ................................................ 46 3.5.1 Basic Principles of the Technology ....................................................................................... 46 3.5.2 Maturity of the Technology ................................................................................................... 47 3.5.3 Potential Regulatory Impact .................................................................................................. 47
3.6 Fabry-Perot Fiber-Optic Temperature Sensors ......................................................................... 47 3.6.1 Basic Principles of the Technology ....................................................................................... 47 3.6.2 Maturity of the Technology ................................................................................................... 48 3.6.3 Potential Regulatory Impact .................................................................................................. 49
3.7 Fiber-Optic Pressure Sensors .................................................................................................... 49 3.7.1 Principles of the Technology ................................................................................................. 49 3.7.2 Maturity of the Technology ................................................................................................... 51 3.7.3 Potential Regulatory Impact .................................................................................................. 52
3.8 Hydrogen Sensors ..................................................................................................................... 52 3.8.1 Basic Principles of the Technology ....................................................................................... 52 3.8.2 Maturity of the Technology ................................................................................................... 53 3.8.3 Potential Regulatory Impact .................................................................................................. 53
3.9 Smart Sensors............................................................................................................................ 53 3.9.1 Sensor Fusion and Enhanced Diagnostics ............................................................................. 53 3.9.2 Maturity of the Technology ................................................................................................... 54 3.9.3 Potential Regulatory Impact .................................................................................................. 54
4. CONCLUSIONS AND RECOMMENDATIONS ............................................................................. 56 5. REFERENCES ................................................................................................................................... 65

ix
LIST OF FIGURES Figure Page 2.1. OPC, a communication technology standard for process control.................................................... 14 2.2. EnLight256. ..................................................................................................................................... 16 2.3. Schematic of a nanotriode ............................................................................................................... 18 2.4. OSEK/VDX standards and implementation in TTPOS ..................................................................... 21 2.5 OSEKtime-based system architecture. ............................................................................................ 22 2.6. Thermal scan of a mechanical component showing a bad bearing on a shaft of an
electrical motor................................................................................................................................ 24 2.7. Generic classical centralized control system architecture. .............................................................. 26 2.8. Generic decentralized control system.............................................................................................. 27 2.9. Buses and processors in a generic industrial plant. ......................................................................... 27 2.10. TELEPERM XP Subsystems........................................................................................................... 28 2.11. General-purpose and open network technologies can be used to configure a compact,
human-friendly supervisory control system. ................................................................................... 28 2.12. Example of control and monitoring system with human-system interface. .................................... 31 2.13. System architecture of a virtual collaborator................................................................................... 31 2.14. Iris scanning at Heathrow Airport, London..................................................................................... 32 3.1. Silicon carbide Schottky diode radiation detector. .......................................................................... 37 3.2. Detection of neutrons via charged particle production by the 6Li(n, α) reaction in a
converter foil. .................................................................................................................................. 38 3.3. General concept of solid-state flux monitor .................................................................................... 40 3.4. Fabrication concept of the solid-state fuel monitor. ........................................................................ 40 3.5. Constant-temperature power sensor Wheatstone bridge control circuit. ......................................... 42 3.6. Cylindrical sensor configuration of the CTPS................................................................................. 42 3.7. Planar sensor configuration of the CTPS. ....................................................................................... 42 3.8. Basic components of a Johnson noise thermometer. ....................................................................... 44 3.9. Schematic for automatic recalibration of RTD from Johnson noise measurement. ........................ 45 3.10. Illustrating the relationship between the PSDs of the individual channel voltages and
the CPSD between them. ................................................................................................................. 45 3.11. Schematic diagram of a dual fiber-optic Fabry-Perot temperature sensor. ..................................... 48 3.12. Fiber-optic pressure transducer. ...................................................................................................... 49 3.13. Sensor head design. ......................................................................................................................... 50 3.14. Sensor block diagram. ..................................................................................................................... 50 3.15. Fabry-Perot cavity. .......................................................................................................................... 51

This Page Intentionally Left Blank
xi
EXECUTIVE SUMMARY
The Nuclear Regulatory Commission (NRC) Digital System Research Plan forms the framework for identifying research areas that the NRC performs to update the tools used in assessing the safety of digital Instrumentation and Controls (I&C) applications in U.S. nuclear power plants. NRC Digital Research Plan for FY 2001–FY 2004 [NRC 2001] identified Emerging Technologies as an area of research. This includes areas that have been shown to be likely to be applied in the future and areas that have the potential to raise safety issues but have not been addressed. By becoming informed of emerging I&C technology and applications, the NRC “…is better prepared to make future regulatory decisions in these areas” [NRC 2001]. Oak Ridge National Laboratory (ORNL) has been tasked to perform the Emerging Technologies study, the first report of which was published in March 2003 as NUREG/CR-6812, “Emerging Technologies in Instrumentation and Controls.” This current report is an update of NUREG/CR-6812. This update (1) discusses the current state of development of the technology focus areas identified in NUREG/CR-6812, (2) identifies advanced sensors as an emerging technology that can affect safety and operating margins and provides a detailed investigation of the topic, and (3) identifies I&C areas that should continue to be monitored in an effort to improve the NRC I&C review process. The methods employed for this emerging technology update survey consisted of literature reviews (in particular, recent scientific and technical journals), Internet searches, vendor contacts, and discussions with technology experts. This report focuses on the following eight technology focus areas that were identified previously in NUREG/CR-6812:
1. Sensors and Measurement Systems, 2. Communications Media and Networking, 3. Microprocessors and other Integrated Circuits, 4. Computational Platforms (computers, programmable logic controllers, application specific
integrated circuits, etc.), 5. Diagnostics and Prognostics, 6. Control and Decision, 7. Human-System Interactions, and 8. High-Integrity Software.
In the following paragraphs, excerpts of technologies under various development stages, as well as their regulatory impact, are described. More detailed information is provided in the report body. For the sensors and measurement systems technology focus area, some of the sensors and sensing techniques that were initiated as a result of the research stimulus provided by the U. S. Department of Energy (DOE) programs [New England Research Institutes (NERI), International Nuclear Energy Research Initiative (INERI), and Nuclear Engineering Education Research (NEER)] have progressed from concepts and laboratory prototypes to becoming potentially commercial products. One notable example of sensors that are close to becoming commercially available is the silicon carbide neutron-flux monitor. This sensor has the potential to combine the functions of current three-range flux monitors into a single system. However, data on important parameters such as drift, accuracy, repeatability, and degradation over time could not be ascertained for this update. It is important that a combined neutron monitor based on this technology not only exhibits the full dynamic range from startup to 100% power, but it should also be shown to not degrade over the long term when at 100% power. The improved operating and safety margins that such detectors will provide, should they also meet all the criteria mentioned above, certainly warrant continued monitoring of progress in their development.

xii
An example of a sensor with potential for commercialization in the near future (within 5 years) is the fuel mimic power monitor (or constant-temperature detector). The instrument represents a unique sensing technology in that it provides a direct measurement of the nuclear energy deposited into a fuel mimic mass. This type of sensor will have the advantage of providing an accurate and direct measurement of reactor power. This may provide licensees a basis to, for example, apply for increase in their licensed operating power level. A significant problem found with the current version, however, is signal drift. In fact, comprehensive testing and characterization of the second-generation constant-temperature power sensor (CTPS) design has yet to be performed. Commercialization of the technology is still a few years away and should be monitored over the long term. Another sensor that could be commercially available for nuclear power plant applications within 5 years is the Johnson noise thermometer (JNT).a The attraction of JNT is that it is inherently drift free and insensitive to the material condition of the sensor. As a result of the latter characteristic, a sensor based on Johnson noise is immune to the contamination and thermo-mechanical response shifts that plague thermocouples and resistance thermometers. This advantage should improve operating as well as safety margins in nuclear power plants. However, problems that have hampered commercial utilization of Johnson noise thermometers include a relatively long response time because of the long integration time required to make a temperature measurement. An ORNL implementation addresses this problem in a dual-mode thermometer by making the temperature measurement as a simple resistance measurement whose resistance to temperature conversion is quasi continuously updated using Johnson noise. Thus, a practical implementation of the JNT in nuclear power plants could be as an on-line, self-calibrating resistance temperature detector (RTD). The regulatory implication of self-calibration is that required calibration intervals could be relaxed. At the other end of the spectrum in terms of commercial availability of the sensor technology are scintillation-based sensors for in-core temperature and flux measurements and vacuum nanotriodes. In the case of scintillation-based sensors, the primary deficiencies in the technology preventing its use for in-core measurements have been the lack of an effective technique for measuring light within reactor core environments and the rapid darkening of fiber-optic light pipes in high radiation fields. Additionally, scintillation materials darken too rapidly to be useful in bulk form near a nuclear reactor core. For the purposes of this update, no significant progress in overcoming these problems could be identified. Advances in some integrated circuit (IC) technologies are also summarized in this report. These technologies include radiation-hardened ICs and system-on-a-chip (SoC) devices. The potential impact toward facilitating smart sensors and sensor networks in containment applications in the long term suggests the value of maintaining awareness of developments for radiation-hard ICs. Likewise, the potential for sensing applications using SoC circuitry that can be located in harsh environments at future reactors and then changed out (perhaps robotically) on a periodic basis provides motivation for monitoring the long-term trends in SoC development. Variability in the radiation response of commercial off-the-shelf (COTS) devices is a significant radiation hardness assurance (RHA) issue. Approaches such as radiation-hard technologies and improved manufacturing processes may resolve this impediment. These improvements are most likely to be seen first in space applications. Therefore, it is warranted to monitor special-purpose applications while confirming the radiation tolerant characteristics of commercial ICs. Considerable progress has been made in radiation-hardened integrated circuit development using materials such as silicon-on-insulator (SOI). State-of-the-art-radiation-hard IC technologies are exemplified by the SCS 750 single-board computer, a Although Johnson noise thermometry has been around for over 50 years [Garrison 1949, Brixy 1971], several technical challenges have hampered its commercial application in nuclear power plants.

xiii
which is Maxwell Technologies’ innovation for space applications. This next-generation supercomputer uses SOI technology fabricated in a radiation-tolerant 0.13-μm complementary metal-oxide semiconductor (CMOS) process. Some of its performance characteristics include (1) one upset every 300 years in a geostationary (GEO) orbit; (2) space-qualified performance at 1800 MIPS; (3) Triple Modular Redundant Processing; (4) use of SOI processors; and (5) use of advanced error corrected synchronous dynamic random access memory (SDRAM).b Another innovation in radiation-hardened chip technology is the integration of chalcogenide material with radiation-hardened CMOS process to produce memory arrays. Chalcogenide-based memory is highly radiation resistant, and its importance in space I&C applications is well recognized. Four megabit C-RAMs represent the current state of the art. The regulatory implication of these advances in radiation-hardened IC technology is that equipment such as smart transmitters could find their way into containment environments in the near future. In the field of nanoelectronics, advances in the development of nanotriodes deserve mention because of the technology’s potential influence on nuclear I&C. In particular, this reinvention of the vacuum tube may show promise for high-radiation and high-temperature environments. Nanotriode technology is still in its infancy, but advances continue to be made. For example, nanotriodes developed at Cambridge University have reached a density of 109 per cm2, comparable to the density of metal-oxide-semiconductor (MOS) transistors. Nanotriodes are advantageous over MOS technology in radiation resistance and temperature tolerance. A current research issue is the reproducibility and longevity of nanotriodes. Although the technology is not likely to be deployed in nuclear power plant environments in the near future, progress in their development should continue to be followed over the long term, given that this technology could enable smart sensors to migrate into the most inhospitable areas within the reactor containment. For SoC devices, most of the current research is focused on the application to the field of communication and computer science. The specialized applications are challenged by the high degree of on-chip integration for complex systems, power consumption, and manufacturability, including testability and reliability. The application of SoC to small systems is already mature. Monitoring the special application of the SoC technique to nuclear instrument development and control performance improvement is appropriate. In sensor fusion, data reconciliation and gross error detection has recently received attention by the nuclear electric utilities in Europe. This technique takes advantage of the plant-wide mass balance and energy balance equations to reconcile plant measurements such that the balance equations are satisfied. Because the easily developed models provide additional functional redundancy to the plant measurements, the reconciled values will be much more accurate than the raw measurements. This technique is mature enough for application in nuclear power plants at steady-state conditions to improve plant performance and provide a sensor calibration standard when digital systems are applied. Additional research is focusing on dynamic data reconciliation for better control. The trend in the use of data networks to serve plant personnel, as well as in the application of digital I&C in some system upgrades, is likely to increase. The current control and protection products on the market (e.g., TELEPERM XP and TELEPERM XS) make use of specialized Ethernet or proprietary protocols for networked microprocessor-based systems. Fieldbus standards continue to proliferate (in the non-nuclear environment) and networked field devices are likely to see increasing application as part of I&C upgrades for plant life extension—with smart sensors becoming more prominent.
b A type of dynamic random-access memory (RAM) that can run at much higher clock speeds than conventional memory.

xiv
High-integrity softwarean area of considerable importance to the application of computer-based systems in nuclear power plants for obvious reasonscontinues to be an important area of research and is briefly reviewed in this report. Considerable progress has been made over the past 15 years or so in increasing the state space capacity of model checkers, to the point where specifications containing hundreds of state variables can often be verified automatically in a few hours. However, realistic designs often contain thousands or millions of state variables, far exceeding the reach of current model checking algorithms. Another class of verification tools called theorem provers can be used to overcome the capacity limitations of model checking. A theorem prover does not search the state space of a specification directly, but instead searches through the space of correctness proofs that a specification satisfies for a given correctness property. In general, model checking and theorem proving are complementary technologies and should be integrated to successfully tackle realistic system designs. An important aspect of the Emerging Technologies series of reports is to identify research needs as well as I&C areas that should continue to be monitored in an effort to improve the NRC review process. An underlying enabling technology that will facilitate reliable nuclear plant digital I&C operation is the implementation of a robust communication protocol. Unfortunately, the unwary use of digital communication in the plant (for example, communication between control, safety, and offsite) has the potential to raise safety and cyber security concerns. A set of best practices in digital communication in nuclear power plant safety I&C systems could be developed to support the review of digital I&C system upgrades in current generation plants, as well as in Generation III and Generation IV plants. Communications media (e.g., cables, fibers, wireless bands) and network systems provide the pathways by which data and information are distributed among the field devices, processing components, and display systems in a plant. In nuclear power plants, traditional direct-wired, point-to-point connections between analog equipment have been the norm. However, the trend in the use of data networks to serve plant personnel, application of digital I&C in system upgrades, and communication between safety and nonsafety systems, is likely to increase. Institute of Electrical and Electronic Engineers (IEEE) Std 7-4.3.2 does not specifically prohibit two-way communication between safety and nonsafety systems. Communication pathways between safety and nonsafety systems are generally acceptable as long as failure of the communication system does not impair the safety function, and the safety function does not rely on nonsafety system inputs to operate. While current NRC regulatory guidelines [e.g., Regulatory Guide (RG) 1.152-2005] do not endorse the guidance provided in IEEE Std 7-4.3.2 for communication independence because it “provides insufficient guidance,” they do not specifically prohibit it. RG 1.152 points to additional guidance provided in Appendix 7.0-A, “Review Process for Digital Instrumentation and Control Systems,” Appendix 7.1-C, “Guidance for Evaluation of Conformance to IEEE Std 603,” and Section 7.9, “Data Communication Systems,” in NUREG-0800. While in agreement with the additional guidance provided in RG 1.152, allowing communication between digital systems in general does introduce the potential for compromising safety. One example is the disabling of a safety parameter display system at the Ohio Davis-Besse nuclear power plant that occurred in January 2003 [Davis-Besse, 2003]. The slammer worm first penetrated the unsecured network of a Davis-Besse contractor, then worked its way through a T1 line bridging that network and Davis-Besse's corporate network. The T1 line was one of multiple ingresses into the Davis-Besses’s business network that completely bypassed the plant's firewall. The plant was reported to have been offline when the incident occurred, thus the breach did not affect the operation of the plant. However, the case does illustrate an important issue: that a cyber security breach can compromise a safety system where interconnection is allowed between plant and corporate networks (or any other network).

xv
ABBREVIATIONS AND ACRONYMS ABWR advanced boiling-water reactor ADC analog-to-digital converter ALARA as low as reasonably achievable AlN aluminum nitride ALWR advanced light water nuclear reactor ASI actuator sensor interface ASIC application-specific integrated circuit AVS automated visual surveillance BWR boiling-water reactor CAN controller area network CCD charge-coupled device CENELEC European Committee for Electrotechnical Standardization (Comité Européen de
Normalisation Electrotechnique) CMOS complementary metal-oxide semiconductor COTS commercial off-the-shelf CPSD cross power spectral density CPU central processing unit CRAM chalcogenide-based random access memory CTPS constant-temperature power sensor DAC digital-to-analog converter DCS distributed control system DER distributed energy resources DF distribution function DM dissimilarity measures DMIPS Dhrystone million instructions per second DNA deoxyribonucleic acid DOE U.S. Department of Energy DP decentralized periphery DSP digital signal processing/processor EM electromagnetic EMI electromagnetic interference EPRI Electric Power Research Institute FFPI fiber-optic Fabry-Perot interferometer FFT Fast Fourier Transform FMS fieldbus message specification FPI Fabry-Perot interferometer GEO geostationary GSD A file extension used to identify a PROFIBUS-DP/PA device HEMT high-electron mobility transistor HMI human-machine interface HTGR high-temperature gas-cooled reactor I&C instrumentation and controls I/O input/output IC integrated circuit IEEE Institute of Electrical and Electronics Engineers, INERI International Nuclear Energy Research Initiative IR infrared ISO International Standards Organization IT information technology

xvi
JAD joint application development JNT Johnson noise thermometer KAERI Korean Atomic Energy Research Institute KTA German Nuclear Safety Standards Commission LC inductor-capacitor LED light-emitting diode LPRM local power range monitor MEM microelectromechanical MEMS microelectromechanical system MFM multilevel flow model MIS metal-insulator-semiconductor MMI man-machine interface MMU memory management unit MOS metal-oxide semiconductor NASA National Aeronautics and Space Administration NEER Nuclear Engineering Education Research NERI Nuclear Energy Research Initiative NIST National Institute of Standards and Technology NPP nuclear power plant NRC U.S. Nuclear Regulatory Commission OLE object linking and embedding OPC OLE for Process Control ORNL Oak Ridge National Laboratory OS operating system OSEK Open systems and the corresponding interfaces for automotive electronics OSEKtime OSEK/VDX time-triggered operating system PA process automation PC personal computer PETS Performance Evaluation of Tracking Surveillance PETS performance evaluation of tracking surveillance PLC programmable logic controller PSD power spectral density PWR pressurized-water reactor RAD rapid application development RAM random-access memory RF radio frequency RG Regulatory Guide RHA radiation hardness assurance ROC receiver operating characteristics ROM read-only memory RTB remote terminal block RTD resistance temperature detector RTOS real-time operating system RUP rational unified process SCADA supervisory control and data acquisition (system) SCIIB self-calibrating interferometer/intensity-based SDLC system development life cycle SDM system development method SDRAM synchronous dynamic random access memory SDS smart distributed system SER Safety Evaluation Report

xvii
SEU single-event upset SiC silicon carbide SoC system on a chip SOI silicon-on-insulator SPACE specification and coding environment SSFM solid-state flux monitor TEMPO Thermal Performance Monitoring and Optimization TTP time-triggered protocol TXS TELEPERM XS UML unified modeling language UT University of Tennessee VC virtual collaborator VDX Vehicle Distributed eXecutive VME VersaModule Euro card (as in VME bus) VSIC vertically stacked integrated circuit

This Page Intentionally Left Blank

1
1. INTRODUCTION 1.1 Scope of Study The purpose of this report is to provide an update on the instrumentation and controls (I&C) technology survey documented in NUREG/CR-6812, Emerging Technologies in Instrumentation and Controls, published in 2003. This report is the second in the series designed to provide periodic reports on the status of specific technologies that have potential applicability for safety-related systems in nuclear power plants and pose emerging research needs. NUREG/CR-6812 provided a broad-brush overview of I&C technologies and served as the baseline for the series of periodic reports specified in the U. S. Nuclear Regulatory Commission (NRC) Plan for Digital Instrumentation and Control (SECY-01-0155). There have been several advances in I&C since NUREG/CR-6812 was published, and this report provides a summary of the state of the art in the technology areas identified in the previous report. From the findings, we develop suggestions for prospective research needs. 1.2 Research Approach The research approach taken in this survey closely follows that used in NUREG/CR-6812. The set of technology focus areas identified in NUREG/CR-6812 was used as the starting point. Then, based on these focus areas, the multidisciplinary expertise at Oak Ridge National Laboratory (ORNL) and the University of Tennessee (UT) was employed to review the state of the art in these technologies. Investigations were conducted that consisted of literature reviews (in particular, recent scientific and technical journals), Internet searches, vendor contacts, and discussions with technology experts. Input was also solicited from nuclear industry representatives such as the Electric Power Research Institute (EPRI). On the basis of the results from this combined expertise, the study provides a summary update on each of these technologies. Sensors are identified as one of the areas in which developments have the greatest likelihood of maturing into commercial deployment in power plants. Additionally, sensors offer the greatest benefits in improving safety and operating margins. Thus, sensor technology is singled out for a detailed discussion after a summary update of the other technologies is provided. Finally, general observations and conclusions are drawn about safety-related issues posed by the expected application of these technologies for upgrades at existing nuclear power plants and for near-term deployment of advanced reactors. The study then suggests confirmatory research approaches that may need to be sponsored by the NRC to promote an understanding of any claimed capabilities of these technologies and their suitability or unsuitability for the nuclear power plant environment. 1.3 Structure of Report The information presented in this report consists of the findings from the emerging technology update survey and observations regarding specific state-of-the-art capabilities, techniques, and components that are candidates for near-term deployment of nuclear applications in existing and evolutionary reactors or may eventually be candidates for deployment in long-term advanced reactor concepts. Using the technology focus areas identified in NUREG/CR-6812 as a basis, Chapter 2 provides a summary update of each technology focus area. Issues addressed are (1) any advantages the particular technology will have in improving the operation economy and safety of nuclear power plants, (2) any new safety issues the new technology will bring about when applied to nuclear power plants, and (3) the impact of the technology on NRC’s license review.

2
Chapter 3 provides a more detailed discussion of advanced sensors, the latter having been identified as an area with significant safety impact and in which developments have the greatest likelihood of maturing into commercial deployment in power plants. In addition, issues discussed include basic principles of the technology and its maturity (e.g., commercial availability or potential for commercialization in the next 5 years). Finally, Chapter 4 presents observations and conclusions about emerging technologies identified in the survey, suggesting confirmatory research approaches that may need to be sponsored by the NRC to promote an understanding of any claimed capabilities of these technologies and their suitability for the nuclear power plant environment.

3
2. SUMMARY UPDATE OF INSTRUMENTATION AND CONTROLS (I&C) TECHNOLOGIES
2.1 Sensors and Measurement Systems Given the range of sensing techniques in existence within the various process industries (e.g., petrochemical, steel, pharmaceutical), NUREG/CR-6812 [Wood 2003] limited the Sensors and Measurement Systems focus area primarily to those measurement systems that relate to the traditional measured variables within the nuclear power industry. We follow a similar approach in this report and provide a summary update on the following sensors in the measurement systems technology focus area.
• silicon carbide flux monitors • solid-state neutron flux monitors • fuel mimic power monitors • scintillation-based measurements for temperature and flux • Johnson noise thermometry • magnetic flowmeters for measurement of primary coolant flow • Fabry-Perot fiber optic temperature sensors • optic pressure sensors • gamma ray tomographic spectrometry • hydrogen sensors • smart sensors
While we provide summary updates for the other technology focus areas in this chapter, we have selected the sensors and measurement systems technology focus area for a more detailed study in the next chapter for the following reasons: (1) sensors are likely to have the greatest safety impact because they have a direct bearing on operating and protection margins; (2) some new sensor designs have the likelihood of maturing into commercial deployment in power plants in the near term; and (3) some of the most significant advances in the technology focus areas are in the area of sensors. Thus, we have devoted Chapter 3 to discuss sensor developments in more detail. Table 2.1 provides a summary of the sensors identified above. In this table, the status column signifies the general time frame for implementation as follows:c
• Category A — Essentially ready for use. The technology is either commercially available now or could be available within a year.
• Category B — Further testing required and is being carried out by the developers. Commercial availability is at least a couple of years away.
• Category C — Some additional development required. Commercial availability is possible within the next 3 to 5 years.
• Category D — Significant development required. Commercial availability is not likely within the next 5 years.
• Category E — Still in the fundamental research stage. Commercial availability may be possible in 5–10 years.
c The category designation is somewhat subjective. It is based on the authors’ assessment of available information and, in some cases, from discussions with experts.

4
2.1.1 Silicon Carbide Flux Monitor The most likely commercial application of the silicon carbide flux monitor is for ex-core neutron monitoring with no gamma compensation. Prototypes have been tested under research reactor conditions. The test results show that the key features, such as linear pulse-mode operation without gamma compensation, are comparable to the presently used gas-filled, ex-core detectors. It is anticipated that a wide-range silicon carbide neutron detector can now be designed to replace the combined functions of the multiple power range detectors in current use. This technology is past the developmental stage and is essentially ready for use. 2.1.2 Solid-State Neutron Flux Monitor The most likely commercial application of the solid-state neutron flux monitor is for in-core flux mapping. The solid-state flux monitor (SSFM) functions both as a neutron-pulse monitor and a dose-sensitive resistive element. Generation II SSFM prototype sensors have been tested at ORNL to characterize the stability and leakage current at room temperature where no incident gamma radiation is present. The results showed that the leakage current is comparable to the presently used gas-filled fission chamber. Design improvements are required to reduce the leakage current to enable potential deployment of the device at core temperatures that are higher than the temperatures of water reactors. The stability of the device also requires further investigation because device polarization appears to be significant [ORNL 2005]. In addition, the long-term survivability of this device under in-core environments has not been demonstrated. In general, commercialization of this device is still several years away, and the technology should continue to be monitored. 2.1.3 Fuel Mimic Power Monitor (or Constant Temperature Nuclear Power Sensor) The fuel mimic power monitor or constant temperature nuclear power sensor (CTPS) represents a unique sensing technology that provides a direct measurement of the nuclear energy deposited into a fuel mimic mass, rather than simply neutron flux, as with other detectors. Thus, the most likely commercial application of the technology is for the direct measurement of nuclear power inside the core. Arrays of CTPS sensors could provide an extremely accurate picture of core power distribution. It is also possible to incorporate a CTPS into a fuel rod so that power distribution could be determined with much greater resolution than is currently achievable. Tests on the first-generation, controlled-calorimetric, in-core instrument prototypes and subsequent modeling showed three existing problems: lack of proportionality in the relative neutron and photon response, a relatively low bandwidth due to nonuniform distribution of nuclear and electrical energy deposition, and drift due to heat transfer through the sensor power leads. The second-generation sensor design forces the temperature gradient into a thin metal axial region that gives a uniform energy distribution from all sources. It also provides better control of thermal leakage and contact resistances and improves the prediction with increased bandwidth and better proportionality. Comprehensive testing and characterization of this second-generation design has not yet been performed. Commercialization of the technology is still a few years away and should be monitored over the long term.

5
Table 2.1 Summary of state of the art of sensor technology focus area
Technology Description of principle Foreseeable application New progress Statusa Conclusions
SiC neutron flux monitor
6LiF deposited on top of a thin SiC layer converts neutrons to charged particles via the Li(n,α)3H reaction. Charge is collected under a voltage bias
Ex-core neutron monitoring with no gamma compensation
Prototype tested under research reactor conditions A
Essentially ready for use
Solid-state neutron flux monitor
Flux-induced change in electric resistance of polycrystalline aluminum nitride
In-core flux mapping
The stability and leakage current tested at room temperature with no incident gamma radiation
B Needs further testing
Fuel mimic power monitor (or constant temperature power sensor)
Control the input electric energy to a fuel pellet to maintain constant temperature when reactor is at some steady state power level. The electrical power required to maintain constant temperature is a measure of the nuclear power level
Direct measurement of the nuclear energy deposition
Second-generation prototype with improved bandwidth and proportionality has been constructed. However, comprehensive testing and characterization had yet to be performed at the time of writing
B
(1) Restricted to steady- state operation (2) Needs demonstration testing at reactor operation conditions
Johnson noise thermometry
Electronic vibration due to thermal agitation of atoms
Self-calibrating resistance temperature detectors (RTDs)
(1) Sensitivity to electromagnetic (EM) noise (2) Complexity of implementation
C
Requires radiation- and thermally-hardened preamp. Improvements in signal processing and rad-hard electronics are still needed
Magnetic flowmeters Conductor passes through magnetic field generates voltage prop to velocity
Currently tested for primary flow measurement in pressurized-water reactors (PWRs)
Determination of how to connect liner to electrode and select proper liner for magnetic flow
D Needs to solve problem of radiation susceptibility of liner
Fabry-Perot fiber-optic temperature sensor
Principle of superposition of waves
Tested for irradiation effects, high temperature, and pressure
Degradation caused by irradiation observed D
Needs results of radiation exposure testing; more exhaustive tests may be required

6
Table 2.1 Summary of state of the art of sensor technology focus area (continued)
Technology Description of principle Foreseeable application New progress Statusa Conclusions
Optical pressure sensor Detects the change in optical guiding path defined by a compressible medium
(1) Pressure measurement in high-temperature, high-pressure, corrosive environment (2) Optical Fabry-Perot interferometer to detect pump cavitation and flow instabilities
(1) Demonstrated application in harsh radiation environment (2) Experimental study is performed
C
Need to improve durability and demonstrate performance
Gamma ray tomographic spectrometry
Use energy and time of Compton scatter event and photon electric absorption event to project arrival angle of an incident Gamma ray
(1) Image of pebble bed coating structure (2) Real-time characterization of radiation field
In use after the improved cadmium zinc telluride production
A
Expect widespread application of the technique for more efficient implementation of the as low as reasonably achievable (ALARA) principle
Hydrogen sensor Uses palladium as catalyst to allow hydrogen to diffuse into a metal and change the resistance
Post-accident hydrogen monitoring
Robust hydrogen sensors have been integrated onto a single chip
C
Needs to be able to withstand the harsh post-accident environment
Sensor fusion Use functional redundancy for sensor fault diagnosis
On-line instrument calibration and fault diagnosis
Demonstration testing has been done B
Could be integrated into distributed control system for next- generation nuclear power plants (NPPs)
Enhanced diagnostics Real-time diagnosis through built- in software and hardware testing
On-line instrument calibration and fault diagnosis
Ultra-sensitive capacitive pressure sensor with built-in temperature compensation
C Extensive use of the principle in NPPs
a A = ready for use; B = confirmatory testing required; C = some additional development required; D = significant development required; E = fundamental research required.

7
2.1.4 Scintillation-Based Measurements for Temperature and Flux The purpose of scintillation-based measurement is to obtain more accurate, reliable, and cost-effective determination of in-core power density that will facilitate higher fuel burn-up, more efficient core loadings, and uniform power distributions. Although the probe would be generally applicable to any reactor technology, it is being specifically targeted to accommodate the higher core temperatures of high-temperature gas-cooled reactors (HTGRs). The primary deficiencies in the technology preventing its use for in-core measurements are the lack of an effective technique for measuring light within reactor core environments and the rapid darkening of fiber-optic light pipes in high radiation fields. For the purposes of this update, no significant progress in overcoming these problems was identified. 2.1.5 Johnson Noise Thermometry Of the two basic types of Johnson noise thermometer (JNT) under development—inductive JNTs and conductive JNTs—the conductive JNT is closest to being commercialized. The complexity of implementing this type of sensor has been one of the most significant drawbacks in its development. For example, until recently, sensitive analog band pass filters were used as part of signal processing in JNT systems in Europe and in the United States, and these filters were often difficult to stabilize, even by skilled operators. Other problems that have hampered commercial utilization include (1) a relatively long response time because of the long integration time required to make a temperature measurement to within an acceptable uncertainty and (2) sensitivity to electromagnetic noise. To address the system complexity issue, scientists at the National Institute of Standards and Technology (NIST) report that now the extensive use of digital signal processing (DSP) techniques makes it possible to avoid the use of analog band pass elements. The new system, with state-of-the-art digital circuitry, makes the system easier to use. To address the problem of long response time, researchers at ORNL have developed a dual-mode thermometer. This sensor makes the temperature measurement as a simple RTD resistance measurement whose resistance to temperature conversion is quasi continuously updated using Johnson noise. To address electromagnetic interference (EMI) issues, DSP methods are used to quantitatively evaluate the magnitude of any periodic interference in the noise spectrum and subtract it from the signal, thus minimizing the interference effect as much as possible. The JNT system at NIST utilizes Fast Fourier Transform (FFT) cross-correlation noise power spectra with 1-Hz resolution and periodic interference are readily distinguished from the thermal noise or reference system pseudonoise. It appears that the most significant hurdle left to be overcome is the need for radiation- and thermally hardened preamplifier electronics for containment use. Thus, JNT is a potential temperature measurement system for the commercial nuclear marketplace in the near future (3–5 years) and should continue to be monitored. 2.1.6 Magnetic Flowmeter for Measurement of Primary Coolant Flow Until recently, the susceptibility to radiation of the liners in magnetic flowmeters has limited their use. Researchers at ORNL [Holcomb 2002, Holcomb 2003] are studying the behavior of these liners in radiation fields that result in a lifetime exposure dose of 2.4 × 10⁸ rads. This level of expected exposure is based on coolant system data from Generation II PWRs, and test plans for magnetic flowmeter liners in this type of environment are being developed. The development of materials for a liner that can survive high-radiation environments is a primary objective. This effort includes production of liners with an internal electrode structure and electrical feed-through test pieces. Current-generation flowmeter electronics could utilize the new liner technology. Progress in radiation-resistant liner technology should continue to be monitored.

8
2.1.7 Fabry-Perot Fiber-Optic Temperature Sensor The Fabry-Perot fiber-optic temperature sensor is a technology likely to be deployed in nuclear power plants in the near term. Fiber-optic sensors have several advantages which make them attractive for use in harsh environments—immunity to electromagnetic and radio-frequency interference, resistance to corrosive environments, high reliability, and relatively high accuracy. However, recent studies have shown this type of sensor to exhibit some offset in mixed high-neutron/gamma fields, which nevertheless anneals after the temperature is increased. Other research has suggested that the temperature offset may also be reduced by improved welding methods. If these shifts in calibration can be compensated for with an on-line sensing or calibration model, the Fabry-Perot temperature sensor, or a similar fiber-optic technology, will be suitable for applications in nuclear power plants. The technology should continue to be monitored. 2.1.8 Optical Pressure Sensors Optic pressure sensors have demonstrated their successes in combustion applications such as pressure-sensing spark plugs, glow plugs, and fuel injectors. They have also been used in noncombustion applications, such as monitoring pressure in natural gas pipeline compressors, plastic melt pressures, and pressure control in a pharmaceutical plant. The survivability of fiber Bragg grating–based optic sensors has been demonstrated for radiation levels up to 2 × 10¹⁹ fast neutrons/cm2 and 87 Grad (0.87 Giga Gy) gamma in a combined neutron and gamma environment. One application of fiber-optic sensing technology that deserves attention is the use of fiber-optic Fabry-Perot interferometers (FFPIs) to detect cavitations and flow instabilities in centrifugal pumps in nuclear power plants. The dynamic pressure resulting from the pump suction and discharge effects, cavitations, vane-pass pulsations, and excessive-wear ring leakage for a high-energy process may cause large dynamic axial forces, leading to premature thrust-bearing failures. Continuously monitoring the dynamic pressure provides a useful indicator of unsafe operation of pumps. Standard pressure transducers are limited to processes below about 300°C, but this FFPI sensing system is able to extend the operating temperature up to 800°C and to improve the sensitivity by two orders of magnitude. Ongoing development of fiber-optic sensor technology is directed toward improving sensor performance and long-term durability. Many applications for nuclear power plants should be available in the next decade. 2.1.9 Gamma Ray Tomographic Spectrometry Gamma ray imaging techniques were not successfully applied for real-time characterization of radiation fields in nuclear power plants until the end of 1990s, primarily because of the requirements for large size and special shielding. The newly designed GammaCamTM has a compact, portable package with the potential of overcoming these limitations. The output from the GammaCam is in the form of color visual images of the scanned area, overlaid with a scaled color representation of the radiation field(s) present. The GammaCam system is particularly useful for obtaining information on the location and intensity of radiation fields, which can be used to locate hot spots. The current system allows for the reliable acquisition of gamma ray images in high-radiation environments, has a field of view of 25°, permitting radiation mapping of large areas, and is able to cover most of the energies of interest in nuclear power plants. The performance of this system has been demonstrated in field experiments to help health physicists rapidly perform a preliminary characterization of an area and identify the precise location of the strongest sources while minimizing the exposure.

9
It is reasonable to expect widespread application of the gamma ray imaging technique for more efficient implementation of the ALARA principle in nuclear power plants in the near term. This tool is well suited for ALARA programs, as it enables remote characterization of radiation source areas. 2.1.10 Hydrogen Sensor Hydrogen sensors have nuclear power applications both in the near term as monitors for hydrogen accumulation in reactor systems, and in the long term as an essential element of a nuclear hydrogen production plant. Indeed, as hydrogen technology has emerged as a clean, abundant energy source, many hydrogen sensor technologies have been developed by different industries in the past 5 years. Catalytic bead sensors can measure hydrogen concentrations of 1 to 5% with a 10- to 30-s response time. Semiconductor and electrochemical hydrogen sensors have very fast response times (less than several seconds), but they are not appropriate for post-accident measurements in nuclear power plants because oxygen concentrations also affect the resistance and the chemical reaction. Palladium alloy sensors, which have rapid responses and are robust in varying environments, would be effective monitors in nuclear applications. A robust, wide-range hydrogen sensor has been developed by Sandia National Laboratories. This hydrogen sensor uses (1) catalytic palladium nickel (PdNi) gate metallization on field-effect transistor sensors for detecting low concentrations of hydrogen (part per million), (2) PdNi resistor sensors for detecting higher concentrations of hydrogen (up to 100%), and (3) on-chip microthermometers and microheaters for maintaining constant chip temperature. The design is aimed at addressing the drawbacks of current hydrogen sensors: limited dynamic range; poor reproducibility and reversibility; unacceptable frequency of false alarms; and the tendency to be slow, unreliable, and difficult to use. Some additional issues for nuclear application include the ability to remove sulfur-bearing contaminants from the palladium surface for accurate measurements and functionality in nonuniform hydrogen distribution and the harsh environment of high temperature, high pressure, and high humidity in the containment after an accident. Aluminum nitride (AlN)-based hydrogen sensors are also under development. This unique sensor is based on a palladium/AlN/silicon structure, which behaves similarly to a metal-insulator-semiconductor (MIS) device. The device is reported to be highly selective, showing no response to oxygen, propane, or carbon monoxide, and capable of detecting hydrogen concentrations down to 1 ppm in the surrounding flow. While this device holds a lot of promise, much work is needed before it can be commercialized. Ongoing work has focused on characterizing the electrical properties of the device, characterizing the exact nature of the sensing mechanism, and optimizing the performance by varying palladium and AlN thicknesses and employing various palladium-based alloys. Hydrogen sensor technologies should continue to be monitored as continued improvement is very likely. 2.1.11 Smart Sensors Sensor Fusion In sensor fusion, data reconciliation and gross error detection has recently received attention by the nuclear electric utilities in Europe. This technique takes advantage of the plantwide mass balance and energy balance equations to reconcile plant measurements, such that the balance equations are satisfied. Because the easily developed models provide additional functional redundancy to the plant measurements, the reconciled values will be much more accurate than the raw measurements. This technique is mature enough for application in nuclear power plants at steady-state conditions to improve

10
plant performance and provide a sensor calibration standard when digital systems are applied. Additional research is focusing on dynamic data reconciliation for better control. Enhanced Diagnostics An alternative approach to smart sensors is for the sensors to have the capability to realize the diagnosis and report on their own conditions through built-in software- and hardware-testing capabilities. Because this technique depends on individual sensor design, it is difficult to completely review this topic. However, the trend toward sensors with the capability of self-checking and calibration as well as intelligent and automatic failure diagnosis is certain to increase, and such sensors will find greater application in nuclear power plants. This technology will reduce personnel costs and increase equipment reliability by detecting a fault at its incipient stage. For instance, Integrated Sensing Systems, Inc., has developed an ultrasensitive capacitive pressure sensor that has built-in temperature compensation and provides features such as self-testing and self-calibration. 2.2 Communication Media and Networking Communications media (e.g., cables, fibers, wireless bands) and network systems provide the pathways by which data and information are distributed among the field devices, processing components, and display systems in a plant. In nuclear power, traditional direct-wired, point-to-point connections between analog equipment have been the norm. However, the trend to use data networks is likely to increase, serving plant personnel and the application of digital I&C in some system upgrades. The current control and protection products on the market (e.g., TELEPERM XP and TELEPERM XS) [TELEPERM (1)] make use of specialized Ethernet or proprietary protocols for networked microprocessor-based systems. Fieldbus standards are maturing, and networked field device are likely to see increasing application as part of I&C upgrades for plant life extension—with smart sensors becoming more prominent. As pointed out in NUREG/CR-6812, it is to be expected that new plants, both in the near term and the long term, will take advantage of the advances in communications technologies to facilitate highly integrated, autonomous control and information systems. In addition, future nuclear power plants may not necessarily have complete separation of safety systems from control systems [Wood 2003]. 2.2.1 Sensor Buses The availability of bus systems has made communication between programmable controllers and personal computers very effective with devices such as limit switches, pushbuttons, and motor starters. There are about a dozen of these so-called device-level networks. The most widely used buses—actuator sensor interface, control area network, Device Net, smart distributed system, Interbus-S, LonWorks, Profibus, and Seriplex—are discussed below. Actuator Sensor Interface An actuator sensor interface (ASI) is a wiring system that connects power and signal (input and output) from a programmable logic controller (PLC) to devices on a machine or process. In its basic form, the ASI features only one cable (a simple pair) that runs from the PLC input/output (I/O) card for up to 300 meters (with repeaters), connecting proximity switches, photo sensors, motor starters, push buttons, signal columns, solenoids, valves, and switches. Safety devices can be connected to the same networks. Each of these field devices can have an integrated ASI connection or be connected to an I/O node. One master PLC controls up to 31 nodes (62 with ASI 2.1), and each node can be up to 4I/4O (or 8 inputs or 8 outputs). So the maximum I/O per ASI master is 248 (465 with ASI 2.1). A master PLC will normally need a power supply, an ASI output module, and possibly a communications module to interface with a higher field bus (e.g., Profibus or Devicenet) known as a gateway. ASI (ASI bus) is a simple bus system

11
that connects intelligent sensors using a mechanically keyed two-wire cable. This cable is responsible for transmitting control and device data, powering the devices, configuring the system architecture, and monitoring the network. In many installations, an ASI bus can replace more complex systems and drastically simplify wiring and diagnostics. ASI is also universal, with devices from different manufacturers being 100% compatible with one another. Controller Area Network A controller area network (CAN) is a common small-area-network solution that supports distributed product and distributed system architectures. The CAN bus is used to interconnect a network of electronic nodes or modules. Typically, a two-wire, twisted-pair cable is used for the network interconnection. The CAN protocol is a set of stringent rules implemented in silicon that supports the serial transfer of information between two or more nodes. CAN has the following features:
• A multimaster hierarchy. This allows constructing intelligent and redundant systems. If one network node is defective, the network is still able to operate.
• Broadcast communication. A sender of information transmits to all devices on the bus. All receiving devices read the message and then decide whether it is relevant to them. Because all devices in the system use the same information, data integrity is guaranteed.
• Sophisticated error-detection mechanisms and retransmission of faulty messages. This feature also guarantees data integrity.
CAN is the International Standards Organization (ISO) standard for automotive networking and is used in virtually all industries (e.g., automotive, manufacturing, agricultural, medical, building controls, marine, aerospace). Device Net Device Net is an open, low-cost communications link based on the reliable CAN technology to interconnect industrial devices (such as limit switches, photoelectric sensors, valve manifolds, motor starters, process sensors, panel displays, operator interfaces) via a single network. This technology eliminates expensive wiring and failure due to the increase in number of connections. It also reduces the cost and time to wire and install industrial automation devices while providing reliable interchangeability of components from multiple vendors. The direct connectivity provides improved communication between devices as well as important device-level diagnostics not easily accessible or available through hardwired I/O interfaces. This technology is used extensively in the United States, Australia, New Zealand, Japan, and China; and it is rapidly gaining popularity in Europe. Device Net is based on the ISO CAN standard for automotive networking. Device Net is now an official European Committee for Electrotechnical Standardization (CENELEC) standard (EN50325). Smart Distributed System The Smart Distributed System (SDS), developed by Honeywell’s Micro Switch Division, is described by the manufacturer as an advanced bus system for intelligent sensors and actuators. This CAN-based network, open at both the control and device levels, streamlines installation, optimizes machine applications, and empowers inputs and outputs to operate at various levels. Combining the power of CAN technology, Honeywell personal computer (PC) control, and intelligent I/O devices, the smart distribution system (SDS) provides an integrated solution. Over a single four-wire cable, SDS can interface with up to 64 nodes with a maximum of 126 addresses. These intelligent sensor and actuator

12
devices do more than just turn on and off; they have advanced device-level functions and system and device diagnostics. Interbus-S Interbus-S is a ring-based distributed device network for manufacturing and process control. An Interbus-S system consists of a controller board installed into a PLC or computer (PC, VME, etc.) that communicates to a variety of I/O devices. This device is available on the Series 90-30 PLC (Horner Electric modules), Series 90-70 PLC (VME Solution from Phoenix), and Field Control I/O (Horner Electric BIU). It treats data as a shift register and is supported by a variety of third-party devices. LonWorks The LonWorks network communicates using LonTalk, the standardized language of the network. LonTalk consists of a series of underlying protocols that allow intelligent communication among various devices on a network. The protocol provides a set of services that allow the application program in a device to send and receive messages from other devices over the network without needing to know the topology of the network or the names, addresses, or functions of other devices. The LonWorks protocol can optionally provide end-to-end acknowledgment and authentication of messages and priority delivery to provide bounded transaction times. Support for network management services allows remote network management tools to interact with devices over the network to reconfigure network addresses and parameters, download application programs, report network problems, and start, stop, or reset device application programs. LonTalk—and thus LonWorks networks—can be implemented over any medium, including power lines, twisted pair, radio frequency (RF), infrared (IR), coaxial cable, and fiber optics. PROFIBUS PROFIBUS is one of the most widely used field bus architectures for industrial control and automation in Europe and the United States. It is well developed and is supported by large companies such as Siemens. Each device is described in a profile file called a GSDd file created by the manufacturer. Baud rate can be selected from 9.6 kB/s up to 12 MB/s, with up to 126 devices on the same bus. The PROFIBUS family is composed of three protocols:
• PROFIBUS-Fieldbus Message Specification (FMS): a peer-to-peer messaging format that allows masters to communicate with one another. An example is PLC-to-PLC communication. It also supports data exchange with field devices. FMS can thus be used for a wide variety of applications, operating at average transmission speeds. However, this ability to provide a wide variety of functions also makes it more complex to implement compared to the other variants.
• PROFIBUS-Decentralized Periphery (DP): This is the high-speed solution of PROFIBUS. It is
optimized especially for communication between automation systems and decentralized field devices (e.g., sensors). It uses a master-slave protocol, in which the master periodically scans the slaves. Multiple masters are possible, in which case, each slave device is assigned to one master. Multiple masters can read input from a device, but only one master can write outputs to that device. PROFIBUS-DP communicates via cyclic data traffic exclusively. Each field device exchanges its I/O data with the automation device, the master, within a cycle time.
d A GSD file is used to identify a PROFIBUS-DP/PA device (master or slave). It contains data making it possible to have manufacturer independent configuration tools. Typical information in a GSD file is vendor information, baud rates supported, timing information, options/features supported, and available I/O signals. A GSD file must be available for every decentralized periphery (DP)/process automation (PA) slave.

13
• PROFIBUS-Process Automation (PA): This device is similar to PROFIBUS-DP, with diagnostic
functions. It is often used in intrinsically safe environments required by chemical and petrochemical process applications. Unlike the automated applications in manufacturing engineering, which require short cycle times of a few milliseconds, other factors are important in process automation, including (1) intrinsically safe transmission techniques, (2) ability of field devices to be powered over the bus cable, (3) reliable data transmission, and (4) interoperability (standardization of device functions). The aspects of “intrinsic safety” and “bus supply” were neglected at first when PROFIBUS was standardized. The PROFIBUS-PA specification published in March 1995 included this transmission technique for intrinsically safe installations and field devices powered over bus cables [PROFIBUS-PA].
Seriplex The Seriplex network, which is supported by Schneider Electric, offers a lot of flexibility. It has been designed to effectively and efficiently network the basic bit-level devices on the plant floor. Unlike most networks, which require a large investment in software and training, the Seriplex network technology is easy to use and has lower installation and maintenance costs. The Seriplex control bus includes cable runs of 5000 ft or more. System throughput time is 0.4 ms for 32 sensors and the same for actuators (5 ms for 510 I/O). It supports more than 255 inputs and 255 outputs. The design eliminates overhead communications and offers system flexibility without system reconfiguration. It uses any wiring configuration (e.g., star, loop, tree, trunk, or daisy chain) consisting of a small, four-wire cable that provides both communication and power and connects directly to over 510 devices. The system eliminates the thousands of parallel wires that usually run through a conduit between local control cabinets and devices. The Seriplex control bus offers the advantages of distributed I/O, plus fast performance, easy configurability, and lower installed cost. Recently, Leviton Manufacturing introduced a new surge protection device designed to provide transient voltage surge suppression for products operating on Seriplex control bus networks. The Class 9999 Type SPXF Seriplex module simplifies motor monitoring and network control of contactors, starters, and overload relays. It reduces the cost of control and power wiring, allowing controls to be linked by a single Seriplex sensor bus cable. The input, output, alarms, and trip indicators are available to the host controller and each module’s LED display, providing local and remote status monitoring. It has two settable current threshold alarms, two cause-of-trip data signals, an overload relay trip status signal, and remote reset capability. Seriplex and ASI have markedly similar characteristics. They are fast, with transmission speeds exceeding 100 kB/s. Both use a low-cost application-specific integrated circuit (ASIC) embedded in the sensor or in a nearby terminal block. Both buses supply power to the devices connected to them; both are designed to be easy to use. The complexity is buried in the ASIC, so the user has little concern about network details. 2.2.2 OLE for Process Control Object linking and embedding (OLE) is Microsoft’s protocol for creating compound documents. With OLE, it is possible to dynamically link files and applications together. An object is a combination of data and the application needed to modify that data. Objects can be embedded in or linked to documents created with a different application. For example, an Excel spreadsheet can be embedded within a Microsoft Word document using OLE. Double-clicking the embedded spreadsheet will launch Excel and allow the user to modify the sheet. OLE for Process Control (OPC) is a new technology designed to bridge various data sources [e.g., from PLCs, pressure and temperature gauges, and distributed control systems (DCSs)] from different vendors

14
through a common communication technology standard. Typically, vendors connect these data sources via serial, Ethernet, wireless, or even radio links to various applications, using Windows, UNIX, or VMX operating systems. OPC defines a common standard interface that allows applications to access data from these various process control devices. The applications must implement one OPC-compliant driver to access data from any OPC-compliant server (see Fig. 2.1). Thus, the data access method remains the same regardless of the type and source of data. This means that users are free to choose the software and hardware that meet their primary production needs, without having to consider the availability of proprietary drivers. OPC components fit into two categories: OPC clients and OPC servers. A client is typically a data sink—an application that uses data in some way, such as a man-machine interface (MMI) or supervisory control and data acquisition (SCADA) package. A server is a data source—a device-specific program that collects data from a field device, then makes it available to an OPC client. A client interacts with a server using a well-defined OPC interface. Therefore, any OPC client can communicate with any OPC server, regardless of the type of device from which the server is designed to collect data. OPC is built using Microsoft’s OLE technology. Also, the OPC specification was designed by an open foundation to meet the general needs of industry, not the specific needs of a few software or hardware manufacturers. The specification also provides for a robust evolution of functionality over time, so that OPC components can meet the emerging needs of industry.
PLC
Gauge RTD
DCS
OPC
Spreadsheet
Trender
HMI
PLC
Gauge RTD
DCS
OPC
Spreadsheet
Trender
HMI
Fig. 2.1. OPC, a communication technology standard for process control. 2.3 Microprocessors and Other Integrated Circuits 2.3.1 Radiation-Hardened Integrated Circuits Considerable progress has been made in radiation-hardened integrated circuit development using materials such as silicon-on-insulator (SOI). State of the art radiation-hardened integrated circuit (IC) technologies are exemplified by the SCS750 single-board computer, which is Maxwell Technologies’ innovation for space applications [Maxwell Technologies 2004]. This single board computer uses SOI technology fabricated in a radiation-tolerant 0.13-μm complementary metal-oxide semiconductor (CMOS) process. Its performance characteristics include (1) one upset every 300 years in a geostationary

15
orbit (GEO), (2) space qualified performance at 1800 MIPS, (3) triple modular redundant processing, (4) use of SOI processors, and (5) the use of advanced error corrected synchronous dynamic random access memory (SDRAM). In addition, power consumption is selectable from 5 – 20W. This next-generation supercomputer will dramatically increase on-board data processing, mission planning, and critical decision making. ATMEL Corporation has manufactured a radiation-hard 0.18-μm CMOS-cell-based ASIC for high-reliability space applications. The ATMEL ATC18RHA [ATMEL 2004] is fabricated on a proprietary 0.18-μm with six-layer metal CMOS process intended for space use. Another innovation in radiation-hardened chip technology is the development of chalcogenide-based random access memories (C-RAM). The term “chalcogen” refers to Group VI elements of the periodic table, and “chalcogenide” refers to an alloy with at least one of the Group VI elements. An example of a chalcogenide material is Ge2Sb2Te5. Chalcogenide is a proven phase change material used in rewriteable CDs and DVDs. This material changes phases, reversibly and quickly, between an amorphous state that is dull in appearance and electrically high in resistance, and a polycrystalline state that is highly reflective and low in resistance. Chalcogenide-based memory is highly radiation resistant, and its importance in space I&C applications is well recognized. Serious attempts to develop chalcogenide-based nonvolatile memory technology for space applications began with the successful integration of chalcogenide material (Ge2Sb2Te5) from Ovonyx with BAE Systems’ 0.5µm radiation hardened CMOS to produce 64-kB arrays. Following the success of this project, the next generation of C-RAM fabricated was a 4M-bit product implemented in 0.25µm radiation-hardened CMOS. Four megabit C-RAMs represents the current state of the art. 2.3.2 System on a Chip System on a chip (SoC) could eventually lead to a sensor on a chip application that could be located in harsh environments and changed out (perhaps robotically) periodically. This would facilitate new measurements of monitoring capabilities at remote or harsh locations over the lifetime of a nuclear power plant without requiring expensive cabling or qualification for an extended life. Most of the current research is focused on applying technologies currently in use in the fields of communication and computer science. The specialized applications are challenged by the high degree of on-chip integration for complex systems, power consumption, and manufacturability, including testability and reliability. The application of SoC to small systems is already mature. The National Aeronautics and Space Administration (NASA) has developed a remote I/O (TRIO) chip that can interface to 32 transducers with current- and voltage-sensing capability, a read-out chip, and a precise time-interval chip—all of which are incorporated into a particle spectroscopy instrument [Paschalidis 2003]. Monitoring the special application of the SoC technique to nuclear instrument development and control performance improvement is appropriate. 2.3.3 Optical Processors An Israeli company, Lenslet, Ltd., claims that its optical DSP [Lenslet 2004], which runs up to 8 tera operations per second (a thousand times faster than existing products) will open the door for new applications for the defense, homeland security, multimedia, and communications fields. The company claims to have developed the world’s first commercial optical DSP, which includes wireless and cellular communications, software-defined radio, real-time video compressions, radar and electronic warfare, and biotechnology, and data mining.
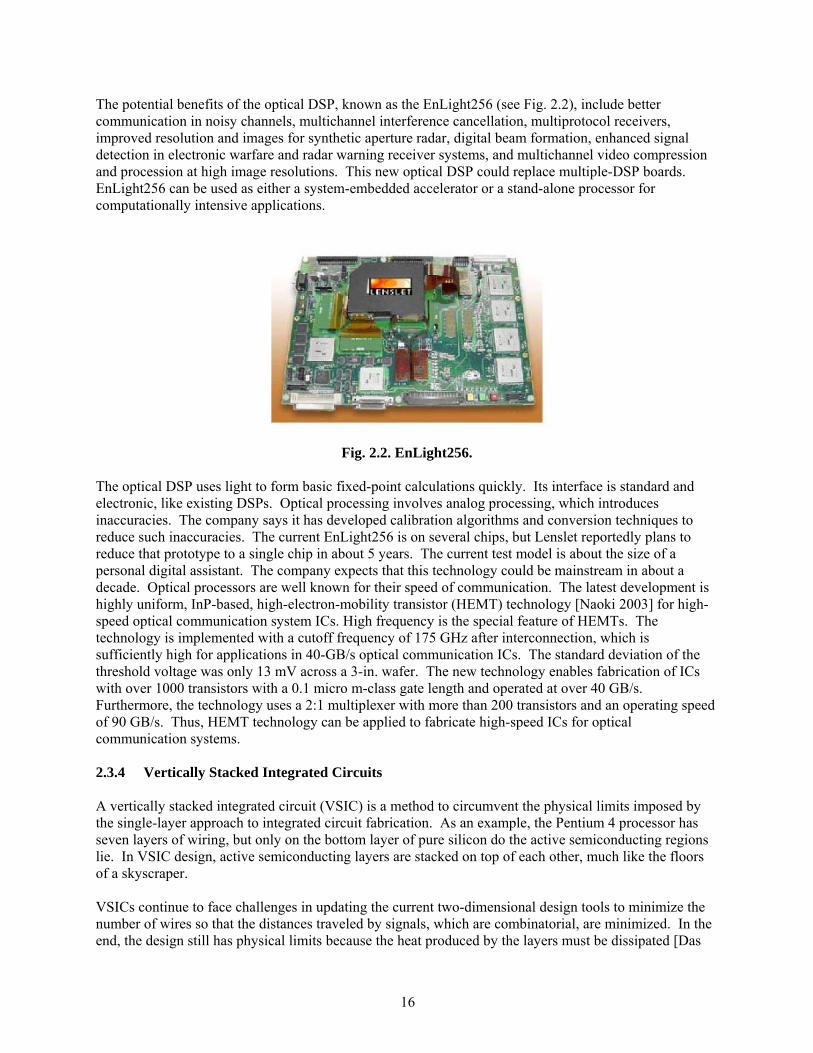
16
The potential benefits of the optical DSP, known as the EnLight256 (see Fig. 2.2), include better communication in noisy channels, multichannel interference cancellation, multiprotocol receivers, improved resolution and images for synthetic aperture radar, digital beam formation, enhanced signal detection in electronic warfare and radar warning receiver systems, and multichannel video compression and procession at high image resolutions. This new optical DSP could replace multiple-DSP boards. EnLight256 can be used as either a system-embedded accelerator or a stand-alone processor for computationally intensive applications.
Fig. 2.2. EnLight256. The optical DSP uses light to form basic fixed-point calculations quickly. Its interface is standard and electronic, like existing DSPs. Optical processing involves analog processing, which introduces inaccuracies. The company says it has developed calibration algorithms and conversion techniques to reduce such inaccuracies. The current EnLight256 is on several chips, but Lenslet reportedly plans to reduce that prototype to a single chip in about 5 years. The current test model is about the size of a personal digital assistant. The company expects that this technology could be mainstream in about a decade. Optical processors are well known for their speed of communication. The latest development is highly uniform, InP-based, high-electron-mobility transistor (HEMT) technology [Naoki 2003] for high-speed optical communication system ICs. High frequency is the special feature of HEMTs. The technology is implemented with a cutoff frequency of 175 GHz after interconnection, which is sufficiently high for applications in 40-GB/s optical communication ICs. The standard deviation of the threshold voltage was only 13 mV across a 3-in. wafer. The new technology enables fabrication of ICs with over 1000 transistors with a 0.1 micro m-class gate length and operated at over 40 GB/s. Furthermore, the technology uses a 2:1 multiplexer with more than 200 transistors and an operating speed of 90 GB/s. Thus, HEMT technology can be applied to fabricate high-speed ICs for optical communication systems. 2.3.4 Vertically Stacked Integrated Circuits A vertically stacked integrated circuit (VSIC) is a method to circumvent the physical limits imposed by the single-layer approach to integrated circuit fabrication. As an example, the Pentium 4 processor has seven layers of wiring, but only on the bottom layer of pure silicon do the active semiconducting regions lie. In VSIC design, active semiconducting layers are stacked on top of each other, much like the floors of a skyscraper. VSICs continue to face challenges in updating the current two-dimensional design tools to minimize the number of wires so that the distances traveled by signals, which are combinatorial, are minimized. In the end, the design still has physical limits because the heat produced by the layers must be dissipated [Das

17
2003]. Developments should continue to be monitored to determine whether the achievable technology can satisfy the needs of nuclear application. As pointed out in NUREG/CR-6812, use of this technology in the nuclear industry is likely to occur after its uses are well established for other applications (e.g., telecommunications). Thus, the potential impact on nuclear power applications would be similar to that of recent evolutionary improvements in IC technology. For safety-related applications, the main issues to be considered for the new stacked processors and memory devices would probably be overall reliability and environmental compatibility if implemented in other than controlled environments. 2.3.5 Nanotriodes Nanotechnology has experienced significant progress in nanosensors, nanoactuators, nanoelectronics, and micro-electromechanical devices (MEMs) in the past several years. In the case of nanoelectronics, advances in the development of nanotriodes deserve particular mention because of the technology’s potential influence on nuclear I&C. In particular, this reinvention of the vacuum tube may show promise for high-radiation and high-temperature environments. The flow of electrons in a vacuum should be unaffected by radiation bombardment. Nanotriode technology is still in its infancy with advances continuing to be made. For example, nanotriodes developed at Cambridge University have reached a density of 109/cm2, comparable to the density of metal-oxide semiconductor (MOS) transistors. Nanotriodes are advantageous over MOS technology in radiation resistance and temperature tolerance. A current research issue is the reproducibility and longevity of nanotriodes [Schewe 1999]. Figure 2.3 shows the schematic of an encapsulated nanotriode fabricated at Cambridge University. Tungsten is used to form the cathode layer (15 nm thick), the gate layer (20 nm thick), and the anode layer (15 nm thick). Silicon dioxide is used to separate the two electrode layers (40 nm on each side). An additional masking layer of titanium (15 nm thick) is deposited on top of the tungsten anode. Electrons are field-emitted from tungsten nanopillars on the cathode having tip radii of 1 nm and heights of 10 nm. The current is collected at the anode controlled by the gate electrode. The turn-on gate voltage for field emission is 8 V, and the field-emitted currents of up to 10 nA are collected at the anode. Progress in development of nanotriodes should continue to be followed over the long term, given the potential that this technology could enable smart sensors to migrate into the most inhospitable areas within the reactor containment. 2.3.6 Microelectromechanical Systems (MEMS) Progress continues to be made in MEMS (also known as micromachines) technology. For example, a high-temperature, low-power silicon tunnel diode oscillator transmitter with an on-board optical power converter is under development for harsh environment MEMS sensing and wireless data telemetry applications [Suster 2004]. The prototype sensing and transmitting module employs a MEMS silicon capacitive pressure sensor performing pressure-to-frequency conversion and a spiral loop serving as an inductor for the inductor-capacitor (LC) tank resonator and also as a transmitting antenna. A GaAs photodiode converts an incoming laser beam to electrical energy for powering the prototype design. The system covers a distance of 1.5 m. Telemetry is achieved up to 250°C with transmitter power consumption of about 60 μW. Such a system can be useful in a harsh environment in which sensing and data communications are always a challenge. Thus, MEMS technology bundled in a SoC package shows promise for eventual use in nuclear power plants for sensing (wireless or wired) applications. The long-term progress in the development of this technology should continue to be monitored.

18
Fig. 2.3. Schematic of a nanotriode (http://www.aip.org/png/html/nanotriodes.html). 2.3.7 Molecular-Scale Electronics Molecular electronics involves designing, fabricating, and applying molecular-level or nano-scale electronic systems such that drastic improvements in computational speed and density can be expected. There are at least three major approaches to the development of this technology. The first approach is chemical computing, which builds calculations upon the chemical reactions and stores the answers in the resulting chemical structures. Adleman utilizes sequences of deoxyribonucleic acid’s (DNA’s) molecular subunits to represent vertices of a graph. Thus, combinations of these sequences formed randomly by the massively parallel action of biochemical reactions in test tubes represent the random paths through the graph. Using the tools of biochemistry, Adleman was able to extract the correct answer to the graph theory problem out of the many random paths represented by the product DNA strands [Adleman 1994, Adleman 2002]. The second approach is quantum computing, which performs massively parallel computations through the natural mechanism of interference among the quantum waves associated with the nanoscale components. In a quantum computer, each bit of information is represented by a quantum state of some component, such as the spin orientation of an atom, which can be manipulated in nanoscale. By carefully setting up the states, a desired computation can be performed through the wave interference among the quantized components. The third approach is nanoelectronic-based computing, which is a natural extension of conventional integrated circuit technology. Quantum dots and single-electron transistors, which can now be made as small as 30 nm, have shown switching and amplification properties. Hewlett-Packard demonstrated in 1999 that a monolayer film of molecules between two electrodes could act as a switch. In 2001, Bell Laboratories used a monolayer to mimic the properties of a transistor. These molecular-scale devices have the potential of turning into working computational units with extremely high bit densities and switching speeds. Despite advances in molecular electronics since the publication of NUREG/CR-6812, numerous challenges remain to be overcome before a molecular device that operates analogously to a transistor is feasible. Therefore, although the technology is interesting, it is not likely to develop to the point that it would migrate into nuclear applications within the foreseeable future.
19
2.4 Computational Platforms NUREG/CR-6812 noted various PLC-based and microprocessor-based computational platforms for operations, control, and safety applications available for I&C upgrades in existing nuclear plants or foundational I&C systems for near-term deployment of future nuclear plants. Two key technologies were identified: ASICs and real-time operating systems. These technologies were identified for two reasons:
• The possibility exists for long-term expansion for ASIC-based components in nuclear power safety applications. Awareness of progress in this technology is therefore recommended, especially in light of the potential costs for dedicated commercial software-based systems.
• Operating systems provide the fundamental interface between software and hardware in most
digital applications. Thus, their performance and reliability characteristics should be well understood.
For the purposes of this update, we reviewed the literature to assess progress in ASIC implementations in safety systems. In the area of real-time operating systems, we provide an example of a real-time operating system that has been in use for safety-critical applications such as aircraft. We also discuss in some detail the open system and the corresponding interfaces for automotive electronics (OSEK™) operating system, and OSEKtime™ in particular, in order to provide an understanding of the general requirements of an operating system for safety critical applications. 2.4.1 Application-Specific Integrated Circuits (ASICs) and Application-Specific Software The NRC reviewed the Westinghouse 7300A ASIC-based replacement module and issued a Safety Evaluation Report (SER) on February 2001 [EPRI, 2003b]. Siemens (Framatome ANP) received approval in May 2000 from NRC to install safety I&C systems based on the TELEPERM™ XS (TXS) platform for safety-related automation tasks in U.S. nuclear power plants [TELEPERM (1)]. TXS is the first digital system to be awarded generic approval under NRC’s standard in NUREG-0800. Although the TXS is not implemented with ASICs, it does have unique characteristics in architecture and software implementation. First, the system architecture and all I&C application functions are engineered by means of a graphical specifications tool called Specification and Coding Environment (SPACE). The modular structure of TXS has been optimized during system development such that the application-specific functions designed for TXS using the SPACE engineering tool are independent of the version of hardware components and system software [TELEPERM (2)]. TXS software is designed so that there is effective decoupling of the process engineering tasks from the response of the I&C system. This is based on the fact that faults and accident conditions in the process are required to not influence the response of the safety I&C under any circumstances. Thus, event-driven software is not used in the TXS. All parts of the software involved in initiating automatic measures are deterministic. That is, the measured signals are read, limit signals are formed, and control commands are output in the same fixed sequence independent of what may be happening in the plant or on other computers. Note that the TELEPERM family includes not only TELEPERM™ XS, for safety I&C equipment, but also TELEPERM XP, for process control systems [TELEPERM (3) (4), Lochner 2002]. Recent applications include the replacement of the turbine control system and the turbine protection equipment for German and Swedish plants.

20
2.4.2 Real-Time Operating Systems Of the different categories of operating systems available today, a hard real-time operating system (OS) is the only obvious choice for safety system applications in nuclear power plants.e One such specification is LynxOS-178, introduced in 2003. LynxOS-178 is a commercially available DO-178B level A certifiable (FAA standard), real-time operating system (RTOS) that meets the stringent standards for safety-critical systems. It includes support for POSIX interfaces, which saves time and cost associated in developing and maintaining applications based on the POSIX open standards. Another hard real-time embedded operating system standard is OSEKtime, which is an extension of the OSEK/VDX operating system standard. In this update we discuss OSEKtime in some detail in order to help understand the performance and reliability requirements for hard real-time operating systems. OSEK/VDX and OSEKtime OSEK /Distributed eXecutive (OSEK/VDX) is a specification for event-triggered operating systems. It was originally developed for the automotive industry but has found its way into many applications such as aerospace, industrial control, building control, public transportation, robotics, and medical electronics. OSEKtime, an extension of OSEK/VDX, defines a strictly time-triggered operating system [based on the time-triggered protocol (TTP)], including a communication protocol for fault-tolerant applications. This specification is extremely important because the control units of embedded systems in the automotive industry are expanding into safety-critical applications such as braking and steering. Figure 2.4 shows the various specifications of OSEK/VDX [TTTech 2004]. TTPOS is an actual operating system with TTPf support based on the OSEKtime specification. It meets all the requirements of a hard real-time operating system. These requirements are the following [Tanzer 1999]:
• Dependability – reliability due to fault tolerance and fault detection. The replica deterministic behavior of time-triggered architectures supports the implementation of fault-tolerant systems by active redundancy. This facilitates the construction of highly dependable systems.
• Predictability – deterministic behavior even at peak load and in case of failure. The system
behavior is controlled by the progression of time based on a periodic pattern making the temporal system behavior predictable. This eases system validation and verification considerably.
• Composability – a clean modular concept as the basis for an improved diagnosability, testability,
and certifiability. The various components of a software system can be developed independently and integrated at a late stage of software development. This is possible because the interface between all components is strictly defined both in the value and time domain. The smooth and painless integration of components facilitates the management of the ever increasing complexity of embedded real-time systems.
e An operating system is said to be “real-time” if it provides some mechanisms to give predictability to task execution times. Soft real-time operating systems meet timing requirements most of the time but are allowed to occasionally miss deadlines. Hard real-time operating systems provide the facilities necessary to meet timing requirements under worst-case conditions. This is clearly the most desirable performance characteristic for safety systems. f TTP® is a communication technology developed at Vienna University of Technology and refined in several European Union (EU)-funded research projects. It addresses the specific requirements of dependable embedded systems and supports the partitioning of a large system into a set of nearly autonomous subsystems with small and testable interfaces.

21
• Reusability of components – In a time-triggered distributed architecture the “glue logic'' needed to interconnect existing components into a new system is physically separate from the application software in the component. Existing components may therefore be reused in a new context without any modification of the tested and proven application software.
• Efficiency – The operating system takes up a minimum of random-access memory (RAM), read-
only memory (ROM), and central processing unit (CPU) processing power.
• Support for fault-tolerant hard real-time systems – The OS supports fault detection and deadline monitoring.
Fig. 2.4 OSEK/VDX standards and implementation in TTPOS Permission to use this copyrighted material is granted by TTAutomotive Software GmbH [TTTech 2004]
Figure 2.5 shows a typical structure of an OSEKtime-based system OSEK was designed for systems with small hardware resources such as 8-bit processors with no memory management unit (MMU). On the other hand, RTLinux is an example of an operating system especially designed for mid-range to high-range processors and is based on the POSIX standard. For nuclear power plant safety systems, the overriding requirement is safety (i.e., ability of the circuit or subsystem to perform its safety function when required) rather than processing power per sec. This is achieved through redundancy, diversity of hardware and software, and fault handling. Also, the applications using the operating system should be safe in the sense that they cannot defeat the operating system’s protection mechanisms. These characteristics are achieved by considering the reliability requirement at every phase of system design. In general, development of hard real-time operating systems is still dynamic, and continued participation in standards activities to provide technical support to the NRC is recommended. In addition, near-term research into the performance and reliability characteristics of real-time operating systems is suggested.

22
Fig. 2.5 OSEKtime-based system architecture. 2.5 Surveillance, Diagnostics, and Prognostics 2.5.1 Model-Based Techniques The Thermal Performance Monitoring and Optimization (TEMPO) system is designed to support plant personnel in identifying and correcting problems that cause small decreases in plant efficiency over long periods of time [TEMPO 2004]. TEMPO has three basic function modules: modeling, monitoring, and optimization. The modeling module allows users to create and maintain a plant model. The monitoring module receives the measured data and fits the plant model calculations, using a few key parameters, to the measurements. The optimization module solves a nonlinear optimization problem to optimize the specified objective functions and free variables. In optimization mode, the user has the opportunity to select predefined, constrained optimization options (e.g., steam fraction to reheater vs. water temperature). Typically, the model will be initiated with the current state of the plant, but it is possible to load different initial plant states. Then the model is started for optimization, and the user can see the new parameters compared with the old ones. The user is allowed to put different weights on the objective function parts and modify constraint parameters. The TEMPO system, still being developed, will be able to address plant operation efficiency problems due to fouling, leaking valves, pump degradation, flowmeter drifting, and ambient condition changes such as sea water temperature or plant parameters. The major issues regarding optimization of plant efficiency are related to steady-state assumptions on plant-measured data and how to deal with model uncertainty
Actuator
Electronic control
unit (ECU)
Se
(ECU)
Sensor
Actuator
(ECU)
(ECU)
Network
Display

23
such as pipe leakage and equipment heat loss, so the technology needs to be demonstrated on its applications to real nuclear power plants. The technology deserves monitoring for near-term deployment. 2.5.2 Fault Detection for Field Devices For automated monitoring and testing of field devices, smart sensors and final control elements that can report their health to the logic solver are increasingly available. This increases plant availability because an unhealthy sensor can be replaced promptly or its input ignored for a voting strategy. Also, problems with final control elements can be diagnosed more rapidly, thus averting dangerous situations. The advanced diagnostics present in today’s smart transmitters, when combined with open digital protocols and asset management software, allow the user to remotely diagnose field devices and go beyond alarming transmitter failures to actually predict impending failures in the complete measurement system. This significantly reduces unscheduled outages and improves overall plant availability. In addition to detecting failures, today’s smart transmitters allow the user to easily diagnose application, configuration, and installation errors. 2.5.3 Forewarning of Failure in Critical Equipment The state of the art is exemplified by the work of Hively and others [Hively et al. 2003]. In this work, methodologies were developed for the forewarning of machine failures in critical equipment in next-generation nuclear power plants. New nonlinear methods were developed and applied successfully to extract forewarning trends from process-indicative, time-serial data for timely, condition-based maintenance. The approach used was a multitiered, model-independent, and data-driven analysis that used an ORNL-developed nonlinear method to perform the extraction of the requisite information from the data. The first tier of the analysis provides a robust choice for the process-indicative data. The second tier rejects data of inadequate quality. The third tier removes signal artifacts that would otherwise confound the analysis, while retaining the relevant nonlinear dynamics. The fourth tier converts artifact-filtered time-serial data into a geometric representation that is then transformed to a discrete distribution function (DF). This method allows for noisy, finite-length datasets. The fifth tier obtains dissimilarity measures (DM) between the nominal-state DF and subsequent test-state DFs. Forewarning of a machine failure is indicated by several successive occurrences of the DM above a threshold, or by a statistically significant trend in the DM. This paradigm yields robust nonlinear signatures of degradation and its progression, allowing earlier and more accurate detection of a machine failure. 2.5.4 Control Loop Performance Monitoring In the past 10 years, controller performance assessment has become an active research area in the process industry, and several commercial software packages are available [Harris 1999]. The embedded algorithms in these programs enable users to obtain accurate controller quality metrics without performing plant tests and to monitor all the aspects of control loops. The principle of the algorithms is to compare the predefined metrics calculated from the historic data with some standards characterizing the best possible control performance. The control loop performance assessment also enables identification of the root causes of poor controller performance. For example, the phase shift in the process I/O cross correlation plot can be examined to differentiate whether an oscillation is due to valve stiction or improper controller tuning. For digital control systems with fast sampling speeds, the control loop performance assessment algorithms can be easily implemented. The demonstration research needs to be an integral part of advanced I&C development for nuclear power plants and deserves monitoring in the near term.

24
2.5.5 Vision-Based Diagnostics Currently, machine vision diagnostic techniques, especially IR imaging, have been widely used in monitoring bearings, misaligned motor shafts, bad couplings, heat exchangers, steam traps, pumps, etc. The thermal patterns that arise prior to catastrophic failure can be continuously monitored to prevent sudden equipment failure and localize the problem. Figure 2.6 is a thermal scan on a mechanical component showing a bad bearing on a shaft of an electrical motor. This nonintrusive diagnostic technique allows impending failures to be detected and replacements made during scheduled outages.
Fig. 2.6. Thermal scan of a mechanical component showing a bad
bearing on a shaft of an electrical motor [ATV 2001]. schedule repairs, and (4) improve availability. 2.5.6 Laser-Based Alignment Monitoring On-line monitoring of the shaft alignment of rotating machines is very important in reducing the vibration and extending the lifetime of machines in nuclear power plants. The most primitive approach is to rely on theoretical calculations of the thermal expansion so that operators can compensate for the positional change from a cold condition to nominal operation. Other methods such as using well-designed support arms with dial indicators, eddy current pickups, or linear variable displacement transformers have been used to monitor positional change in real time. However, these methods are susceptible to inappropriate operator interpretation. Laser technology enables measurement of the relative movement between two laser transducers across long distances with very high resolution. The Permalign system has been mounted to a Westinghouse 23,700-HP turbine coupled to a Pacific Dresser pump operated at 45,000 psi. It is reported that the vibration level was reduced by up to one-half after the laser alignment system was used [Perry 2001]. The development of laser shaft alignment for on-line machine monitoring still needs to address several other issues, such as the insensitivity of the laser transducer to adjacent vibrations and thermal disturbances. Because this technique can provide a preventive maintenance strategy for rotation machinery in nuclear power plants, it warrants long-term monitoring.
Overheated bearing

25
2.6 Control and Decision 2.6.1 Data Acquisition and Control in Industrial Plants Methods for data acquisition and control have evolved during the past 40 years, and competition among companies has led to several variations in implementation. Digital data acquisition and control was implemented during the 1960s through integration software with analog-to-digital converters (ADCs) and digital-to-analog converters (DACs). To communicate directly with ADC and DAC boards, assembly language coding was written, and selected sections of coding were executed based on receipt of interrupts. It was generally necessary to turn off all interrupts during the processing of computational routines and to turn them on when the processing was complete. Interrupts could be clock- or event-driven. This was the general protocol followed in programming data acquisition and control for the NERVA project during the 1960s and early 1970s. The development of systems for data acquisition and control today is accomplished through the use of much higher-level computer software and programming languages. Data transfer rates continue to increase, as do communication protocols from various major commercial companies that provide hardware and software for data acquisition and control systems. Kirman [2004] provides a good overview of a number of data acquisition and control system architectures. He emphasizes in his presentation that data acquisition and control systems must fit the system and not vice versa. Figure 2.7 shows the classical centralized control system architecture, in which the central computer monitors and forwards commands to PLCs. Figure 2.8 shows a decentralized system, in which all controllers can communicate as peers (without going through a central master), restricted only by throughput and modularity considerations. Figure 2.9 shows a PLC-based process control system for a generic industrial plant. In general, start-up sequencing of simple equipment that invokes discrete (binary) steps is well accomplished by PLCs; however, complex machinery, which may have the possibility of multiple start-up paths depending on internal and external conditions, operates beyond the fixed programming of PLCs. A modern, process control system for (both nuclear and nonnuclear) power plants is exemplified by the TELEPERM XP [TELEPERM (4)], as shown in Fig. 2.10. The TELEPERM XP is designed for new plants as well as for retrofits during which the old plant I&C is largely replaced.g The TELEPERM XP is an example of a hierarchical architecture of a distributed control system. Distributed systems are typically organized in hierarchies in order to reduce cognition, communication, and control complexity, as well as to enhance scalability. The TELEPERM XP consists of the following subsystems.
• The AS 620 Automation System. This subsystem collects measured values and statuses from the process, carries out open- and closed-loop control functions and passes the resulting commands to the process.
• The OM 650 Process Control and Management System. This is the human-machine interface
(HMI) and is the operating and monitoring window to the process.
• The ES 680 Engineering System. This is used for the configuration of subsystems. These include all plant-specific automation, process control and process information software functions, communication between subsystems and entire control system hardware.
g The TELEPERM ME is designed for retrofitting an existing plant (e.g., expanding the control room or replacing obsolete control systems and, primarily, to modernize the user interface in the control room).

26
• The DS 670 Diagnostics System. This subsystem is used to perform detailed system status
evaluation and system analysis by providing informational and diagnostic functions. Information on faulty components and all I&C faulty alarms can be provided on this diagnostics subsystem.
• The CT 670 Commissioning Tool. This is used for commissioning and maintenance tasks. The
CT 675 software is accessed using a Windows-compatible PC.
• The SIMATIC NET Industrial Ethernet Bus System. Communication between the I&C system components AS 620, OM 650, ES 680 and DS 670 systems are carried out via this plant bus.
Fig. 2.7. Generic classical centralized control system architecture.
Central computer (Mainframe)
Group control
(PLC)
Group control
(PLC)
Group control
(PLC)
Sensors and actuators Sensors and actuators Sensors and actuators
P L A N T

27
Fig. 2.8. Generic decentralized control system.
Fig. 2.9. Buses and processors in a generic industrial plant.
Engineering workstation
Operator workstation
Data logger
Controller Controller Controller Controller
Control bus
Field bus
P L A N T

28
Fig. 2.10. TELEPERM XP subsystems.
2.6.2 Supervisory Control System The main function of a supervisory control system is to manage all monitoring and operational tasks, placing top priority on reliability. Recent supervisory models offer advanced maintenance functions and greater cost efficiency. Figure 2.11 presents a schematic of a supervisory control system. Hitachi has developed advanced digital and electronic technologies to improve supervisory capabilities in nuclear power plants while maintaining reliability. Hitachi’s totally digital system NUCAMM-90 (Nuclear Power Plant Control Complex with Advanced Man-Machine Interface 90), providing centralized and supervisory control systems for advanced boiling water reactors (ABWRs), has made possible the application of such technologies to supervision and operation from the viewpoint of improving performance and reliability [Takehiko 2001].
Fig. 2.11. General-purpose and open network technologies can be used to
configure a compact, human-friendly supervisory control system. 2.6.3 Intelligent Agent-Based Control The Infotility Company has recently conducted a U.S. Department of Energy (DOE) research project to develop intelligent software components that run at distributed locations on the energy network to

29
improve the reliability, efficiency, security, and stability of the U. S. electrical transmission and distribution network (Cohen 2003). This design uses intelligent agents on the power delivery infrastructure to support multiple operational criteria and a coordination and grid protection scheme. The first phase of the project, begun in September 2003, established a detailed software development plan in April 2004. The second phase of the project, still under way, will create a commercialized version of the software and conduct proof-of-concept testing in a real-world environment with actual distributed energy resources (DER) devices connected to a major U. S. electrical system. The project, if successful, may have a significant impact on the operation of nuclear power plants. For instance, an energy company with multiple plants in one region may be able to allocate its energy output to the national electric grid on a flexible schedule. 2.6.4 NonMathematical Flow Methods A multilevel flow model (MFM) is able to incorporate a deep model structure of means and ends and a quantitative representation of goals and functions, while an expert system and fuzzy logic cannot perform this task. On the other hand, MFM uses discrete and more abstract representation, more appropriate for plant-wide reasoning and higher-level decision making than for statistical and control theory methods. The first MFM model of the main systems of nuclear power plants was developed by Ingstrom based on a nuclear simulator facility at the Nuclear Training and Safety Center (KSU), Studsvik, Sweden, in 1998 and demonstrated in 2000 [Larsson 1998]. However, MFM modeling is still costly to develop and subject to error. Because the use of computerized emergency operation procedures is a trend to avoid human error, the research needs to be monitored in the long term. 2.7 Human-System Interface 2.7.1 Control and Monitoring Systems To address the key issues of implementing advanced technology and reliability, Hitachi has developed a client-server architecture to realize efficient plant monitoring and operating functions. The system was installed to control radioactive waste treatment equipment at Tohoku Electric Power Company, Inc., Onagawa Nuclear Power Plant No. 3. Hitachi’s NUCAMM-90 employs the latest technology to achieve plant supervision [Takehiko 2001]. The interface continuously monitors the plant because most of the operation is done automatically (sequential control). To further enable a clear understanding of plant operations, operators are provided with system diagrams, trend graphs, and alarm status. The highly reliable NUCAMM-90 was applied to a control network that links all controllers and HMI servers, and sufficient responsiveness and reliability were obtained through the architecture and the use of a high-speed duplex optical fiber loop network. The system’s remote terminal block (RTB), a direct-cable-connected process I/O device, has analog signal conversion functions, an internal low-power circuit, and separate high-power process signals. Thus, it does not require a buffer circuit. It contains a circuit that can directly interface, for example, the air-operated valves that make up the most of the device’s control equipment, enabling the amount of internal wiring to be greatly reduced and the number of control panel indicators to be halved.
Figure 2.12 shows an example of a control and monitoring system with a good HMI. By clicking with the mouse on any control equipment device (pump, valve, etc.) at the top of the system diagram, the operator obtains (in a pop-up display) an operation switch window modeled after an actual hard switch. Multiple displays can be shown with this switch window. In addition, trend graphs can be displayed on the same screen, enabling operations such as valve opening or closing to be performed while monitoring the tank level.

30
2.7.2 Software Agent-Based Operational Support System Agent-based systems continue to receive considerable attention. Operators/users can delegate to a society of software agents tasks that are either too time-consuming or mundane to perform themselves or that cannot be accomplished by humans in the available time frame. An agent may be defined as a component of software and/or hardware that is capable of acting exactingly in order to accomplish tasks on behalf of its user. The characteristics of an agent include such attributes as autonomy, learning, and cooperation. Agents may also possess an internal symbolic, reasoning model, and they engage in planning and negotiation in order to achieve coordination with other agents.
One application of software agents in the power plant environment is in the area of security. In the ongoing research to boost the security of nuclear installations, scientists at ORNL have developed special software popularly called “special agents” [SpaceDaily 2004] that work 24/7 to uncover threats to national security. Special agents are intelligent software programs that scan the Internet, satellite images, and massive amounts of electronic information for anything that hints of a plot. By using computers to gather data and reduce the information to what is relevant, the intelligence community can concentrate on analyzing just the meaningful information. Such software agents can definitely play a crucial role in homeland security and should be considered for long-term deployment in power plant security.
2.7.3 Virtual Collaborators
The ongoing research in the development of a virtual collaborator (VC) [Ishii 1999] has resulted in a prototype VC developed at Kyoto University that can behave just like a power plant operator in a nuclear power plant (see Fig. 2.13). At present, the VC can detect an anomaly, diagnose the root cause, and operate the control panel according to the operation manual in virtual space, where the control room of the nuclear plant is visualized. The prototype is a distributed simulation system that comprises of four subsystems:
• a nuclear power plant simulator, • a man-machine interface simulator, • a human model simulator, and • a human body motion simulator.
Researchers are now focusing on developing the functions to estimate human internal states and communicate with real people in the next phase of research.

31
Fig. 2.12. Example of control and monitoring system with human-system interface.
Fig. 2.13. System architecture of a virtual collaborator.

32
2.7.4 Biometrics Biometrics is widely used as a very reliable technology for security. Iris scanning has already been implemented in Heathrow Airport at London (see Fig. 2.14). The United States, too, began using biometrics at its airports and seaports in January 2004. Under the new US-VISIT program [Ross 2004], all foreigners entering on visas will have their hands and faces digitally scanned. American citizens will also be affected, as new passports with a chip that contains biometric data are scheduled to be issued in 2005.
Fig. 2.14. Iris scanning at Heathrow Airport, London.
In California, a retired employee association has employed biometrics to secure software-based assets. Novell and Identix, Inc., have installed fingerprint scanning to replace computer passwords [Emigh 2003]. This eliminated the need for the staff to change passwords every month. The fingerprint reader was also cost-effective—a mere $150. Such low-cost systems can be adapted for security purposes in highly secure nuclear installations. 2.7.5 Automated Visual Surveillance for Facility Monitoring For decades, surveillance through closed-circuit TV has been popular, but the problem is always too many cameras and too few personnel to monitor them. In the current global climate where guaranteeing security to high-risk buildings and nuclear facilities is a requirement, automated visual surveillance (AVS) may be a good solution. An AVS monitors an area, takes video, and then takes appropriate action. Because surveillance systems are generally domain-specific, the best test of the system is in the environment in which it is to be used; however, such testing is not always possible. Quantitative testing has been performed using receiver operating characteristics (ROC) curves [Dicks 2003] with varying parameters on a single test bed. Surveillance particularly benefits from a standard set of test data using a database like performance evaluation of tracking surveillance (PETS). The test sequence provided for PETS2000 [Dicks 2003] represents a suitable test bed because it contains different moving objects and thus confronts the system with the challenge of tracking a specifically selected object in the presence of other objects that are moving across the entire image frame and are even intersecting with the trajectories of other objects in the sequence. Advances in AVS systems will enhance deployment in nuclear power plants. An example is face recognition at access control points. If coupled with additional access controls (e.g., palm or iris scanning, coded badges, or keypads), AVS can be used to replace security personnel at some access

33
points. Video-based face recognition can be used in conjunction with other personnel tracking mechanisms, such as radio-tagged badges, to enhance security in nuclear power plants. 2.7.6 Virtual Reality According to EPRI, large-scale, cost-competitive advanced nuclear power plants calls for stabilization of atmospheric greenhouse gas concentrations. Also, during the capital investment recovery period, construction costs for advanced nuclear reactors must be reduced for them to compete economically with other sources of energy. EPRI has collaborated with Westinghouse to develop advanced construction visualization tools for the first 9 months of construction of the AP600 plant [EPRI 2003]. This is one of the three advanced light water nuclear reactor (ALWR) designs certified by NRC for further deployment. The benefits of using virtual reality include
• optimization of construction sequencing and labor deployment, • verification of accurate and achievable construction schedules, • identification and elimination of problems before they are encountered, and • preparation and training of the workforce.
2.8 High-Integrity Software 2.8.1 Software Development Technologies, Methodologies, and Tools The term “high integrity” implies a specific characteristic of the software in terms of reliability or dependability that requires that the software must be developed using special techniques. The safety requirements of military, aerospace, and transportation applications, due to the consequences of software failure, continue to drive development of ever-increasing levels of quality and reliability for software. In general, however, advances in software engineering have not kept pace with hardware. While there are several system development life cycle (SDLC) methodologies available, the basic processes remain similar. The SDLC is a conceptual model that describes the stages involved in an information system development project, from an initial feasibility study through maintenance of the completed application. Various SDLC methodologies have been developed to guide the processes involved, including the waterfall model (which was the original SDLC method); rapid application development (RAD); joint application development (JAD); the fountain model; the spiral model; build and fix; and synchronize and stabilize. Several models may be combined into a hybrid methodology such as the rational unified process (RUP) which is currently widely used. Documentation is crucial regardless of the type of model chosen or devised for any application, and it is usually done in parallel with the development process. Some methods work better for specific types of projects, but in the final analysis, the most important factor for the success of a project may be how closely the particular plan was followed. In general, an SDLC methodology follows the following steps:
1. The existing system is evaluated. Deficiencies are identified. This can be done by interviewing users of the system and consulting with support personnel.
2. The new system requirements are defined. In particular, the deficiencies in the existing system
must be addressed with specific proposals for improvement.
3. The proposed system is designed. Plans are laid out concerning the physical construction, hardware, operating systems, programming, communications, and security issues.

34
4. The new system is developed. The new components and programs must be obtained and installed. Users of the system must be trained in its use, and all aspects of performance must be tested. If necessary, adjustments must be made at this stage.
5. The system is put into use. This can be done in various ways. The new system can be phased in,
according to application or location, and the old system gradually replaced. In some cases, it may be more cost-effective to shut down the old system and implement the new system all at once.
6. The system should be exhaustively evaluated after it is up and running for a while. Maintenance
must be kept up rigorously at all times. Users of the system should be kept up-to-date concerning the latest modifications and procedures.
Waterfall Model The waterfall model is a popular version of the SDLC model for software engineering. Often considered the classic approach to the SDLC, the waterfall model describes a development method that is linear and sequential. Waterfall development has distinct goals for each phase of development. Imagine a waterfall on the cliff of a steep mountain. After the water has flowed over the edge of the cliff and has begun its journey down the side of the mountain, it cannot turn back. It is the same with waterfall development. After a phase of development is completed, the development proceeds to the next phase, and there is no turning back. The advantage of waterfall development is that it allows for departmentalization and managerial control. A schedule can be set with deadlines for each stage of development, and a product can proceed through the development process like a car in a carwash, and theoretically, be delivered on time. Development moves from concept, through design, implementation, testing, installation, troubleshooting, and ends with operation and maintenance. Each phase of development proceeds in strict order without any overlapping or iterative steps. The disadvantage of waterfall development is that it does not allow for much reflection or revision. After an application is in the testing stage, it is very difficult to go back and change something that was not well thought out in the concept stage. Spiral Model The spiral model, also known as the spiral lifecycle model, is a systems development method (SDM) used in information technology (IT). This model of development combines the features of the prototyping model and the waterfall model. The spiral model is favored for large, expensive, and complicated projects. The steps in the spiral model can be generalized as follows:
1. The new system requirements are defined in as much detail as possible. This usually involves interviewing a number of users, representing all the external or internal users and other aspects of the existing system.
2. A preliminary design is created for the new system.
3. A first prototype of the new system is constructed from the preliminary design. This is usually
a scaled-down system and represents an approximation of the characteristics of the final product.

35
4. A second prototype is evolved by a fourfold procedure: (1) evaluating the first prototype in terms of its strengths, weaknesses, and risks; (2) defining the requirements of the second prototype; (3) planning and designing the second prototype; (4) constructing and testing the second prototype.
5. At the customer’s option, the entire project can be aborted if the risk is deemed too great. Risk
factors might involve development cost overruns, operating-cost miscalculation, or any other factor that could, in the customer’s judgment, result in a less-than-satisfactory final product.
6. The existing prototype is evaluated in the same manner as was the previous prototype, and, if
necessary, another prototype is developed from it according to the fourfold procedure outlined above.
7. The preceding steps are iterated until the customer is satisfied that the refined prototype
represents the final product desired.
8. The final system is constructed, based on the refined prototype.
9. The final system is thoroughly evaluated and tested. Routine maintenance is carried out on a continuing basis to prevent large-scale failures and to minimize downtime.
Rational Unified Process The rational unified process [RUP 2001] is currently one of the most popular SDLC methodologies. It is a hybrid model utilizing features of the waterfall, spiral, and rapid application development models. The unified process has four basic principles: (1) the software should stress use cases (which show how it interacts with users), (2) the process is architecture centric, (3) it is iterative, and (4) it is incremental. It uses six industry-recognized best practices for software development:
1. Develop software iteratively 2. Manage requirements 3. Use component-based architectures 4. Visually model software 5. Verify software quality 6. Control changes to software
The methodology is used to apply these principles and practices to the software development process, which involves everything from gathering system requirements to analysis, design, implementation, and testing. The documentation is developed as a model of the system using the industry standard unified modeling language (UML). The UML document types (like use cases, class diagrams, and state transition diagrams) are then connected with various models used throughout the software development process. Formal Methods Improvements in formal methods mathematically-based techniques with the goal of ensuring that complex hardware and software designs and protocols behave correctly for all possible behaviors continue to be the focus of research in software engineering. They include formal specification languages, model checkers, theorem provers, as well as development of domain-specific logical theories and proof techniques relevant to high-performance hardware systems.

36
To a large extent, the high-level architectures of hardware and software systems are described as a mixture of informal English text and diagrams. It is common for such descriptions to be longer than the code itself, and for ambiguities and misinterpretations to creep in. These specification errors often result in subtle design defects, especially when the implementer and the specifier are different people. Formal specification languages are an alternative to English. Such languages are akin to programming languages, except at a higher level of abstraction. They can be used to specify how architecture is required to behave, as well as high-level design decisions. These attributes allow architectures to be described unambiguously, and yet are often an order of magnitude more concise than the corresponding English. While it is possible to construct pencil-and-paper proofs that a design satisfies its specification, model checkers provide the ability to automate correctness reasoningthe ability to check whether a design is correct and to report meaningful diagnostics when a specification is violated. Considerable progress has been made over the past 15 years in increasing the state space capacity of model checkers, to the point that specifications containing hundreds of state variables can often be verified automatically in a few hours. However, realistic designs often contain thousands or millions of state variables, far exceeding the reach of current model checking algorithms. Another class of verification tools called theorem provers can be used to overcome the capacity limitations of model checking. A theorem prover does not search the state space of a specification directly, but instead searches through the space of correctness proofs that a specification satisfies a given correctness property. In general, model checking and theorem proving are complementary technologies and should be integrated to successfully tackle realistic system designs. 2.8.2 Object-Oriented Language: Real-Time Java Aonix Company announced its plans for delivering safety- and mission-critical Java™ technologies to its mainstream markets on March 29, 2004. The first generation of the safety-critical Java product Jraven built on the strong foundation of the Aonix SmartKernel, a memory and time-partitioned kernel designed to provide safety and security protection. Jraven has already proven its success in a number of commercial deployments. The new-generation product JRTK™ will offer increased generality and flexibility in the software and greater ease of use to be efficiently integrated into the industrial mission-critical soft-real-time virtual machine [Aonix 2004]. The influence of the product on developing digital control of safety system in nuclear power plants needs to be monitored.

37
3. DETAILED INVESTIGATION OF ADVANCED SENSORS Sensors and sensor systems were identified in Chapter 2 as a technology focus area that deserves more attention in the near term because of the following characteristics: (1) they are likely to have the greatest safety impact because they have a direct bearing on operating and protection margins; (2) many new designs have the likelihood of maturing into commercial products ready for deployment in power plants in the near term; and (3) some of the most significant advances in the technology focus areas are in the area of sensors. Thus, this chapter is devoted to a more detailed treatment of sensors and sensor systems. 3.1 Silicon Carbide Flux Monitor 3.1.1 Basic Principles of the Technology In the basic detector, an n-epitaxial silicon carbide layer of 3–100 μm is grown on top of a silicon carbide substrate (300 μm) as shown in Fig. 3.1. When a negative reverse bias is applied to the Schottky contact, the n-epitaxial layer becomes depleted of charge carriers. When an ionizing particle passes through this depleted layer, the charge produced is collected under the influence of the reverse bias and, with proper pulse-shaping electronics, detected as a current pulse. By depositing a layer of neutron-sensitive material (e.g., 6LiF), as shown in Fig. 3.2, incident neutrons are converted to charged particles [e.g., Li(n, α)3H]. Both thermal and epithermal neutrons can be detected using the neutron-to-charged particle conversion technique.
Fig. 3.1. Silicon carbide Schottky diode radiation detector.
300μm
3 - 100μm

38
Fig. 3.2. Detection of neutrons via charged particle production
by the 6Li(n, α) reaction in a converter foil. 3.1.2 Maturity of the Technology To date, neutron response calibrations have been performed for miniature SiC semiconductor detectors based on a Schottky diode design in neutron fields maintained at NIST [Dulloo 2003, Ruddy 2004]. The neutron response was calibrated at fluence rates from 1.76 × 10⁴ to 3.59 × 10¹⁰ /cm2/s in NIST neutron fields. The maximum deviation from linearity of the fit of the neutron response of the SiC detectors to the NIST-measured fluence rates is much less than 5%, which is the estimated uncertainty in the measured fluence rates. A direct comparison of the SiC count rates to count rates obtained with a NIST double fission chamber over limited ranges where the detector positions and configurations remain unchanged shows a relative precision of ±0.6%. In a separate set of calibrations, a SiC neutron detector that had been previously irradiated with a fast (E>1 MeV) neutron fluence of 1.3 × 1016 cm-2 was found to have an absolute neutron fluence rate response that was indistinguishable from that of a previously unirradiated detector. Neutron sensitivity for this type of detector was found to be 1.3e-03 cps/cm2/nv/micron LiF. The LiF enrichment corresponding to this sensitivity is 90%. The neutron sensitivity is proportional to LiF thickness up to about 10 μm. For higher thickness values, the sensitivity starts to level off and becomes constant at about 25 μm. Prototype SiC ex-core neutron detectors have also been tested under research reactor conditions [Ruddy 2002]. The test results show that the key features, such as the linear pulse-mode operation without gamma compensation, are comparable to the presently used gas-filled ex-core detectors. It is anticipated that a wide-range SiC neutron detector can now be designed to replace the combined functions of the multiple power range detectors in current use.
6LiF converter layer

39
3.1.3 Potential Regulatory Impact Because of its larger band gap compared to conventional semiconductors such as silicon or germanium, SiC radiation detectors are not as susceptible to thermally generated noise and are capable of operation at high temperatures. These detectors have also been shown to be much more resistant to detrimental radiation effects (from gamma rays, neutrons, or charged particles) than silicon or germanium detectors. They are reported to operate well in fast neutron fluences up to 1017 n/cm2 (En>1 MeV)] as well as high temperatures up to 800°C. These detectors are capable of monitoring thermal, epithermal, and fast neutron fluences, and offer the potential of combining the functions of current three-range flux monitoring into a single system. In addition, the detectors have a highly linear response as a function of gamma-ray dose rate. Furthermore, the neutron response can be completely separated on the basis of pulse height from the gamma-ray response. Therefore, gamma dose rate and thermal or epithermal neutron fluence rate can be measured simultaneously with a single detector. It is likely that a wide-range silicon carbide neutron detector can now be designed to replace the combined functions of the multiple power range detectors in current use. However, data on important parameters such as drift, accuracy, repeatability, and degradation over time could not be ascertained for this update. It is important that a combined neutron monitor based on this technology not only exhibits the full dynamic range from startup to 100% power, but it should also be shown to not degrade over the long term when at 100% power. The improved operating and safety margins that such detectors will provide, should they also meet all the criteria mentioned above, certainly warrant continued monitoring of progress in their development. 3.2 Solid-State Neutron Flux Monitor 3.2.1 Basic Principles of the Technology The solid-state flux monitor (SSFM) is being developed at ORNL as part of an International Nuclear Energy Research Initiative (INERI) project sponsored by DOE and the Korean Ministry of Science and Technology [Wood 2003]. The monitor is based on the flux-induced change in electrical resistance of an AlN solid with evaporated metal contacts. The detector functions by intercepting a small fraction of incident neutrons in the 14N(n, p)14C reaction. The in-core version of the SSFM is based on a polycrystalline AlN compact with evaporated metal contacts (see Fig. 3.3). The electrical resistivity of AlN at temperatures of 300 K is typically over 1014 Ω-cm. Even at 1300 K, AlN remains a very good insulator. The reaction imparts a net kinetic energy to the energetic daughters of 627 keV. As the energetic daughters slow down in the nitride matrix, they excite electrons into the conduction band. The excited electrons are free to move under an applied bias, resulting in a neutron-flux-induced electrical current. The detector is intended to be operated in current mode, and it will also be sensitive to gamma rays. Thus, the SSFM will be limited to operation in reactor power-range fluxes. Figure 3.4 shows the current fabrication concept. 3.2.2 Maturity of the Technology The SSFM has been tested to characterize stability and leakage current at room temperature with no incident radiation to establish baseline sensor performance and electrical characteristics. Leakage current for all samples tested was in the range of 0.3 to 0.4 nanoamperes (nA) [Holcomb 2002]. This is in the range of conventional neutron detectors, such as miniature fission chambers used in local power range monitor (LPRM) assemblies used in boiling-water reactors (BWRs). LPRMs often exhibit leakage current in the range of 0.1 to 0.2 nA, using an integral mineral-insulated cable assembly of about 15-ft in length. Radiation testing of the sensor, including both mixed neutron-gamma and gamma irradiation at ambient temperature for extended periods of time, is being performed to fully characterize the SSFM for inexpensive, in-core flux measurement.

40
Design improvements are required to reduce the leakage current to enable potential deployment of the device at core temperatures above that of water reactors. The stability of the device also requires further investigation as device polarization appears to be significant [Holcomb 2005]. In addition, the long-term survivability of this device under in-core environments has also not been demonstrated. 3.2.3 Potential Regulatory Impact The SSFM technology is interesting in that it is the first known use of a solid-state resistive type device as a flux/dose monitor under in-core reactor type environments. Future tests in radiation environments need to be evaluated relative to the robustness and cost of the SSFM when placed in service in an operating reactor. In general, commercialization of this device is still several years away, and the technology should continue to be monitored.
Fig. 3.3. General concept of solid-state flux monitor [Source: Wood 2003].
Fig. 3.4. Fabrication concept of the solid-state fuel monitor.

41
3.3 Fuel Mimic Power Monitor (or Constant-Temperature Power Sensor) 3.3.1 Basic Principles of the Technology The fuel mimic power monitor has been developed and demonstrated through the Nuclear Engineering Education Research (NEER) program and EPRI funding. The instrument represents a unique sensing technology in that it provides a direct measurement of the nuclear energy deposited into a fuel mimic mass [Radcliff 2000]. This constant-temperature power sensor (CTPS) works by controlling a resistive device in thermal contact with a uranium fuel pellet or fuel analogue. The measure produced by this system is nuclear power generation rather than a more classic quantity such as neutron flux. To illustrate the CTPS concept, imagine a fuel pellet in which fission events are occurring with the temperature at steady state. The pellet will maintain an equilibrium temperature somewhat higher than the bulk coolant temperature, with the temperature difference dependent on the heat transfer coefficient. If the heat transfer coefficient is known, it is possible to calculate energy deposition by measuring the equilibrium temperature difference between fuel and coolant. At steady-state this relationship is Qdep = Qremoved = UA(Tfuel – T coolant) , (3.1)
where Qremoved = Energy loss by convection to surroundings, Qdep = Energy deposited (nuclear, electrical, etc.), UA = Overall heat transfer coefficient, Tfuel = Temperature of fissile element, Tcoolant = Bulk coolant temperature. If a resistance-heating element is placed inside this fuel pellet, it is possible to alter the temperature of the pellet. By passing a current through this resistance element, heat is deposited that can raise the pellet temperature well above the equilibrium temperature due only to nuclear heating. The electrically deposited power can be controlled because the resistance of the heat element is linearly related to temperature. If UA and Tcoolant remain constant, and the temperature (resistance) of the fuel pellet is maintained by some control routine, it is possible to use a measurement of the electrical power input as the inverse measurement of nuclear power input. In this case the nuclear and electrical power deposited in the pellet are given by the following equation: Qdep, nuclear + Qdep, electrical = UA (∆T) = Constant (3.2) or Qdep, nuclear = Constant - Qdep, electrical .. (3.3) In practice, the resistance sensor element can be made part of a Wheatstone bridge for an accurate measurement of resistance (and therefore electrical power). Figure 3.5 shows a schematic of a CTPS Wheatstone bridge control circuit [Mills 2004].

42
Fig. 3.5. Constant-temperature power sensor Wheatstone bridge control circuit.
Figures 3.6 and 3.7 show a cylindrical sensor configuration and a planar sensor configuration, respectively.
Pt leads
U235 core
SS shell
Pt socket
BeO layer
Al2O3 cap
Fig. 3.6. Cylindrical sensor configuration of the CTPS.
Sapphire or Alumina Cover
r = 0.50 cm
r = 0.65 cm
6 mil Pt Leads
Uranium OxidePt heater
Al2O3
Alumina Substrate
Fig. 3.7. Planar sensor configuration of the CTPS.

43
3.3.2 Maturity of the Technology Tests on the first-generation, controlled-calorimetric, in-core instrument prototypes and subsequent modeling showed three existing problems: (1) lack of proportionality in the relative neutron and photon response, (2) a relatively low bandwidth due to the non-uniform distribution of nuclear and electrical energy deposition, and (3) drift due to heat transfer through the sensor power leads. The second-generation sensor design forces the temperature gradient into a thin metal axial region, which gives a uniform energy distribution from all sources and better control of thermal leakage and contact resistances and improves the prediction with increased bandwidth and better proportionality [Radcliff 2002]. Different configurations (i.e., planar and cylindrical prototypes) of second-generation CTPS have been tested for linearity, sensitivity, and bandwidth [Mills 2004]. The response of resistance of the CTPS to temperature was very linear for the planar configuration up to 500°C, with a slope of 0.0225Ω/°C. The sensitivity was found to be 0.5 mW of CTPS detector power per kilowatt of reactor power, and bandwidth was found to be about 3.5 Hz. A significant problem found with this type of sensor was signal drift, and future work includes addressing this problem. 3.3.3 Potential Regulatory Impact This type sensor will have the advantage of providing an accurate and direct measurement of reactor power. This may provide licensees a basis to, for example, apply for an increase in their licensed operating power level. A significant problem found with the current version, however, is signal drift. In fact, comprehensive testing and characterization of the second-generation CTPS design has yet to be performed. Commercialization of the technology is still a few years away and should be monitored over the long term. 3.4 Johnson Noise Thermometry 3.4.1 Basic Principles of the Technology The components of a Johnson noise thermometer are shown in Fig. 3.8. JNT is based on the noise voltage associated with a resistor at some temperature T (Nyquist’s theorem). For frequencies below 1 MHz and temperatures above 25 K, the power spectral density 2
TV of the noise voltage is given (to an accuracy of more than 0.0001%) by fTRVT Δ= κ42 , (3.4) where κ is Boltzmann’s constant, fΔ is the bandwidth over which the noise is measured, and R is the resistance of the sensor. Equation 3.4 is the basis for all noise thermometry, although it is generally not used directly because of several technical difficulties. First, the amplifier gain needs to be both known and stable. Second, the amplifier passband and filtering effects of connection cabling must be known to within the required measurement accuracy. Finally, the resistance of the sensor must be independently and accurately measured. Early Johnson noise thermometers worked around these difficulties by performing a ratio of two noise voltage measurements. One noise voltage measurement was made with a resistor at the unknown temperature, and the other with a resistor at a reference temperature, switched onto a single amplifier channel. The unknown temperature T is then given by
)()(
2
2
TRTR
V
VTT o
T
To
o
= , (3.5)

44
where it is assumed that the bandwidth is constant. Equation 3.5 shows that a noise thermometer is absolute, i.e., a primary thermometer. The problem with the method, however, is that changing the connection of the sensor to the high-gain measurement circuit introduced noise and decreased reliability [Garrison 1949, Kisner 2005].
Fig. 3.8. Basic components of a Johnson noise thermometer. One alternative approach being investigated by ORNL to minimize the difficulties in previous designs follows the work of Pepper and Brown [Pepper 1979], in which a resistive sensor is connected in series with an inductor and a capacitor forming a tuned circuit. In this approach, the ideal mean squared noise voltage is given by
V 2 = Sv ( f )df∫ = 4kBTRπ2
f0
Q=
kBTC
(3.6)
where Sv is the spectral density, f0 is the resonant frequency, Q is the resonance quality factor, and C is the capacitance of the capacitor. A significant advantage of this measurement technique is that for lossless inductors and capacitors (if the measurement bandwidth is greater than the tuned circuit bandpass), the measured voltage output is independent of the sensor resistance and the inductance. In practice, however, there are losses associated with real inductors, and this limits the overall accuracy obtainable with a tuned circuit implementation of Johnson noise thermometry. One disadvantage with Johnson noise thermometry is the relatively long response time because of the long integration time required to make a temperature measurement. In particular, because of the statistical nature of the voltage measurement, there is uncertainty in the solution, which is progressively decreased by increasing the integration time of the measurement. To overcome this problem, another approach to Johnson noise thermometer design has been developed at ORNL [Kisner 2005] in collaboration with the Korean Atomic Energy Research Institute (KAERI), through an INERI program. As shown in Fig. 3.9a, Kisner et al.’s implementation first measures the actual resistance value of the RTD, using a resistance-to-temperature transfer to compute the temperature as is conventionally done for reading an RTD’s temperature. This temperature readout has a fast response time, and overcomes the comparatively slow response of the Johnson-noise-derived temperature value, due to the statistical processes from which the value is calculated. The transfer function of the RTD, however, drifts over time requiring periodic recalibration. The nondrifting Johnson noise temperature is used to periodically recalibrate the RTD resistance to temperature-transfer function. Thus, the temperature measurement in this dual-mode thermometer is made as a simple resistance measurement whose resistance to temperature conversion is quasi continuously updated using Johnson noise.

45
In the measurement of the Johnson noise temperature (performed in the box marked “Measure Johnson Noise” in Fig. 3.9), the concept of cross correlation is used. In this concept, the measured noise voltage from one amplifier channel is Fourier-transformed and correlated with that from the other channel to form a cross power spectral density (CPSD) that effectively eliminates the noise contribution from the amplifier electronics. This is shown in Fig. 3.10. The figure shows the power spectral density (PSD) function of each amplifier channel containing both correlated and uncorrelated noise and the CPSD function from both amplifiers containing only correlated noise. The CPSD function has units of volts squared per hertz and expresses the voltage-squared content per unit frequency of the measured voltage signal. CPSD provides mean square noise voltage, and the resistance is independently measured. The amplifier gain as a function of frequency and frequency bandwidth is required to obtain temperature from the voltage measurements. The technique used to obtain gain bandwidth product is to initially calibrate the measurement using a known temperature and treat both properties as a single constant.
Fig. 3.9. Schematic for automatic recalibration of RTD from Johnson noise measurement [Source: Kisner 2005].
Fig. 3.10. Illustrating the relationship between the PSDs of the individual channel
voltages and the CPSD between them.

46
3.4.2 Maturity of the Technology Some of the more significant problems that have hampered commercial utilization are (1) relatively long response time because of the long integration time required to make a temperature measurement and (2) sensitivity to electromagnetic noise and complexity of implementation (i.e., the need for skilled operators). Kisner et al.’s [2005] implementation addresses this dual-mode thermometer problem by making the temperature measurement as a simple resistance measurement whose resistance to temperature conversion is quasi continuously updated using Johnson noise. The second problem has also been addressed by the implementation by NIST, in which DSP methods are used to quantitatively evaluate the magnitude of any periodic interference in the noise spectrum and subtract it from the signal, thus minimizing the interference effect as much as possible. The JNT system at NIST utilizes FFT cross-correlation noise power spectra with 1-Hz resolution and periodic interference are readily distinguished from the thermal noise or reference system pseudo-noise. Kisner et al. [2003] also address electromagnetic interference issues using the following methods:
• shielding the sensitive element from electromagnetic noise by placing the RTD in a stainless steel sheath coated on the inside with highly conducting metals such as aluminum, copper, or silver; and
• developing software to remove electromagnetic spikes from the spectrum. The ORNL scientists plan a demonstration of conductive JNT at a nuclear facility within 2 years. Based on the review of the state of the art of Johnson noise thermometry, we expect that deployment of Johnson noise thermometry in nuclear power plants should be possible within the next 3 to 5 years. 3.4.3 Potential Regulatory Impact Considerable progress has been made to date in JNT to make it a viable technology in the near future for primary flow-loop temperature measurement. The attraction of JNT is that it is inherently drift free and insensitive to the material condition of the sensor. As a result of the latter characteristic, a sensor based on Johnson noise is immune to the contamination and thermo-mechanical response shifts that plague thermocouples and resistance thermometers. This advantage should improve operating as well as safety margins in nuclear power plants. The technology should continue to be monitored. 3.5 Magnetic Flowmeter for Primary Coolant Flow Measurement 3.5.1 Basic Principles of the Technology When a conductor is passed through a magnetic field, a voltage is generated that is proportional to the velocity of the conductor. This principle is used in the magnetic flowmeter, where the flowing primary coolant becomes the moving conductor. Physically, a magnetic flowmeter consists of signal-processing apparatus (the transmitter), magnetic coils, and electrodes (to measure the potential across the coolant). The magnetic coils and electrodes are typically implemented as part of a short segment of pipe made of nonmagnetic material that has a nonconductive inner surface containing or pierced by electrodes. Non-wetted, capacitively coupled models are available to allow operation with very low conductivity fluids such as pure water. The advantages of magnetic flowmeters include high accuracy (±0.25% under ideal conditions) and linear response. In addition, they are obstructionless (no fouling, no pumping power consumption) and can be designed to have minimal sensitivity to a flow profile. Also, the capability to directly measure flow rather than rely on inferring flow from measurement of primary coolant pump speed could impact operational margins.

47
3.5.2 Maturity of the Technology This technology has been in use for several years in the process industry and is a mature technology. However, the radiation sensitivity of the nonconductive inner pipe liner in magnetic flowmeters is the major impediment to the application of the magnetic flowmeter to flow measurements in light-water reactors. Solutions to this problem have been proposed [Wood 2003, ORNL 2003, Holcomb 2003]. In particular, work under an INERI project [ORNL 2003] involves the application of advanced digital signal processing as well as state-of-the-art fabrication technologies for the ceramic liner. To date, work has focused on the challenges of producing a radiation-resistant liner and evaluating its survivability. A target lifetime exposure dose of 2.4 × 10⁸ rads, based on Generation II PWR coolant systems has been identified, and preliminary radiation test plans for the new magnetic flowmeter liner are being developed. 3.5.3 Potential Regulatory Impact Improvements in flow measurement accuracy can significantly improve operating margins and over power occurrencesh. For example, on a per-unit basis, errors in feedwater flow measurement have the greatest impact on the accuracy of thermal power calculations — more than any of the other measurements necessary to make the heat balance calculations to confirm operation at 100% power. (Utilities have historically used calculation of heat balance around the reactor vessel or steam generator as a secondary method to periodically compute reactor thermal power to confirm operation at 100% rated thermal power). In addition, flow measurements are typically used to demonstrate that safety-related component performance is adequate to meet the demands indicated by the accident or transient analyses. Therefore, obtaining accurate flow measurements is important to safety. Ultrasonic and magnetic flowmeters are theoretically among the most accurate instruments for flow measurement. However, experience with transit-time flowmeters in some nuclear power plants show that these instruments may not be as accurate as they are claimed to be [NRC 1995]. This may especially be true in complex flow situations, such as in a nuclear power plant environment. It is important, therefore, to pursue further development work on magnetic flowmeters for application in nuclear power plants. 3.6 Fabry-Perot Fiber-Optic Temperature Sensors 3.6.1 Basic Principles of the Technology Of the many types of fiber-optic temperature sensors, the most sensitive is the interferometric type. Fiber-optic interferometric techniques are applicable for measuring almost any physical quantity. Since interferometry yields high-resolution measurements of length, fiber-optic techniques have been developed where a measurand is converted into a change of displacement. Temperature is one such measurand, and for high-precision temperature measurements, fiber-optic interferometers are an important alternative. Fiber-optic versions are available for all the well-known interferometers: Michelson, Fabry-Perot, Sagnac and, perhaps most common, Mach-Zender. Interferometric fiber-optic sensors are phase- (or wavelength-) modulated, have high accuracy and sensitivity, and may be independent of the absolute light intensity transmitted or detected. The basic principle of the Fabry-Perot fiber-optic temperature sensors idea is simple: send light through two fibers, a reference fiber and a sensing fiber (Fig. 3.11). As the physical dimensions of the sensing fiber are changed by the measurand (temperature), there will be a phase difference between the light travelling
h Overpower events are periods during which plants are operated above their licensed power level.

48
through the two fibers. The phase difference can be measured by “counting fringes,” transformed into a physical dimension change which, in turn, gives information about the measurand.
Fig. 3.11. Schematic diagram of a dual fiber-optic Fabry-Perot temperature sensor. The sensor uses two Fabry-Perot interferometers (FPI), one for sensing and one for reference. Similar sensors using other types of interferometers also exist. Light from the light-emitting diode (LED) is modulated by reflection, first by the sensing FPI and then by the reference FPI. It can be shown that the power output is proportional to )cos(5.01 pφΔ+ , where pφΔ is the phase shift due to the perturbation applied to the sensor interferometer. Measurements show that the phase shift is linearly dependent on temperature in a range of 26 to 108°C. Although the sensitivity obtained with this dual FPI sensor is somewhat less than that of a single FPI sensor using a laser source, excellent performance is still possible: sensitivity of the order of 0.0002 degrees is calculated at the maximum sensitivity point. 3.6.2 Maturity of the Technology Fiber-optic sensors in some form have been commercially available for the process industry since the 1980s. Systems with improved sensitivities, such as the Fabry-Perot type discussed above, have been available since the 1990s. The performance of two Fiso Fabry-Perot fiber-optic temperature sensors have been evaluated for potential application in nuclear power plants [Hanying 2003]. This type of sensor employs a Fizeau interferometer and a charge-coupled device (CCD) array to locate the position of the maximum interference fringe intensity, which is directly related to the environmental temperature. Consequently, the basic sensing mechanism is independent of the absolute transmitted light intensity, which is the parameter most likely to be affected by external harsh environments such as nuclear irradiation, high pressure or temperature, and cyclical vibration. The first sensor exhibited no failure or degradation in performance during and following gamma-only irradiation in which a total dose of 1500 krad (15 kGy) was delivered at a dose rate of 250 krad/h (2.5 kGy/h). However, intermittent behavior was observed throughout the latter portions of subsequent tests performed in a thermohydraulic environment in accordance to IEEE Std. 323-1983 [IEEE Std. 1983] procedures. Degradation in performance occurred after the test. Visual evaluation after opening the sensor head indicated that the method used in internal welding was the primary contributor to the observed behavior during this test. Further consultation with the vendor showed that the robustness and reliability of Fiso sensors can be substantially improved by modifying the internal welding methods.

49
The second Fiso temperature sensor was tested in a mixed neutron/gamma environment in which the total neutron fluence was 2.6 × 10¹⁶ neutrons/cm2 and the total gamma dose was 1.09 × 10⁸ rads. During the initial calibration following completion of the test, the sensor exhibited a fixed temperature offset of 18.9°C (34°F) but responded linearly to change in temperature. Annealing was observed as the temperature increased, which reduced the offset by ~63%. This observed phenomenon was very valuable in subsequent model building for on-line maintenance and calibration of the Fiso temperature sensor in a mixed neutron/gamma irradiation field. Conclusions from these tests are that if the observed shifts can be compensated for in an on-line sensing or calibration model of the Fiso sensor, then this type of fiber-optic sensor will be competitive in nuclear power plant applications. 3.6.3 Potential Regulatory Impact Fiber optic sensors are among the most sensitive and accurate sensors available. Thus, they also benefit from the same regulatory advantages associated with improved sensors, as previously mentioned. The major problem hampering their widespread use in nuclear power plant containment environments is the degradation caused by gamma radiation. Ongoing development of fiber-optic sensor technology is directed toward improving sensor performance and long-term durability. Many applications for nuclear power plants should be available in the foreseeable future. 3.7 Fiber-Optic Pressure Sensors 3.7.1 Principles of the Technology There are several basic designs for fiber-optic pressure sensors. The optical pressure transducer based on correlation of reflected light works as the impulse is applied on the surface of diaphragm. When the light focuses on the diaphragm, the angle with which the light reflects varies with the deflection of the diaphragm. A bundle of optical fibers point toward the diaphragm. Some of the fibers in the bundle direct light towards the diaphragm, and the remainder of the fibers capture a portion of the reflected light. The intensity of the reflected light is proportional to the diaphragm deflection that is caused by the pressure applied to the diaphragm, as shown in Fig. 3.12.
Fig. 3.12. Fiber-optic pressure transducer.
The sensor response to pressure results from the displacement of the diaphragm, which in turn changes the optical signal transmitted from the sending to the receiving fiber upon reflection from the diaphragm. In a two-fiber design, the light intensity collected by the receiving fiber may either decrease or increase with increasing diaphragm deflection. For a given diaphragm displacement due to a full-scale pressure change, the sensor response can be adjusted by a suitable choice of optical fiber core diameters and numerical apertures, as well as by the relative position of the fibers with respect to the diaphragm. In a robust and durable design, the sensor head consists of a metal housing with a welded sensing diaphragm, a fiber-holding ferrule, and two fibers bonded inside the ferrule, as schematically shown in Fig. 3.13.

50
SENSOR HOUSINGFIBERS
FERRULE
DIAPHRAGM
WELD
Fig. 3.13. Sensor head design. The diaphragm is one of the most critical elements of the sensor. Sensor diameters typically range from 1.7 to 8 mm, covering the pressure range from 100 to 30,000 psi. Small diaphragm diameters create a significant design challenge due to the simultaneous requirement for large deflection (for high signal-to-noise ratio) and low stresses (required for infinite lifetime). As shown in Fig. 3.14, the fiber-optic sensor developed by Optrand consists of three basic components: a sensing head with a metal diaphragm directly exposed to combustion pressure, a cable containing two multimode fibers, and an opto-electronic signal conditioner containing all optical and electronic components.
Fiber OpticCable
Photodiode
LEDElectronics
Signal ConditionerSensor Head
Fig. 3.14. Sensor block diagram. Opto-electronic conditioning circuitry contains a photodiode, an infrared LED, and an analog electronic circuitry. Two input electrical leads are for power supply and ground while one output pin is for pressure output and the other for sensor fault diagnostics. The electronic circuitry controls light intensity, amplifies and filters the photodiode signal, and provides the auto referencing function. The baseline light intensity in fiber-optic sensors may vary due to optical link transmission fluctuations resulting from connector mechanical and thermal instabilities, fiber bending, light source, or detector temperature dependence, or aging over time. The auto-referencing approach not only corrects for offset drift but also for sensor gain error. A side benefit of the technique, not possible with other combustion pressure sensors, is the availability of sensor-health monitoring output. By continuously monitoring the LED current level or its rate of change, one can identify a potential sensor failure before it occurs. This ability is particularly important in control applications where sensor failure may cause malfunction or even failure of the controlled device. Another type fiber-optic pressure sensor is based on Fabry-Perot interferometry. The basic principle is shown in Fig. 3.15.

51
Fig. 3.15. Fabry-Perot cavity.
Two partially silvered surfaces are placed close together, creating an optical cavity. When light is injected from outside the cavity, a portion of it is reflected and a part of it passes through the first mirror to be reflected from the second mirror. The second mirror is attached to the pressure diaphragm so that its position will vary with the applied pressure. Multiple reflections are created between these two surfaces, and these reflections interfere with each other, either constructively (peaks) or destructively. The light that reflects back up the fiber is wavelength-modulated in proportion to the cavity length. A partially silvered wedge passes light into the cavity, and a CCD array on the other side of the cavity detects the light. The CCD array is calibrated such that when it detects the peak wavelength from the two surfaces of the sensor’s Fabry-Perot cavity, the data are correlated to the absolute length of the cavity, which is a function of the pressure. A third type of pressure sensor based on fiber optics uses a quartz tuning fork attached to the end of a Bourdon tube. As pressure increases inside the Bourdon tube, it attempts to uncoil. This places tension on the quartz tuning fork, thereby increasing the resonant frequency of the tuning fork. If an LED or laser diode excites the tuning fork via a fiber, a second fiber can detect the change in resonant frequency. 3.7.2 Maturity of the Technology Fiber-optic pressure sensors have been used for several years in the process industry, and may also find increasing use in nuclear power plants. Their advantages include excellent stability, high accuracy, and very low maintenance requirements. In addition, they have significant advantages for application in harsh environments due to their immunity to the effects of high-temperature, high-electromagnetic interference, high corrosion, and high-radiation environments. These sensors have demonstrated their successes both in combustion applications, such as pressure-sensing spark plugs, glow plugs, fuel injectors, and noncombustion applications, such as monitoring pressure in natural gas pipeline compressors, plastic melt pressures, and pressure control in a pharmaceutical plant. Luna Innovations demonstrated that their Bragg grating-based optic sensors can survive up to 2 × 10¹⁹ fast neutrons/cm2 and 87 GRad gamma in a combined neutron and gamma environment. These sensors have been demonstrated to measure pressure up to 500 psi at 800°C. Sampling frequencies up to 1.0 MHz are available [Luna Innovations 2004]. One application of fiber-optic sensing technology that deserves attention is the application of the fiber-optic Fabry-Perot interferometer (FFPI) to detect cavitations and flow instabilities in centrifugal pumps in nuclear power plants [Perez 1998]. The dynamic pressure resulting from the pump suction and discharge effects, cavitations, vane-pass pulsations, and excessive wear ring leakage for a high-energy process may cause large dynamic axial forces, leading to premature thrust-bearing failures. Continuously monitoring the dynamic pressure provides a useful indicator of unsafe pump operation. The FPPI technology also has the added advantage of being able to operate at temperature ranges of up to 800°C (typical pressure transducers are limited to processes below about 300°C) and two-orders-of-magnitude improvement in sensitivity over typical pressure transducers.

52
Above 800°C, conventional quartz glass fiber-optic sensors fail to measure pressure reliably. Single-crystal sapphires have been used extensively for high-temperature measurements (above 1000°C), but very few data have been reported for pressure measurement applications. In order to extend the operating temperature of fiber-optic pressure sensors, a fiber-optic pressure sensor utilizing single-crystal cubic zirconium as a structure material has been developed [Peng-Wei 2004]. The pressure response of the sensor has been measured from 0 to 1700 psi. Additional experimental results from 23 to 1026°C show that cubic zirconium could be used for pressure sensors at temperatures over 1000°C. Work is being done to improve fiber-optic pressure and temperature sensors for oil down-hole applications [Qi-Bing 2001]. The air gap in the sensor head changes with the pressure and temperature. The sensor head is an interferometer-based fiber-optic senor. For high-speed applications, a novel self-calibrating interferometer/intensity-based (SCIIB) scheme that compensates for both light-source drift and the fiber-loss variation is used to demodulate the pressure (or temperature) signals. Experimental results show that the SCIIB system achieves 0.1% accuracy with a range of 0 to 8000 psi for the pressure sensor and a range of 0 to 600°C for the temperature sensor. Measurement of pressure in an explosive air blast requires an electrically isolated sensor having high bandwidth and high spatial resolution. Researchers have developed an optical-fiber-based pressure sensor that meets these requirements [MacPherson 2000]. Tests that subject the sensor to experimental explosive-blasts show a high degree of reproducibility in sensor performance and are consistent with a contemporary theoretical model. A rise time of 3 μs was achieved in response to a 100-Kpa shock, and a resolution of 1 Kpa was demonstrated. 3.7.3 Potential Regulatory Impact The preponderance of fiber-optic pressure sensor research is toward improving long-term durability and extending the operating temperature range. Several applications of the technology are anticipated, with benefits as discussed in the previous section. 3.8 Hydrogen Sensors 3.8.1 Basic Principles of the Technology Currently, hydrogen sensors are based on the property changes after hydrogen is absorbed into a material through physical or chemical mechanisms. Catalytic bead sensors consist of two beads surrounding a wire with one bead inert to hydrogen molecules and the other highly reactive to hydrogen molecules. The increase in the resistance of the catalytic bead is used as a signal for hydrogen detection. Catalytic bead sensors can measure hydrogen concentrations ranging from 1 to 5% with 10 to 30 s of response time. Semiconductor and electrochemical hydrogen sensors have very fast response times (less than several seconds), but they are not appropriate for post-accident measurement in nuclear power plants because oxygen concentration also affects the resistance and the chemical reaction. The hydrogen sensor technology deserving of monitoring for nuclear application is the palladium alloy sensor, which has rapid responses and is robust in environment variations [Jardine 2002]. The basic type of resistive palladium alloy sensor uses the palladium surface as a catalyst to break the H-H bond and allow the monatomic hydrogen to diffuse into the metal such that the changes in the electric resistivity of the metal can be used for hydrogen detection. Palladium can also be used as the gate material for a standard field effect transistor; the large changes in the current-voltage characteristics of the field-effect transistor are then used for hydrogen detection.

53
3.8.2 Maturity of the Technology Hydrogen sensors have nuclear power applications both in the near term as monitors for hydrogen accumulation in reactor systems and in the long term as an essential element of a nuclear hydrogen production plant. Indeed, as hydrogen technology has emerged to provide a clean, abundant energy source, many hydrogen sensor technologies have been developed by different industries in the past 5 years. A robust wide-range hydrogen sensor technology has been developed by Sandia National Laboratories [SNL 2004]. The hydrogen sensor uses (1) catalytic palladium nickel (PdNi) gate metallization on field-effect transistor sensors for detecting low concentrations of hydrogen (parts per million), (2) PdNi resistor sensors for detecting higher concentrations of hydrogen (up to 100%), and (3) on-chip micro-thermometers and micro-heaters for maintaining constant chip temperature. The design is aimed at addressing the drawbacks of current hydrogen sensors: a limited dynamic range, poor reproducibility and reversibility, an unacceptable frequency of false alarms, and the tendency to be slow, unreliable, and difficult to use. Some additional issues for nuclear application include methods to remove sulfur-bearing contaminants from the palladium surface for accurate measurements; nonuniform hydrogen distribution; and the harsh environment of high temperatures, high pressure, and high humidity in the containment after an accident occurs. Aluminum nitride–based hydrogen sensors are also under development [Auner 2004]. This unique sensor is based on a Pd/AlN/Si structure which behaves similarly to a MIS device. The device is reported to be highly selective, showing no response to oxygen, propane, or carbon monoxide, and can detect hydrogen concentrations as low as 1 ppm in the surrounding flow. While this device holds a lot of promise, a considerable amount of work still needs to be performed before it can be commercialized. Ongoing work has focused on characterizing the electrical properties of the device, characterizing the exact nature of the sensing mechanism, and optimizing the performance by varying palladium and AlN thicknesses, and employing various palladium-based alloys. 3.8.3 Potential Regulatory Impact Continued interest in following progress in hydrogen-sensor technology is warranted. Continued development of hydrogen sensors is needed not only for current plants, but more so for entrained gas monitoring and for facility or process monitoring as part of nuclear-driven hydrogen production. In either case, monitoring the evolution of these technologies is suggested. 3.9 Smart Sensors 3.9.1 Sensor Fusion and Enhanced Diagnostics Data reconciliation and gross error detection methods have recently received attention among nuclear electric utilities in Europe [Grauf 2004, Sunde 2003]. The sensor fusion technique takes advantage of the plant-wide mass balance and energy balance equations to reconcile plant measurements such that the balance equations are satisfied in a strict manner. Because the easily developed models provide additional functional redundancy to the plant measurements, the reconciled values will be much more accurate than the raw measurements. This technique is mature enough for application in nuclear power plants at steady-state conditions to improve plant operation performance and provide a sensor calibration standard when digital systems are applied. Additional research currently focuses on dynamic data reconciliation for better control.

54
An alternative approach to smart sensors is to realize the diagnosis and report of their own conditions through built-in software and hardware testing capabilities. Because this technique depends on individual sensor design, it is difficult to completely review this topic. However, the trend toward sensors with the capability of self-checking and calibration as well as intelligent and automatic failure diagnosis is certain to increase in order to reduce personnel costs and increase reliability by detecting a fault at its incipient stage. For instance, Integrated Sensing Systems, Inc., has developed an ultra-sensitive capacitive pressure sensor that has built-in temperature compensation and provides such features as self-testing and self-calibration [Adrian 2000]. 3.9.2 Maturity of the Technology While implementation of the technologies outlined above is not as widespread in the power industry, smart sensors and transmitters themselves have long proliferated in the non-nuclear industry and are also in use in nuclear power plants in noncontainment applications. Smart transmitters can offer improved and safer plant operation through remote communications and because of their self-diagnostics capabilities. Specific benefits include (1) greater transmitter accessibility in difficult access locations, (2) simplified transmitter and loop verification, (3) self identification of the failure mode, and (4) ease of troubleshooting and diagnostics from the control room. The most significant hindrance to their application in a containment environment continues to be susceptibility of the CMOS electronics to radiation. However, with advances in radiation-hardened electronics (e.g., C-RAMs and SOI technology), and the likelihood of such electronics increasingly being applied in commercial off-the-shelf (COTS) systems, it is highly likely that smart transmitters can be qualified for containment applications in the foreseeable future. 3.9.3 Potential Regulatory Impact Current standards and regulations for qualifying microprocessor-based I&C may be adequate for qualifying smart transmitters for use in containment environments. However, advances in radiation-hardened electronics should continue to be monitored to identify any need for independent verification of claimed performance in containment. For example, system response time may be critical in some applications, but temporary (several milliseconds) degradation in performance may preclude a smart transmitter’s use in containment, even though for less time-critical applications the transmitter may pass qualification.

55
This Page Intentionally Left Blank

56
4. CONCLUSIONS AND RECOMMENDATIONS This update survey of emerging I&C technologies in the nuclear power plant environment provides an opportunity to assess recent advances in the I&C discipline since the first publication in the series (NUREG/CR-6812). While the technology focus areas identified in NUREG/CR-6812 have essentially been maintained in this update, we have focused on sensors for a more detailed discussion. One reason is that improved and more accurate sensors provide the best opportunity for increased safety and operating margins. This chapter provides a summary of observations and recommendations for confirmatory research and continued monitoring of progress. Table 4.1 provides a summary of the state of the art of the technology focus areas discussed in this update. The “Status” column in the table has the same definition as in Table 2.1, that is
• Category A — Essentially ready for use. The technology is either commercially available now or could be available within a year.
• Category B — Further testing is required and is being carried out by the developers. Commercial availability is at least a couple of years away.
• Category C — Some additional development required. Commercial availability is possible within the next 3–5 years.
• Category D — Significant development required. Commercial availability is not likely within the next 5 years.
• Category E — Still in the fundamental research stage. Commercial availability may be possible in 5–10 years.
For the sensors and measurement systems technology focus area, some of the sensors and sensing techniques that were initiated as a result of the research stimulus provided by the DOE programs (NERI, INERI, and NEER) have progressed from concepts and laboratory prototypes to becoming potential commercial products: 1. One notable example of sensors that are close to becoming commercially available is the silicon
carbide neutron flux monitor. One important advantage of this type detector is that, because of its larger band gap compared to conventional semiconductors such as silicon or germanium, SiC radiation detectors are not as susceptible to thermally generated noise and are capable of operation at high temperatures. This technology is past the developmental stage and is essentially ready for use. However, data on important parameters such as drift, accuracy, repeatability, and degradation over time could not be ascertained for this update. It is important that a combined neutron monitor based on this technology not only exhibits the full dynamic range from startup to 100% power, but it should also be shown not to degrade over the long term when at 100% power. The improved operating and safety margins that such detectors will provide, should they also meet all the criteria mentioned above, certainly warrant continued monitoring of progress in their development.
2. A sensor that could be commercially available for nuclear power plant applications within 5 years is
the Johnson noise thermometer. The attraction of JNT is that it is inherently drift free and insensitive to the material condition of the sensor. As a result of the latter characteristic, a sensor based on Johnson noise is immune to the contamination and thermo-mechanical response shifts that plague thermocouples and resistance thermometers. This advantage should improve operating as well as safety margins in nuclear power plants.

57
Table 4.1. General status of emerging technologies
Technology Statusa Description of principle Typical or foreseeable
application New progress Conclusions
SiC Neutron Flux Monitor A
6LiF deposited on top of a thin SiC layer converts neutrons to charged particles via the Li(n,α)3H reaction Charge is collected under a voltage bias
Ex-core neutron monitoring with no gamma compensation
Prototype tested under research reactor conditions. Essentially ready for use
Solid-state neutron flux monitor
B Flux-induced change in electric resistance of aluminum nitride solid
In-core flux mapping at power range fluxes, since detector is sensitive
The stability and leakage current tested at room temperature with no incident gamma radiation
Need further testing
Fuel mimic power monitor (Constant temperature power sensor )
B
Control the input electric energy to a fuel pellet to maintain constant temperature when reactor is at some steady-state power level The electrical power required to maintain constant temperature is a measure of the nuclear power level
Direct measurement of the nuclear energy deposition
The second-generation prototype with improved bandwidth and proportionality has been tested
Restriction to steady-state operation Need demonstration testing at reactor operation conditions
Optical pressure sensors C
Movement of diaphragm due to pressure causes changes in reflected light Source of light may be an light-emitting diode (LED) and detector may be a photodiode
(1) Pressure measurement in high-temperature, pressure, corrosive environment (2) Optical Farbry-Perot interferometer to detect pump cavitation and flow instabilities
Demonstrated application in harsh radiation environment. Experimental studies are continuing
Need to improve the durability and demonstrate its performance
Gamma ray tomographic spectrometry.
A
Use the energy and time of Compton scatter events and photoelectric absorption events to project the arrival angle of an incident gamma ray
(1) Applied to obtain image of pebble bed coating structure (2) Real-time characterization of radiation field
In use after improvements in cadmium zinc telluride production
Expect extensive use
Hydrogen sensors C
Use palladium as catalysts to allow H to diffuse into a metal and change the resistance
Post-accident hydrogen monitoring
Robust hydrogen sensors have been integrated onto a single chip
Need to stand the post-accident harsh environment

58
Table 4.1. General status of emerging technologies (continued)
Technology Status Description of principle Typical or foreseeable application New progress Conclusion
Johnson noise thermometry C
Electronic vibration due to thermal agitation of atoms (noise) This noise voltage is a function of temperature T
Temperature measurement with continuous online self calibration
Sensitivity to electromagnetic (EM) noise; complexity of implementation is being addressed
Requires radiation-hardened preamp Improvements in signal processing and rad-hard electronics are still needed
Magnetic flowmeter D
Conducting fluid passing through magnetic field generates voltage proportional to velocity of flow
Mature technology in non-nuclear industry Currently tested for primary flow measure-ment in pressurized water reactors (PWRs)
Radiation sensitivity of inner pipe liner is the major challenge Work to overcome this problem is still in progress
Liner problem needs to be solved
Fabry-Perot fiber-optic temperature sensor
D
Send light through a reference fiber and a sensing fiber. Temperature causes change in physical dimension, causing a phase difference between the light travelling through the two fibers. The phase difference can be measured by “counting fringes”
Tested for irradiation effects, high temp and pressure
Degradation caused by irradiation observed
Results awaited for radiation exposure testing
Radiation-hardened integrated circuits
B
Materials/processes that are radiation resistant (e.g., SOI, chalcogenide) and compatible with IC manufacturing processes are used
Total dose hardness, latch-up immunity, and upset error mitigation. Should enable use of commercial off-the-shelf (COTS) systems in harsh environments
Maxwell-SCS 750, radiation-tolerant 0.13 mμ , complementary metal-oxide semiconductor (CMOS) process.
Commercially available and ready for testing
Optical processors B Optical digital signal processing
(DSP) for analog processing
Better communications in noisy channels and interference cancellation
Thousand times faster than conventional electronic processing
Lenslet Ltd.-Enlight 256 commercially available
Supervisory control A
Manage all monitoring and operational tasks
Advanced man-machine interface
Advanced boiling water reactors (ABWRs), Onagawa Nuclear Power Plant
HITACHI-NUCAMM-90 commercially available

59
Table 4.1. General status of emerging technologies (continued)
Technology Statusa Description of principle Typical or foreseeable application New progress Conclusions
Sensor fusion B Use functional redundancy for sensor fault diagnosis
On-line instrument calibration and fault diagnosis
Demonstration testing has been done
Could be integrated into distributed control systems (DCS) for next generation nuclear power plants
Enhanced diagnostics A Real-time diagnosis through built
in software and hardware testing
On-line instrument calibration and fault diagnosis
Ultrasensitive capacitive pressure sensor with built-in temperature compensation
Extensive use of the principle in nuclear power plants
System on a chip C Integration of all components on
one chip
(1) Protection of intellectual property (2) Save circuit board space (3) Sensors-on-a chip application
(1) Wide application in telecommunication (2) A remote input-output chip with 32 transducers of voltage and current sensing
Need to address high degree of integration for complex systems
Vertically stacked integrated circuits
E Three-dimensional (3D) design to increase transistor density
Advanced chip technology.
(1) New 3D design tools are developed (2) Heat removal is still a constraint
Fundamental research
Nanotriodes E Reinvention of vacuum tubes using nanotechnology
High-radiation and temperature application
(1) 100-nm size nanotriodes are developed (2) High operating voltage
Fundamental research
Molecular-scale electronics E
Use nanoscale mechanism to improve computation speed and density
Associated with high-speed computation
Proof-of-principle research on DNA-based computing, quantum computing, and nanoelectronics-based computing
Fundamental theoretical research
Application-specific integrated circuits (ASIC) and ASIC software
A Integrated circuits for specific function
Design-for-test concept allows safety system applications
Westinghouse 7300A (ASIC-based) digital replacement module
Already in extensive use
Model-based techniques B
Use real-time simulation and optimization to improve operation performance
Nuclear power plant operation performance improvement
TEMPO software is completed Need demonstrating application

60
Table 4.1. General status of emerging technologies (continued)
Technology Statusa Description of principle Typical or foreseeable application New progress Conclusions
Control-loop performance monitoring
B
Compare the metrics calculated from historical data with some standards of the best possible performance
Real-time controller performance assessment
Application in other process industries
Need to have a demonstration research for NPPs
Laser-based alignment monitoring
B Able to measure the relative movement between two laser transducers across long distance
Shaft alignment of rotating machines
Demonstrated for the alignment monitoring of a turbine driven feed water pump
Need to address the sensitivity to the adjacent vibration and thermal disturbances
Intelligent agent-based control
D The concept of software agent is used to support autonomous control
Autonomous control of nuclear power plants
Proof-of-concept development and testing to support the grid coordination and protection of distributed energy resources
Long-term monitoring
Multilevel flow model C
Incorporate into control the structured graphic representation of system goals, functions, and their relationships
The achieved control is case dependent, so computerized operation procedure can be developed using this method
An multilevel flow model (MFM) model of nuclear main system has been developed and demonstrated
MFM modeling is time consuming and still subject to error
Object-oriented language: real time Java
D Safety-critical Java product using memory- and time-partitioned kernel
May have application to the control of safety systems
Product release (JRTK™) has been announced Long-term monitoring
Software agents D Multiple agents that can take situational actions interact to achieve self-organizing goal
May have applications in power grid distribution and coordinated plant control
Demonstrated application to distributed data management Long-term monitoring

61
Table 4.1. General status of emerging technologies (continued)
Technology Statusa Description of principle
Typical or foreseeable application New progress Conclusions
Human-system interface A Client server architecture
Enable operation with system diagrams and trends
ABWRs, Onagawa Nuclear Power Plant
HITACHI-NUCAMM-90 commercially available
Software agent-based operational support system
B Software search engines Security of nuclear installations
Works 24/7, sorts out only relevant information
Used in ORNL for homeland security
Virtual collaborator C Software
combined with hardware
Can behave like a nuclear power plant operator
Detect anomaly, diagnose the root cause, and operate control panel
Second-phase research started with focus in interaction with humans
Biometrics C Identification using biological traits such as iris and face recognition
Safety of nuclear power plants and strategic installations
US-VISIT program For homeland security
Automated visual surveillance for facility monitoring
D Monitors area, takes video, and takes action
Safety of nuclear installations
Tested using performance evaluation of tracking system (PETS) 2000
Focus on moving objects
Virtual reality A Software
Optimize construction sequence, eliminate problems, reduce cost, and train workforce
Implemented in AP600 plant (ALWR) Commercially available
aCategory A — Ready for use. The technology is either commercially available now or could be available within a year. Category B — Confirmatory testing required. Commercial availability is at least a couple of years away. Category C — Some additional development required. Commercial availability is possible within the next 3–5 years. Category D — Significant development required. Commercial availability is not likely within the next 5 years. Category E — Fundamental research required. Commercial availability may be possible in 5–10 years.

62
However, problems that have hampered commercial utilization of Johnson noise thermometers include a relatively long response time because of the long integration time required to make a temperature measurement. An ORNL implementation addresses this problem in a dual-mode thermometer by making the temperature measurement as a simple resistance measurement whose resistance to temperature conversion is quasi continuously updated using Johnson noise. ORNL scientists plan a demonstration of JNT at a nuclear facility within 2 years. Thus, a practical implementation of the JNT in nuclear power plants could be as an on-line, self-calibrating RTD. The regulatory implication of self-calibration is that required calibration intervals could be relaxed. It is recommended that progress in this technology should continue to be monitored.
3. At the other end of the spectrum in terms of commercial availability of the sensor technology are
scintillation-based sensors for in-core temperature and flux measurements and vacuum nanotriodes. In the case of scintillation-based sensors, the primary deficiencies in the technology preventing its use for in-core measurements have been the lack of an effective technique for measuring light within reactor core environments and the rapid darkening of fiber-optic light pipes in high radiation fields. Additionally, scintillation materials darken too rapidly to be useful in bulk form near a nuclear reactor core. For the purposes of this update, no significant progress in overcoming these problems could be identified. In the case of vacuum nanotriodes, the technology is also still in relative infancy. However, because of the advantages that advances in both technologies could provide for nuclear power plant I&C, both scintillation-based sensors and vacuum nanotriodes should continue to be monitored.
4. Variability in the radiation response of COTS devices is a significant radiation hardness assurance
(RHA) issue. Approaches such as radiation-hard technologies and improved manufacturing processes may resolve this impediment. These improvements are most likely to be seen first in space applications. Therefore, it is warranted to monitor special-purpose applications while confirming the radiation-tolerant characteristics of commercial ICs. Considerable progress has been made in radiation-hardened integrated circuit development using materials such as SOI. State-of-the-art-radiation-hard IC technologies are exemplified by the Maxwell Technologies’ single board computer, the SCS750. It uses SOI technology fabricated in a radiation-tolerant 0.13-μm CMOS process. Performance characteristics include (1) one upset every 300 years in a GEO orbit, (2) space qualified performance at 1800 MIPS; (3) triple modular redundant processing, (4) use of SOI processors, and (5) use of advanced error-corrected SDRAM. Another innovation in radiation-hardened chip technology is the integration of chalcogenide material with radiation-hardened CMOS process to produce memory arrays. Chalcogenide-based memory is highly radiation resistant, and its importance in space I&C applications is well recognized. Four megabit C-RAMs represent the current state of the art. Advances in radiation-hardened ICs should continue to be monitored to facilitate the review of safety instrumentation such as smart transmitters for containment applications.
5. Advances also continue to be made in other, more exotic technologies such as nanotriodes and
molecular electronics. This technology could have a significant impact on nuclear I&C because of its high tolerance for high-radiation and high-temperatures. Despite advances in the development of these devices, numerous challenges remain before working devices become commercially available. In the case of molecular devices, although the technology is interesting, it is not likely to develop to the point that it would migrate into nuclear applications within the foreseeable future. Although this is not likely that nanoelectronics and nanotriodes be deployed in nuclear power plant environments in the near future, progress in their development should continue to be followed over the long term, because this technology could enable smart sensors to migrate into the most inhospitable areas within the reactor containment.

63
One important aspect of the Emerging Technologies series of reports is to identify research needs as well as I&C areas that should continue to be monitored in an effort to improve the NRC review process. In a memo to the NRC by the Advisory Committee on Reactor Safeguards [ACRS 2000], the latter indicates that the National Research Council recommended Emerging Technologies as a research area for inclusion in the NRC research plan for instrumentation and control. It also recommended that the output of the research should include “specific anticipated output or product…and the way in which this output or product meets the Agency needs….”
6. An underlying enabling technology that will facilitate reliable nuclear plant digital I&C operation is
the implementation of a robust communication protocol. Unfortunately, the unwary use of digital communication in the plant (for example, communication between control, safety, and offsite) has the potential to raise safety and cyber security concerns. A set of best practices in digital communication in nuclear power plant safety I&C systems could be developed to support the review of digital I&C system upgrades in current generation plants, as well as in Generation III and Generation IV plants. In nuclear power plants, traditional direct-wired, point-to-point connections between analog equipment have been the norm. However, the trend in the use of data networks to serve plant personnel, application of digital I&C in system upgrades, and communication between safety and nonsafety systems, is likely to increase. While current NRC regulatory guidelines [e.g., Regulatory Guide (RG) 1.152-2005] do not endorse the guidance provided in IEEE Std 7-4.3.2 for communication independence because it “provides insufficient guidance,” they do not specifically prohibit it. RG 1.152 points to additional guidance provided in Appendix 7.0-A, “Review Process for Digital Instrumentation and Control Systems,” Appendix 7.1-C, “Guidance for Evaluation of Conformance to IEEE Std 603,” and Section 7.9, “Data Communication Systems,” in NUREG-0800.
While in agreement with the additional guidance provided in RG 1.152, allowing communication between digital systems in general does introduce the potential for compromising safety. One example is the disabling of a safety parameter display system at the Ohio Davis-Besse nuclear power plant that occurred in January 2003 [Davis-Besse, 2003]. The slammer worm first penetrated the unsecured network of a Davis-Besse contractor, then worked its way through a T1 line bridging that network and Davis-Besse's corporate network. The T1 line was one of multiple ingresses into the Davis-Besses’s business network that completely bypassed the plant's firewall. The plant was reported to have been offline when the incident occurred, thus the breach did not affect the operation of the plant. However, the case does illustrate an important issue: that a cyber security breach can compromise a safety system where interconnection is allowed between plant and corporate networks (or any other network).

This Page Intentionally Left Blank

65
5. REFERENCES ACRS. 2000. http://www.nrc.gov/reading-rm/doc-collections/acrs/letters/2000/4711888.html Adrian, P. 2000. “Sensor Industry Developments and Trends,” Sensor Business Digest,
http://www.sensorsmag.com/resources/businessdigest/sbd0400.shtml. Adleman. 1994. http://php.iupui.edu/~pellison/n301/page4.html Adleman. 2002. Adleman, Len, Business Week Online,
http://www.businessweek.com/technology/content/jan2002/tc2002014_0027.htm Aonix, 2004. Aonix Press News, “Roadmap for Hard Real-Time Java™ Products,” March 29, 2004.
http://www.aonix.com/pr_03.29.04b.html Auner, G.W. 2004. “Smart Sensors and Integrated Microsystems,”
http://www.ssim.eng.wayne.edu/chemical/ ATMEL. 2004. Space Rad Hard ICs, ATMEL website,
http://www.atmel.com/dyn/products/product_card.asp?part_id=2318 ATV. 2001. http://www.atv-infrared.com/equipment.htm Brixy, H.G., 1971. “Temperature Measurement in Nuclear Reactors by Noise Thermometry,” Nuclear
Instruments and Methods, 97(1) 75–80, November. Cohen, D. 2003. “Distributed Intelligent Agents for Decision Making at Local Distributed Energy
Resource (DER) Levels,” U.S. Department of Energy Electric Distribution Transformation Program Peer Review, October.
Davis-Besse, 2003. http://www.theregister.co.uk/2003/08/20/slammer_worm_crashed_ohio_nuke/ Das, S., A. Chandrakasan, and R. Reif. 2003. “Three-Dimensional Integrated Circuits: Performance, Design Methodology, and CAD Tools,” In Proc. ISVLSI, Feb. Dicks, A.R. and M.J. Brooks. 2003. “Issues in Automated Visual Surveillance,” New Scientist, July 12,
2003, p. 4. Website: http://www.cs.adelaide.edu.au/users/mjb/Papers/issues.pdf Dulloo, A.R., F.H. Ruddy, J.G. Seidel, J.M. Adams, J.S. Nico, and D.M. Gilliam. 2003 “The Thermal
Neutron Response of Miniature Silicon Carbide Semiconductor Detectors,” Nuclear Instruments and Methods, A, 498, 415.
EPRI. 2003. “Virtual Reality Construction for Cost Reduction of Advanced Nuclear Plants,” Strategic Science and Technology, September 2003, http://www.epri.com/attachments/294099_SS-4DVCANP903.pdf
EPRI, 2003b. Safety Evaluation Report on the Westinghouse 7300A, http://www.epri.com/orderableitem.asp?marketnid=249633&targetnid=249866&oitype=1&value=03T023027
Emigh, J. 2003. “The Password is Biometric,” Access Control and Security Systems, May 1, 2003, http://govtsecurity.securitysolutions.com/ar/security_password_biometrics/
Fielder, R.S., and K.L. Stinson-Bagby. 2005. “High-Temperature Fiber Optic Sensors, an Enabling Technology for Nuclear Reactor Applications,” http://www.designinfo.com/goto/PDFViewer?pdfURL=http%3A%2F%2Fwww3%2Einspi%2Eufl%2Eedu%2Ficapp04%2Fprogram%2Fabstracts%2F4298%2Epdf
Garrison, J.B. and A.W. Lawson. 1949. “An Absolute Noise Thermometer for High Temperatures and High Pressures,” Review of Scientific Instruments, 20, 785-94.
Grauf, E., J. Jansky, and M. Langenstein. 2000. “Reconciliation of Process Data in Nuclear Power Plants,” Proceedings of ICONE 8 International Conference on Nuclear Engineering, April 2-6, Baltimore, USA.

66
Hanying, L., D.W. Miller, J.W. Talnagi. 2003 “Performance Evaluation of Fabry-Perot Temperature Sensors in Nuclear Power Plant Measurements,” Nuclear Technology, 143, No. 2, August 2003, pp. 208-216.
Harris T. J., C.T. Seppala, and L.D. Desboroughb. 1999. “A Review of Performance Monitoring and Assessment Techniques for Univariate and Multivariate Control Systems,” Journal of Process Control, 9, 1-17.
Hively, L.M., V.A. Protopopescu, K.M. Reichard. 2003. “Forewarning of Failure in Critical Equipment at Next-Generation Nuclear Power Plants,” ORNL/TM-2003/222, October.
Holcomb, D.E. 2002. “Development of Enhanced Reactor Operation Strategy through Improved Sensing and Control at Nuclear Power Plants,” I-NERI Year II Annual Progress Report.
Holcomb, D.E. 2003 “I-NERI Quarterly Technical Progress Report,” http://rclsgi.eng.ohio-state.edu/~orosz/Quarterly_Sep03.htm.
Holcomb, D. E., et al. 2005. Solid State Flux Monitor Development, Farication, Fabrication, and Testing, Final INERI Project Report Number 2002-020-K.
IEEE Std. 323-1983. 1983. IEEE Standard for Qualifying Class 1E Equipment for Nuclear Power Generating Stations, The Institute of Electrical and Electronic Engineers, Inc., 3 Park Ave., New York City, NY.
Ishii, H., W. Wu, D. Li, H. Ando, H. Shimoda and H.Y Oshikawa. 1999. “A Basic Study of Virtual Collaborator—The First Prototype System Integration,” Graduate School of Energy Sciences, Kyoto University, Kyoto, Japan, http://hydro.energy.kyotou.ac.jp/Lab/staff/hirotake/paper/papers/AROB99.pdf.
Jardine, A.P. 2002. Hydrogen Sensors for Hydrogen Fuel Cell Applications, http://www.powerpulse.net/powerpulse/archive/pdf/aa_111300a.pdf.
Kirman. 2004. http://lamspeople.epfl.ch/kirrmann/Slides/AI_15_Architecture.ppt. Kisner, R. et al. 2003. “Johnson Noise Thermometry for Harsh Environments,” IEEEAC Paper No. 2170,
Version 4, updated November 11. Kisner, R. et al. 2005. “Development of Johnson Noise Thermometer for Nuclear Power Use,” Final
Report, International Nuclear Energy Research Initiative (INERI), Project 2002-020-K. Larsson, J.E. 1988. “Alarm Analysis for a Nuclear Power Plant Using Multilevel Flow Models,”
Proceedings of the 9th International Symposium on System, Modeling, Control, Poland. Lenslet, Ltd. 2004. http://www.lenslet.com Lochner K. 2002, “TELEPERM: An I&C Solution to Improve Plant Performance,” Nuclear Plant
Journal, Editorial Archive, December 2002. http://npj.goinfo.com/NPJMain.nsf/0/11383fed5cb4e5c586256c95007cb798?OpenDocument
Luna Innovations. 2004. “Radiation Hardened Sensors under Development at Luna Innovations,” http://www.lunainnovations.com.
MacPherson W.N., M.J. Gander, J.S. Barton, J.D.C. Jones, C.L. Owen, A. Watson, R.M. Allen. 2000. “Blast-Pressure Measurement with a High-Bandwidth Fiber Optic Pressure Sensor,” Measurement Science and Technology, Vol.11, No. 2, 2000, pp. 95-102.
Maxwell Technologies. 2004. “SCS750, Single Board Computer for Space,” http://www.maxwell.com/microelectronics/products/_sbc/index.html
Mills. 2004. An Experimental Evaluation of the Constant Temperature Nuclear Power Sensor, Masters Thesis, Ohio State University.
Naoki Hara, K. Makiyama, T. Takahashi, K. Sawada, A. Tomoyuki, T. Ohki, M. Nihei, T. Suzuki, Y. Nakasha, and M. Nishi. 2003. “Highly Uniform InAlAs–InGaAs HEMT Technology for High-Speed

67
Optical Communication System ICs,” IEEE Transactions on Semiconductor Manufacturing, Vol.16 (i3), August. p. 370 (6).
NRC. 1995. NRC Information Notice 95-08, “Inaccurate Data Obtained With Clamp-On Ultrasonic Flow Measurement Instruments,” United States Nuclear Regulatory Commission, Office Of Nuclear Reactor Regulation, Washington, D.C.
NRC. 2001. http://www.nrc.gov/reading-rm/doc-collections/commission/secys/2001/secy2001-0155/attachment.pdf
ORNL. 2003. Development Of Enhanced Reactor Operation Strategy Through Improved Sensing And Control At Nuclear Power Plants, I-NERI Quarterly Technical Progress Report, Oak Ridge National Laboratory, July–September.
ORNL. 2005. Miniature, Scintillation-Based, Temperature Probe for HTGRs, Nuclear Energy Research Initiative Project, Oak Ridge National Laboratory and The Ohio State University, Project 2001-039, Final Project Report, March 2005.
Paschalidis, Nikolaos P. 2003. “Advanced System on a Chip Microelectronics for Spacecraft and Science Instruments,” Acta Astronautica, Vol. 52, pp. 411–420.
Pepper, M.G. and J.B. Brown. 1979. “Absolute High-Temperature Johnson Noise Thermometry,” J. Phys. E: Sci. Instrum., Vol. 12, January, pp.31–34.
Perry, S.C. 2001. Alignment Monitoring and Correction of a Turbine Driven Feed Water Pump - PERMALIGN®, Energy Publications.
Peng-Wei, G.R. Pickrell, Wang-Anbo. 2004. “Cubic Zirconia-based Fiber Optic Pressure Sensor for High-Temperature Environment,” Proceedings of SPIE,Tthe International Society for Optical Engineering, Vol.5272, pp. 216–222.
Perez R.X., C.E. Lee, H.F. Taylor. 1998. “Using Fiber-Optic Pressure Sensors to Detect Cavitations and Flow Instabilities in Centrifugal Pumps,” Pumping Technology, June, pp. 170–174.
PROFIBUS-PA.“Technical Information,” http://www.samson.de/pdf_en/l453en.pdf. Qi-Bing, Pickrell-Gary, Zhang-Po, Duan-Yuhong, Peng-Wei, Xu-JunCheng, Huang-Zhenyu, Deng-
Jiangdong, Xiao-Hai, Wang-Zhiyong, Huo-Wei, May-Russell-G, and Wang-Anbo. 2001. “Fiber Optic Pressure and Temperature Sensors for Oil Down Hole Application.” Proceedings of SPIE, The Iinternational Society for Optical Engineering, Vol. 4578, pp. 182–190.
Radcliff, T.D. et al. 2000. “Constant Temperature Calorimetry for In-Core Power Measurement,” Nuclear Technology, Vol. 132(2), November, pp. 240–255.
Radcliff, T.D., S. Liu S, D.W. Miller. 2002. “Modeling and Optimization of a Constant-Temperature In-Core Power Sensor,” Nuclear Technology, Vol. 140. (2), pp. 209–221.
Rigoll, G, S. Eicheler, and I. Talcin. 2000. “1st IEEE Workshop on Performance Evaluation of Tracking and Surveillance (PETS 2000),” March, http://www-2.cs.cmu.edu/~vsam/Conferences/PETS2000/rigoll.html
Ross, Arun, Prabhakar, Salil and Jain, Anil. 2004. “Overview of Biometrics,” http://biometrics.cse.msu.edu/info.html
Ruddy, F.H., A.R. Dulloo, and J.G. Seidel. 2004. “Silicon Carbide Semiconductor Neutron Detectors,” Proceedings of the 4th International Topical Meeting on Nuclear Plant Instrumentation, Control and Human Machine Interface Technolog, (NPIC/HMIT 2004), September 19–22.
Ruddy, F.H., A.R. Dulloo, J.G. Seidel, F.W. Hantz, L.R. Grobmyer. 2002. “Nuclear Reactor Power Monitoring Using Silicon Carbide Semiconductor Radiation Detectors,” Nuclear Technology, Vol. 140, pp. 198–208.
RUP. 2001. Rational Unified Process: Best Practices for Software Development Teams, http://www.cs.nmt.edu/~cs328/reading/rup_bestpractices.pdf.

68
Schewe, P.F. and B. Stein. 1999. AIP Bulletin of Physics News, 454, October 26. SNL. 2004. Sandia National Laboratories MicrosSensors Group,
http://www.sandia.gov/mstc/technologies/microsensors/hydrogensensor.html SpaceDaily. 2004. http://www.spacedaily.com/news/terrorwar-04o.html Sunde, S. and B. Øivind. 2003. “Data Reconciliation and Fault Detection by Means of Plant-wide Mass
and Energy Balances,” Progress in Nuclear Technology, Vol. 43, 97–104. Suster, M., W.H. Ko, D.J. Young. 2004. “An Optically Powered Wireless Telemetry Module for High-
Temperature MEMS Sensing and Communication,” Journal of Microelectromechanical Systems, Vol. 13(3), June, pp. 536–541, http://ieeexplore.ieee.org/iel5/84/28958/01303632.pdf?isNumber=28958&prod=JNL&arnumber=1303632&arSt=+536&ared=+541&arAuthor=+Suster%2C+M.%3B++Ko%2C+W.H.%3B++Young%2C+D.J
Takehiko, S., O. Yukiharu, and M. Koyama. 2001. “Advanced Supervisory and Control Systems for Nuclear Power Plants,” Hitachi Review, Vol. 50, No. 3, p. 79, http://www.hitachi.com/ICSFiles/afieldfile/2004/06/08/r2001_03_104.pdf
Tanzer, C. 1999. Real-Time Magazine, Vol. 99 (4), http://www.realtime-info.be/magazine/99q4/ttt.pdf TELEPERM (1). http://www.framatech.com/envision/winter2001/pe_01.htm TELEPERM (2). Liddle, P. 2004. “Qualified Software Tools for Safety I&C Applications,” 4th Intl.
Topical Meeting Nuclear Plant Instrumentation, Controls, and Human-Machine Interface Technologies (NPIC&HMIT 2004), Columbus, OH.
TELEPERM (3). TELEPERM – Innovative Digital I&C for Nuclear Power Plants, http://www.de.framatome-anp.com/anp/e/foa/anp/products/s3_1.htm
TELEPERM (4). “Instrumentation and Control (I&C) Systems for Power Plants,” http://www.siemens.fi/evu/ev/download/peg97/pegi07.pdf
TEMPO. 2004. http://www.ife.no/english/prosjekter/ TTTech. 2004. Time-Triggered Technology Magazine,
http://www.tttech.com/technology/docs/general/TTTech-TTP-OS.pdf Wood, R.T., et al. 2003. Emerging Technologies in Instrumentation and Controls, NUREG/CR-6812,
RNL/TM-2003/22, Nuclear Regulatory Commission, March.