emerging stronger from the crisis - isbn: …tu...world bank east asia and pacific economic update...
TRANSCRIPT

WORLD BANK EAST ASIA AND PACIFIC ECONOMIC UPDATE 2010, VOLUME I
emergingstronger
from the
crisis
Pub
lic D
iscl
osur
e A
utho
rized
Pub
lic D
iscl
osur
e A
utho
rized
Pub
lic D
iscl
osur
e A
utho
rized
Pub
lic D
iscl
osur
e A
utho
rized


Emerging Stronger from the CrisisWORLD BANK EAST ASIA AND PACIFIC ECONOMIC UPDATE 2010, VOLUME I
Washington, D.C.

© 2010 The International Bank for Reconstruction and Development / The World Bank1818 H Street NWWashington DC 20433Telephone: 202-473-1000Internet: www.worldbank.orgE-mail: [email protected]
All rights reserved
1 2 3 4 13 12 11 10
This volume is a product of the staff of the International Bank for Reconstruction and Development / The World Bank. The findings, interpretations, and conclusions expressed in this volume do not necessarily reflect the views of the Executive Directors of The World Bank or the governments they represent.
The World Bank does not guarantee the accuracy of the data included in this work. The boundaries, colors, denominations, and other information shown on any map in this work do not imply any judgement on the part of The World Bank concerning the legal status of any territory or the endorsement or acceptance of such boundaries.
Rights and Permissions
The material in this publication is copyrighted. Copying and/or transmitting portions or all of this work without permission may be a violation of applicable law. The International Bank for Reconstruction and Development / The World Bank encourages dissemination of its work and will normally grant permission to reproduce portions of the work promptly.
For permission to photocopy or reprint any part of this work, please send a request with complete information to the Copyright Clearance Center Inc., 222 Rosewood Drive, Danvers, MA 01923, USA; telephone: 978-750-8400; fax: 978-750-4470; Internet: www.copyright.com.
All other queries on rights and licenses, including subsidiary rights, should be addressed to the Office of the Publisher, The World Bank, 1818 H Street NW, Washington, DC 20433, USA; fax: 202-522-2422; e-mail: [email protected].
ISBN: 978-0-8213-8275-2eISBN: 978-0-8213-8405-3DOI: 10.1596/978-0-8213-8275-2ISSN has been requested.
Cover photo credits: ©sculpies/istockphoto.com
PREFACE AND ACKNOWLEDGMENTS
The World Bank East Asia and Pacifi c Economic Update 2010, Volume I, was prepared by a team led by Ivailo Izvorski (Lead Economist East Asia and Pacifi c) with guidance from Vikram Nehru (East Asia and Pacifi c Regional Chief Economist). The team included Ekaterina Vostroknutova, Antonio Ollero, Kirida Bhaopichitr, Mohd Hasan Ahmad, and Manohar Sharma. Input was provided by country economists and analysts across the World Bank offi ces in East Asia and the Pacifi c, and from Ahmad Ahsan, Emilia Battaglini, Xu Gao, Robert Jauncey, Abhas Jha, Emmanuel Y. Jimenez, Oliver Mahul, Piers Merrick, Martin Reichhuber, Fatima Shah, Vivek Suri, Linda van Gelder, Eduardo Velez Bustillo, Xiao Ye, and Xiaoqing Yu. Eric Le Borgne, Andrew Burns, Frederico Gil Sander, Ardo Hansson, Louis Kuijs, Mick Riordan, Philip Schellekens, and Hans Timmer provided comments. Elisabeth Mealey provided communication support and Lynn Gross provided expert secretarial assistance. In the Offi ce of the Publisher, Patricia Katayama, acquisitions editor, and Dina Towbin, production editor, assisted in producing the electronic and print versions of the report. Budy Wirasmo typeset the report.
Emerging East Asia as used in this report includes Developing East Asia (China, Indonesia, Malaysia, Philippines, Thailand, Cambodia, Lao People’s Democratic Republic [PDR], Mongolia, Papua New Guinea, Timor-Leste, Vietnam, and the island economies in the Pacifi c) and the Newly Industrialized Economies (NIEs). The NIEs include Hong Kong, China; the Republic of Korea; Singapore; and Taiwan, China. In this report, middle-income countries refer to China, Indonesia, Malaysia, Philippines, and Thailand. In this report, low-income countries include Cambodia, Lao PDR, and Vietnam. The ASEAN member countries are Brunei Darussalam, Cambodia, Indonesia, Lao PDR, Malaysia, Myanmar, Philippines, Singapore, Thailand, and Vietnam.
www.worldbank.org/eapupdate
PREFACE AND ACKNOWLEDGMENTS iii


CONTENTS
Preface and Acknowledgments iiiAbbreviations 2Summary 3I. The Recovery 4
Real GDP is above pre-crisis levels 4Industrial production is recovering sharply 6Capacity utilization in industry and unemployment are also reaching pre-crisis levels 6Exports are yet to recover fully in the region’s middle-income countries 7Capital infl ows recovered in China but not in the other middle-income countries 9The crisis slowed the pace of poverty reduction in developing East Asia 12
II. The Short-Term Challenge: Withdrawing the Stimulus without Disrupting the Recovery 14Premature withdrawal of fi scal stimulus remains a big risk 14Most central banks have begun to selectively tighten monetary policy 15Exchange market intervention and currency appreciation have returned 16
III. The Imperative for Renewed Structural Reforms 18It’s a new world 19For China, the challenge will be to rebalance the economy 20For East Asia’s middle-income countries, moving up the value chain will remain a priority 21Low-income countries need to break into manufacturing 26Commodity exporters need sound fi scal policies for sustainable growth 27The Pacifi c islands need to pursue deeper integration with the nearest large market 29A common regional agenda for the medium term 31
Country Pages & Key Indicators 39Cambodia 39China 42Fiji 45Indonesia 48Lao PDR 51Malaysia 53Mongolia 56Papua New Guinea 58Philippines 61Small Pacifi c Islands 64Solomon Islands 67Thailand 69Timor Leste 72Vietnam 74
Appendix Tables 77
CONTENTS 1
EMERGING STRONGER FROM THE CRISIS

ADB Asian Development BankASEAN Association of Southeast Asian Nations (Brunei
Darusalam, Cambodia, Indonesia, Lao PDR, Malaysia, Myanmar, Philippines, Singapore, Thailand and Vietnam)
BIS Bank for International SettlementsCNPC China National Petroleum CompanyEAP East Asia and Pacifi c RegionECA Europe and Central Asia RegionEdStats Education StatisticsEIS Estimated Sustainable IncomeEU European UnionFDI Foreign Direct InvestmentG-3 United States, the Eurozone and JapanGDP Gross domestic productGEP Global Economic ProspectsHP Filter Hodrick Prescott FilterLAC Latin America and the Caribbean RegionMICs Middle Income CountriesNAFTA North America Free Trade AgreementNIEs Newly Industrialized Economies (Hong Kong,
China; Korea; Singapore; and Taiwan, China)OECD Organization for Economic Co-operation and
DevelopmentSGP Stability and Growth PactUN COMTRADE United Nations Statistics Division – Commodity
Trade StatisticsU.S. United States
CountriesCHN ChinaHKG Hong Kong, ChinaIDN IndonesiaKHM CambodiaKOR KoreaLAO Lao People’s Democratic Republic (PDR)MNG MongoliaMYS MalaysiaPHL PhilippinesPNG Papua New GuineaSGP SingaporeTHA ThailandTWN Taiwan, ChinaVNM Vietnam
ABBREVIATIONS
2
WORLD BANK EAST ASIA AND PACIFIC ECONOMIC UPDATE 2010, VOL. I
ABBREVIATIONS

SUMMARY
East Asia has recovered from the economic and financial crisis. Largely thanks to China, the region’s output, exports and employment have mostly returned to the levels before the crisis. Leading the global economy, real GDP growth in developing East Asia is poised to rise to 8.7 percent in 2010 after slowing from 8.5 percent in 2008 to 7.0 percent in 2009.
With the normalization of activity and firming of prices, the monetary authorities across the region have begun removing exceptional policy support. Measures have included allowing additional liquidity schemes to lapse, increasing required reserves and, in Vietnam and Malaysia, raising policy interest rates. But it may be premature at this stage to withdraw fi scal stimulus in many countries, as private investment is yet to become the engine of growth and the poor are still suffering. Nonetheless, fi scal space is limited and the stimulus alone cannot sustain domestic demand for an extended period of time. Transitioning to private sector-based growth in the short term is central.
This is achievable; East Asia has emerged stronger from the global crisis and rapid growth will be possible in the coming years even in a weakened global economy. But a return to pre-crisis private sector-driven growth rates will require that countries return to the medium-term reform agenda and implement it with vigor.
Given the region’s diversity, priorities will be different in different countries. For China, rebalancing the economy as emphasized in the 11th fi ve-year plan will be key. Rebalancing has several dimensions, including restructuring the composition of economic growth by enabling a larger role for the service sector and private consumption, away from investment-heavy export-led growth, and encouraging more environmental sustainability. For middle-income countries, the priority is more investment in physical and human capital to move up the value chain in production and exports. Low-income countries need to break into manufacturing and become part of global and regional production networks. Commodity exporters will need to strengthen fi scal rules and frameworks to translate volatile external revenues into long-term sustainable growth. And, last but not least, the Pacifi c islands will need deeper integration with their nearest large market.
This report also identifies two common regional agenda items for the medium term. First, the process of regional integration, driven by ASEAN’s commitments to creating a single economic area, will need to continue. Deeper regional economic integration is now even more important, given prospects for slower growth in advanced economies. Behind-the-border trade barriers must be lowered, even in the face of incipient protectionist pressures around the world, including in the region. Deeper integration will encourage agglomeration economies and intra-industry trade, support sustainable urbanization, lower costs, and increase international competitiveness.
Second, addressing climate change is high priority in the region. Mitigation measures must be strengthened to improve land and water use, bolster energy effi ciency and conservation, and foster a much larger role for renewable sources of energy. Increased energy effi ciency is not only good for energy security but is also environmentally more sustainable and will help make rapidly growing cities more livable. Moreover, with investment rates in the region higher than in developed countries, there is scope for East Asia to move rapidly to the “green” technology frontier. Such a move will give the region a competitive advantage in a sector poised for rapid global growth. At the same time, the adaptation agenda will require enhancing the region’s cooperation and disaster risk management frameworks. Institutional and regulatory frameworks for improving the resiliency of economic activity, reducing drought and fl ood risk, and managing coastal areas and small islands, are critically needed.
SUMMARY 3
EMERGING STRONGER FROM THE CRISIS

I. THE RECOVERY
REAL GDP IS ABOVE PRE-CRISIS LEVELS
East Asia has mostly recovered from the crisis. In the space of a year, the region shifted from a collapse in exports and investment, to leading the global rebound, and returning to the pre-crisis levels of real GDP (Figure 1 and Figure 2). The region has emerged stronger in a weakened world economy, in much better shape than after the 1997-98 Asian fi nancial crisis (Table 1). This remarkable recovery has been due to a large and timely policy stimulus, renewed inventory restocking, and the return of buoyant demand abroad and consumer sentiment. Even with the large stimulus, fi scal defi cits and debt are contained and for most countries pose no dangers to debt sustainability. Solid economic fundamentals, including high foreign exchange reserves, well-capitalized banks and modest levels of household, corporate and government debt have also been key factors for the recovery. Capital fl ows have roared back in China and the NIEs, even as tight global fi nancial conditions and ample spare capacity prompt worries that the “new normal” will be characterized by slower global growth. But large capital infl ows have also raised alarms about new asset bubbles in some countries. Authorities in the region are confronting these risks at the same time they are returning to a reform agenda needed to secure strong and sustained growth.
The recovery has been swift. Real GDP growth in the fourth quarter surged to 9.4 percent year-on-year in developing East Asia from 6 percent in the fi rst nine months of the year. For 2009 as a whole, growth slowed to 7 percent from 8.5 percent in 2008. A strong increase in private consumption and exports, and a shift to inventory accumulation in almost all countries were the key drivers of growth in the fourth quarter (Figure 4). High frequency indicators suggest that these factors have continued to support a rapid expansion in the fi rst half of 2010. The open economies of Thailand and Malaysia, with some of the highest ratios of exports to GDP and tightly integrated into global production networks, experienced contractions for 2009 as a whole despite the return to expansion in the latter part of the year. Output also fell in Cambodia, Mongolia and some of the Pacifi c islands.
China strongly infl uenced developments in the region. Its large monetary and fi scal stimulus limited the slowdown in growth to 8.7 percent in 2009 from 9.6 percent in 2008, with government-led investment surging by nearly 6 percent of GDP. Final demand expanded markedly, giving a timely boost to imports from the region in the fi rst half of the year. Stronger demand from the advanced economies began providing a more powerful impetus in the second half of 2009.
Figure 1. Real GDP has rebounded fast …
(Percent change year-on-year)
Sources: CEIC and World Bank staff calculations.
Figure 2. … and levels are above pre-crisis peaks in most of developing East Asia(fourth quarter of 2009 in percent of the pre-crisis peak, seasonally adjusted terms)
Sources: CEIC and World Bank staff calculations.*/ Peak pre-crisis quarter noted in brackets.
4
WORLD BANK EAST ASIA AND PACIFIC ECONOMIC UPDATE 2010, VOL. I
I. THE RECOVERY

Take China out of regional averages, however, and growth in the rest of developing East Asia was a mere 1.3 percent in 2009, lower than in South Asia and slightly stronger than in Sub-Saharan Africa (Table 2). Cyclical developments during the crisis notwithstanding, growth rates in East Asia excluding China have been lower than in Sub-Saharan Africa for more than a decade now, underpinning the ambition of the authorities in the region to sustain the reforms needed to support robust and inclusive economic expansion.
Underlying the diversity of the region, moreover, there are countries with both robust growth and countries with moderate contractions in 2009 (Figure 3). By contrast, all countries in South Asia experienced positive growth. At the other extreme, all of Latin America’s countries contracted in 2009, and only Poland among the 27 EU members grew.
Unbeknownst to many, private consumption made a signifi cant contribution to China’s economic growth in 2009, or 2.8 percentage points to be exact. In fact, for well over a decade, the contribution of private consumption to growth has been the highest in the region and far higher than in the U.S. (Figure 5). Such a high contribution has been made possible by the productive capacity resulting from massive fi xed investment and rapid export growth. Government plans to rebalance the economy foresee a larger role for the service sector, and along with it a boost to rural incomes. As a result of such rebalancing, private consumption will likely contribute more to growth in the future.
Table 1. The region has emerged in better shape from this global crisis than from the 1997-98 Asian fi nancial crisis
After the 1997-98 Asian financial crisis After this global crisisThe global economy … … grew 3.6 percent in 1999 and 4.8 percent in 2000 … contracted 2.2 percent in 2009, projected to
expand 2.7-3.2 percent in 2010-11Real GDP in developing East Asia excluding China …
… contracted 8 percent in 1998 … contracted 0.6 percent in the first half of 2009 before recovering to growth of 1.3 percent in 2009 as a whole
The real GDP of East Asia’s MICs …*/
… took almost four years to recover to pre-crisis levels (third quarter of 2001)
… took one year to return to pre-crisis levels (until end-2009)
China’s real GDP… … slowed to 7.8 percent in 1998 from 11 percent on average during 1990-96
… slowed to 8.7 percent in 2009 from 10 percent on average during 2000-2007
Exports… … contracted 5.3 percent in 1998, rose 21 percent in 2000
… contracted 24 percent y-y in first half of 2009, rose 4.8 percent y-y in the last quarter of 2009
Current accounts … … shifted from deficit to surplus, with the largest swing in Thailand (8 percent of GDP deficit in 1997 to a 6 percent surplus in1998)
… surpluses narrowed from 8.7 percent on average in 2007 to 6.4 percent in 2009
Real exchange rates … … were 20 percent depreciated in late 2000 relative to early 1997
… depreciated 3.5 percent y-y in late 2008, but recovered to pre-crisis levels by the end of 2009
Fiscal defi cits … … widened sharply to 6.3 percent of GDP in 1999 from near balance in early 1997
… rose moderately by 2.7 percent of GDP on average by 2009 from 1.1 percent GDP in 2007
Public debt… .. almost doubled to 39 percent of GDP by end-2000 from end-1997
… increased modestly to 41 percent of GDP by the end of 2009 from 38 percent at end-2007
Non-performing loans… … peaked at 28 percent of total loans in 1998, with 45 percent in Thailand and 49 percent in Indonesia
… remained little changed at about 3 percent during 2009
Sources: GEP, national authorities, IMF WEO 2009, and Bank staff estimates and projections. */ The East Asia’s MICs here refer to Indonesia, Malaysia, Philippines, and Thailand.
Table 2. Thanks to China, developing East Asia remained the fastest growing developing region(Percent change y-y)
2007 2008 2009Developing East Asia 11.4 8.5 7.0
Dev. East Asia excl. China 6.2 4.7 1.3Europe and Central Asia 7.1 4.3 -6.2Latin America and Caribbean 5.5 3.9 -2.6Middle East and North Africa 5.3 5.8 2.9South Asia 8.5 5.7 5.7Sub-Saharan Africa 6.5 4.9 1.1High income countries 2.6 0.4 -3.3
Sources: World Bank Global Economic Prospects 2010 and Bank staff estimates and projections.
I. THE RECOVERY 5
EMERGING STRONGER FROM THE CRISIS

INDUSTRIAL PRODUCTION IS RECOVERING SHARPLY
Driven by inventory restocking, a pickup in domestic demand and rising exports, industrial production has been on the rebound across developing East Asia. China led again, with production up nearly 16 percent in the fourth quarter, more than twice as fast as in the rest of the region on average. Thanks to this swift recovery, industrial production for most countries is at or above pre-crisis peaks (Figure 6). While levels of production in Malaysia and Philippines are modestly below pre-crisis levels, the large service sectors in these countries helped absorb substantial part of the redundant labor and new entrants, enabling a faster recovery in real GDP. As an indication of the pace of fi nal domestic demand, automobile sales in China, Korea, Thailand and Philippines increased by more than 20 percent year-on-year in late 2009, reaching record highs. China’s market, moreover, became the largest in the world in 2009, overtaking the U.S., even though automobile ownership in China is still rather modest (Figure 7).
CAPACITY UTILIZATION IN INDUSTRY AND UNEMPLOYMENT ARE ALSO REACHING PRE-CRISIS LEVELS
Capacity utilization has also risen rapidly in line with production. In Philippines and Korea, capacity utilization has reached pre-crisis levels (Figure 8). In Thailand, capacity utilization is tracking the recovery of important sectors such as vehicles, electronic and chemical products. Overall, capacity utilization in the region is recovering faster than employment, suggesting a stronger productivity growth during the recovery (Figure 9).
Figure 5. Consumer society: private consumption has contributed more to growth in China than in the other middle-income countries of East Asia and the U.S.(in percentage points)
Sources: CEIC and World Bank staff calculations.*/ EAP-4 includes Indonesia, Malaysia, Philippines and Thailand.
Figure 4. Exports, inventory restocking and private consumption were the main drivers of growth in the fourth quarter 2009
(contribution in percentage points, seasonally adjusted)
Sources: CEIC and World Bank staff calculations.
Figure 3. Diverse but better on average: real GDP for developing East Asia and selected countries, 2009(percent change year-on-year; East Asia in blue)
Sources: World Development Indicators and World Bank staff calculations.
-9 -8 -7 -6 -5 -4 -3 -2 -1 0 1 2 3 4 5 6 7 8 9
ChinaTimor Leste
LebanonIndia
BangladeshUzbekistan
VietnamNepal
MoroccoEgypt, Arab Rep. of
IndonesiaPapua New GuineaYemen, Republic of
Sri LankaTunisiaJordan
PakistanBoliviaAlgeriaPoland
Iran, Islamic Rep. ofPhilippines
Korea, Rep. ofBrazil
ColombiaGuatemala
KazakhstanNorway
MongoliaMalaysia
ChileCambodia
Taiwan, ChinaEl Salvador
FranceEcuador
ArgentinaSingapore
ThailandUnited States
HondurasFiji
Hong Kong, ChinaSpain
United KingdomSlovakia
ItalySweden
GermanyJapan
DenmarkRussian Federation
HungaryBulgariaMexicoFinland
RomaniaTurkey
6
WORLD BANK EAST ASIA AND PACIFIC ECONOMIC UPDATE 2010, VOL. I
I. THE RECOVERY

EXPORTS ARE YET TO RECOVER FULLY IN THE REGION’S MIDDLE-INCOME COUNTRIES
Export volumes have surged since early 2009 and have fully recovered to pre-crisis levels in China and Indonesia. In Malaysia and Philippines, on the other hand, export values are still 10 percent below the pre-crisis peak reached in July 2008, with a substantial part of the shortfall due to lower prices for electronics components (Figure 10).
The initial rebound in exports from the bottom reached in early 2009 was due to a substantial degree to China. As demand in OECD countries began to recover after the middle of 2009, and demand within the region began rising robustly, the forces boosting regional exports shifted. For the year as a whole, the export recovery in China was driven mostly by demand outside East Asia, while the recovery among the NIEs was mostly due to China and other East Asian countries. For the remaining large middle-income countries in the region (Indonesia, Malaysia, Thailand and Philippines) regional demand was the primary driver, although part of the ultimate demand is in developed countries (Figure 11). This sequencing of recovery suggests that production networks played a key role during the rebound much as they did during the downturn (Figure 15). In China, for example, processing exports have risen faster than non-processing from the trough (Figure 12).
Figure 7. Going mobile: China overtakes the U.S. in car production and sale(Imports and production in millions on the left scale; cars per 1,000 on the right scale)
Sources: U.S. census, Chinese statistics authorities.
Figure 6. Industrial production has mostly recovered inEast Asia */(January 2010, in percent from pre-crisis peak)
Sources: CEIC and World Bank staff calculations.*/ Numbers in brackets denote quarters from pre-crisis peak.
Figure 9. Unemployment is still modestly higher than beforethe crisis(in percent, annual average)
Sources: Datastream and World Bank staff calculations.
Figure 8. Capacity utilization is rising to pre-crisis levels */
(in percent)
Sources: Datastream and World Bank staff calculations. */Purple bars denote the level of capacity utilization in the fourth quarter. The blue bars measure that level to the pre-crisis peak.
I. THE RECOVERY 7
EMERGING STRONGER FROM THE CRISIS

Figure 10. Exports have recovered in China and Indonesia,but are trailing in the other middle-income countries in developing East Asia(in U.S. dollar terms, February 2010 compared with peak in July 2008=100)
Sources: CEIC and World Bank staff calculations.
Figure 11. Different horses: the G-3’s direct pull is best seen in China’s exports */
(contribution to the change in exports from February 2009 to December 2009)
Sources: CEIC, Haver, and Bank staff. */ SE Asia 4 includes the Philippines, Thailand, Malaysia and Indonesia, G-3 includes the U.S., the EU and Japan.
Figure 12. China’s processing exports rebounded faster after falling more steeply(in percent change, year-on-year, constant prices)
Sources: Datastream, CEIC, and World Bank staff calculations.
Figure 13. On the rise again: China’s trade balance is growing after contracting sharply in early 2009(In billions of U.S. dollars)
Sources: Datastream, CEIC, and World Bank staff calculations.
Figure 14. The region’s share in global exports has climbed further
(In percent of total)
Source: World Bank Global Development Indicators.
Figure 15. Electronics exports have led the recovery
(Jul 2008=100)
Sources: CEIC, Haver, and World Bank staff.
8
WORLD BANK EAST ASIA AND PACIFIC ECONOMIC UPDATE 2010, VOL. I
I. THE RECOVERY
Led by China, developing East Asia managed to outperform the rest of the world. Although China’s exports in 2009 contracted, China overtook Germany as the world’s leading exporter. The region, moreover, continued to gain global market share, as the share of advanced economies fell (Figure 14).
CAPITAL INFLOWS RECOVERED IN CHINA BUT NOT IN THE OTHER MIDDLE-INCOME COUNTRIES
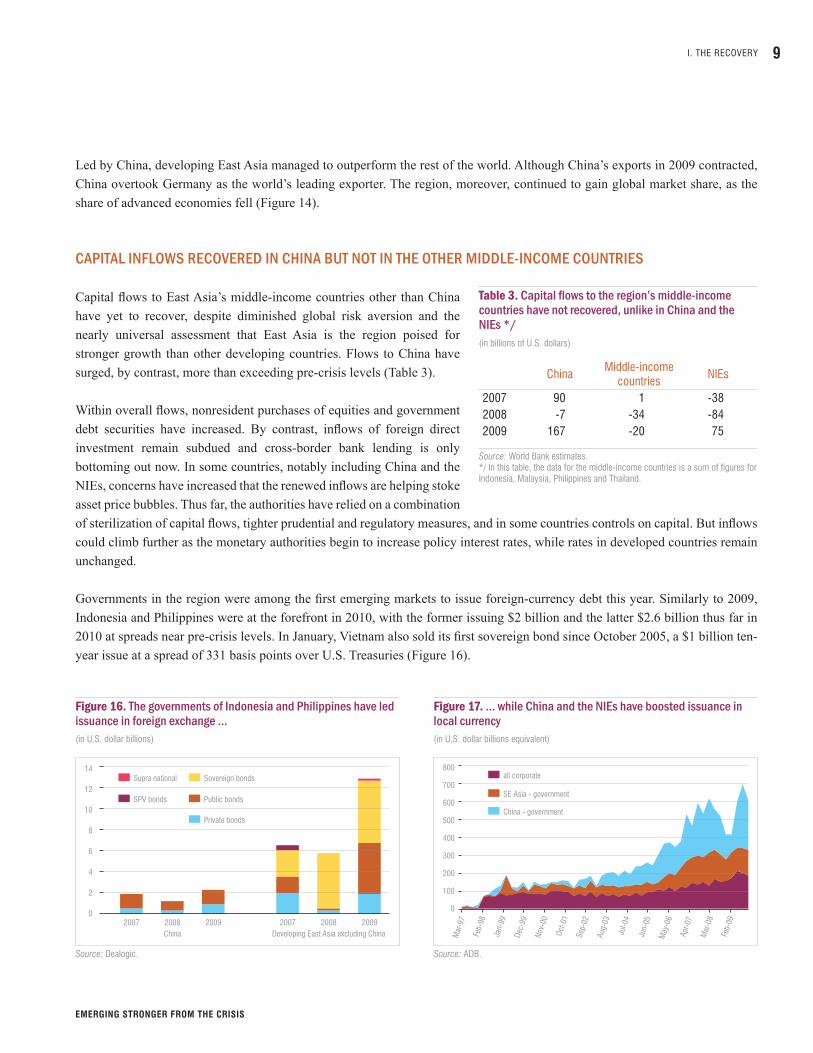
Capital fl ows to East Asia’s middle-income countries other than China have yet to recover, despite diminished global risk aversion and the nearly universal assessment that East Asia is the region poised for stronger growth than other developing countries. Flows to China have surged, by contrast, more than exceeding pre-crisis levels (Table 3).
Within overall fl ows, nonresident purchases of equities and government debt securities have increased. By contrast, infl ows of foreign direct investment remain subdued and cross-border bank lending is only bottoming out now. In some countries, notably including China and the NIEs, concerns have increased that the renewed infl ows are helping stoke asset price bubbles. Thus far, the authorities have relied on a combination of sterilization of capital fl ows, tighter prudential and regulatory measures, and in some countries controls on capital. But infl ows could climb further as the monetary authorities begin to increase policy interest rates, while rates in developed countries remain unchanged.
Governments in the region were among the fi rst emerging markets to issue foreign-currency debt this year. Similarly to 2009, Indonesia and Philippines were at the forefront in 2010, with the former issuing $2 billion and the latter $2.6 billion thus far in 2010 at spreads near pre-crisis levels. In January, Vietnam also sold its fi rst sovereign bond since October 2005, a $1 billion ten-year issue at a spread of 331 basis points over U.S. Treasuries (Figure 16).
Table 3. Capital fl ows to the region’s middle-income countries have not recovered, unlike in China and the NIEs */(in billions of U.S. dollars)
ChinaMiddle-income
countriesNIEs
2007 90 1 -382008 -7 -34 -842009 167 -20 75
Source: World Bank estimates.*/ In this table, the data for the middle-income countries is a sum of figures for Indonesia, Malaysia, Philippines and Thailand.
Figure 17. … while China and the NIEs have boosted issuance in local currency(in U.S. dollar billions equivalent)
Source: ADB.
Figure 16. The governments of Indonesia and Philippines have led issuance in foreign exchange …(in U.S. dollar billions)
Source: Dealogic.
I. THE RECOVERY 9
EMERGING STRONGER FROM THE CRISIS
China has led on local currency issuance. Last year, Chinese governments at all levels raised the equivalent of $114 billion more in local currency bonds than in 2007, the previous peak year (Figure 17).
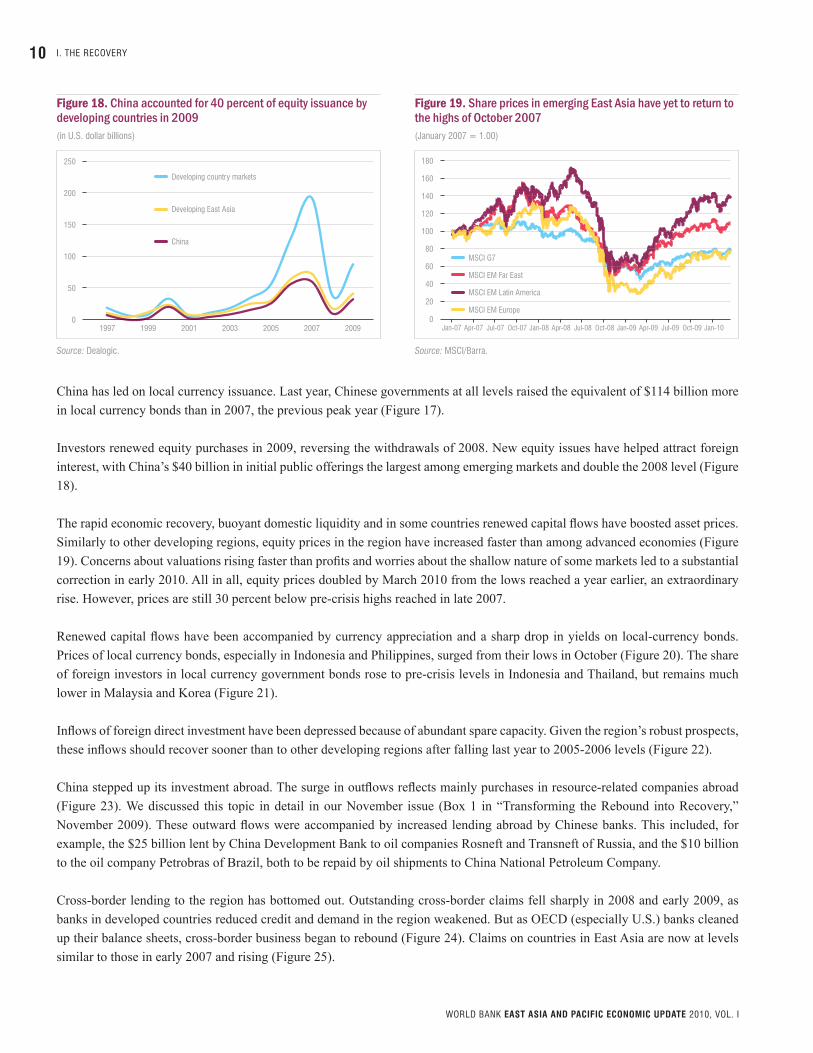
Investors renewed equity purchases in 2009, reversing the withdrawals of 2008. New equity issues have helped attract foreign interest, with China’s $40 billion in initial public offerings the largest among emerging markets and double the 2008 level (Figure 18).
The rapid economic recovery, buoyant domestic liquidity and in some countries renewed capital fl ows have boosted asset prices. Similarly to other developing regions, equity prices in the region have increased faster than among advanced economies (Figure 19). Concerns about valuations rising faster than profi ts and worries about the shallow nature of some markets led to a substantial correction in early 2010. All in all, equity prices doubled by March 2010 from the lows reached a year earlier, an extraordinary rise. However, prices are still 30 percent below pre-crisis highs reached in late 2007.
Renewed capital fl ows have been accompanied by currency appreciation and a sharp drop in yields on local-currency bonds. Prices of local currency bonds, especially in Indonesia and Philippines, surged from their lows in October (Figure 20). The share of foreign investors in local currency government bonds rose to pre-crisis levels in Indonesia and Thailand, but remains much lower in Malaysia and Korea (Figure 21).
Infl ows of foreign direct investment have been depressed because of abundant spare capacity. Given the region’s robust prospects, these infl ows should recover sooner than to other developing regions after falling last year to 2005-2006 levels (Figure 22).
China stepped up its investment abroad. The surge in outfl ows refl ects mainly purchases in resource-related companies abroad (Figure 23). We discussed this topic in detail in our November issue (Box 1 in “Transforming the Rebound into Recovery,” November 2009). These outward fl ows were accompanied by increased lending abroad by Chinese banks. This included, for example, the $25 billion lent by China Development Bank to oil companies Rosneft and Transneft of Russia, and the $10 billion to the oil company Petrobras of Brazil, both to be repaid by oil shipments to China National Petroleum Company.
Cross-border lending to the region has bottomed out. Outstanding cross-border claims fell sharply in 2008 and early 2009, as banks in developed countries reduced credit and demand in the region weakened. But as OECD (especially U.S.) banks cleaned up their balance sheets, cross-border business began to rebound (Figure 24). Claims on countries in East Asia are now at levels similar to those in early 2007 and rising (Figure 25).
Figure 18. China accounted for 40 percent of equity issuance by developing countries in 2009(in U.S. dollar billions)
Source: Dealogic.
Figure 19. Share prices in emerging East Asia have yet to return to the highs of October 2007(January 2007 = 1.00)
Source: MSCI/Barra.
10
WORLD BANK EAST ASIA AND PACIFIC ECONOMIC UPDATE 2010, VOL. I
I. THE RECOVERY

Figure 20. Returns on bonds perceived to be the riskiest have risen most sharply …(returns index, December 2000 = 100)
Source: HSBC.
Figure 21. … accompanied by a growing share of nonresident holdings of government securities issued in local currency(in percent of local currency government bonds outstanding)
Source: ADB.
Figure 22. Infl ows of foreign direct investment remain below the pre-crisis peaks(in billions of U.S. dollars)
Source: Haver Analytics.
Figure 23. And only China has stepped up foreign direct investment abroad(in U.S. dollar billions)
Source: Haver Analytics.
Figure 24. Banks in developed economies are beginning to lend abroad again …(Consolidated foreign claims, in trillions of U.S. dollars)
Source: BIS.
Figure 25. … and cross-border lending to Asia has bottomed out
(in billions of U.S. dollars)
Source: BIS.
I. THE RECOVERY 11
EMERGING STRONGER FROM THE CRISIS

THE CRISIS SLOWED THE PACE OF POVERTY REDUCTION IN DEVELOPING EAST ASIA
The crisis slowed the pace of poverty reduction in the region. The dearth of high frequency disaggregated data on private consumption and incomes makes a comprehensive assessment diffi cult – and also constrains the effectiveness of the policy response. But simulations with aggregate level data suggest that as many as 14 million more people will be in poverty in 2010 as a result of the crisis. In Philippines, for example, a country that appears to have experienced an increase in reported poverty during a period of economic growth earlier this decade, the crisis is estimated to have increased the poverty rate by as much as 2 percentage points. However, polls conducted by Social Weather Stations, a non-profi t social research institution, indicate that optimism about the direction of the economy had generally increased in the country by the end of 2009.
Modestly higher numbers on unemployment often capture the headlines, but they present a very incomplete picture of the impact of the crisis. In some countries, changes in employment patterns suggest substantial movements out of occupations with relative high wages to ones with lower wages. In Cambodia, job losses in the higher paying manufacturing, construction, and tourism companies led people to seek work in the lower paying agricultural sector (including as subsistence farmers). In Malaysia, the loss of manufacturing jobs early in the year led to job increases in retail trade and public services, where wage rates are lower. Those suffering most are unskilled laborers that typically toil in the informal market or are engaged in subsistence agriculture. The
Figure 28. In China, only half of those who lost a job in the off-farm rural sector after September 2008 found a new one …(in percent)
Source: Huang et al. 2010.
Figure 29. … most of those that could not fi nd an off-farm job moved to farming(in percent)
Source: Huang et al. 2010.
Figure 26. In Cambodia, hourly wages fell sharply …(in Cambodian Rials per hour)
Sources: CSES and staff calculations.
Figure 27. … as did off-farm rural wages in China(in RMB per month)
Source: Jikun Huang et al. 2010, “Impact of Global Financial Crisis on Off Farm Employment and Earnings in Rural China,” prepared for the World Bank.
12
WORLD BANK EAST ASIA AND PACIFIC ECONOMIC UPDATE 2010, VOL. I
I. THE RECOVERY
crisis did not leave them idle, but with the ranks of the informally employed swelled by some of those that lost jobs in the formal sector, their earnings fell substantially. For those that remained employed in export-oriented industries, the drop in exports meant a combination of a sharply reduced wage or hours of work. In Cambodia, for example, low-wage garment- and construction-sector workers were particularly hard hit by the slowdown. Those who retained their jobs in these sectors saw their hourly wage rates cut by as much as one-third (Figure 26).
But even with reduced wages, workers who retained their jobs fared much better than those who returned to their villages and joined extended families that had little additional work to offer. In China, the infl ux of migrants that returned home is reported to have depressed off-farm wages by nearly a fi fth (Figure 27). Even at the lower wage rates, only half of those who lost jobs in the off-farm rural sector found a job; of the rest, most moved into subsistence farming (Figure 28 and Figure 29).
I. THE RECOVERY 13
EMERGING STRONGER FROM THE CRISIS

II. THE SHORT-TERM CHALLENGE: WITHDRAWING THE STIMULUS WITHOUT DISRUPTING THE RECOVERY
PREMATURE WITHDRAWAL OF FISCAL STIMULUS REMAINS A BIG RISK
Fiscal easing helped limit the slowdown in economic growth across East Asia and the Pacifi c. Largely thanks to fi scal stimulus measures that averaged 2 percent of GDP in 2009, and supported by monetary and quasi-fi scal easing, output growth weakened by much less in the region than in other developing regions or advanced economies (Figure 30). Most countries in East Asia had the fi scal space to implement fi scal stimulus measures for the fi rst time in decades. In some countries, moreover, the government stimulus was much larger than implied by headline fi scal numbers for the central government. In China, for example, the increase in the fi scal defi cit was limited to 1.8 percent of GDP in 2009. But that modest rise in the defi cit was accompanied by a surge in government-led investment by as much as 6 percent of GDP and a jump in bank lending – much of it to fi nance government-led projects – by about 30 percent of GDP. Most of the stimulus in China, as a result, was quasi-fi scal.
Fiscal defi cits and government debt rose by much less than in other regions despite the fi scal stimulus measures. This outcome refl ected the smaller deterioration in growth and the modest role of automatic stabilizers in the region. The median fi scal defi cit in developing East Asia and Korea rose by about 2.7 percent of GDP in 2009 relative to 2007, or only half as much as in Europe and Central Asia and just one-fourth of the increase among advanced economies (Figure 31). And debt levels have risen much more modestly than in the rest of the world, in stark comparisons to most developed countries where government debt will exceed 100 percent of GDP by 2014.1
In most countries, it is still premature to withdraw the fi scal stimulus because of spare capacity and ample fi scal space. The authorities in the region need to reassess the fi scal policy stance later in the year in light of global developments, and the availability of fi scal space. Governments may be inclined toward sustaining their expansionary fi scal stance for an extended
1 With the exception of Canada and Germany, based on remarks by John Lipsky, First Deputy Managing Director of the IMF, to the China Development Forum, March 2010, http://www.imf.org/external/np/speeches/2010/032110.htm.
Figure 30. Fiscal stimulus in the region compared well with other countries (in percent of GDP)
Sources: National authorities and staff estimates.
Figure 31. Fiscal defi cits have risen due to fi scal stimulus packages and weaker economic activity (in percent of GDP)
Sources: National authorities and Bank staff projections.Note: ECA = Europe and Central Asia; EAP= East Asia and Pacific; G20 (dev) includes only the developed G20 economies.
14
WORLD BANK EAST ASIA AND PACIFIC ECONOMIC UPDATE 2010, VOL. I
II. THE SHORT-TERM CHALLENGE: WITHDRAWING THE STIMULUS WITHOUT DISRUPTING THE RECOVERY

period to return to pre-crisis growth rates in the short term. But this would be a mistake, as pre-crisis growth rates were artifi cially buoyed by the fi nancial bubble in advanced economies. Comparing levels of real GDP based on output growth through 2007 with another through 2010 results in a gap of as much as 10 percent by 2015. Using fi scal policy to bridge the gap will lead to overheating (Figure 33). The “old normal” is no more – and fi scal policy needs to adjust to the changed circumstances.
China and Vietnam offer important lessons for other countries on the challenges of managing fi scal stimulus as recovery picks up. Because credit was the principal avenue for the stimulus efforts in China, government debt barely changed relative to GDP. Even though China’s resources are such that large fi scal and quasi-fi scal stimulus may be maintained for much longer, the authorities are mindful that the rapid credit expansion needs to be curbed to limit risks of asset price bubbles and overheating. The government, as a result, is limiting additional stimulus and projecting real GDP growth of 8 percent in 2010, well-below consensus projections and the World Bank’s 9.5 percent forecast in an effort to allow more room for potential withdrawal of stimulus. In Vietnam, the fi scal defi cit reached almost 10 percent of GDP in 2009 including off-budget spending, the highest in the region. The authorities have switched gear from stimulating domestic demand to preventing overheating and have terminated several components of the fi scal stimulus, including the interest rate subsidy. To ensure debt sustainability, the government plans to reduce the defi cit to 6.2 percent of GDP in 2010, and further to 3-4 percent over the medium-term.
MOST CENTRAL BANKS HAVE BEGUN TO SELECTIVELY TIGHTEN MONETARY POLICY
Signs of rising infl ation after months of tranquility and robust economic recovery have led the monetary authorities in most countries in East Asia to begin tightening monetary policy. Countries in the region have advanced substantially the removal of measures providing liquidity support in local and foreign currencies. China and Indonesia are midway on the road toward returning reserve requirements to pre-crisis levels. Central banks are also set to scale back the types of collateral eligible for accessing central bank facilities. Malaysia and Vietnam led the region with raising policy interest rates, following on hikes in Australia, Norway, and of late India.
All eyes are on China’s monetary policy. Policy actions have been diverse so far and followed exceptionally strong credit growth last year that boosted the stock of domestic credit to the highest levels in the region of about 140 percent of GDP. China’s central bank increased reserve requirements twice this year and is implementing a smaller quota level for bank lending aimed at slowing credit growth to 18 percent this year from 30 percent in 2009. The authorities have also increased down-payment requirements
Figure 33. Do you want to bridge it? The crisis is projected to reduce output by as much as 10 percent relative to a hypothetical trend based on data through 2007(Index, developing East Asia excl. China, 2000=100)
Source: World Bank staff calculations.
Figure 32. Government debt burdens have remained moderate in most developing East Asian countries and risen by less than in advanced economies(in percent of GDP)
Sources: National sources, European Commission, and World Bank staff projections.
II. THE SHORT-TERM CHALLENGE: WITHDRAWING THE STIMULUS WITHOUT DISRUPTING THE RECOVERY 15
EMERGING STRONGER FROM THE CRISIS

for second and third homes. Most importantly, market participants are now all but certain of an imminent increase in policy rates to help limit infl ation pressures. All in all, tighter monetary conditions are helping slow credit growth to its pre-crisis pace, as measures in seasonally adjusted terms (Figure 34).
Other countries are proceeding at a different pace. The authorities in Vietnam abolished an interest rate subsidy that was key to last year’s strong credit growth, and hiked the main policy rate by 100 basis points to 8 percent amid rapidly rising infl ation. These measures have been accompanied by efforts to boost dollar liquidity in the market, including two devaluations of the currency, a cap on dollar deposit rates and a sharp cut in dollar reserve requirements. Malaysia’s central bank also increased its key policy rate in March. The hike of 25 basis points still leaves rates well-below pre-crisis levels, however, and few market participants expect more rapid normalization. In Philippines, the central bank signaled a clear exit strategy in January, starting by bringing its rediscount rate in line with the main overnight policy rate.
Capital infl ows and loose credit conditions have boosted sales and prices of real estate across the region, especially in China, in the NIEs, and in Vietnam. With loans for property development up by a third in 2009 and mortgage loans up by nearly half, sales of residential property recovered sharply in China (Figure 35). Residential property prices are rising rapidly, marking an increase of 16 percent in 2009.
EXCHANGE MARKET INTERVENTION AND CURRENCY APPRECIATION HAVE RETURNED
Robust optimism among domestic and foreign investors, and China’s continued de facto peg to the dollar, has led most authorities in the region to engage in large exchange market intervention to limit currency appreciation (Figure 36). Exchange rates in Indonesia, Thailand, Malaysia and Philippines have all recovered to their pre-crisis levels. With rising infl ation and asset prices, and continued strong economic growth, the real exchange rate in China is likely to appreciate. The choice is whether this occurs through higher infl ation, or through a rise in the currency to help moderate infl ation. In Korea and Vietnam,
Figure 34. Credit growth has started to slow this year in China
(percent change year-on-year)
Source: Prepared by Xu Gao from CEIC data.
Figure 35. Sales of residential property have recovered steeplyin China(in millions of square meters)
Source: CEIC.
Figure 36. Large capital infl ows helped currencies strengthen despite exchange market intervention(percent change during 2009)
Source: CEIC.
16
WORLD BANK EAST ASIA AND PACIFIC ECONOMIC UPDATE 2010, VOL. I
II. THE SHORT-TERM CHALLENGE: WITHDRAWING THE STIMULUS WITHOUT DISRUPTING THE RECOVERY

by contrast, exchange rates are weaker than before the crisis. In Korea, this refl ects large exchange market intervention, combined with monetary accommodation that has kept the main policy rate the lowest levels in the region. In Vietnam, by contrast, investor concerns about the level of reserves – that dipped below 3 months’ import cover – kept the exchange rate at the bottom of the band around the dong’s peg to dollar and was one of the many factors that prompted two devaluations of the dong in November last year (by 5 percent) and in January 2010 (by 3.3 percent).
II. THE SHORT-TERM CHALLENGE: WITHDRAWING THE STIMULUS WITHOUT DISRUPTING THE RECOVERY 17
EMERGING STRONGER FROM THE CRISIS

III. THE IMPERATIVE FOR RENEWED STRUCTURAL REFORMS
Recovery in demand abroad and rapid rebound in consumer spending and sustained fi scal stimulus at home should help boost economic growth in developing East Asia in 2010. We are raising our projection for real GDP growth in the region to 8.7 percent, or by almost a percentage point above our November 2009 forecast (“Transforming the Rebound into Recovery” issued on November 7, 2009) (Table 4).
This upward revision contrasts with a modest downward revision for the G-3 that refl ects a cut in our projection for the EU. Forecasts for the EU have been revised down, as fi scal constraints have limited the ability of governments to boost activity. The EU aside, we are raising our projections for the U.S. and Japan as a result of markedly stronger-than-expected recovery in late 2009 and thus far in 2010. But the strength of the recovery is likely to wane during 2010 as the effects of the fi scal stimulus and the inventory cycles wear off. All in all, real GDP growth in the G-3 is projected to moderate to 1.7-2.0 percent this year and in 2011.
East Asia’s recovery should be supported by robust capital infl ows. Global capital fl ows rebounded in the second half of 2009 amid reduced uncertainty and diminished risk aversion. Even so, net private fl ows to developing economies amounted to about $450 billion annualized in the second half of 2009, down from the $1,200 billion peak in 2007. The World Bank projects global fl ows to be limited to $700-800 billion this year and next, as global banks continue to raise capital to deal with losses and as excess capacity curbs foreign direct investment.
East Asia is poised to receive a larger share of the projected increase in global capital fl ows. East Asia received a fourth of global private capital fl ows in 2007 compared with nearly half for Europe and Central Asia. The fl ows to the latter, however, refl ected to a substantial extent a surge in consumption-related spending that was not sustainable and is unlikely to be repeated any time soon. Capital fl ows to East Asia will be supported by expectations of robust growth based on solid fundamentals and prudent policies that are likely to be adjusted with more agility to the changed circumstances of the global economy than in other developing regions (see below for discussion). Concerns about asset bubbles may result in efforts to curb infl ows, keeping overall magnitudes broadly similar to the year before the crisis (Figure 37).
Table 4. Prospects for East Asia and the Pacifi c are bright
(Percent change y-y unless indicated otherwise)
Forecasts for 2009Dec’08 Apr’09 Nov’09
2008 2009 2010f 2011f 2009 2009 2009
Developing East Asia 8.5 7.0 8.7 8.0 6.7 5.3 6.7China 9.6 8.7 9.5 8.7 7.5 6.5 8.4Indonesia 6.1 4.5 5.6 6.2 4.4 3.4 4.3Malaysia 4.6 -1.7 5.7 5.3 3.7 -1.0 -2.3Philippines 3.8 0.9 3.5 3.8 3.0 1.9 1.4Thailand 2.6 -2.3 6.2 4.0 3.6 -2.7 -2.7Vietnam 6.2 5.3 6.5 6.5 6.5 5.5 5.5Cambodia 6.7 -2.0 4.4 6.0 4.9 -1.0 -2.2Lao PDR 7.5 6.7 7.7 7.8 6.0 5.0 6.4Timor-Leste 12.8 7.4 7.5 7.4 1.4 1.0 7.4Mongolia 8.9 -1.6 7.3 7.1 7.5 2.7 0.5Fiji -0.1 -2.5 2.0 2.2 1.1 2.4 -0.3Papua New Guinea 6.7 4.5 8.0 5.5 5.0 4.7 3.9
Memoranda:Developing East Asia
Middle-income countries 8.6 7.2 8.7 8.0 6.8 5.4 6.9Low-income countries 6.3 4.3 6.4 6.4 6.1 4.7 4.5
Excluding ChinaDeveloping East Asia 4.7 1.3 5.5 5.2 4.1 1.1 1.1Middle-income countries 4.5 0.9 5.4 5.1 3.8 0.7 0.7
G-3 0.3 -3.5 1.7 2.0 -0.4 -3.1 -3.5Global trade volumes 3.0 -14.4 4.3 5.3 -2.1 -6.0 -11.4
Sources: Datastream; World Bank Global Development Prospects; and staff estimates and projections. f=forecast
18
WORLD BANK EAST ASIA AND PACIFIC ECONOMIC UPDATE 2010, VOL. I
III. THE IMPERATIVE FOR RENEWED STRUCTURAL REFORMS

IT’S A NEW WORLD
East Asia will face a different global economy over the medium term. The “new normal” is likely to be characterized by slower growth in developed countries, tighter global fi nancial conditions, rising concerns about developed countries’ debt levels, and a more diffi cult environment for free trade. Growth in developed countries will be slower than observed before the crisis, as banks, companies and households continue to deleverage, and employment and housing prices remain well below the peak of recent years. Under these circumstances, output should remain below potential through 2014 (Figure 38). Financial conditions should remain more constrained, as high-income countries introduce regulation to reduce excessive risk taking by fi nancial intermediaries, including through higher capital requirements and rules that limit bank size to address concerns about “too systemically important to fail.”
Large fi scal defi cits and rapidly increasing government debt will also weigh on developed countries’ growth prospects. The large and timely fi scal stimulus packages among the large developed economies helped mitigate the impact of the global fi nancial and economic crisis. But concerns are rising whether there will be suffi cient political will for fi scal consolidation over the medium term. Projections by the U.S. Congressional Budget Offi ce, for example, suggest that the U.S. fi scal defi cit will narrow to near 4 percent of GDP by 2014 under current plans before widening again through the end of the decade as age-related spending surges.2 Designing and implementing a credible medium-term fi scal framework that addresses these fi scal challenges in the U.S., Japan and other advanced economies will go a long way in helping support global activity in the longer term and reduce risks of another fi nancial crisis.
Despite a weaker global economy, East Asia still has the capability to grow strongly over the medium term. But this will not be easy to achieve and will not be automatic. Strong and inclusive growth will require renewed vigor in implementing key structural reforms in countries and at the regional level. And the country priorities for structural reforms are likely to
2 See www.cbo.gov.
Figure 38. Output in advanced economies is set to remain below potential through 2014(output gap in percent of GDP)
Sources: IMF and WEO database 2009.
Figure 37. East Asia is poised to receive a larger share of net private fl ows to developing countries(In trillions of U.S. dollars)
Sources: World Bank’s Development Prospects Group through 2008, the Institute of International Finance for 2009-2011 (Capital Flows, March 2010, www.iif.com).
Figure 39. East Asia is more diverse than other developing regions(standard deviations of land area and GDP per capita)
Source: World Development Indicators.
III. THE IMPERATIVE FOR RENEWED STRUCTURAL REFORMS 19
EMERGING STRONGER FROM THE CRISIS

be as diverse as country circumstances in the most diverse region in the world, whether measured by population, land area, per capita income and production (Figure 39). The next section identifi es the single biggest challenges facing the fi ve sub-groups of countries that comprise developing East Asia: China, which deserves a category of its own; the region’s middle-income countries; the low-income countries; the commodity producers and exporters; and the Pacifi c islands.
FOR CHINA, THE CHALLENGE WILL BE TO REBALANCE THE ECONOMY
China’s rapid capital-intensive, export-oriented growth has been spectacularly successful. But the global markets it relied on will be weaker in the near future. And for all its successes, the existing pattern of growth is energy- and natural resource- intensive, environmentally unsustainable, and does not create enough urban jobs. Supporting it has required ever higher corporate savings and sustained explicit and implicit government subsidies. Inequality has climbed to levels approaching those in Latin America. And lack of access to health, education or social support by the poor means that millions of migrants leave their children behind as they move to the coastal areas in search of work. The importance of addressing these challenges has been laid bare by the crisis and its aftermath of slower global expansion that are challenging some of the foundations of China’s current growth model.
The case for rebalancing has been made forcefully by the Chinese authorities and is the center-piece of the 11th fi ve-year plan. The crisis slowed progress on efforts to give larger weight to domestic sources of growth (Figure 40 and Figure 41). Nonetheless, key measures have been taken, including a boost to spending on health, education, and social insurance, improved access of small companies to fi nance, and efforts to mitigate environmental damage and upgrade energy effi ciency in the economy.
● Private consumption grew by 8 percent in 2009 after expanding 7.2 percent a year on average during 2000-08, the highest rate in the region.3 Private consumption contributed 3-4 percentage points to real GDP growth over the last decade, more than any
3 There were 21 countries in the world with higher growth rates of private consumption during the 2000s, including fragile states benefi tting from reconstruction, commodity-rich economies mainly in Sub-Saharan Africa, and several countries in Eastern Europe and Central Asia.
Figure 41. … and for services
(in percent of GDP, 2004-08)
Source: World Bank.
Figure 40. Rebalancing by allowing a larger role for private consumption ….(in percent of GDP)
Source: World Development Indicators.
20
WORLD BANK EAST ASIA AND PACIFIC ECONOMIC UPDATE 2010, VOL. I
III. THE IMPERATIVE FOR RENEWED STRUCTURAL REFORMS
other country in the region and all developed countries, although it expanded in most years at a pace slower than real GDP growth. Consumption is still held back by the much lower incomes received by rural households or rural migrants working in large cities but whose families remain in their home towns. Reforming the hukou, as planned by the government, should limit the unequal treatment received by different classes of citizens, facilitate greater employment opportunities, allow for better use of agglomeration economies, and help raise living standards. The effects of reforming healthcare, education and pensions will contribute to the same goal.
● The service sector holds huge potential for China, but lags behind countries with broadly similar income levels. Gradual reduction in tax and other incentives in favor of export-oriented manufacturing, allowing more domestic and foreign competition, and improving access to fi nance for small- and medium- enterprises – many of them potentially in the service sector – will help set the service sector on a robust expansion path. Even if China follows the pace of service sector development in Korea – the country with the lowest share of services in value-added among the OECD economies – real GDP could double over the next quarter century, compared with a scenario where the share of services is stagnant.
● China’s primary energy consumption rose by about 10 percent a year during 2000-2005, twice as fast as during the previous two decades, and its energy intensity doubled during that period. If recent energy consumption patterns continue without change, China’s energy consumption will surge to the equivalent of 87 percent of today’s world consumption by 2030.4 The profound implications of such developments led the authorities to set a target of reducing intensity by 20 percent by 2010. Whether this goal will be met in 2010 will become clear next year, but the authorities have moved forcefully to boost energy effi ciency and improve environmental sustainability. About a third of the investment-based stimulus package in China is for “green investments,” a share three times as large as in the U.S.5 Thanks to the investment stimulus, China doubled yet again in 2009 its installed wind power capacity, a pace three times as fast as the world as a whole. China now accounts for a third of global capacity, and is just behind the U.S. Installing new capacity has not only facilitated access to cleaner energy, but is turning Chinese producers into major global and regional exporters of wind power equipment.6
FOR EAST ASIA’S MIDDLE-INCOME COUNTRIES, MOVING UP THE VALUE CHAIN WILL REMAIN A PRIORITY
It is hard to overestimate the role dynamic manufacturing sectors have played in supporting economic growth in the region’s middle-income countries. For decades, the region has been the principal destination of large multinationals that invested in low value-added assembly production facilities, linking them in regional and global production networks (Box 1). As productivity surged, so did wages and living standards. But the region’s middle-income countries are fi nding that new efforts are needed to give economic development a fresh impetus. And with the emergence of China, and of late India, as favored investment locations, reliance on “high volume, low value-added” production that pays decent wages is under threat.
New policies are required to escape from the “crowded middle” of industrial development and break into knowledge- and skill-intensive sectors. Rising to the challenge will require that the region’s middle-income countries move up the value chain through increased sophistication of production. To achieve this, countries must invest more and with greater effi ciency in physical and human capital, foster substantially more innovative activity, and encourage entrepreneurship and risk taking. The spatial dimension
4 See the World Bank’s Midterm Evaluation of China’s 11th Five-year Plan, Chapter 4,www.worldbank.org.5 As referred in a speech by Achim Steiner, head of the UN Environment Program, http://www.unep.org/Documents.Multilingual/Default.asp?DocumentID=492&ArticleID=6258&
l=en.6 See the Global Energy Council, http://www.gwec.net. China’s capacity at the end of 2009 was as large as that in Germany and two-thirds of the level in the U.S.
III. THE IMPERATIVE FOR RENEWED STRUCTURAL REFORMS 21
EMERGING STRONGER FROM THE CRISIS

of moving from middle-income to high-income status should also not be neglected. Innovation is highly dependent on higher density of production, research and development. And more mobile labor, capital and fi nance will be critical to allow production structures to shift away from “sunset” industries and toward high income elasticity, skill- and knowledge-intensive sectors.
In most countries in the region, fi xed investment as a share of GDP over the last decade remained well-below the levels achieved before the 1997-98 Asian fi nancial crisis. The exceptions are China and Vietnam, where investment relative to GDP climbed rapidly and exceeded levels achieved earlier (Figure 42 and Figure 43). China and Vietnam apart, however, levels of fi xed investment in the region are markedly smaller than the levels achieved in Japan; Korea; Taiwan, China; and Singapore during their takeoff, even when adjusting for incomes per capita (Figure 44). Investment levels in Philippines and Malaysia, moreover, are even below those in today’s high-income Japan.
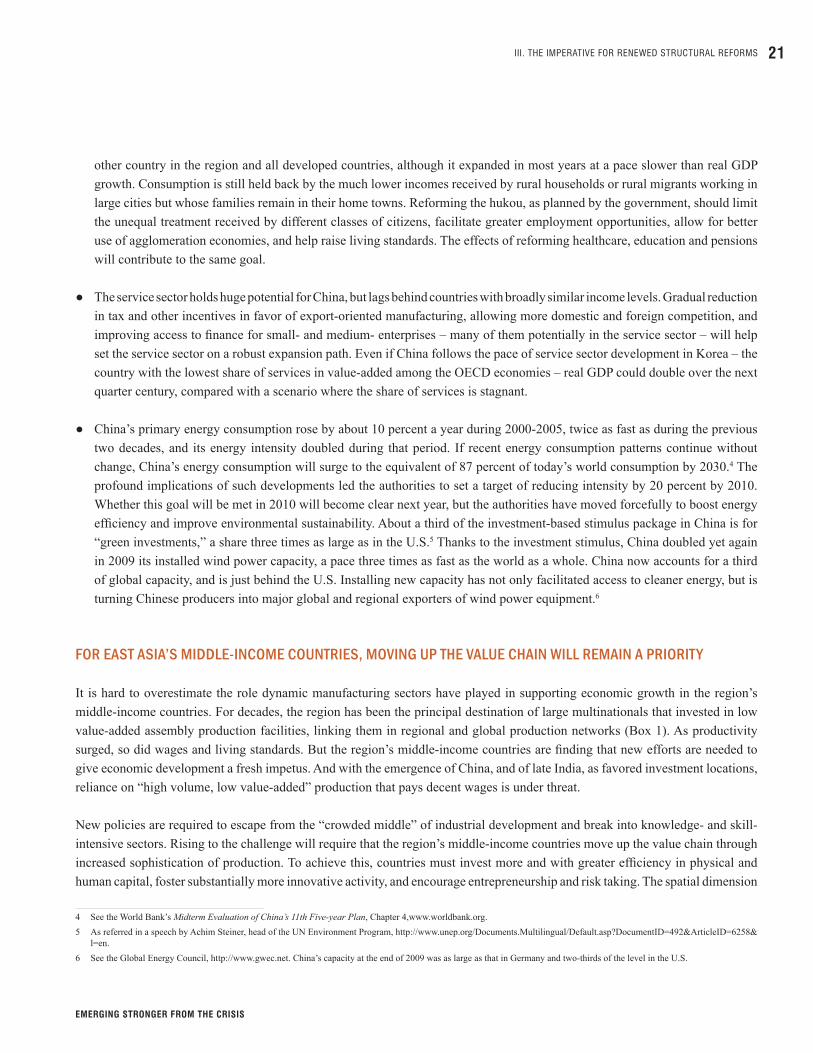
The shortfall of fi xed investment relative to the period before 1997-98 is due mainly to a sharp drop in residential and commercial real estate. There are additional factors as well. In Indonesia, energy-related investment by state-owned companies shrunk from 4 percent of GDP in 1997 to about ½ percent in 2006. The decline refl ected fi scal consolidation and limited fi scal space by the government to provide fi nancing, coupled with the limited capacity of the fi nancial sector to provide long-term fi nancing at competitive rates (Figure 45). Fiscal consolidation and a much more rigorous fi scal framework in Thailand has also been a factor constraining public investment in infrastructure.
Lower domestic saving and lower foreign investment are not the reasons behind reduced fi xed investment in most of East Asia after 1997-98. In almost all countries, domestic saving rates have either risen or remained broadly unchanged over the last
Figure 43. … but in some, there is a marked increase in the 2000s
(Investment as percent of GDP, average)
Sources: Datastream and World Bank staff calculations.
Figure 42. In most countries, investment has remained below levels achieved prior to 1997-98 …(Investment as percent of GDP, average)
Sources: Datastream and World Bank staff calculations.
Figure 44. Investment levels in most countries in the region are lower than in Japan and the NIEs in the past at similar income levels(in percent of GDP)
Sources: Datastream and World Bank staff calculations.
22
WORLD BANK EAST ASIA AND PACIFIC ECONOMIC UPDATE 2010, VOL. I
III. THE IMPERATIVE FOR RENEWED STRUCTURAL REFORMS
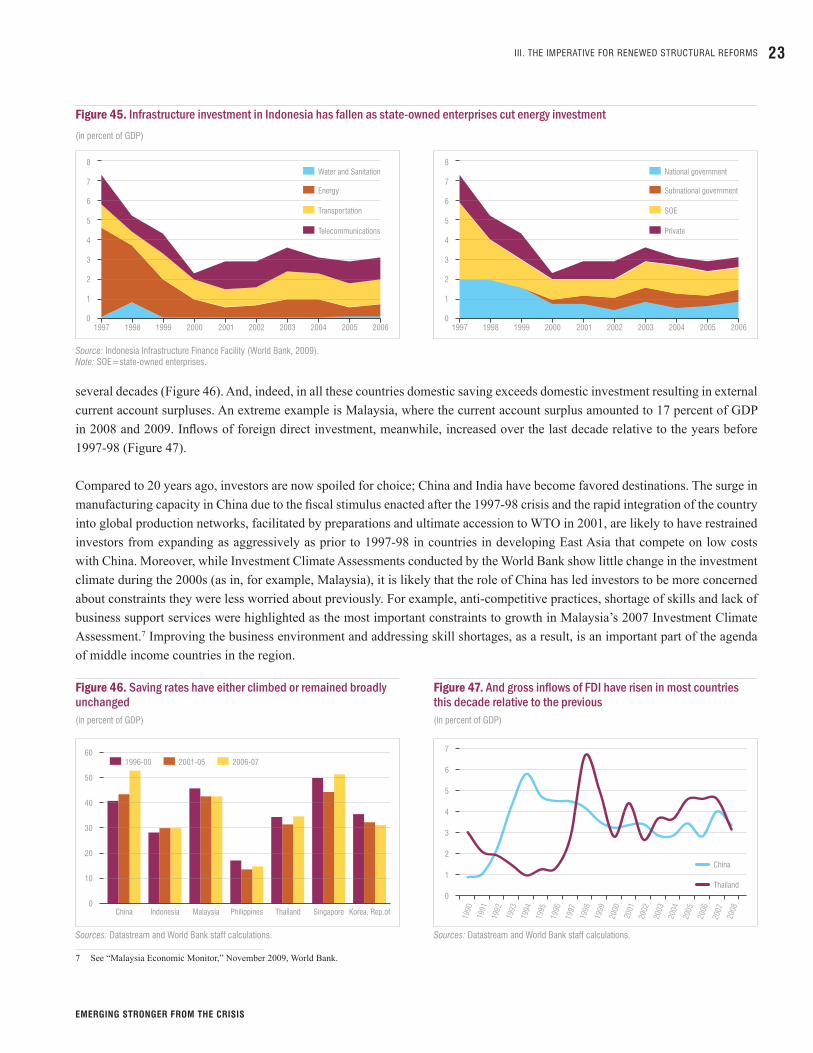
several decades (Figure 46). And, indeed, in all these countries domestic saving exceeds domestic investment resulting in external current account surpluses. An extreme example is Malaysia, where the current account surplus amounted to 17 percent of GDP in 2008 and 2009. Infl ows of foreign direct investment, meanwhile, increased over the last decade relative to the years before 1997-98 (Figure 47).
Compared to 20 years ago, investors are now spoiled for choice; China and India have become favored destinations. The surge in manufacturing capacity in China due to the fi scal stimulus enacted after the 1997-98 crisis and the rapid integration of the country into global production networks, facilitated by preparations and ultimate accession to WTO in 2001, are likely to have restrained investors from expanding as aggressively as prior to 1997-98 in countries in developing East Asia that compete on low costs with China. Moreover, while Investment Climate Assessments conducted by the World Bank show little change in the investment climate during the 2000s (as in, for example, Malaysia), it is likely that the role of China has led investors to be more concerned about constraints they were less worried about previously. For example, anti-competitive practices, shortage of skills and lack of business support services were highlighted as the most important constraints to growth in Malaysia’s 2007 Investment Climate Assessment.7 Improving the business environment and addressing skill shortages, as a result, is an important part of the agenda of middle income countries in the region.
7 See “Malaysia Economic Monitor,” November 2009, World Bank.
Figure 45. Infrastructure investment in Indonesia has fallen as state-owned enterprises cut energy investment(in percent of GDP)
Source: Indonesia Infrastructure Finance Facility (World Bank, 2009).Note: SOE=state-owned enterprises.
Figure 47. And gross infl ows of FDI have risen in most countries this decade relative to the previous(in percent of GDP)
Sources: Datastream and World Bank staff calculations.
Figure 46. Saving rates have either climbed or remained broadly unchanged(in percent of GDP)
Sources: Datastream and World Bank staff calculations.
III. THE IMPERATIVE FOR RENEWED STRUCTURAL REFORMS 23
EMERGING STRONGER FROM THE CRISIS

Moving up the value chain will require better education and skills. The development of skills involves well-functioning and effi cient education systems at all levels, combined with labor policies and active employer participation in setting education standards and curricula.
Access to primary education is now largely universal across East Asia’s middle-income countries, and many have nearly universal secondary education. But high enrollments do not guarantee good outcomes. Although there is substantial divergence across the region, most middle-income countries lag behind the international average in basic skills, including reading and mathematics (Figure 48). Lower outcomes at the secondary level, in turn, restrict the pool of students for universities and other tertiary institutions. And high costs are a deterrent as well, leaving tertiary enrollment in East Asia well below the OECD average (Figure 49).
It is hardly a surprise, then, that indicators of innovation lag behind those of advanced countries. Thailand and Malaysia, for example, substantially trail the NIEs in both the inputs for innovation activity – including number of researchers and outlays on research and development (R&D) – and outcomes such as the number of patents (Table 5). Further, while the U.S., Japan and the NIEs innovate more than countries with similar levels of income per capita, East Asia’s middle-income economies innovate much less relative to peers with similar income (Figure 50 and Figure 51).
Figure 48. Education outcomes in developing East Asia lag the NIEs and advanced economies(8th Grade TIMSS scores for mathematics)
Source: International Mathematics and Science Study (TIMSS).
Figure 49. Access to tertiary education in developing East Asia lags the OECD(tertiary gross enrolment rate, in percent)
Sources: EdStats (2009) and UIS (2009).
Figure 50. The U.S., Japan and the NIEs innovate more than countries with similar incomes …(Patents per 100,000 population)
Sources: U.S. Bureau of Patents and World Bank staff estimates.
Figure 51. … while the middle-income countries in East Asia innovate less or as much as countries with similar incomes */(Patents per 100,000 population)
Sources: U.S. Bureau of Patents and World Bank staff estimates. */ The scale of the vertical axis is smaller than in the previous one.
24
WORLD BANK EAST ASIA AND PACIFIC ECONOMIC UPDATE 2010, VOL. I
III. THE IMPERATIVE FOR RENEWED STRUCTURAL REFORMS

Bolstering the quality of education and innovation will require concerted efforts by governments, universities, and the private sector. Improving the access and the quality of secondary and tertiary education is an important step. Better scholarship opportunities will also help raise quality. Government research and development institutes such as the ones in Korea and Thailand, have also attracted qualifi ed researchers, promoted innovation and resulted in the creation of spin off of technology fi rms. At the vocational and at the tertiary levels of education, there is need for more demand-driven curricula drafted with industry input, as well as for more practitioners in school staff, and more apprenticeship programs with fi rms.8
Skills need to be constantly upgraded after graduating from school or university. Life-long learning should be recognized as an important component of enhancing skills in a constantly changing environment. Employees can be offered in-fi rm training and incentives for improving work-relevant skills outside the fi rm. Such incentives have been the rule among Japanese fi rms for decades.
In times of crises, it is important not to let the slump in economic activity destroy the human capital built in times of prosperity. The global crisis has reinforced the importance for countries to have a capacity to help ameliorate the impact of large shocks on workers and limit the disincentive effects a protracted slump or lack of work opportunities can have on the most vulnerable. Setting up such systems during a crisis is challenging and rarely as effective as setting them up in good times. The middle-income countries of East Asia have been strengthening social assistance systems since the 1997-98 Asian fi nancial crisis and stepped up their efforts during the recent crisis. Both Philippines and Indonesia utilized conditional cash transfer programs (CCT) to poor families on the condition they send their children to school and keep them immunized. All middle-income countries used their fi scal stimulus packages to offer other types of support to the vulnerable and the poor, including through consumption subsidies, subsidized training for the unemployed or the low-skilled, and opportunities for employment in public works.
Moving up the value chain will also require more smoothly functioning labor, land and fi nancial markets. Improved labor market fl exibility and a balance between passive and active labor market policies are important to achieve that goal. Social insurance schemes also need to be developed to facilitate the adjustment of workers to a new job in the event of a job loss, help reduce the stigma of a business failure on workers, and embolden individuals to move from stable – or stale – low-paying jobs to more productive, higher paying ones. Entrepreneurial skills and higher tolerance for risk will, therefore, be encouraged. All in all, middle-income countries need to embrace the need to protect workers and skills, not jobs or positions, to encourage the creativity and innovation needed to transition from middle-income to high-income status.
East Asia’s developing economies need to revitalize their land markets if they are to reap the direct and indirect contributions of effi cient and equitable land systems to growth and poverty reduction. In particular, the region has to establish more effi cient land market structures, mechanisms and institutions that enhance agricultural intensifi cation, urban development, and fi nancial deepening.
8 In the UK, semi-private intermediary research institutes (IRIs) have served as a linkage between universities and the private sector. Professors get access to funds to carryout industry-relevant research, while industries help commercialize research by the universities.
Table 5. Developing East Asia lags in terms of R&D Outcomes
Countries R&D percent of
GDP (2006)
USPTO Patents per million
people (2008)
Researchers per million
people (2006) Japan 3.40 287 5,558Korea, Rep. of 2.83 180 ..Taiwan, China 2.30 338 ..Singapore 2.31 93 5,736Malaysia 0.64 6.2 371Thailand 0.25 0.6 ..
Source: Brahmbatt and Hu, “Ideas and Innovation in East Asia,” forthcoming.
III. THE IMPERATIVE FOR RENEWED STRUCTURAL REFORMS 25
EMERGING STRONGER FROM THE CRISIS

Well functioning agricultural land markets will support agricultural productivity; they can also be structured to help reduce rural poverty. After dismantling its collectivized farming system, Vietnam introduced a formalized market that privatized land use rights that favored the poor. There were concerns that the initiative might lead to ineffi ciencies, but it has in fact helped improve both effi ciency and equity. In China, studies suggest that a greater reliance on land leasing rather than on land readjustments can increase agricultural output substantially.
Similarly, urban land markets have to cope with the unfolding explosion in urbanization and development of semi-urban areas. The region’s urban population is projected to grow by about 60 percent to 800 million by 2025, and close to half of growth may well occur in semi-urban areas. Hence, governments need to reform their development control regimes if challenges in the fringe areas are to be met. Settlement mechanisms need also be regularized, and land market improvements linked closely with service upgrading interventions for the urban poor if conditions in informal settlements that proliferate in countries including Philippines are to be substantially improved.
LOW-INCOME COUNTRIES NEED TO BREAK INTO MANUFACTURING
Moving from dependence on agriculture, mining and informal services to manufacturing holds the key to long-term growth for the region’s low-income countries. Research suggests that agglomeration economies is the crucial factor in determining the location of manufacturing facilities, followed by low transport costs and cheap labor.9 Industrial production is lumpy, and fi rms begin production in locations close to other fi rms. This may seem to limit scope for new countries to industrialize. But changes in these endowments among existing countries and the emergence of new activities, or “tasks” into which production is broken, enable new countries to join in. In East Asia, China’s break into manufacturing in the 1980s was followed by explosive growth that seemed to many destined to exclude the low-income countries of the region from industrial development. But rising labor costs in China, improving regional transport links, and the rapid increase in the variety of “tasks” away from vertical integration has opened the potential for low income countries to break into manufacturing and become part of regional and global production chains.
9 The discussion in this section is partly based on: UNIDO, 2009, “Breaking in and Moving up: New Industrial Challenges for the Bottom Billion and the Middle-Income Countries, Industrial Development Report 2009” and Indermit Gil, 2009, “Reshaping Economic Geography: World Development Report 2009,” the World Bank.
Figure 52. Vietnam, Lao PDR and Cambodia have relatively high shares of manufacturing in GDP(in percent of GDP)
Source: World Development Indicators.
Figure 53. The share of agriculture and mining in GDP is sizable in most low-income countries in East Asia(in percent of GDP)
Source: World Development Indicators.Note: KHM (Cambodia), LAO (Lao People’s Democratic), MYR (Myanmar), VNM (Vietnam), IDN (Indonesia), MYS (Malaysia), PHL (Philippines), THA (Thailand)
26
WORLD BANK EAST ASIA AND PACIFIC ECONOMIC UPDATE 2010, VOL. I
III. THE IMPERATIVE FOR RENEWED STRUCTURAL REFORMS

Several of East Asia’s low-income countries have already started on this path, imitating China’s rapid ascent. Among countries with similar income levels, Cambodia, Lao PDR, and Vietnam have the highest share of manufacturing value-added relative to GDP (Figure 52 and Figure 53). This outcome was achieved after two decades of growth at the highest pace in the region after China, with real GDP per capita almost quadrupling in the three countries. In Cambodia, value-added in industry almost tripled over the last two decades, and so did the number of workers. Industrial growth in Cambodia, as a result, excelled in creating jobs, primarily in the garment sector, but productivity increases were negligible. The level of productivity in garments is still similar to that in Lao PDR and Vietnam, but much below China’s.10
The global economic crisis hit Cambodia hard, with real GDP contracting 2 percent in 2009 – the only contraction among the region’s low-income countries other than in overheated Mongolia. Prospects are for return to strong growth this year and next, but much uncertainty remains over the medium term. Many Cambodians remain poor and with few assets that could be used to add to investment. Boosting investment in the coming decade from the 18.5 percent of GDP of the last decade will, therefore, require foreign saving. The dilemma Cambodia faces is similar to what Vietnam dealt with a decade ago. Vietnam’s decision to open the economy to foreign investment and embark on ambitious structural reforms boosted infl ows of foreign direct investment and helped raise fi xed investment to 32 percent of GDP on average over the last decade.11 Opening up also brought its own risks. A surge in foreign investment through 2008 led to overheating pressures. But forceful government action helped tackle the danger and cooled the economy just before the global crisis hit with full force.
Lao PDR and Cambodia can benefi t from their neighbors. Being in a rapidly growing neighborhood will help, as will the continued regional and global diversifi cation of trade in tasks, and the rapidly rising labor costs in China and other parts of the world. Thus far, however, only Vietnam has been able to link to production networks, and only to a limited extent. The challenge and opportunity confronting Laos and Cambodia will be to upgrade physical and human capital and embrace regional integration. The development of regional and national infrastructure (fi nanced in part by the Asian Development Bank) to improve connectivity and reduce transportation costs across South-East Asia is a critical step in this direction. This will now need to be complemented by “soft infrastructure” – namely, measures to facilitate trade such as effi cient transit arrangements, common border regulations, national single window facilities for importers and exporters, and customs modernization.
COMMODITY EXPORTERS NEED SOUND FISCAL POLICIES FOR SUSTAINABLE GROWTH
East Asia’s commodity exporters – Lao PDR, Mongolia, Timor-Leste, Papua New Guinea - face the continued challenge of harnessing natural resource endowments for economic development while limiting the impact of resource-induced volatility on their domestic economy. The challenge is illustrated by the large swings in global commodity prices which may well continue in the near term as the global economy converges to its new equilibrium (Figure 54). The large and growing dependence of these economies on commodities for exports and government revenues – at least in the medium term – is also a cause for concern (Figure 55).
Prudent fi scal policy before and during the commodity boom helped PNG and Timor-Leste weather well the economic crisis. In PNG, fi scal policy even before the crisis was guided by adherence to the principles that underpinned the Medium-Term Fiscal Strategy for 2008-2012, including limits on the fi scal defi cit in line with estimates of sustainable medium-term fi scal balances.
10 See: “Cambodia: Sustaining Rapid Growth in a Challenging Environment,” 2009, the World Bank.11 Lao PDR’s investment rate is also high at about 30 percent over the last decade, but much of that refl ects investment into mining and energy-generating capacity, rather than
manufacturing.
III. THE IMPERATIVE FOR RENEWED STRUCTURAL REFORMS 27
EMERGING STRONGER FROM THE CRISIS

The authorities also saved windfall revenues from natural resources into trust accounts. (And the authorities recognize the need for further reforms of how resource revenues are saved and where they are invested.) Timor-Leste also emerged relatively unscathed from the crisis, thanks to rules established in 2005 to save all petroleum-related revenues in a Petroleum Fund invested abroad, and to limit withdrawals. Withdrawals were limited to the estimated sustainable income (ESI) derived from Fund balances and projected fl ows into the Fund. In 2009, the authorities prudently increased withdrawals to above the ESI to help mitigate the impact of the crisis. (The notes on PNG and Timor-Leste at the end of this volume discuss some of these details further).
Mongolia’s experience with the commodity boom and bust has been different. During the boom, the government saved only a part of the windfall revenues while increasing untargeted social expenditures, wages and salaries, and allowing the proliferation of poorly-screened investment projects expected to be funded with resource revenues in the future. When the boom turned into bust, the modest fi scal surplus quickly turned into a large defi cit that could not be fi nanced by the small savings. At the same time, the external current account also swung into a large defi cit, and the fi nancial sector, which had been overheating during the boom period, ran into serious problems, with one of the major banks put under conservatorship.
A robust fi scal framework and good fi scal policy are crucial for saving, managing and using resource-related revenues for improving living standards. A robust fi scal framework includes, but is not limited to, a good taxation regime for the natural resource sector, comprehensive government budgets, thorough costing of all government programs, budget and spending transparency, stronger medium-term fi scal and expenditure frameworks, and a robust regime for public investment planning, execution and monitoring. Fiscal rules are an integral part of the framework
Fiscal rules are broadly defi ned as limits or restrictions on fi scal discretion, signaling the commitment of the government to particular set of fi scal policies. More narrowly, fi scal rules are limits on fi scal indicators, such as the fi scal balance, taxes, the growth or composition of spending, and government debt or borrowing. As with every commitment device, robust defi nitions are needed to signal credibility, but overly rigid or complex rules often become unsustainable. A similar trade-off exists between accuracy and simplicity, especially in countries with limited capacity and transparency. More accurate or counter-cyclical rules (such as those that adjust for the business cycle) are data-intensive and may produce a rule that may not command enough credibility if the quality of the data is patchy.
Despite good intentions, the record on fi scal rules is somewhat mixed. In PNG, the authorities restrained the fi scal defi cit during the recent commodity boom, as they were preparing a fi scal rule essentially limiting the fi scal defi cit to 4-8 percent of GDP for 2008-2012 and paid down government debt (Figure 56 and Figure 57). The defi cit surged during the crisis, however, well outside
Figure 54. Swings in commodity prices have amplifi ed …
(12-month rolling standard deviation of spot prices)
Source: World Bank staff estimates.
Figure 55. … posing challenges to the region’s commodity producers and exporters(in percent of total exports, 2004-08)
Source: UN COMTRADE.
28
WORLD BANK EAST ASIA AND PACIFIC ECONOMIC UPDATE 2010, VOL. I
III. THE IMPERATIVE FOR RENEWED STRUCTURAL REFORMS

the rule. Chile introduced a structural surplus rule of 1 percent of GDP in 2000 as an attempt to correct earlier efforts to manage resource-related revenues largely through rules on the Copper Stabilization Fund. Those efforts ran into diffi culties after 1998, when commodity prices plunged.12 The EU also presents a good case study. Analysis of fi scal rules for all levels of government in the EU using data before 2008, for example, suggested they have been associated with positive fi scal outcomes for the EU on average.13 Such results aside, the EU’s fi scal rules have not been effective in keeping fi scal defi cits below the 3 percent of GDP limit in many EU countries. Greece has exceeded this threshold in every year since 2000, and so has Hungary since its EU accession in 2004.14 Governments, in short, invariably fi nd reasons to abandon or circumvent fi scal rules as they become binding.
Fiscal rules are no panacea, but combined with a solid fi scal framework they are essential pre-requisites for helping transform boom-bust cycles into sustainable revenues streams that can support long-term development. Recent best practice in this regard is to combine a medium-term fi scal framework with a fi scal risk statement that reveals and analyzes the risks from various fi scal paths and fl ags the impact on fi scal variables and macroeconomic stability from known contingent liabilities.
THE PACIFIC ISLANDS NEED TO PURSUE DEEPER INTEGRATION WITH THE NEAREST LARGE MARKET
The Pacifi c islands face unique development and policy challenges, given the small size of their economies and population, the signifi cant distance to large markets, and exceptionally high dependency on single sectors. The population of the Pacifi c islands, excluding PNG and Timor-Leste, is about 2 million, a tenth of the population of Jakarta. That population inhabits a land area about half the size of the Philippine islands of Luzon, yet stretches across an area of ocean about one-seventh of the surface of the world. The islands are, on average, more than a third farther from world markets than are the islands in the Caribbean, as measured by GDP-weighted distances to all countries in the world. More than any other group of small countries, the Pacifi c islands embody the paradox that while they are far and away from world markets and trading partners, they are dependent on them to a much
12 The structural balance rule was introduced in 2000 by a government decree and signaled government commitment for 2000-2005. In 2007, the authorities decided to modify the rule to better capture the cyclical variations in copper prices and the level of GDP relative to trend. The rule was then enshrined in the Fiscal Responsibility Law. The law also created two sovereign wealth funds: the Economic and Social Stabilization Fund (into which the Copper Stabilization Fund was merged) and the Pension Reserve Fund.
13 See Debrun (2008).14 Moreover, government debt in many EU countries remains above the 60 percent limit in the SGP. In 1997, 12 out of the current 27 member states had debt exceeding 60 percent of
GDP. The number declined in half by 2001, thanks to sustained fi scal consolidation efforts even after countries joined the eurozone in 1999 (for Greece, 2001), before rising again to 10 by the end of 2009, suggesting limited progress over a decade. The median level of debt has declined consistently, however, and is down to about 48 percent of GDP from 58 percent a decade ago.
Figure 56. Papua New Guinea restrained its non-mineral fi scal defi cit in 2004-08…(in percent of GDP)
Sources: PNG authorities and World Bank estimates.
Figure 57. … and reduced its public external debt
(in percent of GDP)
Sources: PNG authorities and World Bank estimates.
III. THE IMPERATIVE FOR RENEWED STRUCTURAL REFORMS 29
EMERGING STRONGER FROM THE CRISIS

larger extent, including through aid and remittances. The Pacifi c islands also the most aid-dependent countries in the world, with per capita aid ranging from $40 in Fiji to more than $2000 in Palau.15
The islands are highly vulnerable to systemic and one-off external shocks, including those related to climate change. The recent series of crises were no exceptions, with the islands battered more than other countries by the surge in prices for food and fuel, the collapse in foreign demand for goods and services – notably tourism, and a drop in remittances. For several of these countries, their vulnerability to natural disasters was exposed at a time when economies had already been weakened by global economic developments. Massive fl ooding in Fiji last year were followed by cyclones and, in September 2010 by an earthquake and tsunami in Samoa - the worst natural disaster in the country in half a century – and the outlying islands of Tonga.
The Pacifi c islands also differ by their unique vulnerabilities and challenges. In the Solomon Islands, the imminent end of large-scale logging that has supported growth through 2008 will strain the nation, even though governance challenges are now largely in the past. In Fiji, relations with external partners remain strained and full bilateral relations are still to be restored. (For more details, see the note on the Pacifi c islands at the end of the report.)
The crisis drove home the point that there is a much larger premium on prudent macroeconomic policy in small states that face high systemic volatility in their economic performance. Ensuring a strong fi scal and external position during upswings creates room for shoring up economic activity and protecting the vulnerable during the troughs.
While there are numerous long-term challenges confronting this group of countries, it is worth highlighting several where potential solutions are feasible. The fi rst is aid coordination and aid predictability. The “Cairns Compact” on strengthening development cooperation in the Pacifi c is an important step toward implementing the Paris Declaration on Aid Harmonization. The Compact calls for frequent collective reviews of progress in strengthening development coordination, regular peer reviews of national development plans and budget allocation processes, and annual reports on efforts to reduce aid fragmentation and lower administrative costs. Stable and predictable aid is needed, in good times and bad, to help support reform efforts across the region. Catastrophic risk insurance instruments need also be created to ensure resources are available when natural disasters hit.
The second is to overcome the costs of distance and isolation by facilitating the quiet telecommunications revolution taking place in the Pacifi c. That “revolution” has helped reduce costs of telephone calls, internet access, long-distance transactions, information fl ows and service delivery, helping reduce distances previously thought unbridgeable.16 Long-distance learning through the internet has taken off, enabling students in the Pacifi c islands to obtain degrees at a fraction of the cost of attending in person. Medical diagnoses can be made based on images transmitted from the islands to advanced hospitals around the world. And the scarcity of qualifi ed staff can be overcome through tighter regional integration. In the Caribbean, for example, seven islands established a regional telecommunications advisory body, ECTEL, in 2003, to help advance electronic communications and e-government.
And the third is the importance of sub-regional economic integration. The most important among these are efforts to implement sub-regional agreements on the management, conservation, and development of fi sheries; develop regional arrangements for marine mineral resource management; and implement key regional agreements to promote the freer movement of goods and services. There is also considerable potential for deepening integration with the nearest large market, which for the Pacifi c Islands
15 World Bank, 2009, “Pacifi c Islands: Development in 3D.”16 Most of the Pacifi c islands have opened their markets to private operators, starting with Fiji and Samoa in 2006.
30
WORLD BANK EAST ASIA AND PACIFIC ECONOMIC UPDATE 2010, VOL. I
III. THE IMPERATIVE FOR RENEWED STRUCTURAL REFORMS

mostly means integration with Australia and New Zealand. Most recently, temporary migration schemes with New Zealand and Australia have been at the forefront of this agenda. New Zealand now runs a Recognized Seasonal Employer program that allows up to 8,000 temporary migrants from the Pacifi c islands to work in the country’s horticulture. Such efforts can be expanded, particularly given Australia’s need for large numbers of temporary agricultural laborers.
A COMMON REGIONAL AGENDA FOR THE MEDIUM TERM
The preceding paragraphs focused on the country-specifi c challenges and medium-term agendas. But there is a common agenda, which is constantly enriched and deepened by the sustained shift of global economic power to the East. Fortunately, East Asia is served by two active and effective regional organizations – ASEAN and APEC. ASEAN, in its various manifestations (ASEAN+3, ASEAN+6, East Asia Summit) covers most of East Asia, while APEC broadens East Asia’s partnership to the North American continent and Latin America. This section focuses on two items of the common agenda: regional integration, and climate change and environmental sustainability.
Deeper regional integration
Achieving deeper regional integration is a key element of this common agenda. The importance attached to this issue refl ects the realization that while the benefi ts of tighter integration have been numerous and profound, the actual level of integration is relatively low. And with prospects for a more slowly expanding global economy, the regional market for goods and services will provide an ever expanding opportunity that so far has been only partially explored. Tighter integration in the region should boost regional trade in goods and services, helping create better agglomeration economies, improve international competitiveness, and support sustainable urbanization.
Market-driven integration in the region has been advanced, but efforts to create institutions and arrangements for more comprehensive economic cooperation and integration are starting to catch up only recently. The ASEAN Free Trade Area (AFTA) established in 1993, was followed by ASEAN’s commitment to create a single ASEAN Economic Community by 2015. A free trade agreement between ASEAN and China, and a separate one with India, entered into effect from the start of 2010. The dialogue under the Asia-Pacifi c Economic Cooperation (APEC) has also progressed. These developments notwithstanding, convergence of incomes across the region is progressing slowly, to be achieved as deeper economic integration takes fi rmer hold (Figure 58).
Intra-regional trade has risen fast, as an illustration of the advance of market-driven integration. Intra-regional trade accounts for 55-60 percent of total external trade of the East Asian countries, driven by intra-industry trade within regional and global production networks (Figure 59).
There is ample room for further trade integration. Regional agreements, as in all regions at similar stages of integration, tend to have provisions to exclude trade in sensitive products, including unprocessed agriculture goods and services. Progress is more robust on trade in industrial products and processed foods. From the start of 2010, the ASEAN-6 cut tariff rates on almost 8,000 tariff lines to zero, bringing the total tariff lines traded under the Common Effective Preferential Tariffs for the ASEAN Free Trade Area (CEPT-AFTA) to 99.11 percent.17 The average tariff rate for trade in industrial products and processed food among the ASEAN+6 is now reduced to 0.05 percent from nearly 0.8 percent last year. Under the CEPT-AFTA commitments, the newer
17 Brunei Darussalam, Indonesia, Malaysia, Philippines, Singapore, and Thailand.
III. THE IMPERATIVE FOR RENEWED STRUCTURAL REFORMS 31
EMERGING STRONGER FROM THE CRISIS

ASEAN members – Cambodia, Lao PDR, Myanmar, and Vietnam – will also see average tariff rate reduced from 3 percent in 2009 to 2.6 percent in 2010. However, agricultural products which come under the Sensitive List will have their tariffs reduced to 5 percent in 2010 and to zero only by 2015. Products under the Highly Sensitive List, including rice will have their tariff capped on a specifi ed date. Tariffs on agriculture products are nil in the EU and amount to 3.17 percent in NAFTA.
The remaining agenda for trade facilitation is also large. Improvements in logistics and behind-the-border trade facilitation are two of the main issues. Logistics costs needs to be reduced to further bolster trade across borders. The costs of logistics in this region are about double those in advanced countries. For example, the logistics costs of transporting a container from Bangkok or Jakarta to Los Angeles is twice that of shipping it from Shanghai or Seoul (Figure 60). High logistics costs in East Asia stem from inadequate transport infrastructure, underdeveloped logistics and transport services, technical control regulations, and bureaucratic (and sometimes corrupt) import and export procedures. Much of the problem is behind the border, and indeed beyond the port.
Behind-the-border procedures and rules need to be simplifi ed and made more predictable. Examples of simplifi cation include streamlining of documentary requirements for import and export transactions, reducing the number of border agencies with which fi rms must interact and eliminating hidden trade barriers. Predictability can be increased, reducing the cost of doing business, by cutting export and import delays, lowering uncertainty surrounding unoffi cial payments, and eliminating favoritism in administrative decision making.
Contrary to expectations, barriers to foreign direct investment in East Asia are the highest in the world. This outcome is surprising given the role of foreign direct investment in advancing intra-regional trade (Figure 61). Such barriers constrain competition and limit productivity gains that could be obtained from higher foreign direct investment, and hamper the use of the region’s large savings in making overseas investments.
The benefi ts from integrating trade in services and addressing technical barriers to trade cannot be underestimated. They are likely to be many times those from reducing border barriers. For example, static gains for developing East Asia and Korea from services liberalization are estimated at about $270 billion by 2015.18 If there could be improvements in the effi ciency of the services sector, then the gains occur not only within the service sectors, but also within other sectors as services are a key input into other
18 World Bank, 2002, Global Economic Prospects.
Figure 58. East Asia’s per capita income is much more dispersed than in Western Europe(coefficient of variation of per capita income)
Sources: World Development Indicators and Bank staff calculations.
Figure 59. Intraregional trade in EAP has risen quickly, surpassing that of NAFTA(Trade within the region as share of total trade, percent)
Source: UN Comtrade, as in Alavi, Nehru, van Dorn (2008).
32
WORLD BANK EAST ASIA AND PACIFIC ECONOMIC UPDATE 2010, VOL. I
III. THE IMPERATIVE FOR RENEWED STRUCTURAL REFORMS
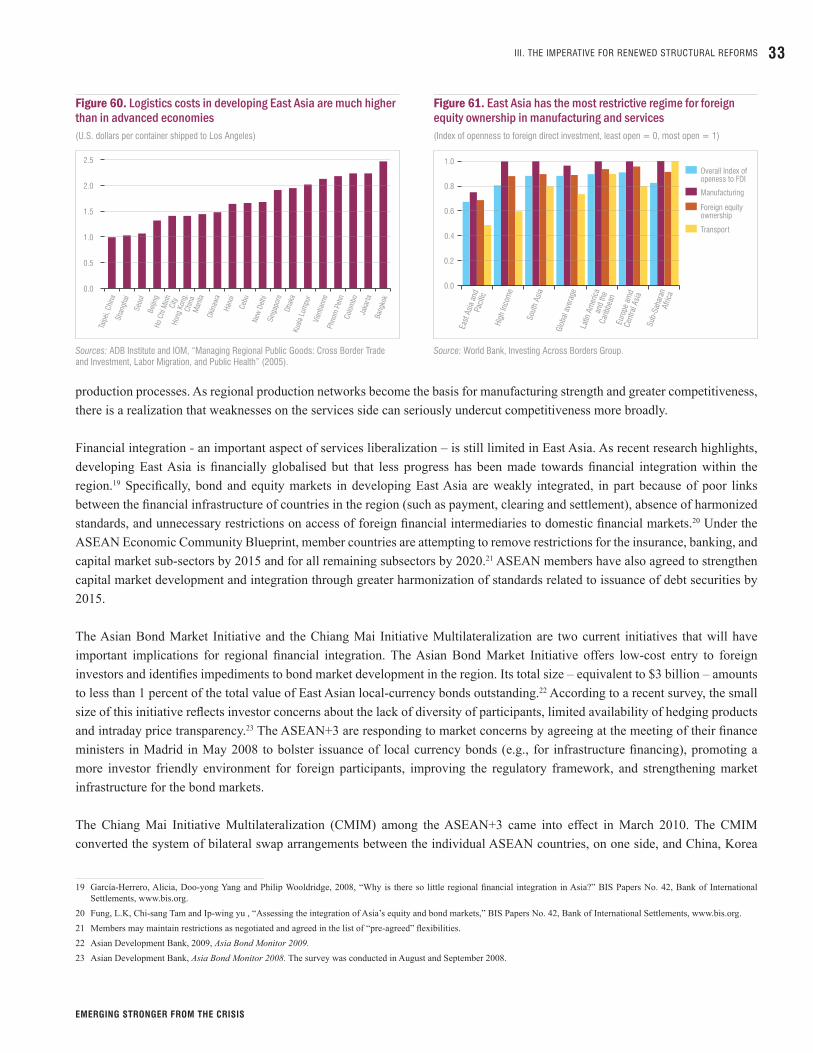
production processes. As regional production networks become the basis for manufacturing strength and greater competitiveness, there is a realization that weaknesses on the services side can seriously undercut competitiveness more broadly.
Financial integration - an important aspect of services liberalization – is still limited in East Asia. As recent research highlights, developing East Asia is fi nancially globalised but that less progress has been made towards fi nancial integration within the region.19 Specifi cally, bond and equity markets in developing East Asia are weakly integrated, in part because of poor links between the fi nancial infrastructure of countries in the region (such as payment, clearing and settlement), absence of harmonized standards, and unnecessary restrictions on access of foreign fi nancial intermediaries to domestic fi nancial markets.20 Under the ASEAN Economic Community Blueprint, member countries are attempting to remove restrictions for the insurance, banking, and capital market sub-sectors by 2015 and for all remaining subsectors by 2020.21 ASEAN members have also agreed to strengthen capital market development and integration through greater harmonization of standards related to issuance of debt securities by 2015.
The Asian Bond Market Initiative and the Chiang Mai Initiative Multilateralization are two current initiatives that will have important implications for regional fi nancial integration. The Asian Bond Market Initiative offers low-cost entry to foreign investors and identifi es impediments to bond market development in the region. Its total size – equivalent to $3 billion – amounts to less than 1 percent of the total value of East Asian local-currency bonds outstanding.22 According to a recent survey, the small size of this initiative refl ects investor concerns about the lack of diversity of participants, limited availability of hedging products and intraday price transparency.23 The ASEAN+3 are responding to market concerns by agreeing at the meeting of their fi nance ministers in Madrid in May 2008 to bolster issuance of local currency bonds (e.g., for infrastructure fi nancing), promoting a more investor friendly environment for foreign participants, improving the regulatory framework, and strengthening market infrastructure for the bond markets.
The Chiang Mai Initiative Multilateralization (CMIM) among the ASEAN+3 came into effect in March 2010. The CMIM converted the system of bilateral swap arrangements between the individual ASEAN countries, on one side, and China, Korea
19 García-Herrero, Alicia, Doo-yong Yang and Philip Wooldridge, 2008, “Why is there so little regional fi nancial integration in Asia?” BIS Papers No. 42, Bank of International Settlements, www.bis.org.
20 Fung, L.K, Chi-sang Tam and Ip-wing yu , “Assessing the integration of Asia’s equity and bond markets,” BIS Papers No. 42, Bank of International Settlements, www.bis.org.21 Members may maintain restrictions as negotiated and agreed in the list of “pre-agreed” fl exibilities.22 Asian Development Bank, 2009, Asia Bond Monitor 2009.
23 Asian Development Bank, Asia Bond Monitor 2008. The survey was conducted in August and September 2008.
Figure 60. Logistics costs in developing East Asia are much higher than in advanced economies(U.S. dollars per container shipped to Los Angeles)
Sources: ADB Institute and IOM, “Managing Regional Public Goods: Cross Border Trade and Investment, Labor Migration, and Public Health” (2005).
Figure 61. East Asia has the most restrictive regime for foreign equity ownership in manufacturing and services(Index of openness to foreign direct investment, least open = 0, most open = 1)
Source: World Bank, Investing Across Borders Group.
III. THE IMPERATIVE FOR RENEWED STRUCTURAL REFORMS 33
EMERGING STRONGER FROM THE CRISIS

and Japan, on the other, and the $2 billion swap arrangements between the ASEAN countries (ASA) into a single $120 billion multilateral swap arrangement for balance of payments support. The maximum amount available for each country to draw is a multiple of its original contribution, ranging from $11.2 billion for Indonesia, Malaysia, Singapore and Thailand, to $0.2 billion for Lao PDR.
Regional integration can be accelerated through better management of migration. At present, there are more than 20 million migrants from the region who remitted nearly $80 billion in 2008. Excluding China, the share of migrants is more than 2 percent of the population and 4 percent of the labor force. In Singapore and Brunei, immigrants make up more than a third of the population, while in other countries there is consensus that offi cial numbers underestimate the true magnitude of the migrant population. Research suggests that offi cial numbers capture only a fi fth of actual immigrants in Thailand and about 70 percent in Malaysia. Remittances are a signifi cant source of income for some countries, notably Philippines (where remittances account for about 13 percent of GDP), Vietnam (8 percent), and Fiji, Tonga, and the Solomon Islands (6 percent).
Much of East Asia’s migration takes place within the region. The large differentials in earnings of as much as fi ve times among countries in the region, and the demographic pressures of aging among the more affl uent countries will adversely affect growth and fi scal sustainability by lowering the share of the working age population. (For example, people aged 65 and older will likely account for 40-60 percent of some of the North Asian countries in the next 30 years). New research suggests that managing migration can be an effective policy instrument to raise profi ts and investments for receiving countries, while minimizing the consequences for the domestic work force.
The movements of migrants are raising new issues. In host countries, domestic workers worry about the infl ux of unskilled migrants and their potentially depressing effects on wages and employment opportunities, and the burden on public fi nance and services. In source countries, concerns are raised about brain drain, exploitation of workers, adverse cultural and social effects, and growing dependence on remittance earnings. During the crisis and its aftermath, voices are rising against migration and for sending migrants back to their countries. Addressing these issues is sensitive, but progress should help contribute to regional integration, mitigate labor market shortages in some countries and fi nd employment for excess labor in others. And migrants in manufacturing, especially in companies integrated within production networks, will learn valuable skills that are transferable to low-income countries where production networks may be making the initial inroads.
Climate change and environmental sustainability
Climate change and environmental sustainability is another strand of the regional agenda. Looking ahead, the region faces the twin challenges of energy security and environmental sustainability. East Asia’s rapid economic development, including accelerating urbanization, has resulted in tripling energy consumption over the last three decades with projections for a further doubling over the next two decades. For most developing countries in the region and elsewhere, ensuring energy security so far has involved the adoption of technologies that are high emitters of greenhouse gases. Under unchanged policies, projections are for greenhouse gas emissions and local air pollutants to double for all the larger countries in the region by 2030. At the same time, these large increases in greenhouse gas emissions are accelerating global climate change, often with detrimental impacts for the region. Catastrophic events such as fl oods, droughts and storms, especially for countries in the Mekong Delta, Vietnam, Indonesia, the Pacifi c islands, and Philippines, are likely to become more frequent and more deadly.
Addressing the twin challenges will also help make the region’s rapidly growing cities more livable. At present, developing East Asia has some of the world’s most polluted cities, although energy consumption and greenhouse gas emissions per capita
34
WORLD BANK EAST ASIA AND PACIFIC ECONOMIC UPDATE 2010, VOL. I
III. THE IMPERATIVE FOR RENEWED STRUCTURAL REFORMS

are well-below levels in advanced economies. Unless tackled, urban pollution and environmental degradation will rise rapidly further, threatening to offset to a substantial extent the benefi ts of agglomeration economies.
Estimates from regional researchers suggest that with the proper balance of energy effi ciency and use of low-carbon renewables, emissions can peak in 2025. To achieve this target, mitigation – that is, efforts to reduce greenhouse gases – will need to involve fostering new investment in renewable technologies and disseminating the use of the “green” growth products that will require signifi cant regional cooperation. There is also an opportunity to turn the challenge of climate change into growth. With investment rates in the region higher than in most developed countries, there is scope for East Asia to move rapidly to the “green” technology frontier. Such a move will give the region a competitive advantage in a sector poised for rapid global growth. China, Japan, Korea and Singapore are already at the forefront of developing energy-effi cient and renewable technologies and products, including photo-voltaic cells, wind power, biofuels and hydro-electricity. Korea, for example, has doubled investments in renewables over the past fi ve years, while China has doubled its installed wind power capacity in each of the last fi ve years. Given the region’s scope and opportunities for tighter integration, companies at the forefront of these efforts will gain a competitive advantage in a sector poised for rapid global growth. Addressing a regional issue, as a result, will open doors to global markets.
Countries in the region will also need to adapt to the changing climate. Innovation and ingenuity will be part of the efforts to cope with the rising temperatures and sea levels, more intense rainfalls, more erratic and extreme weather, and increased prevalence of both fl ooding and drought. The East Asia and Pacifi c region is particularly prone to climate change because of its unique geography and demographic characteristics: high population density, long coastlines and many island nations, as well as the relative prominence of agriculture and fi shing in the livelihoods of the poor.
The adaptation agenda will require improved coordination and policy harmonization, and integration with the region’s disaster risk management agenda. The economic sectors likely to be affected include ports, river navigation, urban economies, agriculture, and hydropower. Adaptation measures may require additional investments in coast line rehabilitation, watershed management and reforestation, river levees, and diversifi cation of agricultural crops. Small islands may need stronger coastal protection measures, and a combination of engineering and natural interventions may be needed to adapt to changing river dynamics.
Recently, several natural disasters of unprecedented magnitude occurred in the region, pointing at the need to invest in early warning systems, protect cities, and strengthen regional cooperation. Manila and the Northern Philippines were devastated by the typhoons Ondoy and Pepeng, and Vietnam, Cambodia, and Lao PDR hit by the typhoon Ketsana. All of these caused unprecedented fl ooding in several capital cities in the region. Ulan Bator was also fl ooded in 2009. Investing in early warning systems would save lives, and the assessments are currently under way. For example, six city governments – in Vietnam (Hanoi, Can Tho, and Dong Hoi), Indonesia (Yogyakarta), Philippines (Iloilo), and China (Ningbo) are applying the broad concepts from the Climate Resilient Cities Primer to their local contexts, including in the case of Vietnam, the development of Local Resilience Action Plan.
Several regional initiatives are underway to estimate potential impacts, and design regional response programs. The lower Mekong River basin will be particularly vulnerable to climate change, with the changing seasonal rainfall patterns, increased severity of hurricanes, and changes in water levels in the Mekong and its tributaries. The Mekong River Commission (MRC) has a regional Climate Change and Adaptation Initiative to help streamline adaptation actions into national plans. After the Singapore Declaration on Climate Change, Energy and the Environment acknowledged that adaptation is a critical issue for the region, ASEAN also noted in various meetings that capacity to adapt to climate change in the region is low. In fact, to improve this capacity, and especially to respond more quickly to natural disasters, ASEAN established a $5 billion regional adaptation
III. THE IMPERATIVE FOR RENEWED STRUCTURAL REFORMS 35
EMERGING STRONGER FROM THE CRISIS

Box 1. Production networks and competition
Global and regional production networks offer an opportunity for the region’s middle-income countries to move up the value chain and for the low-income countries to industrialize. The rapid transmission of demand along the network also allowed counties in the region to recover faster, once global demand began to pick up.
In the last decade, increasing integration through production networks has helped boost industrial development throughout the East Asia and Pacifi c region. In the aftermath of the 1997-98 Asian fi nancial crisis, the emerging economies of East Asia took less than a decade to double nominal dollar GDP by 2005, in large part thanks to exports rising faster as a share of GDP than in any other region (Figure 62). Intra-regional trade and fl ows of direct investment boomed, and innovation fl ourished in some countries. Intra-regional trade grew faster than trade with countries outside the region, and today accounts for more than half of East Asia’s total trade. Finally, the emergence of vertical and narrowly specialized production networks had formed the East Asian production model. Networks in the electronics, automobile and textile industries are the largest in the region.
The share of parts and components in external electronics trade is higher in East Asia than in other developed or developing region (Figure 63). Electronics products account for a third of China’s exports to the G-3 and half for China’s imports from East Asia.24 Electronics exports to the G-3 are predominantly, although not exclusively,
24 We defi ne electronics products broadly to consist of: (1) electrical machinery, apparatus and appliances (SITC3 cat.77); (2) telecommunications and sound recording apparatus (SITC3 cat.76); and, (3) offi ce machines and automatic data processing equipment (SITC3 cat.75). Within these categories, parts and components versus fi nal goods, as well as electronics with high technology content versus medium technology content are defi ned based on S. Leduc, M. Marazzi and B.A. Wilson, 2007, “The Role of China in Asia: Engine, Conduit, or Steamroller?” Board of Governors of the Federal Reserve System International Finance Discussion Papers, #904, September.
fund. A few climate change adaptation initiatives are also being developed in the Pacifi c island countries, ranging from scientifi c and technical cooperation, knowledge sharing, and institutional strengthening, to mainstreaming climate risk in development programs and investments. The Pacifi c region is also implementing regional initiatives in support of climate and hazard risk reduction through collaborative efforts between multilateral donors.
Figure 62. Export growth is higher in East Asia than in other regions (in percent of GDP)
Source: World Development Indicators.
Figure 63. Parts and components dominate electronics trade within the region(share of electronics parts and components in total exports, 2007, in percent)
Source: UN COMTRADE.
36
WORLD BANK EAST ASIA AND PACIFIC ECONOMIC UPDATE 2010, VOL. I
III. THE IMPERATIVE FOR RENEWED STRUCTURAL REFORMS

comprised of equipment and devices (with fi nal goods accounting for two-thirds and parts for the rest), while electronics imports from East Asia are largely parts and components (fi nal goods account for 15 percent). A vertical chain formed across several countries leads to the manufacture of products that are exported to third countries, increasingly by China. This pattern of production illustrates the mutual and increasing dependence of countries on imports of components from each other (Figure 64). The East Asian production networks are also becoming increasingly more global. For example, 80-100 percent of electronics imported by Philippines and China from Latin America or Eastern Europe in 2008 were parts and components, compared with 40 percent a decade ago.
The role of China in the regional and global production networks has changed. Similarly to Philippines, but unlike the other middle-income countries and the NIEs, the share of high technology products in China’s electronics exports has risen sharply (Figure 65). At the same time, fi nished products rather than parts and components dominate China’s electronics exports. This transformation has put China in direct competition with the NIEs, which have had to move up the value chain to survive. Depending on the product segment, other countries in East Asia fi nd themselves either in direct competition with China, or a part of the pattern of mutual and increasing dependence.
While production networks so far appear to have not involved low-income countries so far, there are indications that some, notably Vietnam, are ready to break in. Vietnam, for example, increased its electronics exports to more than 8 percent of the total in 2008, and multinational corporations have been seen in search for new end-branches for their production in Vietnam, Cambodia and Lao PDR.
But even within the middle-income countries there may be a case for some economies breaking into global or regional production networks. For example, compare Indonesia and Philippines, countries with broadly similar levels of income per capita. Electronics account for two-thirds of Philippines’ exports and a much smaller part in Indonesia. Unlike Indonesia, Philippines has been part of regional and global production networks for decades. These differences aside, high technology does not mean high value added. Value-added in electronics has been stagnant in Philippines, with little evidence of spillover effects to other companies or industries. And the model has been one of low cost assembly. When you compete on costs, other lower cost producers tend to overtake you. The middle-income countries in the region, as a result, have been
Figure 64. The share of parts and components in imports rose sharply in China and the NIEs(share in electronic imports, in percent)
Source: UN COMTRADE. */ Imports of electronic parts and components as share of total electronics imports.
Figure 65. Going high-tech(share of high-technology exports in electronics, in percent)
Source: UN COMTRADE.
III. THE IMPERATIVE FOR RENEWED STRUCTURAL REFORMS 37
EMERGING STRONGER FROM THE CRISIS

losing market share against China (Figure 66 and Figure 67).
Production networks hold high promises but also big challenges for developing East Asia. The middle-income countries need to move up the value chain building on their integration in regional and global networks, encourage technological spillovers and facilitate new investment to boost economic development. The low-income countries should break into manufacturing and industrialize faster. The rapidly rising role of China poses a challenge, with the country turning into both the main point of assembly of fi nal products for exports to third countries, and into a powerful competitor for all. The scale of China’s economy allows the country to compete both in terms of costs, at least for the medium term, and in terms of capacity for imitation and innovation. Proximity to a dynamic large market such as China needs to be seen as a blessing by countries in the region. Tough competition stimulates reform, and a return to the structural reforms pursued before the global economic crisis is what the region needs to grow fast even in a slowly growing global economy.
Figure 67. … as China gains(global market share in percent)
Source: UN COMTRADE.
Figure 66. The middle-income countries are losing market share …(global market share in percent; low-tech is apparel; medium- and high-tech is electronics)
Sources: UN COMTRADE.
Figure 69. Philippines has a relatively more educated workforce(share of labor force by technological sophistication and education level, percent)
Sources: Labor Force Surveys.
Figure 68. Just one factor for assessing competitiveness: monthly wages are lower in Malaysia in the apparel sector and higher in electronics(wages in U.S. dollars per month)
Sources: UN COMTRADE.
38
WORLD BANK EAST ASIA AND PACIFIC ECONOMIC UPDATE 2010, VOL. I
III. THE IMPERATIVE FOR RENEWED STRUCTURAL REFORMS

C A M BO D I APopulation 14.7 million
Population growth 1.7 percent
Surface area 181,040 sq. km.
Capital Phnom Penh
Source: World Development Indicators.
Cambodia’s economy suffered a serious setback in 2009. Real GDP is estimated to have contracted by 2 percent in 2009, driven by poor exports of garments (volumes down by 16 percent), smaller tourism receipts (down 2 percent with tourist air arrivals reduced by 10 percent), and weak infl ows of foreign direct investment (down by 35 percent). These negative factors were compounded by tighter credit and a severe slowdown in construction. The estimated contraction is consistent with results from a survey of 300 formal fi rms and 100 informal fi rms indicating a 30 percent decline in sales and profi ts in the summer of 2009 compared to the year before. In the formal sector, 4 percent of fi rms went bankrupt, with another 4 percent closing for seasonal or other reasons. New company registrations fell by 27 percent. In the midst of this contraction, agriculture continued to post a healthy growth of around 5 percent and an accommodative policy mix mitigated the slowdown.
However, signs emerged in late 2009 that winds were shifting. Recorded agribusiness exports more than doubled (essentially in milled rice and rubber exports), year-on-year air tourist arrivals stopped declining, imports of consumer goods stabilized, and both domestic credit and infl ows of foreign direct investment began rebounding. As a result, we project growth of 4.4 percent in 2010. Risks to the forecast include the fragility of the global recovery, the constraint capacity of the economy to diversify, and the limited scope for a stronger recovery in credit.
The current account defi cit is expected to fl uctuate within the overall macroeconomic framework. The defi cit fell to 11.5 percent of GDP in 2009, with the decline in exports to both the U.S. and EU markets more than offset by the drop of imports. With imports growing faster than exports in 2010, the
current account defi cit is projected to increase to 15.3 percent of GDP. Cambodia’s trading pattern remains vulnerable to external shocks as its market segment is narrow. More than 60 percent of exports go to a single country and more than two-thirds of imports come from 4 countries in East Asia. On the fi nancing side, FDI infl ows shrank by -35 percent, falling to US$515 million or 5.1 percent of GDP from US$795 million or 7.7 percent of GDP in 2008. While external aid was steady, other private fl ows rebounded after outfl ows of capital late 2008. As a result, gross reserves continued to accumulate albeit at a lower rate than previous years, expanding by 9.4 percent to US$2.4 billion, representing about 4 months of imports. The exchange rate has been relatively stable with year-on-year infl ation rate dropping from a two-digit rate last year to 5.3 percent by the end of 2009. The previous years’ depreciation in the real effective exchange rate was reversed in 2009.
Fiscal policy has supported the economy. The fi scal defi cit is expected to have widened to 6 percent of GDP in 2009 from 2.8 percent in 2008 and a budget target of 4.2 percent. The increase is due to a combination of tax incentives as a response to the crisis and weak economic activity, and higher expenditures refl ecting stimulus spending. In particular, the wage bill rose to 4.4 percent of GDP in 2009 from 3.4 percent in 2008. Priority expenditures (rural development and social sectors essentially) rose from 3.3 percent of GDP in 2008 to 3.8 percent in 2009. The wider defi cit was fi nanced by a combination of a drawdown from the government cash reserve of as much as 1.6 percent of GDP and foreign grants. The 2010 budget seeks to withdraw partially the fi scal stimulus to ensure fi scal sustainability, by introducing a property tax and various enforcement measures and curbing expenditure growth, especially on the wage bill. Measures on public wages include cuts in some allowances for the military, tightening up of promotion and use of contractual staff in the civil side, and reform of salary supplements. This would bring the fi scal defi cit down to 5.2 percent of GDP, requiring only a small fi nancing from budget reserves. To improve budget performance and expenditure impact, the Public Financial Management Reform Program launched in 2004 has entered its second phase focusing on fi nancial transparency and accountability. The fi rst phase generated several results,
COUNTRY PAGES & KEY INDICATORS
COUNTRY PAGES & KEY INDICATORS 39
EMERGING STRONGER FROM THE CRISIS

including a greater use of the banking system (92 percent of tax revenue was collected through banking system in 2007, up from 2 percent in 2004, and 72.5 percent of payments to creditors and government staff were made through banking system in 2007 compared with 5 percent in 2004), timely cash releases from central government, elimination of arrears, dissemination of budget information, and approval of a new Law on Public Finance System.
Monetary policy was eased in 2009, but risks in the banking sector are on the minds of policymakers. Cambodia had limited direct exposure of its fi nancial sector to the world fi nancial markets. However the slowdown in economic activity, declining property values, and more limited access to FDI constrained credit growth. The central bank reduced reserve requirements from 16 percent to 12 percent and removed restrictions on credit ceiling to the real estate sector in January 2009. Nevertheless, the 12-month growth of credit to the private sector slowed from 55 percent at the end of 2008 to 6 percent at the end of 2009. To avoid liquidity shortages, commercial banks accumulated deposits, which rose to $3.3 billion by the end of 2009 from $2.5 billion a year earlier. This brought the lending-to-deposits-ratio down from 94 percent in the end of 2008 to 73 percent in the end of 2009 and the capital adequacy ratio up to 28 percent, well above the 15 percent requirement. Excess reserve holdings could pose macro-fi nancial risk if banks resume lending at a fast pace to reduce its high cost of holding large volume of deposits.
The downturn in the economy has had an important social impact. After the signifi cant distributional impact of the soaring food prices in 2008, the slowdown in 2009 had an impact on the vulnerable population. Only a fi fth of all households have a job in sectors directly affected by the crisis (garments, construction, and tourism). Urban households and richer households are more likely to be affected through these sectors, but the income impact is the greatest amongst poorer and rural households, for whom these jobs, if present, account for a far larger share of income. Early evidence suggests that a number of households had to resort to several jobs, often back in the agriculture sector, to mitigate the impact of lower incomes.
The government is updating its National Strategic Development Plan (NSDP) to extend it in line with the government electoral mandate. The updated plan will be adopted by June 2010, setting ambitious 2013 targets of attaining per capita GDP income of nearly $1,000, net primary school enrolment of 99 percent, and rural access to improved drinking water of 67 percent. Beyond macroeconomic management, the government is focusing on the lessons from the crisis. A social protection strategy is in the fi nal stages of preparation. An agreement has been signed to expand the Rural Development Bank’s fi nancial support to the rice sector. The Tourism Law was endorsed and visa waiver programs expanded. And trade facilitation is continuing with the expansion of the customs automation project.
40
WORLD BANK EAST ASIA AND PACIFIC ECONOMIC UPDATE 2010, VOL. I
COUNTRY PAGES & KEY INDICATORS

Cambodia: Key Indicators
2005 2006 2007 2008 2009e 2010fYear Year Year Year Year Year
Output, Employment and PricesReal GDP (% change y-y) 13.3 10.8 10.2 6.7 -2.0 4.4Industrial production index (2000=100) 192 227 246 256 230 237
(% change y-y) 12.7 18.3 8.4 4.1 -10.1 3.1Consumer price index (% change y-y) 8.4 4.2 14.0 12.5 5.3 5.0
Public SectorGovernment balance (% GDP) -2.5 -2.7 -2.9 -2.8 -6.0 -5.2
Foreign Trade, BOP and External DebtTrade balance (millions US$) -1,018 -1,078 -1,382 -1,801 -1,541 -2,284Exports of goods (millions US$) 2,910 3,693 4,089 4,708 3,907 4,103
(% change y-y) 12.4 26.9 10.7 15.2 -17.0 5.0Key export (% change y-y) 1/ 10.5 21.1 8.1 3.3 -16.0 2.0Imports of goods (millions US$) 3,928 4,771 5,471 6,509 5,448 6,387
(% change y-y) 20.1 21.5 14.7 19.0 -16.3 17.2Current account balance (millions US$) 2/ -606 -522 -705 -1733 -1,147 -1,700
(% GDP) -9.7 -7.1 -8.1 -16.8 -11.5 -15.3Foreign direct investment (millions US$) 375 475 866 795 515 725 External debt (millions US$) 3,155 3,318 3,537 3,892 3,170 3,531
(% GDP) 50.4 45.1 40.4 37.8 31.8 31.8Short-term debt (millions US$) 279 209 218 218 218 218Debt service ratio (% exports of g&s) 1.8 1.4 1.0 1.0 1.3 1.5Foreign exchange reserves, gross (millions US$) 915 1,097 1,616 2,164 2,367 2,722
(months of imports of g&s) 2.4 2.4 3.0 3.4 4.4 4.3
Financial MarketsDomestic credit (% change y-y) 22.6 35.7 70.7 51.1 19.9 20.0Short-term interest rate (% p.a.) 3/ 16.2 16.4 16.0 15.8 15.0 14.5Exchange rate (Riel/US$, eop) 4116 4061 4003 4081 4169 4100Real effective exchange rate (2000=100) 95.9 94.3 99.2 112.8 111.5 ..
(% change y-y) 4.9 -1.7 5.2 13.7 -1.2 ..
Memo: Nominal GDP (millions US$) 6,257 7,350 8,754 10,286 9,966 11,109
Source: National data sources and World Bank staff estimates.e = estimate 1/ Garments 3/ One-year US$ loansf = forecast 2/ Excludes official transfers
COUNTRY PAGES & KEY INDICATORS 41
EMERGING STRONGER FROM THE CRISIS

C H I N APopulation 1,325.6 million
Population growth 0.6 percent
Surface area 9,598,088 sq. km.
Capital Beijing
Source: World Development Indicators.
China’s economy has held up remarkably well during the global recession.25 GDP grew 8.7 percent in 2009, led by a massive investment-led stimulus that showed up partly as an increase in the offi cial fi scal defi cit from 0.4 percent of GDP in 2008 to 2.8 percent of GDP in 2009, but much more in a surge in bank lending by almost 30 percent of GDP.
Government-led investment was the key driver of growth for much of 2009, but real estate investment gained prominence more recently. All in all, investment rose about 18 percent in real terms in 2009, the fastest growth since 1993. Household consumption growth has remained solid throughout, largely because the labor market held up well. Overall employment and wage growth remained positive in the fi rst half of 2009 and picked up again around midyear.26
After a sharp fall early in 2009, exports recovered briskly and returned to the pre-crisis level by the end of 2009. Because of the steep initial fall, exports declined by around 10 percent in real terms in 2009 as a whole (Figure 1). Imports held up much better than exports, especially the non-processing imports used in the domestic economy. Because of the larger increase in imports, net external trade was a major drag on growth in 2009, subtracting 3.9 percentage points from GDP growth. The current account surplus declined from 9.4 percent of GDP in 2008 to 5.8 percent in 2009.
Real GDP growth is likely to remain strong this year, with the composition of growth set to shift markedly. The strong
25 For more detail on recent developments, the outlook, and policy issues in China, see the World Bank’s March 2010 “China Quarterly Update.”
26 Per capita rural wage income growth, which includes the impact of both wage and employment developments, dropped sharply to 7-8 percent year-on-year in the last quarter of 2008 and the fi rst quarter of 2009. As the economy picked up again, it recovered quickly, growing 13.5 percent year-on-year in the second half of 2009.
growth momentum carried into the fi rst months of 2010, with particularly strong exports, retail sales and industrial production. The World Bank projects real GDP growth of 9.5 percent for the year as a whole. Exports are on course to grow robustly as global demand recovers. Although imports should outpace exports somewhat, net external trade should add modestly to real GDP growth. Real investment growth, however, may be around half of the rate last year (Figure 2). In a heated housing market, real estate investment should grow strongly. But government-led investment, the key driver of growth in 2009, is bound to decelerate heavily.
In this scenario, the trade surplus may edge down in 2010 in U.S. dollar terms because of a projected decline in the terms of trade. The current account surplus may increase somewhat, again in U.S. dollar terms, mainly due to higher income on China’s foreign exchange reserves.
Infl ation has turned positive, but is likely to remain modest in 2010. Consumer prices picked up in the second half of 2009, predominantly because of higher food prices. Nonetheless, infl ation will likely remain modest, reaching 3.5-4 percent on average in 2010, as global price pressures remain subdued, China-specifi c factors behind food price increases abate, and the authorities respond decisively to help curb core infl ation pressures.
In the heated real estate market, however, property prices are rising rapidly. Prices in the large cities were on average more than 30 percent higher than a year ago in February, and further increases are in sight. This has triggered policy measures to expand supply and curb speculation, although the government is cautious in its policy response and does not want to reduce real estate activity.
China needs a less accommodative macroeconomic policy stance than in 2009 to contain the emerging risks. The world economy is still subdued, with output below potential in many parts. However, China’s growth has been strong and, unlike most other countries, China’s overall output is close to potential. Thus, China needs a different macro stance than most other economies. Even though infl ation risks remain modest because of the global context, the macro stance needs
42
WORLD BANK EAST ASIA AND PACIFIC ECONOMIC UPDATE 2010, VOL. I
COUNTRY PAGES & KEY INDICATORS

to be noticeably tighter than in 2009 to manage infl ation expectations and contain the risks of a property bubble and strained local government fi nances.
● The budget presented to the National People’s Congress (NPC) rightly implies a broadly neutral fi scal stance. The 2010 defi cit is now targeted to remain little changed compared to 2009. However, there are still uncertainties about the world economy and it is important to have fl exibility in implementation. That means contingency plans and, equally importantly, room for automatic stabilizers to work.
● Monetary policy needs to be tighter than last year and the case for exchange rate fl exibility and more monetary independence from the U.S. is getting stronger. Strengthening the exchange rate can help reduce infl ationary pressures and rebalance the economy. The case for a larger role for interest rates in monetary policy is strong. If policymakers remain concerned about interest rate sensitive capital fl ows, more exchange rate fl exibility would help.
● Ensuring fi nancial stability includes mitigating the risk of a property price bubble and ensuring the sustainability of local government fi nances. With regard to the property market, stability calls for an appropriate macro stance and improving the functioning of markets. Concerns about the affordability of housing for lower income people would be best addressed by a long term government support framework. The central authorities have rightly increased
vigilance over lending by local government investment platforms. Given China’s solid macroeconomic position, the local fi nance problems are unlikely to cause systemic stress. But the fl ow of new lending to the platforms needs to be contained and local government revenues need to become less dependent on land transaction revenues.
In the presentations to the NPC, the government emphasized the need for structural reforms. As China is preparing for the 12th fi ve-year plan, the key overall objectives are making further progress in “rebalancing” the economy, enhancing effi ciency gains, moving to a more sustainable spatial transformation of economic activity and employment, further changing the role of the state in the economy, and taking account of China’s interaction with the rest of the world.
Figure 1. Exports have recovered after a steep fall
Index, constant prices (October 2008 = 100)
Sources: CEIC, Central Plan Bureau, and staff estimates.
Figure 2. The composition of growth is likely to change substantially this yearContribution to growth (real, percent yoy)
Sources: CEIC and World Bank staff estimates.
COUNTRY PAGES & KEY INDICATORS 43
EMERGING STRONGER FROM THE CRISIS

China: Key Indicators
2006 2007 2008 2009 2010f 2009 2009 2010Year Year Year Year Year Q1 Q2 Q3 Q4 Nov Dec Jan Feb
Output, Employment and PricesReal GDP (% change y-y) 11.6 13.0 9.6 8.7 9.5 6.2 7.9 9.1 10.7 .. .. .. ..Industrial production index /1 .. .. .. .. .. .. .. .. .. .. .. .. ..
(% change y-y) 12.9 14.9 9.3 10.3 .. 5.3 9.0 12.3 17.9 19.2 18.5 20.7 20.7Unemployment (%) 2/ 4.1 4.0 4.2 4.3 4.5 4.3 4.3 4.3 4.3 .. .. .. ..Real wages (% change y-y) 12.7 13.3 10.7 .. .. .. .. .. .. .. .. .. ..Consumer price index (% change y-y) 1.5 4.8 5.9 -0.7 3.7 -4.6 -7.2 -7.7 -2.1 0.6 1.9 1.5 2.7
Public SectorGovernment balance (% GDP) -1.0 0.6 -0.4 -2.2 -3.5 .. .. .. .. .. .. .. ..Domestic public sector debt (% GDP) /3 16.2 19.6 17.0 18.0 19.1 .. .. .. .. .. .. .. ..
Foreign Trade, BOP and External DebtTrade balance (billions US$) 177.5 262.0 297.3 198.2 210.2 62.5 34.9 39.3 61.5 19.1 18.4 14.2 7.6Exports of goods (billions US$) 969.3 1218.3 1429.2 1202.0 1378.7 245.6 276.2 325.1 355.1 113.7 130.7 109.5 94.5
(% change y-y) 4/ 27.2 25.7 17.3 -15.9 14.7 -19.7 -23.4 -20.3 0.2 -1.2 17.6 21.0 45.7Key export (% change y-y) 5/ 28.5 26.2 16.8 -15.7 .. -19.7 -23.0 -20.1 0.2 -1.3 17.8 20.4 46.4Imports of goods (billions US$) 791.8 956.3 1131.8 1003.9 1168.5 183.1 241.3 285.8 293.6 94.6 112.3 95.3 86.9
(% change y-y) 4/ 19.9 20.8 18.4 -11.3 16.4 -30.8 -20.2 -12.0 22.3 26.3 55.6 85.6 44.7Current account balance (billions US$) 253.3 371.8 426.1 284.1 304.0 .. .. .. .. .. .. .. ..
(% GDP) 9.2 10.3 9.3 5.8 5.5 .. .. .. .. .. .. .. ..Foreign direct investment (billions US$) /6 72.7 83.5 108.3 90.0 .. 42.7 104.7 168.0 238.8 84.3 145.7 97.5 70.7External debt (billions US$) 323.0 373.6 374.7 .. .. .. .. .. .. .. .. .. ..
(% GDP) 11.7 10.4 8.2 .. .. .. .. .. .. .. .. .. ..Short-term debt (billions US$) 183.6 220.1 210.8 .. .. .. .. .. .. .. .. .. ..Debt service ratio (% exports of g&s) 2.1 2.0 1.8 .. .. .. .. .. .. .. .. .. ..Foreign exchange reserves, gross (billions US$) 1074.0 1534.7 1952.5 2405.7 2818.0 1960.3 2138.2 2279.2 2405.8 2395.4 2405.8 .. ..
(months of imports of g&s) 16.3 19.3 20.7 28.8 28.9 32.1 26.6 23.9 24.6 2.1 1.8 .. ..
Financial MarketsDomestic credit (% change y-y) 15.7 16.1 15.9 31.7 .. 29.8 34.4 34.2 31.7 33.8 31.7 29.3 27.2Short-term interest rate (% p.a.) 7/ 3.3 3.3 2.8 2.8 .. 2.8 2.8 2.8 2.8 2.8 2.8 2.8 2.8Exchange rate (RMB/US$, eop) 7.82 7.37 6.84 6.83 .. 6.83 6.83 6.83 6.83 6.83 6.83 6.83 6.83Real effective exchange rate (2000=100) 102.2 103.6 118.1 111.7 .. 124.7 116.4 116.9 115.1 113.4 115.1 113.8 118.4
(% change y-y) -1.8 1.3 13.9 -5.4 .. 15.3 5.7 -1.3 -5.0 -8.4 -5.4 -5.7 -6.9Stock market index (Dec. 19, 1990=100)/8 2675 5262 1821 3277 .. 2373 2959 2779 3277 3195 3277 2989 3052
Memo: Nominal GDP (billions US$) 2,764.8 3,607.8 4,589.7 4,912.1 .. .. .. .. .. .. .. .. ..
Source: National data sources.f = forecast1/ Annual data are not comparable with the quarterly and monthly data. Annual data
cover all industrial enterprises while the quarterly and monthly ones only refer to those enterprises with sales value above Rmb5 millions.
2/ Official urban unemployment only, not including laid-off workers3/ Includes treasury bond, policy financial bond and other financial bond (end-period
outstanding)
4/ Nominal growth rate5/ Manufactured exports6/ Gross FDI utilized7/ Central Bank loans to financial institutions, less than 20 days8/ Shanghai Stock Exchange A-Share Price Composite
44
WORLD BANK EAST ASIA AND PACIFIC ECONOMIC UPDATE 2010, VOL. I
COUNTRY PAGES & KEY INDICATORS

F I J IPopulation 838,700
Population growth 0.5 percent
Surface area 18,270 sq. km.
Capital Suva
Source: World Development Indicators.
Fiji’s economy is expected to have contracted by 2.5 percent in 2009, representing its worst performance in more than a decade.27 As a result of the economic contraction, poverty is likely to have risen during 2009. Massive fl ooding in January damaged vital infrastructure and severely affected economic activity. Tourist arrivals began to recover in the second half of the year, limiting the full-year decline to about 8 percent. Flood damage to crops brought down production in the agriculture sector, while continued problems in Fiji’s sugar mills. Manufacturing output also fell, led by garment production. By contrast, output increased in the mining and construction sectors.
Economic recovery is expected in 2010, with growth of around 2 percent. Growth is expected to be driven by an expansion in tourism activity, supported by economic recovery in Fiji’s major tourist source countries. The government forecasts non-cane agriculture, forestry and non-sugar manufacturing to recover strongly in 2010, and gold production to continue to regain ground following its 2007/08 crash. Uncertainty in the political sphere is likely to continue to hamper growth by checking any expansion of private sector investment. The modest level of growth expected in 2010 is unlikely to be suffi cient to make signifi cant inroads into Fiji’s unemployment which is now above 9 percent. This growth outlook remains subject to substantial risks, largely due to Fiji’s considerable vulnerability to external shocks, both economic and environmental. This vulnerability has been illustrated yet again by the devastating cyclone damage suffered by the small islands of eastern Fiji in March 2010. The cost of restoring essential services and infrastructure,
27 The previously recorded large economic contraction in 2007 has now been revised to a small contraction, as a result of a rebasing exercise by the Fiji Islands Bureau of Statistics involving the reweighting of GDP components.
rebuilding homes, and rehabilitating the agricultural and fi sheries sectors in affected areas will be enormous.
In April 2009, the Reserve Bank devalued the Fiji dollar by 20 percent, successfully reversing the previous sharp decline in foreign exchange reserves. By the end of the year, foreign exchange reserves amounted to nearly $580 million, equivalent to some 3.75 months of imports. Both the trade defi cit and the current account defi cit narrowed during 2009, largely due to the depressive effect of the devaluation on imports. By September 2009, the trade defi cit was 22 percent of GDP (relative to 31 percent a year earlier) and the current account defi cit stood at 9 percent of GDP (from 18 percent the previous year). Export revenue fell signifi cantly in 2009, led by declines in sugar, garments and mineral water receipts. Sugar receipts were affected by both the decline in output and the decline in the EU sugar price (now 36 percent lower than in 2006). At the same time, a decline in imports of goods more than offset the drop in exports. Tourism receipts also fell signifi cantly.
Infl ationary pressures in Fiji were suffi ciently well contained in 2009 for the devaluation to result in a signifi cant competitiveness gain for the Fijian economy. Year-end infl ation for 2009 was around 6.75 percent, considerably lower than earlier forecast. Rises in prices for transport, consumer durables and to a lesser extent for food contributed to the increase in prices in 2009. While the outlook for infl ation in 2010 is subdued, considerable downside risks to this outlook are posed by potential rises in oil and other commodity prices as the global economy recovers. Nominal wages in the public sector, which dominates formal sector employment in Fiji, remained steady in 2009.
The fi scal defi cit is likely to have been limited to the 3 percent of GDP targeted under the budget. The outcome appears likely as somewhat capital spending than budgeted partly offset reduced revenues. Of the FJD 140 million revenue shortfall, two-thirds are due to lower-than-budgeted VAT and tariff revenues, and the remainder accounted for by lower income and corporate tax receipts. Operating expenditures are expected to have amounted to FJD 30 million lower than budgeted, but capital expenditures were much lower than
COUNTRY PAGES & KEY INDICATORS 45
EMERGING STRONGER FROM THE CRISIS

planned. The 2010 budget targets a defi cit of about 3.5 percent of GDP.
The fi scal defi cit in 2009 has increased Fiji’s public debt, which now stands at some 52 percent of GDP. The bulk of this debt is fi nanced domestically, with the Fiji National Provident Fund (FNPF) the major holder of government debt. While this arrangement protects Fiji from foreign exchange risks and global fi nancial market volatility, it leaves FNPF highly exposed to government debt. In addition to its uncomfortably large public debt, the government is conscious that its contingent liabilities from the government-guaranteed debts of state-owned enterprises pose a signifi cant risk to its debt sustainability. The government estimates that these liabilities currently stand at 15 percent of GDP.
Fiji faces a number of very diffi cult economic challenges in the year ahead. Foremost among them is the need for major structural reforms to improve the performance of the agricultural sector. There are three interrelated elements
of this problem that need to be addressed. Fiji’s sugar industry—the backbone of the rural economy—is vastly underperforming. Incentive structures in the fi eld, transport and milling segments all require an overhaul, to entice viable growers to remain in the industry and produce high quality cane, and to ensure that the management and operation of the transport system and mills improves dramatically. To spur agricultural diversifi cation, the problems of Fiji’s non-sugar agricultural sector must be addressed alongside the sugar reforms. Reforms are required to increase productivity at the farm level, improve quality throughout the production chain, and exploit market opportunities where remunerative returns can be obtained. The success of both sugar and non-sugar agricultural reforms will depend on the effective resolution of Fiji’s land problems. Forms of tenure must be developed that offer security to tenants, a reasonable return to landowners, and the potential for land access to serve as collateral for fi nance. Equally, institutions administering leases need to become effi cient and accountable, and regain the confi dence of all stakeholders in the land-lease system.
46
WORLD BANK EAST ASIA AND PACIFIC ECONOMIC UPDATE 2010, VOL. I
COUNTRY PAGES & KEY INDICATORS

Fiji: Key Indicators
2005 2006 2007 2008 2009e 2010fYear Year Year Year Year Year
Output, Employment and PricesGDP (% change y-y) 0.7 -0.4 -1.2 -0.1 -2.5 2.0Tourist arrivals (thousands) 545 549 540 585 539 ..
(% change y-y) 8.1 0.6 -1.6 8.4 -7.8 ..Unemployment rate (%) 7.7 8.3 8.6 7.7 9.4 ..Consumer price index (% change y-y) 2.4 2.5 4.3 7.8 6.8 2.0
Public SectorGovernment balance (% GDP) -3.4 -2.8 -1.7 -0.2 -3.0 -3.5Domestic public sector debt (% GDP) 44.5 45.4 42.6 42.8 44.5 44.9
Foreign Trade, BOP and External DebtTrade balance (millions US$) -720 -897 -842 -1,108 -714 -812Exports of goods (millions US$) 742 729 787 944 637 673
(% change y-y) 11.5 -1.8 8.0 19.9 -32.5 5.7Key export (% change y-y) 1/ 9.6 -6.1 -7.2 35.7 -44.2 -12.6Imports of goods (millions US$) 1,462 1,626 1,629 2,052 1,351 1,485
(% change y-y) 13.7 11.2 0.2 26.0 -34.2 9.9Current account balance millions US$) -298 -582 -463 -640 -297 -493
(% GDP) -9.9 -18.8 -13.6 -17.9 -9.5 -16.1Foreign direct investment (millions US$) 150 415 329 313 263 264Total external debt (millions US$) 285 445 461 449 378 517
(% GDP) 9.5 14.3 13.5 12.6 12.1 16.8Short-term debt (millions US$) 111 111 210 210 210 210Debt service ratio (% exports of g&s) 1.1 1.4 2.4 1.8 5.2 2.4Foreign exchange reserves, gross (millions US$) 2/ 315 460 551 381 600 561
(months of imports g&s) 1.9 2.9 2.6 2.6 3.8 3.5
Financial MarketsDomestic credit (% change y-y) 3/ 24.5 23.7 6.9 6.4 0.8 ..Short-term interest rate % p.a.) 2.3 4.3 4.3 n.i. 4.25 ..Exchange rate (FJ$/US$, eop) 1.7 1.7 1.5 1.8 2.1 2.1Real effective exchange rate (2000=100) 109.2 107.0 109.8 114.4 91.5 ..
(% change y-y) -0.5 -2.1 2.6 4.2 -20.0 ..
Memo: Nominal GDP (millions US$) 3,007 3,103 3,405 3,572 3,120 3,071
Sources: National data sources and World Bank staff estimates.e = estimate 2/ Includes foreign assets of non-bank financial institutions.f = forecast 3/ Domestic credit to the private sector.1/ Sugar.
COUNTRY PAGES & KEY INDICATORS 47
EMERGING STRONGER FROM THE CRISIS

I N D O N E S I APopulation 228.2 million
Population growth 1.2 percent
Surface area 1,904,570 sq. km.
Capital Jakarta
Source: World Development Indicators.
Indonesia has weathered relatively well the global economic and fi nancial crisis. Real GDP growth quickened in every quarter of 2009, reaching by the fourth quarter seasonally adjusted growth of 1.7 percent, higher than at any time over the last decade. For 2009 as a whole, real GDP growth amounted to 4.5 percent, signifi cantly higher than projected in early 2009.
The fi scal stimulus and recovery in demand abroad helped support growth during 2009. Throughout 2009 government consumption made signifi cant contribution to growth due to election-related spending in the fi rst half and stimulus-related expenditures thereafter. For 2009 as a whole, government consumption contributed around 1.25 percentage points to real GDP growth, the largest in two decades. As foreign demand began to recover later in the year, exports are coming back strongly, similarly to the rest of the region.
Other indicators suggest a more mixed picture for economic activity coming into 2010. Consumer confi dence has fallen for four out of the last fi ve months, and retail sales remain below the September 2009 highs. Motor vehicle and motor cycle sales rose in the fourth quarter after reaching a low earlier. Nonetheless, motorcycle sales are almost 6 percent down compared with 2008 as a whole.
Indonesia’s fi nancial markets have recovered robustly since early 2009, helping support economic activity. Equity prices rose in January, unlike in other countries in the region. The rupiah has also held up well against the dollar so far in 2010 after appreciating 22 percent from March through December 2009. Perhaps most signifi cant this year is the performance of Indonesia’s fi xed income market. Since December 2009, the yield curve on local currency bonds has continued to shift
down across all maturities, helping the government raise cheaper funds to fi nance the smaller fi scal defi cit. So far in 2010, the government has issued a third of the gross issuance plan for the year as a whole.
The fi nancial market stability also saw the balance of payments surplus increase slightly to $4 billion in the fourth quarter. Net of the SDR allocation of the equivalent of $2.7 billion in the third quarter, the surplus on the fi nancial account rose in the fourth quarter thanks to larger nonresident purchases of government bonds. Foreigners also purchased large amounts of corporate bonds, with infl ows of $1.2 billion in the fourth quarter, the highest level on record. As a result of balance of payments surplus, foreign exchange reserves rose to $69.6 billion by the end of January, almost $10 billion higher than the pre-crisis peak reached in July 2008.
The health of the banking sector appears to be robust, with strong earnings among the major banks and robust capital levels. Non-performing loans fell to 3.3 percent of total loans by December 2009 from 3.6 percent on average in 2008 and 8 percent in 2006. Despite the overall buoyancy in the banking sector, credit growth remained slow. For 2009 as a whole, credit growth slowed to 12 percent from 32 percent during 2008.
Infl ation is on the rise but well-below pre-crisis levels. The twelve-month increase in consumer prices reached 3.8 percent in February 2010, the highest in nine months. Almost all of the increase in infl ation in recent months was driven by higher food prices affected by negative weather conditions.
The government’s budget defi cit in 2009 was somewhat smaller than expected because of stronger revenues late in the year, despite somewhat larger expenditures. The defi cit outcome was 1.6 percent of GDP compared to the 2.4 percent targeted under the budget. Revenue collection increased signifi cantly in December 2009 after lagging collection during most of the year.
The authorities target a defi cit of 2.1 percent of GDP in 2010. Part of the increase in the defi cit relative to last year’s outcome refl ects tax cuts and other tax incentives together
48
WORLD BANK EAST ASIA AND PACIFIC ECONOMIC UPDATE 2010, VOL. I
COUNTRY PAGES & KEY INDICATORS
with higher spending for fuel subsidies, a result of the upward revision of oil prices in the budget assumptions. Tax policy reforms continue with their goal of both stimulating the economy while achieving higher tax payer compliance. The budget defi cit could end up being lower than envisioned by the government, if revenues come in stronger than projected and spending is not fully realized, as has happened in previous years.
Real GDP is projected to quicken to 5.6 percent in 2010 and 6.2 percent in 2011. Domestic demand will be the main driver of growth. With imports likely to grow at a higher rate than exports, external demand will contribute less to growth than in 2009. Private consumption expenditure is expected to accelerate, growing by around 5.3 percent in 2010 with the continued impact of the fi scal stimulus, moderate price growth and improving incomes. Investment growth is also expected to accelerate in 2010, as increasing commodity prices, external demand and lower bank lending rates, support investors’ plans.
COUNTRY PAGES & KEY INDICATORS 49
EMERGING STRONGER FROM THE CRISIS

Indonesia: Key Indicators
2006 2007 2008 2009 2010f 2009 2009 2010Year Year Year Year Year Q1 Q2 Q3 Q4 Nov Dec Jan Feb
Output, Employment and PricesReal GDP (% change y-y) 1/ 5.5 6.3 6.0 4.6 5.6 6.2 6.4 6.4 5.2 .. .. .. ..Industrial production index (2000=100) 116.9 123.4 127.2 128.8 132.7 123.4 128.1 129.5 124.1 131.7 132.2 123.4 127.2
(% change y-y) -1.6 5.6 3.0 1.3 3.0 2.5 2.4 -0.8 -2.8 -0.9 0.4 -6.6 3.0Unemployment (%) 10.3 9.1 8.4 8.1 .. .. .. .. .. .. .. ..Real wages (% change y-y) 1.6 1.7 -3.3 .. .. .. .. .. .. .. .. ..Consumer price index (% change y-y) 13.1 6.0 9.8 4.8 5.4 0.2 0.0 1.3 1.2 0.0 0.3 0.8 0.3
Public SectorGovernment balance (% GDP) -0.9 -1.3 -0.1 -1.6 -1.3 .. .. .. .. .. .. .. ..Domestic public sector debt (% GDP) 39.2 35.4 29.2 31.3 .. .. .. .. .. .. .. .. ..
Foreign Trade, BOP and External DebtTrade balance (billions US$) 19.8 20.9 9.9 21.0 14.0 4.1 5.1 5.0 6.9 2.0 3.0 2.0 ..Exports of goods (billions US$) 103.5 118.0 139.6 119.5 154.3 24.2 28.1 31.3 35.9 10.8 13.3 11.6 ..
(% change y-y) 19.0 14.0 18.3 -14.4 29.1 -92.4 22.1 -1.6 38.1 11.5 50.0 59.0 ..Key export (% change y-y) 2/ 14.6 14.5 23.1 -31.0 .. -54.7 -52.7 -33.9 74.8 ..Imports of goods (billions US$) 73.9 85.3 116.7 84.3 112.8 17.3 19.8 22.8 24.5 8.8 10.3 9.5 ..
(% change y-y) 6.3 15.4 36.9 -27.7 33.8 -35.7 -38.1 -29.5 -4.4 -2.9 33.0 44.6 ..Current account balance (billions US$) 10.9 10.5 0.1 10.6 2.7 2.5 2.5 2.2 3.4 .. .. .. ..
(% GDP) 3.0 2.4 0.0 1.9 0.4 2.2 1.9 1.5 2.2 .. .. .. ..Foreign direct investment (billions US$) 3/ 4.9 6.9 9.3 5.3 5.6 1.9 1.4 1.0 1.0 .. .. .. ..External debt (billions US$) 128.0 135.9 148.5 166.2 .. .. .. .. .. .. .. ..
(% GDP) 35.0 31.5 29.1 30 .. .. .. .. .. .. .. ..Foreign exchange reserves, gross (billions US$) 42.6 56.9 51.6 66.1 73.3 54.8 57.6 62.3 66.1 65.8 66.1 69.6 ..
(months of imports of g&s) 6.9 8.0 5.3 9.4 7.8 9.5 8.7 8.2 8.1 .. .. .. ..
Financial MarketsDomestic credit (% change y-y) 13.9 26.5 30.5 9.9 17.0 26.0 16.3 9.6 9.9 5.5 9.9 .. ..Short-term interest rate (% p.a.) 4/ 11.8 8.6 9.2 7.3 6.5 8.8 7.3 6.6 6.5 6.5 6.5 6.5 6.4Exchange rate (Rupiah/US$, ave) 9,141 9,163 9,756 10,356 9,400 11,636 10,426 9,887 9,475 9,480 9,400 9,365 ..Real effective exchange rate (2000=100) 129.5 136.8 148.8 148.9 149.8 134.9 148.5 153.3 159.0 157.9 161.0 161.7 ..
(% change y-y) 23.9 5.6 8.8 0.1 0.6 -5.5 -3.1 -5.2 18.6 16.5 18.6 18.0 ..Stock market index (Aug. 1988=100) 5/ 1442 2210 2087 2014 .. 1350 1888 2377 2439 2415 2534 2610 2549
Memo: Nominal GDP (billions US$) 365.3 431.1 507.5 544.0 694.8 113.3 131.4 146.0 153.2 .. .. .. ..
Source: National data sources.f = forecast 3/ Uses new classification starting in 19941/ Based on GDP 2000 base 4/ Policy rate: one-month Bank Indonesia Certificates2/ Crude oil exports 5/ Jakarta Composite
50
WORLD BANK EAST ASIA AND PACIFIC ECONOMIC UPDATE 2010, VOL. I
COUNTRY PAGES & KEY INDICATORS
L AO P D RPopulation 6.2 million
Population growth 1.8 percent
Surface area 236,800 sq. km.
Capital Vientiane
Source: World Development Indicators.
A large increase in government spending and sustained demand for Lao’s exports from countries in the region helped the economy weather the economic and fi nancial crisis relatively well. Limited integration with global fi nancial markets has also been a factor. Real GDP growth slowed by less than a percentage point to 6.7 percent in 2009, largely due to slower expansion in exports and lower foreign direct investment. The impact has been less signifi cant than initially anticipated because of favorable external factors including sustained demand for Lao’s exports of goods (minerals, electricity, and food processing) and services (tourism), lower import prices, and a domestic stimulus from increased public spending on consumption and investment.
Growth in 2010 is forecast at about 7.7 percent. The expansion is projected to be driven by strong growth in the natural resource sectors (mainly electricity exports from the Nam Thun 2 Dam, which started production from the start of 2010), steady growth in agriculture and a rebound in processing industry and tourism. The resource sectors are expected to contribute 3.6 percentage points to growth. In the medium term, the economic outlook remains favorable, with the expected benefi ts from sustained global commodity prices (mainly metals and agriculture), recovery in tourism, implementation of large hydropower projects under construction and in the pipeline, and a projected increase in demand for Lao main export products from neighboring countries (especially Thailand, China, and Vietnam) and the EU.
After a period of defl ation in 2009, infl ation is picking up again driven by prices for energy and food and increased liquidity in the economy. Consequently, prices rose 4.7 percent in the 12 months through February 2010 after falling 1.8 percent
in the 12 months through September 2009. Core infl ation has remained relatively stable in recent months at above 2 percent. Nevertheless, energy and food prices rose 7 percent in the 12 months through February 2010 after falling almost 2 percent in the 12 months through October 2009. For 2010 as a whole, infl ation is projected at 4.5 percent.
The fi scal defi cit in 2008/09 was smaller than the 6.8 percent projected earlier, but much wider from the year before. The gap relative to the earlier projection is due to delays in the implementation of some public investment projects and over-budgeting in recurrent spending. The substantial increase from a year earlier, by contrast, is due to lower revenue collection and a signifi cant rise in expenditures. The latter was driven by the government’s commitments to host the South-East Asian Games and efforts to support economic growth.
The government targets the defi cit to narrow to 3.5 percent of GDP in 2009/10. The projected decline refl ects improvements in tax revenue collection and the introduction of VAT in January 2010. The expiration of one-off spending related to the SEA games will also help, as will the phasing out of Bank of Lao PDR’s quasi-fi scal activities in FY2009/10. Although Lao PDR still has a high risk of debt distress, the debt profi le has improved in recent years, thanks to robust economic growth and currency appreciation.
In 2009, the trade balance improved as a result of declining imports and fairly stable exports. Commodity exports earnings are estimated to have grown 2.9 percent in 2009 due to a recent recovery of commodity prices (especially metal and agriculture), increased copper output and robust regional demand. Garment exports decreased only marginally. Trade is likely to improve in 2010, with exports projected to grow 33 percent, driven by electricity and minerals. Imports are likely to increase by less, or about 12 percent, driven by consumer goods, raw materials and capital investment imports. As a result, the current account defi cit is projected to further decline from 6.6 percent last year to only about 3 percent in 2010.
Credit growth has remained high, despite a recent slowdown. Credit growth was recorded at 89 percent y-o-y as of
COUNTRY PAGES & KEY INDICATORS 51
EMERGING STRONGER FROM THE CRISIS

September of 2009 (of which, credit to private sector increased by 76.3 percent). The Bank of Lao PDR’s direct lending to local infrastructure projects contributed as much as 30 percent to the total credit growth y-o-y as of September 2009. The central bank helped reduce credit growth in 2009 through a variety of measures, including by not providing direct fi nancing to any new projects and by strengthening bank credit supervision as a response to increasing concerns about macroeconomic and banking sector stability.
The government has continued to press on with structural reforms in different areas. In public fi nance management, the centralization of treasury operations in all provinces was completed in December 2009. In the fi nancial sector, the central bank is preparing an action plan following the approval of the Financial Sector Strategy while the implementation decree for the Commercial Bank Law was approved in early 2009. Progress towards WTO accession has accelerated, as evidenced by the preparation of the Decrees on Import and Export Management as well as Rules-of-Origin. All products under the sensitive list have been transferred to the inclusive list under the AFTA CEPT framework. In some areas, reform progress has been slower than initially envisioned, including in the implementation of the investment and mining laws, procurement and budgetary norms for the education, and reforms of the health sector.
Lao PDR: Key Indicators
2005 2006 2007 2008 2009e 2010fYear Year Year Year Year Year
Output, Employment and PricesReal GDP (% change y-y) 7.1 8.5 7.5 7.5 6.7 7.7Consumer price index (% change y-y) 7.2 6.8 4.5 7.6 0.1 4.5
Public Sector 1/Government balance (% GDP) 2/ -4.5 -3.8 -3.2 -1.8 -4.6 -3.5
Foreign Trade, BOP and External DebtTrade balance (millions US$) -515 -406 -713 -838 -603 -308Exports of goods (millions US$) 725 1,080 1,188 1,429 1,471 1,950
(% change y-y) 35.2 49.0 10.0 20.2 2.9 32.6Key export (% change y-y) 33.0 49.2 6.1 19.5 5.1 34.6Imports of goods (millions US$) 1,240 1,486 1,902 2,267 2,073 2,258
(% change y-y) 17.4 19.9 28.0 19.2 -8.5 8.9Current account balance (millions US$) -466 -329 -597 -696 -395 -198
(% GDP) -17.1 -9.3 -14.0 -12.6 -6.6 -2.9Foreign direct investment (millions US$) 298 502 826 914 702 675External debt (millions US$) 3,088 3,424 4,301 5,145 5,548 5,797
(% GDP) 113 97 101 93 93 84Short-term debt (millions US$) 109 .. .. .. .. …Debt service ratio (% exports of g&s) 20.9 5.7 12.5 10.3 11.1 19.5Foreign exchange reserves, gross (millions US$) 3/ 238 336 531 636 645 724
(months of imports of g&s) 3.1 2.5 3.1 3.2 3.5 3.6
Financial MarketsDomestic credit (% change y-y) 5.5 -6.0 16.0 77.4 125.5 ..Short-term interest rate (% p.a.) 4/ 15.0 14.5 13.0 10.5 7.0 7.0Exchange rate (Kip/US$, ave) 10635.8 10060.6 9603.0 8635.3 8498.4 8477.2Real effective exchange rate (2000=100) 103.2 106.2 105.3 124.7 116.6 ..
(% change y-y) 7.6 2.9 -0.8 18.4 -8.4 ....
Memo: Nominal GDP (millions US$) 2,730 3,520 4,277 5,545 5,987 6,922
Source: National data sources.f = forecast 3/ Excluding gold1/ Fiscal year basis 4/ Treasury bill rate2/ After grants
52
WORLD BANK EAST ASIA AND PACIFIC ECONOMIC UPDATE 2010, VOL. I
COUNTRY PAGES & KEY INDICATORS

M A L AY S I APopulation 27 million
Population growth 1.7 percent
Surface area 329,740 sq. km.
Capital Kuala Lumpur
Source: World Development Indicators.
The economy has been recovering from the deep contraction in early 2009. Real GDP growth rose in seasonally adjusted terms in each of the last three quarters, limiting the full-year decline in real GDP to 1.7 percent. Fixed investment, inventory restocking and, of late, exports, have been the main drivers of the recovery. At the sectoral level, manufacturing, which led the downturn, is making a strong contribution to growth. Although capacity utilization rates continue to rise, up from a low of 59 percent in early 2009 to 73 percent by the end of 2009, there remains considerable spare capacity.
The offi cial unemployment rate in the fourth quarter was 3.5 percent, up from 3.1 percent a year earlier. The number of retrenchments has continued to fall, however, reaching pre-crisis levels. The continued pickup in manufacturing suggests that unemployment is trending lower, but it take longer for pre-crisis levels to return.
Exports are recovering thanks to improved external demand and higher international commodity prices. Exports rose 37 percent year-on-year in January, with electrical and electronic products up 56 percent. Stronger demand from emerging East Asian economies has been particularly important, making the largest contribution to Malaysia’s export growth. Refl ecting the integrated supply chains of much of the export-oriented manufacturing sector, imports used for processing – intermediate goods – have been rising in line with exports.
Foreign investors have also returned. After the sharp rise in portfolio outfl ows in late 2008 in the heat of the global fi nancial crisis, outfl ows shifted to sizeable infl ows in the third and fourth quarters of 2009. Direct investment abroad also broadly returned to its previous trend. Overall, the
current account surplus remained an oversized at 16.7 percent of GDP in 2009.
Infl ation has been modest at about 1 percent year-on-year in late 2009 and early 2010, refl ecting higher prices for food and services. The recent increase in consumer prices follows seven months of month-on-month declines during September 2008 and April 2009 (except February).
The fi nancial sector remains strong. Non-performing loans amount to 1.9 percent of the total, but there may be lags in the realization of any losses from the downturn. Capital adequacy ratio remains little changed at about 14.6 percent. And bank profi tability appeared to start improving in the third quarter of 2009 after a long decline since early 2008. Bank lending is still largely concentrated on households, which remain in good fi nancial health with moderate indebtedness. Lending activity is picking up, with credits to companies rising 20 percent year-on-year in the fourth quarter.
A much improved economic outlook led the central bank to increase its key policy rate by 25 basis points in early March to 2.25 percent after keeping rates unchanged since February 2009. The move was the second increase in rates in the region after the economic and fi nancial crisis, following Vietnam.
Preliminary data indicates that the federal government defi cit rose to about 7 percent of GDP in 2009 from 4.8 percent in 2008. The increase was due to lower revenues in line with the weaker activity and the stimulus spending. As of late February, about 94 percent of the fi rst stimulus package targeted for 2009 (RM 7 billion) and half of the second planned for 2009-2010 (15 billion) have been spent. Federal government debt, nearly all domestic, rose to 54 percent of GDP at end-2009 from 41.5 percent a year earlier.
The Malaysian economy is expected to grow robustly by 5.7 percent in 2010, building on faster-than-expected growth in the fourth quarter of last year. The recovery will be driven largely by strong consumer spending and continued restocking. The contribution of net external demand will likely turn negative, as imports outpace exports given the stronger domestic demand. Unwinding of policy support
COUNTRY PAGES & KEY INDICATORS 53
EMERGING STRONGER FROM THE CRISIS

through fi scal consolidation effort and further rate hikes are not expected to derail the recovery, as withdrawal of stimulus will be gradual.
The growth outlook remains favorable for 2011 and 2012 with anticipated growth rates of 5.3 to 5.6 percent. The main near-term risk to the outlook is external and arises from the strength of the global recovery. The fundamental medium-term risk
arises from the structural reform momentum under the New Economic Model (NEM). The NEM is expected to revitalize growth by promoting private sector investment, liberalizing and deregulating the economy and modernizing the country’s social protection mechanisms. Provided reform momentum picks up as under the NEM, Malaysia’s competitiveness should be enhanced as will growth prospects.
54
WORLD BANK EAST ASIA AND PACIFIC ECONOMIC UPDATE 2010, VOL. I
COUNTRY PAGES & KEY INDICATORS
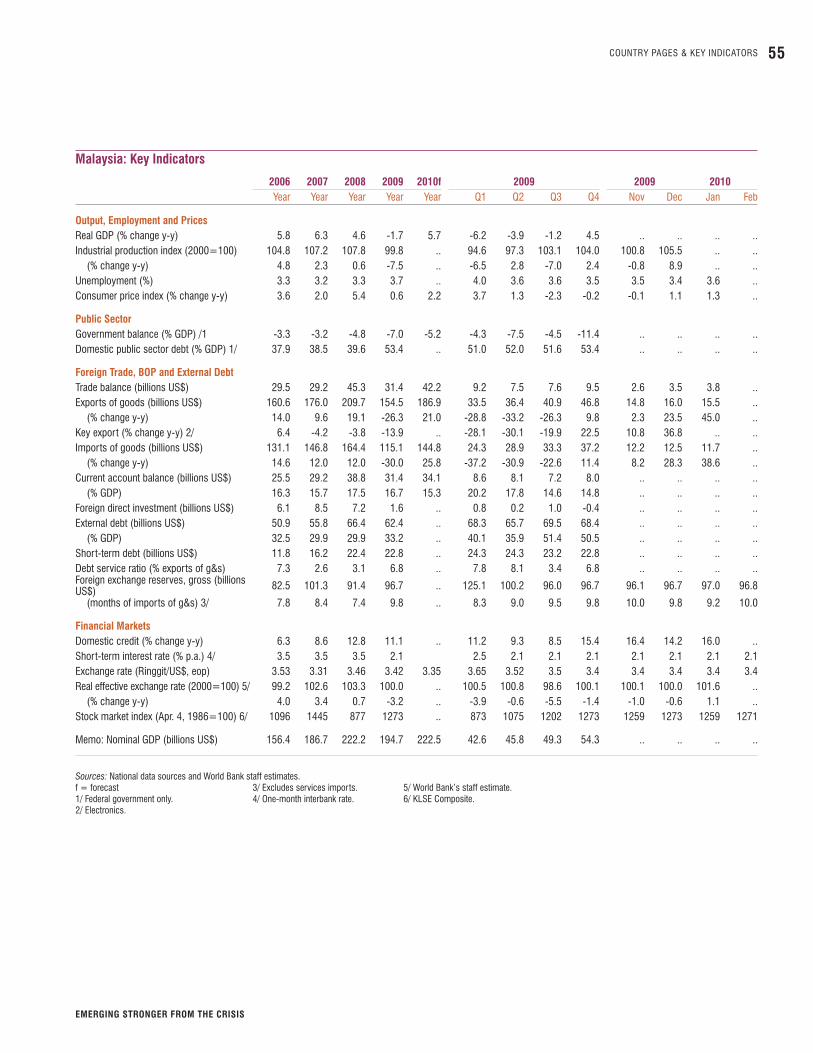
Malaysia: Key Indicators
2006 2007 2008 2009 2010f 2009 2009 2010Year Year Year Year Year Q1 Q2 Q3 Q4 Nov Dec Jan Feb
Output, Employment and PricesReal GDP (% change y-y) 5.8 6.3 4.6 -1.7 5.7 -6.2 -3.9 -1.2 4.5 .. .. .. ..Industrial production index (2000=100) 104.8 107.2 107.8 99.8 .. 94.6 97.3 103.1 104.0 100.8 105.5 .. ..
(% change y-y) 4.8 2.3 0.6 -7.5 .. -6.5 2.8 -7.0 2.4 -0.8 8.9 .. ..Unemployment (%) 3.3 3.2 3.3 3.7 .. 4.0 3.6 3.6 3.5 3.5 3.4 3.6 ..Consumer price index (% change y-y) 3.6 2.0 5.4 0.6 2.2 3.7 1.3 -2.3 -0.2 -0.1 1.1 1.3 ..
Public SectorGovernment balance (% GDP) /1 -3.3 -3.2 -4.8 -7.0 -5.2 -4.3 -7.5 -4.5 -11.4 .. .. .. ..Domestic public sector debt (% GDP) 1/ 37.9 38.5 39.6 53.4 .. 51.0 52.0 51.6 53.4 .. .. .. ..
Foreign Trade, BOP and External DebtTrade balance (billions US$) 29.5 29.2 45.3 31.4 42.2 9.2 7.5 7.6 9.5 2.6 3.5 3.8 ..Exports of goods (billions US$) 160.6 176.0 209.7 154.5 186.9 33.5 36.4 40.9 46.8 14.8 16.0 15.5 ..
(% change y-y) 14.0 9.6 19.1 -26.3 21.0 -28.8 -33.2 -26.3 9.8 2.3 23.5 45.0 ..Key export (% change y-y) 2/ 6.4 -4.2 -3.8 -13.9 .. -28.1 -30.1 -19.9 22.5 10.8 36.8 .. ..Imports of goods (billions US$) 131.1 146.8 164.4 115.1 144.8 24.3 28.9 33.3 37.2 12.2 12.5 11.7 ..
(% change y-y) 14.6 12.0 12.0 -30.0 25.8 -37.2 -30.9 -22.6 11.4 8.2 28.3 38.6 ..Current account balance (billions US$) 25.5 29.2 38.8 31.4 34.1 8.6 8.1 7.2 8.0 .. .. .. ..
(% GDP) 16.3 15.7 17.5 16.7 15.3 20.2 17.8 14.6 14.8 .. .. .. ..Foreign direct investment (billions US$) 6.1 8.5 7.2 1.6 .. 0.8 0.2 1.0 -0.4 .. .. .. ..External debt (billions US$) 50.9 55.8 66.4 62.4 .. 68.3 65.7 69.5 68.4 .. .. .. ..
(% GDP) 32.5 29.9 29.9 33.2 .. 40.1 35.9 51.4 50.5 .. .. .. ..Short-term debt (billions US$) 11.8 16.2 22.4 22.8 .. 24.3 24.3 23.2 22.8 .. .. .. ..Debt service ratio (% exports of g&s) 7.3 2.6 3.1 6.8 .. 7.8 8.1 3.4 6.8 .. .. .. ..Foreign exchange reserves, gross (billions US$) 82.5 101.3 91.4 96.7 .. 125.1 100.2 96.0 96.7 96.1 96.7 97.0 96.8
(months of imports of g&s) 3/ 7.8 8.4 7.4 9.8 .. 8.3 9.0 9.5 9.8 10.0 9.8 9.2 10.0
Financial MarketsDomestic credit (% change y-y) 6.3 8.6 12.8 11.1 .. 11.2 9.3 8.5 15.4 16.4 14.2 16.0 ..Short-term interest rate (% p.a.) 4/ 3.5 3.5 3.5 2.1 2.5 2.1 2.1 2.1 2.1 2.1 2.1 2.1Exchange rate (Ringgit/US$, eop) 3.53 3.31 3.46 3.42 3.35 3.65 3.52 3.5 3.4 3.4 3.4 3.4 3.4Real effective exchange rate (2000=100) 5/ 99.2 102.6 103.3 100.0 .. 100.5 100.8 98.6 100.1 100.1 100.0 101.6 ..
(% change y-y) 4.0 3.4 0.7 -3.2 .. -3.9 -0.6 -5.5 -1.4 -1.0 -0.6 1.1 ..Stock market index (Apr. 4, 1986=100) 6/ 1096 1445 877 1273 .. 873 1075 1202 1273 1259 1273 1259 1271
Memo: Nominal GDP (billions US$) 156.4 186.7 222.2 194.7 222.5 42.6 45.8 49.3 54.3 .. .. .. ..
Sources: National data sources and World Bank staff estimates.f = forecast 3/ Excludes services imports. 5/ World Bank’s staff estimate.1/ Federal government only. 4/ One-month interbank rate. 6/ KLSE Composite.2/ Electronics.
COUNTRY PAGES & KEY INDICATORS 55
EMERGING STRONGER FROM THE CRISIS

M O N G O L I APopulation 2.6 million
Population growth 0.9 percent
Surface area 1,566,500 sq. km.
Capital Ulaanbaatar
Source: World Development Indicators.
Collapsing mineral prices and a steep drop in external demand due to the global downturn affected Mongolia’s economy seriously, exposing underlying weaknesses in the economic and policy environment. A combination of expansive fi scal and monetary policies in the preceding boom years, a de facto fi xed exchange rate, and an overheated fi nancial sector meant that Mongolia’s economy was one of the hardest hit in both East Asia and among other copper producers. Real GDP contracted 1.6 percent in 2009 after growth of 8.9 percent in 2008. While the initial shock was from the fall in commodity prices and mining sector weakness, banking sector instability also led to a sharp tightening in credit, adding to the drag on economic activity. Two banks were taken into receivership during the course of 2009.
The social impact of the crisis was seen in sharp real wage declines, particularly in the informal sector. Meanwhile, labor force surveys placed the unemployment rate at close to 10 percent, well-above offi cial unemployment fi gures. Recent livestock losses due to the dzud have put further pressure on the livelihoods of the rural poor and have encouraged large movements from rural to urban areas further putting pressures on wages in informal labor markets.
Strong policy action by the government supported by programs with the IMF, the World Bank, the ADB, and Japan led to a rapid stabilization in the economic situation after mid-2009. An improvement in the external environment has also helped, as trade with China which absorbs nearly 70 percent of Mongolia’s exports rebounded and commodity prices recovered. The latest data show that the economy grew 3.9 percent year-on-year in the fi nal quarter of 2009, following three consecutive quarters of contraction. With exports falling at a slower pace than imports, the trade defi cit
narrowed. Fiscal retrenchment supported by a recovery in mining-related revenues resulted in defi cit of 5.4 percent of GDP in 2009 compared with a full-year target of 5.8 percent. The exchange rate has stabilized since April, allowing the central bank to rebuild foreign exchange reserves which currently stand close to record levels. Infl ation fell sharply in 2009, turning negative for a brief period, but is now in positive territory as the economy has bottomed out.
However, banking sector balance sheets deteriorated markedly during 2009, contributing to tightening of credit conditions. Non-performing loans currently amount to about one-fi fth of total outstanding loans, with a large exposure to the construction sector which suffered badly during the downturn. And, despite the cuts in policy rates by 400 basis points in three steps from May to September 2009, nominal interest rates on both local currency deposits and loans barely fell in 2009. On the deposit side, the search for funds by banks facing liquidity diffi culties is likely an important driver of the high rates while the lending rates likely refl ected concerns over credit quality, and high funding costs. There are however some tentative signs of a recovery in new loan issuance, in particular to the mining sector.
Looking forward, the economic outlook is very favorable, driven by the signing of the Oyu Tolgoi (OT) investment agreement in October 2009. Capital expenditures on infrastructure and investment relating to the development of the OT mines is expected to signifi cantly boost real GDP growth to about 7 percent during 2010-2012 and over 20 percent in the medium term. But, the upcoming mining boom will carry with it the attendant Dutch disease risks and worries about a return to the “profl igate populism” of the past. Other risks to the outlook relate to resolving the ongoing solvency problems in the banking sector and to near-term fi scal pressures before the sharp increases in mineral revenues associated with the OT project from 2014/15 onwards.
Accordingly, it remains crucial to continue the policy reforms started in 2009, including through early passage of the comprehensive social transfer and fi scal stability laws submitted to parliament. The adoption of the planned fi scal stability law, for instance, will help to move away from the
56
WORLD BANK EAST ASIA AND PACIFIC ECONOMIC UPDATE 2010, VOL. I
COUNTRY PAGES & KEY INDICATORS

boom and bust cycle of mineral prices while implementation of a targeted poverty benefi t should ensure that in the future the poor are protected from mining boom-and-busts in a fi scally sustainable manner. Other pressing reforms include improvements to the budget process and to the planning and management of public investment which will help minimize unproductive and ineffi cient government spending, and putting in place a framework to support future infrastructure investment. Similarly, addressing the banking sector problems in a decisive and transparent manner is urgently needed to prepare the sector for the upturn in economic activity, investment and capital infl ows in the years ahead. Finally, continued reforms in the mining sector will enhance incentives for new exploration and environmentally and socially sustainable development in a sector that is a key driver of medium to long term growth.
Mongolia: Key Indicators
2005 2006 2007 2008 2009e 2010fYear Year Year Year Year Year
Output, Employment and PricesReal GDP (% change y-y) 7.3 8.6 10.2 8.9 -1.6 7.3Industrial production index .. 100.0 110.4 113.4 109.7 ..
(% change y-y) .. .. 10.4 2.7 -3.3 ..Unemployment (%) 3.3 3.2 2.8 2.8 3.3 ..Consumer price index (% change y-y) 9.6 5.9 14.1 23.2 1.9 ..
Public SectorGovernment balance (% GDP) 2.6 3.3 2.8 -5.0 -5.4 ..Non-mineral government balance (% GDP) -1.3 -7.3 -13.4 -15.5 -12.9Domestic public sector debt (% GDP) 0.1 1.0 0.5 0.0 9.3 ..
Foreign Trade, BOP and External DebtTrade balance (millions US$) -100 136 -52 -613 -285 ..Exports of goods (millions US$) 1,066 1,544 1,951 2,535 1,562 ..
(% change y-y) 22.2 44.8 22.4 34.4 -38.4 ..Key export (% change y-y) 1/ 14.7 94.8 27.7 3.0 -39.9 ..Imports of goods (millions US$) 1,166 1,408 2,117 3,147 2,040 ..
(% change y-y) 20.0 20.8 42.5 70.8 -35.2 ..Current account balance (millions US$) 30 222 265 -722 -382 ..
(% GDP) 1.3 7.0 6.7 -13.9 -9.1 ..Foreign direct investment (millions US$) 258 290 360 586 527 ..External debt (millions US$) 1,360 1,414 1,529 1,601 2,101 ..
(% GDP) 59.7 44.3 38.9 33.1 50.0 ..Short-term debt (millions US$) 2/ 0 0 0 0 0 ..Debt service ratio (% exports of g&s) 3/ 2.7 2.3 2.0 2.0 3.7 ..Foreign exchange reserves, gross (millions US$) 333 718 1,001 657 1,145 ..
(month of imports of g&s) 2.5 4.6 5.0 2.1 5.1 ..
Financial MarketsDomestic credit (% change y-y) 18.8 -3.1 78.4 52.5 -0.8 ..Short-term interest rate (% p.a.) 4/ 3.7 5.1 8.4 9.8 .. ..Exchange rate (Tugrik/US$, eop) 1221.0 1165.0 1170.0 1267.5 1446.6 ..Real effective exchange rate (2000=100) 99.6 102.8 104.8 127.4 .. ..
(% change y-y) 6.1 3.2 1.9 21.5 .. ..Stock market index (2000=100) 5/ 204 382 2048 1182 .. ..
..Memo: Nominal GDP (millions US$) 2,307 3,156 3,930 5,258 4,203 ..
Source: National data sources.e = estimate 3/ On PPG debt.f = forecast 4/ Yield of 14-day bills until 2006 and of 7-day bills for 2007.1/ Copper concentrate. 5/ Top-20 index, eop, index=100 in Dec-2000.2/ Short-term PPG debt.
COUNTRY PAGES & KEY INDICATORS 57
EMERGING STRONGER FROM THE CRISIS
PA P UA N E W G U I N E APopulation 6.4 million
Population growth 2.0 percent
Surface area 462,840 sq. km.
Capital Port Moresby
Source: World Development Indicators.
Growth slowed only moderately last year, to 4.5 percent from 6.7 percent in 2008, aided in large part by the stimulus spending of mineral revenues saved over the commodity boom years. Prudent fi scal policies in 2004–08 and a strengthening of the terms of trade through mid-2008 kept Papua New Guinea strongly positioned for the global fi nancial crisis. The government drew down trust accounts by about 8 percent of GDP and spent largely on social and infrastructure development projects in 2009. The markedly increased fi scal defi cit was to help moderate the downturn in external demand, with mineral exports down 17 percent in 2009 to $3.5 billion.
The authorities kept monetary policy appropriately tight through the crisis. The Central Bank raised the kina facility rate to 8 percent in December 2008 and kept the rate unchanged through 2009. Credit to the private sector grew only 17.3 percent last year, a moderate increase considering the average 37 percent rise in 2007 and 2008. Broad money also followed a relatively more modest expansion path. More moderate credit expansion and domestic demand pressures, together with lower international energy prices, helped slow infl ation to 6.9 percent in 2009 from 10.7 percent in 2008.
Foreign exchange reserves rose to $2.6 billion by the end of the year. The collapse of global commodity prices in the second half of 2008 and the subsequent capital outfl ows had previously cut reserves from a high $2.7 billion in mid-2008 to less than $2 billion in early 2009. The new reserve levels, the equivalent of a year’s value of non-mineral imports, are deemed generally adequate to address balance of payments needs in the near term and should, in addition, give the central bank some leeway in supporting the kina. The kina
strengthened against the Australian dollar last year on an average annual basis.
The fl agship LNG project, approved last December with an investment of $18 billion, provides the country with the opportunity to materially raise growth in the long-term. Sponsored by a consortium led by ExxonMobil, the facility aims to exploit the country’s abundant natural gas resources, proven reserves of which are ranked 43rd in the world at 226.5 billion cubic meters. Estimates suggest that the project will yield 50 million barrels oil equivalent of natural gas and lead to $3 billion in average annual export receipts starting in 2013-14. By one consortium partner’s estimates, the project could turn PNG into the second largest LNG producer in East Asia, after Malaysia and past Indonesia, by 2017.
Growth is projected to rebound strongly this year, as the construction of the LNG facility begins and the project directly and indirectly stimulates domestic demand. Estimates suggest that real GDP growth could increase by 0.8 percentage points a year during the construction phase alone and then perhaps by 15-25 percent per year during the 30-year life of the project, doubling the country’s GDP in 3 to 5 years after the project becomes operational. Growth prospects for the year are also being buoyed by the $1.4 billion nickel-cobalt mining project, production from which is expected to commence at mid-year after commissioning in late 2009.
Monetary policy, therefore, has to focus on squarely on emerging infl ationary pressures in the economy. The construction of the LNG project will undoubtedly strain domestic capacity. The pressure on domestic demand coupled with the projected recovery in international commodity prices this year and appreciation of the kina against the Australian dollar last year will drive infl ation higher. The current account defi cit is also expected to deteriorate this year and over the next few years due to imports of investment goods related to the LNG project. However, FDI fi nancing of the project implies that the import requirements of the project will have little adverse impact on external stability.
More importantly, the government needs to strengthen its commitment to its Medium Term Fiscal Strategy (MTFS).
58
WORLD BANK EAST ASIA AND PACIFIC ECONOMIC UPDATE 2010, VOL. I
COUNTRY PAGES & KEY INDICATORS

The strategy aims to enhance the country’s macroeconomic stability by insulating the public budget from volatility in mineral revenues. It commits the government to restrain the non-mineral fi scal defi cit to 4 to 8 percent of GDP in 2008-12 and to restrict spending from accumulated mineral revenues to not more than 4 percent of GDP. Moreover, seven-tenths of such spending should be directed at public investment and three-tenths at debt reduction.
The government had prudently adhered to elements of its fi scal strategy years before the formal adoption of the fi scal framework in 2008. Windfall mineral revenues from the commodity boom years were saved in trust accounts that were built up to 14 percent of GDP by the end of 2008. More expensive public external debt was paid down to 13.2 percent of GDP in 2008 from a high 54.2 percent of GDP in 2002. And, the non mineral budget defi cit was kept within bounds, until 2009 when the global fi nancial crisis and the collapse in external demand warranted a fi scal response.
While a looser fi scal policy stance was a broadly appropriate during the crisis, breaches in MTFS commitments may risk undermining fi scal credibility. Stimulus spending in 2009 far exceeded the limit imposed by the MTFS on expenditures out of accumulated mineral revenues, sending the non mineral budget defi cit past its MTFS bounds to 11.4 percent of GDP. Concerns have also been raised about the quality of the stimulus spending as some involved village level projects for which project and fi nancial reporting have historically not been forthcoming. Moreover, the 2010 budget surprisingly lacks any provision for using the accumulated mineral revenues for debt reduction this year.
As the implementation of the LNG project will make attaining macroeconomic stability more diffi cult, it has become imperative that authorities exert tighter fi scal discipline in the years ahead. The 2010 budget still features a ramp-up in development spending that, when combined with sizable private investment for the LNG project, will be expansionary. Spending that is permitted from trust accounts that are outside the budget, at a time of strong private activity, will also strain overall stability. A sliding of the public investment project pipeline may be helpful as will a recalibration of the MTFS
spending thresholds to levels that are consistent with the LNG project induced up-cycle in the economy.
The launch of the LNG project also provides PNG with the opportunity to consider, at this time, other options to manage its resource wealth and to address its vulnerability to resource volatility shocks. The authorities may consider strengthening the counter-cyclical elements of their MTFS budget balance rules. They may also want to reform their trust accounts system, including fully integrating all trust accounts with the central government budget. Finally, PNG may consider establishing a Nonrenewable Resource Fund that, as a single savings and stabilization fund, will be fully integrated with the macro framework, budgetary system, and spending priorities and that will seek to maximize the long-run development impact of the country’s resource wealth.
COUNTRY PAGES & KEY INDICATORS 59
EMERGING STRONGER FROM THE CRISIS

Papua New Guinea: Key Indicators
2005 2006 2007 2008 2009e 2010fYear Year Year Year Year Year
Output, Employment and PricesReal GDP (% change y-y) 3.6 2.6 7.2 6.7 4.5 8.0Tourist arrivals (thousands) 69.3 77.7 104.1 115.0 123.0 ..
(% change y-y) 17.3 12.2 34.0 10.4 7.0 ..Consumer price index (% change y-y) 1.8 2.4 0.9 10.7 6.9 ..
Public SectorGovernment balance (% GDP) 2.7 6.4 6.5 2.5 -7.7 -1.2Domestic public sector debt (% GDP) 22.4 18.0 16.9 18.5 19.2 ..
Foreign Trade, BOP and External DebtTrade balance (millions US$) 816 1,401 1,419 1,603 676 ..Exports of goods (millions US$) 3,278 4,204 4,822 5,823 4,617 ..
(% change y-y) 28.3 28.2 14.7 20.8 -20.7 ..Key export (% change y-y) 1/ 6.0 9.3 25.6 26.3 15.3 ..Imports of goods (millions US$) 2,462 2,805 2,629 3,148 3,430 ..
(% change y-y) 37.2 13.9 -6.3 19.7 9.0 ..Current account balance (millions US$) 207 128 208 805 -541 -1,422
(% GDP) 4.2 2.3 3.3 10.0 -6.8 -16.1Foreign direct investment (millions US$) 67.9 196.2 462.7 32.0 767.0 ..External debt (millions US$) 2,021 2,192 1,978 2,066 2,127 ..
(% GDP) 41.2 39.1 31.2 25.8 26.9 ..Short-term debt (millions US$) 232 167 100 125 110 ..Debt service ratio (% exports of g&s) 9.7 8.0 8.3 5.1 6.3 ..Foreign exchange reserves, gross (millions US$) 765 1,427 2,083 1,986 2,569 ..
(months of imports of g&s) 2.4 3.8 4.2 4.4 5.6 ..
Financial MarketsDomestic credit (% change y-y) 23.7 38.2 34.4 39.4 17.3 ..Short-term interest rate (% p.a.) 3.8 3.7 4.4 5.9 7.2 ..Exchange rate (Kina/US$, eop) 3.1 3.0 2.8 2.7 2.7 ..Real effective exchange rate (2000=100) 100.6 100.9 96.5 109.4 118.0 ..
(% change y-y) 1.2 0.3 -4.4 13.4 7.8 ..
Memo: Nominal GDP (millions US$) 4,899 5,605 6,339 8,009 7,907 ..
Sources: National data sources, IMF, and World Bank staff estimates.e = estimate f = forecast 1/ Gold
60
WORLD BANK EAST ASIA AND PACIFIC ECONOMIC UPDATE 2010, VOL. I
COUNTRY PAGES & KEY INDICATORS

P H I L I P P I N E SPopulation 90.3 million
Population growth 1.8 percent
Surface area 300,000 sq. km.
Capital Manila
Source: World Development Indicators.
The economy recorded positive growth for the year as a whole. Real GDP grew 0.9 percent in 2009, but contracted by a similar amount on per capita basis. Private consumption—partly driven by strong remittance infl ows—and robust public spending have been the key growth drivers. Investment and net exports continue to be a drag on growth, but at a decelerating rate. On the supply side, the typhoons that generated massive fl oods in the national capital region and the Luzon Island in general in September and October 2009 profoundly impacted the agricultural sector in the fourth quarter of 2009. Industry is gradually recovering with business sentiment strong.
Amid some bright spots, social indicators remain weak, refl ecting the series of natural and man-made crises that have hit the country. Hunger incidence reached record highs in late 2009, with Manila particularly badly affected. This partly resulted from the long-lasting hardship that typhoon Ondoy brought to the poor in the capital region. Both unemployment and underemployment remain elevated and the labor force participation rate is increasing rapidly as households seek additional income given the pressure on real wages. Deployment of overseas foreign workers (OFW) remained strong despite rapidly rising global unemployment, refl ecting the Filipino workers’ attractiveness in the global labor market, as evident in the sea-faring industry (Figure 1).
Despite a series of diverse global shocks, the balance of payments remained strong throughout the past two years, thanks to strongly counter-cyclical infl ows of workers’ remittances. Thanks to the country’s robust balance of payments surpluses, the central bank has been able to accumulate substantial foreign exchange liquidity in 2009 (US$20 billion between net international reserves and the forward book of the central bank), providing ample support
to the country’s trade and external repayments needs. Trade recovered in late 2009 but exports remain at 2005 levels. As expected, remittances accelerated in the fourth quarter of 2009, in part due to transfers to typhoon-affected relatives. The countercyclical nature of real peso remittances has been remarkable in the past three years (Figure 2); as the economy recovers, the strength of these remittances is projected to wane in 2010.
The central bank has laid out a clear exit strategy from the extraordinary crisis-related liquidity-support and monetary easing and began a prudent and paced implementation. As concerns about the liquidity and stability of the fi nancial system have abated, and infl ation rising moderately, the bank signaled in January 2010 a measured implementation of its exit strategy by realigning its rediscounting facility rate of
Figure 1. Robust overseas deployment partly refl ects global staffi ng restructuring
Source: Philippines Overseas Employment Agency (POEA).
Figure 2. Remittances have been strongly countercyclical in real peso termsIndex, constant prices (October 2008 = 100)
Source: Bangko Sentral ng Pilipinas.
COUNTRY PAGES & KEY INDICATORS 61
EMERGING STRONGER FROM THE CRISIS

the overnight RRP. Subject to fulfi lling its infl ation target, the central bank is projected to pace the normalization of monetary policy to the strength of the economic recovery. Well-anchored infl ation expectations and a slow elimination of the positive output gap— projected to close only by 2013 —provide some leeway for the bank to pace the implementation of its exit strategy while continuing to support the recovery.
The largest fi scal easing in over two decades weakened the structural fi scal balance. A clear and credible exit strategy is crucial to enabling a measured unwinding of the fi scal stimulus. Thanks to previous fi scal consolidation efforts, for the fi rst time in recent economic downturns, the government was able to undertake a counter-cyclical fi scal policy. The 2.5 percent of GDP in fi scal easing was the largest since 1986 and clearly helped buffer the economy during the global recession. Nonetheless, it generated an overall fi scal defi cit of the central government of 4.1 percent of GDP,
mostly of a structural nature as permanent revenue-eroding and expenditure-increasing measures were introduced. To enable a measured unwinding of this fi scal expansion while protecting the nascent recovery, a detailed and credible medium-term fi scal plan that takes into account the country’s inclusive growth agenda is warranted.
Real GDP growth is projected to reach 3.5 percent in 2010 and accelerate moderately to 3.8 percent in 2011. The upward revision from our previous forecast refl ects a stronger global outlook, larger than expected OFW deployment in 2009 leading to an upward revision in our remittance projections, and a looser fi scal stance in 2010 than earlier anticipated. Thus far, the size and pace of the peak-to-trough and the projected recovery in 2010 is closely aligned with past Philippine recessions. However, unless reforms address long-standing growth bottlenecks, growth will be constrained.
62
WORLD BANK EAST ASIA AND PACIFIC ECONOMIC UPDATE 2010, VOL. I
COUNTRY PAGES & KEY INDICATORS

Philippines: Key Indicators
2006 2007 2008 2009 2010f 2009 2009 2010Year Year Year Year Year Q1 Q2 Q3 Q4 Nov Dec Jan Feb
Output, Employment and PricesReal GDP (% change y-y) 1/ 5.3 7.1 3.8 0.9 3.5 0.6 0.8 0.4 1.8 .. .. .. ..Industrial production index (1994 = 100) 86.9 84.6 84.8 73.9 .. 61.2 70.7 76.7 86.9 86.2 89.2 .. ..
(% change y-y) -8.5 -2.7 0.3 -12.9 .. -23.4 -18.0 -13.3 2.6 5.0 11.1 .. ..Unemployment (%) 2/ 8.0 7.3 7.4 7.5 .. 7.7 7.5 7.6 7.1 .. .. .. ..Nominal wages (% change y-y) 3/ 7.9 4.5 5.3 2.2 .. 5.5 1.8 0.0 0.0 0 0 0 0Real wages (% change y-y) 3/ 0.9 2.0 -1.6 0.6 .. 1.4 2.9 0.8 -2.3 -1.9 -3.8 -5.6 -5.9Consumer price index (% change y-y) 6.3 2.8 9.3 3.2 4.8 6.9 3.2 0.3 2.9 2.8 4.4 4.3 4.2
Public SectorGovernment balance (% GDP) 4/ -1.4 -1.7 -1.5 -4.1 -3.8 -7.1 -2.0 -4.7 -3.0 .. .. .. ..Domestic public sector debt (% GDP) 5/ 31.7 33.1 31.5 .. .. 33.4 34.9 33.4 .. .. .. .. ..
Foreign Trade, BOP and External DebtTrade balance (billions US$) 6/ -6.7 -8.4 -12.9 -8.6 -10.2 -2.1 -2.5 -1.9 .. .. .. .. ..Exports of goods (billions US$) 6/ 46.5 49.5 48.3 37.7 42.2 7.7 9.1 10.2 .. .. .. .. ..
(% change y-y) 15.6 6.4 -2.5 -21.9 12.0 -37.1 -29.4 -22.0 .. .. .. .. ..Key export (% change y-y) 7/ 7.5 5.3 -7.2 .. .. -41.9 -27.6 -17.7 .. .. .. .. ..Imports of goods (billions US$) 6/ 53.3 57.9 61.1 46.3 52.4 9.8 11.5 12.1 .. .. .. .. ..
(% change y-y) 10.9 8.7 5.6 -24.2 13.1 -34.7 -30.4 -29.8 .. .. .. .. ..Current account balance (billions US$) 8/ 5.3 7.1 3.9 8.8 6.1 2.0 2.1 2.0 .. .. .. .. ..
(% GDP) 4.5 4.9 2.3 5.5 3.5 5.6 5.5 5.2 .. .. .. .. ..Foreign direct investment (billions US$) 2.8 -0.6 1.1 1.3 2.0 0.0 0.8 0.2 .. .. .. .. ..External debt (billions US$) 9/ 53.4 54.9 53.9 .. .. 52.5 51.8 53.1 .. .. .. .. ..
(% GDP) 45.4 38.1 32.3 .. .. 32.6 32.2 33.0 .. .. .. .. ..Short-term debt (billions US$) 9/ 5.0 7.1 7.0 .. .. 6.5 5.8 5.1 .. .. .. .. ..Debt service ratio (% exports of g&s) 12.0 10.1 9.6 .. .. 10.3 10.6 10.7 .. .. .. .. ..Foreign exchange reserves, gross (billions US$) 9/ 23.0 33.8 37.6 44.2 46.5 39.5 39.5 42.5 44.2 44.2 44.2 45.6 ..
(months of imports of g&s) 10/ 5.7 6.0 9.0 8.7 8.3 6.7 7.3 8.6 9.0 9.0 9.0 9.3 ..
Financial MarketsDomestic credit (% change y-y) 11/ 7.2 5.2 16.8 7.4 .. 16.0 14.9 8.8 7.4 8.7 7.4 9.2 ..Short-term interest rate (% p.a.) 12/ 7.8 6.9 5.4 4.8 .. 5.2 4.5 4.1 4.3 4.4 4.2 .. ..Exchange rate (Peso/US$, ave) 51.3 46.1 44.5 47.6 .. 47.7 47.9 48.1 46.8 47.0 46.4 46.0 46.3Real effective exchange rate (2000=100) 111.1 121.7 128.6 125.2 .. 127.4 126.2 122.5 124.6 123.5 125.6 117.0 118.9
(% change y-y) 13/ 11.1 9.6 5.7 -2.6 .. -4.3 -2.7 -4.0 0.6 -2.1 0.6 -5.3 -3.6Stock market index (Jan. 2, 1985=100) 14/ 2412 3443 2587 2509 .. 1901 2280 2729 2986 3045 3053 3000 2953
Memo: Nominal GDP (billions US$) 117.5 144.0 166.9 161.0 175.1 36.4 38.8 38.8 47.2 .. .. .. ..
Source: National data sources.f = forecast1/ The GDP series has a break in 2000.2/ New methodology. Figures are based on the 2000 census.3/ Non-agriculture minimum wage, National Capital Region.4/ IMF GFS basis.5/ Total public sector domestic debt.6/ Balance-of-payments basis.
7/ Electronics.8/ Estimate.9/ Central bank figures. For the quarterly figures, % of annual GDP10/ Based on end-of-period gross international reserves. 11/ Based on Depository Corporations Survey12/ Interbank call rate.13/ World Bank staff estimate.14/ PSEi Composite, period average for annual figures.
COUNTRY PAGES & KEY INDICATORS 63
EMERGING STRONGER FROM THE CRISIS
S M A L L PAC I F I C I S L A N D S
The small states of Vanuatu, Samoa, Tonga, and Kiribati (“the Pacifi c Islands”) have very small populations—in some cases dispersed over large distances—and are far away from their nearest large markets. They are also highly vulnerable to external shocks, both economic and environmental. Their economic fortunes are substantially infl uenced by the particular shocks encountered in any given period, and the way they manage to respond to these. The Pacifi c Islands have been affected in different ways by the global recession, which followed hard on the heels of the global food and fuel crisis. Each has also recently suffered damage from natural disasters, whether relating to tropical cyclones, volcanic activity, climate change or earthquake activity—this last
causing a tsunami that resulted in especially severe damage in Samoa in late September 2009 (Box 1).
Remittances have been the key channel through which the global recession affected the Pacifi c Islands. Limited employment prospects at home have made remittance income from abroad especially important, with the share of foreign exchange earnings provided by remittances above 60 percent in Tonga, 50 percent in Samoa, and 15 percent in Kiribati. Economic contractions and rising unemployment in the developed countries where their diasporas work have threatened to translate into declines in remittances to the Pacifi c Islands. Worst hit thus far has been Tonga, with a decline in remittances in 2008/09 of nearly 15 percent from the peak infl ow in 2007/08. For Kiribati, remittances are
BOX 1: THE IMPACT OF THE TSUNAMI IN SAMOA
The tsunami that hit Samoa on September 29, 2009, was its worst natural disaster in at least half a century. Nearly 150 lives were lost and some 2.5 percent of the population were left homeless. The physical damage of the tsunami is expected to cost US$ 85 million to repair (around 14.25 percent of GDP), but further economic losses from the temporary absence of destroyed assets will take the cost much higher. Adding in the costs of maintaining basic social services and social safety nets for the affected population and investing in disaster risk reduction during the reconstruction process, the total cost of the tsunami is estimated to be a staggering 21 percent of GDP over the next three to four years.
The tsunami hit Samoa at a time when its government and people were already grappling with the impact of the global food and fuel crisis and the global recession. Samoa experienced an economic contraction of 5.5 percent of GDP in 2008/09, primarily due to the damage to its manufacturing sector caused by the global downturn. To provide a substantial fi scal stimulus to the economy, the Samoan government had budgeted for a defi cit of more than 10 percent of GDP in 2009/10. In the wake of the tsunami, the Samoan economy is expected to contract more sharply in 2009/10 than previously forecast, and the government has now budgeted for a defi cit of some 12 percent of GDP. As a result of the tsunami, it will be much harder for Samoa to recover from the global downturn, particularly given the loss of around one-quarter of the capacity of its vital tourism sector in some of Samoa’s most popular tourist destinations.
Just prior to these recent crises, poverty levels in Samoa were already rising as cash-earning opportunities for people in rural areas failed to keep pace with the expenditure required to acquire basic infrastructure services—such as transport, electricity, and communications—being extended throughout the country. At the time of the Household Income and Expenditure Survey in 2008, with the impact of rising food and fuel price only partially felt, nearly 27 percent of Samoans were living in poverty (compared to 23 percent in 2002). Subsequently, poverty is expected to have risen further, as the full effects of the food and fuel price crisis, the economic contraction consequent to the global recession, and the tsunami, which predominantly affected rural areas, took their toll.
At the same time as the government is working to restore economic growth in Samoa, it is acting to mitigate the impact of these crises on the poor. Not only was its immediate rehabilitation effort after the tsunami rapid and effective, it is committed to maintaining access to basic social services for those affected by the tsunami, abolishing school fees for primary education, and implementing an agricultural and fi sheries recovery program to restore livelihoods in this vital sector of the economy.
64
WORLD BANK EAST ASIA AND PACIFIC ECONOMIC UPDATE 2010, VOL. I
COUNTRY PAGES & KEY INDICATORS
expected to have declined in 2009 due to the contraction of the global shipping trade that employs Kiribati seafarers.
Tourism is another important channel through which the global recession has affected the Pacifi c Islands. In Vanuatu, earlier liberalisation of the air transport and communications sectors laid the groundwork for a continued expansion of its tourism industry, which was also boosted in 2009 by the diversion of tourists from fl ood-stricken Fiji. As Australians and New Zealanders cut back long-haul international travel in the economic downturn, Vanuatu appears to have benefi ted as a relatively proximate and inexpensive destination. In the year to August 2009, visitor arrivals by air rose 12.5 percent year-on-year and arrivals by sea rose over 43 percent. Gains from the diversion of tourists from Fiji in the fi rst half of 2009 also seem to have offset losses related to the global recession in Samoa and Tonga, with the latter boosted by Tongan nationals returning for the royal coronation in the second half of 2008. Samoa’s tourism sector is, however, expected to contract in 2009/10, due to the substantial tsunami damage to tourism infrastructure.
For Samoa, Tonga, and Vanuatu, the contraction in merchandise export opportunities associated with the global recession has had a negative impact on their GDP. In Samoa, the global downturn led to a major downsizing of its largest manufacturer, an auto-parts supplier, involving the loss of more than 7 percent of formal sector jobs. In Tonga and Vanuatu, the decline in prices for some of their major commodity exports slowed agricultural sector growth considerably, in Tonga’s case leading to an overall contraction in agricultural output. While the low volume of merchandise exports from Kiribati meant it was not similarly affected, it did suffer from the stagnation of its vital fi shing licence revenues, which were expected to provide around 35 percent of its foreign exchange earnings in 2009.
For Kiribati, the global fi nancial crisis that precipitated the global recession led to a signifi cant fall in the asset value of its Revenue Equalisation and Reserve Fund (RERF). With returns on assets also falling, the income Kiribati received from the RERF halved between 2008 and 2009. In 2008, Kiribati’s investment income had been suffi cient to fund some 40 percent of current government expenditure, and its
BOX 2: GROWTH AND STABILITY IN VANUATU
Vanuatu’s economy is now one of the fastest growing in the Pacifi c, a signifi cant turnaround from the previous era of underperformance. Sound macroeconomic management and a period of political stability from 2003 onwards have provided the right environment for growth. Agriculture, construction, tourism, infrastructure development, and foreign direct investment in real estate have all made important contributions to economic growth, which averaged 6.5 percent in the fi ve years 2004–2008. Vanuatu was affected by the global downturn in 2009, but its economy held up very well, with an estimated growth rate of nearly 4 percent—extraordinary by regional standards. The continued growth of the tourism industry and ongoing aid-funded infrastructure projects helped Vanuatu to weather the global storm.
The fi scal position of the government has been strong in recent years, with fi scal surpluses averaging just over 1 percent of GDP in the fi ve years 2004–2008. Revenue growth has been underpinned by the strength of economic activity, but Vanuatu has also taken important steps to widen its tax base and improve tax compliance. Its estimated fi scal surplus of 0.8 percent of GDP in 2009 is again extraordinary, by regional standards. Vanuatu has used its fi scal surpluses to retire debt, with public debt now around 17 percent of GDP from nearly 45 percent in 2002.
In the coming years, Vanuatu faces the challenge of maintaining political stability and ensuring that social stability is promoted through an equitable distribution of the returns from its economic success, not least in relation to surging real estate development. With the population growing at an annual rate of about 2.5 percent, Vanuatu needs to maintain the moderate-to-high levels of economic growth it has achieved in recent years, to keep per capita incomes rising. But even that is not enough to secure human development, as the progressive decline in Vanuatu’s primary school enrolment ratio during its recent period of economic growth has shown. The phasing-out of school fees over the years 2010–12 does, however, give an indication of the government’s willingness to address these problems.
COUNTRY PAGES & KEY INDICATORS 65
EMERGING STRONGER FROM THE CRISIS
decline augurs poorly for the future supply of public services – or alternatively for fi scal sustainability. The volatility of the Australian dollar (which Kiribati uses as its currency) makes budgeting in respect of investment income more diffi cult. Economic activity in Kiribati is highly sensitive to the level of government spending, given that the current expenditure budget is the equivalent of 55 percent of GDP.
Turning to infl ation, the price rises occurring in the Pacifi c Islands as a result of the global food and fuel crisis subsided during 2009. The dependence of domestic economic activity in the Pacifi c Islands on imports makes them particularly vulnerable to global price rises (merchandise imports are the equivalent of over 50 percent of GDP in Kiribati, for example, and over 40 percent of GDP in Samoa and Tonga). At its peak, infl ation was severe Samoa and Kiribati in late 2008 (18.5 percent), with lower peaks recorded in Tonga and Vanuatu in mid-2008 (12 and 6 percent, respectively). Eroding real incomes, this infl ation will have been particularly hard on the poorest segments of each population engaged in the cash economy – with those engaged in subsistence agriculture better placed to mitigate the damage.
With the exception of Vanuatu (Box 2), the recent economic developments in the Pacifi c Islands have had a detrimental impact on government fi nances and, in turn, on public debt levels. While most pronounced in Samoa, Tonga has also
moved from a period of fi scal surplus to defi cit. The economic slowdown in Tonga has combined with major reforms to the tax regime in recent years to substantially reduce government revenue, while a previously-agreed public sector wage rise has increased government expenditure in the current fi scal year. As the defi cit adds to public debt, Tonga faces a high risk of debt distress, mitigated only by the cushion that remittances are expected to continue to provide. In Kiribati, the recent fi nancing of sizeable budget defi cits has contributed to the decline in asset value of the RERF, a situation which cannot be sustained.
Looking ahead, the Pacifi c Islands face considerable challenges. Samoa and Tonga need to return to their previously-achieved fi scal responsibility targets, following the completion of the reconstruction process in Samoa and the resumption of normal revenue fl ows in Tonga. Vanuatu needs to continue to expand the productive capacity of its economy, in order to sustain its recent growth record and provide a foundation for social stability. And ways must be found to enable Kiribati to maintain the real per capita value of its RERF. Each faces the risk that the global economic rebound will falter, potentially affecting fl ows of remittances, tourism earnings and export receipts. Their external balances are also vulnerable to any return to rising oil prices. On the upside, improved labor market access abroad has the potential to bring signifi cant gains to each.
66
WORLD BANK EAST ASIA AND PACIFIC ECONOMIC UPDATE 2010, VOL. I
COUNTRY PAGES & KEY INDICATORS

S O L O M O N I S L A N D SPopulation 506,967
Population growth 2.3 percent
Surface area 28,900 sq. km.
Capital Honiara
Source: World Development Indicators.
Real GDP in the Solomon Islands contracted 2.3 percent in 2009, after growing 6.9 percent in 2008. The shift from growth to contraction refl ected unfavorable international conditions (with weak commodity prices affecting negatively log production and exports), and the impact of the fl oods on agricultural production. Reduced government spending given revenue constraints was also a factor. With a reduction in output and continuing population growth, poverty is likely to have increased. Infl ation fell to 6.8 percent in 2009, as prices for food and fuel eased. This ended a period of high infl ation that peaked at 17 percent in 2008. Infl ation is expected to reach 7 percent in 2010.
The government faced serious fi scal challenges during 2009. Fiscal revenues in 2009 were 13.5 percent below projections, largely refl ecting reduced duties on log exports, and the impacts of the economic slowdown on tax and tariff receipts. The government responded to falling revenues through a range of emergency expenditure and revenue measures, including across-the-board reservations on non-payroll expenditure by line ministries, delays to the implementation of development projects, increases in customs duties for luxury items, and the retrospective infl ation indexation of various fees and charges. Emergency cash management practices instituted by the Ministry of Finance and Treasury, while effective in averting a collapse in government fi nances, led to delays in payments to suppliers and disruption to programs.
The 2010 budget assumes revenues and spending will increase by about 20 percent each from last year’s outcome. Revenue projections are optimistic, as they assume robust recovery and improved tax compliance. In the absence of improved cash-fl ow forecasting and management, risks remain of further disruptive restraints on expenditures during 2010 if revenue
projections are not realized. Fiscal constraints are likely to be eased by planned donor support, involving contributions from the European Commission of €15.2 million. These contributions have not been included in current revenue forecasts.
During 2009, the Solomon Islands reduced its external debt to around 25 percent of GDP. Under the “Honiara Club Agreement”, under which the Solomon Islands was provided debt rescheduling and relief by a group of major creditors, the government is expected to refrain from new external borrowing and pursue grant fi nancing until the country is at a low level of debt distress as defi ned under the joint World Bank-IMF Debt Sustainability Framework. The Solomon Islands remains at moderate risk of debt distress, given uncertain growth prospects, and its current policy is to avoid contracting any new public debt. In the medium- to long-term, debt sustainability will depend on the successful development of mining sector projects and the emergence of new sources of growth and exports.
Growth is expected to recover modestly to around 3.5 percent during 2010. Growth will be driven by rebounding demand abroad, especially in the Asia-Pacifi c Region, strengthening of commodity prices and demand, and new mining-related investment in relation to the Gold Ridge mine. Log prices, however, are expected to remain weak, dampening overall growth prospects. Medium-term growth prospects remain uncertain, given the current reliance on unsustainable log extraction and continuing uncertainty around major planned mining activities.
The current account is likely to come under pressure during 2010, given continued sluggish log exports and increased fuel imports. Imports for mining investment — while largely funded by infl ows of foreign direct investment or offi cial infl ows — will also widen the current account defi cit, which is expected to reach 18 percent of GDP in 2010. While foreign exchange reserves are currently at comfortable levels, these are expected to decline to just 1.2 months by the end of 2011. Over the medium-term, the current account and foreign exchange position are heavily dependent on successful
COUNTRY PAGES & KEY INDICATORS 67
EMERGING STRONGER FROM THE CRISIS
implementation of mining operations at Gold Ridge, and in Choiseul and Isabel.
The Solomon Islands face substantial structural challenges over the coming years due to the impending collapse of natural forest logging (which currently accounts for a large proportion of exports), government revenue, and foreign exchange receipts. The Solomon Islands government, in close coordination with donors, is taking steps to address these challenges through a reform program targeting improvements in strategic coordination of government and donor development investments, budget systems and processes, cash management, tax frameworks around natural
resource industries, and the business environment. Medium-term priorities for structural reform include improving access to international labor markets, maximizing local economic benefi ts of aid fl ows, and intensifying natural resource industries. Priorities also include improving economic infrastructure in productive centers, reducing unnecessary barriers to fl ows of people and goods within Solomon Islands, and pursuing options for increased regional and international integration. It will be important for the Solomon Islands to maintain the current reform momentum and aggregate fi scal control in the context of the forthcoming elections and a possible change of government during 2010.
68
WORLD BANK EAST ASIA AND PACIFIC ECONOMIC UPDATE 2010, VOL. I
COUNTRY PAGES & KEY INDICATORS
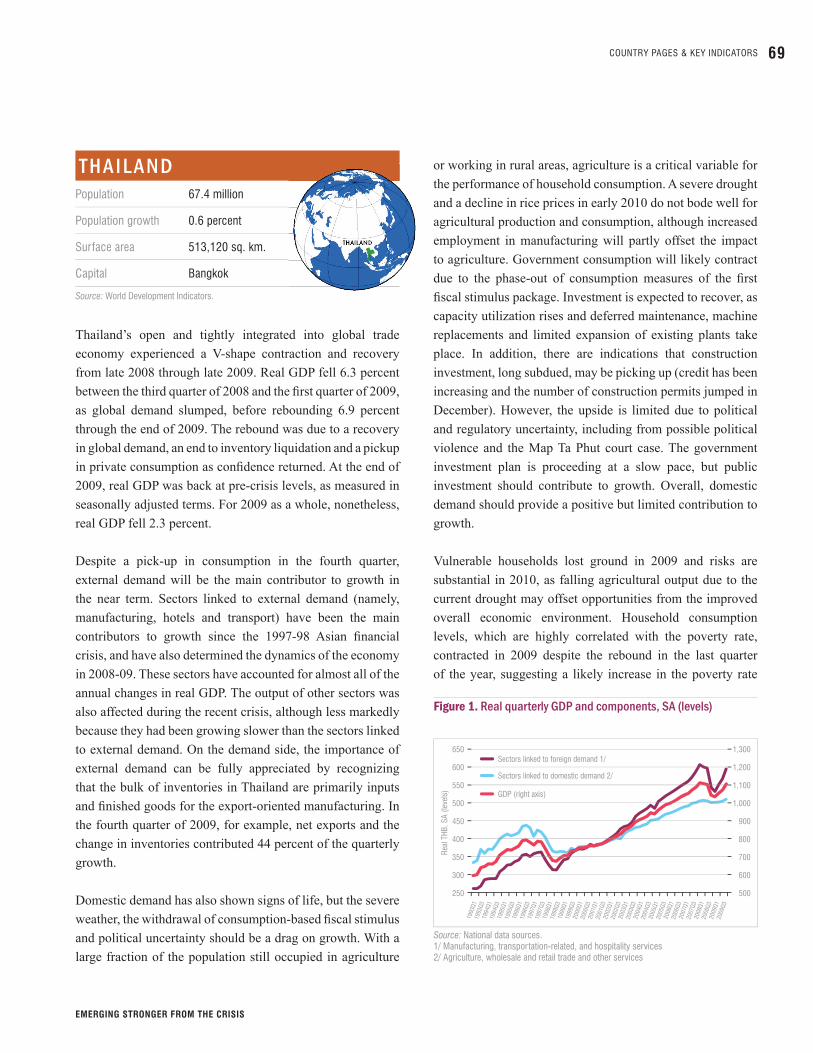
T H A I L A N DPopulation 67.4 million
Population growth 0.6 percent
Surface area 513,120 sq. km.
Capital Bangkok
Source: World Development Indicators.
Thailand’s open and tightly integrated into global trade economy experienced a V-shape contraction and recovery from late 2008 through late 2009. Real GDP fell 6.3 percent between the third quarter of 2008 and the fi rst quarter of 2009, as global demand slumped, before rebounding 6.9 percent through the end of 2009. The rebound was due to a recovery in global demand, an end to inventory liquidation and a pickup in private consumption as confi dence returned. At the end of 2009, real GDP was back at pre-crisis levels, as measured in seasonally adjusted terms. For 2009 as a whole, nonetheless, real GDP fell 2.3 percent.
Despite a pick-up in consumption in the fourth quarter, external demand will be the main contributor to growth in the near term. Sectors linked to external demand (namely, manufacturing, hotels and transport) have been the main contributors to growth since the 1997-98 Asian fi nancial crisis, and have also determined the dynamics of the economy in 2008-09. These sectors have accounted for almost all of the annual changes in real GDP. The output of other sectors was also affected during the recent crisis, although less markedly because they had been growing slower than the sectors linked to external demand. On the demand side, the importance of external demand can be fully appreciated by recognizing that the bulk of inventories in Thailand are primarily inputs and fi nished goods for the export-oriented manufacturing. In the fourth quarter of 2009, for example, net exports and the change in inventories contributed 44 percent of the quarterly growth.
Domestic demand has also shown signs of life, but the severe weather, the withdrawal of consumption-based fi scal stimulus and political uncertainty should be a drag on growth. With a large fraction of the population still occupied in agriculture
or working in rural areas, agriculture is a critical variable for the performance of household consumption. A severe drought and a decline in rice prices in early 2010 do not bode well for agricultural production and consumption, although increased employment in manufacturing will partly offset the impact to agriculture. Government consumption will likely contract due to the phase-out of consumption measures of the fi rst fi scal stimulus package. Investment is expected to recover, as capacity utilization rises and deferred maintenance, machine replacements and limited expansion of existing plants take place. In addition, there are indications that construction investment, long subdued, may be picking up (credit has been increasing and the number of construction permits jumped in December). However, the upside is limited due to political and regulatory uncertainty, including from possible political violence and the Map Ta Phut court case. The government investment plan is proceeding at a slow pace, but public investment should contribute to growth. Overall, domestic demand should provide a positive but limited contribution to growth.
Vulnerable households lost ground in 2009 and risks are substantial in 2010, as falling agricultural output due to the current drought may offset opportunities from the improved overall economic environment. Household consumption levels, which are highly correlated with the poverty rate, contracted in 2009 despite the rebound in the last quarter of the year, suggesting a likely increase in the poverty rate
Figure 1. Real quarterly GDP and components, SA (levels)
Source: National data sources.1/ Manufacturing, transportation-related, and hospitality services2/ Agriculture, wholesale and retail trade and other services
COUNTRY PAGES & KEY INDICATORS 69
EMERGING STRONGER FROM THE CRISIS

compared to 2008, especially when compounded by the loss in purchasing power from the food and fuel crisis of 2008. The outlook for 2010 is uncertain. Average wages are likely to increase, thanks to the reallocation of labor from agriculture to manufacturing. Although labor markets appear very tight, with unemployment below 1 percent, the data do not account for the large number of workers who moved to lower-productivity jobs in agriculture and informal services due to the crisis. Many of these workers are now returning to manufacturing, which offers higher wages than agriculture. The continuation of certain government policies, especially the pension to the elderly and free education should also support higher consumption levels for the poor.
The longer-term goal of reducing reliance on external demand will take time, especially given political uncertainties that hinder the government’s ability to implement not only its investment program but also needed structural reforms. Policies that could contribute to reducing Thailand’s dependence on foreign demand include a phased liberalization of the services sector, boosting transport infrastructure, a reform of educational curricula and improved access and quality of higher education to boost skills of the labor force, better integration of universities, fi rms and government, and improved social safety nets. While the Thai government is aware of the need for these reforms, political uncertainties have made it more challenging to pursue them.
All in all, a more favorable external environment should help boost real GDP growth to 6.2 percent in 2010. After this year,
slower growth in developed countries, emerging capacity constraints as capacity idled during the crisis is quickly put to use, and the weight of the ongoing political turmoil on new investment, should likely keep growth below Thailand’s historical average of 5.1 percent.
Thailand’s fi scal and fi nancial picture is solid. The fi scal defi cit is modest, public debt manageable, foreign exchange reserves much higher than before the crisis, and the fi nancial sector is sound and well regulated. The slower-than-expected implementation of the infrastructure-focused second stimulus package should help limit the fi scal defi cit to 2.2 percent in 2010, from 4.4 percent in 2009. Government debt is projected to decline to about 44 percent of GDP from 45.2 percent in September 2009. Foreign exchange reserves, already equivalent to 13 months’ import cover, should rise further as the current account remains in surplus.
Infl ation is likely to remain subdued given the slack in domestic demand, and policy rates will rise only modestly and gradually during 2010. Risks to the infl ation outlook include the tight labor markets, with fi rms reporting diffi culties in fi nding workers and increasing reliance on foreign workers. The central bank is likely to continue to limit exchange rate appreciation amid concerns that the country will lose competitiveness against China, given that the renminbi has been effectively re-pegged to the dollar since mid-2008. Concerns about exchange rate appreciation appear to have led the central bank to start liberalizing the fi nancial account of late, making it easier for residents to invest abroad.
70
WORLD BANK EAST ASIA AND PACIFIC ECONOMIC UPDATE 2010, VOL. I
COUNTRY PAGES & KEY INDICATORS

Thailand: Key Indicators
2006 2007 2008 2009 2010f 2009 2009 2010Year Year Year Year Year Q1 Q2 Q3 Q4 Nov Dec Jan Feb
Output, Employment and PricesReal GDP (% change y-y) 5.1 4.9 2.5 -2.3 6.2 -7.1 -4.9 -2.7 5.8 .. .. .. ..Industrial production index (2000=100) 167.0 180.7 190.2 180.4 .. 162.5 171.9 186.0 201.1 192.9 214.5 197.3 ..
(% change y-y) 7.3 8.2 5.3 -5.2 .. -18.5 -9.2 -5.0 14.0 9.2 35.9 28.6 ..Unemployment (%) 1.5 1.4 1.4 1.5 1.3 2.1 1.7 1.2 1.0 1.0 0.9 .. ..Real wages (% change y-y) 1/ 1.6 0.7 4.8 -1.6 .. -6.6 1.1 1.3 -2.2 .. .. .. ..Consumer price index (% change y-y) 4.6 2.2 5.5 -0.8 3.5 -0.2 -2.8 -2.2 1.9 1.9 3.5 4.1 3.7
Public SectorGovernment balance (% GDP) 2/ 0.7 -2.5 -1.9 -4.4 -2.2 -12.0 2.4 -4.9 -5.0 .. .. .. ..Domestic public sector debt (% GDP) 3/ 34.2 32.7 33.7 39.7 38.8 37.0 38.8 40.9 39.7 39.6 39.7 .. ..
Foreign Trade, BOP and External DebtTrade balance (billions US$) 1.0 12.8 0.1 19.4 10.8 7.7 3.9 5.1 2.7 1.1 -0.1 0.6 ..Exports of goods (billions US$) 127.9 151.3 175.2 150.9 168.2 33.3 34.0 40.7 42.9 13.7 14.5 13.6 ..
(% change y-y) 17.0 18.2 15.9 -13.9 11.5 -20.0 -26.1 -17.5 12.2 17.3 26.2 31.4 ..Key export (% change y-y) 4/ 25.2 16.4 7.6 -15.2 .. -31.3 -25.0 -13.6 12.8 12.2 41.5 66.6 ..Imports of goods (billions US$) 126.9 138.5 175.1 131.5 157.5 25.6 30.1 35.6 40.2 12.6 14.6 13.0 ..
(% change y-y) 7.9 9.1 26.5 -24.9 19.8 -37.6 -33.0 -28.3 1.4 8.5 31.9 56.9 ..Current account balance (billions US$) 2.3 15.7 1.6 20.3 11.6 9.5 2.8 3.7 4.3 1.3 0.8 2.0 ..
(% GDP) 1.1 6.3 0.6 7.7 3.8 15.4 4.4 5.6 5.9 .. .. .. ..Foreign direct investment (billions US$) 5/ 10.5 10.3 7.6 5.5 6.1 1.3 1.0 1.2 2.0 0.5 0.6 .. ..External debt (billions US$) 6/ 59.6 61.7 68.1 .. .. 62.4 63.1 66.3 .. .. .. .. ..
(% GDP) 28.8 24.8 25.0 .. .. 22.9 23.2 24.4 .. .. .. .. ..Short-term debt (billions US$) 6/ 18.6 21.6 24.2 .. .. 21.7 21.7 24.0 .. .. .. .. ..Debt service ratio (% exports of g&s) 11.4 11.8 7.1 .. .. 7.3 7.8 5.8 .. .. .. .. ..Foreign exchange reserves, gross (billions US$) 67.0 87.5 111.0 138.4 143.9 116.2 120.8 131.8 138.4 139.8 138.4 142.4 ..
(months of imports of g&s) 6.6 7.9 7.9 13.2 11.0 11.1 10.0 9.5 8.9 10.4 10.3 .. ..
Financial MarketsDomestic credit (% change y-y) 7/ 4.8 4.9 9.3 3.1 .. 6.4 2.9 0.4 3.1 1.8 3.1 3.3 ..Short-term interest rate (% p.a.) 8/ 6.3 3.7 3.4 1.4 1.4 1.7 1.3 1.3 1.3 1.3 1.3 1.3 1.3Exchange rate (Baht/US$, ave) 37.9 34.2 33.4 34.3 32.5 35.3 34.7 34.0 33.3 34.1 34.1 34.0 33.8Real effective exchange rate (2000=100) 9/ 105.3 112.2 112.8 108.8 .. 109.4 109.6 108.4 107.8 107.6 108.2 110.1 110.6
(% change y-y) 8.9 6.6 0.5 -3.6 .. -4.6 -5.1 -2.6 -1.9 -4.1 -0.4 0.4 -0.7Stock market index (Dec. 1996=100) 10/ 680 858 450 735 .. 432 597 717 735 689 735 697 721
Memo: Nominal GDP (billions US$) 207.0 249.0 272.0 263.7 305.9 62.0 63.4 65.8 72.4 .. .. .. ..
Sources: National data sources and World Bank staff estimates.
f = forecast1/ Average wage of employed person, using the National Statistical Office Labor Force
Survey, deflated by CPI inflation.2/ Cash balance of central government.3/ Includes domestic central government (CG) debt, domestic debt of non-financial
state enterprises, and the Financial institutions Development Fund (FIDF) debt. Series was revised by adding the Village Fund (VF) and the Energy Fund Public Organization (EFPO).
4/ Machinery and mechanical appliances.
5/ Non-bank FDI.6/ Bank of Thailand figures.7/ Private credits from domestically registered commercial banks, branches of foreign
banks, international banking facilities, finance companies, specialized banks, thrift and credit cooperatives, and money market mutual funds.
8/ One-day repurchase rate, average.9/ World Bank staff estimates.10/ Bangkok SET
COUNTRY PAGES & KEY INDICATORS 71
EMERGING STRONGER FROM THE CRISIS

T I M O R L E S T EPopulation 1.1 million
Population growth 3.2 percent
Surface area 14,870 sq. km.
Capital Dili
Source: World Development Indicators.
Economic activity in the past months has remained buoyant on the back of government spending and a relatively large international donor and security presence. Aside from the oil and gas sector, limited external links has meant that the country remains sheltered from the effects of the global economic crisis. Still, the impact of the crisis was felt through the drop in petroleum receipts by 28 percent in 2009 as export prices fell. Withdrawals from the Petroleum Fund (PF) for the fi rst time exceeded the Estimated Sustainable Income (ESI) in 2009. PF balances ($5.4 billion at the end of December 2009) continue to provide strong buffer against potential shocks. Key challenges include ensuring the quality of government spending, boosting private sector productivity and facilitating diversifi cation of the economy. There have been major strides in restoring security and stability, and sustained efforts should help to consolidate peace.
Estimates for economic growth in 2009 are not yet fi nal, but indications are that aggregate demand has remained strong on the back of government spending. In 2009, the government reallocated about $70 million from a power project due to implementation adjustments, to small and medium sized infrastructure works. The Referendum Package, as it is called, was designed to provide contracts for about 700 projects to domestic companies across the country. Imports of raw materials and capital goods declined slightly in the second half of 2009, but were about 5 percent higher in 2009 compared to 2008.
There are other signs that demand has remained robust. For example there has been a rapid rise in the number of registered vehicles (from about 5,700 in 2008 to 11,500 in 2009), with a noticeable increase in traffi c in Dili. The number of vehicles for commercial use in particular has more than doubled in
one year. There has been a concurrent drop in prices for transport and communications (8.7 percent) over the same period, also associated with falling fuel prices. The number of mobile phone subscribers has gone from 125,000 in 2008 to 351,000 in 2009. This follows Timor Telecom’s efforts to increase services and coverage, after indications that the government may consider breaking the monopoly. Electricity consumption has increased by about 50 percent from 2008 to 2009. There are preliminary indications that agricultural output has remained strong in 2009, but food imports also increased by nearly 30 percent.
Commercial credit to the private sector picked up slightly in the third quarter of 2009, rising to $111 million from $105 million in the second quarter. This was due to increased lending to the construction sector, most likely associated with the Referendum Package. But about 50 percent of total lending is to individuals. Despite rapidly rising deposits, which went from $248 million in the third quarter to $289 million at the end of the year, lending to the private sector remains stagnant. The private companies highlight access to fi nance as one of the key constraints to investment. The spread between lending and deposit rates remains high at about 10 percent, refl ecting private sector capacity constraints and associated risks.
Prices started to pick up again at the end of 2009, with headline infl ation at 1.5 percent for the last quarter. According to offi cial statistics, prices fell year-on-year in early 2009 due to the drop in commodity prices. But with growth recovering in the latter half of the year and the sharp depreciation of the exchange rate in the second half of 2009 (both in nominal and real terms), prices increases returned.
The trade defi cit—which does not refl ect petroleum receipts—fell slightly in the second half of the year. But with petroleum receipts large at about $1.7 billion for the year as a whole, the overall balance of payments remained strong. Tax and royalty receipts into the PF were about 28 percent lower in 2009 compared to 2008 due to lower prices. Interest earnings (net of management fees) for the year were about $182.9 million compared to $114.9 million in 2008. About $1 billion from the PF was placed under the management of the Bank for International Settlements last year, which has
72
WORLD BANK EAST ASIA AND PACIFIC ECONOMIC UPDATE 2010, VOL. I
COUNTRY PAGES & KEY INDICATORS

diversifi ed the PF portfolio to include Australian, Eurozone, UK, and Japanese money market instruments.
Fiscal policy over the last three years has been expansionary. Preliminary data shows that government spending in 2009 reached about $604 million (nearly 90 percent of budget), up from $552 million in 2008. PF withdrawals in 2009 were $512 million, exceeding the ESI by $104 million. Non-oil revenue receipts seem to have improved.
For 2010, planned spending is expected to be about $660 million. The government is looking to improve non-petroleum receipts through increased compliance. It has indicated its intention to moderate spending growth but also noted it might borrow during the course of 2010. It will be important to maintain spending on a smooth upward trend, to avoid risks to fi scal sustainability, particularly given the increase in non-discretionary spending such as wages and salaries.
There has been some progress on structural reforms. A key development has been the increased delegation of procurement authority to line ministries for contracts up to $1 million. This will require adequate oversight and audit capacity to ensure value for money. In February 2010, the Parliament swore in Timor-Leste’s fi rst Anti-Corruption Commissioner. A draft Transitional Land Law (Special Regime for Determination of Ownership of Immovable Property) was approved by the Council of Ministers in March 2010. This aims to establish a regime for identifying and regulating land ownership, which is critical given multiple claims to property deriving from previous legal regimes. To address access to fi nance, the government has set aside $8 million in the 2010 budget for the establishment of a Rural Bank.
Key challenges going forward include ensuring the quality of government spending and strengthening private sector productivity, competitiveness and diversifi cation. Rapidly rising spending inevitably raises issues about quality of spending. There are challenges about designing and costing projects, as well as internal controls and audit. The government is trying to address these through public fi nance management reforms. The rapid increase in spending has helped to address pressing short-term needs, which are
critical to longer term development. It has also stimulated growth in the economy. It will be important to continue to prioritize spending to avoid diminishing returns from fi scal expansion. This is also important to not distort private sector incentives, and to avoid sharp adjustments in an economy that is vulnerable to oil price volatility. Continued investments in skills development, critical infrastructure and structural reforms such as liberalization of telecommunications will be important to promoting competitiveness and private investment for diversifying sources of growth.
COUNTRY PAGES & KEY INDICATORS 73
EMERGING STRONGER FROM THE CRISIS

V I E T N A MPopulation 86.2 million
Population growth 1.2 percent
Surface area 329,310 sq.km.
Capital Hanoi
Source: World Development Indicators.
Vietnam navigated the global fi nancial crisis better than could have been anticipated, given the high ratio of exports to GDP and the overall openness of its economy. Real GDP grew by 5.3 percent in 2009, led by a surge in construction due to a large extent to the sizeable stimulus program set by the government between late 2008 and mid-2009. A large budget defi cit, rapid credit growth and moral suasion on state-owned enterprises resulted in a doubling of total investment in 2009, pushing up the investment rate to 42.8 percent of GDP. The state sector accounted for about a third of the total. The recovery has consolidated in recent months, with real GDP posting 6.9 percent growth in the last quarter of 2009 year-on-year, and growth of 6 percent is plausible for the fi rst quarter of 2010.
Reliance on domestic demand to support economic activity resulted in pressures on the balance of payments. At a fundamental level, the external position of Vietnam is sustainable. Exports decreased by 9.7 percent in 2009, the fi rst decline since the beginning of reforms two decades ago. Imports contracted by 14.7 percent, which brought the current account defi cit down to about 7.8 percent of GDP, compared to 11.9 percent in 2008. Infl ows of foreign direct investment are estimated to have declined by a relatively modest 13 percent in a diffi cult year. For 2009, the capital account surplus roughly offset the current account defi cit. However, unusually large errors and omissions item in the balance of payments by about 10 percent of GDP, and the dollar trading outside the dong band in parallel markets, indicate a lack of confi dence in the dong. Throughout 2009, households and domestic enterprises (including large state-owned economic groups) have been betting on a devaluation of the dong.
Meanwhile, infl ation shows sign of accelerating. Prices rose 6.5 percent in 2009 as a whole, down from 19.9 percent in 2008. However, on a monthly basis infl ation started accelerating in the last quarter of 2009. There is a strong seasonality in the months around the Lunar New Year, which makes it diffi cult to isolate a trend. However, higher international commodity prices, the devaluation of the dong, and the adjustment of energy prices to align them with international comparators are bound to result in higher infl ation rates. The infl ationary pressure is even more visible in asset markets, with the stock market index being on an upward trend for months in a row, and land prices escalating. These developments suggest that the limits of the expansionary policy stance adopted by government since 2008 are being reached. With the global economy doing substantially better now than it did in 2009, the time to gradually phase out Vietnam’s stimulus program is rapidly approaching.
In the last quarter of 2009 there was a gradual rebalancing of macroeconomic policy towards ensuring macroeconomic stability. The acceleration of infl ation, a spike in the domestic price of gold, and a widening gap between the parallel and the offi cial exchange rates, made it obvious that the expansionary stance was not sustainable for much longer. Excessively low interest rates had also made government bond issuances unattractive. In spite of a substantial increase in fast disbursing ODA, and the drawdown of government deposits in commercial banks, fi nancing the budget defi cit was becoming increasingly diffi cult. This policy rebalancing has continued well into 2010, and may be pursued further in the coming months. The speed at which this could occur will very much depend on the assessment of the current situation. There has been limited appetite to raise policy rates, but this pro-growth stance may be softened if new data on consumer and price data make it clear that infl ation is back and some turbulence could be expected in the coming months.
The new policy stance was refl ected in a lower target for credit growth in 2010 (25 percent, as opposed to an actual increase of 37.7 percent in 2009), the discontinuation of the short-term interest rate subsidy program, fi scal adjustment in the order of 2-3 percentage points of GDP, and two smaller devaluations of the dong, in November 2008 and February
74
WORLD BANK EAST ASIA AND PACIFIC ECONOMIC UPDATE 2010, VOL. I
COUNTRY PAGES & KEY INDICATORS

2009. The target for real GDP growth in 2010 is an easily attainable 6.5 percent. Keeping the infl ation rate below 7 percent, as requested by the National Assembly, will be more challenging. The tighter monetary stance brought the parallel exchange rate closer to the offi cial band, and led to a substantial but only temporary correction in the stock market. More recently, the government allowed credit institutions and borrowers to negotiate the terms of their lending, which amounts to the abolition of the lending cap on interest rates. This cap had been introduced during the over-heating phase of the economy, but in the current circumstances it squeezed the profi tability of commercial banks.
The balance of payments may continue to be a challenge for the authorities going in 2010, but in the wake of the Lunar New Year it is still diffi cult to infer any trend from the available data. While waiting for more clarity on the prices front, the government is taking steps towards strengthening the banking system. Minimum capital requirement should be met by end-2010, and plans to do so much be submitted before March 2010, and a framework to support the bankruptcy, merger and absorption of the banks that cannot be meet the new minimum requirements are being put in place. In early 2010, the Prime Minister instructed seven of the largest state-owned corporations to surrender the foreign exchange holdings to credit institutions. In turn, those credit institutions will ensure that the corporations have enough access to foreign exchange to settle their payments.
The government is expected to reduce the size of the budget defi cit gradually. The budget plan for 2010, which translates into an overall fi scal defi cit of about 6.2 percent of GDP, entails a substantial contraction compared with 2009, but still an expansionary stance compared with previous years. Vietnam’s debt is likely to stay sustainable if the current economic recovery continues and the authorities revert to a budget defi cit in the order of 3 to 4 percent, as had been the case in previous years. The government is expected to fi nance this defi cit with a combination of increased fast-disbursing ODA and bond issuance. A second international bond was issued, for $1 billion in January 2010. With a 10-year maturity and a 6.75 percent coupon rate, it was sold at discount to yield at 6.95 percent or 332.7 basis points over U.S. Treasury
bonds. The issuance was 2.4 times over-subscribed. While Vietnam’s return to international capital markets can be considered a success, the yield of the bond is about 100 basis points higher than for the recent bonds issued by Indonesia and the Philippines. In the recent past, the risk premia for these two countries have been higher than for Vietnam.
Steps have been taken to discourage speculation by Vietnamese investors. Gold trading fl oors will be closed by March 31, 2010. Gold speculation by local investors had led to worrying price spikes, affecting market sentiment. While trading in gold will not be forbidden, the lack of an easily observable price should reduce the volatility of expectations. But a tight credit policy will be necessary as well. Unless interest rates in dong are increased (and become roughly comparable to the infl ation rate), investors and exporters will be reluctant to drawdown their foreign currency holdings, which means that the parallel market for foreign exchange could continue trading outside the offi cial band. Discussions about possible price controls do not reassure the markets. However, there are indications that the rebalancing of the policy stance is working, and a growing interest in Vietnam by international asset managers and portfolio investors is already perceptible.
COUNTRY PAGES & KEY INDICATORS 75
EMERGING STRONGER FROM THE CRISIS

Vietnam: Key Economic Indicators
2005 2006 2007 2008 2009e 2010fYear Year Year Year Year Year
Output, Employment and PricesReal GDP (% change y-y) 8.4 8.2 8.5 6.2 5.3 6.5Industrial production index
(% change y-y) 17.1 16.8 16.7 13.9 7.6 12.5Unemployment (%) 1/ 5.3 4.8 4.6 4.7 6.5 5.0Consumer price index (% change y-y) 8.8 6.7 12.6 19.9 6.5 9.0
Public SectorGovernment balance, official (% GDP) 2/ -0.1 1.1 -2.2 -1.1 -6.2 -3.8Government balance, general (% GDP) 3/ -4.5 -1.1 -5.3 -4.5 -9.7 -6.2Domestic public sector debt (% GDP) 4/ 44.5 44.0 46.5 41.4 46.5 47.5
Foreign Trade, BOP and External DebtTrade balance (millions US$) -2,439 -2,776 -10,360 -12,782 -8,307 -7,820Exports of goods (millions US$) 32,447 39,826 48,561 62,685 57,096 64,115
(% change y-y) 22.5 22.7 21.9 29.1 -8.9 12.3Key export (% change y-y) 4/ 30.3 12.1 2.7 23.1 -40.2 13.0Imports of goods (millions US$) 34,886 42,602 58,921 75,467 65,403 71,935
(% change y-y) 15.7 22.1 38.3 28.1 -13.3 10.0Current account balance (millions US$) -560 -163 -6,992 -10,705 -7,192 -7,320
(% GDP) -1.1 -0.3 -9.8 -11.9 -7.8 -7.2Foreign direct investment (billions US$) 1.9 2.4 6.7 9.3 8.4 8.8External debt (billions US$) 17.2 19.1 23.8 29.6 33.2 37.1
(% GDP) 32.7 31.5 33.4 33.0 36.0 36.5Debt service ratio (% exports of g&s) 5.4 5 4.6 3.9 5 5.7Foreign exchange reserves, gross (billions US$) 8.6 11.5 21 23 15.2 17.5
(months of imports of g&s) 11.3 12.5 16.6 14.4 10.9 11.4
Financial MarketsDomestic credit (% change y-y) 31.7 25.4 53.9 25.4 37.7 25Short-term interest rate (% p.a.) 6/ 7.4 7.9 7.8 8.1 8.5 8.5Exchange rate (Dong/US$, eop) 15,916 16,055 16,010 16,450 17,664 ..Real effective exchange rate (2000=100) 93.7 97.3 98.4 110.9 113.1 ..
(% change y-y) 4.4 3.9 1.1 12.7 2.0 ..Stock market index (Jul. 2000=100) 7/ 308 752 927 316 494.8 ..
Memo: Nominal GDP (millions US$) 52,917 60,913 71,034 90,705 93,513
Sources: Vietnam Government Statistics Office, State Bank of Vietnam, IMF, and World Bank staff estimates.e = estimate 2/ Excludes off-budgetary items. 5/ Crude oil.f = forecast 3/ Excludes off-budgetary items. 6/ Three-month deposit, end-of-period.
1/ Urban areas.4/ Includes guaranteed and off-
budgetary items.7/ Ho Chi Minh Stock Index
76
WORLD BANK EAST ASIA AND PACIFIC ECONOMIC UPDATE 2010, VOL. I
COUNTRY PAGES & KEY INDICATORS

APPENDIX TABLES
Appendix Table 1. Real GDP Growth(percent change from a year earlier)
China Indonesia Malaysia Philippines Thailand Hong Kong,China
Korea,Rep. of Singapore Taiwan,
China East Asia
Q1-2002 8.9 3.5 2.7 4.2 4.5 -1.0 6.6 -0.9 1.6 5.9Q2-2002 8.0 4.2 4.7 4.6 5.0 0.5 7.0 4.7 6.5 6.6Q3-2002 8.1 5.6 7.1 3.3 5.8 2.8 6.8 6.7 6.8 6.9Q4-2002 8.1 4.7 6.9 5.5 6.0 4.8 8.1 6.4 6.0 7.2Q1-2003 10.8 4.9 6.3 4.8 6.9 4.1 3.5 3.9 4.7 7.4Q2-2003 7.9 5.0 5.9 4.3 6.6 -0.9 1.8 -1.5 -1.3 4.6Q3-2003 9.6 4.6 4.6 5.4 6.7 3.8 2.0 4.5 4.6 6.4Q4-2003 9.9 4.6 6.5 5.1 8.3 4.7 3.9 8.3 6.4 7.4Q1-2004 10.4 4.1 8.2 7.2 6.7 7.7 5.2 9.5 6.1 8.1Q2-2004 9.6 4.4 7.9 7.1 6.6 12.0 5.9 12.9 9.7 8.6Q3-2004 9.1 4.5 6.4 5.6 6.3 6.6 4.8 7.6 6.7 7.3Q4-2004 9.5 7.2 4.9 5.8 5.9 7.9 2.7 7.1 2.9 6.9Q1-2005 10.5 6.0 5.6 4.5 3.6 6.2 2.7 4.5 2.7 7.1Q2-2005 10.1 5.9 4.3 5.1 4.7 7.1 3.4 7.0 4.0 7.3Q3-2005 9.8 5.8 5.6 4.7 5.5 8.1 4.5 9.1 4.8 7.6Q4-2005 9.9 5.1 5.9 5.4 4.7 6.9 5.1 9.7 7.0 7.9Q1-2006 11.4 5.1 6.0 5.5 6.2 9.0 6.1 11.0 5.8 8.9Q2-2006 11.5 4.9 6.1 5.3 5.2 6.1 5.1 8.6 5.8 8.5Q3-2006 10.6 5.9 5.8 5.2 4.8 6.4 5.0 8.0 6.5 8.1Q4-2006 10.4 6.1 5.4 5.4 4.5 6.7 4.6 7.4 3.8 7.7Q1-2007 13.0 6.1 5.4 6.9 4.6 5.6 4.5 7.7 4.5 9.1Q2-2007 13.8 6.7 5.6 8.3 4.5 6.1 5.3 9.0 5.7 9.9Q3-2007 13.4 6.7 6.5 6.8 5.3 6.8 4.9 10.0 7.1 9.9Q4-2007 12.1 5.8 7.2 6.3 5.3 6.9 5.7 6.2 6.5 9.1Q1-2008 10.6 6.2 7.4 3.9 6.4 7.0 5.5 7.3 6.9 8.5Q2-2008 10.1 6.3 6.6 4.2 5.2 4.0 4.3 2.8 5.4 7.6Q3-2008 9.0 6.2 4.8 4.6 2.9 1.1 3.1 0.1 -0.8 5.9Q4-2008 6.8 5.3 0.1 2.9 -4.2 -2.7 -3.4 -4.2 -7.1 2.3Q1-2009 6.2 4.5 -6.2 0.6 -7.1 -7.5 -4.2 -9.4 -9.1 1.1Q2-2009 7.9 4.1 -3.9 0.8 -4.9 -3.7 -2.2 -3.1 -6.9 3.0Q3-2009 9.1 4.2 -1.2 0.4 -2.7 -2.2 0.9 0.6 -1.0 5.0Q4-2009 10.7 5.4 4.5 1.8 5.8 2.6 6.0 4.0 9.2 8.4
Sources: Haver Analytics and national sources.
Quarterly data for China is estimated using new annual production side GDP data.
APPENDIX TABLES 77
EMERGING STRONGER FROM THE CRISIS

Appendix Table 2. Real GDP and Components of Aggregate Demand (percent change from a year earlier)
Indonesia Malaysia Philippines Thailand Hong Kong,China
Korea,Rep. of Singapore Taiwan,
China S.E. Asia NIEs
GDP 2005 5.7 5.3 5.0 4.6 7.1 4.0 7.7 4.7 5.2 4.92006 5.5 5.8 5.3 5.1 7.0 5.2 8.7 5.4 5.4 5.82007 6.3 6.2 7.1 4.9 6.4 5.1 8.2 6.0 6.0 5.82008 6.0 4.6 3.8 2.5 2.1 2.2 1.4 0.7 4.4 1.72009 4.5 -1.7 0.9 -2.3 -2.7 0.2 -2.0 -1.9 0.9 -1.0
Private Consumption 2005 4.0 9.1 4.8 4.6 3.0 4.6 3.8 2.9 5.3 3.82006 3.2 6.8 5.5 3.2 5.9 5.1 4.3 1.5 4.3 4.12007 5.0 10.4 5.8 1.7 8.5 5.1 6.1 2.1 5.4 4.92008 5.3 8.5 4.7 2.7 2.3 1.6 2.3 -0.6 5.2 1.22009 4.9 0.8 3.8 -1.1 -0.3 1.3 -0.5 1.5 2.3 0.9
Fixed Investment 2005 10.9 5.0 -6.6 10.5 4.1 1.9 -0.1 2.7 6.7 2.32006 2.6 7.5 3.9 3.9 6.3 3.4 13.3 0.1 4.2 3.72007 9.3 9.6 10.9 1.5 8.5 4.2 19.2 0.6 7.5 5.12008 11.8 0.8 2.9 1.2 2.3 -1.7 14.3 -11.2 5.2 -2.32009 3.3 -5.5 -3.5 -9.0 -0.3 -0.9 -3.1 -11.8 -2.9 -4.1
Exports of Goods & Services 2005 16.6 8.3 4.8 4.2 10.6 7.8 12.6 7.8 9.6 8.62006 9.4 6.6 13.4 9.1 9.4 11.4 11.4 11.4 9.4 11.12007 8.5 4.5 5.4 7.8 8.3 12.6 8.5 9.6 7.0 10.72008 9.5 1.3 -1.9 5.1 2.5 5.7 3.6 0.6 4.8 3.62009 -9.7 -10.1 -14.2 -12.7 -10.2 -1.0 -10.9 -9.2 -11.3 -5.6
Sources: Haver Analytics, national data sources, and World Bank staff estimates. Regional averages are 2000 US$ GDP weighted.
Appendix Table 3: East Asia: Merchandise Export Growth(in U.S. dollars, percent change from a year earlier)
2007 2008 2009 Q1 2009 Q2 2009 Q3 2009 Q4 2009 Nov-09 Dec-09 Jan-10 Feb-10
East Asia (10) 17.0 13.6 -16.1 -24.5 -24.1 -19.8 5.4 5.8 23.1 32.8 ..China 25.7 17.4 -15.9 -19.7 -23.4 -20.5 0.2 -1.2 17.8 21.1 45.7S.E. Asia 13.6 15.0 -16.6 -21.7 -24.5 -20.7 3.4 10.2 28.5 43.1 ..
Indonesia 13.2 20.1 -15.0 -31.9 -26.2 -19.3 23.9 11.5 50.0 59.0 ..Malaysia 9.5 13.4 -21.1 -28.9 -33.3 -26.3 9.8 2.3 23.5 45.0 ..Philippines 7.1 -2.7 -21.9 -36.8 -28.9 -21.5 5.0 5.7 23.8 42.5 ..Thailand 17.8 14.3 -13.6 -23.4 -23.6 -16.7 13.5 20.3 25.7 33.2 ..Vietnam 25.0 29.2 -10.1 4.1 -14.7 -22.2 -3.7 11.1 11.6 34.8 -22.4
NIEs 10.9 9.3 -16.2 -28.4 -23.5 -18.3 8.5 12.1 27.4 42.3 29.9Hong Kong, China 8.8 5.3 -12.2 -21.5 -12.4 -13.8 -2.0 1.3 9.2 18.3 28.3Korea, Rep. of 14.1 13.6 -13.9 -25.2 -21.1 -17.6 11.7 17.9 32.8 47.1 31.0Singapore 10.1 12.9 -20.2 -32.8 -30.7 -22.3 11.9 13.4 30.5 46.3 28.1Taiwan, China 10.3 3.7 -20.5 -37.1 -32.5 -20.8 17.3 19.9 48.4 77.4 32.6
Sources: Haver Analytics and national data sources.
78
WORLD BANK EAST ASIA AND PACIFIC ECONOMIC UPDATE 2010, VOL. I
APPENDIX TABLES

Appendix Table 4. East Asia and the Pacific: GDP Growth Projections (percent change from a year earlier)
Forecast Forecast2002 2003 2004 2005 2006 2007 2008 2009 2010 2011
East Asia 7.0 6.7 7.9 7.6 8.6 9.5 6.2 4.5 7.6 7.0Developing East Asia 7.9 8.8 9.0 9.1 10.1 11.4 8.5 7.0 8.7 8.0
China 9.1 10.0 10.1 10.4 11.6 13.0 9.6 8.7 9.5 8.7Indonesia 4.5 4.8 5.0 5.7 5.5 6.3 6.1 4.5 5.6 6.2Malaysia 5.4 5.8 6.8 5.3 5.8 6.2 4.6 -1.7 5.7 5.3Philippines 4.3 5.0 6.4 5.0 5.3 7.1 3.8 0.9 3.5 3.8Thailand 5.3 7.1 6.3 4.6 5.1 4.9 2.6 -2.3 6.2 4.0Vietnam 7.1 7.3 7.8 8.4 8.2 8.5 6.2 5.3 6.5 6.5Cambodia 6.5 8.5 10.0 13.3 10.8 10.2 6.7 -2.0 4.4 6.0Fiji 3.2 1.0 5.3 0.7 -0.4 -1.2 -0.1 -2.5 2.0 2.2Lao PDR 5.9 6.1 6.4 7.1 8.5 7.5 7.5 6.7 7.7 7.8Mongolia 4.2 6.1 10.8 7.3 8.6 10.2 8.9 -1.6 7.3 7.1Papua New Guinea -0.2 2.2 2.7 3.4 2.6 6.5 7.0 3.9 3.7 3.3Timor-Leste 2.4 0.1 4.2 6.2 -5.8 8.4 12.8 7.4 7.5 7.4
East Asia NIEs 5.6 3.2 6.0 4.9 5.8 5.8 1.7 -1.0 5.0 4.5
Sources: World Bank data and staff estimates.
APPENDIX TABLES 79
EMERGING STRONGER FROM THE CRISIS

Appendix Table 5. Regional Aggregates for Poverty Measures in East Asia
$1.25 –a-day $2-a-dayMean
Consumption (2005 PPP$/
month)
Headcount Index (%)
Number of Poor (million)
Headcount Index (%)
Number of Poor (million)
Population (million)
EAP1990 49.16 54.7 873.3 79.8 1,273.7 1,595.91993 54.55 50.8 845.3 75.8 1,262.1 1,664.91996 67.01 36.0 622.3 64.1 1,108.1 1,728.71999 70.76 35.5 635.1 61.8 1,104.9 1,788.42002 85.65 27.6 506.8 51.9 954.1 1,837.02005 106.85 16.8 316.2 38.7 728.7 1,884.4
EAP excluding China1990 72.98 39.2 180.5 66.0 304.4 460.81993 73.84 42.6 207.3 68.0 330.9 486.41996 85.81 35.0 178.8 61.5 314.2 511.21999 82.96 35.2 188.1 62.7 335.2 534.72002 89.76 25.5 142.1 54.0 300.8 556.62005 100.98 19.0 110.2 44.8 259.5 579.9
South East Asia (Indonesia, Malaysia, Philippines, Thailand)1990 77.05 38.6 120.3 65.1 202.9 311.81993 82.24 37.8 124.2 63.8 209.8 328.71996 96.46 29.5 101.6 56.2 193.9 344.91999 91.12 31.8 114.8 59.2 213.6 361.12002 97.84 21.3 80.3 49.9 188.4 377.32005 107.30 17.0 66.8 42.2 166.0 393.8
Lower-Income East Asia (Cambodia, Laos, PNG, Vietnam)1990 58.57 41.2 34.6 69.5 58.4 84.11993 43.53 60.5 54.4 83.6 75.2 90.01996 47.82 55.1 52.7 80.6 77.1 95.71999 54.43 47.3 47.4 75.3 75.6 100.32002 60.87 41.0 42.6 69.1 71.9 104.12005 79.14 26.1 28.4 53.8 58.6 108.8
Source: World Bank staff estimates.
80
WORLD BANK EAST ASIA AND PACIFIC ECONOMIC UPDATE 2010, VOL. I
APPENDIX TABLES

Appendix Table 6. Primary Commodity Prices(in U.S. dollars, percent change from a year earlier)
Actual Projections1980- 1991-
Commodity 90 98 2000 2001 2002 2003 2004 2005 2006 2007 2008 2009 2010 2011
Crude oil average 0.0 -5.7 56.2 -13.7 2.4 15.9 30.6 41.5 20.4 10.6 36.4 -36.3 23.1 0.8
Non-Energy Commodities -0.8 0.4 -1.4 -9.1 5.3 10.2 17.5 12.0 29.0 17.1 21.0 -21.6 5.3 0.7
Agriculture -1.9 0.8 -5.7 -9.1 8.6 9.6 10.5 2.8 12.6 20.1 27.2 -13.8 -5.8 -1.8Cocoa -7.3 4.0 -20.2 18.0 66.4 -1.5 -11.5 -0.8 3.5 22.6 32.0 12.1 3.8 -20.0Coffee, arabica -3.6 12.6 -16.2 -28.5 -1.2 4.3 25.3 42.7 -0.4 8.0 13.1 2.9 -14.9 -5.6Coconut oil -1.4 10.6 -38.9 -29.4 32.4 11.0 41.4 -6.6 -1.6 51.4 33.2 -40.7 3.4 0.0Palm oil -3.0 12.3 -28.8 -7.9 36.6 13.6 6.3 -10.4 13.3 63.1 21.6 -28.0 -3.3 1.5Rice, Thai, 5% 0.8 2.1 -18.5 -14.6 11.0 3.0 20.3 20.4 6.5 7.1 99.2 -14.6 -17.1 0.4Sugar, world 16.4 -2.8 30.6 5.6 -20.3 3.0 1.1 37.9 49.5 -31.8 27.0 41.8 -12.5 -2.9Logs, Malaysia 1.9 3.4 1.5 -16.3 2.7 14.5 5.4 3.0 17.9 11.9 9.1 -1.7 -6.0 1.1Sawn wood, Malaysia 4.1 -0.1 -1.0 -19.1 9.4 4.6 5.5 13.4 13.6 7.6 10.3 -9.4 0.6 0.8Rubber, RSS1, Singapore -1.7 0.5 6.2 -13.8 33.0 41.5 20.4 15.2 40.3 8.7 12.9 -25.7 -16.7 6.3
Metals and minerals 2.9 -2.6 12.6 -9.6 -3.1 12.7 37.1 28.9 56.9 12.0 3.7 -27.7 27.8 5.2Tin -6.7 -0.7 0.6 -17.5 -9.5 20.5 73.9 -13.3 19.0 65.6 27.3 -26.7 21.6 9.1Copper 4.3 -4.1 15.3 -13.0 -1.2 14.1 61.1 28.4 82.7 5.9 -2.3 -26.0 35.9 7.1
Source: World Bank DEC Prospects Group. Projections as of 1/7/2010.
APPENDIX TABLES 81
EMERGING STRONGER FROM THE CRISIS

Appendix Table 7. East Asia: Exchange Rates(local currency per U.S. dollar, end-of-period)
China Indonesia Malaysia Philippines Thailand Vietnam Hong Kong,China
Korea,Rep. of Singapore Taiwan,
China Japan
Jan-2007 7.78 9090 3.50 49.03 35.80 16035.50 7.81 940.90 1.54 32.95 121.68Feb-2007 7.74 9160 3.51 48.29 35.45 15990.00 7.81 938.30 1.53 32.95 118.48Mar-2007 7.73 9118 3.46 48.26 35.02 16022.50 7.81 940.30 1.52 33.09 117.65Apr-2007 7.71 9083 3.42 47.51 34.77 16045.50 7.82 929.40 1.52 33.28 119.60May-2007 7.65 8828 3.40 46.27 34.65 16079.00 7.81 929.90 1.53 33.02 121.62Jun-2007 7.62 9054 3.45 46.33 34.54 16113.00 7.81 926.80 1.53 32.74 123.23Jul-2007 7.57 9186 3.45 45.61 33.81 16126.50 7.83 923.20 1.51 32.81 118.95Aug-2007 7.56 9410 3.50 46.70 34.33 16225.50 7.80 939.90 1.52 33.00 116.20Sep-2007 7.51 9137 3.42 45.06 34.27 16091.50 7.77 920.70 1.49 32.58 115.05Oct-2007 7.47 9103 3.34 43.95 34.00 16082.50 7.75 907.40 1.45 32.41 114.75Nov-2007 7.40 9376 3.36 42.80 33.85 16044.00 7.79 929.60 1.45 32.27 110.30Dec-2007 7.30 9419 3.31 41.40 33.75 16010.00 7.80 938.20 1.44 32.44 114.00Jan-2008 7.19 9291 3.24 40.65 33.03 15971.00 7.80 943.90 1.42 32.20 106.36Feb-2008 7.11 9051 3.19 40.36 31.87 15931.00 7.78 937.30 1.39 30.95 104.73Mar-2008 7.02 9217 3.19 41.87 31.51 16105.00 7.79 991.70 1.38 30.41 100.10Apr-2008 7.00 9234 3.16 42.19 31.74 16116.00 7.80 999.70 1.36 30.45 104.08May-2008 6.95 9318 3.24 43.88 32.46 16246.00 7.80 1031.40 1.37 30.41 105.66Jun-2008 6.86 9225 3.27 44.76 33.52 16842.00 7.80 1043.40 1.36 30.35 106.40Jul-2008 6.86 9118 3.26 44.14 33.54 16755.00 7.80 1008.50 1.37 30.59 107.99Aug-2008 6.85 9157 3.39 45.69 34.17 16525.00 7.80 1081.80 1.42 31.52 109.10Sep-2008 6.85 9378 3.46 46.92 34.02 16575.00 7.77 1187.70 1.43 32.13 104.30Oct-2008 6.86 10995 3.56 48.75 34.99 16812.50 7.75 1291.40 1.48 33.00 98.30Nov-2008 6.87 12151 3.62 48.88 35.47 16973.50 7.75 1482.70 1.51 33.30 95.25Dec-2008 6.86 10950 3.46 47.49 34.93 17433.00 7.75 1257.50 1.44 32.86 90.75Jan-2009 6.86 11355 3.61 47.08 34.93 17474.50 7.75 1368.50 1.51 33.80 89.60Feb-2009 6.84 11980 3.69 48.24 36.05 17475.00 7.75 1516.40 1.54 34.95 97.55Mar-2009 6.84 11575 3.65 48.42 35.52 17756.00 7.75 1377.10 1.52 33.92 98.10Apr-2009 6.85 10713 3.56 48.70 35.30 17784.00 7.75 1348.00 1.48 33.23 97.60May-2009 6.82 10340 3.51 47.55 34.38 17784.00 7.75 1272.90 1.45 32.65 96.50Jun-2009 6.81 10225 3.52 48.31 34.02 17801.00 7.75 1284.70 1.45 32.82 95.95Jul-2009 6.82 9920 3.52 48.12 34.04 17815.00 7.75 1240.50 1.44 32.82 95.33Aug-2009 6.82 10060 3.52 48.91 34.01 17823.00 7.75 1244.90 1.44 32.92 92.70Sep-2009 6.83 9681 3.47 47.59 33.55 17841.00 7.75 1188.70 1.41 32.20 89.77Oct-2009 6.82 9545 3.41 47.73 33.43 17862.00 7.75 1200.60 1.40 32.54 91.38Nov-2009 6.83 9480 3.39 46.75 33.21 18485.00 7.75 1167.40 1.38 32.19 86.75Dec-2009 6.83 9400 3.42 46.36 33.36 18472.00 7.76 1167.60 1.40 32.03 92.06Jan-2010 6.82 9365 3.41 46.74 33.15 18472.00 7.76 1156.50 1.40 31.99 89.85Feb-2010 6.84 9318 3.41 46.26 33.09 18925.00 7.76 1158.40 1.41 32.09 88.87Mar-2010 6.83 9125 3.31 45.67 32.31 19115.00 7.76 1134.60 1.40 31.72 90.39
Sources: Haver Analytics and Datastream.
82
WORLD BANK EAST ASIA AND PACIFIC ECONOMIC UPDATE 2010, VOL. I
APPENDIX TABLES

Appendix Table 8. East Asia: Foreign Reserves Minus Gold(in billions of U.S. dollars)
China Indonesia Malaysia Philippines Thailand Hong Kong,China
Korea,Rep. of Singapore Taiwan,
China Total
Dec-1997 142.8 17.4 20.8 7.3 26.3 92.8 20.4 71.3 83.5 482.5Dec-1998 149.2 23.5 25.6 9.3 28.8 89.7 52.0 75.1 90.3 543.4Dec-1999 157.7 27.3 30.6 13.3 34.1 96.2 74.0 77.0 106.2 616.4Dec-2000 168.3 29.4 29.5 13.1 32.0 107.5 96.1 80.2 106.7 662.9Dec-2001 215.6 28.0 30.5 13.5 32.4 111.2 102.8 75.7 122.2 731.7Dec-2002 291.1 32.0 34.2 13.3 38.1 111.9 121.3 82.2 161.7 885.9Dec-2003 408.2 36.3 44.6 13.7 41.1 118.4 155.3 96.2 206.6 1,120.3Dec-2004 614.5 36.3 66.4 13.1 48.7 123.5 199.0 112.6 241.7 1,455.9Dec-2005 821.5 34.7 70.2 15.9 50.7 124.2 210.3 116.2 253.3 1,697.1Dec-2006 1,068.5 42.6 82.2 20.0 65.3 133.2 238.9 136.3 266.1 2,053.0Dec-2007 1,530.3 56.9 101.1 30.2 85.2 152.6 262.2 163.0 270.3 2,651.7Dec-2008 1,949.3 51.6 91.2 33.2 108.7 182.5 201.2 174.0 291.7 3,083.3Jan-2009 1,916.6 50.9 91.0 34.7 108.2 181.7 201.7 166.9 292.7 3,044.2Feb-2009 1,915.1 50.6 90.7 34.2 110.7 177.0 201.5 163.3 294.2 3,037.4Mar-2009 1,956.8 54.8 87.4 34.5 113.7 186.2 206.3 166.0 300.1 3,106.0Apr-2009 2,012.0 56.6 87.8 34.9 114.4 193.4 212.4 169.9 304.7 3,186.0May-2009 2,093.1 57.9 87.9 34.7 118.9 205.1 226.7 171.5 312.6 3,308.4Jun-2009 2,135.2 57.6 91.3 34.8 118.3 206.9 231.7 173.0 317.6 3,366.3Jul-2009 2,178.2 57.4 90.8 35.3 120.9 218.0 237.4 173.9 321.1 3,433.1Aug-2009 2,223.9 57.9 93.3 36.7 124.8 223.2 245.4 176.1 325.4 3,506.5Sep-2009 2,288.5 62.3 94.8 37.5 129.1 226.8 254.2 181.8 332.2 3,607.2Oct-2009 2,344.3 64.5 94.9 37.9 132.5 240.0 264.1 184.1 341.2 3,703.5Nov-2009 2,404.1 65.8 95.0 38.5 136.7 256.2 270.8 188.7 347.2 3,802.9Dec-2009 2,399.2 66.1 96.4 38.8 135.5 255.7 269.9 187.6 348.2 3,797.3Jan-2010 .. 69.6 95.7 40.2 139.5 257.1 273.6 189.4 350.7 ..Feb-2010 .. 69.7 95.5 40.2 138.8 258.2 270.6 187.6 352.7 ..
Sources: Haver Analytics, Thomson Datastream, and IMF International Financial Statistics.
APPENDIX TABLES 83
EMERGING STRONGER FROM THE CRISIS

Appendix Table 9a. East Asia: Balance of Payments(in percent of GDP)
Overall Balance 1/ Current Account Capital Account 2/2005 2006 2007 2008 2009 2005 2006 2007 2008 2009 2005 2006 2007 2008 2009
East Asia 5.3 6.7 9.5 5.9 9.3 5.7 7.3 8.7 7.6 6.4 -0.3 -0.6 0.8 -1.7 2.9 China 9.0 8.9 13.4 9.5 9.2 7.0 9.1 10.8 9.6 5.8 2.0 -0.2 2.6 -0.2 3.4 S.E. Asia 1.0 4.6 6.3 1.0 4.5 2.2 5.3 6.2 3.8 6.1 -1.2 -0.7 0.1 -2.8 -1.7 Indonesia -0.6 2.2 3.3 -1.0 2.7 0.1 3.0 2.4 0.1 2.0 -0.6 -0.8 0.9 -1.1 0.7 Malaysia 2.7 7.6 10.1 -4.5 2.7 15.0 16.7 15.7 17.6 16.7 -12.3 -9.1 -5.6 -22.0 -14.0 Philippines 2.8 3.5 7.0 1.8 3.5 1.9 4.4 5.0 2.1 5.3 0.9 -1.0 2.1 -0.4 -1.8 Thailand 1.1 7.0 8.1 8.6 10.2 -4.3 1.1 6.3 0.6 7.7 5.5 5.9 1.7 8.0 2.5 NIEs 1.8 4.2 4.0 0.1 13.3 5.3 5.4 6.1 4.9 8.6 -3.5 -1.2 -2.1 -4.8 4.7 Hong Kong, China 0.4 4.7 9.4 13.9 34.8 11.4 12.1 12.3 13.6 8.7 -11.0 -7.4 -2.9 0.2 26.0 Korea, Rep. of 1.3 3.0 2.2 -6.5 8.3 1.8 0.5 0.5 -0.3 5.2 -0.4 2.5 1.7 -6.1 3.2 Singapore 3.0 14.3 15.5 5.9 7.7 22.0 24.9 27.5 19.3 19.2 -19.0 -10.7 -12.0 -13.5 -11.5 Taiwan, China 3.2 3.4 1.1 5.3 14.9 4.8 6.9 8.4 6.2 11.3 -1.6 -3.5 -7.3 -0.9 3.6Median 2.7 4.7 8.1 5.3 8.3 4.8 6.9 8.4 6.2 7.7 -0.6 -1.0 0.9 -0.9 2.5
Sources: Haver Analytics and national sources.
1/ Equals change in foreign reserves.
2/ Includes errors and omissions.
Appendix Table 9b. East Asia: Capital Account Components(in percent of GDP)
Net FDI Net Portfolio Net Other Capital 3/2005 2006 2007 2008 2009 2005 2006 2007 2008 2009 2005 2006 2007 2008 2009
East Asia 2.0 1.5 1.8 1.4 0.4 -0.7 -2.3 -0.9 -1.1 -0.1 -0.6 0.2 -1.2 -1.3 3.0 China 2.9 2.2 3.5 2.1 0.7 -0.2 -2.4 0.5 1.0 0.6 -0.2 0.5 -2.0 -2.7 3.1 S.E. Asia 2.2 1.6 0.7 0.2 -0.1 1.4 1.8 0.9 -2.5 0.2 -3.1 -3.7 -2.3 0.1 -2.2 Indonesia 1.8 0.6 0.5 0.7 0.4 1.5 1.2 1.3 0.3 1.9 -3.3 -1.0 -1.1 -1.4 -1.6 Malaysia 0.7 0.0 -1.4 -3.5 -3.7 -2.7 2.2 2.9 -11.4 0.1 -5.1 -9.8 -7.3 -1.1 -8.7 Philippines 1.7 2.4 -0.4 0.8 1.0 3.5 2.6 3.2 -2.3 0.9 -3.0 -5.1 -0.3 0.4 -3.2 Thailand 4.3 4.1 3.4 2.2 0.9 3.1 2.1 -2.7 -0.7 -3.5 -1.1 -2.9 -1.9 3.8 2.0 NIEs 0.5 0.4 -0.9 0.5 -0.3 -2.5 -4.2 -4.8 -5.3 -2.1 0.0 1.8 0.9 1.4 6.7 Hong Kong, China 3.6 0.0 -3.3 4.2 -1.8 -17.7 -14.1 -1.3 -17.6 -21.0 2.0 3.2 -5.0 14.4 44.1 Korea, Rep. of 0.2 -0.5 -1.3 -1.7 -1.1 -0.4 -2.4 -2.5 -0.3 6.1 0.8 5.1 4.2 -1.8 -1.3 Singapore 3.5 7.3 4.9 10.3 5.9 0.7 -0.4 -10.4 -21.4 -17.0 -17.9 -17.5 -12.6 -1.6 -0.7 Taiwan, China -1.2 0.0 -0.8 -1.2 -0.8 -0.8 -5.0 -10.2 -3.1 -2.7 2.9 0.1 1.2 3.5 7.0Median 1.8 0.6 -0.4 0.8 0.4 -0.2 -0.4 -1.3 -2.3 0.1 -1.1 -1.0 -1.9 -1.1 -0.7
Sources: Haver Analytics and national sources.
3/ Net Other Investment + Financial Derivatives
84
WORLD BANK EAST ASIA AND PACIFIC ECONOMIC UPDATE 2010, VOL. I
APPENDIX TABLES

Appendix Table 10. East Asia: Nonperforming Loans(in percent of total loans)
1997 1998 1999 2000 2001 2002 2003 2004 2005 2006 2007 2008 2009Dec Dec Dec Dec Dec Dec Dec Dec Dec Dec Dec Dec Mar Jun Sep Dec
China .. .. .. .. .. 23.1 17.9 13.2 8.6 7.1 6.2 2.4 2.0 1.8 1.7 1.6Indonesia 1/ 7.2 48.6 32.9 18.8 12.1 7.5 7.2 6.0 6.5 8.0 5.6 3.6 3.7 4.0 3.9 3.7Malaysia 2/ .. 10.6 11.0 9.7 11.5 10.2 9.0 7.5 5.8 4.8 3.2 2.2 2.2 2.2 2.1 1.8Philippines 3/ .. 11.0 12.7 14.9 16.9 14.6 13.8 12.5 8.6 6.1 4.9 4.1 4.3 4.3 4.1 4.0Thailand 4/ .. 45.0 39.9 19.5 11.5 18.1 13.9 11.6 8.3 8.1 7.3 5.3 5.5 5.4 5.3 4.8Korea, Rep. of 5/ 6.0 7.3 13.6 8.8 3.3 2.4 2.2 2.0 1.3 0.9 0.7 1.1 1.5 1.5 1.5 1.2
Source: National data sources.
1/ Excludes IBRA’s AMC. Data from 1997 to 2002 excludes state banks. Data from 2003 covers all commercial banks including state banks.
2/ Excludes Danaharta. This series, used by Bank Negara Malaysia, is net of provisions and excludes interest in suspense.
3/ Includes interbank loans.
4/ Excludes transfers to AMCs. The jump in headline NPLs in December 2002 was a one-off increase, reflecting a change in definition and did not affect provisioning.
5/ Excludes KAMCO/KDIC.
APPENDIX TABLES 85
EMERGING STRONGER FROM THE CRISIS

Appendix Table 11. East Asia: Financial Market Indicators
Stock Market Index, end-of-period, Dec. 31, 2007 = 100Sep-07 Dec-07 Mar-08 Jun-08 Sep-08 Dec-08 Mar-09 Jun-09 Sep-09 Dec-09 Mar-10
China 105.5 100.0 66.0 52.0 43.6 34.6 45.1 56.3 52.8 59.6 54.4Indonesia 85.9 100.0 89.1 85.6 66.7 49.4 52.2 73.8 89.9 90.2 95.0Malaysia 92.5 100.0 86.3 82.1 70.5 60.7 60.4 74.4 83.2 84.5 86.2Philippines 98.7 100.0 82.4 67.9 71.0 51.7 54.8 67.3 77.3 87.1 88.6Thailand 98.5 100.0 95.2 89.6 69.5 52.4 50.3 69.6 83.6 92.8 95.1Vietnam 112.9 100.0 55.8 43.1 49.3 34.0 30.3 48.4 62.7 58.8 61.4Hong Kong, China 97.6 100.0 82.2 79.5 64.8 51.7 48.8 66.1 75.3 82.6 79.4Korea, Rep. of 102.6 100.0 89.8 88.3 76.3 59.3 63.6 73.3 88.2 95.3 93.3Singapore 105.2 100.0 86.8 85.1 68.1 50.8 49.1 67.3 77.1 90.0 90.0Taiwan, China 110.6 100.0 100.8 88.4 67.2 54.0 61.3 75.6 88.3 100.2 94.2
Source: Thomson Datastream.
Yields, 10-year local-currency government bonds, end-of-period, in percentSep-07 Dec-07 Mar-08 Jun-08 Sep-08 Dec-08 Mar-09 Jun-09 Sep-09 Dec-09 Mar-10
China 4.4 4.5 4.1 4.5 3.8 2.8 3.2 3.2 3.5 3.6 3.4Indonesia 9.2 10.0 11.7 13.4 13.2 11.9 12.7 11.1 10.0 10.1 9.1Malaysia 3.7 4.1 3.8 4.9 4.6 3.2 3.8 4.4 4.2 4.3 4.2Philippines 7.2 6.6 7.3 9.4 8.1 7.4 8.2 8.1 8.0 8.1 8.1Thailand 4.7 5.0 4.6 5.9 4.4 2.7 3.3 3.7 4.0 4.2 4.0Vietnam 8.6 9.1 9.2 16.0 15.0 10.2 9.5 9.7 10.3 11.5 12.3Hong Kong, China 4.3 3.4 2.6 3.5 2.9 1.9 1.9 2.6 2.4 2.6 2.6Korea, Rep. of 5.6 5.7 5.3 6.0 6.1 4.2 5.2 5.2 5.3 5.4 4.7Singapore 2.7 2.7 2.3 3.6 3.2 2.1 2.0 2.6 2.5 2.7 2.7Taiwan, China 2.6 2.6 2.4 2.7 2.2 1.4 1.5 1.6 1.4 1.5 1.4
Source: Bloomberg.
Foreign-Currency Government Bond Spreads (EMBIG), end-of-period, in basis points over U.S. TreasuriesSep-07 Dec-07 Mar-08 Jun-08 Sep-08 Dec-08 Mar-09 Jun-09 Sep-09 Dec-09 Mar-10
China 88 120 154 137 191 228 210 122 87 104 87Indonesia 217 275 329 381 490 762 742 433 295 230 212Malaysia 108 119 144 153 194 119 344 167 175 136 138Philippines 184 172 207 303 324 546 432 324 265 206 219Vietnam 156 203 283 368 404 747 574 379 290 314 293
Sources: JP Morgan and Bloomberg.
Credit Default Swap (CDS) Spreads on Foreign-Currency Government Bonds, 5-year, end-of-period, in basis pointsSep-07 Dec-07 Mar-08 Jun-08 Sep-08 Dec-08 Mar-09 Jun-09 Sep-09 Dec-09 Mar-10
China 20 29 81 75 90 188 156 75 69 73 63Indonesia 142 154 245 286 357 638 575 317 187 188 156Malaysia 25 44 99 116 171 225 238 105 83 90 70Philippines 145 153 243 266 284 384 360 217 176 168 156Thailand 43 55 111 135 172 256 233 110 87 96 104Hong Kong, China 9 18 58 42 62 104 145 68 56 48 39Korea, Rep. of 24 47 97 107 182 319 328 182 101 85 75
Source: Thomson Datastream.
86
WORLD BANK EAST ASIA AND PACIFIC ECONOMIC UPDATE 2010, VOL. I
APPENDIX TABLES

Eco-AuditEnvironmental Benefi ts Statement
The World Bank is committed to preserving Endangered Forests and natural resources. The Offi ce of the Publisher has chosen to print The World Bank East Asia and Pacifi c Economic Update 2010, Vol. I on recycled paper with 30% post consumer fi ber. The World Bank has formally agreed to follow the recommended standards for paper usage set by Green Press Initiative—a nonprofi t program supporting publishers in using fi ber that is not sourced from Endangered Forests. For more information, visit www.greenpressinitiative.org.
These measures in printing The World Bank East Asia and Pacifi c Economic Update 2010, Vol. I on 30% recycled paper saved the following:
Trees* Solid Waste Water Net Greenhouse Gases Total Energy
6 153 2,523 524 2*40’ in height and6-8” in diameter lbs. Gallons lbs. million BTU’s


Emerging Stronger from the CrisisWORLD BANK EAST ASIA AND PACIFIC ECONOMIC UPDATE 2010, VOLUME I
The World Bank East Asia and Pacific Economic Update 2010, Volume I, is the World Bank’s comprehensive, twice-yearly review of the region’s economies. In this edition, the Bank finds that, largely thanks to China, the region’s output, exports, and employment have mostly returned to the levels they were at before the crisis. And while countries can grow rapidly in the next decade even in a slower world economy, they need to return to their structural reform agendas with renewed vigor. These agendas include regional components, with a focus on regional economic integration, and addressing the challenges posed by climate change.
ISBN 978-0-8213-8275-2
SKU 18275