emerging markets review - center for risk management...
TRANSCRIPT

S.A.
Emerging Markets Review 29 (2016) 246–273
Contents lists available at ScienceDirect
Emerging Markets Review
j ou rna l homepage : www.e lsev ie r .com/ loca te /emr
The effect of listing switches from a growth marketto a main board: An alternative perspective
Jong-Ho Park a, Ki Beom Binh b, Kyong Shik Eomc,⁎a College of Social Sciences, Sunchon National University, 255 Jungang-ro, Sunchon, Jeonnam 57922, Republic of Koreab College of Social Science, Myongji University, 34 Geobukgol-ro, Seodaemun-gu, Seoul 03674, Republic of Koreac Center for Risk Management Research, University of California at Berkeley, 530 Evans Hall #3880, Berkeley, CA 94720-3880, U.
a r t i c l e i n f o a b s t r a c t
an growthimproved
Article history:Received 15 April 2015
ry 201
ng
E-mail address: [email protected] (1 The term “newmarket” originally refe
the term “growth market” has largely repEuropean and U.S. (Nasdaq before 2006) v“new” in the context of a listing switching
http://dx.doi.org/10.1016/j.ememar.20161566-0141/© 2016 Elsevier B.V. All rights
We examine whether firms switching listings from the Koremarket (KOSDAQ) to the main board (KOSPI) experienced
6 trading-related market quality. We focus onmarket macrostructure andg. Contraryat trading-anged fol-tructure ofrnality by
Received in revised form 29 FebruaAccepted 25 August 2016Available online 31 August 2016
JEL classification:G12
ative newms whoseted there.s reserved.
use a difference-in-difference techniquewith nearestmatchinto previous research and practitioners' opinions, we find threlated market quality mostly deteriorated or remained unchlowing the switch, indicating that the specific market macrosa country matters. Listing switches produce a negative exteweakening KOSDAQ and thereby impairing funding for innovfirms, suggesting that policymakers should encourage fircharacteristics fit the standalone growth market to remain lis
© 2016 Elsevier B.V. All right
G32C33
Keywords:Listing switchTrading-related market qualityMarket macrostructureStandalone growth marketDID technique with nearest matchi
1. Introduction
ts” in thecountriesrvive and
KOSDAQ, a part of the Korea Exchange (KRX), is one of the very few successful “growth markeworld (see Section 2 for details);1 most other growth markets in the advanced major industrialhave languished or failed, confirming that growth markets need to be nurtured if they are to su
⁎ Corresponding author.
K.S. Eom).rred to those European stockmarketsmodeled after Nasdaq and founded in the 1990s. Recently,laced the term “new market.” In this paper, we use the term “growth market” to include bothersions of newmarkets and to prevent unnecessary confusion which could arise from the wordsituation..08.006reserved.

provide social benefits. In spite of its success, many of the most successful KOSDAQ start-ups, including flag-ship firms, have steadily switched their listings to KOSPI, the main board of the KRX.
t qualityed their
e samplele perioda for 250odology,take intosubstan-es on so-
, trading-ates that,generallytrading-
ocks, thiser qualityr trading-et can de-e marketn deliver
e macro-an activee impor-wnershipt difficultment for
ycle thatg tradersthe con-agnitude
e growthinishing
n. Indeed,hing theirstructuree under-
ided thehis is thee growth
ir size, theirrchical rela-
247J.-H. Park et al. / Emerging Markets Review 29 (2016) 246–273
In this paper, we specifically examine whether the post-switch trading-related markedelivered by KOSPI is better than that provided by KOSDAQ for the 38 firm which switchlistings from KOSDAQ to KOSPI between January 1999 and April 2010. Along with thesfirms, we also utilize 38 matched firms which kept their listings on KOSDAQ during the sampfor our study. We use both trade and quote (TAQ) data for 100 days and daily market dattrading days, both before and after the listing switch from KOSDAQ to KOSPI. For our methwe employ the difference-in-difference (DID) technique with nearest matching in order toaccount the possible sample-selection bias in the listing switch event. We also control for thetial fluctuations in price and trading patterns of the associated underlying stocks in our samplcalled witching days.
Our main finding is, contrary to previous research and practitioners' opinions in other countriesrelated market quality mostly deteriorated or remained unchanged following the switch. This indicunlikemost world growthmarkets, KOSDAQ hasmanaged to provide trading-relatedmarket qualitycomparable to that of the main board, KOSPI, conditional on the characteristics of each firm. Whilerelated market quality is higher overall among KOSPI-listed stocks than among KOSDAQ-listed stappears to represent different distributions of firm characteristics on the two boards rather than bettfor any given firm. Weak growth markets have been found in previous research to deliver inferiorelated market quality, compared to main boards. KOSDAQ demonstrates that a strong growthmarkliver trading-related market quality comparable to the main board. In other words, thmacrostructure—the hierarchy of stock markets in a country—matters; a strong growth market catrading-related market quality superior to that of a weak growth market.2
Our main finding has significant policy implications, which can only be understood from thstructure perspective. As the literature summarized in Section 3 has established, the presence ofgrowth market is very important to nurturing innovation. Black and Gilson (1998) emphasize thtance to venture capitalists and entrepreneurs of the ability of the venture capitalists to exit othrough a successful initial public offering (IPO). However, typical firms at the IPO stage find ito meet the listing standards for the main board. A strong growth market is the ideal environan IPO.
Successful firms which remain listed on the growth market contribute to a self-reinforcing cstrengthens the growth market. A vibrant market creates a positive network externality, drawinand dealers and thereby improving liquidity; see, for example, Economides (1993, 1996) (providingceptualization of this network externality) and Barclay and Hendershott (2004) (quantifying the mof the liquidity externality).
However, growthmarkets have proven to be quite fragile.3 Firms that switch their listings from thmarket to the main board reduce the market capitalization and liquidity of the growth market, dimthe liquidity externality and thereby reducing the ability of the growthmarket to nurture innovatiolisting switches could lead to a total collapse of the growthmarket. Because firms considering switclistings do not take the liquidity externality into account, listing switches result in a negative macroexternality. It is the macrostructure that is affected by the listing switches; the externality cannot bstood in a microstructure context.
Of course, this negative macrostructure externality could be offset if the main board provswitching firms with significantly improved trading-related market quality, following the switch. Tquestion we address in this paper. We examine whether or not a firm switching its listing from th
2 Pirrong (2002) first named “the macrostructure of a securities market,” defining it as “the number of trading venues, themarket shares, and the policies they adopt” (see page 386). Drawing on practical usage in the field, we include also the hiera
tionships amongmarkets in the definition of marketmacrostructure. A typical country's marketmacrostructure consists of a main board,a growth market, and an organized over-the-counter (OTC) stock market.3 Growthmarkets such as Germany's NeuerMarkt and France's NouveauMarché have dissolved, andmany other attempts to establishvibrant self-sustaining growth markets have failed. Nasdaq gradually changed from an organized OTC stock market to a growth marketand ultimately a main board in the period leading up to 2006. While KOSDAQ's market capitalization is 10% of that of KOSPI, the U.K.'sgrowthmarket (AIM) has 5.5% of LSE's, Canada's TSX Venture Exchange has 3.23% of TSX's, and Japan's JASDAQhas 0.3% of TSE's; all othercountries are lower (World Federation of Exchanges, 2012). China's ChiNext is not included since it was founded in October 2009.

market (KOSDAQ) to the main board (KOSPI) of the KRX experienced an improvement in trading-relatedmarket quality. In otherwords, we investigatewhether themain board confers trading-relatedmarket quality
d in quan-n themo-specially
tandpoint's stand-witchinghowever,market's. This ap-son andd ordersined theincludedarket mi-hat firms; they at-ferences.of firms
the Mainhing list-itch an-
after thempanies
ing a list-the sameeir diver-ows us to
ovided bys suggestg-relatedof the ex-ficmarket
switchedOSDAQ,5
ing func-OSDAQ's
eatens itseir ability
248 J.-H. Park et al. / Emerging Markets Review 29 (2016) 246–273
over and beyondwhat the switchingfirmswas experiencing in the growthmarket.We are interestetifying the total improvement in trading-relatedmarket quality; in particular,we are not interested itives of the switching firms (which would be microstructure issues); see also Section 4.1, and efootnote 15, which discusses the motives for switching.4
The literature on listing switching can be generally classified into papers from the firm's sand papers from themarket's standpoint; see Section 3.2 for more details. Papers from the firmpoint analyze the switching firm's benefits, motives, or performance before and after the sevent. This is the traditional approach and almost all the previous research has adopted it;it suffers from the limitations enumerated in Section 3.3. In contrast, the analysis from thestandpoint considers differences in trading-related market quality before and after the switchproach has appeared in only two previous papers, Bennett and Wei (2006) and JenkinRamadorai (2013). Bennett and Wei (2006) examined the NYSE and Nasdaq, which handlein significantly different ways in the study period (2002–2003). At that time, Nasdaq combfunctions of a growth market (with many young technology firms) with a main board, since itmature technology giants such as Microsoft. In other words, NYSE and Nasdaq had different mcrostructures, and somewhat different roles in the macrostructure. Bennett and Wei found tswitching from Nasdaq to NYSE experienced improvements in trading-related market qualitytributed this to the microstructure differences, but did not discuss the macrostructure difJenkinson and Ramadorai (2013) analyzed the announcement and one-year performancesswitching listings between the Alternative Investment Market (AIM), growth market, andMarket (MM) of the London Stock Exchange (LSE). They found that the returns of firms switcings from AIM (the MM) to the MM (AIM) were positive (negative) right after the listing swnouncement, whereas their returns were broadly neutral (strongly positive) the yearswitches. They argued that a lighter regulatory environment may be appropriate for some coand their investors, but did not consider the market macrostructure issues.
Like Bennett andWei (2006), the present paper examines trading-related market quality following switch. However, KOSDAQ and KOSPI have essentially the same tradingmechanisms; they havemarket microstructure, but play very different roles in the market macrostructure, as reflected by thgent listing and delisting standards, and by the characteristics of their listed firms. This setting allfocus on the effect of macrostructure.
Our Null Hypothesis is that the trading environment provided by KOSPI is no better than that prKOSDAQ for firms that switch. Previouswork in the U.S. and practitioners' opinions in other countriethat ourNull Hypothesis should be easily rejected. However, our tests, based on amultitude of tradinmarket quality measures, do not reject the Null Hypothesis. This indicates that there is no evidenceistence offirmbenefits that offset themacrostructure externality. It provides evidence that the specimacrostructure of the country matters.
The reality is that themost successful KOSDAQ start-ups, including the flagship firms, ultimatelytheir listings to KOSPI. This suggests that the switch was motivated by the perceived reputation of Krather than a desire for improved trading-relatedmarket quality. Our results show that KOSDAQ tradtion remains competitivewith that of KOSPI. However, the continuing switch offirmsmay threaten Kfuture ability to remain competitive.
The switching firms do not consider the externality that switching weakens KOSDAQ and thrability to continue nurturing innovation. Only policymakers can address this externality through th
4 Also, we are not interested in determining the exact mechanism by which the benefit is obtained. Our focus is on whether the mainboard provides benefits to the switching firms that could possibly offset the macrostructure externality.
5 Despite its great success, KOSDAQ has repeatedly experienced problems ofmarket integrity common to growthmarkets: high (tran-sitory) volatility, speculative trading behavior, stock pricemanipulation,managers' embezzlement, and so on. These phenomena seriouslythreaten to erode investor confidence in KOSDAQ. The vulnerability of a growth market in market integrity is documented in Cummingand Johan (2013), who report that litigated cases of fraud in Canada, the U.K., and the U.S. occurred more frequently in growth marketswith lower listing standards than in main boards with higher listing standards.

to influence market design. In the end, the results suggest that policymakers should encourage those firmswhose characteristics fit the standalone growth market to remain listed on that market.
teriorat-most of, tradingy. In par-, there isthat im-and low-efined inrice effi-accuracys the ad-
ore pro-
. At firsto switcht benefit.a smallere failuree switch6 In mostificance.differentf a coun-
estic ando innova-ture pointurementslications.
249J.-H. Park et al. / Emerging Markets Review 29 (2016) 246–273
Our more specific findings are as follows:First, for the overall sample period, we find that the trading-relatedmarket quality mostly de
ed or remained unchanged following the switch from KOSDAQ to KOSPI; we find reductions inthe trading-related market quality dimensions such as liquidity (relative spread, market depthvolume, and number of trades), trade-execution cost, and institutional investors' trading activitticular, although the result was not statistically significant, price declined after the switch; thusno evidence that the switch caused an increase of the equity value. The only market statisticproved with statistical significance was volatility, measured by the difference between highestest prices on a single day. However, another measure of volatility, transient volatility, as dRanaldo (2004), deteriorated with statistical significance. The effects of listing switches on pciency were not uniform, and were not statistically significant; as a result of the switch, theof price discovery increased with the 5-minute variance ratio closer to 1 from below, whereaverse selection cost increased more than the decrease in transitory cost.
Second, the deterioration in trading-relatedmarket quality caused by the listing switch becamemnounced following the consolidation of KOSDAQ and KOSPI into KRX in 2005.
Third, our main empirical results are mixed in terms of signs and statistical significanceglance, this may appear to be a weakness, but it is actually a strength. The firms that chose tpresumably expected to benefit as a result, and we should expect to find evidence of thaThe results from almost all the previous studies showed that a firm switching its listing fromexchange such as Nasdaq to NYSE achieved a significant improvement in market statistics. Thto find statistically significant improvements in trading-related market quality following thfrom KOSDAQ to KOSPI indicates there is no evidence that the firms benefit from the switch.cases, we find different signs from those in the previous literature, with weak statistical signOnly in rare cases do we find the same signs with statistical significance. Our results have veryimplications from the previous literature, indicating that the specific market macrostructure otry matters.
The remainder of this paper is as follows. In Section 2, we briefly introduce KOSDAQ and its dominternational status. Section 3 reviews the literature regarding the importance of growth markets ttion and listing switching, and details the rationalewhy themarket's standpoint and themacrostrucof view are important. Section 4 describes our hypothesis, data, testingmodel, definitions andmeasof variables, and estimation method. In Section 5, we report the empirical results and their impSection 6 provides a summary of our results.
2. KOSDAQ's domestic and international status
guration,in IPOs
xchangepolicy tod KOSPIl market
tive smallhe listing
YSE. UnlikeI are the list-
2.1. KOSDAQ, the Korean standalone growth market
KOSDAQ was established in 1996 as an organized OTC stock market in Korea. Since its inauKOSDAQ has achieved remarkable growth in market capitalization as a result of the boomaround 2000. KOSDAQ evolved into a growth market independent of the Korea Stock E(KSE). KOSDAQ and KSE were later consolidated into the KRX in 2005 under a governmentbuild up the Korean stock markets, with the KSE renamed as KOSPI. Since then, KOSDAQ anhave been divisions of KRX and have served complementary roles in the Korean capitamacrostructure.
KOSDAQ has served primarily as a capitalmarket for information technology (IT)-related innovaandmedium enterprises (SMEs) that have reached the level of revenue or profitability specified in t
6 The relationship between KOSDAQ and KOSPI is somewhat different from the relationship between Nasdaq and the NNasdaq, KOSDAQ's tradingmechanism is exactly the same as that of KOSPI. Themain differences between KOSDAQand KOSP
ing and delisting standards, which are looser on KOSDAQ than KOSPI, and the characteristics of the listed firms. Most of the switchingfirms are big fish in the small pond of KOSDAQ, but only small fish on KOSPI. These facts may explain why listing switches fromKOSDAQ to KOSPI do not deliver the same benefits as switches from Nasdaq to the NYSE.
standards. Meanwhile, KOSPI is the flagship capital market in Korea for firms that are established and larger,and belong to traditional industries.7 KOSDAQ functions as a standalone market.8 Even though their roles are
includingtandards,
example,f those of
ets in theets. As ofwthmar-S$101bn)KOSDAQ.spectively, at 10%, isthanAIMountries'me, whilevanced or
the ability
nsuccess-eveloped
250 J.-H. Park et al. / Emerging Markets Review 29 (2016) 246–273
different in the Korean stockmarkets, KOSDAQ and KOSPI share a commonmarket microstructure,a common trading mechanism. The main differences between them are the listing and delisting swhich are looser on KOSDAQ than on KOSPI, and the characteristics of the listed firms.9
2.2. KOSDAQ, one of very few successful growth markets in the world
Domestically, the market activities of KOSDAQ are comparable to KOSPI by many measures; forthenumber of listedfirms and the turnover ratio (using thenumber of shares)were 131% and 166%oKOSPI, respectively.
Internationally, KOSDAQ has been also considered one of the very few successful growth markworld; besides Nasdaq, AIM and KOSDAQ are usually named as the most successful growth mark2011, themarket capitalization of KOSDAQwas US$92bn and it ranked fifth in theworld among grokets, with only Nasdaq (US$3,845bn), ChiNext (US$118bn), JASDAQ (US$110bn), and AIM (Uahead. Nasdaq is now a main board; ChiNext and JASDAQ serve much bigger economies than doesThe number of listed firms, trading volume, and number of IPOs ranked fourth, second, and fifth, re(World Federation of Exchanges, 2012). The ratio of KOSDAQ'smarket capitalization to that of KOSPIthehighest ratio of growthmarket tomain board in theworld; see footnote 3. Growthmarkets otherand KOSDAQ have remained subordinate markets, making only limited contributions to their cgrowth. KOSDAQ's successful development as a strong growth market within a short period of tiKorea was transitioning from an emerging to an advanced market, makes it a good model for ademerging industrial countries which aspire to establish a strong growth market.
3. Literature review and rationale for the market macrostructure point of view
3.1. The importance of growth markets in innovation
Black and Gilson (1998) emphasize the importance to venture capitalists and entrepreneurs ofof the venture capitalists to exit ownership through an IPO:
“Other countries have openly envied the U.S. venture capital market and have actively, but ufully, sought to replicate it. We offer an explanation for this failure: We argue that a well-d
is critical
ir portfo-term like
stock market that permits venture capitalists to exit through an initial public offering (IPO)to the existence of a vibrant venture capital market.” …
“First, we explain the importance of exit—why venture capital providers seek to liquidate thelio company investments in the near to moderate term, rather than investing for the long-
potentialy throughpreneurs
cially for in-
Japanese or German banks. Second, we explain the importance of the form of exit: why thefor the venture capital provider to exit from a successful start-up through an IPO, available onla stock market, allows venture capital providers to enter into implicit contracts with entre
7 Until recently, FreeBoard completed the Korean capital market macrostructure as the organized OTC stock market espe
termediate-mature unlisted firms. In sharp contrast to KOSDAQ, however, FreeBoard had not functioned well in its assigned role, one ofthe main concerns that Korean policymakers have struggled to resolve. In July 2013, Korean policymakers moved the best-performingpart of FreeBoard into KONEX, a newly-formed independent submarket of KOSDAQ. In August, 2014, they also restructured FreeBoardand renamed it as K-OTC. The Korean capital market macrostructure now consists of KOSPI, KOSDAQ, KONEX, and K-OTC.8 Within amarketmacrostructure, the growthmarket can act as a stepping stone throughwhich a growth firm is encouraged tomigrate tothe main board once mature; TSX Venture Exchange and GEM at HKEx are examples. Alternatively, the growth market can function as astandalone, independent market, retaining mature firms while attracting new growth firms. From the outset, KOSDAQ was intended to bea standalone market similar to Nasdaq, reflecting the high proportion of IT firms in the Korean economy. Currently, KOSDAQ remains astandalone growth market, even though since its consolidation into KRX in 2005, it no longer has an independent ownership structure. Asof the end of 2011, 459 (about 46.9%) firms out of 978 firms met the listing standards for KOSPI, but remained in KOSDAQ, confirming thatKOSDAQ has fulfilled its market macrostructural role as a standalone market rather than acting as a stepping stone market.
9 Details on the listing and delisting standards for KOSPI and KOSDAQ are shown in the Appendix.

concerning future control of startup firms, in a way not available in a bank-centered capital market.”(Black and Gilson, 1998, page 245)
themainwthmar-
251J.-H. Park et al. / Emerging Markets Review 29 (2016) 246–273
Note, however, that typical firms at the IPO stage find it difficult to meet the listing standards forboard. A strong growthmarket is the ideal environment for an IPO. Thus, the presence of a strong groket is important in supporting a strong venture capital sector.
ycle thatg tradersthe con-agnitudeity in the
) reportsal financethe com-fically forsegmentm the ad-efit from
ptions forlonemar-bmissionce whereBoard orely affectriseswitheir prod-
the firm'son listingai (2013)
q and/orobtainedmain re-ws. First,reported
iani et al.,sdaq and/bases andswitched
for the AIM
Successful firms which remain listed on the growth market contribute to a self-reinforcing cstrengthens the growth market. A vibrant market creates a positive network externality, drawinand dealers and thereby improving liquidity; see, for example, Economides (1993, 1996) (providingceptualization of this network externality) and Barclay and Hendershott (2004) (quantifying the mof the liquidity externality). If firms switched from the growth market to the main board, liquidgrowth market would suffer.
This scholarly work is also supported by practitioner sentiment. Grant Thornton (2015, page 5“AIM plays a key role in the UK's SME funding environment, allowing companies to raise externat different stages in their lifecycle and providing an exit route for early stage investors (such as forpany founder(s) or private equity investors). It also offers a regulatory framework designed specismaller, growing companies, proving less prescriptive than for companies listing on the Premiumof the London Stock Exchange's Main Market. As companies continue to grow, they also benefit frovisory and investor support network that has developed around AIM over the last 20 years and benthe ease with which they can return to the market to raise further funds.”
The HKEx and the Hong Kong Securities and Futures Commission (SFC) considered a variety of otheHongKongGrowth EnterpriseMarket (GEM). Practitioners favored the development of a standaket similar to AIM. Typical was Hong Kong Stockbrokers Association (2007), “As responded in our suto the Discussion Paper in 2006, we considered that the GEM Board should be positioned as a plaSMEs can raise funds and maintain their listing status without any pressure to transfer to the Mainthe stigma of staying on a ‘second rate’ board. Setting higher admission requirements would adversGEMas a capital formation platform for SMEs, particularly for those high andnew technology enterponly minimum cashflow and tangible assets but seeking to raise capital on GEM to commercialize thucts research and development.”10
3.2. Literature on listing switching
As briefly described in the Introduction, there are two strands of research on listing switching:standpoint and the market's standpoint. Regardless of the standpoint, all but one paper so farswitching has been conducted on the U.S. stock markets; the exception is Jenkinson and Ramadoron the U.K. stock markets.11
All research from the firm's standpoint has focused on what motivated firms on the NasdaAmerican Stock Exchange (AMEX) to switch the listings to NYSE and/or AMEX, what benefits theyfrom switching, or how much the stock returns or operating returns changed after switching.12 Thesults of the research on the motives and specific benefits from the firm's standpoint are as folloswitching a listing fromNasdaq or AMEX toNYSE increased liquidity and improvedprice discovery. Asin most of the related papers (e.g., Christie and Huang, 1994; Kadlec and McConnell, 1994; Elyas2000), this result is considered to be the most important motive for listing switching from the Naor AMEX to NYSE. Second, switching the listing to NYSE has helped firms to expand their investorincrease their visibility (Kadlec and McConnell, 1994; Jain and Kim, 2006). Third, the firms which
10 The practitioners' advice was not accepted, on the grounds that the regulatory structure in Hong Kongwas “not yet readymodel” (Hong Kong Exchanges and Clearing Limited, 2008).11
We are interested only in listing switches from the growth market to the main board, so the literature review discusses only papersdealing with such switches. However, there is another set of literature examining the listing switch from the main board and/or thegrowth market to OTC stock markets. This strand of research focuses on the firms which were delisted from NYSE and/or Nasdaq toOTCBB and/or Pink Sheets (Harris et al., 2008; Macey et al., 2008).12 According to the persons in charge of listing on Nasdaq, about 15 to 20 firms have switched their listings from NYSE to Nasdaq sincethe inception of Nasdaq, whereas about 20 Nasdaq firms have switched their listings to NYSE every year. Almost all the listing switchesfrom NYSE to Nasdaq, except for Aeroflot, occurred in recent years, indicating that Nasdaq has recently started to aggressively competewith NYSE.
their listings to NYSE obtained a type of bonding effect associated with the tighter regulatory standards onNYSE (Kadlec andMcConnell, 1994; Elyasiani et al., 2000; Jain andKim, 2006). Fourth, after switching their list-
s acquisi-d to othertives andf a switch
s increaseoperatingmanagerm's stockt for firmsalho andsegment,k returns,
inson andn Januaryand pricein tradingrovemententation
nson andmarket)
ith lighterncementtrast, theeturns ofturns oneof listinget, its op-
tch from aesmarketthe anal-
ing switch
ture, rath-ifferenceslay a role.ifferencesffers fromards; theySDAQ can
governance
252 J.-H. Park et al. / Emerging Markets Review 29 (2016) 246–273
ings to NYSE, the firms issued more debt and equity, and engaged in more asset transactions such ations, suggesting that the firms' listing switching decisions are often not isolated, but rather relateimportant corporate objectives (Kedia and Panchapagesan, 2011).13 All of these studies on the mobenefits from listing switches exhibit methodological limitations, in that they infer the motives ofrom the results of the switch.
The results on performance are as follows. Right after the listing switch, the firm's stock return(Jain and Kim, 2006; Jenkinson and Ramadorai, 2013) or decrease (Papaioannou et al., 2009) andreturns decrease (Papaioannou et al., 2003), perhaps because of the timing hypothesis, in which theselects the timing of listing switching to match the peak in the firm's financial situation. The firreturns decrease over mid- and long-term time-horizons; this phenomenon is particularly evidenthat switched their listings from Nasdaq to AMEX (Dharan and Ikenberry, 1995). De CarvPennacchi (2011) find that Brazilian firms that voluntarily migrated to the premium exchangewhich hasmore stringent disclosure and governance requirements, achieved abnormal positive stocsupporting a bonding effect.
Now, we turn to the two papers from themarket's standpoint: Bennett andWei (2006) and JenkRamadorai (2013).14 First, analyzing 39 firms switching their listings from Nasdaq to NYSE betwee2002 andMarch 2003, Bennett andWei (2006) report that thefirm's trading-relatedmarket qualityefficiency improved after the switch. They argue that the improvement arose from the differencemechanism (i.e., market microstructure). More specifically, they argue that the post-switch impof trading-relatedmarket quality and price efficiency came from the lower degree of order flow fragmunder the NYSE specialist mechanism compared to the Nasdaq dealer mechanism. Next, JenkiRamadorai (2013) examine the consequences of listing switching from AIM (exchange regulatedto theMM(EU regulatedmarket), and vice versa. They find that firms switching listings fromAIMwregulation to the MM with higher regulation experienced, on average, significantly positive annoureturns of about 5%, while the returns of these firms were broadly flat for a year thereafter. In confirms moving down from the MM to AIM experienced, on average, negative announcement rabout 5% and a strong positive return drift thereafter, with about 25% cumulative abnormal reyear following the switch. They attribute the results to the observation that themarket capitalizationswitch firms is generally small. That is, if a small firm switches its listing to the less-regulated markerating cost will reduce and, in turn, affect its returns eventually.
The present paper is also from the market's standpoint. It analyzes the effect of a firm's listing swismallermarket to themainboard on its trading-relatedmarket quality. Themarket's standpoint analyzstatistics and interprets the results from the switch as themarket's responses; this is very different fromyses carried out from the firm's standpoint. Hence, themarket's standpoint for the analyses on the listis valuable in overcoming the methodological weaknesses inherent in the firm's standpoint.
However, this paper differs fromBennett andWei (2006) in thatwe focus onmarketmacrostrucer than on market microstructure. Bennett andWei attribute their findings to the microstructure dbetweenNYSE andNasdaq, and do not consider the possibility that themacrostructure differences pBecause KOSPI and KOSDAQ had identical tradingmechanisms, we can control for microstructure din away that Bennett andWei could not, and focus on the effect ofmacrostructure. This paper also diJenkinson and Ramadorai (2013). Their argument is mainly based on the difference of listing standdo not consider market macrostructure. Our finding indicates that a vibrant growthmarket like KO
13 The firms which switch their listings to the main board may expect investors to view them as having better corporate
after the switch (see Claessens and Yurtoglu, 2013). However, this benefit is not relevant for this paper since KOSPI and KOSDAQ havealmost the same listing standards for minimum float, the only listing standard related to the corporate governance in these twomarkets.14 Johan (2010) and Cumming and Johan (2013) study listing standards from themarket’s standpoint, but donot studyfirms that switchlisting. Analyzing the main boards and growth markets in Canada, the U.K., and the U.S., Johan (2010) and Cumming and Johan (2013)argue that the listing standards are the foremost determinant of IPO performance and preparedness, and the frequency of fraud cases,which are elements of market quality. Park, Nam, and Eom (2007) examine the market efficiency of AIM, KOSDAQ, and Nasdaq fromthe market macrostructure point of view, focusing on volatility. Decomposing volatility of the major indices of the main boards and thegrowth markets in Korea (KOSPI 200, KOSPI 50), the U.K. (FTSE 100, FTSE AIM), and the U.S. (S&P 500, Nasdaq 100) into permanentand transitory components, they insist that the market efficiency of KOSDAQ is comparable to Nasdaq and AIM.
provide trading-related market quality to its listed firms similar to the trading-related market quality theywould obtain after a switch to KOSPI. If trading-related market quality is higher overall for firms listed on
I from the
from theance) fors (includ-hile it in-nce about
ings fromrms thatcteristics,ure own-biased inr that ad-market'sifference
view en-re. Thereortant so-firm re-
fits in theKOSDAQSDAQ totemplat-ly modestistings on
g trading-an on thesuperior
s trading-sting andare eitherresult of amatching
SPI. The re-presentative
253J.-H. Park et al. / Emerging Markets Review 29 (2016) 246–273
KOSPI, it is because KOSPI-listed firms have different characteristics from KOSDAQ-listed firms.
3.3. Rationale for the market macrostructure point of view
Why is it important to understand the listing switch phenomenon of the KOSDAQ firms to KOSPmarket's standpoint by the market macrostructure point of view? The rationale is as follows:
First, analysis from the firm's standpoint has amethodological flaw. Asmentioned above, studiesfirm's standpoint are intended to explain the switching firm's motives (such as benefits or performthe switch. To do this, the analysis from the firm's standpoint tests the differences of market statisticing some trading-relatedmarket quality measures) between before and after the switching event, wterprets the results from the differences of market statistics as themotives of the switch. The inferemotives is at best indirect.
Second, there is a self-selection issue arising from the fact that firms that choose to switch listKOSDAQ to KOSPI may differ systematically from those that choose not to switch. Indeed, the fiswitch are presumably those that anticipate benefits from switchingwith their currentmarket charafuture expectations of corporate cash flow, plans of capital structure and investment, current and futership and control structure, etc. Any approach which ignores this endogeneity problem would bethe direction andmagnitude of finding benefits to switching. Of the previous research, the only papedresses this endogeneity problem is Bennett and Wei (2006), who analyzed the question from thestandpoint. However, Bennett and Wei dealt with only one aspect of market microstructure, the din trading mechanism.
Third, the analysis of the listing switch phenomenon from the market macrostructure point ofables us to get economically meaningful insights for the design of a country's market macrostructuis an important positive externality that regulators need to take into account. KOSDAQprovides impcial benefits in its function as a growth market, providing capital to IPOs and IT-related SMEs. A newceives these benefits when it initially lists on KOSDAQ, and the prospect of receiving such benefuture should help in attracting venture capital. When the firm matures, its continued listing onhelps KOSDAQ in providing a market for new firms. When a firm switches its listing from KOKOSPI, it undermines KOSDAQ's ability to provide these benefits to new firms. An individual firm coning switchingwill not take this externality into account, but regulators should. If KOSPI provides onor no meaningful benefits to firms that switch, regulators should encourage firms to retain their lKOSDAQ in order to maintain it as a strong standalone growth market.
4. Empirical analyses
4.1. Hypothesis
Asmentioned in the Introduction, this paper focuses on the exchange's functioning (i.e., providinrelated market quality) for the switching firms, which is a market macrostructure issue, rather thswitching firms' motives.15 Thus, we address the following specific question: Does KOSPI provide atrading environment to KOSDAQ for firms that switch?
From the market's point of view, a superior trading environment would be reflected in the variourelated market quality measures; see Section 4.3.4. Since KOSDAQ and KOSPI differ only in the lidelisting standards and the characteristics of the listed firms, the only possible benefits to switchingdriven by firm characteristics, or are reputational (the firm is recognized as large or established as aKOSPI listing), or arise from the bonding effect associated with KOSPI's tighter listing standards. The
15 With assistance from KRX, we undertook an informal survey on the motivation for firms switching from KOSDAQ to KOsponses are as follows: (1) Weakness of the stable investor base due to the lack of institutional/foreign investors, (2) Lack of re
stocks (e.g., large and blue chips) in KOSDAQ to play a leading role, (3) Persistence of the negative image of KOSDAQ. All of these motivesare eventually related to a belief that stocks might be undervalued on KOSDAQ, and that switching the listing to KOSPI might increasethe price. However, as we found, switching listings did not result in increases in stock prices.
technique allows us to control for firm characteristics. However, the reputational and bonding effects cannot bemeasured directly, and in particularwe cannot distinguish between them. And in any case, our goal is not to de-
e marketeasures:d marketdress ourt the neg-ability tos no better.
254 J.-H. Park et al. / Emerging Markets Review 29 (2016) 246–273
termine either firm's motives or the specific nature of the benefits from switching. However, using thmacrostructure view allows us to measure the total benefit through trading-related market quality msophisticated investors' (institutional/foreign investors') trading activity and a general trading-relatequality measure, full-information transaction cost (FITC) (see Section 4.3.4). This allows us to admain policy question: Are there market-quality benefits to individual firms from switching that offseative macrostructure externality that arises when firms switch, thereby likely weakening KOSDAQ'sfoster innovation? Our Null Hypothesis is: The trading environment provided by the main board, KOSPI, ithan that would be provided by the established standalone growth market, KOSDAQ, for firms that switch
4.2. Methodology
nce (DID)
ent effect.emain ontely, any-
is endog-egressionhing deci-e sample
ample se-h actuallyg volume,the latterobservedy without
t of listing-invariantstimation.ting. For aerved re-e cannot
or recovert, specifi-ect on thes treated.s equal tothe treat-ponses ofnt, and ofafter the
ting fromre beforeto firm i
y (see the
With the listing switch as a treatment, we test our Null Hypothesis using difference-in-differemethodology, for the following reasons:
If we could carry out a randomized controlled experiment, we could easily measure the treatmThat is, if we could randomly force a listing switch on some firms, while forcing other firms to rKOSDAQ, the listing switching effects on trading-relatedmarket quality could be derived. Unfortunaone cannot conduct such a randomized controlled experiment.
Our data is based on those firms that chose to switch voluntarily, where the decision to switchenous and not randomly assigned. As a result, a two sample difference test or OLS estimation of the rwith a dummy for switching is potentially affected by sample selection bias. However, if the switcsion is based only on observable characteristics, i.e., selection-on-observables, thenwe can remove thselection bias by controlling for those observables.
Thematching technique used in this paper is one of a large number ofmethods for controlling for slection bias. To utilize the matching technique, we construct our sample with the 38 firms whicswitched their listings from KOSDAQ to KOSPI and 38 KOSDAQ firms matched based on price, tradinmarket capitalization, and volatility. The former set offirms can be considered the treatment group andthe control group. The major assumption of the matching technique is that once we control for thecharacteristics affecting the decision, whether the decision is made or not is determined randomlany systematic factors.
With daily or intraday unbalanced panel data for all 76 firms, we get DID estimates of the effecswitching on trading-related market quality. Meanwhile, we can also remove the unobserved timefirm specific effects which potentially cause the listing switch, by applyingfixed-effects panel data e
Now, we turn to the meaning of treatment effect and the computation of DID in our specific setfirm i, the individual treatment effect would be defined as yi(1)−yi(0), where the yi(1) is the obssponse for treatment and yi(0) is the response (or outcome) for no treatment. However, the fact thatwobserve the quantity yi(0) makes it difficult to measure the treatment effect. So we should estimatethe counterfactual outcome yi(0). On the other hand, we are ultimately interested in the mean effeccally, the average conditional on receiving the treatment. This is called ATT (average treatment efftreated). The ATT is defined as follows: ATT=E [yi(1)−yi(0)| i∈T], where i∈T means that subject i i
Under the assumption that we have properly matched the treatment and control groups, ATT ithe following DID: DID=E[yi(1,a)−yi(0,b)| i∈T]−E[yj(0,a)−yj(0,b)| j∈C], where T and C denotement group and the control group, respectively and yi(1,a), yi(0,b), yj(0,a) and yj(0,b) is the restreated i after the treatment, of treated i before the treatment, of non-treated j after the treatmenon-treated j before the treatment, respectively. These quantities can all be observed before andtreatment and for the treated and non-treated subjects.
In this paper, we use an applied version of the DID technique. Suppose a firm i switched its lisKOSDAQ to KOSPI and yi ,s
b and yi ,ta are the observed values of a trading-relatedmarket qualitymeasu
and after the listing switch, respectively.16 Moreover, suppose a firm j(i) is the firm best matchedunder a distance criterion defined from price, trading volume, market capitalization, and volatilit
16 The subscripts s and t denote trading days before and after the listing switch event, respectively.
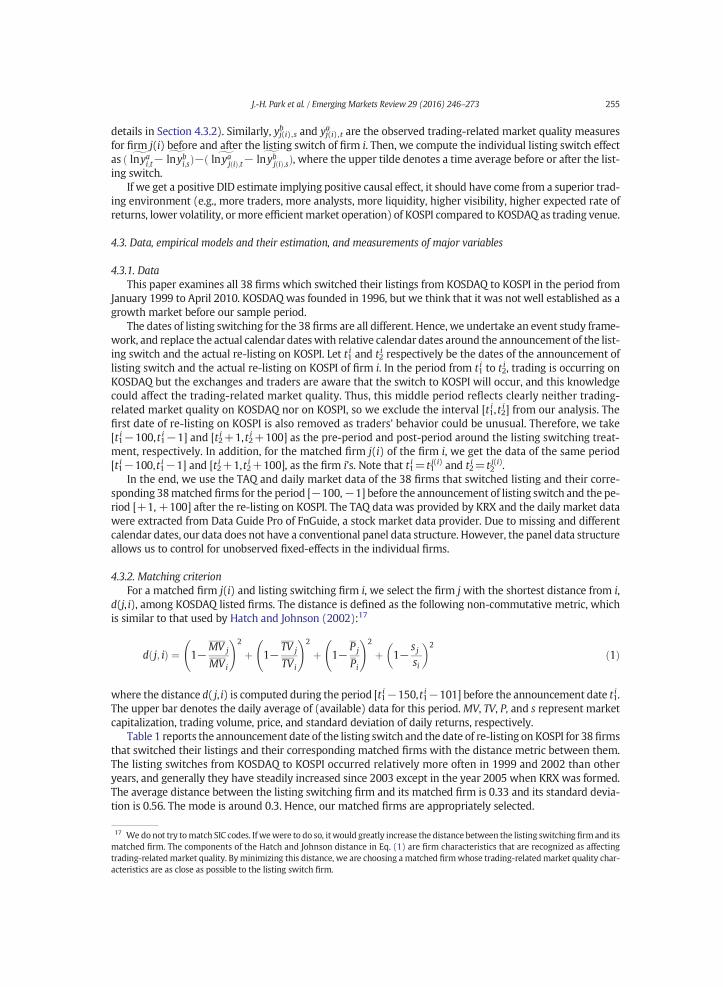
details in Section 4.3.2). Similarly, yj(i),sb and yj(i),ta are the observed trading-related market quality measures
for firm j(i) before and after the listing switch of firm i. Then, we compute the individual listing switch effectg g r the list-
rior trad-ed rate ofng venue.
riod fromished as a
dy frame-f the list-ement ofurring onowledgetrading-lysis. The, we takeing treat-e period
eir corre-d the pe-rket datadifferentstructure
ce from i,ric, which
ð1Þ
255J.-H. Park et al. / Emerging Markets Review 29 (2016) 246–273
as ð glnyai;t− lnybi;sÞ−ð glnyajðiÞ;t− lnybjðiÞ;sÞ, where the upper tilde denotes a time average before or afteing switch.
If we get a positive DID estimate implying positive causal effect, it should have come from a supeing environment (e.g., more traders, more analysts, more liquidity, higher visibility, higher expectreturns, lower volatility, or more efficientmarket operation) of KOSPI compared to KOSDAQ as tradi
4.3. Data, empirical models and their estimation, and measurements of major variables
4.3.1. DataThis paper examines all 38 firms which switched their listings from KOSDAQ to KOSPI in the pe
January 1999 to April 2010. KOSDAQwas founded in 1996, but we think that it was not well establgrowth market before our sample period.
The dates of listing switching for the 38 firms are all different. Hence, we undertake an event stuwork, and replace the actual calendar dateswith relative calendar dates around the announcement oing switch and the actual re-listing on KOSPI. Let t1i and t2
i respectively be the dates of the announclisting switch and the actual re-listing on KOSPI of firm i. In the period from t1
i to t2i , trading is occ
KOSDAQ but the exchanges and traders are aware that the switch to KOSPI will occur, and this kncould affect the trading-related market quality. Thus, this middle period reflects clearly neitherrelated market quality on KOSDAQ nor on KOSPI, so we exclude the interval [t1i , t2i] from our anafirst date of re-listing on KOSPI is also removed as traders' behavior could be unusual. Therefore[t1i−100,t1i−1] and [t2i+1, t2i+100] as the pre-period and post-period around the listing switchment, respectively. In addition, for the matched firm j(i) of the firm i, we get the data of the sam[t1i−100,t1i−1] and [t2i+1,t2i+100], as the firm i’s. Note that t1i=t1
j(i) and t2i=t2
j(i).In the end, we use the TAQ and daily market data of the 38 firms that switched listing and th
sponding 38matched firms for the period [−100,−1] before the announcement of listing switch anriod [+1, +100] after the re-listing on KOSPI. The TAQ data was provided by KRX and the daily mawere extracted from Data Guide Pro of FnGuide, a stock market data provider. Due to missing andcalendar dates, our data does not have a conventional panel data structure. However, the panel dataallows us to control for unobserved fixed-effects in the individual firms.
4.3.2. Matching criterionFor a matched firm j(i) and listing switching firm i, we select the firm j with the shortest distan
d(j, i), among KOSDAQ listed firms. The distance is defined as the following non-commutative metis similar to that used by Hatch and Johnson (2002):17
d j; ið Þ ¼ 1−MV j
MV
!2
þ 1−TV j
TV
!2
þ 1−P j
P
!2
þ 1−s jsi
� �2
nt date t1i .t market
r 38 firms
i i i
where the distance d( j, i) is computed during the period [t1i−150,t1i−101] before the announcemeThe upper bar denotes the daily average of (available) data for this period.MV, TV, P, and s represencapitalization, trading volume, price, and standard deviation of daily returns, respectively.
Table 1 reports the announcement date of the listing switch and the date of re-listing on KOSPI fo
en them.an others formed.rd devia-firm and itsas affecting
that switched their listings and their corresponding matched firms with the distance metric betweThe listing switches from KOSDAQ to KOSPI occurred relatively more often in 1999 and 2002 thyears, and generally they have steadily increased since 2003 except in the year 2005 when KRX waThe average distance between the listing switching firm and its matched firm is 0.33 and its standation is 0.56. The mode is around 0.3. Hence, our matched firms are appropriately selected.
17 We do not try tomatch SIC codes. If wewere to do so, it would greatly increase the distance between the listing switchingmatched firm. The components of the Hatch and Johnson distance in Eq. (1) are firm characteristics that are recognized
trading-relatedmarket quality. Byminimizing this distance, we are choosing a matched firmwhose trading-relatedmarket quality char-acteristics are as close as possible to the listing switch firm.
4.3.3. Main and complementary empirical models and their estimation
amework
ð2Þ
Table 1Sample firms and distancemetrics for matching. This table reports the announcement dates and the dates of re-listing on KOSPI for all 38firms which switched their listings from KOSDAQ to KOSPI between January 1999 and April 2010. For each listing switching firm, thename of the matched firm and the distance metric between the listing switching firm and its matched firm are provided. As of the endof 2010, 459 (about 46.9%) firms out of 978 firms met the listing standards for KOSPI, but remained in KOSDAQ.
Name of the listing switching firm Announcement date Date of re-listing on KOSPI Matched firm Distance
DCM Corp. 7/5/99 8/18/99 Finetec 0.01416Hyundai Heavy Industries 6/8/99 8/24/99 Blumum Co., Ltd. 1.33895Kira Telecom 9/3/99 11/18/99 Bitcomputer 0.04125UNIMO C&C 6/10/99 11/26/99 KB Autosys 2.37846Daewon Pharm. Co. Ltd. 8/31/99 12/15/99 Paradise Industry 0.10803TLC Leisure 11/4/99 1/6/00 Choa Pharm 0.19291Hansae Yes24 Holdings 9/27/99 1/6/00 Genexel 0.15705Korea Refractories 9/8/00 10/16/00 Kores 0.04534Woongjin Coway Co., Ltd. 6/28/01 8/7/01 G.I. Blue Co., Ltd. 0.05541Feelux Corp. 11/28/01 12/26/01 Depassion 0.02654Kolmar Korea 1/3/02 4/9/02 Taechang 0.07482Wooshin System Co., Ltd. 4/12/02 5/28/02 Turbotek 0.02381Shinsegae E&C 4/16/02 6/17/02 Jautour 0.04805Kyobo Securities 5/27/02 7/18/02 Edu Ark Co., Ltd. 0.06676Sejong Industrial Co., Ltd. 6/3/02 9/25/02 Wonik Co., Ltd. 0.00732S&T Holdings 9/18/02 10/22/02 Seoul Semiconductor 0.25765Maniker Co., Ltd. 7/4/02 10/29/02 DASAN Networks, Inc. 0.04286Tae Kyung Chemical Co., Ltd. 5/29/02 1/28/03 Yangjisa Co., Ltd. 0.08973NCsoft Corp. 10/11/02 5/22/03 GHS 0.25028SBS 4/3/03 6/25/03 Hantong Data 1.64257Kangwon Land 3/5/03 9/4/03 Daum Communications 0.89802Isupetasys Co., Ltd. 2/28/03 10/7/03 Dongjin Semichem Co., Ltd. 0.03197IBK 2/12/03 12/24/03 Hantong Data 1.64257KTF 3/8/04 4/29/04 Humax Holding Co., Ltd. 0.84178Infac Corp. 3/8/04 9/21/04 SAMIL Co., Ltd. 0.22184Sangshin Brake 2/24/04 10/27/04 Dong Yang S-Tec 0.04412Samho Development 12/16/04 5/12/05 GK Power Co., Ltd. 0.00988Shinsegae I&C 2/10/06 5/18/06 Dae Sun Shipbuiliding &
Engineering Co., Ltd.0.35299
Woojin Plaimm Co., Ltd. 3/3/06 5/24/06 Testech Inc. 0.00937Cosmax 7/13/06 11/13/06 Eyedream 0.02788Korea United Pharm Inc. 10/10/07 10/23/07 Cell Biotech 0.00495Asiana Airlines 1/28/08 3/28/08 Interpark Int. 0.55144LG U-Plus 2/26/08 4/21/08 SK Broadband 0.51482Bukook Steel Co. 8/6/08 10/10/08 Woojeon & Handan 0.02802NHN 10/2/08 11/27/08 Seoul Semiconductor 0.25765Kiwoom Securities Co. 5/12/09 8/3/09 Neowiz Games 0.06899Hwang Kum Steel & TechnologyCo., Ltd.
5/18/09 10/29/09 Sewoonmedical Co., Ltd. 0.02700
Shinsegae Food Co., Ltd. 2/17/10 4/29/10 Credu Co., Ltd. 0.17378
256 J.-H. Park et al. / Emerging Markets Review 29 (2016) 246–273
4.3.3.1. Main analyses. To obtain DID estimates from the main analyses, we employ a regression frwith dummy variables. We specify the regression model as follows:
ln yi;τ� �
¼ α þ βDTi þ γDKOSPI
i;τ þ δ DTi � DKOSPI
i;τ
� �þ θ
0Dmonthi;τ þ φ
0zi;τ þ μ i þ εi;τ
i i i i� �
ent of ang volume,ms of the
τ ¼ t1−100;⋯; t1−1; t2 þ 1;⋯; t2 þ 100
In Eq. (2), the dependent variable yi ,τ is a trading-related market quality measure, an elemexchange's trading environment, in each analysis. So yi ,τ is relative spread,market depth, price, tradinvolatility, trade-execution cost, or sophisticated investors' trading activity.We use the natural logarith
t group ofif firm i is
dependent variables to ensure that the units do not matter. Letting T and C in Eq. (2) be the treatmen38 listing switching firms and the control group of 38matched firms, respectively, the dummyDi
T is 1

in T, 0 if thefirm is inC. So for a listing switchingfirm i,DiT=1and for thematchedfirm j(i) of thefirm i,Dj(i)
T =0.The dummy Di ,τ
KOSPI denotes the trading venues for the pre-period [t1i−100, t1i−1] and the post-periodi i e date of
ate of re-oefficient
emonth-ntrol var-whetheriration ofations ine variablet conven-gression.rolling forservablesween theliminatedffects es-
, random-imation israndom-
analysesed spreadacKinlayand afterowing re-
ð3Þ
257J.-H. Park et al. / Emerging Markets Review 29 (2016) 246–273
[t2+1, t2+100] around the listing switching of a firm i, so that it is 1 if the relative date τ is after thre-listing on KOSPI of the firm i, 0 otherwise. For the matched firm j(i), Dj(i),τ
KOSPI is 1 if τ is after the dlisting on KOSPI of the firm i, 0 otherwise. We should note the interaction term Di
T×Di ,τKOSPI, since its c
δ embodies DID. That is, the estimate of δ is the DID estimate.On the other hand,Di ,τ
month is a set of dummies representing the actual calendarmonths.With thesly dummies,we can control for themonthly common effects. The variable zi ,τwould include other coiables. In this study, to control for the witching-day effect, we use a dummy variable which indicatesor not the date τ is a witching day. We define a witching day to be a day with simultaneous expKOSPI200 index futures and options.18 With this variable, we control for the substantial fluctuprice and trading patterns of the associated underlying stocks in our sample on witching days.19 Thμi represents unobserved fixed-effects (or time-invariant effects) of firm i. Although our data is notional panel data, we can applyfixed-effects estimation aswell as random-effects estimation in the re
To get theDID estimate in regression Eq. (2), we primarily employ fixed-effects techniques. Contthe listing switch selection with the matching framework under the assumption of selection-on-obwill reduce and might eliminate the selection bias. However, if there still remains a correlation betlisting switching decision and unobserved firm-specific characteristics, not all of the bias will be ebymatching. Since fixed-effects estimation removes the unobserved time-invariant effects μi, fixed-etimates are robust to the bias resulting from the correlation of μi and listing switching decision.
However, if there is an unobserved effect μi which is not related to the listing switching decisioneffects estimation can be more efficient than fixed-effects estimation.20 Hence, the fixed-effects estthe most appropriate for our analytic situation, but we cannot rule out the potential benefits of theeffects estimation. Therefore, we report both estimates for our empirical results.
4.3.3.2. Complementary analyses on price efficiency. To obtain DID estimates from the complementaryon price efficiency, we use two components (adverse selection cost and transitory cost) of the impliof Madhavan et al. (1997, hereafter “MRR”) and the 5-minute variance ratio proposed by Lo and M(1988) for our dependent variables. Since we can estimate only a statistic for the periods beforethe listing switch for these variables, we cannot use regression Eq. (2). Hence, we employ the follgression equation to test the effect of listing switch from KOSDAQ to KOSPI on price efficiency.
ln yi;u� �
¼ α þ βDTi þ γDKOSPI
i;u þ δ DTi � DKOSPI
i;u
� �þ μ i þ ϵi;u u ¼ 0;1ð Þ
f adversery cost ofy Lo and
In Eq. (3), the dependent variable yi ,u isMRR ratio, Theta, Phi, and VR.MRR ratiodenotes the ratio oselection cost to the MRR implied spread; Theta and Phi denote adverse selection cost and transitothe MRR implied spread, respectively. VR denotes the 5-minute variance ratio provided b
r a listingsents theched firmed above,ng period
ond, respec-
MacKinlay (1988).The dummy variable Di
T is defined the same way as in Eq. (2). That is, the dummy DiT is 1 fo
switching firm i or 0 for the matched firm j(i). In the dummy variable Di ,uKOSPI, the time index u repre
pre- (coded by 0) or post- (coded by 1) period of re-listing of a listing switching firm i and its matj(i). So Di ,u
KOSPI is 0 for the pre-listing-switching period or 1 for the post-re-listing period. As mentionwe can get only one value for the dependent variable for each pre-listing-switching and post-re-listiby the estimation of Eq. (3). This is the reason why the time index u denotes only two periods.
18 As of 2012, trading volumes (using thenumber of contracts) forKOSPI200 index futures and options rankedninth and sectively, in the world (World Federation of Exchanges, 2012).19
Barclay et al. (2008) argue that prior to November 2004 when Nasdaq introduced the opening call auction, the NYSE's opening callperformed better than Nasdaq on non-witching days and much better than Nasdaq on witching days, which generate large liquidityshocks at the open as a result of theU.S. settlement procedure.We can infer from their results that themain boardmight bemore efficientthan the growthmarket in liquidity crunch time such aswitching days. By including thewitching-day dummyvariable in our analyses, wecontrol for this possibility.20 If therewere no unobserved effect μi, OLS estimation could be adequate. However, itwould be difficult for such an assumption to holdin our data.
We should note the interaction term DiT×Di ,u
KOSPI, since its coefficient embodies DID.We cannot include themonthly dummies or witching day dummy. The variable μi represents unobserved fixed-effects of firm i. As in
ply fixed-
pply a ro-ence,weer homo--effects orsman test
258 J.-H. Park et al. / Emerging Markets Review 29 (2016) 246–273
the estimation for regression Eq. (2), although our data is not conventional panel data, we can apeffects estimation as well as random-effects estimation for the regression.
On the other hand, in our fixed-effects and random-effects estimations for Eqs. (2) and (3), we abust estimation to compute the standard errors taking the heteroscedasticity of errors into account. Hdeliberately do not carry out the Hausman test for the null of exogeneity of all covariates. Even undscedasticity, as noted in Baltagi (2005, p. 19), the Hausman test cannot identify whether a randomfixed-effects estimation is suitable.With heteroscedasticity, it is doubly inappropriate to use theHauto select between random-effects and fixed-effects estimations.21
4.3.4. Measurements of trading-related market quality
In this paper, various variables representing trading-related market quality are used as dependent vari-the effectres, price,
ectly from
is defined
he sumof
ily lowest
e twenty-des, as in20 trans-t volatility
flects thent for our
ction costtion pricebased on
aning of the
ables yi ,τ in regression Eqs. (2) and (3). The DID estimate in a regression for each variable measuresof listing switching on that trading-related market quality variable. We use several liquidity measuvolatility, trade-execution cost, investors' trading activity, and price efficiency measures.
We categorize our variables into four groups. The first group includes the variables computed dirthe market statistics.22 These variables are computed as follows:
• Relative spread: Daily average (over time) of intraday relative spreads. Intraday relative spreadas (best ask price− best bid price) / {(best ask price + best bid price) / 2}.23
• Market depth: Daily average (over time) of intradaymarket depth.Market depth is defined as tthe order size at the best bid price and the order size at the best ask price.
• Trading volume: Daily total amount of trading in Korean won.• Number of trades: Daily total number of trades.• Price: Daily closing price which is adjusted to control for discontinuous changes of price.24
• High-low volatility: (daily highest price − daily lowest price) / {(daily highest price + daprice) / 2}.
• Transient volatility: Daily average of the transient volatilities of transactions (beginning with thfirst) that occurred on that day. We use transient volatility using a transaction time of 20 traRanaldo (2004) and Eom et al. (2007). For a given transaction t on a given day, we consider theactions t, t−1, t−2,…, t−19, which yield 19 continuously-compounded returns; the transienat transaction t is defined to be the standard deviation of these 19 returns.
We use twomeasures for volatility, high-low and transient volatility. Transient volatility better reidiosyncratic characteristics of a given market than high-low volatility, and hence is more importapurposes.
The second group comprises trade-execution cost for which we use full-information transa(FITC) of Bandi and Russell (2006). After decomposing the transaction price into the full-informa(or true price) and error due to microstructural effects,25 they provide a consistent estimator (
21 This point seems poorly understood among applied researchers, many of whom seem tomisunderstand the role and me
Hausman test in panel data analysis. In the same vein, the Hausman test cannot identify whether the endogeneity problem still remainsafter the instrumental variable (IV) estimation. However, unfortunately,many scholars use the test to confirm the validity of instruments.22 Transient volatility does not belong to this group, but we include this variable here to compare it with high-low volatility.23 We do not use (absolute) spread for our analyses since it varies significantly depending on themarket's characteristics and respondssensitively to price changes. Sincemany previousworks inmarketmicrostructure have used this variable, however, wemake some com-ments on the results referring to (absolute) spread for comparison.24 Events which may cause a discontinuous trend of stock price include M&A, seasoned equity offering, capital reduction, ex-dividend,ex-rights, stock split, and so on.25 According to Bandi and Russell (2006), the true price is defined as the full-information price reflecting both public and private infor-mation at a given time. Market microstructure effect includes price discreteness, inventory costs that the market maker passes on totraders in the form of the bid-ask spread, and the systematic losses that uninformed traders incur when tradingwith the better informed(Eom et al., 2007).
intraday data) of FITCwhich is essentially the standard deviation of the error with autocorrelation considered.A decrease in FITC indicates an improvement in trading-related market quality.
s' tradingof a stockexisting
investorsd marketinvestorsrs' share-with thet qualityestors innvestors'
aily total
l trading
wo com-nute var-variablesobtain a
3, we uti-lts to the
the mainion of theso shows
teractionpendentod are as
ity. Moreume andd. Mean-all the li-ot rejecth respect
ng the post-ely controls
259J.-H. Park et al. / Emerging Markets Review 29 (2016) 246–273
The third group consists of twomeasures of investors' trading activity: institutional investoractivity and foreign investors' trading activity. These variables serve as proxies for the visibilityto sophisticated investors (or the level of sophistication of investors), which is viewed in theliterature as one of the main motives for firms to switch their listings. The more sophisticatedsuch as institutional or foreign investors in Korean stock markets improve the trading-relatequality since they facilitate price discovery or price efficiency. The level of sophistication ofin the existing literature is measured by the number of analyst reports or institutional investoholding (Kadlec and McConnell, 1994; Jain and Kim, 2006), variables that have little to docharacteristics of the exchange. Since we are looking at the change in trading-related markefor a given firm in switching their listing, we need to define the level of sophistication of invterms of trading-related market quality. Hence, we define the following two measures of itrading activity:
• Institutional investors' trading activity: 100 × (institutional investors' daily buy and sell) / (dtrading volume).
• Foreign investors' trading activity: 100 × (foreign investors' daily buy and sell) / (daily totavolume).
Finally, the variables in the fourth group reflect price efficiency on the exchanges. We use tponents (adverse selection cost and transitory cost) of the MRR implied spread and the 5-miiance ratio proposed by Lo and MacKinlay (1988). These final group variables differ from thein the other three groups in that we cannot compute daily values of the variables. Instead, westatistic for the periods before and after the listing switch. Hence, as mentioned in Section 4.3.lize the test results based on theMRR implied spread and variance ratio as complementary resuothers.
5. Empirical results
5.1. Results from the analyses for the overall sample period
Table 2 presents the DID estimates based on the fixed-effects estimation of Eq. (2), which areresults of this paper. We focus on the fixed-effects estimates because they control for the correlatunobservables with the listing switching decisions. However, as a robustness check, the Table althe DID estimates based on random-effects estimation.
As noted in Section 4.3.3, our attention in Eq. (2) is focused on the coefficient δ of the interm Di
T×Di ,τKOSPI, which represents the effect of the treatment of listing switching on the de
variable. The DID estimates based on fixed-effects estimation for the overall sample perifollows:
First, the listing switching from KOSDAQ to KOSPI resulted mostly in a reduction in liquidspecifically, after the switch to KOSPI, the relative spread increased,26 both the trading volthe number of trades decreased, so that the liquidity in terms of spread and volume deterioratewhile, the liquidity in terms of market depth marginally improved. However, the effects onquidity measures except the number of trades were statistically insignificant. Thus, we cannour Null Hypothesis that the trading environment is no better on KOSPI than on KOSDAQ witto liquidity.27
26 There may be a concern that this result on the relative spread could be affected by a change in the relative spread duriswitching period that is unrelated to the stock's switch to KOSPI.We think that 100 days of the post-switching period effectiv
for it. For a robustness check, however, we added to Eqs. (2) and (3) trading volume, stock price, and the stock price volatility as themaindeterminants of the relative spread (see Brockman and Chung, 2003; Narayan et al., 2014), and checked the DID estimates. The resultswere qualitatively similar to those from our main and complementary analyses. So were the results for FITC and MRR, for which theremay be similar concerns. Detailed results are available from the authors on request.27 Most of the switching firms become small fish on KOSPI, so that investor inattention might be a factor in this result.
Table 2Regression results from the analyses for the overall sample period. This table provides the results of estimations by fixed-effects (FE) and random-effects (RE) for each dependent variable in Eq. (2). De-pendent variables are (absolute) spread, relative spread, market depth, price, trading volume, number of trades, high-low volatility, transient volatility, Bandi and Russell's (2006) full-information trans-action cost (FITC), institutional investors' trading activity, and foreign investors' trading activity.We use logarithms of all the dependent variables so that the unit of each dependent variable is not an issue.The DID estimatemultiplied by 100 indicates the effect of listing switchingmeasured in percentage terms. The sample firms include all 38 firmswhich switched their listings fromKOSDAQ to KOSPI in theperiod from January 1999 to April 2010 and their corresponding firms matched with a distance criterion defined from price, trading volume, market capitalization, and volatility. The daily values derivedfrom either their daily or intraday data are used.We consider relative dates from−100 to−1 before the announcement date of listing switching and from+1 to+100 after the re-listing date; we includea date in our sample only if we can obtain data for both the listing switching firm and its matched firm on that date. Our interest is focused on the coefficient estimate of the interaction term, Di
T × Di,τKOSPI,
since it represents DID for the effect of listing switching.DiT is a dummy representingwhether firm i is a listing switcher or itsmatched firm j(i).Di,τ
KOSPI is a dummywhich is 1 if the relative date τ is after thedate of re-listing on KOSPI of the firm i, 0 otherwise. Dwitching is a dummy for a witching day, defined as a day of simultaneous expiration date of both futures and options on the KOSPI200 index. Monthlydummies for calendar-based months are included in all regressions. Note that the coefficient of Di
T cannot be identified under fixed-effects estimation. The figures in the parentheses below the estimatesare z-values. ⁎, ⁎⁎, and ⁎⁎⁎ denote the two-sided 10%, 5%, and 1% statistical significances, respectively. All standard errors are computed through Huber-White robust estimation.
ln(absolute spread) ln(relative spread) ln(market depth) ln(price) ln(trading volume) ln(number of trades)
FE RE FE RE FE RE FE RE FE RE FE RE
DiT 0.1188 −0.1579 −0.0765 −0.6516⁎ 0.0201 −0.1151
(0.434) (−0.989) (−0.273) (−1.860) (0.045) (−0.376)Di,τKOSPI −0.0425 −0.0968 −0.1488⁎ −0.1849⁎⁎⁎ −0.1451 −0.0423 0.0222 0.0236 0.3715 0.4368⁎⁎ 0.3123 0.3412⁎⁎
(−0.254) (−0.810) (−1.755) (−2.691) (−0.755) (−0.278) (0.231) (0.256) (1.349) (2.306) (1.503) (2.435)DiT × Di,τ
KOSPI −0.0038 −0.0030 0.0441 0.0446 0.0071 0.0061 −0.1211 −0.1211 −0.1937 −0.1933 −0.2902⁎ −0.2911⁎
(−0.029) (−0.023) (0.511) (0.515) (0.042) (0.036) (−1.517) (−1.516) (−1.066) (−1.054) (−1.947) (−1.946)Dwitching 0.0004 −0.0007 −0.0147 −0.0159 0.0164 0.0185 0.0117⁎ 0.0117⁎⁎ −0.0133 −0.0089 −0.0192 −0.0163
(0.021) (−0.039) (−0.841) (−0.912) (0.643) (0.720) (1.983) (1.992) (−0.280) (−0.188) (−0.517) (−0.442)Monthly dummies Included Included Included Included Included Included Included Included Included Included Included IncludedN 14,541 14,541 14,541 14,541 14,540 14,540 14,722 14,722 14,661 14,661 14,606 14,606R2 0.3473 0.3287 0.1982 0.4705 0.3641 0.3231#(firms) 76 76 76 76 76 76 76 76 76 76 76 76
260J.-H
.Parketal./Em
ergingMarkets
Review29
(2016)246–273

ln(high-low volatility) ln(transient volatility) ln(FITC) ln(institutional investors'activity)
ln(foreign investors'activity)
FE RE FE RE FE RE FE RE FE RE
DiT −0.2055⁎⁎⁎ −0.1224 −0.1726 −0.2149 0.0284
(−4.224) (−0.908) (−1.260) (−0.639) (0.074)Di,τKOSPI 0.1205⁎ 0.0428 −0.1016 −0.1540⁎⁎ −0.0704 −0.1367⁎⁎ −0.7968 −1.0759⁎⁎⁎ 0.4643 0.1280
(1.698) (1.048) (−1.260) (−2.008) (−1.035) (−2.429) (−1.644) (−3.467) (1.411) (0.527)DiT × Di,τ
KOSPI −0.0976⁎⁎ −0.0979⁎⁎ 0.1533⁎ 0.1590⁎ 0.0915 0.0920 −0.1435 −0.1746 0.3456 0.3227(−2.234) (−2.231) (1.688) (1.731) (1.563) (1.547) (−0.422) (−0.518) (1.586) (1.447)
Dwitching −0.0863⁎⁎⁎ −0.0873⁎⁎⁎ 0.0192 0.0172 −0.0271 −0.0292⁎ 0.1943 0.1909 −0.1084 −0.1115(−2.926) (−2.958) (0.489) (0.442) (−1.586) (−1.718) (1.239) (1.219) (−0.937) (−0.961)
Monthly dummies Included Included Included Included Included Included Included Included Included IncludedN 14,448 14,448 13,639 13,639 13,733 13,733 8,380 8,380 6,369 6,369R2 0.1141 0.0858 0.1950 0.1285 0.0949#(firms) 76 76 76 76 76 76 75 75 75 75
Table 2 (continued)
261J.-H
.Parketal./Em
ergingMarkets
Review29
(2016)246–273

Second, price declined after the switch, although the decrease was not statistically significant. Ithas generally been believed that firms traded on KOSDAQ trade at a discount to their true values.
was theolatility)volatilitynce levelecreasedre of theour Nullespect to
teriorat-ce level.trading-
to trade-
e sophis-ing activ-ean stockr groups'
ching onaccuracyition, theh impliesSDAQ to
262 J.-H. Park et al. / Emerging Markets Review 29 (2016) 246–273
However, our analysis shows that switching does not increase the stock's value. Volatilityonly market characteristic for which all measures (in this case, high-low and transient vwere statistically significant, but the effects of the listing switching on these two types ofgo in opposite directions. After the switch, high-low volatility improved at the 5% significawhile transient volatility deteriorated at the 10% level. This implies that the total volatility d(improved) after the switch, but the transient volatility, which provides a better measumarket's idiosyncratic characteristics, increased (deteriorated). Again, we cannot rejectHypothesis that the trading environment is no better on KOSPI than on KOSDAQ with rprice or volatility.
Third, trade-execution cost measured by Bandi and Russell (2006), FITC, increased (deed) after the switch, but the result marginally missed the 10% statistical significanHasbrouck (1993) argued that trade-execution cost is an estimate which reflects generalrelated market quality; once again, our Null Hypothesis is not rejected with respectexecution cost.
Fourth, the results are mixed on whether KOSPI provided a better environment for expanding thticated investor base.While institutional investors' trading activity decreased, foreign investors' tradity increased. Considering foreign investors' strong influences as informed traders on the Kormarkets (Kho, 2011), we might infer that price efficiency improved, but the results on both investotrading activity are not statistically significant.
Fifth, the complementary results reported in Table 3 show that the effects of listing switprice efficiency were not uniform, and were not statistically significant. More specifically, theof price discovery measured by variance ratio improved after the listing switch to KOSPI. In addvariance ratio after the switch (0.6031) is larger than that before the switch (0.5641), whicthat the post-switch price in KOSPI over-reacted less than did the pre-switch price in KO
Table 3
Regression results from tests on price efficiency—complementary results. This table provides the results of estimations by fixed-effects(FE) and random-effects (RE) for each dependent variable in Eq. (3). The dependent variable isMRR ratio, Theta, Phi, and VR. MRR ratiodenotes the ratio of adverse selection cost to theMRR (Madhavan et al., 1997) implied spread; Theta and Phi denote adverse selection costand transitory cost of theMRR implied spread, respectively.VRdenotes the 5-minute variance ratio providedby Lo andMacKinlay (1988).Since we cannot estimate daily values of these variables, we estimate a statistic for the periods before and after the listing switch, unlikethe variables used in Table 2.We use logarithms of all the dependent variables so that the unit of each dependent variable is not an issue.TheDID estimatemultiplied by 100 indicates the effect of listing switchingmeasured in percentage terms. The sample firms include all 38firms which switched their listings from KOSDAQ to KOSPI in the period from January 1999 to April 2010 and their corresponding firmsmatched with a distance criterion defined from price, trading volume, market capitalization, and volatility. We consider relative datesfrom−100 to−1 before the announcement date of listing switching and from+1 to +100 after the re-listing date; we include a datein our sample only if we can obtain data for both the listing switching firm and its matched firm on that date. The dummy DiT is 1 for alisting switching firm i or 0 for thematched firm j(i). In the dummy variable Di,u
KOSPI, the time index u represents the pre-listing-switching(coded by 0) period or post-re-listing (coded by 1) period of a listing switching firm i and its matched firm j(i). So Di,u
KOSPI is 0 for the pre-listing-switching period of relative [−100, −1] dates or 1 for the post-re-listing period of [+1,+100] dates. We should note theinteraction term, Di
T × Di,uKOSPI, since its coefficient embodies DID. Note that the coefficient of Di
T cannot be identified under fixed-effectsestimation. The figures in the parentheses below the estimates are z-values. ⁎, ⁎⁎, and ⁎⁎⁎ denote the two-sided 10%, 5%, and 1% statisticalsignificances, respectively. All standard errors are computed through Huber-White robust estimation.
ln(MRR ratio) ln(Theta) ln(Phi) ln(VR)
FE RE FE RE FE RE FE RE
DiT −0.1796 −0.0064 0.1712 −0.0502
(−1.177) (−0.017) (0.491) (−0.445)Di,uKOSPI −0.2128⁎ −0.2092⁎ −0.5607⁎⁎⁎ −0.5594⁎⁎⁎ −0.3175⁎⁎⁎ −0.3092⁎⁎⁎ 0.0690 0.0667
(−1.782) (−1.765) (−3.933) (−3.905) (−2.739) (−2.641) (1.120) (1.088)DiT × Di,u
KOSPI 0.2241 0.2241 0.1641 0.1744 −0.1072 −0.1076 0.1109 0.1125(1.327) (1.337) (0.814) (0.861) (−0.659) (−0.654) (1.273) (1.299)
N 150 150 150 150 149 149 150 150R2 0.0424 0.2438 0.2308 0.1197#(firms) 76 76 76 76 76 76 76 76
information at the 5-minute horizon.28 In contrast, the results from the analyses of the MRR impliedspread components show that price efficiency deteriorated. After the switch to KOSPI, the transitory
s the ad-ot worse.lies thatprice ef-
ely differ-ure of theent set oftively the
OSPI thanpinion infirms thatcountry
ently andparison ofeffects of
d markete resultsiency areteriorat-mentary
SPI, manylistings tolosing thewasmo-d market
263J.-H. Park et al. / Emerging Markets Review 29 (2016) 246–273
cost component decreased, suggesting that trading-related market quality improved, whereaverse selection cost component increased, suggesting that trading-related market quality gHowever, the ratio of adverse selection cost to the MRR implied spread increased, which impthe increase in adverse selection cost is larger than the decrease in transitory cost, and overallficiency after the switch to KOSPI deteriorated.
Lastly, the results from the DID estimates based on random-effects estimation are not qualitativent from those based on fixed-effects estimation. This implies that ourmain results are robust to failassumptions underlying the fixed-effects estimation. We also tested our hypothesis with a differmatched firms selected using the interval of 100 days (not 50 days), but the results were qualitasame as our main results.29
All together, we fail to reject our Null Hypothesis that the trading environment is no better on KonKOSDAQ forfirms that switch. Contrary to theprevious literature from theU.S. and practitioners' oother countries, there is no evidence that KOSPI provides higher trading-related market quality toswitch their listings from KOSDAQ. This indicates that the specific market macrostructure of amatters.
5.2. Results from the analyses for the subsample periods
Prior to their consolidation into KRX in January 27, 2005, KOSDAQ and KOSPI operated independcompeted for the listings of SMEs. Since the consolidation, they no longer compete. Therefore, a comsubsamples before and after the consolidation allows us to infer the effect of the consolidation on thelisting switching on trading-related market quality.
The fixed-effects estimates shown in Table 4 suggest that the post-switch trading-relatequality provided by KOSPI deteriorated more after the 2005 consolidation than before.30 Thesare robust to random-effects estimation. The results from complementary tests on price efficnot uniform, but they also continue to suggest that the overall post-switch price efficiency deed more after the 2005 consolidation; for brevity, we do not report details of these completests.
Despite the deterioration in trading environment following a listing switch from KOSDAQ to KOof themost successful KOSDAQ start-ups, including the flagship firms, have steadily switched theirKOSPI. This confirms the conventionalwisdom that, after the 2005 consolidation, KOSDAQhas beengrowth-market dynamismwhich it once enjoyed.31 This also supports the argument that the switchtivated by the perceived reputation of KOSDAQ, rather than a desire for improved trading-relate
28 If stock returns follow a random walk process, the estimator of Lo and MacKinlay's (1988) variance ratio would converge to 1 in alarge sample. Thus, values of the variance ratio closer to 1 indicate greater efficiency of price discovery (see Bessembinder, 2003; Chordiaet al., 2008; among many others). If the process of stock returns deviates from the random walk process statistically significantly, how-ever, then wemay conclude that there is price distortion at a certain horizon (e.g., the 5-minute horizon in the case of our paper). More-over, if the variance ratio is substantially higher (lower) than 1, thenwemay conclude that themarket price under-reacts (over-reacts) toinformation at a certain horizon (e.g., the 5-minute horizon in the case of our paper).29 Detailed results are available from the authors on request.30 In interpreting the results from these subsample periods, we should keep in mind that most of the coefficients are statistically insig-nificant as in the analyses for the overall sample period. Once again, however, the statistical insignificance strengthens our argument. Con-trary to expectations, we fail to reject the Null Hypothesis that the trading environment on KOSPI is no better than on KOSDAQ for firmsthat switch. Thus, the specific market macrostructure of a country matters.31 Starting a few years after the consolidation,media have reported that KOSDAQwas losing its dynamismand had become a second tiermarket of KOSPI. This issue was discussed in the National Assembly of Korea on October 15, 2009 (see http://news.inews24.com/php/news_view.php?g_serial=450190&g_menu=022600).

Table 4Regression results from the analyses for the subperiods. This table provides the results offixed-effects (FE) and random-effects (RE) estimations for each dependent variable in Eq. (2),wherewe separatelyanalyze the listing switching firms and theirmatched firms for each sub-period before and after the consolidation of KOSDAQ and KOSPI into KRX on January 27, 2005. Dependent variables are (absolute)spread, relative spread, market depth, price, trading volume, number of trades, high-low volatility, transient volatility, Bandi and Russell's (2006) full-information transaction cost (FITC), institutionalinvestors' trading activity, and foreign investors' trading activity. We use logarithms of all the dependent variables so that the unit of each dependent variable is not an issue. The DID estimate multipliedby 100 indicates the effect of listing switchingmeasured in percentage terms. The sample firms include all 38 firmswhich switched their listings fromKOSDAQ to KOSPI in the period from January 1999 toApril 2010 and their corresponding firms matched with a distance criterion defined from price, trading volume, market capitalization, and volatility. The daily values derived from either their daily orintraday data are used. We consider relative dates from−100 to−1 before the announcement date of listing switching and from+1 to +100 after the re-listing date; we include a date in our sampleonly if we can obtain data for both the listing switching firm and itsmatched firm on that date. Our interest is focused on the coefficient estimate of the interaction term,Di
T × Di,τKOSPI, since it represents DID
for the effect of listing switching. DiT is a dummy representing whether firm i is a listing switcher or its matched firm j(i). Di,τ
KOSPI is a dummywhich is 1 if the relative date τ is after the date of re-listing onKOSPI of thefirm i, 0 otherwise.Dwitching is a dummy for awitching day, defined as a day of simultaneous expiration date of both futures and options on the KOSPI200 index.Monthly dummies for calendar-basedmonths are included in all regressions. Note that the coefficient of Di
T cannot be identified under fixed-effect estimation. The figures in the parentheses below the estimates are z-values. ⁎, ⁎⁎, and ⁎⁎⁎
denote the two-sided 10%, 5%, and 1% statistical significances, respectively. All standard errors are computed through Huber-White robust estimation.
ln(absolute spread) ln(relative spread) ln(market depth)
FE RE FE RE FE RE FE RE FE RE FE RE
Before 2005.1.27. After 2005.1.27. Before 2005.1.27. After 2005.1.27. Before 2005.1.27. After 2005.1.27.
DiT 0.2087 −0.0641 −0.06 −0.3619 −0.0726 −0.0903(0.672) (−0.122) (−0.317) (−1.368) (−0.276) (−0.133)
Di,τKOSPI 0.0043 −0.0243 −0.1628 −0.3825** −0.1616* −0.1169 −0.0294 −0.13 −0.0949 −0.0632 −0.4848** 0.04(0.021) (−0.158) (−0.759) (−2.137) (−1.735) (−1.479) (−0.146) (−0.848) (−0.393) (−0.314) (−2.312) (0.15)
DiT × Di,τKOSPI −0.0829 −0.0814 0.154 0.154 −0.004 −0.0036 0.1403 0.1403 0.053 0.0508 −0.0847 −0.0847(−0.474) (−0.464) (0.861) (0.86) (−0.046) (−0.041) (0.727) (0.727) (0.228) (0.219) (−0.442) (−0.439)
Dwitching −0.0309 −0.031 0.0591* 0.0568* −0.0600*** −0.0593*** 0.0689** 0.0660** 0.0394 0.0394 −0.0208 −0.0168(−1.612) (−1.624) (1.751) (1.686) (−3.225) (−3.170) (2.158) (2.057) (1.568) (1.572) (−0.382) (−0.305)
Monthly dummies Included Included Included Included Included Included Included Included Included Included Included IncludedN 9,768 9,768 4,773 4,773 9,768 9,768 4,773 4,773 9,768 9,768 4,772 4,772R2 0.3905 0.2397 0.3781 0.269 0.165 0.3058#(firms) 52 52 24 24 52 52 24 24 52 52 24 24
264J.-H
.Parketal./Em
ergingMarkets
Review29
(2016)246–273

ln(price) ln(trading volume) ln(number of trades)
FE RE FE RE FE RE RE FE RE FE RE
Before 2005.1.27. After 2005.1.27. Before 2005.1.27. .1.27. Before 2005.1.27. After 2005.1.27.
DiT −0.7972* −0.3405 −0.0148 0.0783 −0.1283 −0.0926(−1.844) (−0.578) (−0.027) (0.098) (−0.352) (−0.162)
Di,τKOSPI 0.0246 0.0243 −0.0463 −0.0477 0.6042* 0.3581 ** 0.2416 0.4821* 0.3238* −0.5502** 0.2907(0.208) (0.214) (−0.498) (−0.511) (1.857) (1.401) (0.644) (1.927) (1.689) (−2.184) (1.05)
DiT × Di,τKOSPI −0.0854 −0.0853 −0.1939* −0.1939* −0.0726 −0.0712 −0.4402* −0.2544 −0.2553 −0.3627* −0.3629*(−0.804) (−0.803) (−1.772) (−1.772) (−0.303) (−0.296) (−1.703) (−1.261) (−1.266) (−1.841) (−1.795)
Dwitching 0.0267*** 0.0267*** −0.0155* −0.0155* 0.0193 0.0175 −0.0528 −0.0144 −0.0157 −0.0205 −0.0097(3.807) (3.826) (−1.958) (−1.959) (0.31) (0.283) (−0.743) (−0.334) (−0.368) (−0.285) (−0.135)
Monthly dummies Included Included Included Included Included Included included included included included includedN 9,946 9,946 4,776 4,776 9,885 9,885 4,776 9,836 9,836 4,770 4,770R2 0.3786 0.6736 0.3626 0.3438 0.2841#(firms) 52 52 24 24 52 52 24 52 52 24 24
Table 4 (continued)
265J.-H
.Parketal./Em
ergingMarkets
Review29
(2016)246–273
FE
After 2005
−0.9342*(−3.304)−0.4400*(−1.743)−0.0646(−0.914)Included4,7760.398724

ln(high-low volatility) ln(transient volatility) ln(FITC)
FE RE FE RE FE RE RE FE RE FE RE
Before 2005.1.27. After 2005.1.27. Before 2005.1.27. r 2005.1.27. Before 2005.1.27. After 2005.1.27.
DiT −0.1522*** −0.3160*** −0.015 −0.3492 −0.099 −0.3133(−2.864) (−4.032) (−0.087) (−1.628) (−0.639) (−1.237)
Di,τKOSPI 0.2021** 0.1323** −0.2183** −0.0903 −0.1084 −0.0986 787 −0.1536 −0.0578 −0.0313 −0.0388 −0.2517*(2.476) (2.521) (−2.327) (−1.266) (−1.119) (−0.981) .481) (−1.164) (−0.726) (−0.519) (−0.296) (−1.734)
DiT × Di,τKOSPI −0.1247** −0.1251** −0.0442 −0.0441 0.1603 0.1639 15 0.146 0.0285 0.0287 0.2090* 0.2097*(−2.344) (−2.358) (−0.574) (−0.571) (1.27) (1.298) 7) (1.244) (0.424) (0.424) (1.912) (1.908)
Dwitching −0.1364*** −0.1374*** 0.008 0.0089 −0.0082 −0.0073 97 0.0645 −0.0535** −0.0528** 0.0205 0.0167(−3.935) (−3.989) (0.165) (0.183) (−0.172) (−0.157) 2) (0.909) (−2.291) (−2.254) (0.988) (0.812)
Monthly dummies included included included included included included ded included included included included includedN 9,683 9,683 4,765 4,765 8,978 8,978 1 4,661 9,052 9,052 4,681 4,681R2 0.0937 0.1641 0.0887 08 0.1869 0.2249#(firms) 52 52 24 24 52 52 24 52 52 24 24
Table 4 (continued)
266J.-H
.Parketal./Em
ergingMarkets
Review29
(2016)246–273
FE
Afte
−0.0(−00.14(1.220.06(0.98inclu4,660.0824

ln(institutional investors' activity) ln(foreign investors' activity)
FE RE FE RE FE RE FE RE
Before 2005.1.27. After 2005.1.27. Before 2005.1.27. After 2005.1.27.
DiT −0.1491 −0.3183 0.6573 0.8159*(−0.395) (−0.559) (1.198) (1.703)
Di,τKOSPI −0.9042* −1.7561*** 0.9206 −0.5736 0.1518 −0.5102 0.8087** 0.343(−1.757) (−3.739) (1.244) (−1.496) (0.275) (−0.780) (2.229) (1.122)
DiT × Di,τKOSPI −0.1359 0.0955 −0.1825 −0.2491 0.5697 0.1481 0.2192 0.2176(−0.327) (0.228) (−0.301) (−0.418) (1.197) (0.215) (0.917) (0.914)
Dwitching 0.0634 0.1323 0.4554* 0.4337* 0.0381 −0.104 −0.196 −0.1947(0.306) (0.626) (2.054) (1.936) (0.18) (−0.406) (−1.423) (−1.411)
Monthly dummies included included included included included included included includedN 5,497 5,497 2,883 2,883 2,569 2,569 3,800 3,800R2 0.1302 0.1279 0.1077 0.0916#(firms) 51 51 24 24 51 51 24 24
Table 4 (continued)
267J.-H
.Parketal./Em
ergingMarkets
Review29
(2016)246–273

quality. By all accounts, the consolidation of KOSDAQ and KOSPI into KRX has turned out to be unfavorable forthe firms that switched listings from KOSDAQ.32,33
eir listingslatedmar-OSDAQ tomatchinga firm.'s trading-ng results.stly dete-ence that. Second,
solidationctitioners'nificance,tters.rable, andlike mostmparabled marketrepresenten firm.ve steadilys growth-novation.ever, the
mpetitive.ould con-fully con-ms of themaintain
ithRobertoojin Ryu,Advanced7th CAFMmarket to
s' numerouscts on firms
268 J.-H. Park et al. / Emerging Markets Review 29 (2016) 246–273
6. Concluding remarks
In this paper, focusing on market macrostructure, we examined whether or not firms switching thfromKOSDAQ, the growthmarket, to KOSPI, themain board, experienced an improvement in trading-reket quality sufficient to justify the switch. We examined all 38 firms that switched their listings from KKOSPI between January 1999 andApril 2010. For the analysis, we applied theDID techniquewith nearestunder the regression framework to consider the potential sample selection bias in the listing switch of
Using thedaily values of various trading-relatedmarket qualitymeasures, elements of an exchangerelated environment,whichwere derived fromeither their daily or intraday data,we found the followiFirst, for the overall sample period, the trading-related market quality (including price efficiency) moriorated or remained unchanged following the switch from KOSDAQ to KOSPI. There is no evidKOSPI provides higher trading-related market quality to firms that switch their listing from KOSDAQthe post-switch trading-related market quality delivered by KOSPI deteriorated more after the conof KRX in 2005. Third, contrary to the expectations from the previous literature in the U.S. and praopinions in other countries, our main empirical results are mixed in terms of signs and statistical sigstrengthening our argument, and indicating that the specific market macrostructure of a country ma
All together, the post-switch trading-related services delivered by KOSPI turned out to be unfavothis phenomenon became more prominent after the 2005 consolidation. This indicates that, unworld growth markets, KOSDAQ has managed to provide trading-related market quality generally coto that of the main board, KOSPI, conditional on the characteristics of each firm. While trading-relatequality is higher overall among KOSPI-listed stocks than among KOSDAQ-listed stocks, this appears todifferent distributions of firm characteristics on the two boards rather than better quality for any giv
Furthermore, the fact thatmanyof themost successfulKOSDAQstart-ups, includingflagshipfirms,haswitched their listings to KOSPI confirms the conventional wisdom that KOSDAQ has been losing itmarket dynamism. This likely results in a negative externality, reducing KOSDAQ's ability to nurture inOur results show that KOSDAQ has not yet fallen behind KOSPI in terms of trading environment. Howcontinuingmigration of KOSDAQ firms to KOSPI may threaten KOSDAQ's future ability to maintain co
Overall, our results suggest that firmswhose characteristics fit the standalone growthmarket shtinue to be listed and traded on the standalone growthmarket. Moreover, policymakers should caretemplate and monitor the possible dynamic changes in characteristics and range of the target firgrowth market from the market macrostructure point of view, in order to nurture innovation anda healthy market macrostructure.
Acknowledgments
The authors are very grateful for use of a data set providedby theKRX, and for helpful discussionswAnderson, Kin-Yip Ho, Hyung Cheol Kang, Yongsang Kim, Eun Jung Lee, Inmoo Lee, Raymond Liu, DYong Yoon, Qiaoqiao Zhu, andmany seminar participants at the Australian National University, KoreaInstitute of Science and Technologies (KAIST), Korea University, the 19th IBRC in Melbourne, and thein Seoul. This paperwas previously circulated under the title “The effect of a listing switch from a newa main board: A market macrostructure perspective.” All errors are the responsibility of the authors.
32 The overall evaluation of the 2005 consolidation should be carried out in a comprehensive way based on the exchangefunctions, and not just the effect on firms that switched listings. We reemphasize that our discussion is restricted to the effe
that switched listings from KOSDAQ to KOSPI.33 To complement our results, we implemented case studies for NCsoft and NHN, both of which were the KOSDAQ flagship firm at thetime of the listing switch. NCsoft switched before and NHN after the consolidation of KRX. There exist striking differences in results fromthese two importantfirms. For NCsoft, the trading-relatedmarket quality inmarket depth, trading volume, number of trades, price, trade-execution cost, and institutional investors' trading activity improved, whereas the trading-relatedmarket quality in relative spread, high-low volatility, transient volatility, and foreign investors' trading activity deteriorated. In contrast, for NHN, the trading-related marketquality improved only in market depth, trade-execution cost, and foreign and institutional investors' trading activity, whereas all otherdimensions of the trading-relatedmarket quality deteriorated. These results provide evidence supporting a positive individual treatmenteffect for NCsoft, but not for NHN; this complements our main analysis. Detailed results are available from the authors on request.
Panel A: The listing requirements for the main board, KOSPI
Criteria Listing requirements
Years in operation sinceincorporation
At least 3 years
Businesssize
Equity Capital⁎ At least KRW 30 billion
Number of shares tobe listed
At least 1 million shares
Minimum float To meet all of the following requirements:① To meet any one of the following shares requirements
• At least 25% of shares or 5 million shares held by public shareholders• At least 25% of shares or 5 million shares to be publicly offered (including no. of sharesbefore submission of application for listing eligibility review)
• At least 10% of shares to be publicly offered after submission of application for listingeligibility review and at least the number of the publicly offered shares should be asfollows- 1 million shares: in case of KRW 50 billion Equity Capital ~ KRW 100 billion, or in
case of KRW 100 billion Market Capitalization ~ KRW 200 billion- 2 million shares: in case of KRW 100 billion Equity Capital ~ KRW 250 billion, or in
case of KRW 200 billion Market Capitalization ~ KRW 500 billion- 5 million shares: in case of Equity Capital over KRW 250 billion, or Market Capitalization
over KRW 500 billion• In case of the simultaneous offering in Korea and abroad, at least 10% of shares and 1million shares to be publicly offered
② At least 700 public shareholders(※ No restriction placed on transfers of shares)
Business performance(sales*, profit**, total marketcapitalization)
To meet any one of the following requirements:① To meet all of the following Sales and Profit requirements
• Sales: Higher than KRW 100 billion of the latest fiscal year and KRW 70 billion inaverage of the recent 3 fiscal years
• Profit- Net Income: Higher than KRW 3 billion of the latest fiscal year and KRW 6 billion in
total of the recent 3 fiscal years- ROE: Higher than 5% of the latest fiscal year and 10% in total of the recent 3 fiscal
years- In case of Large-sized Company (the company with Equity Capital over KRW 100
billion): Higher than 3% at ROE, or higher than 5 billion at Net Income, and OperatingCash Flow is positive
② Sales amount: Higher than KRW 200 billion at the latest fiscal yearand Total Market Capitalization: Higher than KRW 400 billion
Auditor's opinion ① The latest fiscal year: Unqualified② 2 fiscal years before the latest fiscal year: Unqualified or qualified (excluding qualified
opinion due to the limit placed on the scope of audit)(※ Including the audit opinion on the consolidated financial statements, if the company issubject to the preparation of consolidated financial statements)
Merger or split In case of merger, split, etc.: Financial statements in relevant fiscal year should be determined(If the term between the merger date and the end of the fiscal year is less than 3 months,semi-annual financial statements in the following fiscal year should be determined)
Restriction on disposal of sharesheld by largest shareholder, etc.
For 6 months after listing
Source: https://global.krx.co.kr/contents/GLB/03/0304/0304010000/GLB0304010000.jsp.
Appendix A. Listing requirements for KOSPI and KOSDAQ in the Korean stockmarketsPanel A and Panel B of this table report the list-ing requirements for the main board, KOSPI (as of June 30, 2014), and the growthmarket, KOSDAQ (as of February 22, 2013), in theKorean stockmarkets, respectively. * denotes “limited to the sales of goods and provision of services (In case of a holding company, it re-fers to the sales amount stated in the consolidated financial statements.)” ** denotes “In the case of a company subject to the preparationof consolidated financial statements, the consolidated financial statements shall be used as the basis, but the non-controlling interestsshall be excluded from equity capital.” ROE (Return on Equity): 100 × [Net Income / Equity Capital]. Growth Technical Company: A com-pany that has received a higher grade than ‘A’ in the assessment of technology capability by the professional appraisal agency. Large-sizedCompany: A company with equity capital over KRW 100 billion or base market capitalization of at least KRW 200 billion (as of the sub-mission date of application for listing eligibility review.)
269J.-H. Park et al. / Emerging Markets Review 29 (2016) 246–273
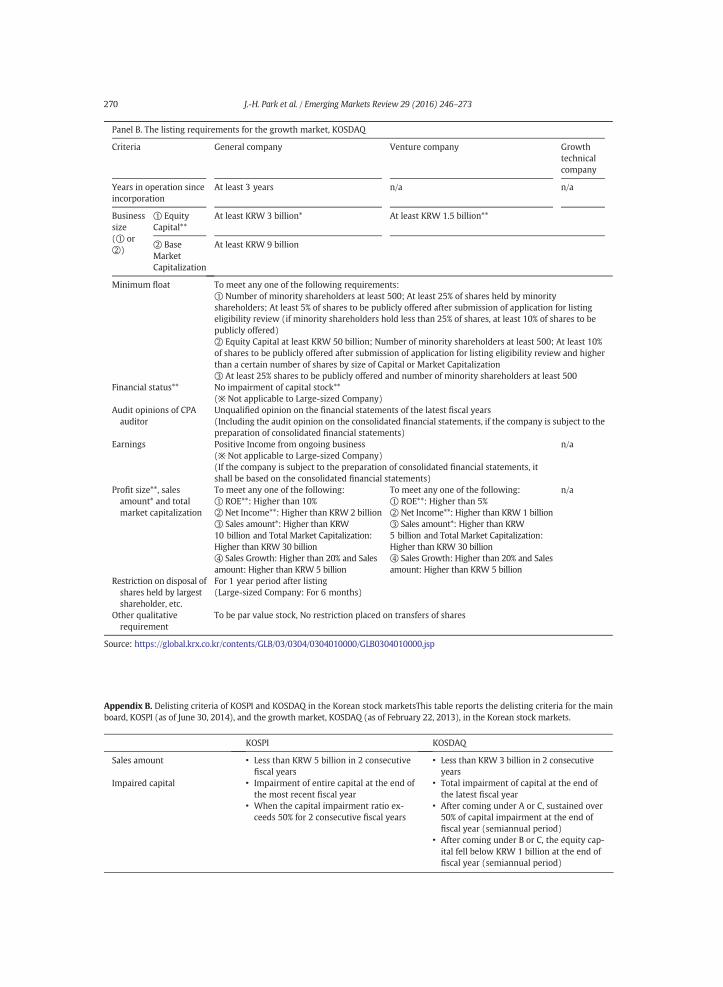
Panel B. The listing requirements for the growth market, KOSDAQ
Criteria General company Venture company Growthtechnicalcompany
Years in operation sinceincorporation
At least 3 years n/a n/a
Businesssize(① or②)
① EquityCapital**
At least KRW 3 billion* At least KRW 1.5 billion**
② BaseMarketCapitalization
At least KRW 9 billion
Minimum float To meet any one of the following requirements:① Number of minority shareholders at least 500; At least 25% of shares held by minorityshareholders; At least 5% of shares to be publicly offered after submission of application for listingeligibility review (if minority shareholders hold less than 25% of shares, at least 10% of shares to bepublicly offered)② Equity Capital at least KRW 50 billion; Number of minority shareholders at least 500; At least 10%of shares to be publicly offered after submission of application for listing eligibility review and higherthan a certain number of shares by size of Capital or Market Capitalization③ At least 25% shares to be publicly offered and number of minority shareholders at least 500
Financial status** No impairment of capital stock**(※ Not applicable to Large-sized Company)
Audit opinions of CPAauditor
Unqualified opinion on the financial statements of the latest fiscal years(Including the audit opinion on the consolidated financial statements, if the company is subject to thepreparation of consolidated financial statements)
Earnings Positive Income from ongoing business(※ Not applicable to Large-sized Company)(If the company is subject to the preparation of consolidated financial statements, itshall be based on the consolidated financial statements)
n/a
Profit size**, salesamount* and totalmarket capitalization
To meet any one of the following:① ROE**: Higher than 10%② Net Income**: Higher than KRW 2 billion③ Sales amount*: Higher than KRW10 billion and Total Market Capitalization:Higher than KRW 30 billion④ Sales Growth: Higher than 20% and Salesamount: Higher than KRW 5 billion
To meet any one of the following:① ROE**: Higher than 5%② Net Income**: Higher than KRW 1 billion③ Sales amount*: Higher than KRW5 billion and Total Market Capitalization:Higher than KRW 30 billion④ Sales Growth: Higher than 20% and Salesamount: Higher than KRW 5 billion
n/a
Restriction on disposal ofshares held by largestshareholder, etc.
For 1 year period after listing(Large-sized Company: For 6 months)
Other qualitativerequirement
To be par value stock, No restriction placed on transfers of shares
Source: https://global.krx.co.kr/contents/GLB/03/0304/0304010000/GLB0304010000.jsp
KOSPI KOSDAQ
Sales amount • Less than KRW 5 billion in 2 consecutivefiscal years
• Less than KRW 3 billion in 2 consecutiveyears
Impaired capital • Impairment of entire capital at the end ofthe most recent fiscal year
• When the capital impairment ratio ex-ceeds 50% for 2 consecutive fiscal years
• Total impairment of capital at the end ofthe latest fiscal year
• After coming under A or C, sustained over50% of capital impairment at the end offiscal year (semiannual period)
• After coming under B or C, the equity cap-ital fell below KRW 1 billion at the end offiscal year (semiannual period)
Appendix B. Delisting criteria of KOSPI and KOSDAQ in the Korean stock marketsThis table reports the delisting criteria for the mainboard, KOSPI (as of June 30, 2014), and the growth market, KOSDAQ (as of February 22, 2013), in the Korean stock markets.
270 J.-H. Park et al. / Emerging Markets Review 29 (2016) 246–273

(continued)
KOSPI KOSDAQ
• After coming A or B or C, have failed tosubmit the semiannual report within10 days after the submission deadline ofsemiannual report or the audit opinionthereon is adverse, disclaimer of opinion orqualified due to the limit placed on auditscope
Stock price • When failing to satisfy the requirementthat the stock price must be higher than20% of face value for 10 consecutive daysand total of 30 days during the 90 daysfollowing the designation as administra-tive issue
• No requirements
Market capitalization • When failing to satisfy the requirementthat the market value must be higher thanKRW 5 billion for 10 consecutive days andtotal of 30 days during the 90 days fol-lowing the designation as administrativeissue
• Failure to meet the requirement ofmarket capitalization to be higher thanKRW 4 billion for 10 consecutive days andfor 30 days out of 90 days after havingbeen designated as administrative issue
Audit opinion • When the audit opinion on the annual re-port is adverse or disclaimer of opinion- In case where the audit opinion is due
to the uncertainty about going concern,the delisting is postponed until the endof semi-annual period if the cause of theuncertainty has been resolved
• When the audit opinion on the annual re-port is qualified opinion due to the limitplaced on the scope of audit 2 consecutivefiscal years
• Adverse or disclaimer of opinion, or quali-fied due to the limit placed on audit scope- If the audit opinion is due to the con-
cern about going concern, provided thatthe elimination of the auditor's concernhas been confirmed, the delisting ispostponed to the end of the next semi-annual period
Trading volume • When the average monthly trading vol-ume in the semi-annual period droppedbelow 1% of number of floating shares andsuch situation continued for anothersemi-annual period
• Average quarterly trading volume fell lessthan 1% of floating shares for 2 consecu-tive quarters
Minimum float • When the number of public stockholders isless than 200 for consecutive last 2 years
• When the share of public stockholders withat most 2 million shares is less than 10% forconsecutive last 2 years
• Failure to meet the minimum floatrequirement for 2 consecutive years
Unfaithful disclosure • (Subject to Listing Maintenance Review)When the penalty points more than 15has been accumulated in recent 1 yearafter designation as administrative issue
• Case of being designated as unfaithfuldisclosure corporation, because ofintentionally or by major mistake violatingthe disclosure requirement of matter thatmay have serious influence on corporatemanagement
• (Subject to qualitative delistingexamination)
Disclosure documents • When failing to submit the quarterly report,semi-annual report and annual report 2consecutive times
• When failing to submit the annualreport within 10 days of legal submissiondeadline
• Failure to submit quarterly or semiannualbusiness reports 3 times in 2 years
• Failure to submit business report within10 days after the submission deadline
• After coming under A (sustainedsubmission failure) or B, in case where Aor B occurs again in the next termreporting period
Outside directors, etc. • When failing to satisfy the requirementthat for composition of outside directors /audit committee for 2 consecutive years
• Failure to meet the requirement for 2consecutive years
(continued on next page)
271J.-H. Park et al. / Emerging Markets Review 29 (2016) 246–273

h School of
Finance 59,
Quant. Anal.
.c. Econ. 47,
Intermed. 3,
to premium
Financ. Rev.
(continued)
KOSPI KOSDAQ
Application for rehabilitation/bankruptcy
• (Subject to Listing Maintenance Review)When the application for commencementof rehabilitation procedure is dismissed,the decision on the commencement ofrehabilitation procedure is cancelled, therehabilitation plan is disapproved, or thedecision is made to retract thecommencement of rehabilitationprocedure
• (Subject to Qualitative Delisting Examina-tion) when application for commencementof rehabilitation procedures is turneddown. Decision on commencement ofrehabilitation procedures is cancelled, orrehabilitation plan is disapproved
Others (immediate delisting) • Case of final bankruptcy or suspension ofbank transactions
• Case where the cause of dissolution hasoccurred under the laws
• Case of restricting transfer of stocks• Case where the concerned companybecomes a wholly owned subsidiary of aholding company and the stocks ofconcerned holding company is initiallylisted
• In the event of backdoor listing, case ofviolating the regulations related backdoorlisting
• Final bankruptcy or suspension of banktransactions
• Company dissolution (merged intoanother company, bankruptcy)
• When the article of incorporation wasamended to include the restrictions onstock transfer
• When listing on the KOSPI Market• When violating the regulationsconcerning the backdoor listing
(Growth technical company) • No requirements • Failure to submit the report or organizethe investor relations conference in thenext semi-annual period
Loss from on-going businessbefore taxes
• No requirements • In the year after having been designatedas administrative issue, sustained the lossgreater than 50% (and KRW 1 billion) ofEquity Capital
Prolonged operating loss • No requirements • Operating loss for 5 consecutive years
Source: ForKOSPI, http://eng.krx.co.kr/m7/m7_2/m7_2_2/m7_2_2_5/UHPENG07002_02_05.html. (Wecorrect somemistakes on thewebsiteby referring to the KRX Regulations.) For KOSDAQ, http://eng.krx.co.kr/m7/m7_2/m7_2_3/m7_2_3_6/UHPENG07002_03_06.html.
272 J.-H. Park et al. / Emerging Markets Review 29 (2016) 246–273
References
Baltagi, B.H., 2005. Econometric Analysis of Panel Data. 3rd edition. John Wiley & Sons, Chichester, U.K.Bandi, F.M., Russell, J.R., 2006. Full-Information Transaction Costs. Working Paper. University of Chicago Boot
Business.Barclay, M.J., Hendershott, T., 2004. Liquidity externalities and adverse selection: Evidence from trading after hours. J.
681–710.Barclay, M.J., Hendershott, T., Jones, C.M., 2008. Order consolidation, price efficiency, and extreme liquidity shocks. J. Financ.
43, 93–122.Bennett, P., Wei, L., 2006. Market structure, fragmentation, and market quality. J. Financ. Mark. 9, 49–78.Bessembinder, H., 2003. Trade execution costs and market quality after decimalization. J. Financ. Quant. Anal. 38, 747–778Black, B.S., Gilson, R.J., 1998. Venture capital and the structure of capital markets: Banks versus stock markets. J. Finan
243–277.Brockman, P., Chung, D.Y., 2003. Investor protection and firm liquidity. J. Finance 58, 921–938.Chordia, T., Roll, R., Subrahmanyam, A., 2008. Liquidity and market efficiency. J. Financ. Econ. 87, 249–268.Christie, W., Huang, R., 1994. Market structure and liquidity: A transactions data study of exchange listings. J. Financ.
300–326.Claessens, S., Yurtoglu, B.B., 2013. Corporate governance in emerging markets: A survey. Emerg. Mark. Rev. 15, 1–33.Cumming, D., Johan, S., 2013. Listing standards and fraud. Manag. Decis. Econ. 34, 451–470.De Carvalho, A.G., Pennacchi, G.G., 2011. Can a stock exchange improve corporate behavior? Evidence from firms' migration
listings in Brazil. J. Corp. Finance 18, 20–35.Dharan, B.G., Ikenberry, D.L., 1995. The long-run negative drift of post-listing stock returns. J. Finance 50, 1547–1574.Economides, N., 1993. Network economics with application to finance. Financ. Mark. Inst. Instrum. 2, 89–97.Economides, N., 1996. The economics of networks. Int. J. Ind. Organ. 14, 673–699.Elyasiani, E., Hauser, S., Lauterbach, B., 2000. Market response to liquidity improvements: Evidence from exchange listings.
35, 1–14.

Eom, K.S., Ok, J., Park, J.-H., 2007. Pre-trade transparency and market quality. J. Financ. Mark. 10, 319–341.Grant Thornton, 2015. Economic Impact of AIM (April).Harris, J.H., Panchapagesan, V., Werner, I.M., 2008. Off but Not Gone: A Study of Nasdaq Delistings. Working Paper. Ohio State University.
anc. Stud. 6,
7).21–42.ndards. Eur.
nge listings.
ns. J. Financ.
Rev. Financ.
cess. J. Law
stocks. Rev.
1–60.gs. J. Financ.
m operating
ew marketslish abstract
8, 385–410.
273J.-H. Park et al. / Emerging Markets Review 29 (2016) 246–273
Hasbrouck, J., 1993. Assessing the quality of a security market: A new approach to transaction-cost measurement. Rev. Fin191–212.
Hatch, B.C., Johnson, S.A., 2002. The impact of specialist firm acquisitions on market quality. J. Financ. Econ. 66, 139–167.Hong Kong Exchanges and Clearing Limited, 2008. Consultation Conclusions on the Growth Enterprise Market (May).Hong Kong Stockbrokers Association, 2007. Response to Consultation Paper on the Growth Enterprise Market (NovemberJain, P.K., Kim, J.-C., 2006. Investor recognition, liquidity and exchange listings in the reformed markets. Financ. Manag. 35,Jenkinson, T., Ramadorai, T., 2013. Does one size fit all? The consequences of switching markets with different regulatory sta
Finan. Manage. 19, 852–886.Johan, S., 2010. Listing standards as a signal of IPO preparedness and quality. Int. Rev. Law Econ. 30, 128–144.Kadlec, G.B., McConnell, J.J., 1994. The effect of market segmentation and liquidity on asset prices: Evidence from excha
J. Finance 49, 611–636.Kedia, S., Panchapagesan, V., 2011. Why do only some Nasdaq firms switch to the NYSE? Evidence from corporate transactio
Mark. 14, 109–126.Kho, B.-C., 2011. The impact and role of foreign investors in Korea. Asian Rev. Financ. Res. 24, 231–273.Lo, A.W., MacKinlay, A.C., 1988. Stock market prices do not follow random walks: Evidence from a simple specification test.
Stud. 1, 41–66.Macey, J.R., O'Hara, M., Pompilio, D.J., 2008. Down and out in the stock market: The law and economics of the delisting pro
Econ. 51, 683–714.Madhavan, A., Richardson, M., Roomans, M., 1997. Why do security prices change? A transaction level analysis of NYSE
Financ. Stud. 10, 1035–1064.Narayan, P.K., Mishra, S., Narayan, S., 2014. Spread determinants and the day-of-the-week effect. Q. Rev. Econ. Financ. 54, 5Papaioannou, G.J., Travlos, N.G., Viswanathan, K.G., 2003. The operating performance of firms that switch their stock listin
Res. 26, 469–486.Papaioannou, G.J., Travlos, N.G., Viswanathan, K.G., 2009. Visibility effects and timing in stock listing changes: Evidence fro
performance. Q. Rev. Econ. Financ. 49, 357–377.Park, J.-H., Nam, S.-K., Eom, K.S., 2007. Market efficiency in KOSDAQ: A volatility comparison between main boards and n
using a permanent and transitory component model. Asia-Pac. J. Financ. Stud. 36, 533–566 (in Korean with long Engand English Tables).
Pirrong, C., 2002. Securities marketmacrostructure: Property rights and the efficiency of securities trading. J. Law Econ. Org. 1Ranaldo, A., 2004. Order aggressiveness in limit order book markets. J. Financ. Mark. 7, 53–74.World Federation of Exchanges, 2012. http://www.world-exchanges.org/statistics/annual.