emerging markets and the digitalization of the film...
TRANSCRIPT
UIS INFORMATION PAPER NO. 14 AUGUST 2013
EMERGING MARKETS AND THE DIGITALIZATION OF THE FILM INDUSTRY
An analysis of the 2012 UIS International Survey of Feature Film Statistics

UNESCO
The constitution of the United Nations Educational, Scientific and Cultural Organization (UNESCO) was adopted by 20 countries at the London Conference in November 1945 and entered into effect on 4 November 1946. The Organization currently has 195 Member States and 8 Associate Members.
The main objective of UNESCO is to contribute to peace and security in the world by promoting collaboration among nations through education, science, culture and communication in order to foster universal respect for justice, the rule of law, and the human rights and fundamental freedoms that are affirmed for the peoples of the world, without distinction of race, sex, language or religion, by the Charter of the United Nations.
To fulfil its mandate, UNESCO performs five principal functions: 1) prospective studies on education, science, culture and communication for tomorrow's world; 2) the advancement, transfer and sharing of knowledge through research, training and teaching activities; 3) standard-setting actions for the preparation and adoption of internal instruments and statutory recommendations; 4) expertise through technical co-operation to Member States for their development policies and projects; and 5) the exchange of specialized information.
UNESCO is headquartered in Paris, France.
UNESCO Institute for Statistics
The UNESCO Institute for Statistics (UIS) is the statistical office of UNESCO and is the UN depository for global statistics in the fields of education, science and technology, culture and communication.
The UIS was established in 1999. It was created to improve UNESCO's statistical programme and to develop and deliver the timely, accurate and policy-relevant statistics needed in today’s increasingly complex and rapidly changing social, political and economic environments.
The UIS is based in Montreal, Canada.
Published in 2013 by:
UNESCO Institute for Statistics P.O. Box 6128, Succursale Centre-Ville Montreal, Quebec H3C 3J7 Canada
Tel: +1 514-343-6880 Email: [email protected] http://www.uis.unesco.org
ISBN 978-92-9189-136-8 Ref: UIS/2013/CUL/TD/06
© UNESCO-UIS 2013 The authors are responsible for the choice and presentation of the facts contained in this report and for the opinions expressed therein which are not necessarily those of UNESCO and do not commit the Organization.
The designations employed and the presentation of material throughout this publication do not imply the expression of any opinion whatsoever on the part of UNESCO concerning the legal status of any country, territory, city or area or of its authorities or concerning the delimitation of its frontiers or boundaries.

- iii -
Acknowledgements
This paper was written by Mr Roque González, film studies researcher, Universidad de Buenos Aires and Universidad Nacional de La Plata. The report was edited and finalised by Ms Lydia Deloumeaux and Mr José Pessoa of the Culture Statistics Unit, UNESCO Institute for Statistics (UIS).

- iv -
Table of contents
Page
Aclknowledgements ................................................................................................................... iii
Introduction ................................................................................................................................. 6
1. Films on top ....................................................................................................................... 6
2. Production........................................................................................................................ 10 2.1 Feature film production ......................................................................................... 10 2.2 National film support ............................................................................................. 14
3. Market share (exhibition and consumption) ...................................................................... 15 3.1 Exhibition .............................................................................................................. 15 3.2 BRIC countries: The emerging market .................................................................. 18 3.3 Consumption: The link between film attendance and availability of screens ......... 19
4. Digitization ....................................................................................................................... 24
5. Case studies .................................................................................................................... 25 5.1 China: The future leader of the film market? ......................................................... 25 5.2 Latin America: Evolution and characteristics of the cinema industry .................... .28
Conclusions .............................................................................................................................. 34
References ............................................................................................................................... 36
Appendix ................................................................................................................................... 37
List of maps Map 1. Concentration of film production, 2011 ................................................................................... 12
List of boxes Box 1. Film production in video format .............................................................................................. 13 List of figures Figure 1. Contrasting trends between global admissions and box office, 2005-2011 ........................... 15 Figure 2. Frequency of attendance by screen per 100,000 inhabitants aged 5 to 79 years old, 2011 . 20 Figure 3. Distribution of cinemas by number of screens, 2011 ............................................................. 23 Figure 4. Number of digital screens, 2007-2011 ................................................................................... 24 Figure 5. Annual growth rate in box office revenue in China and USA, 2005-2011 (base year 2005).. 26 Figure 6. Annual growth rate in admissions in China and USA, 2005-2011 (base year 2005) ............. 26 Figure 7. Projected box office revenue in China and USA (in millions US$), 2011-2025 ..................... 27 Figure 8. Number of feature films produced in Latin America, 2005-2011 ............................................ 29 Figure 9. Number of admissions in Latin America, 2005-2011.............................................................. 30 Figure 10. Number of national first-time release films in Latin America, 2005-2011 ............................... 31 Figure 11. Number of screens in Latin America, 2005-2011 ................................................................... 33 Figure 12. Number of digital screens in DLP-DCI in Latin America, 2007-2011 ..................................... 33
- v -
List of tables Table 1. Top 30 feature films, 2010 and 2011 ........................................................................................ 7 Table 2. Genre of the Top 30 Films, 2010 and 2011 .............................................................................. 9 Table 3. World production of feature films for theatrical release, 2005-2011 ....................................... 11 Table 4. Top 10 film producers in the world ......................................................................................... 11 Table 5. Production level by number of countries and films, 2005-2011 ............................................. 12 Table 6. Film producers in video format, 2005-2011 ............................................................................ 13 Table 7. Total number of films in all formats, 2005-2011 ..................................................................... 13 Table 8. Top 15 countries with the highest number of feature films produced for theatrical
release, by market share (admissions) and national film support (average for 2005-2011) .. 14 Table 9A. Total box office revenue for the Top 10 countries (in millions US$). 2006-2011 ................... 16 Table 9B. Evolution of box office revenue, 2006-2011 ........................................................................... 16 Table 10. World average ticket prices (in US$), 2005-2011 ................................................................... 17 Table 11. Total admissions for the Top 10 countries (in millions), 2005-2011 ....................................... 18 Table 12. Box office revenue in BRIC countries (in millions US$), 2006-2011 ...................................... 19 Table 13. Admissions in BRIC countries, 2006-2011 ............................................................................. 19 Table 14. Frequency of film attendance per capita (population aged 5 to 79 years) for the
Top 10 countries, 2005-2011 .................................................................................................. 20 Table 15. Top 5 countries with at least 10 screens per 100,000 inhabitants (population
aged 5 to 79 years), 2005-2011 ............................................................................................. 21 Table 16. Top 5 countries with the fewest screens per 100,000 inhabitants (population
aged 5 to 79 years), 2005-2011 ............................................................................................. 22 Table 17. Average market share of national first-time release films between 2005 and 2011
in Latin America, based on admissions ................................................................................. 32
- 6 -
Introduction Feature films are one of the most popular cultural expressions worldwide, with an audience of approximately 7.5 billion people per year. However, in recent years, the cinema sector experienced structural changes in the production of its movies and greater diversification of its access modes. Audiences are increasingly using a wide range of media (i.e. smartphone, tablet, video-on-demand) to watch movies. The digitization of movie production and their exhibition in multiplexes has been one of the primary reasons that cinema has continued to attract audiences to theatres in many parts of the world. At the same time, the cinema sector has had to face the impacts of the financial crisis of 2008, which slowed down growth in many sectors of the economy. What have been the impacts of the digitization of the movie industry? Has the rate of digitization been the same worldwide? Do cinema audiences go to movie theatres more often? What are the trends in ticket prices? Is there still an audience for nationally-produced movies? This report examines these and other aspects of the film industry based on the analysis of harmonised data collected from the 2012 biennial Survey of Feature Film Statistics for the reference years 2010 and 20011 conducted by the UNESCO Institute for Statistics (UIS). In addition, an analysis of data from 2005 to 2011 is also presented for selected indicators to provide insight into the current state of the cinema industry. It focuses on the impact that increasing digitization of film production and exhibition has had on the industry. The report also presents two case study analyses: i) a comparison of the Chinese and USA film markets; and ii) an examination of the film sector in Latin America over the last seven years.
1. Films on top The majority of films produced today are oriented towards mass market consumption, in particular the youth market. Blockbusters, many based on comics and others being sequels, supported by powerful global mass marketing that bottleneck national and non-Hollywood cinema characterise the global cinema industry with few exceptions. The global Top 30 list of films, as illustrated in Table 1, uses a weighted score to rank films by popularity. It is a measure of audience preference. To create this list, the UIS 1 collects information on the 10 most popular feature films in each country, generally using admissions2, and applies a weighted score to calculate a total point count for each country. As has been the case throughout the 2000s, in almost all countries feature films from the United States of America (USA) (or USA coproductions in conjunction with primarily European countries) dominated the Top 30 (see Table 1) in 2010 and 2011. Almost all of these films were distributed by the six major Hollywood studios (with 50% of them released in 3D). Furthermore, the number of animated releases aimed at child-youth audiences was significant, in addition to sequels, prequels and adaptations. The rise and importance of 3D films is also evident between 2005 and 2011.
1 Refer to the UIS Data Center for a complete database:
http://www.uis.unesco.org/Culture/Pages/movie-statistics.aspx 2 Most countries measure popularity by cinema admissions, though a few use gross box office revenue.

- 7 -
However, many of the films that are ranked from No. 15 to No. 30 are typically nationally-produced or non-USA-produced films, mostly distributed by local companies. TABLE 1. TOP 30 FEATURE FILMS IN 2010 AND 2011
2010 rank
Title Origin Genre Weighted
score Language 3D
1 Avatar USA/GBR Fantasy, adventure, action 399 English Yes
2 Harry Potter and the Deathly Hallows: Part 1
GBR/USA Fantasy, adventure 290 English No
3 Shrek Forever After USA Animation 290 English Yes
4 Inception USA/GBR Action, adventure, mystery
284 English No
5 Alice in Wonderland USA Fantasy, adventure 272 English Yes
6 The Twilight Saga: Eclipse USA Fantasy, adventure 208 English No
7 Toy Story 3 USA Animation 184 English (Spanish) Yes
8 Clash of the Titans USA Fantasy, adventure, action 104 English Yes
9 Iron Man 2 USA Sci-fi, adventure, action 69 English (Russian) Yes
10 Sex and the City 2 USA Comedy, romance, drama 68 English No
11 Prince of Persia: The Sands of Time
USA/GBR Fantasy, adventure, action 61 English No
12 Despicable Me USA Animation 48 English Yes
13 How to Train Your Dragon USA Animation 34 English Yes
14 Sherlock Holmes GBR/USA/ DEU
Action, adventure, crime 34 English No
15 Tangled USA Animation 33 English Yes
16 The Chronicles of Narnia: The Voyage of the Dawn Trader
USA/GBR Fantasy, adventure 27 English Yes
17 The Karate Kid USA/CHN Action, drama 23 English (Chinese) No
18 Step Up 3D USA Romance, musical, drama 22 English Yes
19 Robin Hood GBR/USA Adventure, action 21 English (French) No
20 Salt USA Action, crime, mystery 20 English (Russian/ Korean)
No
21 My name is Khan India Drama, romance, thriller 18 Hindi/Urdu/English No
22 Alvin and the Chipmunks: The Squeakquel
USA Animation 15 English No
23 Grown Ups USA Comedy 14 English No
24 The Princess and the Frog USA Animation 13 English (French) No
25 Elite Squad: The Enemy Within (Tropa de Elite 2 - O Inimigo Agora É Outro)
Brazil Action, drama 10 Portuguese No
26 Five Minarets in New York (New York'ta Bes Minare)
Turkey Drama 10 Turkish/ English No
27 Lapland Odyssey (Napapiirin sankarit)
FIN/SWE/IRL Comedy, drama, romance 10 Finnish No
28 Le clandestin (Al Khattaf) Morocco Comedy 10 Arabic No
29 Mission London BGR/GBR/HUN/ MKD/SWE
Comedy 10 English/ Bulgarian (Russian/ Serbian)
No
30 Women in temptation (Ženy v pokušení)
Czech Republic Comedy, romance 10 Czech No

- 8 -
2011 rank
Title Origin Genre Weighted
score Language 3D
1 Harry Potter and the Deathly Hallows: Part 2
GBR/USA Fantasy, adventure 336 English No
2 Pirates of the Caribbean: On Stranger Tides
USA Adventure, action 306 English (Spanish)
No
3 The Smurfs USA Animation 167 English Yes
4 The Twilight Saga: Breaking Dawn - Part 1
USA Fantasy, adventure 165 English No
5 The Hangover Part II USA Comedy 154 English (Thai) No
6 Transformers: Dark of the Moon USA Sci-fi, action, adventure 139 English No
7 Rio USA Animation 108 English (Portuguese)
Yes
8 Kung Fu Panda 2 USA Animation 105 English Yes
9 Fast Five USA Action, adventure 104 English (Portuguese/ Spanish)
No
10 Cars 2 USA Animation 101
English (Japanese/ Italian/ French)
Yes
11 Tangled USA Animation 77 English Yes
12 Puss in Boots USA Animation 47 English Yes
13 Johnny English Reborn GBR/FRA/ USA
Comedy 45 English (Mandarin)
No
14 The King's Speech GBR/USA Drama 43 English No
15 The Adventures of Tintin USA/NZL Animation 39 English Yes
16 Intouchables France Drama 23 French No
17 Bridesmaids USA Comedy, romance 21 English No
18 Mission Impossible - Ghost Protocol USA/UAE Action, adventure 21 English (Russian/ Arabic)
No
19 Sherlock Holmes II GBR/USA/ DEU
Action, adventure 21 English No
20 Nothing to Declare (Rien à déclarer) France/ Belgium
Comedy 18 French No
21 The Inbetweeners Movie GBR Comedy 14 English No
22 Zookeeper USA Comedy 13 English No
23 Ertkhel Shua Qalaqshi Georgia Action, adventure 10 Georgian No
24 Eyyvah eyvah 2 Turkey Comedy 10 Turkish No
25 Fireheart: The Legend of Tadas Blinda (Tadas Blinda. Pradzia)
Lithuania Adventure, action, drama 10 Lithuanian/ Russian
No
26 Kokowääh Germany Comedy 10 German No
27 Lao Wedding Laos Romance 10 Lao No
28 Letters to Santa (Listy do M.) Poland Comedy, romance, drama 10 Polish No
29 Montevideo, Bog te video (Montevideo, God Bless You!)
Serbia Comedy, adventure, drama
10 Serbian No
30 Muži v nadeji (Muzi v nadeji - Men in hope)
Czech Republic
Comedy 10 Czech No
Notes: BGR: Bulgaria;`CHN: China; DEU: Germany; FIN: Finland; GBR: United Kingdom; HUN: Hungary;
IRL: Ireland; MKD: the former Yugoslav Republic of Macedonia; NZL: New Zealand; SWE: Sweden; UAE: United Arab Emirates; USA: United States of America.
Source: UNESCO Institute for Statistics, July 2013.
- 9 -
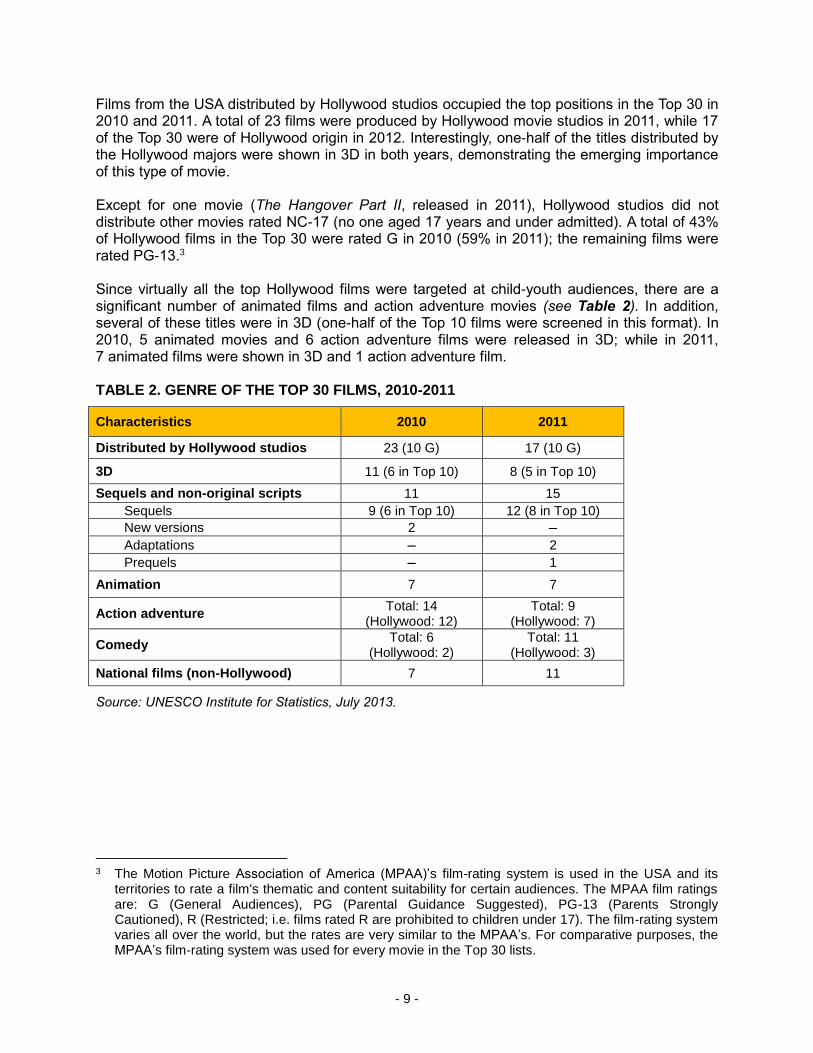
Films from the USA distributed by Hollywood studios occupied the top positions in the Top 30 in 2010 and 2011. A total of 23 films were produced by Hollywood movie studios in 2011, while 17 of the Top 30 were of Hollywood origin in 2012. Interestingly, one-half of the titles distributed by the Hollywood majors were shown in 3D in both years, demonstrating the emerging importance of this type of movie. Except for one movie (The Hangover Part II, released in 2011), Hollywood studios did not distribute other movies rated NC-17 (no one aged 17 years and under admitted). A total of 43% of Hollywood films in the Top 30 were rated G in 2010 (59% in 2011); the remaining films were rated PG-13.3 Since virtually all the top Hollywood films were targeted at child-youth audiences, there are a significant number of animated films and action adventure movies (see Table 2). In addition, several of these titles were in 3D (one-half of the Top 10 films were screened in this format). In 2010, 5 animated movies and 6 action adventure films were released in 3D; while in 2011, 7 animated films were shown in 3D and 1 action adventure film. TABLE 2. GENRE OF THE TOP 30 FILMS, 2010-2011
Characteristics 2010 2011
Distributed by Hollywood studios 23 (10 G) 17 (10 G)
3D 11 (6 in Top 10) 8 (5 in Top 10)
Sequels and non-original scripts 11 15
Sequels 9 (6 in Top 10) 12 (8 in Top 10)
New versions 2 –
Adaptations – 2
Prequels – 1
Animation 7 7
Action adventure Total: 14
(Hollywood: 12) Total: 9
(Hollywood: 7)
Comedy Total: 6
(Hollywood: 2) Total: 11
(Hollywood: 3)
National films (non-Hollywood) 7 11
Source: UNESCO Institute for Statistics, July 2013.
3 The Motion Picture Association of America (MPAA)’s film-rating system is used in the USA and its
territories to rate a film's thematic and content suitability for certain audiences. The MPAA film ratings are: G (General Audiences), PG (Parental Guidance Suggested), PG-13 (Parents Strongly Cautioned), R (Restricted; i.e. films rated R are prohibited to children under 17). The film-rating system varies all over the world, but the rates are very similar to the MPAA’s. For comparative purposes, the MPAA’s film-rating system was used for every movie in the Top 30 lists.

- 10 -
Following a similar pattern over the last few years for Hollywood blockbusters, many of the films in the Top 30 are non-original concepts, i.e. sequels, prequels and adaptations. Including film adaptations (such as Tintin), new versions/remakes (such as Karate Kid) or prequels (such as Puss in Boots), the overall number of non-original films increased from 11 in 2010 to 15 in 2011 in the Top 30 films list. Furthermore, 6 of the Top 10 movies were sequels in 2010 and 8 in 2011. In both years, there were also two sequels and one adaptation that were non-Hollywood-produced releases. Comedy is another genre that stands out in the Top 30: 6 were released in 2010 and 11 in 2011. It is interesting to note that 2 of the 6 comedies in 2010 were USA-produced; while in 2011 3 of 11 were produced in the USA. It should also be noted that comedies for all ages were among the films that broke box office and admission records in many countries. For example, Mission London in Bulgaria and Listy do M. in Poland broke box office records in their respective markets. There were other notable non-USA releases that were blockbusters, illustrating the growing impact of non-Hollywood film globally. The Indian movie, My name is Khan (a 2010 drama), was the highest-grossing Indian movie internationally in history. Meanwhile, the paramilitary Brazilian drama, Elite Squad, turned into the most viewed Brazilian film internationally to date (with more than 11 million admissions outside Brazil, breaking the record of the 1976 film Dona Flor e Seus Dois Maridos, which sold 10.7 million tickets). Elite Squad was distributed in about 20 countries. All films in the Top 30 were distributed by local companies (or distributors that covered two or three neighbouring countries). The only exception was the Indian movie; My Name is Khan, which was distributed by Fox Studios in about 30 countries worldwide. Other non-Hollywood national films appearing in the Top 30 included the French film Intouchables (distributed in about 50 countries worldwide), the British film The In-Betweeners (released in about 25 territories), the French-Belgian film Rien à Déclarer (released in about 12 countries), and the Finnish film Lapland Odyssey (distributed in about 12 countries). The 12 remaining movies were released by national distributors in their respective native countries and in 1 to 5 other territories. In total, 7 non-Hollywood national films were released in 2010 and 11 in 2011. Of these 18 films, 11 were European, 2 were from Turkey, 1 was from India, 2 were from the rest of Asia, 1 from Latin America, and 1 from Africa.
2. Production
2.1. Feature film production World film production continued to grow from 2005 to 2011, with a 39% increase. During this period, about 100 countries produced professional feature films for theatrical release, with an average of 5,987 feature films being produced per year, as shown in Table 3. The figures also show that there has been stagnation in the world film production since 2008, with total film production remaining at around 6,500 releases per year over the last four years for which data are available.

- 11 -
TABLE 3. WORLD PRODUCTION OF FEATURE FILMS FOR THEATRICAL RELEASE*, 2005-2011
2005 2006 2007 2008 2009 2010 2011
Number of feature films produced
4,818 5,284 5,760 6,454 6,475 6,548 6,573
Number of countries 81 79 85 89 93 82 76
Note: * Professional films made with commercial exhibition as the main objective (Nigerian films are not included).
Source: UNESCO Institute for Statistics, July 2013.
When analysed at the country level, the increase in the world film production is highly dependent on the Top 10 producers which represent around 65% of world production, as shown in Table 4. The countries with the highest increases in production between 2005 and 2011 were: China (260 to 584, 124.6%), the United Kingdom (106 to 299, 182.1%) and the Republic of Korea (87 to 206, 148.3%). Other countries with significant increases were: Germany (45.2%), Spain (40.1%) and Italy (58.1%). Outside of the Top 10, several countries showed important increases although the level of production was smaller, including: Brazil (42 to 100 films, 136%), Iran (26 to 76 films, 192%), Turkey (28 to 70 films, 150%), Viet Nam (12 to 75 films, 525% in 2010), and Mexico (71 to 111 films, 56.3%). The level of production for the rest of the world grew at a smaller rate between 2008 and 2011. However, as seen in Table 4, the increase in film production was at a slower pace for the largest producers (on average at about 20%). For example, the average increase in film production between 2005 and 2011 was 21% in India, 17% in USA, 24% in Japan and 13% in France. As of 2008, some relative stagnation in growth for these countries is noticeable.
TABLE 4. TOP 10 FILM PRODUCERS IN THE WORLD
Rank Country 2005 2006 2007 2008 2009 2010 2011
Average increase
from 2005-2011
1 India 1,041 1,091 1,146 1,325 1,288 1,274 1,255 21%
2 USA 699 673 789 773 751 792 819 17%
3 China 260 330 411 422 475 542 584 125%
4 Japan 356 417 407 418 448 408 441 24%
5 UK 106 107 124 279 313 346 299 182%
6 France 240 203 228 240 230 261 272 13%
7 Rep. of Korea 87 110 124 113 158 152 216 148%
8 Germany 146 174 174 185 216 189 212 45%
9 Spain 142 150 172 173 186 200 199 40%
10 Italy 98 116 121 154 131 142 155 58%
World share of Top 10 65.9% 63.8% 64.2% 63.2% 64.8% 65.8% 67.7%
Source: UNESCO Institute for Statistics, April 2013.
- 12 -
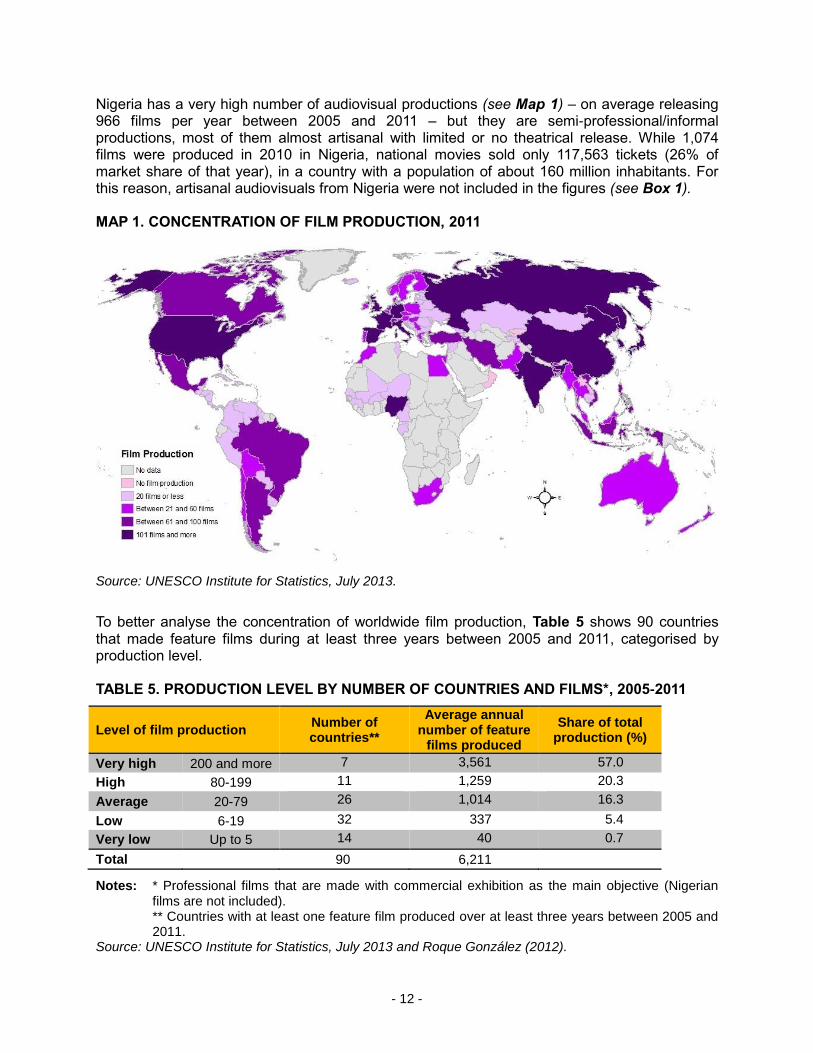
Nigeria has a very high number of audiovisual productions (see Map 1) – on average releasing 966 films per year between 2005 and 2011 – but they are semi-professional/informal productions, most of them almost artisanal with limited or no theatrical release. While 1,074 films were produced in 2010 in Nigeria, national movies sold only 117,563 tickets (26% of market share of that year), in a country with a population of about 160 million inhabitants. For this reason, artisanal audiovisuals from Nigeria were not included in the figures (see Box 1). MAP 1. CONCENTRATION OF FILM PRODUCTION, 2011
Source: UNESCO Institute for Statistics, July 2013.
To better analyse the concentration of worldwide film production, Table 5 shows 90 countries that made feature films during at least three years between 2005 and 2011, categorised by production level. TABLE 5. PRODUCTION LEVEL BY NUMBER OF COUNTRIES AND FILMS*, 2005-2011
Level of film production Number of countries**
Average annual number of feature
films produced
Share of total production (%)
Very high 200 and more 7 3,561 57.0
High 80-199 11 1,259 20.3
Average 20-79 26 1,014 16.3
Low 6-19 32 337 5.4
Very low Up to 5 14 40 0.7
Total 90 6,211
Notes: * Professional films that are made with commercial exhibition as the main objective (Nigerian films are not included).
** Countries with at least one feature film produced over at least three years between 2005 and 2011.
Source: UNESCO Institute for Statistics, July 2013 and Roque González (2012).

- 13 -
BOX 1. FILM PRODUCTION IN VIDEO FORMAT
This report focuses on films for theatrical release. Nevertheless, production in video format is also a key component of the film industry and a factor of growth and creativity in many developing countries. Countries which do not have the facilities and resources to produce films for theatrical release are using video format to reach their audiences. As shown in Table 6, Nigeria – with an average production of 1,000 movies per year – is the third largest producer in terms of volume. As a result of new technology and video production, the emergence of new film producers, such as Mauritius, has been possible. While the country did not produce any feature films before 2009, Mauritius increased its production from 19 to 30 films between 2010 and 2011.
TABLE 6. FILM PRODUCERS IN VIDEO FORMAT, 2005-2011
Country Total number of films produced in video format
2005 2006 2007 2008 2009 2010 2011 Average
Bhutan 31 29 30
Cambodia 41 62 35 25 28 26 13 33
Cameroon 4 7 1 3 20 * 7
Gabon 1 4 6 9 10 6
Mauritius – – – – 19 16 30 22
Nigeria 872 914 ** 956 987 1,074 997 967
Notes: – = quantity nil ; * = National estimation; **= UIS estimation. Source: UNESCO Institute for Statistics, July 2013.
Analysing all films, regardless of their format of production (theatrical release or video production) provides an overview of the cinema sector worldwide. Table 7 shows that global film production has increased significantly in recent times, with total production rising from 5,735 movies in 2005 to 7,442 in 2008. Production continues to grow but at a slower pace since 2008.
TABLE 7. TOTAL NUMBER OF FILMS IN ALL FORMATS, 2005-2011
Country Total number of films produced in all formats
2005 2006 2007 2008 2009 2010 2011
Video format 917 951 988 1,060 1,156 1,079
Theatrical release 4,818 5,214 5,760 6,454 6,475 6,548 6,573
Total 5,735 6,711 7,442 7,535 7,704 7,652
Source: UNESCO Institute for Statistics, July 2013.
There were 7 countries that had “very high” annual film production (more than 200 feature films) between 2005 and 2011, producing on average 3,561 films yearly and representing 57% of the world’s feature films. There were 11 countries that had a “high” level of film production (between 80 and 199 feature films per year), producing on average 1,259 feature films annually. The very high- and high-level groups together accounted for 78% of global film production on average over this time period, representing the production of 4,820 films annually. The “average” production category (between 20 and 79 feature films per year) accounted for an average annual production of 16% of the world’s films (1,013 films on average per year). Finally, one-half of countries were classified in the “low” or “very low” levels of film production. They accounted for 6% of total average annual feature films produced.
- 14 -
2.2. National film support
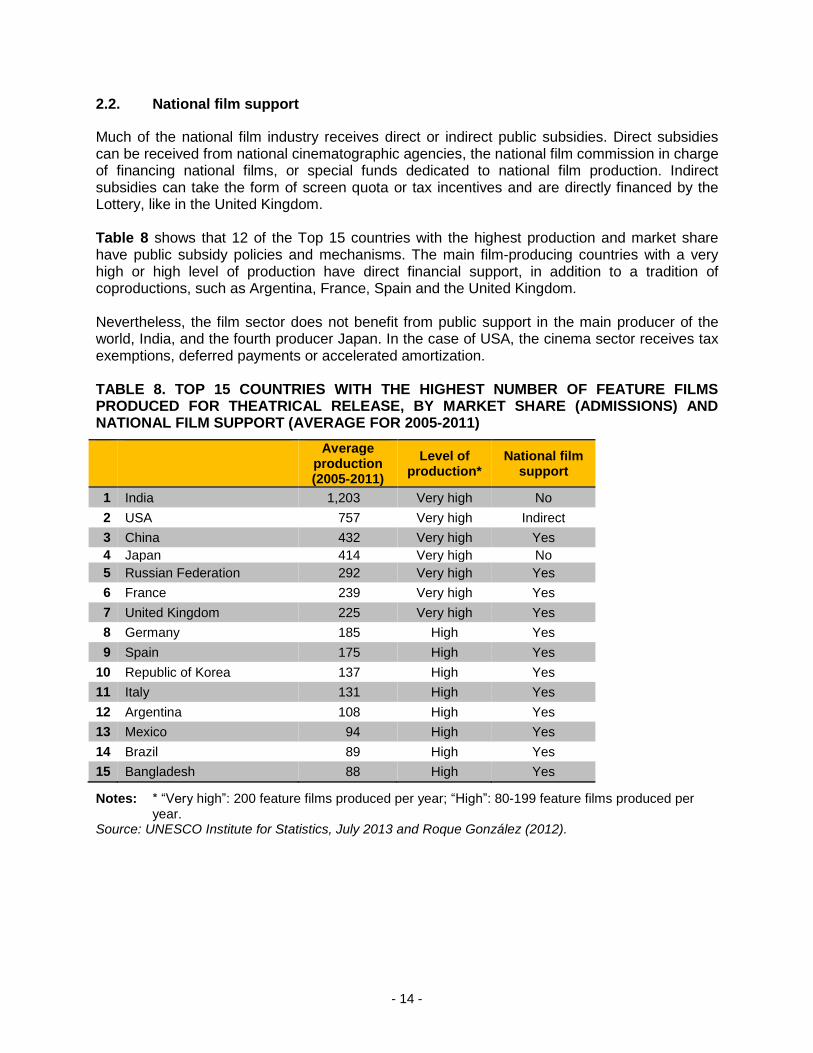
Much of the national film industry receives direct or indirect public subsidies. Direct subsidies can be received from national cinematographic agencies, the national film commission in charge of financing national films, or special funds dedicated to national film production. Indirect subsidies can take the form of screen quota or tax incentives and are directly financed by the Lottery, like in the United Kingdom. Table 8 shows that 12 of the Top 15 countries with the highest production and market share have public subsidy policies and mechanisms. The main film-producing countries with a very high or high level of production have direct financial support, in addition to a tradition of coproductions, such as Argentina, France, Spain and the United Kingdom. Nevertheless, the film sector does not benefit from public support in the main producer of the world, India, and the fourth producer Japan. In the case of USA, the cinema sector receives tax exemptions, deferred payments or accelerated amortization. TABLE 8. TOP 15 COUNTRIES WITH THE HIGHEST NUMBER OF FEATURE FILMS PRODUCED FOR THEATRICAL RELEASE, BY MARKET SHARE (ADMISSIONS) AND NATIONAL FILM SUPPORT (AVERAGE FOR 2005-2011)
Average production (2005-2011)
Level of production*
National film support
1 India 1,203 Very high No
2 USA 757 Very high Indirect
3 China 432 Very high Yes
4 Japan 414 Very high No
5 Russian Federation 292 Very high Yes
6 France 239 Very high Yes
7 United Kingdom 225 Very high Yes
8 Germany 185 High Yes
9 Spain 175 High Yes
10 Republic of Korea 137 High Yes
11 Italy 131 High Yes
12 Argentina 108 High Yes
13 Mexico 94 High Yes
14 Brazil 89 High Yes
15 Bangladesh 88 High Yes
Notes: * “Very high”: 200 feature films produced per year; “High”: 80-199 feature films produced per year.
Source: UNESCO Institute for Statistics, July 2013 and Roque González (2012).
- 15 -
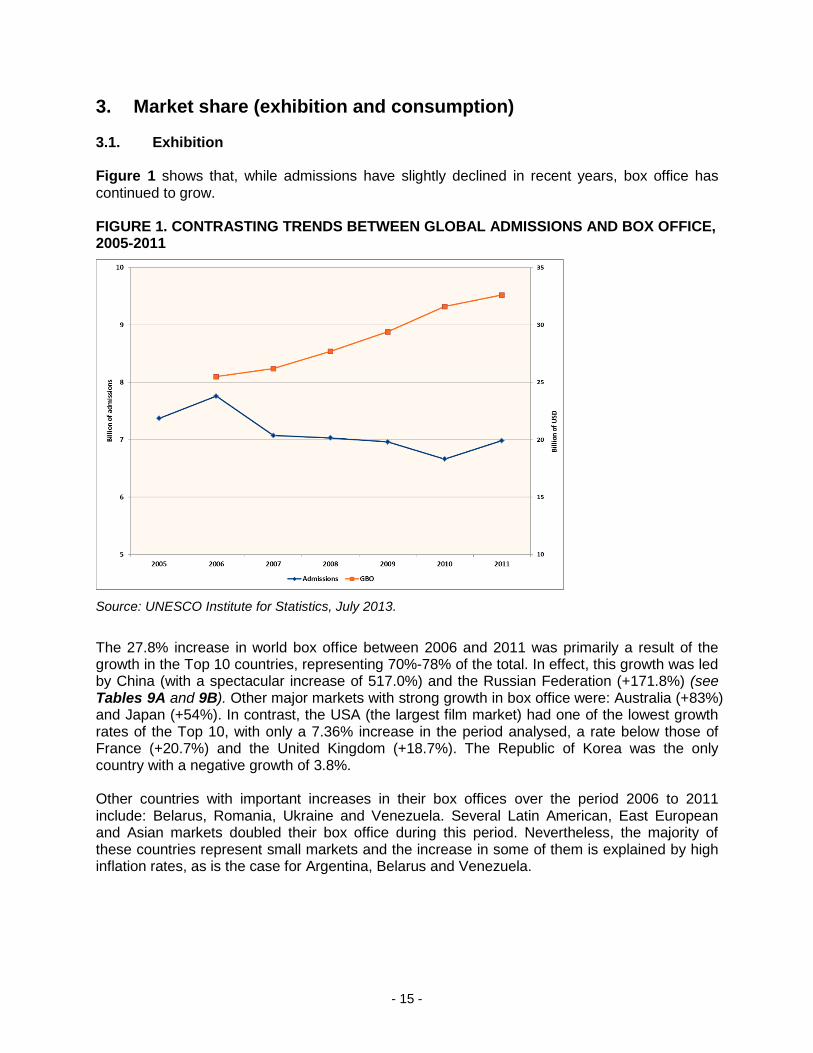
3. Market share (exhibition and consumption) 3.1. Exhibition Figure 1 shows that, while admissions have slightly declined in recent years, box office has continued to grow. FIGURE 1. CONTRASTING TRENDS BETWEEN GLOBAL ADMISSIONS AND BOX OFFICE, 2005-2011
Source: UNESCO Institute for Statistics, July 2013.
The 27.8% increase in world box office between 2006 and 2011 was primarily a result of the growth in the Top 10 countries, representing 70%-78% of the total. In effect, this growth was led by China (with a spectacular increase of 517.0%) and the Russian Federation (+171.8%) (see Tables 9A and 9B). Other major markets with strong growth in box office were: Australia (+83%) and Japan (+54%). In contrast, the USA (the largest film market) had one of the lowest growth rates of the Top 10, with only a 7.36% increase in the period analysed, a rate below those of France (+20.7%) and the United Kingdom (+18.7%). The Republic of Korea was the only country with a negative growth of 3.8%. Other countries with important increases in their box offices over the period 2006 to 2011 include: Belarus, Romania, Ukraine and Venezuela. Several Latin American, East European and Asian markets doubled their box office during this period. Nevertheless, the majority of these countries represent small markets and the increase in some of them is explained by high inflation rates, as is the case for Argentina, Belarus and Venezuela.

- 16 -
TABLE 9A. TOTAL BOX OFFICE REVENUE FOR THE TOP 10 COUNTRIES (IN MILLIONS US$), 2006-2011
2006 2007 2008 2009 2010 2011
USA 9,488 9,632 9,635 10,610 10,580 10,186
Japan 1,745 1,685 1,885 2,202 1,347 2,766
China 329 434 607 909 1,502 2,030
France 1,475 1,559 1,586 1,789 1,745 1,780
GBR 1,402 1,878 1,723 1,772 1,526 1,665
India 1,371 1,729 1,843 1,415 1,356 1,470
Germany 1,008 1,115 1,104 1,415 1,227 1,244
Australia 616 749 793 848 1,038 1,128
Russia 408 547 799 706 1,014 1,109
Rep. of Korea 1,036 1,069 890 857 1,000 997
TOTAL Top 10 18,878 20,398 20,865 22,524 22,335 24,375
World* 25,500 26,200 27,700 29,400 31,600 32,600
% Top 10 74 78 75 77 71 75
Note: * From Focus 2013, European Audiovisual Observatory. Source: UNESCO Institute for Statistics, July 2013.
TABLE 9B. EVOLUTION OF BOX OFFICE REVENUE, 2006-2011
Variation 2006/2011
Yearly average growth
Share of World in
2011
Share of Top 10
USA 7.36% 1.43% 31.25% 41.79%
Japan 58.51% 9.65% 8.48% 11.35%
China 517.02% 43.90% 6.23% 8.33%
France 20.68% 3.83% 5.46% 7.30%
GBR 18.76% 3.50% 5.11% 6.83%
India 7.22% 1.40% 4.51% 6.03%
Germany 23.41% 4.30% 3.82% 5.10%
Australia 83.12% 12.86% 3.46% 4.63%
Russia 171.81% 22.14% 3.40% 4.55%
Rep. of Korea -3.76% -0.76% 3.06% 4.09%
TOTAL Top 10 29.12% 5.24% 74.77%
World* 27.80% 5.04%
Source: UNESCO Institute for Statistics, July 2013.

- 17 -
A key factor in the world box office variation was the constant rise in the average ticket price, by 46% globally (see Table 10). Switzerland had the most expensive average ticket price in the world over 2005-2011: US$13.55, followed by Norway (US$12.96), Sweden ($US12.07), and Japan (US$11.96). Nine of the Top 10 countries with the highest ticket prices were from Europe. In contrast, countries with the least expensive ticket prices included: India (the world’s least expensive); Egypt, Niger, Senegal, Ethiopia in Africa; the Philippines, Indonesia and Laos in Asia; Belarus in Europe; and Iran in West Asia. TABLE 10. WORLD AVERAGE TICKET PRICES (IN US$), 2005-2011
2005 2006 2007 2008 2009 2010 2011
Average ticket price 4.76 5.21 6.02 6.30 6.35 6.53 6.95
Countries covered 55 55 59 63 60 58 52
Source: UNESCO Institute for Statistics, July 2013.
Between 2005 and 2011, China’s ticket prices increased by 253% the most of any country. It was followed next by Morocco (180%), Belarus (148%) and Argentina (134%) over the same period. These price increases are also a result of inflation, with Argentina and Belarus experiencing some of highest inflation rates in the world during that time. Other countries where ticket prices doubled include: the Philippines, Slovakia, Ukraine and Venezuela. In the Russian Federation, box office increased by 239%, while the average ticket price grew by 86%. In contrast, some countries showed only small increases in ticket prices between 2005 and 2011, such as Estonia, Iceland and the Republic of Korea. In fact, ticket prices in Iceland decreased by 25%, coinciding with the beginning of the 2008 national economic crisis. The average ticket price in Iceland declined from US$12.90 to US$9.10, and then to a low of US$6.80 in 2009. However, there were small increases in 2010 and 2011, with ticket prices of US$7.70 and US$8.10 respectively. Although it may appear that ticket prices in developing countries are low, when compared with the average income and the cost of living, ticket prices in these countries are relatively high compared to developed countries: one trip to the movies with friends or family can represent almost 10% of monthly income (González, 2012). Comparing admissions and box office, it is clear that different dynamics emerge. In box office (see Table 9A), the wealthiest countries (with a high average ticket price) and the robust markets of emerging countries (like China and India) are prominent. When examining the Top 10 countries by admissions for the period 2005-2011 (see Table 11), other emerging economies are noticeable with outstanding increases in markets, such as China (135.3%), the Russian Federation (82.5%) and Brazil (71.5%). After the Top 10 list, other markets with notable increases (from +138% to +156%) were: Bosnia and Herzegovina, Colombia, Lithuania, Malaysia and Romania. Nevertheless, all these countries (outside of the Top 10) have small to medium-sized markets (from 600,000 to 7 million admissions in 2011). By contrast, admissions were down by 5.2% in countries with larger markets (-8.1% in the Top 10), primarily accounted by decreases in India and Japan (especially in the former – the largest world market in terms of admissions). During the period 2005 to 2011, the share of world admissions of the Top 10 countries varied from 82% to 85%.
- 18 -
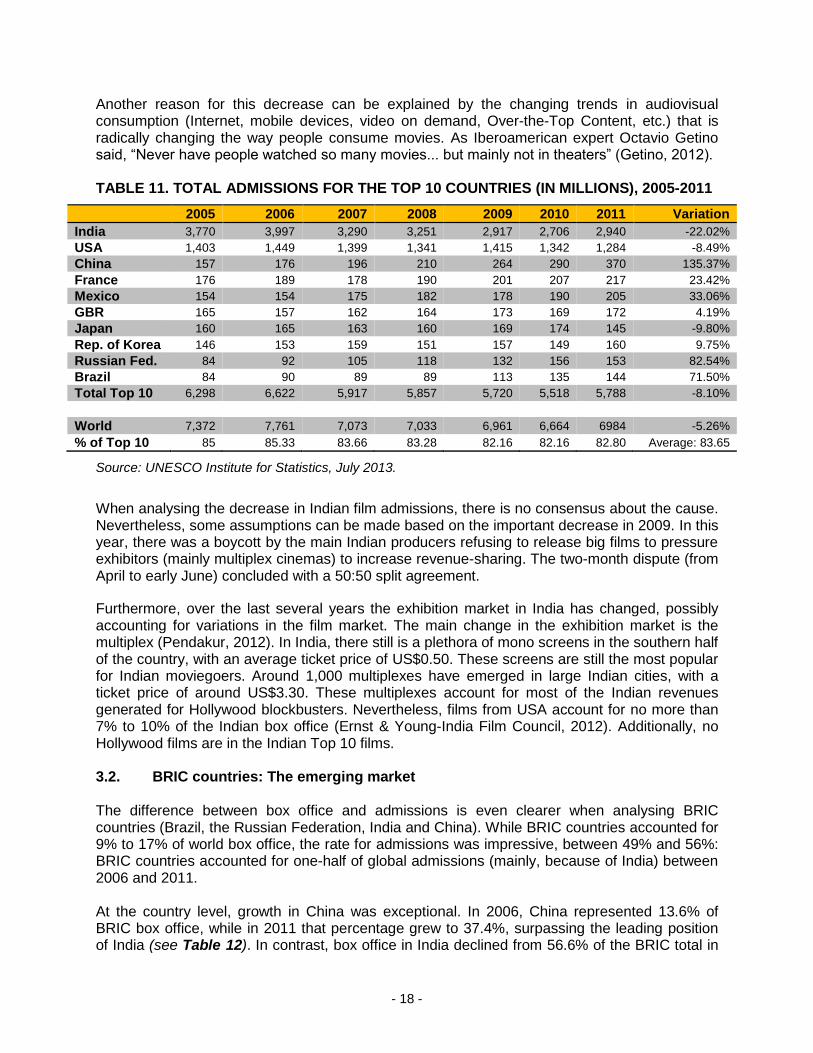
Another reason for this decrease can be explained by the changing trends in audiovisual consumption (Internet, mobile devices, video on demand, Over-the-Top Content, etc.) that is radically changing the way people consume movies. As Iberoamerican expert Octavio Getino said, “Never have people watched so many movies... but mainly not in theaters” (Getino, 2012). TABLE 11. TOTAL ADMISSIONS FOR THE TOP 10 COUNTRIES (IN MILLIONS), 2005-2011
2005 2006 2007 2008 2009 2010 2011 Variation
India 3,770 3,997 3,290 3,251 2,917 2,706 2,940 -22.02%
USA 1,403 1,449 1,399 1,341 1,415 1,342 1,284 -8.49%
China 157 176 196 210 264 290 370 135.37%
France 176 189 178 190 201 207 217 23.42%
Mexico 154 154 175 182 178 190 205 33.06%
GBR 165 157 162 164 173 169 172 4.19%
Japan 160 165 163 160 169 174 145 -9.80%
Rep. of Korea 146 153 159 151 157 149 160 9.75%
Russian Fed. 84 92 105 118 132 156 153 82.54%
Brazil 84 90 89 89 113 135 144 71.50%
Total Top 10 6,298 6,622 5,917 5,857 5,720 5,518 5,788 -8.10%
World 7,372 7,761 7,073 7,033 6,961 6,664 6984 -5.26%
% of Top 10 85 85.33 83.66 83.28 82.16 82.16 82.80 Average: 83.65
Source: UNESCO Institute for Statistics, July 2013.
When analysing the decrease in Indian film admissions, there is no consensus about the cause. Nevertheless, some assumptions can be made based on the important decrease in 2009. In this year, there was a boycott by the main Indian producers refusing to release big films to pressure exhibitors (mainly multiplex cinemas) to increase revenue-sharing. The two-month dispute (from April to early June) concluded with a 50:50 split agreement.
Furthermore, over the last several years the exhibition market in India has changed, possibly accounting for variations in the film market. The main change in the exhibition market is the multiplex (Pendakur, 2012). In India, there still is a plethora of mono screens in the southern half of the country, with an average ticket price of US$0.50. These screens are still the most popular for Indian moviegoers. Around 1,000 multiplexes have emerged in large Indian cities, with a ticket price of around US$3.30. These multiplexes account for most of the Indian revenues generated for Hollywood blockbusters. Nevertheless, films from USA account for no more than 7% to 10% of the Indian box office (Ernst & Young-India Film Council, 2012). Additionally, no Hollywood films are in the Indian Top 10 films. 3.2. BRIC countries: The emerging market The difference between box office and admissions is even clearer when analysing BRIC countries (Brazil, the Russian Federation, India and China). While BRIC countries accounted for 9% to 17% of world box office, the rate for admissions was impressive, between 49% and 56%: BRIC countries accounted for one-half of global admissions (mainly, because of India) between 2006 and 2011. At the country level, growth in China was exceptional. In 2006, China represented 13.6% of BRIC box office, while in 2011 that percentage grew to 37.4%, surpassing the leading position of India (see Table 12). In contrast, box office in India declined from 56.6% of the BRIC total in
- 19 -
2006 to 27% in 2011. Meanwhile, the Russian Federation and Brazil had very little growth during this period from 17% to 20% and from 13% to 15%, respectively. TABLE 12. BOX OFFICE REVENUE IN BRIC COUNTRIES (IN MILLIONS US$), 2006-2011
Box office 2006 2007 2008 2009 2010 2011
China 329 434 607 909 1,502 2,030
Russian Fed. 409 547 799 707 1,014 1,109
India 1,371 1,729 1843 1,415 1,356 1,470
Brazil 313 360 359 478 735 817
Total BRIC 2,422 3,070 3,608 3,509 4,607 5,426
% share in Top 10 12.83% 15.05% 17.29% 15.58% 20.63% 22.26%
% of world share 9.50% 11.72% 13.03% 11.94% 14.58% 16.64%
Source: UNESCO Institute for Statistics, July 2013 and Roque González (2011).
With regards to admissions, the situation was more stable (see Table 13). The market share of films from India decreased in relation to the total of BRIC countries, from 91.8% in 2006 to 81.5% in 2011. Meanwhile, China multiplied its proportion of BRIC admissions by 2.5, increasing from 4.5% to 10.3%. The Russian Federation and Brazil doubled their admissions: 2.0% for both in 2006, increasing to 4.2% and 4.0%, respectively, in 2011. TABLE 13. ADMISSIONS IN BRIC COUNTRIES, 2006-2011
BRIC 2006 2007 2008 2009 2010 2011
India 3,997 3,290 3,251 2,917 2,706 2,940
China 176 196 210 264 290 370
Russian Fed. 92 105 118 132 156 153
Brazil 90 89 89 113 135 144
Total BRIC 4,355 3,680 3,668 3,425 3,287 3,606
% share in Top 10 65.77% 62.20% 62.62% 59.89% 59.56% 62.31%
% world share 56.12 52.03 52.15 49.21 49.32 51.64
Source: UNESCO Institute for Statistics, July 2013.
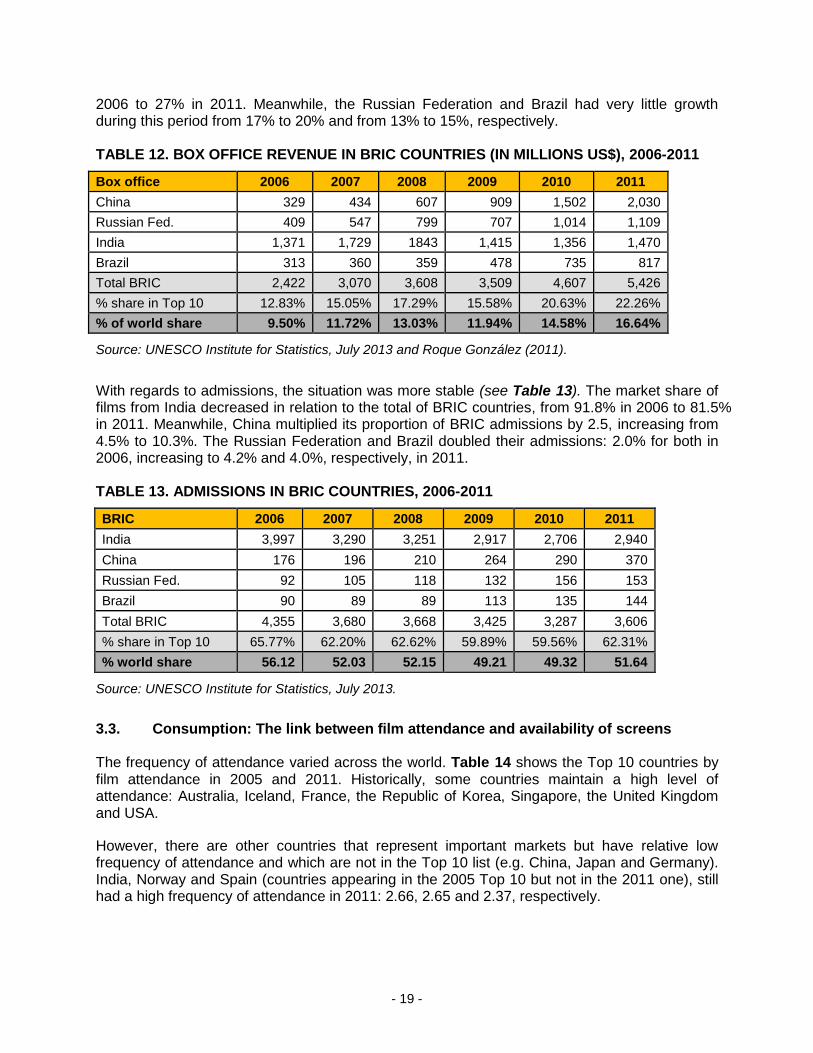
3.3. Consumption: The link between film attendance and availability of screens The frequency of attendance varied across the world. Table 14 shows the Top 10 countries by film attendance in 2005 and 2011. Historically, some countries maintain a high level of attendance: Australia, Iceland, France, the Republic of Korea, Singapore, the United Kingdom and USA.
However, there are other countries that represent important markets but have relative low frequency of attendance and which are not in the Top 10 list (e.g. China, Japan and Germany). India, Norway and Spain (countries appearing in the 2005 Top 10 but not in the 2011 one), still had a high frequency of attendance in 2011: 2.66, 2.65 and 2.37, respectively.
- 20 -
TABLE 14. FREQUENCY OF ATTENDANCE PER CAPITA (POPULATION AGED 5 TO 79 YEARS) FOR THE TOP 10 COUNTRIES FOR FILM ATTENDANCE, 2005-2011
Rank 2005 2011
1 USA 5.27 Iceland 5.24
2 Iceland 5.19 USA 4.59
3 Australia 4.54 Singapore 4.56
4 Singapore 3.78 Australia 4.20
5 India 3.74 Ireland 4.06
6 Rep. of Korea 3.31 France 3.89
7 Spain 3.25 Aruba 3.81
8 France 3.23 Rep. of Korea 3.56
9 United Kingdom 3.04 United Kingdom 3.08
10 Norway 2.90 Luxembourg 2.74
Source: UNESCO Institute for Statistics, July 2013.
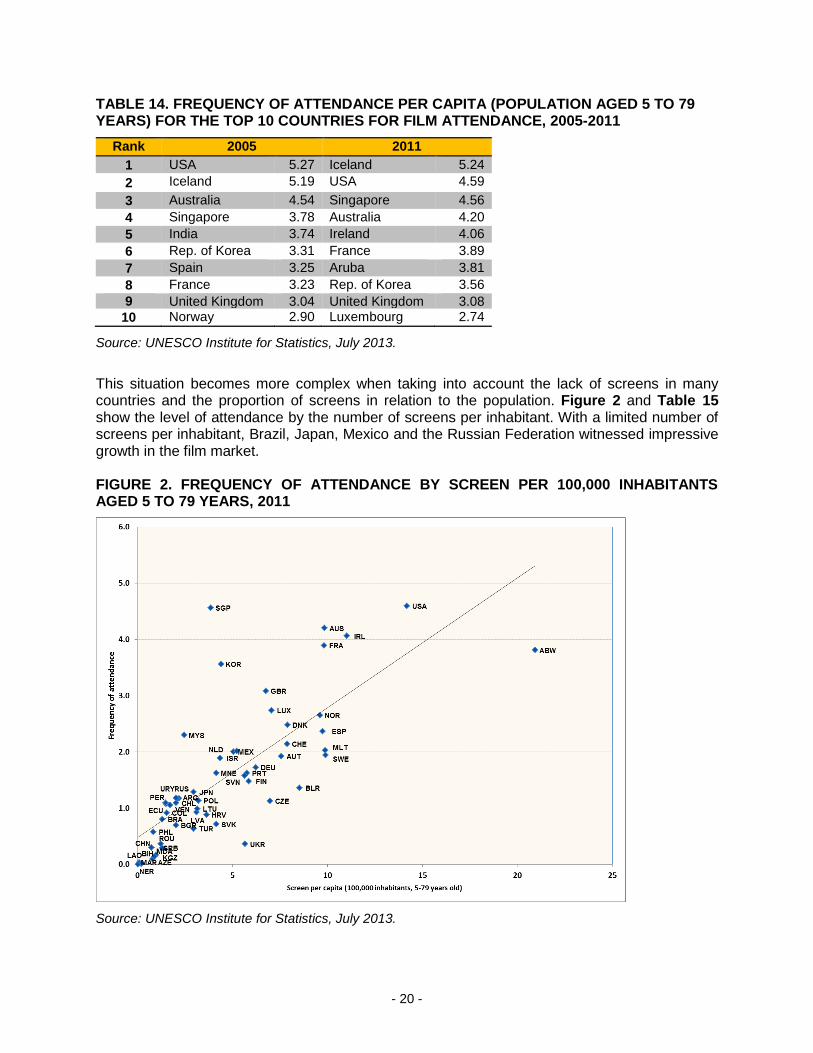
This situation becomes more complex when taking into account the lack of screens in many countries and the proportion of screens in relation to the population. Figure 2 and Table 15 show the level of attendance by the number of screens per inhabitant. With a limited number of screens per inhabitant, Brazil, Japan, Mexico and the Russian Federation witnessed impressive growth in the film market. FIGURE 2. FREQUENCY OF ATTENDANCE BY SCREEN PER 100,000 INHABITANTS AGED 5 TO 79 YEARS, 2011
Source: UNESCO Institute for Statistics, July 2013.

- 21 -
Aruba and the USA stand out in Figure 2. They have the highest frequency of attendance and screens per capita but for different reasons. Aruba has a wealthier economy mainly generated from tourism and a small population (about 100,000 inhabitants in 2011); it has nearly 20 screens/2 theaters for 380,000 annual admissions. These humble numbers generate very high percentages. Another Caribbean island – Saint Kitts – has a similar situation. The other outlier, USA, is the primary film market in the world.
Singapore and the Republic of Korea have high attendance frequency but a relatively low number of screens per capita.
Countries which have a high number of screens per capita but lower frequency of attendance include: Malta, Spain and Sweden. It is worth noting that Spain is the 6th largest exhibition market in the world (2011). This country also had an important crisis that significantly reduced its level of admissions in recent years (127.6 million in 2005; 98.3 million in 2011).
TABLE 15. TOP 5 COUNTRIES WITH AT LEAST 10 SCREENS PER 100,000 INHABITANTS (POPULATION AGED 5 TO 79 YEARS), 2005-2011
Country Screens per
capita in 2005
Country
Screens per capita in 2006
Iceland 16.88 Iceland 17.03
USA 14.34 USA 14.34
Sweden 12.03 Sweden 12.04
Spain 11.20 Ireland 10.90
Malta 11.08 Spain 10.81
Country Screens Per
Capita in 2007
Country Screens per
capita in 2008 Iceland 15.70 Saint Kitts and Nevis 15.30
USA 14.85 USA 14.77
Sweden 11.49 Iceland 14.75
Ireland 11.05 Ireland 11.16
Malta 10.99 Malta 10.97
Country Screens per
capita in 2009
Country Screens per
capita in 2010 Saint Kitts and Nevis 15.09 Aruba 21.03
USA 14.47 USA 14.28
Iceland 14.19 Iceland 13.29
Ireland 11.22 Belarus 11.30
Malta 10.95 Ireland 10.99
Country Screens per
capita in 2011*
Aruba 20.93
USA 14.19
Ireland 11.03
Sweden 9.90
Malta 9.88
Note: * No data for Iceland for 2011, which should have been ranked in the Top 5. Source: UNESCO Institute for Statistics, July 2013.

- 22 -
Table 16 shows that the countries that had the fewest number of screens in 2007 were almost exclusively from Africa. Nevertheless, some countries with few screens in other regions still had important markets, such as China, India and the Russian Federation. Latin America also generally has a low number of screens, but two countries stood out: Bolivia (2005) and Paraguay (2006). This is a more recent situation, because until the 1970s Latin America had many screens distributed all over its territories (Getino, 2005). TABLE 16. TOP 5 COUNTRIES WITH THE FEWEST SCREENS PER 100,000 INHABITANTS (POPULATION AGED 5 TO 79 YEARS), 2005-2011
Country* Screens per
capita in 2005
Country* Screens per
capita in 2006
Iran 0.38 China 0.25
Romania 0.59 Tunisia 0.31
Bolivia 0.61 Iran 0.37
Russian Federation 0.81 Indonesia 0.45
India 1.04 Paraguay 0.52
Country Screens per
capita in 2007
Country Screens per
capita in 2008 Cameroon 0.02 Cameroon 0.02
Mozambique 0.02 Mozambique 0.02
Niger 0.03 Niger 0.03
Algeria 0.03 Burkina Faso 0.08
Palestine 0.06 Nigeria 0.08
Country Screens per
capita in 2009
Country Screens per
capita in 2010 Mozambique 0.02 Mali 0.02
Niger 0.03 Guinea 0.02
Algeria 0.06 Syria 0.03
Cambodia 0.06 Niger 0.03
Burkina Faso 0.08 Tanzania 0.06
Country Screens per
capita in 2011
Mali 0.02
Guinea 0.02
Syria 0.03
Niger 0.03
Tanzania 0.06
Note: * No data for the Sub Saharan region. Source: UNESCO Institute for Statistics, July 2013.
- 23 -
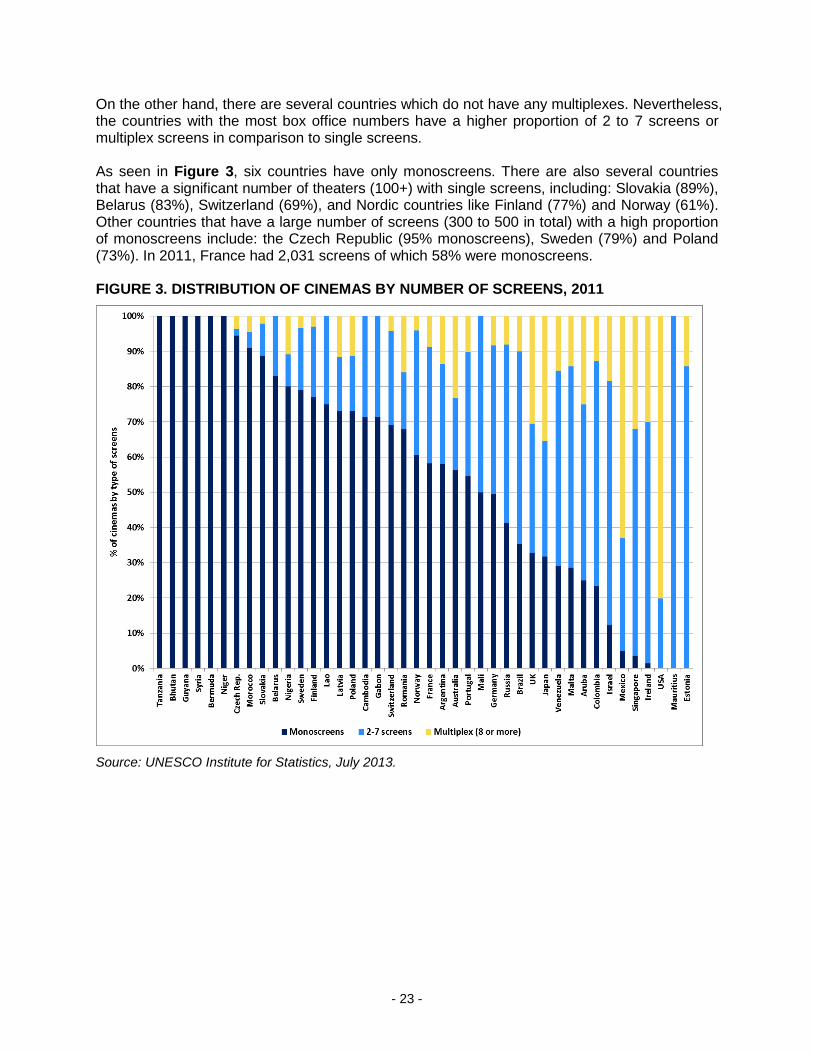
On the other hand, there are several countries which do not have any multiplexes. Nevertheless, the countries with the most box office numbers have a higher proportion of 2 to 7 screens or multiplex screens in comparison to single screens. As seen in Figure 3, six countries have only monoscreens. There are also several countries that have a significant number of theaters (100+) with single screens, including: Slovakia (89%), Belarus (83%), Switzerland (69%), and Nordic countries like Finland (77%) and Norway (61%). Other countries that have a large number of screens (300 to 500 in total) with a high proportion of monoscreens include: the Czech Republic (95% monoscreens), Sweden (79%) and Poland (73%). In 2011, France had 2,031 screens of which 58% were monoscreens. FIGURE 3. DISTRIBUTION OF CINEMAS BY NUMBER OF SCREENS, 2011
Source: UNESCO Institute for Statistics, July 2013.

- 24 -
4. Digitization
Since 2010 (the year in which the film Avatar was released), the number of digital screens increased exponentially, especially in developed countries. In developing countries, the rate of digitization was lower yet still significant. Figure 4 shows the sharp rise in the number of digital screens, increasing from 6,707 in 2005 to 55,442 in 2011. This represents an increase of 726%. The trend is also characterised by the fact that it occurred outside the USA. In 2007, the USA accounted for 70% of all digital screens; by 2001, the share had dropped to 46%. The greatest growth occurred in Europe.
In the 2000s, the mainstream film industry (Hollywood and multinational companies) declared that digitization of screens would reduce copy fees and other related costs, opening more theaters, penetrating territories with a low level of screens, allowing national film producers and filmmakers in developing countries to increase their market share and reinforcing cultural diversity (De Luca, 2004, 2009) .
FIGURE 4. NUMBER OF DIGITAL SCREENS*, 2007-2011
Note: * Digital projectors included in the UIS survey until 2007 required a minimum standard of 1.3K resolution, where the imaging device is 1,280 pixels wide by either 720 or 1,024 pixels high. Since 2008, all new digital projectors have a minimum standard of 2K resolution (2,048 x 1,080).
Source: UNESCO Institute for Statistics, July 2013.
- 25 -
Digitization is dominated by Hollywood and other major players. This concentration has strengthened in recent years, and this having a negative impact on middle and small exhibitors and, in some cases, national producers. The Virtual Print Fee (VPF4) has almost no presence in regions like Latin America – except for a very few big players. National producers also need to pay a “sui generis” VPF which is more expensive than the former 35mm print costs for local producers in developing countries (González, 2011).
5. Case studies In order to analyse specific trends in the cinema market across the world, two cases studies will be presented: one comparing film market in the USA to that of China, and the other focusing on the Latin American market. The first case study will demonstrate how the dynamic Chinese market is challenging the USA as the premier film market in terms of box office. The second case study will show that the Latin American film sector is not homogenous and is led by two countries – Brazil and Mexico have entered into the world top market during the last decade, while other countries of the region lack screens and have small production. Public regulation and support of the film sector in the region have also highly influenced the structure of the Latin American market. 5.1. China: The future leader of the film market? Over the few last decades, the rate of economic growth of the Chinese economy has been enormous compared to most, if not all, economies in developed countries. As a result, this growth has been evident in the film market, where by 2012 China became the second largest consumer of feature films in the world in terms of box office. During the same period, the USA market has faced stagnation or experienced little increase in terms of admissions. If this trend continues, China will surpass the USA as the world’s Number 1 film market by 2020. The film market in China has grown four to five times faster than its GDP over the last decade (and its GDP is one of the fastest growing in the world) and the growth in the film market has been even more impressive. In fact, between 2005 and 2011, box office in China grew on average by 43% per year (50% over the 2008-2011 period), while the cinema market box office of the USA grew on average by just 2.2% annually (see Figure 5). The difference in the number of admissions is remarkable: while admissions grew on average by 15.6% annually in China between 2005 and 2011, in the USA market there was an annual average decrease of -1.4% (see Figure 6). This growth occurred despite the dramatic increase in ticket prices that occurred in China during this period. The average admission price in China multiplied 3.5 times, an increase of 253% between 2005 and 2011, whereas the average ticket price in the USA increased by only 23.8%. It is worth noting that the decline in growth of the US market (both for box office and admissions) started in 2005, that is to say, three years before the start of the global financial crisis.
4 The Virtual Print Fee (VPF) is financial support giving by distribution companies to exhibition
companies to afford the high costs of digitization.

- 26 -
FIGURE 5. ANNUAL GROWTH RATE IN BOX OFFICE REVENUE IN CHINA AND USA, 2005-2011 (BASE YEAR 2005)
Source: UNESCO Institute for Statistics, July 2013.
FIGURE 6. ANNUAL GROWTH RATE IN ADMISSIONS IN CHINA AND USA, 2005-2011 (BASE YEAR 2005)
Source: UNESCO Institute for Statistics, July 2013.
- 27 -
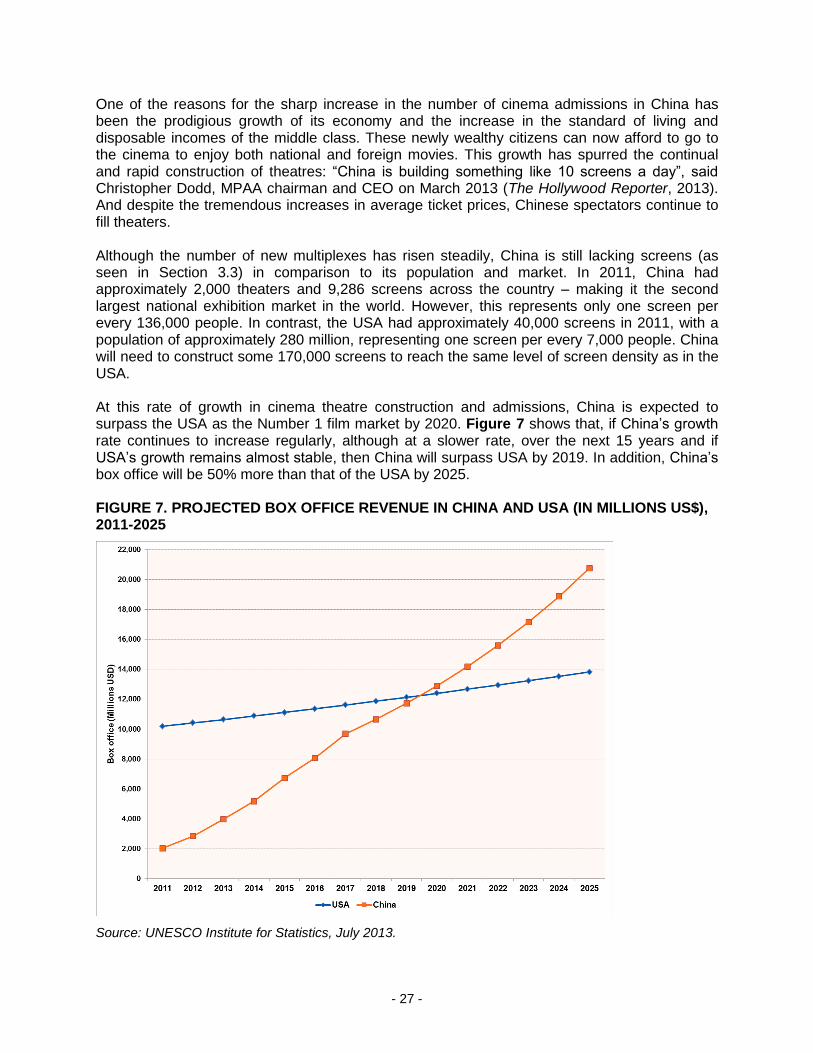
One of the reasons for the sharp increase in the number of cinema admissions in China has been the prodigious growth of its economy and the increase in the standard of living and disposable incomes of the middle class. These newly wealthy citizens can now afford to go to the cinema to enjoy both national and foreign movies. This growth has spurred the continual and rapid construction of theatres: “China is building something like 10 screens a day”, said Christopher Dodd, MPAA chairman and CEO on March 2013 (The Hollywood Reporter, 2013). And despite the tremendous increases in average ticket prices, Chinese spectators continue to fill theaters. Although the number of new multiplexes has risen steadily, China is still lacking screens (as seen in Section 3.3) in comparison to its population and market. In 2011, China had approximately 2,000 theaters and 9,286 screens across the country – making it the second largest national exhibition market in the world. However, this represents only one screen per every 136,000 people. In contrast, the USA had approximately 40,000 screens in 2011, with a population of approximately 280 million, representing one screen per every 7,000 people. China will need to construct some 170,000 screens to reach the same level of screen density as in the USA. At this rate of growth in cinema theatre construction and admissions, China is expected to surpass the USA as the Number 1 film market by 2020. Figure 7 shows that, if China’s growth rate continues to increase regularly, although at a slower rate, over the next 15 years and if USA’s growth remains almost stable, then China will surpass USA by 2019. In addition, China’s box office will be 50% more than that of the USA by 2025. FIGURE 7. PROJECTED BOX OFFICE REVENUE IN CHINA AND USA (IN MILLIONS US$), 2011-2025
Source: UNESCO Institute for Statistics, July 2013.

- 28 -
5.2. Latin America: Evolution and characteristics of the cinema industry
The Latin American film market shows contrasting situations between countries. On the one hand, there are countries that in the last decade have more than doubled the number of screens, admissions and/or box office (i.e. Brazil, Colombia, Mexico and Peru). Brazil entered the world Top 10 list with the highest admissions of any Latin American country during the last decade, while Mexico has the fifth largest number of screens in the world. On the other hand, some countries encountered modest growth or even stagnation in the number of screens available (i.e. Argentina and Uruguay).
A common pattern seen in the region is government support for film production. The evolution of the film market in some countries, such as Argentina, Brazil and Mexico, is highly dependent on public policies, which have been changing over the last 30 years.
In 2011, Latin America generated a total box office of US$1.6 billion, representing an average ticket price of US$4.50 and the sale of 417 million tickets. Brazil and Mexico together accounted for 65% to 75% of these totals.
Viewers in Latin America have access to about 9,756 screens. On average, there are 210 commercial releases per year. Depending on the country, between 5 and 130 national films are produced a year, primarily as a direct result of the national support received by the governments of the region over various decades. Production
During the first decade of the 21st Century, Latin American countries produced 2,400 feature films (see Figure 8), with growth throughout each decade (on average 350 films were produced per year between 2005 and 2011). This is a sharp increase from the 1980s, when on average 230 films were produced annually or the 1990s with 90 films per year (Getino, 2005). Film production in Latin America increased partly as a direct result of the public policies developed to support the field (with the exceptions of Paraguay and a few Central American countries). These policies have been present in most of the subcontinent since the 1930s (mainly in Argentina, Brazil, Mexico and Peru). The subsequent decades saw further support in the form of subsidies, tax incentives, soft loans, prizes for quality and screen quotas (there were even state producers, state distributors and state exhibitors, mainly in Mexico from the 1940s to 1970s and in Brazil in the 1970s). In the early 1990s, most countries in the region experienced a drastic reduction in public support, affecting the national film sectors negatively. Nevertheless, in the late 1990s and early 2000s, there was a re-emergence of public policies favorable to the film sector, mainly in relation to production. The three major film-producing countries, Argentina, Brazil and Mexico, resumed their growth. During the 2000s, most Latin American countries implemented national legislation supporting the film sector. Argentina and Brazil returned to maximum production peaks with over 100 films produced annually, surpassing records set in the earlier “golden years”. Mexico also increased film production, but the country is only just reaching the number of films produced during its golden years (between 1940 and 1980), which was also about 100 annually. Other Latin American countries showed more modest increases in the number of films produced. Due to new national film policies in some of these countries, they have begun regular production of films for the first time in their history.

- 29 -
FIGURE 8. NUMBER OF FEATURE FILMS PRODUCED IN LATIN AMERICA, 2005-2011
Source: UNESCO Institute for Statistics, July 2013 and Latin American film agencies, production companies and media (RoqueGonzalezConsulting.com).
Over the last decade, coproduction became the main method of film production in many Latin American countries, such as Bolivia, Cuba and Uruguay. A significant inter-governmental initiative related to film support was born within this context: the Conference of Ibero American Film Authorities (CACI, in Spanish initials). In 1997, they created the Ibermedia Program5 that since has had a fundamental role in regional cinematography, with funds dedicated to production, distribution, training and marketing. Nevertheless, production is the main focus for Ibermedia loans. There was another regional attempt to create a similar inter-governmental space in Southern Cone–the Specialized Meeting of Film and Audiovisual Authorities6 (Recam, in Spanish initials), but with no concrete outcome until now. Within Latin America, there is an important and hidden level of semi-professional, almost artisanal, production of feature films, especially in Bolivia, Ecuador, Peru and Venezuela. Like “Nollywood”, these films which are not released in theatres but rather circulated via street vendors or streaming on-line (mainly YouTube) are viewed by large audiences, with some titles becoming popular “hits”.
5 www.programaIbermedia.com 6 www.recam.org
- 30 -
Market and consumption
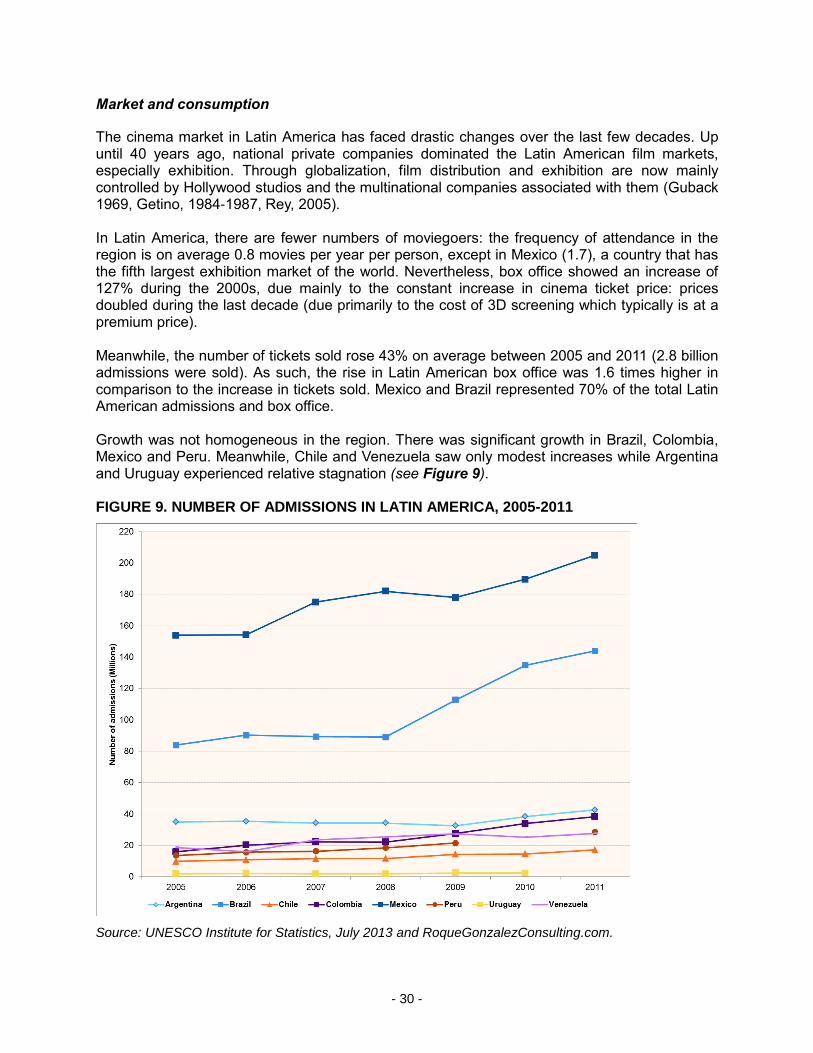
The cinema market in Latin America has faced drastic changes over the last few decades. Up until 40 years ago, national private companies dominated the Latin American film markets, especially exhibition. Through globalization, film distribution and exhibition are now mainly controlled by Hollywood studios and the multinational companies associated with them (Guback 1969, Getino, 1984-1987, Rey, 2005). In Latin America, there are fewer numbers of moviegoers: the frequency of attendance in the region is on average 0.8 movies per year per person, except in Mexico (1.7), a country that has the fifth largest exhibition market of the world. Nevertheless, box office showed an increase of 127% during the 2000s, due mainly to the constant increase in cinema ticket price: prices doubled during the last decade (due primarily to the cost of 3D screening which typically is at a premium price). Meanwhile, the number of tickets sold rose 43% on average between 2005 and 2011 (2.8 billion admissions were sold). As such, the rise in Latin American box office was 1.6 times higher in comparison to the increase in tickets sold. Mexico and Brazil represented 70% of the total Latin American admissions and box office. Growth was not homogeneous in the region. There was significant growth in Brazil, Colombia, Mexico and Peru. Meanwhile, Chile and Venezuela saw only modest increases while Argentina and Uruguay experienced relative stagnation (see Figure 9). FIGURE 9. NUMBER OF ADMISSIONS IN LATIN AMERICA, 2005-2011
Source: UNESCO Institute for Statistics, July 2013 and RoqueGonzalezConsulting.com.
- 31 -
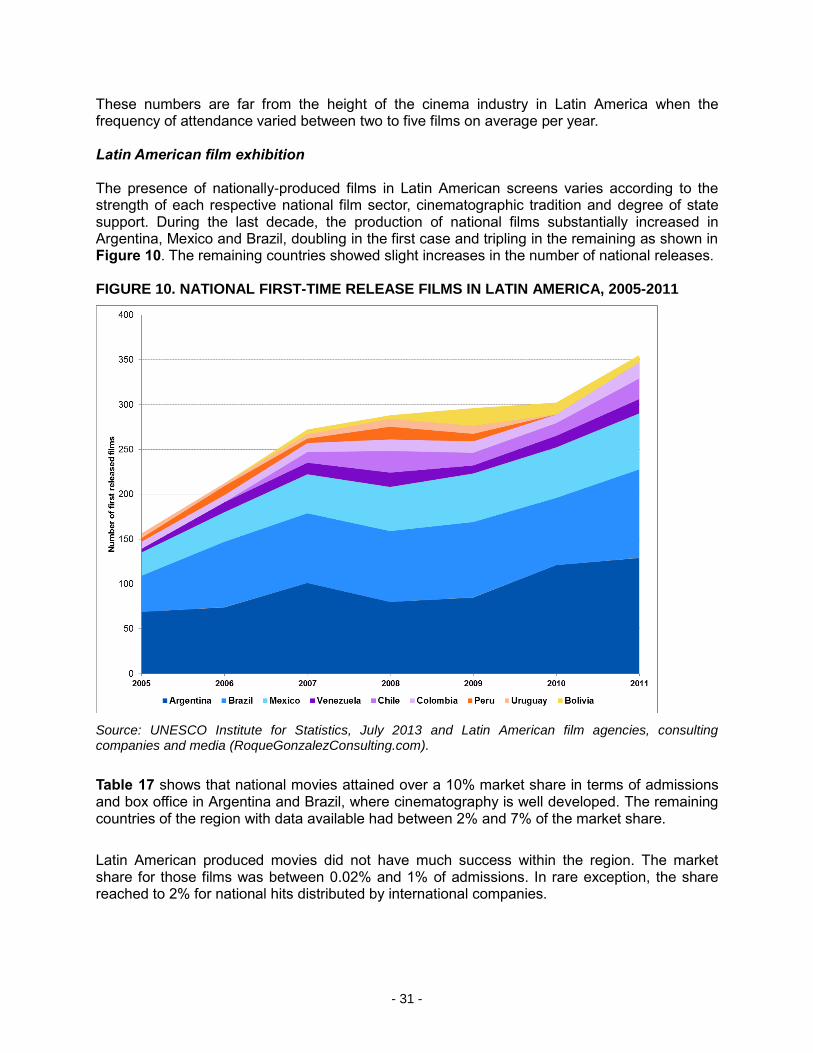
These numbers are far from the height of the cinema industry in Latin America when the frequency of attendance varied between two to five films on average per year. Latin American film exhibition The presence of nationally-produced films in Latin American screens varies according to the strength of each respective national film sector, cinematographic tradition and degree of state support. During the last decade, the production of national films substantially increased in Argentina, Mexico and Brazil, doubling in the first case and tripling in the remaining as shown in Figure 10. The remaining countries showed slight increases in the number of national releases. FIGURE 10. NATIONAL FIRST-TIME RELEASE FILMS IN LATIN AMERICA, 2005-2011
Source: UNESCO Institute for Statistics, July 2013 and Latin American film agencies, consulting companies and media (RoqueGonzalezConsulting.com).
Table 17 shows that national movies attained over a 10% market share in terms of admissions and box office in Argentina and Brazil, where cinematography is well developed. The remaining countries of the region with data available had between 2% and 7% of the market share.
Latin American produced movies did not have much success within the region. The market share for those films was between 0.02% and 1% of admissions. In rare exception, the share reached to 2% for national hits distributed by international companies.

- 32 -
TABLE 17. AVERAGE MARKET SHARE OF NATIONAL FIRST-TIME RELEASE FILMS BETWEEN 2005 AND 2011 IN LATIN AMERICA, BASED ON ADMISSIONS
Country Market share (%)
Brazil 12.7
Argentina 11.0
Colombia 7.3
Mexico 6.5
Uruguay 6.0
Chile 5.6
Venezuela 4.9
Peru 2.0
Source: UNESCO Institute for Statistics, July 2013 and Latin American film agencies, consulting companies and media (RoqueGonzalezConsulting.com).
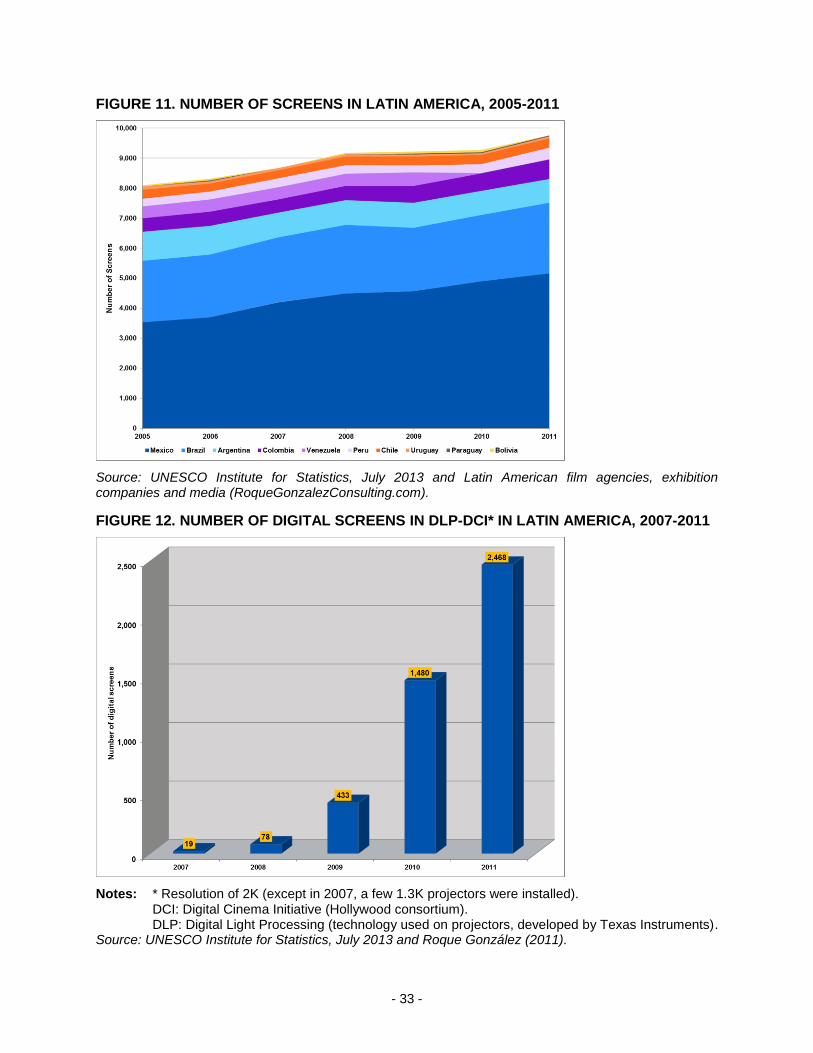
Infrastructure and exhibition The number of screens in Latin America grew on average by 65% in the 2000s. This percentage was led by Mexico and to a lesser extent; Brazil and Colombia (see Figure 11). This growth took place in a context of high geographic and class concentration, in addition to the high cost of tickets – in Latin America just one family outing to the family represented the equivalent of 10% of average local monthly income. Nevertheless, Latin America still remains “under screened”, including the giant Brazil, which has only around 2,500 screens for a population of almost 200 million inhabitants, representing only 1.1 screens per 100,000 inhabitants. Regardless of whether one country has more or fewer screens, the geographic concentration of the screens is extremely important in all Latin American countries. In Mexico, only 7% of cities had a screen, and in Brazil, the second largest Latin American exhibition market, only 10% of cities had a theater (González, 2011). Digital screens These patterns are especially acute in digital cinema through its flagship: 3D (the vast majority of Latin American digital screens are 3D). In 2007, 19 screens were digitized in Latin America. Since 2008, especially 2009, many digital screens opened in the entire region. Nevertheless, the rate of digitization in the region remains one of the lowest in the world (22% in 2011) (see Figure 12). Digital screens in Latin America are concentrated in two countries: three-quarters are in Mexico and Brazil. Since the onset, Mexico has led the way in digital exhibition in the region – in July 2000 the first Latin American digital screen opened in Mexico City (Cinemex’s “Mundo E”). Until December 2011, one-half of Latin American digital screens were located in Mexico.
- 33 -
FIGURE 11. NUMBER OF SCREENS IN LATIN AMERICA, 2005-2011
Source: UNESCO Institute for Statistics, July 2013 and Latin American film agencies, exhibition companies and media (RoqueGonzalezConsulting.com).
FIGURE 12. NUMBER OF DIGITAL SCREENS IN DLP-DCI* IN LATIN AMERICA, 2007-2011
Notes: * Resolution of 2K (except in 2007, a few 1.3K projectors were installed). DCI: Digital Cinema Initiative (Hollywood consortium). DLP: Digital Light Processing (technology used on projectors, developed by Texas Instruments). Source: UNESCO Institute for Statistics, July 2013 and Roque González (2011).
- 34 -
However, promises about democratisation, lower costs and more diversity around digital cinema have not materialised. In Latin America, equipment costs are about US$100,000.00, almost double that of developed countries. This is due to high taxes charged on electronic and digital equipment. For this reason, only the major exhibition companies (foreign and local) are capable of paying the costs of digitization. Moreover, there are generally no public policies to help exhibition companies to digitize – like in Europe, except in Argentina and Brazil. In this context, the Latin American digital screens are replicating the pattern of general exhibition: they are mainly in wealthy cities and wealthy neighborhoods.
Conclusion This analysis has highlighted some unique trends in the global cinema sector. First, there is a tendency for the “global film industry” (dominated by Hollywood productions) to produce sequels, prequels and adaptations (non-original ideas) that are targeted to mass media, children and youth, resulting in a concentration of world production. Second, film production is highly concentrated with 7% of the countries with regular film production making 55% of all feature films globally. India itself produced 20% of all films worldwide. Blockbusters outside of the USA have mainly been USA-produced comedies, breaking records all over the world. National productions or coproductions that are not distributed by Hollywood major studios have had almost no circulation beyond national borders. In the period 2005-2011, world admissions dropped by 12.8%, while box office revenues rose by 27.8% (average ticket price increased by 46%, especially since the 3D boom). Market concentration is still very high; Top 10 countries represented around 75% of world box office and 85% of world admissions. The concentration for admissions slowly increased from 85% to 90% between 2005 and 2011. Similar to patterns in the world macro-economy, the BRIC group (Brazil, the Russian Federation, India and China) is increasing its market share of the world film market (both production and admissions). China is the main star of this story: based on conservative estimates, by early 2020 the Asiatic giant will surpass USA as the main film market in the world. Other regions, like Latin America, have improved their film market indicators, but they are still low (except for Brazil and Mexico) in comparison to other regions. There are many individual countries that had impressive box office growth (21 countries with increases from 102% to 556%), in comparison with admissions rises (10 countries increasing from 100% to 156%). In other words, the world film screen market is losing spectators but increasing revenues – mainly due to increased ticket prices. In the context of many large countries, such as China, the Russian Federation and India, “lacking cinema screens, the development of their cinema infrastructure could give a push to the world film market” (Miller, 2008).

- 35 -
This state of affairs could be the result of a change of paradigm related to audiovisual consumption. More people are watching movies, television series, shows, clips, etc. mainly through Internet connections (in their home, office, walking down the street or in a cybercafé). Nevertheless, the audiovisual industry has not yet received high revenues from these sources, such as the major profits that were generated by home video from the mid-1980s to the mid-2000s. The digitization of screens (a radical change since the beginning of cinema) has rapidly increased, especially since 2010. Nevertheless, the reduction of many distribution and exhibition costs is not changing the context of screen concentration and vast territories with cinema infrastructure remain under-developed. This is a time of fundamental change in the film and audiovisual sector, and it is just the beginning.

- 36 -
References
Cain, Robert (2013). “The Increasingly Astonishing Rise of China’s Film Business”. Accessed on 22 April 2013: http://chinafilmbiz.com/2013/04/06/the-increasingly-astonishing-rise-of-chinas-film-business/
De Luca, Luiz Gonzaga Assis (2009). A hora do cinema digital. Democratização e globalização do audiovisual. San Pablo: Imprensa oficial do Estado de São Paulo.
De Luca, Luiz Gonzaga Assis (2004). Cinema digital: Um novo cinema?. San Pablo: Imprensa oficial do Estado de São Paulo.
Ernst & Young-India Film Council (2012). Film Industry in India: New Horizons. Kolkata: Ernst&Young.
European Audiovisual Observatory. Focus, various editions. Strasbourg: European Audiovisual Observatory.
European Audiovisual Observatory (2012). The Film Industry in the Russian Federation. Strasbourg: European Audiovisual Observatory.
Fundación del Nuevo Cine Latinoamericano (2011). Cine latinoamericano y nuevas tecnologías audiovisuales (“Latin American Cinema and New Audiovisual Technologies”). Havana: Fundación del Nuevo Cine Latinoamericano.
Getino, Octavio (2005). Cine iberoamericano: los desafíos del nuevo siglo (“Ibero American Cinema: Challenge of New Century”). San José de Costa Rica: Veritas.
Getino, Octavio – coordinator (2012). Producción y mercados del cine latinoamericano en la primera década del siglo XXI (“Production and Market of Latin American Cinema in the First Decade of the XXIst Century”). Buenos Aires: Ciccus.
González, Roque (2012). “Cine latinoamericano: entre la pantalla de plata y las pantallas digitales” (“Latin American Cinema: between silver screen and digital screens”). In Octavio Getino (coordinator), Producción y mercados del cine latinoamericano en la primera década del siglo XXI (“Production and market of Latin American Cinema in the first decade of the XXIst Century”). Buenos Aires: Ciccus.
Guback, Thomas (1969). "The International Film Industry". Indiana: Indiana University Press.
Lobato, Ramón (2012). Shadow Economies of Cinema: Mapping Informal Film Distribution. London: British Film Institute.
Miller, Toby, Nitin Govil, John McMurria, Richard Maxwell and Ting Wang (2008). Global Hollywood 2. London: BFI Publishing.
Oxford Economics (2011). The Economic Contribution of the Film and Television Industries in China, London: Oxford Economics.
Pendakur, Manjunath (2012). “Digital pleasure palaces: Bollywood seduces the global Indian at the multiplex”. In Jump Cut: A Review of Contemporary Media, No. 54, Fall.
The Hollywood Reporter (2013). “Second Only to North America”. Accessed on 2 May 2013: http://www.hollywoodreporter.com/
Wasko, Janet (2011). “The Dead of Hollywood: Exaggeration or Reality?”. In: Wasko, Janet, Graham Murdock and Helena Sousa (eds.), The Handbook of Political Economy of Communications. London: Blackwell.
- 37 -
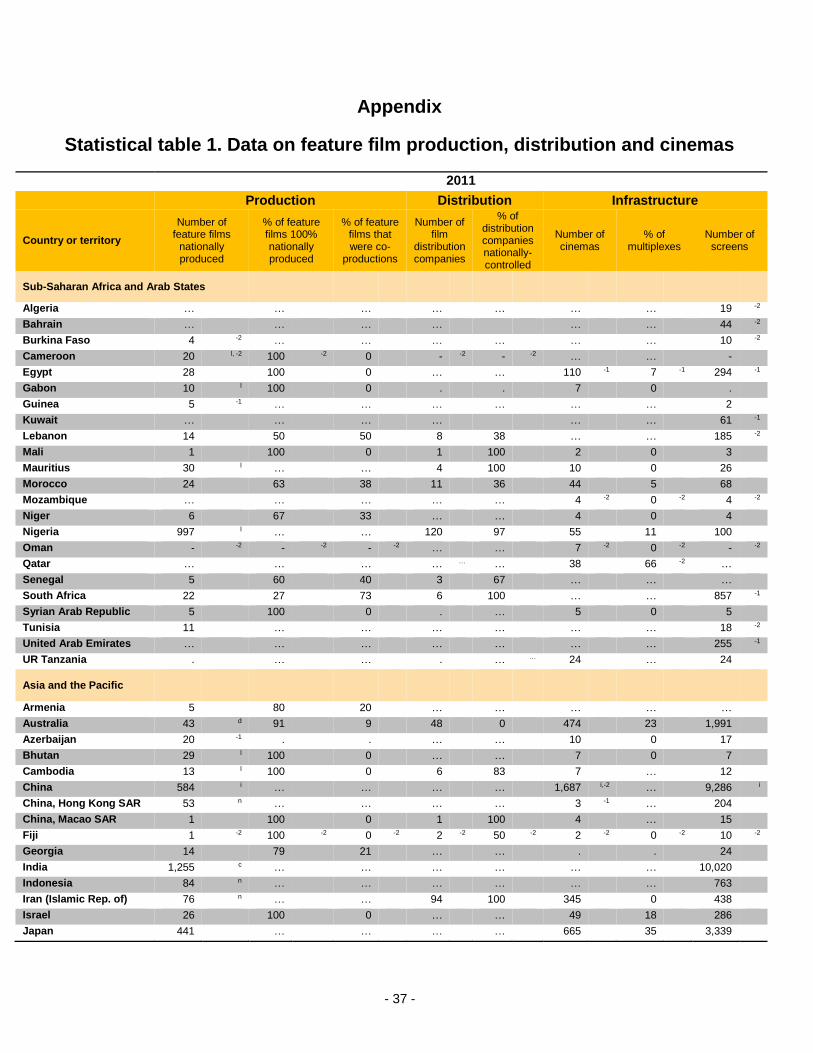
Appendix
Statistical table 1. Data on feature film production, distribution and cinemas
2011
Production Distribution Infrastructure
Country or territory
Number of feature films
nationally produced
% of feature films 100% nationally produced
% of feature films that were co-
productions
Number of film
distribution companies
% of distribution companies nationally-controlled
Number of cinemas
% of multiplexes
Number of screens
Sub-Saharan Africa and Arab States
Algeria … … … … … … … 19 -2
Bahrain … … … … … … 44 -2
Burkina Faso 4 -2 … … … … … … 10 -2
Cameroon 20 l, -2 100 -2 0 - -2 - -2 … … -
Egypt 28 100 0 … … 110 -1 7 -1 294 -1
Gabon 10 l 100 0 . . 7 0 .
Guinea 5 -1 … … … … … … 2
Kuwait … … … … … … 61 -1
Lebanon 14 50 50 8 38 … … 185 -2
Mali 1 100 0 1 100 2 0 3
Mauritius 30 l … … 4 100 10 0 26
Morocco 24 63 38 11 36 44 5 68
Mozambique … … … … … 4 -2 0 -2 4 -2
Niger 6 67 33 … … 4 0 4
Nigeria 997 l … … 120 97 55 11 100
Oman - -2 - -2 - -2 … … 7 -2 0 -2 - -2
Qatar … … … … … … 38 66 -2 …
Senegal 5 60 40 3 67 … … …
South Africa 22 27 73 6 100 … … 857 -1
Syrian Arab Republic 5 100 0 . … 5 0 5
Tunisia 11 … … … … … … 18 -2
United Arab Emirates … … … … … … … 255 -1
UR Tanzania . … … . … … 24 … 24
Asia and the Pacific
Armenia 5 80 20 … … … … …
Australia 43 d 91 9 48 0 474 23 1,991
Azerbaijan 20 -1 . . … … 10 0 17
Bhutan 29 l 100 0 … … 7 0 7
Cambodia 13 l 100 0 6 83 7 … 12
China 584 i … … … … 1,687 i,-2 … 9,286 i
China, Hong Kong SAR 53 n … … … … 3 -1 … 204
China, Macao SAR 1 100 0 1 100 4 … 15
Fiji 1 -2 100 -2 0 -2 2 -2 50 -2 2 -2 0 -2 10 -2
Georgia 14 79 21 … … . . 24
India 1,255 c … … … … … … 10,020
Indonesia 84 n … … … … … … 763
Iran (Islamic Rep. of) 76 n … … 94 100 345 0 438
Israel 26 100 0 … … 49 18 286
Japan 441 … … … … 665 35 3,339

- 38 -
Kazakhstan 12 ±, -2, r, s 67 -2 33 -2 … … 94 … 171 -2
Kyrgyzstan 1 -1 … … 1 100 38 0 38
Lao PDr 2 -2 0 -2 100 -2 3 100 4 0 5
Malaysia 49 f … … … … 107 f … 639
Mongolia 13 100 0 4 75 … … …
Myanmar 27 -2 100 -2 0 -2 50 -2 100 -2 124 -2 0 -2 124 -2
New Zealand 25 88 12 … … … … …
Pakistan 27 -2 100 -2 0 -2 232 -2 86 ±, -2 228 -2 6 -2 319 -2
Philippines 78 n … … … … … … 693
Republic of Korea 216 h … … … … 300 h 79 h 1,974
Singapore 15 73 27 … … 28 32 187
Tajikistan 8 -2 13 ±, -2, s … … … … … 67
Thailand 49 n, -1 … … … … … … 757
Viet Nam 75 56 44 … … 105 0 …
Europe and North America
Austria 54 52 48 … … 157 14 577
Belarus 1 100 0 7 100 129 … 744
Belgium 47 -2 17 -2 83 -2 27 -1 81 -1 … … 461 -1
Bosnia/Herzegovina 7 n … … … … … … 34
Bulgaria 15 67 33 17 100 . . 138
Canada 86 d … . … … … … …
Croatia 9 33 67 6 17 68 0 146
Cyprus 3 33 67 6 100 7 0 30
Czech Republic 45 84 16 25 0 473 4 668
Denmark 43 37 63 18 … 161 4 396
Estonia 13 62 38 15 87 … … 74
Finland 42 64 36 13 62 166 3 283
France 272 56 44 439 0 2,031 9 5,465
Germany 212 62 38 103 93 1,671 g 8 4,640
Greece 43 n 77 23 … … … … 370 -1
Hungary 24 -1 83 -1 17 -1 … … 177 -1 7 -1 411 -1
Iceland 13 69 31 … … … … 38 -1
Ireland 32 13 ±, e 56 ±, e 8 25 70 30 444
Italy 155 b 85 15 … … … … 3,217 -1
Latvia 6 83 17 7 43 26 12 63
Lithuania 2 100 0 . … 51 18 95
Luxembourg 16 13 88 … … 13 8 33
Malta 1 100 0 1 100 7 14 38
Montenegro 4 0 100 … … 24 0 24
Netherlands 73 j 38 ±, e 37 ±, e 24 j … 239 j … 789
Norway 35 77 23 24 83 198 4 422
Poland 51 a 86 14 … … 448 11 1,122
Portugal 30 53 47 24 96 165 10 558
Republic of Moldova 1 -2 100 -2 0 -2 … … … … 29
Romania 17 71 29 37 100 75 16 241
Russian Federation 140 o, e … … … … 925 q 8 2,726
Serbia 29 55 45 11 91 82 1 117
Slovakia 12 42 58 13 85 143 2 209
Slovenia 19 32 68 32 97 52 8 104
Spain 199 76 24 … … 876 26 4,044
Sweden 43 58 42 … … 478 3 830
Switzerland 84 67 33 55 100 288 4 547
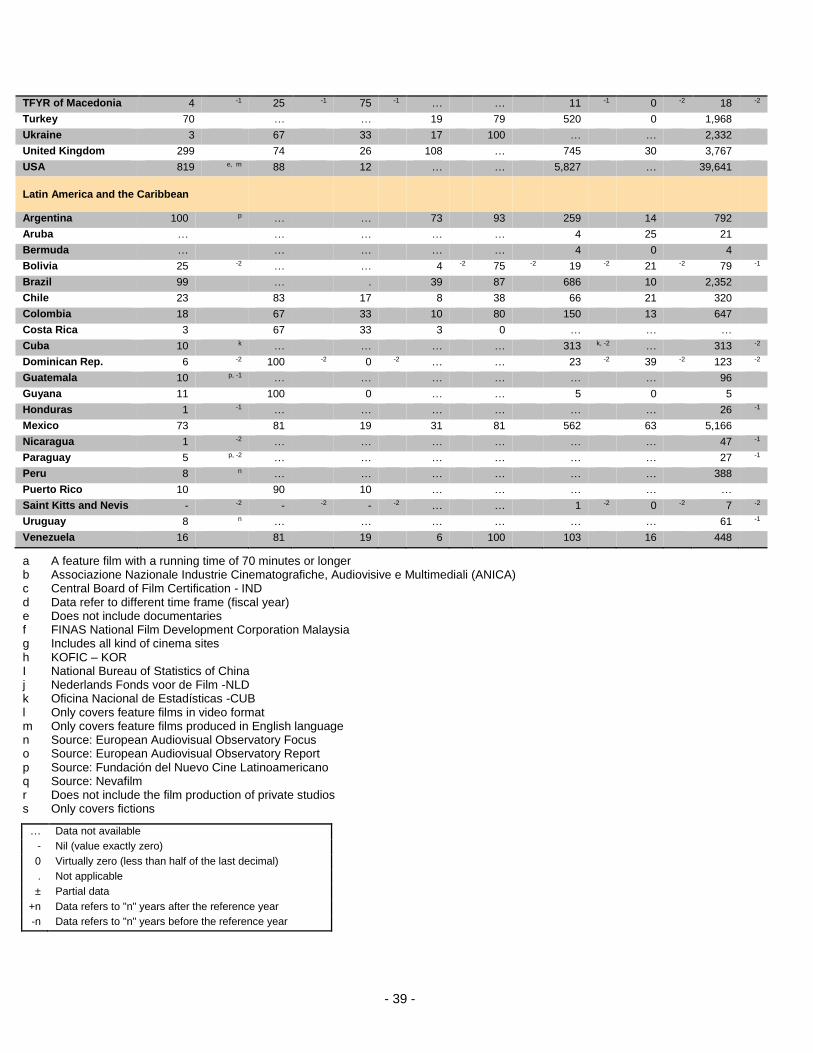
- 39 -
TFYR of Macedonia 4 -1 25 -1 75 -1 … … 11 -1 0 -2 18 -2
Turkey 70 … … 19 79 520 0 1,968
Ukraine 3 67 33 17 100 … … 2,332
United Kingdom 299 74 26 108 … 745 30 3,767
USA 819 e, m 88 12 … … 5,827 … 39,641
Latin America and the Caribbean
Argentina 100 p … … 73 93 259 14 792
Aruba … … … … … 4 25 21
Bermuda … … … … … 4 0 4
Bolivia 25 -2 … … 4 -2 75 -2 19 -2 21 -2 79 -1
Brazil 99 … . 39 87 686 10 2,352
Chile 23 83 17 8 38 66 21 320
Colombia 18 67 33 10 80 150 13 647
Costa Rica 3 67 33 3 0 … … …
Cuba 10 k … … … … 313 k, -2 … 313 -2
Dominican Rep. 6 -2 100 -2 0 -2 … … 23 -2 39 -2 123 -2
Guatemala 10 p, -1 … … … … … … 96
Guyana 11 100 0 … … 5 0 5
Honduras 1 -1 … … … … … … 26 -1
Mexico 73 81 19 31 81 562 63 5,166
Nicaragua 1 -2 … … … … … … 47 -1
Paraguay 5 p, -2 … … … … … … 27 -1
Peru 8 n … … … … … … 388
Puerto Rico 10 90 10 … … … … …
Saint Kitts and Nevis - -2 - -2 - -2 … … 1 -2 0 -2 7 -2
Uruguay 8 n … … … … … … 61 -1
Venezuela 16 81 19 6 100 103 16 448
a A feature film with a running time of 70 minutes or longer b Associazione Nazionale Industrie Cinematografiche, Audiovisive e Multimediali (ANICA) c Central Board of Film Certification - IND d Data refer to different time frame (fiscal year) e Does not include documentaries f FINAS National Film Development Corporation Malaysia g Includes all kind of cinema sites h KOFIC – KOR I National Bureau of Statistics of China j Nederlands Fonds voor de Film -NLD k Oficina Nacional de Estadísticas -CUB l Only covers feature films in video format m Only covers feature films produced in English language n Source: European Audiovisual Observatory Focus o Source: European Audiovisual Observatory Report p Source: Fundación del Nuevo Cine Latinoamericano q Source: Nevafilm r Does not include the film production of private studios s Only covers fictions
… Data not available
- Nil (value exactly zero)
0 Virtually zero (less than half of the last decimal)
. Not applicable
± Partial data
+n Data refers to "n" years after the reference year
-n Data refers to "n" years before the reference year