emerging infrastructure financing mechanisms in sub-saharan africa
TRANSCRIPT

For More InformationVisit RAND at www.rand.org
Explore the Pardee RAND Graduate School
View document details
Support RANDBrowse Reports & Bookstore
Make a charitable contribution
Limited Electronic Distribution RightsThis document and trademark(s) contained herein are protected by law as indicated in a notice appearing later in this work. This electronic representation of RAND intellectual property is provided for non-commercial use only. Unauthorized posting of RAND electronic documents to a non-RAND website is prohibited. RAND electronic documents are protected under copyright law. Permission is required from RAND to reproduce, or reuse in another form, any of our research documents for commercial use. For information on reprint and linking permissions, please see RAND Permissions.
Skip all front matter: Jump to Page 16
The RAND Corporation is a nonprofit institution that helps improve policy and decisionmaking through research and analysis.
This electronic document was made available from www.rand.org as a public service of the RAND Corporation.
CHILDREN AND FAMILIES
EDUCATION AND THE ARTS
ENERGY AND ENVIRONMENT
HEALTH AND HEALTH CARE
INFRASTRUCTURE AND TRANSPORTATION
INTERNATIONAL AFFAIRS
LAW AND BUSINESS
NATIONAL SECURITY
POPULATION AND AGING
PUBLIC SAFETY
SCIENCE AND TECHNOLOGY
TERRORISM AND HOMELAND SECURITY
This product is part of the Pardee RAND Graduate School (PRGS) dissertation series.
PRGS dissertations are produced by graduate fellows of the Pardee RAND Graduate
School, the world’s leading producer of Ph.D.’s in policy analysis. The dissertation has
been supervised, reviewed, and approved by the graduate fellow’s faculty committee.

PARDEE RAND GRADUATE SCHOOL
Emerging Infrastructure Financing Mechanisms in Sub-Saharan AfricaTewodaj M. Mengistu

PARDEE RAND GRADUATE SCHOOL
Emerging Infrastructure Financing Mechanisms in Sub-Saharan AfricaTewodaj M. Mengistu
This document was submitted as a dissertation in June 2013 in partial fulfillment of the requirements of the doctoral degree in public policy analysis at the Pardee RAND Graduate School. The faculty committee that supervised and approved the dissertation consisted of Krishna B. Kumar (Chair), Gery Ryan, and Rafiq Dossani.

The RAND Corporation is a nonprofit institution that helps improve policy and decisionmaking through research and analysis. RAND’s publications do not necessarily reflect the opinions of its research clients and sponsors.
R® is a registered trademark.
Permission is given to duplicate this document for personal use only, as long as it is unaltered and complete. Copies may not be duplicated for commercial purposes. Unauthorized posting of RAND documents to a non-RAND website is prohibited. RAND documents are protected under copyright law. For information on reprint and linking permissions, please visit the RAND permissions page (http://www.rand.org/publications/permissions.html).
Published 2013 by the RAND Corporation1776 Main Street, P.O. Box 2138, Santa Monica, CA 90407-2138
1200 South Hayes Street, Arlington, VA 22202-50504570 Fifth Avenue, Suite 600, Pittsburgh, PA 15213-2665
RAND URL: http://www.rand.orgTo order RAND documents or to obtain additional information, contact
Distribution Services: Telephone: (310) 451-7002; Fax: (310) 451-6915; Email: [email protected]
The Pardee RAND Graduate School dissertation series reproduces dissertations that have been approved by the student’s dissertation committee.

iii
Abstract
It is widely acknowledged that infrastructure plays a fundamental role in stimulating economic growth in developing countries. Conversely, the large infrastructure gap in low and middle income countries (LMICs) is a major impediment to growth. The deficit is particularly acute for Sub-Saharan Africa (SSA) where new infrastructure investment needs are estimated at US$ 22 billion a year for the next decade. While many SSA countries are unable to finance these investments on their own, the continent has experienced a significant increase in infrastructure investments since the 2000s. A substantial portion of these investments is coming from “non-traditional” sources: The private sector and emerging countries, especially China. However, the determinants of these investments, the terms of engagement underlying the new flows, and the associated tradeoffs are not well-understood. From the policy perspective, while the rise of funding for infrastructure is welcome, if the resources are not channeled adequately, the risk is that the funds will not be invested in a way that would contribute to economic growth and development, and will therefore be wasted. Thus, the overall goal of this dissertation is to better understand the new flows and their policy implications.
Given that the issues associated with Chinese and private sector financing are very
different in nature, the dissertation takes a mixed-method approach and is broadly divided into two parts. In a first part, a systematic qualitative comparison between the Chinese approach to infrastructure financing in SSA and that of other large multi- and bilateral financiers is undertaken. Unlike previous research, this dissertation takes a holistic approach and compares the different financing models using a framework that assesses infrastructure financing along the “lifecycle” of an infrastructure investment – from the planning stage to the monitoring and upkeep of the facility once it has been built. In a second part, the determinants and the extent of private participation in infrastructure (PPI) in SSA are compared to that in other LMICs using a cross-country panel regression framework. Additionally, using theoretical findings from the literature on the broader topic of private delivery of public services, the contracting mechanisms used for PPI are further explored.


v
Table of Contents
Abstract .......................................................................................................................................... iiiFigures............................................................................................................................................ ixTables ............................................................................................................................................. xiAcknowledgments........................................................................................................................ xiiiFunding ......................................................................................................................................... xvAbbreviations .............................................................................................................................. xvii1. Introduction ................................................................................................................................. 1
Motivation and policy relevance .............................................................................................................. 1General aims and research questions ........................................................................................................ 3Organization of dissertation ..................................................................................................................... 4
2. Overview and Background ......................................................................................................... 5Defining infrastructure ............................................................................................................................. 5Historical overview of infrastructure investments in SSA ....................................................................... 6
3. The Role of China as a Financier of SSA Infrastructure .......................................................... 10Previous research .................................................................................................................................... 10Methodology and data ............................................................................................................................ 12Defining a framework for the analysis ................................................................................................... 12
Planning: What goes into the planning for an infrastructure facility investment? ............................. 13Financing: What types of financing mechanisms does a public entity have at hand? ........................ 13Procurement: How does a public entity chose a builder for the facility? ........................................... 14Construction: What are the common issues that can arise during construction? ............................... 15Monitoring and upkeep: What comes after construction? .................................................................. 16Cross-cutting issues: Contractual design, transparency and corruption ............................................. 16Summary: Benchmark questions to compare alternatives .................................................................. 17
Identifying the main foreign financiers of SSA’s infrastructure ............................................................ 18Chinese actors .................................................................................................................................... 19Traditional financiers of SSA infrastructure ...................................................................................... 20
Identifying the range of practices along the infrastructure investment lifecycle .................................... 24Planning .............................................................................................................................................. 24Financing ............................................................................................................................................ 26Procurement ....................................................................................................................................... 27Construction ....................................................................................................................................... 28Monitoring and upkeep ...................................................................................................................... 30Cross-cutting issues ............................................................................................................................ 30
Discussion: How do Chinese actors compare to other financiers? ......................................................... 31Some similarities ................................................................................................................................ 32But differences stand out .................................................................................................................... 32

vi
Policy implications ............................................................................................................................. 344. Determinants of Private Participation in Infrastructure ............................................................ 36
Background and related research ............................................................................................................ 36Methodology........................................................................................................................................... 40Data ........................................................................................................................................................ 42
Private participation in infrastructure ................................................................................................. 42Explanatory variables ......................................................................................................................... 43
Results .................................................................................................................................................... 45Robustness checks .................................................................................................................................. 47Discussion .............................................................................................................................................. 49
5. Determinants of the Extent of Private Participation in SSA ..................................................... 52Background and related research ............................................................................................................ 52Methodology........................................................................................................................................... 53Data ........................................................................................................................................................ 54Results .................................................................................................................................................... 56Robustness checks .................................................................................................................................. 57Discussion .............................................................................................................................................. 59
6. Determinants of the Optimal Contract ...................................................................................... 61Underlying framework ........................................................................................................................... 61Data ........................................................................................................................................................ 69Methodology........................................................................................................................................... 70Results .................................................................................................................................................... 71Discussion .............................................................................................................................................. 72
7. Conclusions and Policy Implications ........................................................................................ 75What are these new sources of infrastructure investment? ..................................................................... 75What are the benefits and the risks? ....................................................................................................... 76What are the policy implications? .......................................................................................................... 77
References ..................................................................................................................................... 78Appendix A List of sources for the comparative analysis ............................................................ 89Appendix B Financing Mechanisms for Infrastructure ................................................................ 90Appendix C Historical Context of China-Africa Relations and Motivations of Chinese
Involvement in SSA Infrastructure ......................................................................................... 94Historical context ............................................................................................................................... 94Motivations ......................................................................................................................................... 95
Appendix D Exploring the Outcome Variable: PPI .................................................................... 100Appendix E Explanatory Variables- Determinants of PPI ......................................................... 102Appendix F Determinants of PPI- Results .................................................................................. 105Appendix G Determinants of PPI- Robustness Checks .............................................................. 111Appendix H PPP Contracts for PPI- Definitions ........................................................................ 123Appendix I Determinants of the Extent of PPI- Results ............................................................. 124Appendix J Robustness Checks .................................................................................................. 127

vii
Appendix K Determinants of the Optimal Contract ................................................................... 134


ix
Figures
Figure 1 Total commitments to African infrastructure from China and the private sector ............ 8Figure 2 The lifecycle of an infrastructure investment ................................................................. 13Figure 3 Factors associated with positive levels of PPI- SSA compared to LMICs ..................... 46Figure 4 Factors associated with the amount of PPI received- SSA compared to LMICs ........... 47Figure 5 PPI contracts negotiated in LMICs and SSA 1995-2008 (% of all PPI contracts) ......... 55Figure 6 Infrastructure sectors along the private to pure public good continuum ........................ 65Figure 7 Scope for competition in infrastructure sectors .............................................................. 66Figure 8 Level of competition in procurement ............................................................................. 67Figure 9 Level to which public provision of services is important for equity reasons ................. 68Figure 10 Types of PPI contracts negotiated in LMICs by sector 1995-2008 (% of all PPI
contracts) ............................................................................................................................... 70


xi
Tables
Table 1 Infrastructure endowment by developing region ............................................................... 7Table 2 Relevant questions for the comparison among financiers ............................................... 18Table 3 Chinese financiers of SSA infrastructure ......................................................................... 20Table 4 Traditional financiers of SSA infrastructure .................................................................... 21Table 5 Factors potentially affecting the level of PPI received .................................................... 38Table 6 Private Participation in Infrastructure Summary statistics .............................................. 43Table 7 PPI contract types by level of private sector engagement ............................................... 52Table 8 PPI contracts negotiated in LMICs and SSA by sector 1995-2008 (% of all PPI
contracts) ............................................................................................................................... 55Table 9 Determinants of the extent of PPI- LMICs ...................................................................... 56Table 10 Determinants of the extent of PPI- SSA ........................................................................ 57Table 11 Types of market failures ................................................................................................ 62Table 12 Summary of results ........................................................................................................ 71


xiii
Acknowledgments
First and foremost, I am deeply indebted to my dissertation committee members— Krishna Kumar (Chair), Gery Ryan, and Rafiq Dossani; without their support, constructive feedback, and guidance throughout the process, this dissertation would not have been possible. I would also like to thank my outside reader, Professor Sharique Hasan from the Stanford Graduate School of Business, for his very thoughtful comments and suggestions that have greatly improved the manuscript. Others at RAND, including Paul Heaton, Nick Burger, Joanne Yoong, Neeraj Sood, Raquel Fonseca, and Susan Gates, have, over the course of the dissertation, provided feedback that has helped shape the direction of this dissertation.
I would like to extend my gratitude to those who organized and facilitated my interviews and data gathering process in Addis Ababa, Ethiopia. In particular, I am deeply grateful to my father, Mebrate Mengistu, for his tireless efforts in making sure that I met the right people, as well as Ato Tesfaw Sisay and Ato Yohannes Teferi for their assistance. I am also grateful to Ato Ashagrie Getinet and Ato Jemal Mohammed from Ethio Telecom, Ato Negussie Bekele from the Ethiopian Roads Authority, Ato Zena Marcos from the Central Statistical Agency of Ethiopia, Ing. Haileyesus Adamtei and Dr. Teklu Tesfaye from the World Bank (Addis Ababa office), as well as Ato Lemma Solomon and Ato Befekadu Behute from the International Food Policy Research Institute (IFPRI) in Addis Ababa, for taking the time to talk to me, and graciously providing data and information that has been invaluable for my dissertation.
I further would like to thank Drs. Vivien Foster, Adriana Aguinaga, and Apurva Sanghi from the World Bank in Washington, D.C. for their willingness to provide data and feedback on my work, as well as Professor Deborah Bräutigam from Johns Hopkins School of Advanced International Studies for taking the time to talk to me about her work on China in Africa. In addition, I would like to extend a very special thank you to Dr. Siwa Msangi from IFPRI for his friendship and professional guidance throughout the years, and to Dr. Ruth Vargas Hill, also from IFPRI, for extensively exploring with me the initial idea of evaluating the impact of infrastructure investments on grain traders in Ethiopia that due to lack of key data we were not to bring to fruition.
I am grateful to my PRGS classmates, especially to my first year study group, for providing the support and energy to get through the qualifying exams, as well as for their precious friendship throughout the years at PRGS, and hopefully beyond. A big thank you to Brooke Stearns Lawson for being a good friend and mentor, and to my friend Nono Ayivi-Guedehossou for her good humor and constant encouragement. I would also like to thank the PRGS administration- Rachel Swanger, Mary Parker, Maggie Clay, Kristina Wallace, Ingred Globig, and Megan Ramirez, for making the path towards the dissertation as smooth as possible; Ira Krinsky for his career advice; Jeffrey Wasserman for being so available and providing guidance

xiv
in crucial moments throughout the dissertation; and Susan Marquis for her overall leadership. A special thank you to Fred Pardee for his support of my ideas, as well as for many stimulating conversations about development and the importance of the advancement of the human condition.
Within the RAND community, I would like to acknowledge my PIs who contributed to my intellectual growth and professional experience, in particular, Soeren Mattke, Greg Treverton, and Laurel Miller. In addition, I would like to thank Tom McNaugher for his advice and inspiring conversations whenever I visited the DC office.
I am eternally grateful to my parents and my siblings for their enduring support throughout
all these years, for inspiring me to pursue the PhD in the first place, and for encouraging me to persevere through the process. I would also like to thank Woinshet Desta, Mellat Desta, and Meti Zegeye for cheering me on. Last but not least, I am deeply indebted and grateful to Lisa Klautzer, who has been by my side from start to finish, both in the good and the bad times, providing incredible support and energy, and greatly enriching the experience the last six years!

xv
Funding
This dissertation was generously supported by two dissertation awards from the Pardee RAND Graduate School: the Anne and James Rothenberg Dissertation Award, and the Frederick S. Pardee Multi-Nation Regional Analysis Dissertation Fellowship. I would also like to acknowledge support through a RAND project funded by the Legatum Institute— the India Entrepreneurship Project led by Krishna Kumar— that got me started on thinking about the role of the private sector participation in infrastructure investments. In addition, I received conference travel support from PRGS conference travel funds as well as from the RAPID Center in L&P that allowed me to present parts of my findings at the International APPAM Conference at the Fundan University in Shanghai, China in May 2013.


xvii
Abbreviations
ADF African Development Fund AFD Agence Française du Développement AfDB African Development Bank
BMZ Bundesministerium für wirtschaftliche Zusammenarbeit und Entwicklung (translates to "Federal Ministry for Economic Cooperation and Development")
CADF China Africa Development Fund CDB China Development Bank
DEG Deutsche Investitions- und Entwicklungsgesellschaft (translates to “German Investment and Development Corporation”)
DFI Development Finance Institutions DRC Democratic Republic of Congo EIB European Investment Bank EXIM Bank Export-Import Bank FDI Foreign Direct Investment FOCAC Forum on China–Africa Cooperation G8 Group of Eight GDP Gross Domestic Product HIPC Highly Indebted Poor Countries IATI International Aid Transparency Initiative
IBRD International Bank for Reconstruction and Development (World Bank)
ICA Infrastructure Consortium for Africa ICB International Competitive Bidding ICT Information Communications Technologies IDA International Development Association (World Bank) IEF Index of Economic Freedom IFC International Finance Corporation (IFC) IFI International Finance Institution JBIC Japan Bank for International Cooperation JICA Japan International Cooperation Agency
KfW KfW Entwicklungsbank (translates to “KfW Development Bank”)

xviii
LAC Latin America and the Caribbean LDC Least Developed Countries LMIC Low and Middle Income Country MDGs Millennium Development Goals MOFCOM Ministry of Commerce of the People’s Republic of China NGO Non-Governmental Organization NTF Nigerian Trust Fund (AfDB) ODA Official Development Assistance OECD Organisation for Economic Co-operation and Development OECD-DAC The OECD Development Assistance Committee OLS Ordinary Least Squares PBC People’s Bank of China PIU Parallel implementation units (PIUs) PPI Private Participation in Infrastructure PPP Public Private Partnership PRC People’s Republic of China PROPARCO Promotion et participation pour la Coopération (translates to
"Investment and Promotions Company for Economic Cooperation")
RMC Regional Member Countries SOE State Owned Enterprise SSA Sub Saharan Africa WDI World Development Indicators WTO World Trade Organization

1
1. Introduction
Motivation and policy relevance
It is widely acknowledged that investments in infrastructure can play a fundamental role in stimulating economic growth particularly in developing countries (e.g., Esfahani and Ramirez 2003; Canning and Pedroni 2008; Aschauer 1989). Indeed, infrastructure serves as an input in the production process and can enable improvements in productivity and efficiency through reductions in time wastage resulting from decreased service interruptions, as well as better communications capabilities, improved access to information and markets, and lower costs of transportation and logistics. Furthermore, by improving access to services such as water &sanitation, electricity, and information communication technologies (ICT) infrastructure can play a role in improving living standards (Straub 2011; World Bank 1994).
By the same token, one of the major impediments to growth in low and middle income countries (LMICs) is the shortfall in infrastructure investments, i.e., the failure to keep up with the investments required to support economic growth and meet social demands for infrastructure. The deficit is particularly acute for Sub-Saharan Africa (SSA)1 where, after decades of neglect, new infrastructure investment needs are now estimated at US$ 22 billion a year over the next ten years (Foster et al. 2009).
While many countries in SSA are unable to finance these investments on their own, the continent has received a significant increase in infrastructure investments, particularly in the hydroelectric, transportation (roads and railways), and telecommunications sectors since the early 2000s. In contrast to historical trends where infrastructure was financed either through bilateral Official Development Assistance (ODA)2 from Western governments (primarily Group
1 Sub-Saharan Africa includes all the countries in Africa located south of the Sahara desert. It therefore excludes the Northern African countries, i.e., Algeria, Djibouti, Egypt, Libya, Morocco and Tunisia 2 In this dissertation, aid is defined according to the widely accepted OECD definition of Official Development Assistance (ODA) (OECD-Development Assistance Committee 2008). According to this definition, the two characteristics of ODA are as follows:
“i. [flows] provided by official agencies, including state and local governments, or by their executive agencies; and
ii. each transaction of which:
a) is administered with the promotion of the economic development and welfare of developing countries as its main objective; and
b) is concessional in character and conveys a grant element of at least 25% (calculated at a rate of discount of 10%).”
An important note to that respect is that, “[i]f the loan satisfies the ODA criteria, then the whole amount is reported as ODA. The grant element itself is not reportable as a flow.”

2
of Eight (G8) countries3) or multilateral concessional loans, a substantial portion of the investments is now coming from non-traditional sources: The private sector and emerging countries, especially China (Foster et al. 2008; UNCTAD 2008; Moyo 2009). However, the determinants of these investments, the terms of engagement underlying the new flows, and associated policy implications are not well-understood.
Thus far, research on the new flows has been unbalanced. In the last five years, the rise of Chinese investments in SSA’s infrastructure has attracted considerable press and scholarly attention in the context of the overall increase of Chinese presence on the continent (e.g., Michel and Beuret 2009; Bräutigam 2009; Rotberg 2008; Cheru and Obi 2010; Polgreen and French 2007; The Economist 2008). The diverse and novel ways investments are being undertaken, the lack of transparency in the dealings between Chinese entities and SSA governments, and the absence of concrete information on the amounts and the mechanisms used has led to a contentious treatment of the topic, especially with regards to whether the increased investments have been beneficial to the continent. The main concerns have hovered around the ideas that Chinese involvement is reminiscent of colonial trading patterns and/or that Chinese financing is propping up illegitimate African governments as China observes ‘non-interventionist’ policies and the funds are usually devoid of the traditional conditionalities imposed by OECD donors/financiers (Davies 2011; Jacobs 2011).
In contrast, the role of private participation in infrastructure (PPI) financing in SSA has not generated as much interest partly because SSA has received much less private investment in infrastructure relative to other developing regions. Nevertheless, at its highest, in 2007, PPI represented as much as 47 percent of the commitments to infrastructure in Africa (ICA 2011).
From the policy perspective, while the rise of funding for infrastructure is welcome, if the resources are not channeled adequately, the risk is that the funds will be invested in a way that would not contribute to economic growth and development, and will therefore be wasted in part or in full. As noted by Mold (2012), the last infrastructure “boom” on the continent in the 1960s and 1970s, enabled by high commodity prices, had just those negative consequences: A lot of the countries built “white elephant” projects— large, expensive, highly visible but non-productive investments that did not necessarily contribute to the long-term growth of the local economy, and ultimately led to unsustainable levels of debt.
Thus, to enable African policymakers to adopt policies that maximize the gains from the new capital inflows in terms of accelerated economic growth and improved social outcomes, it is important to understand the tradeoffs related to these relatively new financing sources. This entails identifying the full costs and benefits both in the short and longer run throughout the whole process of investments in infrastructure, from the planning to the post-construction stages.
3 Forum of governments of the world's eight wealthiest countries including: Canada, France, Germany, Italy, Japan, and Russia (with the European Union also being represented).

3
A better grasp of the underlying issues can also instruct the policies of organizations that have been involved in infrastructure financing in SSA for a longer period of time- i.e., the G8 countries and the multinational institutions (The World Bank, the African Development Bank (AfDB), the European Commission (EC), etc.). Indeed, the emergence of new financiers poses challenges to the financing models that traditional players have developed over four decades of engagement in SSA. Gaining a better understanding of the new sources of funds can highlight the strengths and weaknesses of their approach to infrastructure financing and potentially provide indications on how to address the challenges and opportunities associated with the emergence of new financiers of infrastructure.
General aims and research questions
The overall aim of this research is to better understand the new flows going into infrastructure in SSA in terms of their tradeoffs and associated policy implications. The questions addressed are as follows:
1. What are the new mechanisms used for infrastructure finance in SSA? 2. What accounts for these flows to the region? 3. Are these flows different from what the region has received in the past? If so, how? 4. What are the costs and benefits, both implicit and explicit, in the short and long run? As noted earlier, the issues, as well as the existing knowledge and data around the two types
of new flows— the Chinese funds and the private sector funds– are dissimilar in nature, in that the existing research on Chinese involvement in sub-Saharan Africa is more speculative and lacking of official data, while the amount of the private sector’s involvement is known but its determinants have not been explored in detail. Thus, the research addresses these two issues separately and takes a mixed methods approach, adapting the questions and methods to the types of issues and the type of data available.
As described in the figure below, the first part of the research takes a qualitative approach to systematically compare the Chinese involvement in SSA infrastructure to those of the other large bilateral and multilateral financiers. The goal is to understand the full range of differences between China and the traditional donors, in order to better assess the tradeoffs between the various financing models and ultimately identify the policy implications for both SSA policymakers and traditional financiers of infrastructure on the continent.
The second part of the research quantitatively addresses the questions as they relate to private participation in infrastructure in SSA. Using panel cross-country data from the World Bank’s Private Participation in Infrastructure database as the primary data source, this part explores the extent of PPI in SSA, the characteristics of countries receiving PPI and the factors influencing the amounts of PPI received, and how these differ from what other developing countries are receiving. Additionally, the research explores the structure of PPI contracts on the continent in

4
terms of the level of involvement of the private sector, and whether these contracts are optimal from the public policy perspective.
Organization of dissertation
The next chapter provides the definition of infrastructure used in this dissertation, as well as a brief historical background of infrastructure investments and current needs on the continent. Subsequently, Chapter 3 explores the role of China as a financier of infrastructure on the continent. The next three chapters address the role of the private sector in infrastructure financing. Chapter 4 explores the factors characterizing countries receiving PPI in SSA compared to LMICs, as well as the determinants of the amounts of PPI receipts. Chapter 5 starts to delve into the contracting mechanisms used for PPI in SSA and assesses the determinants of the degree of private sector involvement in terms of the level of risk the private sector assumes and the amount of new capital it commits. Chapter 6 extends this analysis to determine whether PPI contracts are being assigned optimally given the inherent characteristics of each of the infrastructure sectors covered in the analysis. Chapter 7 summarizes the findings of the research and discusses their policy implications. Appendices A through K contain additional overview information, as well as information on data sources and detailed tables and figures of the analyses performed in Chapters 3 through 6.
Emerginginfrastructurefinancingmechanisms
TheroleofChinaasafinancierofSSAinfrastructure
Qualitativeapproach
Constructaholisticframeworktolookat
infrastructureinvestments
Compareacrossmajorbilateralandmultilateral
funders
TheroleoftheprivatesectorasafinancierofSSAinfrastructure
Quantitativeapproach
ComparedeterminantsofPPIinSSAvs.LMICs
Explorethedeterminantsoftheextentandtheoptimallevelofprivateparticipation

5
2. Overview and Background
In this chapter, I first introduce and define the basic concepts used in this dissertation in order to clarify the contours of the analysis. I then provide a historical overview of infrastructure investments in SSA in order to elucidate the context in which the new investments are being made.
Defining infrastructure
While the concept of infrastructure has been discussed extensively in the literature, there is no universally accepted definition. For Hirschman (1958), infrastructure is very broad and includes “all public services from law and order through education and public health to transportation, communications, power and water supply as well as agricultural overhead capital such as irrigation and drainage systems” (p. 83). The World Bank adopts an equally broad definition in its World Development Report centered on infrastructure: “An umbrella term for many activities referred to ‘social overhead capital’”, but also qualifies this definition with the addition that infrastructure “encompass[es] activities that share technical features (such as economies of scale) and economic features (such as spillovers)” (World Bank 1994, p. 2). Others (e.g., Fourie 2006; Baldwin and Dixon 2008) have attempted to distinguish common features of what is considered infrastructure, including the following:
Investments are capital intensive and, once constructed, the facilities have monopolistic features to varying degrees depending on the type of infrastructure as market power generates economies of scale.
Investments are fixed, durable, and irreversible.
Constructed facilities have no substitutes in the short to medium run.
Infrastructure goods are, at least partially, public in nature, and therefore, depending on infrastructure type, have some degree of non-excludability and non-rivalry of use. On the flipside, the construction and operation of facilities can generate negative externalities such as environmental pollution or displacement of populations.
Within this broad set of activities, the literature has further distinguished two types of infrastructure (Fourie 2006; Baldwin and Dixon 2008). Economic infrastructure refers to facilities promoting economic activities that support other factors of productions such as transport, power, telecommunication, and water &sanitation. Social infrastructure refers to facilities promoting social objectives such as schools, libraries, hospitals, museums, and parks. Overlap between the two types is possible, as for some types of infrastructure (e.g., water
6
&sanitation) there is not always a clear cut differentiation between economic and social objectives.
In this dissertation, I define “infrastructure” as “economic infrastructure.” More specifically,
following the priorities of the Program for Infrastructure Development in Africa (PIDA),4 I include the following infrastructure types: Transport (including air, maritime, rail, and road), information and communication technologies (ICTs), power generation and distribution, and water &sanitation. In addition, when referring to infrastructure costs and investments, I include maintenance costs unless otherwise specified.
Historical overview of infrastructure investments in SSA
Between the late 1950s and the 1970s, in the context of post-colonialism and an economic orthodoxy that promulgated capital accumulation as the path to economic growth, SSA governments established infrastructure as a priority sector. Enabled by favorable external conditions resulting from commodity booms, particularly in the 1970s, SSA governments also invested heavily in this priority sector.
This trend was, however, reversed in the 1980s and 1990s with the advent of the debt crisis, the fall of commodity prices, and the pursuant constraints of SSA governments’ abilities to take on additional loans to finance infrastructure investments (Mold 2012; Farooki 2012). At the same time, there was a pervasive belief within the international development community that infrastructure could, under certain market conditions, be financed by the private sector leading governments and development financiers to focus on other sectors of the economy. The conditions in SSA were, however, not conducive to private sector participation due to several factors including low population densities that rendered the cost of providing network infrastructure prohibitive and the lack of technological advances that are necessary for a minimum threshold for profitable production. In addition, many African countries suffered from governance deficits and some from conflict, creating overall an unattractive investment climate for potential private investors (Jerome 2011; Mold 2012; Foster et al. 2008; Yepes, Pierce, and Foster 2008).
As a result, the existing infrastructure stock deteriorated and investments lagged. By the early 2000s, SSA trailed behind much of the developing world in terms of infrastructure endowments (Table 1) and the infrastructure gap—the difference between the infrastructure needs5 and the actual historic investment in infrastructure—grew considerably (Yepes, Pierce, and Foster 2008; Foster and Briceño-Garmendia 2010). This, in turn, constrained economic growth, as poor
4 PIDA is a joint initiative by the African Union (AU), New Partnership for African Development (NEPAD), and the African Development Bank (AfDB). 5 Infrastructure need is defined in terms of infrastructure needed to support economic growth and social demands for infrastructure.

7
infrastructure is a significant deterrent to investment in productive enterprises and impedes on the expansion of domestic and regional trade. For example, firms in the formal sector report loosing up to five percent of sales due to power shortages and regular interruptions to services, while those in the informal sector (which typically do not own generators) report loosing up to 20 percent of sales. Further, the lack of adequate ports, railroads, and roads has meant that freight costs in Africa are 250 percent of the global average and account for 40 percent increase in transport costs for coastal countries and up to 60 percent for landlocked countries (Economic Commission for Africa, African Development Bank, and African Union 2011; Foster and Briceño-Garmendia 2010; Escribano, Guasch, and Pena 2010; Teravaninthorn and Raballand 2008).
Table 1 Infrastructure endowment by developing region
Sub-
Saharan Africa
South Asia East Asia and Pacific
Latin America and the
Caribbean
Middle East and North
Africa
Electrical generating capacity (MW per 1 million people, 2003)
70 154 231 464 496
Water (% of households with access, 2002)
63 72 75 90 85
Sanitation (% of households with access, 2002)
35 48 60 77 77
Density of total road network (km/1,000 arable km2, 2001)
2,558 1,400 5,385 8,850 30,319
Density of fixed-line telephones (subscribers per 1,000 people, 2004)
33 39 90 197 100
Density of mobile telephones (subscribers per 1,000 people, 2004)
101 86 208 350 224
Source: Yepes et al. (2008)
The World Bank estimates that SSA as a whole would need to spend around US$ 93 billion
each year on infrastructure (maintenance and rehabilitation as well as new investment), or 15 percent of GDP, in order to meet the current infrastructure needs—that is to keep up with the new demands created by economic growth and to meet a number of social targets, including those set under the Millennium Development Goals (MDGs). The World Bank estimates suggest that the needs are highest in the power sector, followed by water &sanitation, transportation, and information and communications technologies (ICT), each requiring respectively US$ 41 billion, US$ 22 billion, US$ 18 billion and US$ 9 billion annual investments (Foster and Briceño-Garmendia 2010).6
6 See Foster and Briceño-Garmendia (2010) for assumptions and details of the estimates.

8
While still not reaching these targets, the last decade has seen a gradual redress in the level of infrastructure investments throughout the continent. Effectively, current spending on infrastructure (including maintenance) is in the order of US$ 45.3 billion a year - 66 percent of which is financed through tax revenues and user charges, while 21 percent is financed by the private sector, 8 percent through ODA and the remaining 5.5 percent by non-OECD financiers. Public funds are used mostly for operation and management and only about one third are used for new capital investments. The bulk of new investments and reconstruction is provided by external funds from private participation in infrastructure (PPI) as well as ODA from OECD countries and non-OECD financiers (Foster and Briceño-Garmendia 2010).
Thus, the main sources of growth over the last decade have been two-fold: A rise in the allocation of public funds generated through taxes and user fees, and a marked increase in external sources, including PPI, ODA- particularly after 2005, and elevated investments from emerging economies, chiefly China but also India, Arab states and their associated multilateral organizations (Foster et al. 2008; ICA 2010, 2011).
Focusing on the external sources, several trends are noted. First, the level of ODA committed by OECD countries has risen sharply, mostly as a result of more concerted and coordinated efforts from the donor community with the creation of the Infrastructure Consortium for Africa (ICA) at the 2005 G8 Gleneagles Summit. Second, until the recent economic downturn, PPI in Africa had risen steadily, reaching a high of US$ 17.5 billion in investment commitments in 2007 and, after the downturn of 2008 and 2009 where the levels fell to US$ 11.4 billion, PPI is slowly recovering with US$ 13.8 billion in investment commitments in 2010 (Figure 2, PPIAF 2011; ICA 2010). Third, the role of non-OECD bilateral financiers has grown with their commitment rising from less than US$ 1 billion in 2000 to US$ 13 billion in 2010. Within this category, China’s investment is by far the largest with US$ 9 billion (Figure 2; Foster et al. 2008; Foster et al. 2009; ICA 2011).
Figure 1 Total commitments to African infrastructure from China and the private sector
Note: The figures for China also include North Africa, and are in US$ billion
Sources: ICA (2011) and World Bank (2012)

9
This dissertation centers on the last two trends and attempts to tease out their determinants, the associated tradeoffs, and the policy implications. The next chapter looks at the role of China as a financier of infrastructure in SSA.

10
3. The Role of China as a Financier of SSA Infrastructure
As noted in the introduction, the overall rise of Chinese investments in SSA has attracted considerable attention due to the sheer size of the investments as well as the novel terms of engagement. However, the resulting discussion has been highly contentious and opinionated. This chapter examines the role of China in financing infrastructure – the sector in which Chinese entities have been the most active on the continent— and compares it with other large bilateral and multilateral financiers. The main aim is to provide a framework by which to assess the Chinese investments and consider the tradeoffs associated with these investments as compared to alternatives.
The chapter begins with an overview of the existing literature on China’s role in financing infrastructure in SSA and outlines the ways in which this research contributes to existing knowledge. The methodology and the guiding framework for the analysis are then presented. Subsequently, the main bilateral and multilateral financiers of infrastructure in SSA are identified, followed by a discussion of the range of practices along the infrastructure lifecycle. The chapter concludes with a discussion of the tradeoffs associated with the various mechanisms and the related policy implications.
Previous research
One of the most important challenges for research in this area is that the exact extent of China’s involvement in SSA infrastructure is unknown. The Chinese government does not provide statistics on its activities on the continent, nor do SSA governments indicate to what degree their infrastructure is being funded by Chinese monies. Partly, the problem is that the Chinese government does not have a central entity governing its aid and investment relations – these relations are managed across several state agencies, including the Ministry of Commerce, the Ministry of Foreign Affairs, and the Ministry of Finance, as well as individual Chinese embassies within the respective recipient countries. None of these entities releases consistent longitudinal figures on divestitures in foreign countries. An additional layer of complication is that in the Chinese case it is often difficult to distinguish aid from investments as many of the interventions, particularly those in infrastructure, are a mix of the two: On the one hand, much of China’s aid comes in the form of concessional loans which could be regarded as aid, on the other hand, much of the foreign direct investment (FDI) by private companies are secured by bilateral agreements, making the financial risks on the Chinese companies negligible and therefore substantially different from traditional FDI (Salidjanova 2011; Gernot 2007; Foster et al. 2009; Lum et al. 2009).

11
Thus, while the literature on the increased Chinese presence in SSA is prolific, only a handful of papers have centered specifically on China’s role in financing SSA’s infrastructure, and these have been mostly exploratory. For instance, some papers, including Foster et al. (2008, 2009) and ICA (2011), have attempted to estimate the extent of Chinese aid to SSA’s infrastructure by triangulating information from media sources (primarily Chinese but also some international press articles) and subsequently confirming the information with Chinese sources. Other research has centered on the motivation of Chinese entities to fund infrastructure on the continent: For example, the Center for Chinese Studies at the Stellenbosch University (2007) explores the links between the growth in the Chinese construction sector and its expansion outside of China and the growth of Chinese infrastructure investments in SSA (see Appendix C for more details).
Two papers have compared aspects of China’s involvement with that of traditional partners: Fletcher (2010) compares the Chinese involvement with that of two multilaterals—the European Commission (EC) and the World Bank, while Jacobs (2010) compares it to that of European bilateral partners and the EC. Similarly to Foster et al., both look exclusively at aid flows, Fletcher (2010) in the context of one African country (Mali) and Jacobs (2010) for the continent as a whole. In their findings, both papers highlight the differences in terms of how aid is delivered. In particular, they point to the differences in approach. The West has generally focused on its role as a donor, fostering paternalistic relationships with policymakers in SSA and delivering projects in a top-down fashion. In contrast, China has negotiated agreements in the context of a “partnership” between China and the beneficiary country, emphasizing the idea of mutual benefit and cooperation. The two papers also note that China, different to other partners, has participated in infrastructure ventures on a project-by-project basis; in practice, this approach has limited deliberations over proposed projects and provided for speedier approvals as well as reduced consultations during the implementation phase.
While the two papers are important in terms of understanding some of the basic differences between the diverse types of partners, the comparisons have been ad-hoc and without a systematic framework or clear benchmarks that make explicit on which aspects the different financing models are being compared. In contrast, this dissertation takes a more holistic approach and compares the different financing models using a framework that assesses infrastructure financing in the context of the wider process of infrastructure investments. As such, the range of differences is explored across the “lifecycle” of an infrastructure investment– from the planning stage to the monitoring and upkeep of the facility once it has been built. Similarly, the tradeoffs associated with each of the financing models are compared along this framework.

12
Methodology and data
The methodology adopted is primarily qualitative. To compare Chinese bilateral financiers of infrastructure on the continent with other traditional bilateral and multilateral financiers, a standardized framework for making the comparisons is developed. The framework uses a holistic approach and considers the lifecycle of an infrastructure investment to identify the relevant features and standards. The framework is then used to assess how each financier performs along these established characteristics.
The research relies on publically available data, including literature, newspaper articles, websites, and blogs published between 2007 and 2012. In addition, the analysis is informed by informal conversations with people on the field, mainly in Ethiopia, as well as academics and infrastructure experts in multilateral organizations, in Washington D.C. and in the Ethiopia country office (see full list of sources in Appendix A).
Defining a framework for the analysis
A simplified framework representing the lifecycle of an investment in an infrastructure facility is first developed to identify the relevant factors for assessing financing models. The underlying rational is that the way in which an infrastructure facility is financed and who finances it affects the whole process of an infrastructure investment, starting from the planning stage (i.e., decisions on what and where to invest in, understanding the costs, the externalities, etc.) to the monitoring and upkeep of the facility once it is built.
In effect, the lifecycle of an investment in infrastructure is depicted as a linear process (Figure 3). I identify five stages: (1) planning, (2) financing, (3) procurement, (4) construction, and (5) monitoring and upkeep. The framework also takes into account cross-cutting elements, i.e., those factors that are present in all or several stages of the process, including the level of flexibility in project requirements at each of the stages, the transparency of the process, and the susceptibility to corruption and/or undue influence. Certainly, in reality, the process is not as linear—there are a number of feedback loops between some of the stages, in particular between financing, planning, and procurement. The goal of the framework, however, is to provide a schematic of the main elements of an investment in infrastructure in order to understand the factors needed to assess the intervention and compare alternatives.

13
Figure 2 The lifecycle of an infrastructure investment
Planning: What goes into the planning for an infrastructure facility investment?
The planning of an infrastructure facility investment entails the assessment of investment priorities and the identification of projects that would fit these priorities, followed by the appraisal of these projects.
Priorities are often determined based on multi-stakeholder discussions within countries (or across countries for cross-country infrastructure needs) and are driven by multiple factors. Typically, these factors include demand-side considerations such as infrastructure required to support population needs and economic growth as well as political considerations. The latter includes, for example, the objective of satisfying certain constituencies who would benefit from the new infrastructure facility or the desire to stimulate growth in an economically depressed region/area with investments in infrastructure. In some cases, infrastructure investment priorities can be driven by the pursuit of prestige projects.
Once a public entity has decided on investment priorities, it starts considering specific projects. Due to their inherent riskiness and their long term planning horizons, these have to be appraised a priori (Flyvbjerg 2005). The appraisal process generally consists of estimating direct costs and benefits of building the facility and assessing the potential negative externalities. The latter include social impact analyses to gauge the potential disruptions to human lives of the proposed facility, and environmental assessments to evaluate the potential harm to the environment.
Financing: What types of financing mechanisms does a public entity have at hand?
Various mechanisms for financing infrastructure exist, with funds coming from either public or private sectors, or some combination of the two (OECD 2012; Kigombe 2011; Søreide 2006; Estache 2004; World Bank 1994). Public sources include government tax revenues and foreign aid in the form of grants or concessional loans. A government can also borrow funds at market rate from a bilateral partner, a private bank, and/or a multilateral bank (e.g., the World
Planning Financing Procurement Implementation/ Construction
Monitoring and upkeep
Contractualdesign Transparencyoftheprocess
Susceptibilitytocorruption/undueinfluence

14
Bank or the African Development Bank), as well as combine concessionary financing with debt finance from market sources. Governments can negotiate export credits from bilateral partners’ export credit agencies, which grant loans at somewhat concessional rates to finance specific procurement associated with an infrastructure facility. In addition, resource backed loans— loans tying repayment to national resource or primary commodity exports or preferential access to natural resource exploitation rights are sometimes used to finance infrastructure in some developing countries.
Private funds for infrastructure come mostly from private equity firms that invest in certain industries (e.g., telecommunications, roads, airports) in anticipation of steady returns over the long period of time. However, because most investments in SSA’s infrastructure are considered high-risk, SSA countries have not attracted much of this type of funding, with the exception of telecommunications (Kigombe 2011). Nevertheless, public entities, particularly development finance institutions (DFIs) have been increasingly using innovative mechanisms to leverage public funds to increase private financing for infrastructure in SSA. Indeed, both bilateral (e.g., the German investment corporation and France’s PROPARCO) and multilateral (the International Finance Corporation) DFIs have, for example, set up investment funds managed by private companies to invest in funds targeted towards African infrastructure projects. These funds then provide capital directly to private investors (in the form of equity or loan)7 for specific infrastructure projects. In addition, DFIs provide a range of risk management products such as guarantees to private firms interested in investing in African infrastructure.
Other sources of finance include sovereign wealth funds which are government owned and funded through foreign currency reserves (Schubert 2011) and quid pro-quo arrangements, whereby a government negotiates the building of an infrastructure facility with a private firm in exchange for the firm being able to operate in the country.
Procurement: How does a public entity chose a builder for the facility?
There are essentially two ways by which a public entity chooses the contractor to build an infrastructure facility: Most commonly the selection happens through a tender process, but sometimes also by responding to unsolicited proposals (Hodges 2003; Søreide 2006).
In principle, tenders introduce competition among potential contractors to guarantee the optimal combination of price and quality as well as on-time delivery (i.e., “best quality, lowest cost and timely delivery” [Hertogh et al. 2008, p.113]). In order to ensure that the process is truly competitive, tender rules and procedures are often very elaborate. However, in practice, the procedures often leave room for undue influence in the tendering process through for example marketing activities to influence decision makers, and, in some cases, even promote illegal practices (e.g., weak sanctions against firms bribing public officials to win contracts). The type
7 DFIs can also allocate the funds through intermediary financial institutions that offer the funding to private investors.

15
of funding that the public entity secures to build the infrastructure facility can also impose restrictions on the tendering process; for example, donor funds are sometimes “tied,”8 i.e., restricted to firms from the donor’s countries (Søreide 2006).
For unsolicited proposals, the basic premise is that allowing such proposals would promote innovative ideas from the private sector (Hodges 2003). Some countries do not allow unsolicited proposals, as it is perceived as a way for a private firm to bypass the competitive tender process and/or a way to argue for exclusive negotiations under the rational that the firm owns the intellectual property of the idea. Those countries that do allow unsolicited proposals generally do not have formal policies or procedures for handling these proposals (Hodges 2003). Thus, given that the use of unsolicited proposals is very country and context specific, the discussion on procurement will focus mostly on the tender process.
Construction: What are the common issues that can arise during construction?
Once the project has been decided on, the contractor selected, and all the approvals and consents fulfilled, the contractor can begin the construction of the facility. From the policymaker’s perspective, a number of issues are pertinent during this phase.
The first relates to the extent to which contractors use locally available materials and labor (“local content”). This is important as increasing local content in infrastructure projects can stimulate the local economy through employment, increased demand for construction materials and equipment produced domestically, and the associated multiplier effects. Furthermore, using local labor can facilitate skill-transfer which, in-turn, enhances the ability to operate and maintain the facility locally. However, in practice, similar to procurement, the source of funding sometimes dictates who the suppliers should be (i.e., often nationals of the financier country) and thus constrains the ability of the public entity to use the investment in infrastructure to stimulate economic growth (Shwartz et al. 2009; OECD undated; Wells and Hawkins 2008).
The second consideration is cost growth and the length of construction. Infrastructure projects, especially the larger and more complex ones, are commonly associated with significant delays and cost overruns (Flyvbjerg et al. 2002 and 2004; Iimi 2009). Delays are due to a number of factors including natural factors during construction (e.g., floods, unforeseen geological complications at the site of construction), bureaucratic delays (e.g., land acquisition), adjustments to terms of reference post award of the contract, disbursement issues, and any conflict between contractor and public entity. Cost overruns are partly due to overly optimistic engineering cost estimates as well as delays encountered during construction. For the latter, post-award adjustment in particular can impose adaptation costs to contractors. In addition, delays are associated with increased material costs, especially in developing countries where exchange rate
8 The formal definition of tied aid is as follows: “official or officially supported Loans, credits or Associated Financing packages where procurement of the goods or services involved is limited to the donor country or to a group of countries which does not include substantially all developing countries” (OECD 2003, webpage).

16
fluctuations are common and a depreciation of the local currency over time entails an increase in the price of imported materials. The public entity may be able to minimize some of the delays and cost overruns a priori by reducing the possibility of post-award modifications to the terms of reference and by introducing risk-sharing mechanisms and cost incentives within the contracts.
For donor funded projects, delays can be triggered by disbursement issues. Typically, financiers release funds in chunks based on successful completion of interim checks, including financial and technical audits which aim to ensure that the funds are being expended for their intended purpose as well as goods being delivered in the quantity and quality specified (Paterson and Chaudhuri 2007). If projects do not perform adequately in these audits, further disbursement of funds may be delayed, which may in turn affect costs of the project negatively.
Monitoring and upkeep: What comes after construction?
Once the infrastructure project has been delivered, the financing agency in conjunction with the implementing agency undertakes ex-post cost-benefit evaluation (measuring outputs, outcomes, and impacts), as well as post-procurement oversight. If the facility was paid for through a loan, the public entity has to start repaying the loan (typically there is a grace period) and is required to put forward a plan for the operation of the facility as well as a strategy for long-term upkeep and maintenance of the facility.
Cross-cutting issues: Contractual design, transparency and corruption
Generally, infrastructure procurement contracts are not completely binding at the onset (Iimi 2009). This is because projects, especially the larger and more complex ones, often need to be adjusted as complications arise. However, there is also a fair amount of political discretion in decision-making, especially in the planning and procurement stages (Paterson and Chaudhuri 2007). In combination with the monopolistic nature of most infrastructure sectors, these factors foster an environment prone to corruption. Effectively, construction is one of the most corrupt sectors in the world (Kenny 2011), and “favoritism, fraud, cronyism, patronage, embezzlement, bribes, and state capture are all concepts that have long been associated with the delivery of infrastructure services in many countries” (Estache 2004, p. 21).
Nevertheless there are often “large grey zones between legal and illegal business practices” when it comes to infrastructure (Søreide 2006, p.5), so corruption is not always easily detectible. For instance, in the planning stage, there is commonly deliberate overestimation of benefits and underestimation of costs to facilitate the authorization of the project (Flyvbjerg 2002); in the procurement phase, potential bidders may try to influence tender documents, there may be collusion among bidders to manipulate the procurement process, or even outright rigging of the process (Paterson and Chaudhuri 2007); at the implementation stage, the introduction of modifications and amendments can introduce scope for corruption, especially in the context where there is political discretion in decision making (Iimi 2009).

17
Research has shown that corruption or undue influence is most prominent in large scale procurement, where procedures and processes are unclear, or in the context of low institutional capacity, low accountability, and weak governance in public procurement systems (Flyvbjerg 2004).
Transparent practices throughout the lifecycle of the infrastructure investment can, to some extent, reduce the scope for corruption. Indeed, the more transparent the process is, the less room there is for irregular practices and the more accountable policymakers involved in the negotiation processes will be. In effect, transparent practices entail laying out clear objectives and priorities at the planning stage, clear eligibility criteria as well as rules and regulations at the procurement stage, and mechanisms to allow for transparent negotiations with contractors in the implementation stage. For the latter, the funder could for example mandate third party monitoring, i.e., the oversight of a third entity responsible for the monitoring of procurement and implementation of the project (Paterson and Chaudhuri 2007).
Summary: Benchmark questions to compare alternatives
Following the framework outlined above, I have identified the most pertinent questions within each of the infrastructure lifecycle stages to distinguish the characteristics of infrastructure projects financed through different entities and mechanisms. Table 2 below summarizes these questions which ultimately allow for the description and comparison of alternative forms of financing.

18
Table 2 Relevant questions for the comparison among financiers
Infrastructure lifecycle stage Relevant questions
Planning • How are investment priorities set? • How are projects assessed? • To what extent are social and environmental externalities considered?
Financing
• What are the sources of financing? • What are the financial terms attached to the sources of financing (e.g., repayment
terms)? • To what extent is coordination needed among the different sources of finance?
Procurement • What are the rules and regulations attached to tender processes? • What types of restrictions do these rules impose (e.g., nationality of bidders, tied
aid)?
Construction
• What is the level of local content in the construction phase? • Are there any contingencies to minimize delays and cost overruns? • What types of interim-checks do projects have to undergo (e.g., financial, technical
audits)?
Monitoring & upkeep
• What do the ex-post evaluations and post-procurement oversights look at? • How much burden does the repayment of the investment impose? • What is the long-term strategy for upkeep of the facility?
Contractual design, transparency & corruption
• How flexible are contracts? • What is the level of political discretion in decision-making? • How clear and transparent are the rules and regulations around procurement? • How transparent are the negotiations with contractors? • What types of monitoring tools are in place?
Identifying the main foreign financiers of SSA’s infrastructure
In order to make the analysis more tractable, the comparison groups are limited to the five largest financiers of infrastructure in 2010. As shown in Figure 4 below, China is the largest with US$ 9 billion, closely followed by the World Bank with US$ 8.8 billion. The other large multinational funder is the African Development Bank (AfDB), while the most prominent bilateral financiers are Japan, France, and Germany.

19
Figure 3 Commitments to African* infrastructure in 2010 (in millions of US$)
*Includes North Africa Source: ICA (2011)
Chinese actors
A number of governmental organizations are involved in providing funds for infrastructure in SSA (Table 3). The central actor is the Export-Import Bank of China (China EXIM Bank), one of China’s three policy banks9 whose aim is “to facilitate the export and import of Chinese mechanical and electronic products, complete sets of equipment as well as new and high-tech products, assist Chinese companies with comparative advantages in their offshore contract projects and outbound investment, and promote Sino-foreign relationship and international economic and trade cooperation” (China EXIM Bank 2012, webpage). Effectively, the main objective of the China EXIM Bank is to promote Chinese enterprise and exports, while at the same time advancing more social objectives in recipients’ countries by funding projects with “good social benefit.” China EXIM Bank administers several instruments for engagement in SSA’s infrastructure (see Appendix B, Table 1) including concessional loans, preferential export buyer’s credit, export seller’s credit, and resource backed loans, in addition to “package financing mode,” which mixes several of these instruments. Each of these instruments has different objectives and in some cases different types of recipients.
The China Development Bank (CDB), the second of China’s three policy banks, is also active in financing infrastructure projects in SSA. While its mission is primarily domestic, i.e., to “provide medium- to long-term loan facilities that assist in the development of a robust economy and a healthy prosperous community” (China Development Bank 2005, webpage), as of 2007 it
9 The three policy banks- the Agricultural Development Bank of China, the China Development Bank, and the Export-Import Bank of China were created in 1994; all the three are responsible for financing government expenditures for economic and trade development in different areas: The first one agricultural projects in rural areas, the second infrastructure projects, and the last one trade facilitation projects.
0
1
2
3
4
5
6
7
8
9
10
Germany France Japan AfDB WorldBank China

20
also manages the China-Africa Development Fund, the largest Chinese equity fund focusing on investments on the continent (ICA 2010; China-Africa Development Fund 2012).
The Ministry of Commerce (MOFCOM) is the main entity in charge of implementing Chinese development assistance through its Department of Aid to Foreign Countries. In that capacity, it administers most of the soft loans and grants targeting infrastructure in SSA. However, a number of other ministries, including the ministries of foreign affairs, agriculture, health, science and technology, have international cooperation departments and may at some level fund development projects, including infrastructure projects with grants (Grimm et al. 2011).
Table 3 Chinese financiers of SSA infrastructure
Institution Description Export-Import Bank of China (EXIM Bank)
Established in 1994, as a government policy bank under the direct leadership of the State Council of China aims to implement the state policies in industry, foreign trade, diplomacy, economy and finance
Sole institution authorized by the Chinese government to provide concessional loans
Almost 80 percent of the projects financed by the Bank have been infrastructure projects
Currently supporting around 300 infrastructure projects (79 percent infrastructure) in Africa
China Development Bank (CDB)
Largest amongst China’s three policy banks- operates mainly in China but is playing a growing role in Africa
Lends on commercial terms In 2007 designated to manage the $ 5bn China-Africa Development Fund
Government ministries Ministry of Commerce of the People’s Republic of China (MOFCOM) is the “lead” entity charged with managing foreign aid
Other ministries; foreign affairs, health, science and technology, etc. also have departments for development cooperation
All engage in some form in financing development projects (incl. infrastructure) through grants and soft loans
Source: Compiled by author using ICA 2010, 2007; Bräutigam 2010; Grimm et al. 2011.
Traditional financiers of SSA infrastructure
The traditional financiers of infrastructure in SSA, summarized in Table 4, are bilateral aid agencies and multilateral governmental organizations. Each of these institutions has a similar structure with a public sector arm that provides grants and loans (concessional and market rate) to developing country governments, and a private sector arm that invests equity and/or lends to companies and projects. The bilateral institutions are integrated within their respective country’s foreign affairs ministries and are tasked with implementing their country’s ODA. Further, with

21
the exception of France,10 they have a separate group dedicated to promoting their own country’s exports and foreign investments in developing countries.
Typically, the missions of both the bilaterals and multilaterals revolve around poverty reduction, economic growth, and private sector development. The lending instruments utilized reflect these missions (see Appendix B, Table 2 for more details on financing instruments). Indeed, the public sector focused arms of these institutions generally adjust their terms on the basis of the income level of the recipient country— most have a financing window that provides funds either as grants or loans at concessional rates for the poorest and/or most indebted countries, and market rate or near market rate loans for the higher income countries. Further, the private sector windows focus on making financial resources and instruments available to private firms and projects either directly or through intermediaries such as banks and equity funds.
Similar to China, the bilaterals often also include the desire to provide their own companies with opportunities abroad in their missions, and provide instruments such as export credits and guarantees specifically designed for that purpose in their offerings.
Table 4 Traditional financiers of SSA infrastructure
Partner Responsible agency Description
World Bank
International Bank for Reconstruction and Development (IBRD)
The original lending arm of the World Bank Group. "Aims to reduce poverty in middle-income countries and creditworthy
poorer countries by promoting sustainable development through loans, guarantees, risk management products, and analytical and advisory services" (World Bank 2013a, webpage)
Raises funds from international financial markets. Provides non-concessional loans to middle-income and poor credit
worthy countries.
International Development Association (IDA)
"Aims to reduce poverty by providing loans and grants for programs that boost economic growth, reduce inequalities, and improve people's living conditions." (World Bank 2013b, webpage).
Raises funds through member countries/donor contributions, as well as income generated from IBRD and IFC activities, and borrower's repayments of earlier IDA loans.
Provides concessional loans and grants to low-income countries and countries “at risk of debt distress”.
International Finance Corporation (IFC)
Aims “to create opportunity for people to escape poverty and improve their lives by: (1) Mobilizing other sources of finance for private enterprise development; (2) Promoting open and competitive markets in developing countries; (3) Supporting companies and other private sector partners where there is a gap; (4) Helping generate productive jobs and deliver essential services to the poor and the vulnerable” (IFC 2013, webpage).
Provides loans and equity investments to commercial projects.
10 France’s equivalent organization, Compagnie Française d'Assurance pour le Commerce Extérieur (COFACE), was privatized in 1994. It now operates as a private commercial company.

22
Partner Responsible agency Description
AfDB
African Development Bank
Aims “to promote the investment of public and private capital in projects and programs that are likely to contribute to economic and social development” (AfDB 2011).
Raises funds from capital markets, as well as from income generated from the AfDB lending activities.
Provides non-concessional loans to African governments.
African Development Fund (ADF)
“Main objective is to reduce poverty in Regional Member Countries (RMCs) by providing loans and grants” (AfDB 2013a, webpage).
Raises funds through member countries/donor contributions. Provides zero-interest loans to African governments.
Nigeria Trust Fund (NTF)
Aims “to assist the development efforts of the Bank's low-income regional member countries whose economic and social conditions and prospects require concessional financing” (AfDB 2013b, webpage).
Funding is provided by the Nigerian government. Provides concessional loans (interest rates between 2 and 4%) to
both private and public sector operations and can also co-finance operations with the ADB and the ADF,as fund stand-alone operations, in both the public and the private sector.
Private Sector Window
Responsible for “making the Bank responsive to the private sector’s needs and extend appropriate technical and financial support, within the general framework of assisting RMCs shifting from State-controlled economies to Private-led economies” (AfDB 2013c, webpage).
Provides financing to corporate entities and projects either directly or through intermediaries such as private equity and venture capital funds.
Japan11
Japan International Cooperation Agency (JICA)
Main government agency coordinating Japanese ODA Aims to "to contribute to the peace and development of the
international community, and thereby to help ensure Japan's own security and prosperity” (Ministry of Foreign Affairs (Japan) 2003, p1).
Provides grant aid and concessional loans to low-income country governments.
Japan Bank for International Cooperation (JBIC)
Government owned policy-based financial institution administered by the Ministry of Finance. Akin to an export-import bank.
Aims to (1) promote overseas development of strategically important natural resources to Japan; (2) support Japanese industry efforts to develop international business operations; (3) prevent financial disorder in the international economy; (4) maintain and improve the international competitiveness of Japanese industries; and (5) promote projects for conserving global environment.
Provides buyer’s credit (market rate loans) to foreign buyers and financial institutions, as well as loans to Japanese joint ventures, foreign governments, or banks. The latter requires substantial benefit for Japanese companies and that project “preserve the global environment” (JBIC 2012, webpage).
11 The Japanese Ministry of Foreign Affairs also provides grants for economic and social development projects to Japanese non-governmental organizations (NGOs) operating in developing countries. These funds support small scale projects, including in the infrastructure, e.g., small scale water and sanitation projects (Ministry of Foreign Affairs (Japan) 2007).

23
Partner Responsible agency Description
France
Agence Française du Développement (AFD)
Main government agency coordinating France’s ODA. ODA aims to “(1) contribute to shared and sustainable growth; (2)
fight against poverty and reduce inequality; (3) preserve global public goods; (4) promote stability and the rule of law as factors of development” (Ministry of Foreign and European Affairs (France) 2011, p. 13).
Provides grants and concessional loans to African governments and for “high impact projects (…) that do not generate sufficient profit over the short or medium term to pay back market-rate loans” (AFD 2012, webpage).
Promotion et participation pour la Coopération (Proparco)
Subsidiary of AFD in addition to private shareholders from “the North and South".
Aims to “be a catalyst for private investment in developing countries which targets growth, sustainable development and reaching the Millennium Development Goals (MDGs)" (Proparco 2012, webpage).
Provides private companies with loans and equity finance.
Germany
KfW Entwicklungsbank (KfW)
Government owned development bank- It implements Germany's ODA on behalf of the Bundesministerium für wirtschaftliche Zusammenarbeit und Entwicklung (BMZ), the Federal Ministry for Economic Cooperation and Development
ODA aims to help “(1) ensure that scarce resources are more equitably shared and that our environment is preserved for coming generations, and (2) reduce global poverty” (BMZ 2012, webpage)
Provides grants and concessional loans (at zero interest) to Least Developed Country (LDC) governments, market and near-market rate loans to middle and high income developing country governments.
Bundesministerium für wirtschaftliche Zusammenarbeit und Entwicklung (BMZ)
Federal Ministry for Economic Cooperation and Development As an instrument for foreign trade promotion, a separate arm of the
BMZ provides export credits (called Hermes guarantees) to German exporters and banks to cover risks of non-payment.
Deutsche Investitions- und Entwicklungsgesellschaft (DEG)
German Investment and Development Corporation; subsidiary of the KfW
Aim is “to promote private enterprise initiative in developing and transition countries as a contribution to sustainable growth and a lasting improvement in the living conditions of the local population” (KfW 2013, webpage)
Provides German and European firms with market rate financing to invest in developing country projects
Source: Compiled using World Bank 2013a,b; IFC 2013, AfDB undated, 2013a,b,c, 2011; Ministry of Foreign Affairs (Japan) 2003, 2007; JBIC 2012; Ministry of Foreign and European Affairs (France) 2011; AFD 2012; Proparco 2012; BMZ 2012, and KfW 2013.

24
Identifying the range of practices along the infrastructure investment lifecycle
Planning
In planning, variation among practices of financiers relates to how early in the process and how much the financier gets involved in the determination of investment priorities and in the appraisal of potential projects. In theory, all financiers support “country-led approaches” to infrastructure development and therefore consider projects that are planned by recipient country governments. However, in practice, financiers get involved in the planning process at varying degrees, especially in the case of large projects because most of the countries in SSA lack the technical and governance capacity to determine demand and priorities for specific infrastructure facilities, as well as to conduct project appraisals and risk assessments.
Traditional financiers have a high level of involvement from the very beginning. In order to increase “country ownership” of proposed projects,12 they require the recipient country to devise a growth and development strategy as well as a multi-year budget plan through a consultative framework with relevant in-country stakeholders, within which proposed infrastructure projects have to fit. However, “ownership” of the proposed project may be diminished in practice, as a number of issues can dilute the level of control the recipient government has. For one, due to the lack of capacity, the financiers often end up playing an important role early in this process by providing technical assistance and capacity building, and in some cases, assist countries in conducting feasibility studies for proposed projects. This is especially the case for the larger and more complex projects (de Renzio et al. 2008; Garnett et al. 2009; OECD 2006). Second, traditional financiers generally cooperate to fund large projects and, despite recent efforts to harmonize their policies and coordinate their activities on the ground,13 redundant policies and sometimes discordance between their different requirements imposed by the individual funders can be a challenge for recipient countries. In addition, the program that is agreed upon by the co-financiers may only be a second best option for the recipient government (Garnett et al. 2009). Third, many of the traditional financiers impose value-based as well as economic conditionalities 12 The 2005 Paris Declaration, which was negotiated under the auspices of the OECD Development Assistance Committee (DAC), outlines the “five core principles” for effective development assistance (OECD undated, webpage)
“1. Ownership: Developing countries set their own strategies for poverty reduction, improve their institutions and tackle corruption. 2. Alignment: Donor countries align behind these objectives and use local systems. 3. Harmonisation: Donor countries coordinate, simplify procedures and share information to avoid duplication. 4. Results: Developing countries and donors shift focus to development results and results get measured. 5. Mutual accountability: Donors and partners are accountable for development results.”
13 Following up on the 2005 Paris Declaration on Aid Effectiveness, traditional donors have been moving towards harmonization of their activities. The 2008 Accra Agenda devised an agreement to “deepen implementation of the Paris Declaration”. The 2011 Busan Agreements attempted to take stock of the progress achieved.

25
around certain issues such as human rights, military expenditures, democratization efforts, and fiscal reform, in order to fund any project in developing countries, which may further dilute ownership of the project if those conditionalities are not in line with government policies (de Renzio et al. 2008).
In contrast, China negotiates project involvement on a case by case basis, and imposes few conditionalities except for the recognition of “One China Policy” and adherence to the “One China Principle”14 (CIDA et al. March 27-28, 2008; Fletcher 2010). Chinese entities frame these negotiations in the context of a “partnership” between China and the beneficiary country, and the idea of mutual benefit and cooperation. Nevertheless, the type of financing instrument considered to finance a proposed project determines to some extent the requirements for funding. For example, on the one hand, loans are allocated to projects with the potential of economic returns in the medium to long run; therefore, to qualify for funding, governments have to show that the projects have the “ability to generate profit.” In addition, the proposed projects undergo a review process, which include risk analyses in order to determine the overall risks involved. On the other hand, grant funding is usually provided for turnkey projects,15entirely managed by the financier; i.e., the Chinese government contracts with a Chinese company (through competitive bidding) to lead the process of building an infrastructure project— from planning all the way through construction and delivery of the facility (Grimm et al. 2011; Jacobs 2011; Corkin, Burke, and Davies 2008).
All financiers require some form of social and environment assessments in order to approve the project. The level of stringency of these assessments varies however. Traditional financiers have a relatively arduous process which can be costly, time consuming, and bureaucratic. Typically, the bilaterals (France, Germany, and Japan) conduct the environmental and social assessments and devise a “risk mitigation plan” with the beneficiary government (AFD 2012; KfW 2013). The multilaterals provide budgetary support to the beneficiary governments to conduct these assessments, but generally these funds tend to be small, increasing the cost for the beneficiary (EIC 2012).
Chinese financiers’ requirements with respect to social and environmental assessments are perceived to be more lax, as their social and environmental standards, which follow their own domestic standards, are far lower than those imposed by traditional donors (Woods 2008).
14 The one-China Policy is the view that there is only one state called China and requires by default that the
recognition of either the People’s Republic of China or The Republic of China (i.e., Taiwan) as “sole legal government” of China. This is separate from the one-China principle, which sees Taiwan as a province of China (Chiang 2004). 15 A turnkey project is one where the builder takes charge of the entire process- from the design to the construction of the facility- and turns it over to the procurer when the facility is ready for operation.
26
Financing
Funders of infrastructure in SSA use a variety of instruments- similar across funders- to finance specific projects. Indeed, all financiers use grants, concessional loans, market-rate loans, and some form of equity financing. Germany, Japan, and China also negotiate export credits with beneficiary countries to promote their own exports there. Furthermore, in all cases, equity financing—administered through DFIs for traditional financiers and through the China-Africa Development Fund (CADF) for China— has not yet made substantial headway in providing funds for infrastructure in SSA (Kigombe et al. 2011): The traditional partners DFIs have mostly made loans available to private sector firms, while the CADF, an equity fund capped at US$ 5bn which can invest in “stocks, convertible bonds, and other quasi-equity types of investments,” has invested an initial US$ 1bn in approximately 30 projects but mostly concentrated in the natural resource sector (Yan 2010; Massa 2011).
In terms of differences across financiers, first, the level of concessionality of subsidized loans varies widely. Some have very low interest rates (close to zero percent) as in the case of the World Bank’s IDA loans, the AfDB’s zero-interest loans, and the KfW’s subsidized loans. Other loans, such as the JICA’s ODA loans and AFD’s soft loans, with interest rates between zero and 1.7 percent, are negotiated with the recipient government based upon the nature of the project, while those provided by the China EXIM Bank are only mildly below market rate (in the order of 1.5 to 2 percent). The repayment periods for concessional loans can also vary: Typically, traditional financiers allow for long repayment periods, ranging from 15 to 50 years, with grace periods of 5 to 20 years, while those of China are relatively short with repayment periods between 15 and 20 years and grace period of 5 years (Appendix B, Tables 1 and 2).
Second, China uses one distinct loan type: The resource backed loan. The main goal of this instrument is to secure natural resources for China, while providing loans with competitive interest-rates to countries that would otherwise not be able to obtain such loans. In essence, the EXIM Bank negotiates an agreement with the recipient country whereby it lends the country funds for building an infrastructure facility and the country repays the loan through natural resource exports or by providing preferential access to natural resource exploitation rights. In these agreements, the China EXIM Bank retains all disbursements and control of the project, i.e., it chooses and contracts directly with the firms that are awarded the contract to build the infrastructure facility. Amongst the prominent deals of this type is the 2004 agreement signed with Angola for over US$ 1bn worth of infrastructure construction and rehabilitation in exchange for oil exports. Another such deal was signed with the Democratic Republic of Congo (DRC) in 2008 for US$ 6bn worth of infrastructural works in exchange for copper and cobalt exploitation rights (Massa 2011; Jacobs 2011). While most of the commodities in these agreements have been oil and minerals (e.g., copper, bauxite, iron, chromium), over time, China has diversified into other commodities, including cacao (2007 agreement with Ghana) as well as
27
sesame seeds and goat skins (2011 agreement with Ethiopia) (Bräutigam 2011; Shinn and Brown 2012; Foster et al. 2009).
A third and important difference in the financing practices has to do with how the financing for a specific project is arranged. Traditional financiers tend to co-finance projects; in particular, the European bilateral agencies (AFD and KfW) along with their DFIs (Proparco and DEG) coordinate their investments with each other and those of the World Bank and the IFC. As noted above, this can be challenging to manage for recipient governments as the various institutions tend to have different requirements to approve financing (Garnett et al. 2009). China, in contrast, does little co-financing with other partners, but often mixes a number of instruments to fund a specific project.
Procurement
Two issues arise with the procurement process; who is responsible for managing the procurement process and therefore the bidding process, and second, who is allowed to participate in the bidding. In recent years, recognizing that to improve aid effectiveness, donor countries had to reform some of their practices, traditional donors pledged to undertake several changes under two OECD sponsored agreements - the 2005 Paris Declaration on Aid Effectiveness and the 2008 Accra Agenda, including using local institutions and procedures for procurement as well as untying aid. China has not signed onto either of the agreements and uses its own procurement system when funding projects (contracting directly with the construction firms) as well as ties much of its financing to the use of Chinese contractors and materials. Indeed, one requirement for project financed through concessional loans is that a Chinese company must be awarded the construction and in addition, at least 50 percent of the equipment and materials needed must be procured in China (Jacobs 2011; Corkin et al. 2008).
In the past, traditional financiers were intricately involved in the procurement process and used their own procurement systems - parallel implementation units (PIUs) - to deliver their aid and financing. Under the Paris Declaration and the Accra Agenda donors committed to using beneficiary procurement systems and to better align their policies and practices to beneficiaries systems as the first step while developing countries agreed to strengthen their procurement systems (Ellmers 2011; OECD undated).The implementation of this has however been slow, especially with larger projects, partly because beneficiaries’ systems do not have the capacity to conduct bidding processes (particularly those that require International Competitive Bidding (ICB)). But even in cases where country systems could conduct such processes, traditional donors are sometimes reluctant to use these countries’ systems because of the high level of corruption within these governments as well as the lack of transparency (Garnett et al. 2009; Ellmers 2011). Indeed, in conducting a series of case studies on donor financed infrastructure in several developing countries, Garnett et al. (2009) found that in most cases beneficiary countries’ procurement systems were not being used as these did not have the capacity or the accountability systems to conduct the process. The authors also found that “donors were less likely to align with

28
government procurement systems for large-scale infrastructure projects” and that “alignment is less likely where large scale procurement involving International Competitive Bidding (ICB) is required” (p. iii).
Furthermore, multilateral financing requires ICB and, most of the time, the tenders are evaluated primarily on the lowest price, as well as the capability and resources of the bidder (EIC 2012; Wells and Hawkins 2008).
As for the untying of aid, many of the traditional bilateral financiers have made substantial progress: The AFD’s ODA is now completely untied, as is 95 percent of JICA’s ODA. Nevertheless, the KfW still ties about 50 percent of its aid, and most of the technical assistance provided by many of the bilaterals (including China) is tied. On the latter, one important difference between China and the other bilaterals is that the traditional donors are perceived to be using expatriate staff with very high salaries compared to the local standards, while those funded by China pay their engineers according to local pay scales (Corkin, Burke, and Davies 2008; Fletcher 2010).
Construction
In construction, variation among financiers comes from the way control is exercised over the process, the level of risk taken by the financier (and by the same token, the beneficiary), and the incidence of delays and cost overruns. There is however little variation with respect to the extent of “local content” in the construction in that many of the projects in SSA use mostly imported (as opposed to locally available) materials and skilled labor. The only link to the local economy in most case is the use of unskilled labor, which is also not always guaranteed – particularly with Chinese-funded projects (Michel and Beuret 2009). Indeed, as noted earlier, the level of “local content” is associated with the beneficiary government’s laws and regulations but also the requirements imposed by the financiers. The World Bank for example prohibits any mandatory requirements that an international contractor enter into a joint venture with a local contractor to undertake construction, as well as any restrictions related to local use of skilled labor and materials; China requires the use of Chinese contractors and that at least 50 percent of the equipment and materials be imported from China (Wells and Hawkins 2008; Jacobs 2011; Corkin, et al. 2008).
In terms of how financiers control the process, traditional financiers have done so with the use of performance monitoring systems, imposing a number of reporting requirements and delaying disbursements if these are not met. The World Bank for example imposes performance benchmarks for each of the projects and withholds disbursements if these are not met. Similarly, ADF monitors compliance with the contract as well as with the risk mitigation action plan during construction. For the beneficiary countries, extensive monitoring requirements can add significant transaction costs, as their implementing agencies have to be equipped to undertake some of this monitoring, or at the very least, coordinate donor monitoring. Furthermore, the requirements add volatility and uncertainty to the process: In his study of donor financed
29
infrastructure in Mali, Fletcher (2011) found that “the irregularity of disbursements is just one of a number of risks faced by recipient governments when implementing aid-funded infrastructure projects” (p. 11). Chinese funds function very differently; they come with streamlined requirements and the contracts are often very flexible; renegotiations and adjustments of the contractual terms are not unusual, even once the construction has begun (Fletcher 2010; Jacobs 2011). Furthermore, the responsible agency (e.g., EXIM Bank) often contracts directly with the construction firms and can therefore negotiate incentive-based contracts with the firms themselves, addressing some of the potential delays (Jacobs 2011).
In terms of who bears the risks in the construction phase, in the Chinese case, the contracts themselves do not stipulate clearly who bears the risk in terms of price fluctuations and unforeseen events, but at least in the case of Mali, as Fletcher (2010) found, the Chinese authorities would meet with the recipient government and discuss how to jointly deal with the risk once it has happened. This introduces some unknown level of risk—-particularly in the long run— for the recipient government, as the Chinese counterparts may explicitly or implicitly ask for higher repayment or preferential treatment on other issues in the future. In contrast, traditional funders include clauses within the initial contract negotiated with the beneficiary government. In general the latter bears much of the cost of delays including currency and price shocks (e.g., oil prices)—the full cost with the multilaterals and the majority of it (80 to 90 percent) with the bilateral funders (Fletcher 2010).
In case of dispute between the contractor and beneficiary government, the World Bank requires that this be settled in international commercial arbitration in order to guarantee a neutral setting. While this is in theory the fairest way to resolve dispute, in practice it can also lead to delay of the project as arbitrators have to be appointed. Real-time dispute settlement options are not readily available, as beneficiary governments would have to set them up, and often, the funds for that area do not exist (EIC 2012).
For the incidence of delays and cost overruns, projects financed by traditional financiers are more prone to delays. For one, they are more likely to incur delays very early on at the planning stage as a result of the stringent and bureaucratic processes for environmental approvals, particularly acute for hydropower. Furthermore, during construction, there is some uncertainty and legal insecurity around the fact that the environmental rules agreed upon in the planning phase are being adhered to (EIC 2012). Secondly, as mentioned earlier, larger projects tend to be funded by multiple traditional financiers, and harmonizing and coordinating their many requirements may be challenging, time consuming, and costly. As noted by Woods, “the result is that scarce personnel and other resources in poor countries are used up in maintaining and strengthening external relations with donors and undertaking externally demanded actions, many of which are contradictory” ( p.1219).

30
Monitoring and upkeep
In general, the focus of traditional financiers has also been demonstrating the value of the project at hand through ex-ante and ex-post cost benefit evaluations, while that of China has been the delivery of projects (CIDA et al. March 27-28, 2008; Fletcher 2010). Thus, traditional funders have both project and program level evaluation of results (Garnett et al. 2009).
At the project level, ex-post assessments are almost always conducted. JICA for example, conducts “a post-project evaluation that measures the relevance, the impact, efficiency and sustainability of the project”. Similarly, AFD conducts a post-project performance evaluation at the end of each project, while the KfW conducts an assessment of the project a year after completion to see if it is operational and if the “resources were used in accordance with the contractual agreements.” The DFIs, in particular the JBIC, the IFC, and DEG, also have their own assessments mostly focusing on the profitability of the project as well as its development effects and its impact on the environment.
None of the financiers have paid much attention to the maintenance and upkeep of the infrastructure. As noted by Garnett et al. (2009), while traditional financiers provide funding for capacity building in the planning stage, they do not do so consistently across developing countries for maintenance and upkeep. Similarly, Chinese actors focus on the delivery of the facility and rarely on its maintenance (Jacobs 2011).
For the burden that repayment imposes on the beneficiary countries, as illustrated in the financing section, the terms vary across financiers, but in general, traditional financiers generally provide more generous terms under their ODA windows, both in terms of interest rates, maturity, and length of the grace period. This is pertinent because many SSA countries are already heavily indebted (33 out of the 39 Highly Indebted Poor Countries (HIPC) are from SSA), and taking on additional debt can become unsustainable and negatively impact development in these countries. Nevertheless, it is important to note that in the Chinese case, while the loans stipulate a specified grace period and maturity, the terms can sometimes be flexible. As described by Fletcher (2010), “loans may become grants, terms can be adjusted,” but these adjustments/ gifts “may elicit large payments in the future” (p. 12).
Cross-cutting issues
Corruption in the public sector is a pervasive problem across the SSA continent; according to Transparency International, “aid resources provided by multilateral and bilateral agencies have not been immune to corruption and misuse” and “the institutions that are intended to provide checks and balances within the system are generally under-resourced and lack independence” (Transparency International, webpage). This suggests a setting where politicians have a high level of discretion in policymaking and a lack of transparency and accountability in many of the stages of the infrastructure lifecycle, particularly procurement. Traditional funding agencies have introduced conditionalities around good governance and increased transparency, as well as

31
stringent monitoring and evaluation tools to counterbalance this environment and to improve the allocation of funds to projects.
However, the financing agencies themselves have questionable levels of transparency – to varying degrees – when it comes to the funding they make available to developing countries in the form of development assistance. According to the International Aid Transparency Initiative (IATI),16 the multilaterals are the most transparent (the World Bank ranked 2nd and the AfDB 8th among 72 development agencies) systematically publishing recipient country level information as well as project level information. The bilaterals are much less transparent, as they do not disclose as much of their country project-levels activities. JICA is the most transparent among them (ranked 25th), followed by AFD (ranked 44th) and the KfW (ranked 55th). The DFIs (PROPARCO and DEG) are even less transparent than their public sector counterparts, including the IFC; in general none of them has an explicit Policy on Disclosure of Information, and DEG is required by law to uphold the German Banking Secrecy Law. However, Chinese agencies under the Ministry of Commerce are the least transparent, ranking second to last, as it discloses very little about its agencies, or about its country-level interactions and projects (Publish What You Fund 2013).
By the same token, as noted earlier, Chinese contracts with beneficiary institutions also tend to be the most flexible. Indeed, important clauses around dispute resolution or risk distribution across parties are not explicitly outlined. Additionally, renegotiations are not uncommon, even once the construction has started. In light on the lack of transparency around these funds, the flexibility of contractual terms provides an environment where corruption can thrive and the risk of misallocation of funds can be high.
Discussion: How do Chinese actors compare to other financiers?
The analysis above has shown that there are some similarities between the way Chinese and traditional financiers operate but the differences predominate. I highlight these here and explore the tradeoffs associated with the different types of financing options, before concluding with the policy implications for SSA governments in the next section.
16 The IATI, launched in 2008, is a “voluntary, multi-stakeholder initiative that seeks to improve the transparency of aid in order to increase its effectiveness in tackling poverty” (IATI 2013, webpage). As part of the Accra Agenda in 2008 and the 2011 Busan Agreements, 33 signatory donor country governments along with civil society organizations agreed on a set of common standards for transparency of development assistance and agreed to publish that information to IATI. Based on these, since 2010, IATI has been monitoring the transparency levels of donor organizations under the Publish What You Fund Initiative. In 2011, using primary data collected in partnership with 49 civil society organizations, the initiative successfully piloted its Aid Transparency Index rating donor agencies on the transparency their overall organization, recipient country level information, and activity (project) levels (Publish What You Fund 2013). The ratings discussed here are those of 2012.

32
Some similarities
The financing instruments are very closely aligned across financiers. Indeed, both Chinese and traditional partners provide a mix of market-rate and concessional loans, as well as grant financing for infrastructure financing in SSA countries. Furthermore, very similar to other bilaterals, notably Germany and Japan, China uses instruments such as export credits to promote its own exports of materials and equipment for the construction of the facilities. As of 2007, similar to other DFIs, China also has the CADF which intends to provide equity and quasi-equity financing to infrastructure projects on the continent. However, China does use one financing instrument that is not utilized by other financiers; resource-backed loans.
The terms associated with the financing instruments are also not that different, especially those accorded to middle income countries. Indeed, Chinese funding for infrastructure on the continent is mostly made up of loans at mildly concessional rates, while traditional donors provide similar loans to middle income and non-debt distressed countries.
In terms of procurements, while traditional donors have committed to using recipient country systems under the Paris Declaration, in effect, they still use their own as a result of capacity and reliability issues on the recipient country side. Chinese entities similarly rely on their own systems, albeit for different reasons, as they exercise full control over procurement.
But differences stand out
To start with, the guiding outlook to financing infrastructure in SSA is very different. The missions and principles of Chinese actors highlight the idea of partnership, “South-South cooperation,” and mutual benefit, while traditional donors take a more paternalistic approach, highlighting development goals, knowledge transfer, and the protection of the environment. To that effect, Chinese agencies appear to be more “hands-off” in the planning process. They also do not impose any conditionality to their funds, with the exception of the recognition of the “One China Principle.” In contrast, despite their expressed desire to have “strong country ownership”, in addition to imposing conditionalities around human rights, democratic governance, as well as economic conditionalities, the traditional bilateral and multilateral agencies are involved from the very beginning, requiring that proposed projects fit overall country growth strategies, and at the same time providing technical assistance and capacity building to prepare country strategies and project feasibility studies. The result in some cases is that country ownership is so weak that the agenda is mostly donor driven. This is also reflected in the construction/implementation phase of the infrastructure lifecycle, where traditional financiers use extensive monitoring and evaluation standards and even condition the disbursement of funds on strict performance benchmarks.
Another facet to the differences in missions and guiding principles is that Chinese funding is tied whereas other financiers have started progressively untying their aid; under the 2005 Paris Declaration and 2008 Accra Agenda, traditional donors have committed to fully untie their

33
development assistance, while China has stated that it will only do so on a “voluntary basis” during the 2011 Busan agreements. Perhaps more importantly, Chinese funding terms seem to be less generous (in terms of interest levied, length of the grace period, and maturity of the loan) than traditional donors that generally calibrate their terms to the income and debt levels of recipient countries. It is nevertheless important to note here that China has also cancelled a number of debts owed by SSA countries in recent years.
The way China undertakes its development assistance is also fundamentally different: Chinese aid is conducted on a project-by-project basis, and each project is entirely funded by Chinese agencies. In contrast, traditional financiers aim to finance projects that fit into the overall country growth strategy. They also tend to work with each other and jointly fund projects, particularly if the projects are large. For example, France’s AFD often works with the European Investment Bank (EIB) and Germany’s KfW, as well as the respective private sector arms (DEG and PROPARCO to fund a project). Multilateral agencies also co-finance projects; in particular, the World Bank and the African Development Bank. The IFC, by policy, funds at most 25 percent of project, as it endeavors to attract other sources of (private) finance for projects. For the recipient country, multiple co-sponsors can add to the transaction and coordination costs, as each of the funders has specific requirements that can sometimes be contradictory.
Yet another distinction between Chinese and traditional funders is the level of flexibility throughout the infrastructure lifecycle. Chinese agencies typically negotiate vague contracts and allow for the renegotiation of terms during the whole lifecycle including repayment terms, whereas traditional financiers have more robust contracts stipulating a number of the requirements, risk mitigation strategies, responsibilities in case of delays and cost overruns, dispute settlement mechanisms etc. Likewise, traditional funders have extensive environmental and social assessment requirements before agreeing to fund a project, while the requirements for Chinese agencies are minimal. Furthermore, Chinese agencies tend to be a lot less transparent in their dealings than the traditional financiers, although the latter group is not homogeneous in the disclosure of its practices.
Lastly, in assessing their respective levels of success, traditional financiers focus on the impact, efficiency and sustainability of the project, and therefore conduct a multitude of ex-post evaluation, while their Chinese counterparts focus on the delivery of the facility on time.
One of the implications of these differences is that Chinese funded projects are associated with fewer delays than those funded by traditional financiers. They also impose fewer transaction costs, are more predictable, and have lower short-term risks. On the flip side, however, Chinese funds are associated with higher long-term costs given the less generous terms, as well as higher long-term risk in that the contracts are not very elaborate, and given the lack of transparency, could imply implicitly a number of costly future commitments such as preferential access to natural resources, or higher debt servicing costs.

34
Policy implications
In sum, the main finding of this chapter is that Chinese financing provides a real alternative to traditional financing of infrastructure on the continent. For African policymakers, this provides a portfolio of possible financing sources for the much needed infrastructure, as well as more leverage to negotiate better deals. In order to take advantage of these however, it is important that African policymakers understand the differences and tradeoffs around the various financing mechanisms. In effect, the various financiers present several tradeoffs around the following key issues:
1. Ownership of the infrastructure project versus a donor-driven agenda 2. Direct cost of the financing both in the short-term and the long run; the terms of the
financing, the level of future debt burden the financing option imposes 3. The amount of short term and long-term risk that the SSA government takes on 4. The transaction costs involved 5. Speed of delivery and the potential for delays and cost overruns
In broad strokes however, the advantages of Chinese funds relative to those from traditional financiers are that they enable countries to fund projects of their choosing, are associated with fewer delays, they impose fewer transaction costs, are more predictable, and have lower short-term risks. The disadvantages are that Chinese funds are associated with higher long-term costs given the less generous terms, as well as higher long-term risk in that the contracts are not very elaborate and, given the lack of transparency, could entail implicitly a number of costly future commitments such as preferential access to natural resources, or higher debt servicing costs.
Ultimately, the choice of the financing really depends on the individual recipient country government as well as on the specific project based on the environment in the country, governance capacities, experience with the specific financiers, and the needs on the ground. The framework established here provides a clear guide on what factors should be taken into consideration throughout the lifecycle of an infrastructure investment.
While the discussion here assumes a welfare maximizing SSA policymaker, it is important to note that this may not always be the case. Indeed, the strongest criticisms of the Chinese way of financing infrastructure (and more generally of providing assistance to SSA countries) is that (1) because it does not impose conditionalities around good governance and human rights issues, China supports “rogue states” and does not demand adequate environmental and social protection in the projects it funds, and (2) the lack of transparency in its dealing promotes corrupt practices in countries that already have low levels of political governance. In so doing, it sets back the efforts of traditional donors who have worked for decades to promote good governance and sustainable growth (Woods 2008).
This is all the more important as a separate recent trend is that the Chinese involvement is driving a rising interest from other emerging economies, in particular Turkey and Brazil, to invest in African infrastructure. The mechanisms that they employ are very similar to those of

35
China; i.e., providing support to Turkish/ Brazilian firms to engage in infrastructure provision in SSA on the one hand, and providing competitive loans to countries to enable them to build the needed infrastructure (Özkan 2008; The Economist 2010, 2012).
36
4. Determinants of Private Participation in Infrastructure
The main aims of this chapter are to investigate the determinants of private participation in infrastructure in LMICs and SSA countries and explore how SSA countries compare to the other LMICs. The guiding research questions are whether SSA countries differ from other LMICs in how they attract private investment in infrastructure, and if they do, what policy implications these findings entail. The underlying premise is that SSA countries may indeed be different from other developing countries (and therefore require unique policies), as there is consistent evidence from the macroeconomic literature that SSA countries differ from other developing countries with regards to factors influencing macroeconomic trends such as growth and FDI (e.g., Asiedu (2002) and Morrisset (2000) for FDI receipts, and Tsangarides (2005) and Block (2001) for economic growth).
A quantitative approach is taken to address these questions, using a cross-country panel regression framework. The outcome variables of interest are (1) whether a country received any PPI in any given year between 1995 to 2008, and (2) the amount of PPI received (in constant 2005 US$) contingent on receiving PPI. I test if factors such as government fiscal stance, political and business environment, and market size affect whether or not a country attracts private funds for infrastructure, and for those countries that do in fact attract PPI, whether these factors have an impact on the amount received.
The chapter is structured as follows: In the next section, I provide a brief background and discuss the related research as well as my own contributions; subsequently, the methodology is outlined, followed by the data and the results. The chapter then concludes with a discussion of the findings.
Background and related research
Formally defined, an infrastructure project is considered a PPI “if a private company or investor bears a share of the project's operating risk” (World Bank 2013, webpage). In the most basic sense, PPIs entail some sort of partnership between the public and private sectors through a long-term contractual agreement which aims to facilitate the involvement of the private sector in infrastructure provision so as to increase the infrastructure stock as well as its quality and performance. Thus, a PPI can exist only in the event that there are complementarities between the public and private sectors and, typically, the contract involves a risk-sharing mechanism between the two entities.

37
Effectively, for a given infrastructure project the private sector can bring financing and management expertise and, as it is profit-driven, efficiency and self-sustainability of utilities (resulting from stronger incentives for tariff discipline) and improved quality of services (resulting from consumers’ higher willingness to pay for better services). In exchange, the public sector can provide a conducive business environment, access to credit, as well as investor protection (de Bettignies and Ross 2004, Kirkpatrick et al. 2006a, Linder 1999).
By the same token, PPIs may not be viable in some cases. For one, certain infrastructure sectors, such as water and electricity, are inherently more “public” than others, and therefore (in most cases) benefit from subsidies which can result in highly distorted tariffs. This may in turn translate in strong opposition to any form of privatization on the moral ground that these infrastructure services represent basic needs, ultimately leading to difficulties for the private sector to rationalize tariffs and making PPIs non-viable. Furthermore, because some infrastructure sectors require substantial upfront investments (e.g., construction of the physical network) with profits spread out over the long run and low rates of return to investment, in the absence of strong credit markets providing debt financing opportunities for the private sector, PPIs may not be feasible without credit enhancement or guarantees from governments and/or multilateral agencies (Dubash 2002, Shirley 2007, Tenenbaum and Izaguirre 2007). Additionally, since infrastructure sectors have natural monopoly features, a good regulatory environment is central to the success of PPIs (Grimsey and Lewis, 2002, Pragal 2003, Kirkpatrick et al. 2006a).
Given these considerations, three relevant areas to assess the determinants of PPI are distinguished: (1) the motivations of governments to engage the private sector in infrastructure financing, (2) the motivations of the private sector to enter a public-private partnership (PPP) with the government, and (3) the underlying context in terms of the institutional and macroeconomic environment, which drives to some extent the respective motivations of the public and private sectors. I briefly discuss the factors included in each of the three categories and summarize them in Table 5 below.

38
Table 5 Factors potentially affecting the level of PPI received
Category Factors identified in the literature Government motivations
Ability of government to finance infrastructure Improved efficiency and tariff discipline in infrastructure sectors
Private firm motivations
Adequate regulatory framework and proper enforcement of laws Independence of regulatory institutions and processes Access to credit Consumers’ ability to pay for services Government effectiveness and responsiveness Political stability and public opinion on private provision of infrastructure services
Enabling environment
Macroeconomic environment Institutional capacity to regulate PPPs Structural characteristics of country
The literature on PPIs identifies two key factors which can affect governments’ motivations
to engage the private sector: The ability of the government to finance infrastructure on its own; its desire to increase access to infrastructure and introduce improved efficiency and tariff discipline in infrastructure provision; and its desire to reduce its own investment risks. In a series of case studies of PPIs across eight countries,17 Sanghi et al. (2007) find that initially the principal motivation for governments to enter into a PPP contract was to attract private financing for infrastructure, but as countries built experience with PPPs, governments started considering the optimal risk allocation and the net present value of money under a PPP contract relative to a situation where the government provides infrastructure by itself (Sanghi, et al. 2007). Harris (2003), through a qualitative study of the historical trends of PPI in developing countries, suggests similar motives for government involvement in PPPs: The governments that sought out PPIs in the early 1990s were those experiencing severe budget strains as a result of their inability to impose commercial and financial discipline to publically owned utility sectors, which, as a result, experienced declining performance and were finding themselves unable to meet the increasing demand.
Private firms investing in infrastructure face a different set of incentives. Lamech and Saeed (2003), who undertook a survey of firms investing in PPIs in the power sector in developing countries, find that firms prioritize the existence of a regulatory framework that adequately defines investors’ rights and responsibilities, as well as the ability to enforce them, in their decision on whether or not to invest in a developing country. Additionally, firms valued the independence of public regulatory institutions from political government entities and arbitrary interference. Market size, consumers’ ability to pay for services, administrative efficiency of the government and its responsiveness to private investors, and access to credit also influenced
17 These are Bangladesh, Jamaica, South Korea, the Philippines, Portugal, South Africa, the United Kingdom and The state of Victoria in Australia.

39
firms’ decisions. Furthermore — although to a lesser extent than the other factors — public opinion on the provision of infrastructure services by the private sector and “tenure and stability of elected officials in the political process,” mattered in firms’ decisions to invest (Lamech and Saeed 2003, p 15). Similarly to the latter point, Foster and Briceño-Garmendia (2010) find that in SSA, politically unstable countries on average tend to attract less private capital into infrastructure than their more stable counterparts.
Outside of the respective government and private sector motivations to engage in an infrastructure PPP, other factors can also influence the level of PPI received by countries. One that is often cited in the literature is the macroeconomic environment. Indeed, inflation and variability in the exchange rate have been shown to be detrimental to PPI (Banerjee et al. 2006). Furthermore, when looking at PPI trends over time, sharp drops in PPI have been noted in times of macroeconomic crises, such as the financial crises in Asian in 1997 and in Argentina in 1999 (Harris 2003). Another factor mentioned in the literature (and referred to earlier) is the institutional capacity of the government to regulate and manage a PPP contract.
A whole host of other factors related to the structural characteristics of the PPI receiving country may also matter. For example, the legal tradition in the country can influence the regulatory environment in which PPPs operate (La Porta et al. 1997, 1998). Additionally, a number of empirical studies have shown that openness to trade is positively associated with increased FDI (Asiedu 2002, Morrisset 2000); and, since in many developing countries firms investing in infrastructure tend to be foreign (due to the high level of investment required), openness could in turn affect PPI.
The empirical evidence on determinants of PPIs is sparse and, to my knowledge, no study has looked at the specific case of SSA. Among the few papers that have explored the question, most use a cross-country panel regression approach, looking at whether indicators of macroeconomic stability, measures of institutional and regulatory quality, and a variety of other controls impact the total amount of PPI received by a country. For example, Pargal (2003) and Kirpatrick et al. (2006) look at the importance of the regulatory framework as a determinant of PPI respectively for Latin America and the Caribbean (LAC) and the broader set of developing countries. Pargal (2003) finds that the most significant determinant of PPI is the passage of legislation liberalizing the investment regime, while Kirpatrick et al. (2006) find that institutional framework and regulation matter most. Similarly, Banerjee et al. (2006) look at the question of whether institutions matter for PPI. While their results indicate that property rights and bureaucratic quality play a significant role in promoting PPI, they also find that countries with higher levels of corruption attract more PPIs.
This dissertation contributes to the existing literature in several ways. For one, as stated earlier, only a handful of studies have empirically investigated the determinants of PPI in developing countries and, to my knowledge, none has centered in on SSA. Further, where the other studies have considered the trends in PPI up until 2005, I extend the analysis to 2008. More substantively the empirical strategy taken here yields more robust results than earlier research in

40
that it controls for unobserved time characteristics through time fixed effects models, controls for a wide number of country-level characteristics, and accounts for heteroskedasticity in the model. For the latter, previous papers have relied on generalized least squares method of estimation, which implicitly assumes a general distributional form for the error terms. This assumption cannot be tested, and in the event of misspecification, it can lead to incorrect standard errors and biased coefficients. In contrast, I cluster the standard errors on countries, allowing for arbitrary heteroskedasticity across countries and autocorrelation within countries. Furthermore, unlike much of the previous research, I separately estimate the determinants of getting PPI and the amount of PPI given that a country has received PPI.
Methodology
The main methodology adopted here is a cross-country regression framework. In essence, I estimate the predictors of PPI receipts for all LMICs and for SSA countries separately to compare the two groups and identify if and how SSA countries differ from LMICs.
The outcome variable of interest, the amount of PPI received by a country in a given year (financial closure year), has a left-skewed distribution with a substantial number of observations clumped at zero as some countries did not receive private capital in infrastructure during certain years (see Appendix D). Initially, following the literature (e.g., Kirpatrick et al. 2006), I specify a “benchmark” model using a random effects ordinary least squares (OLS) estimation with a log transformation of the outcome variable (so that the PPI numbers are more normally distributed—see Appendix D),18 and the three groups of independent variables discussed above, such that X represents the factors influencing government motivations, Y the factors influencing the private sector motivations, and Z the factors influencing the enabling environment. In addition, I include the total level of investment in the economy, I, as a control to normalize PPI data,19 and time fixed effects to account for unexpected events that may have affected PPI (e.g., financial crises).20 In terms of the standard errors used, because I have panel data, there is a high likelihood of heteroskedasticity and autocorrelation within the model. Therefore, I cluster the
18 As described in Appendix D, I take the ln(PPI+1) so that all the observations where PPI is equal to zero are not dropped from the analysis when I take the natural logarithm. I recognize however that adding 1 to the outcome variable is somewhat arbitrary and could therefore bias the results. 19 I use the gross fixed capital formation (in constant 2005 US$) defined as the total expenditure on “land improvements; plant, machinery, and equipment purchases; and the construction of roads, railways, and the like, including schools, offices, hospitals, private residential dwellings, and commercial and industrial buildings” (World Bank, World Development Indicators website)
20 I selected a random effects model in part because the differences across countries may influence the level of PPI received by a country. I ran a Hausman test to see whether a random effects or a fixed effects model is preferred. The null hypothesis that that the coefficients estimated by the random effects model are the same as the ones estimated by the fixed effects model cannot be rejected , therefore it is safe to use a random effects model(p= 0.1033).
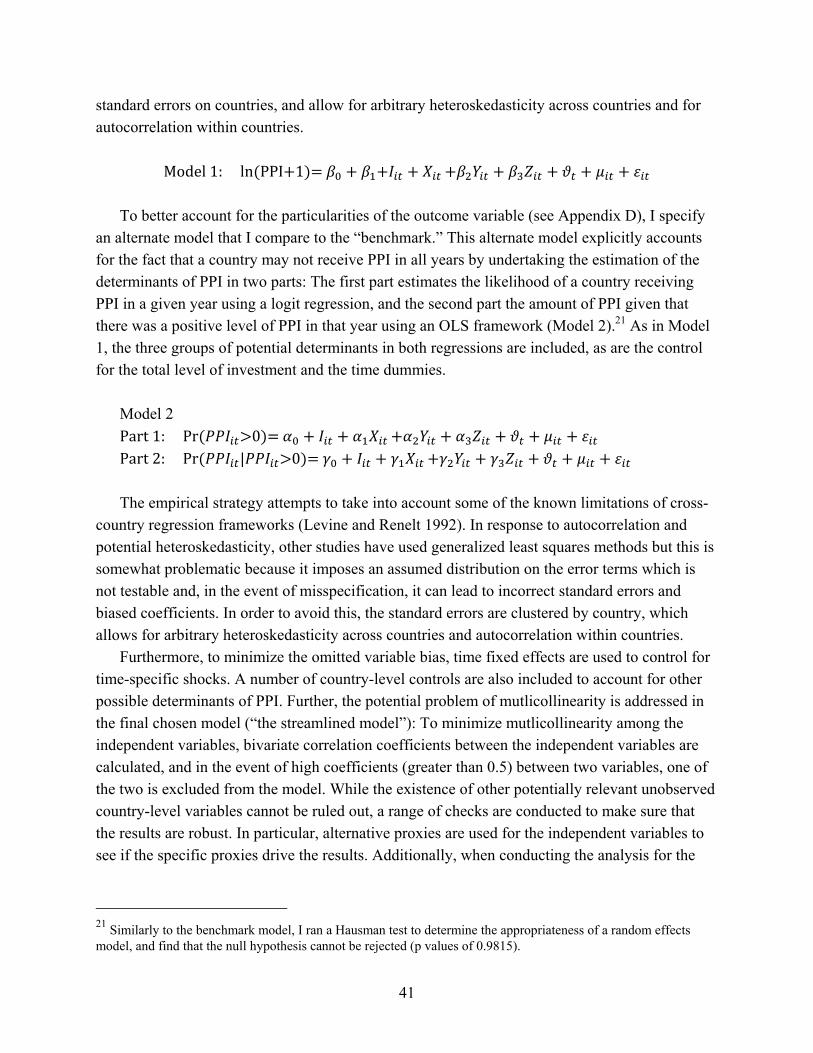
41
standard errors on countries, and allow for arbitrary heteroskedasticity across countries and for autocorrelation within countries.
Model1:ln PPI 1 To better account for the particularities of the outcome variable (see Appendix D), I specify
an alternate model that I compare to the “benchmark.” This alternate model explicitly accounts for the fact that a country may not receive PPI in all years by undertaking the estimation of the determinants of PPI in two parts: The first part estimates the likelihood of a country receiving PPI in a given year using a logit regression, and the second part the amount of PPI given that there was a positive level of PPI in that year using an OLS framework (Model 2).21 As in Model 1, the three groups of potential determinants in both regressions are included, as are the control for the total level of investment and the time dummies.
Model 2Part1:Pr 0
Part2:Pr | 0
The empirical strategy attempts to take into account some of the known limitations of cross-
country regression frameworks (Levine and Renelt 1992). In response to autocorrelation and potential heteroskedasticity, other studies have used generalized least squares methods but this is somewhat problematic because it imposes an assumed distribution on the error terms which is not testable and, in the event of misspecification, it can lead to incorrect standard errors and biased coefficients. In order to avoid this, the standard errors are clustered by country, which allows for arbitrary heteroskedasticity across countries and autocorrelation within countries.
Furthermore, to minimize the omitted variable bias, time fixed effects are used to control for time-specific shocks. A number of country-level controls are also included to account for other possible determinants of PPI. Further, the potential problem of mutlicollinearity is addressed in the final chosen model (“the streamlined model”): To minimize mutlicollinearity among the independent variables, bivariate correlation coefficients between the independent variables are calculated, and in the event of high coefficients (greater than 0.5) between two variables, one of the two is excluded from the model. While the existence of other potentially relevant unobserved country-level variables cannot be ruled out, a range of checks are conducted to make sure that the results are robust. In particular, alternative proxies are used for the independent variables to see if the specific proxies drive the results. Additionally, when conducting the analysis for the
21 Similarly to the benchmark model, I ran a Hausman test to determine the appropriateness of a random effects model, and find that the null hypothesis cannot be rejected (p values of 0.9815).

42
SSA sample, potential outlier countries are identified in the sample and excluded from the analysis to ensure that these are not driving the results.
Data
Private participation in infrastructure
The World Bank maintains a database containing time-series project level data, spanning from 1984 to 2008. The database compiles information on large PPI projects in 133 LMICs for the four infrastructure sectors of interest. It includes information on the level of PPI received (in millions of current US$) by project, sector, and country in which the project is located, and the contractual arrangements used in each project. Of note, the database registers private sector commitments to invest in public infrastructure (rather than actual disbursements) and therefore tracks private sector intentions to invest. Furthermore, portfolio investments in infrastructure through the stock market are not reflected in the database. This is not necessarily a problem since the focus here is SSA countries, which typically do not have a vibrant stock exchange, with the exception of South Africa (Andrianaivo and Yartey 2010, Yartley and Adjasi 2007). To account for this, in the robustness checks, South African PPIs are excluded from the sample of SSA countries to see if the results are sensitive to the inclusion of a possible outlier.
One limitation of the database is that since the data is collected from major news sources, databases, and government websites, it may miss out on smaller projects not reported in these sources and therefore not capture the entirety of PPI within the country. The database is nevertheless the most complete source of PPI data across developing countries.
For the analysis, PPI numbers are adjusted for inflation using the consumer price index (base year 2005), obtained from the World Bank’s World Development Indicators (WDI), thus, the primary outcome variable used is the total PPI in constant 2005 US$. In addition, because of the lack of data for explanatory variables in certain countries for earlier years (1984-1994), the time period is limited to 1995-2008.
As shown in Table 6 below, the average PPI received by an LMIC in a year over the period was a little over US$1 billion, with a minimum of US$ 0 and the maximum of US$ 101.24 billion. In contrast, the numbers are much more modest for SSA; there were 616 PPI projects during the period, the average annual receipt was around US$ 162 million, and the maximum amount of PPI received in a year was just over US$ 6.1 billion. Furthermore, as stated earlier, an important characteristic of the outcome variable is that its distribution is highly skewed towards zero, as a number of countries did not receive any private capital in infrastructure in some years. To that effect, 39 percent of the observations in the LMICs sample are zeros compared to 47 percent in the SSA sample.

43
Table 6 Private Participation in Infrastructure Summary statistics
Group LMICs SSA
# of countries 133 44
Mean (millions of constant 2005 US$) 1,010.12 162.43
Std. Dev. 4568.86 570.51
Min (millions of constant 2005 US$) 0 0
Max (millions of constant 2005 US$) 101,236.70 6,106.45
# of observations 1862 616
Explanatory variables
The proxies used for the explanatory variables are discussed following the structure described in the background section and summarized in Table 1 above. The full list of variables, their definitions, and their sources are provided in Appendix E.
Factors affecting the government’s motivations to enter a public-private partnership (PPP)
To proxy the government’s ability to finance infrastructure on its own, two indicators are used: The level of aid received as a percentage of gross capital formation from the World Bank’s WDI database and an index capturing government size from the Heritage Foundation’s Index Economic Freedom (IEF) database. The rationale behind the first indicator is that to the extent to which the government is able to attract other sources of capital for investment purposes through, for example, foreign aid, it may not necessarily be pursuing PPI. I therefore expect aid to be negatively correlated with PPI. As for the index of government size, which captures the level of government expenditures with respect to consumption, transfers, and provision of public services, it indicates (albeit imperfectly) how involved the government is in the financing of public services, including the provision of infrastructure services. Effectively, because a higher index entails a smaller government (and therefore a lower level of expenditures), I expect the index to be negatively correlated with PPI.
The need for improved efficiency and tariff discipline in infrastructure sectors could be proxied by indicators of government debt. Unfortunately, complete data on this across countries are not readily available; the only indicator found, central government debt as a percentage of GDP from the WDI, is missing the vast majority of the observations.
Factors affecting the private sector’s motivations to enter a public-private partnership (PPP)
To proxy for the regulatory framework and the extent of enforcement of laws, as well as the independence of regulatory institutions and processes, I use two indices from the IEF: Freedom from corruption and property rights protection. These indices capture different aspects of the regulatory framework; while the property rights index indicates the existence of laws protecting

44
investors and how well they are enforced, the corruption index measures the level of unlawfulness and impropriety that exists within the system. In both cases, a higher value of the index indicates a better environment (i.e., the higher the property rights index, the better the protection and the higher the freedom from corruption index, the less corruption there is). I expect both to be positively correlated with PPI.
Domestic credit to the private sector as a percentage of GDP, population size, and GDP per capita (in constant 2005 international $)—all from the WDI— are used to proxy respectively for the availability of domestic credit, market size, and consumers’ ability to pay. I expect all three to be positively correlated with PPI as greater access to credit, a large population, and high GDP per capita all entail better prospects for the private firm investing in an infrastructure facility.
For government effectiveness and responsiveness to the private sector, indices of fiscal, investment, and business freedom from the IEF are used, respectively measuring tax burden imposed by government on private sector, constraints on the flow of investment capital, and the efficacy of the government in the regulatory process in terms of the ability to start, operate, and close a business. For all three measures, as the index rises, the level of “freedom” increases (i.e., a high fiscal freedom index suggests a low tax burden on the private sector, a high investment index corresponds to a situation where there is little constraints on the movement of capital in and out of the country, and a high business freedom suggests low regulatory burden/high government efficiency to start, operate, and close a business). I expect the three indices to be positively correlated with PPI. In addition, a dummy indicating whether or not the country is a democracy is used; arguably, responsiveness to private sector may be stronger in democracies and therefore, I would expect democracies to have more PPI.
Political stability is measured primarily through a variable of regime duration. Frequent regime changes can entail a volatile business environment with recurrent policy changes as they relate to the private sector. Particularly for PPI, being a sensitive area, there is the risk that a regime change could dramatically alter government policies towards PPI. Conversely, longer regime duration brings stability with respect to government policies, which in turn provides private firms with a more predictable business environment. In the same vein, a dummy variable for civil war is added (obtained from Hadenius and Teorell 2007) to control for specific years in which there was disruptions due to civil war, Clearly, I expect PPI to be negatively associated with civil war. Furthermore, in order to get at the potential for political instability, I use an indicator developed by Roeder (2001), which provides “the probability that two randomly selected people in a given country will not belong to the same ethnolinguistic group” (as cited in Hadenius and Teorell 2012, p. 45). The idea here is that a higher level of ethnic fractionalization is associated with increased instability and therefore reduced PPI.
Factors affecting the enabling environment
Annual consumer price inflation (from the WDI) is used as a measure of macroeconomic stability. High and volatile inflation rates are detrimental to business through their impact on

45
costs of inputs and on prices, and may negatively affect the level of investment a private firm decides to undertake.
Openness, defined as imports and exports as a fraction of GDP, is used as a measure of the country’s receptiveness to foreign investment. To the extent that PPI is undertaken by mostly foreign firms, I expect openness to be positively correlated with PPI.
Other factors related to the structural characteristics of the PPI receiving country may also matter. For example, the legal tradition in the country can influence the regulatory environment in which PPIs happen (La Porta et al. 1997, 1998). I control for legal traditions directly by using a dummy for countries that follow common law.22 In addition, several indicators of the structural characteristics of the host economies are controlled for, including the value added of agriculture, industry and services to GDP, as well as an indicator of natural resource dependence.
Results
Appendix F outlines the full results discussed here. In general, the “benchmark” model yields similar results to the two-part model with a few exceptions, but I discuss the latter in more detail, as it enables me to separately identify possible determinants of PPI, as well as the level of PPI given that a country receives PPI.
As described in the methodology section, I start with a broad set of independent variables that were found to be relevant for PPI in the literature (Appendix F, Table 1). Acknowledging however that these results may be biased due to multicollinearity, I streamline the model by dropping the explanatory variables that are correlated with each other (correlations shown in Appendix F, Table 2). Effectively, I drop GDP per capita (highly correlated with structural indicators of the economy, in particular value added of agriculture, services and industry to the economy, as well as the level of aid received by the country), and the index for property rights (highly correlated with the freedom from corruption as well as with the investment and business freedom indices).
The final results, as described in Figure 3 below, suggest that for LMICs as a whole the largest predictor of getting PPI has to do with recipients’ economic structure, in particular, countries with larger service sectors (as a percentage of GDP) are more likely to receive PPI. Countries more open to trade, countries with larger populations, and democracies, are also more likely to receive PPI, as are countries with higher levels of fiscal freedom (lower tax burden). The results for SSA countries differ slightly; while countries with larger service sectors, larger populations, and lower tax burdens, are similarly significantly and positively associated with PPI receipts, being a democracy or having an open trade regime do not appear to affect the
22 Common law is defined by Tetley (1999) as follows “legal tradition which evolved in England from the eleventh century onwards. Its principles appear for the most part in reported judgments, usually of the higher courts, in relation to specific fact situations arising in disputes which courts have adjudicated. The common law is usually much more detailed in its prescriptions than the civil law” (p. 684).
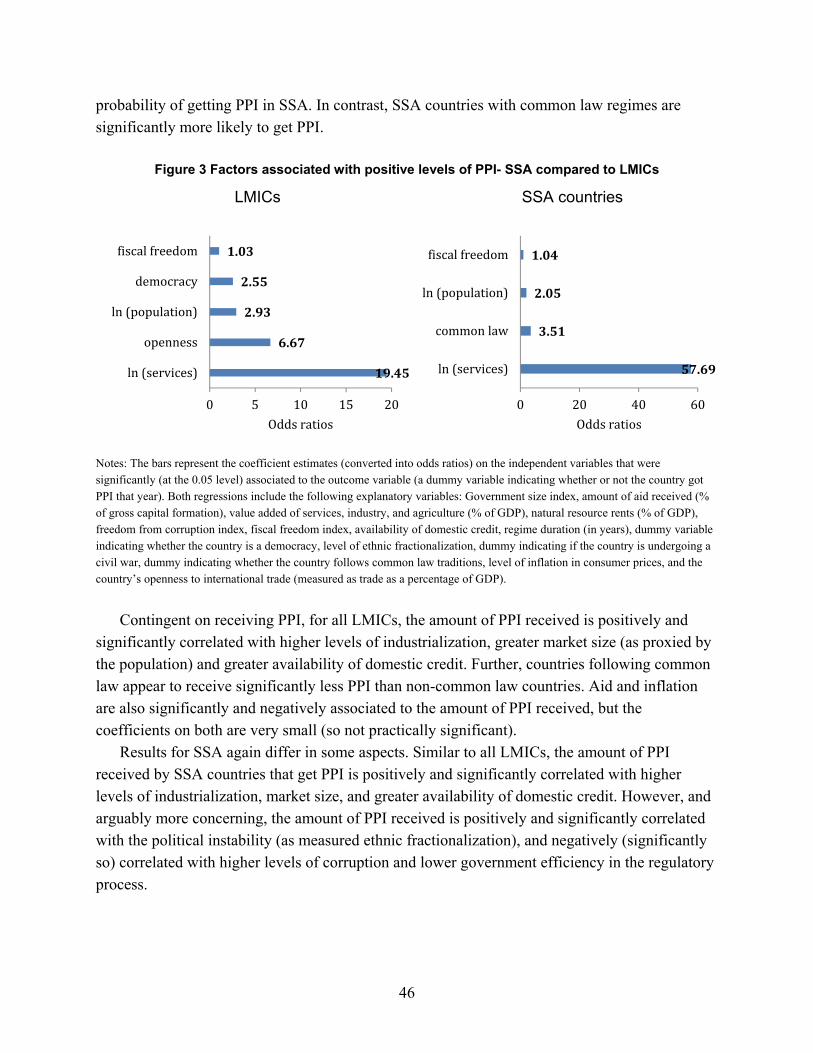
46
probability of getting PPI in SSA. In contrast, SSA countries with common law regimes are significantly more likely to get PPI.
Figure 3 Factors associated with positive levels of PPI- SSA compared to LMICs
LMICs SSA countries
Notes: The bars represent the coefficient estimates (converted into odds ratios) on the independent variables that were significantly (at the 0.05 level) associated to the outcome variable (a dummy variable indicating whether or not the country got PPI that year). Both regressions include the following explanatory variables: Government size index, amount of aid received (% of gross capital formation), value added of services, industry, and agriculture (% of GDP), natural resource rents (% of GDP), freedom from corruption index, fiscal freedom index, availability of domestic credit, regime duration (in years), dummy variable indicating whether the country is a democracy, level of ethnic fractionalization, dummy indicating if the country is undergoing a civil war, dummy indicating whether the country follows common law traditions, level of inflation in consumer prices, and the country’s openness to international trade (measured as trade as a percentage of GDP).
Contingent on receiving PPI, for all LMICs, the amount of PPI received is positively and
significantly correlated with higher levels of industrialization, greater market size (as proxied by the population) and greater availability of domestic credit. Further, countries following common law appear to receive significantly less PPI than non-common law countries. Aid and inflation are also significantly and negatively associated to the amount of PPI received, but the coefficients on both are very small (so not practically significant).
Results for SSA again differ in some aspects. Similar to all LMICs, the amount of PPI received by SSA countries that get PPI is positively and significantly correlated with higher levels of industrialization, market size, and greater availability of domestic credit. However, and arguably more concerning, the amount of PPI received is positively and significantly correlated with the political instability (as measured ethnic fractionalization), and negatively (significantly so) correlated with higher levels of corruption and lower government efficiency in the regulatory process.
19.45
6.67
2.93
2.55
1.03
0 5 10 15 20
ln(services)
openness
ln(population)
democracy
fiscalfreedom
Oddsratios
57.69
3.51
2.05
1.04
0 20 40 60
ln(services)
commonlaw
ln(population)
fiscalfreedom
Oddsratios

47
Figure 4 Factors associated with the amount of PPI received- SSA compared to LMICs
LMICs
SSA
Notes: The bars represent the coefficient estimates on the independent variables that were significantly (at the 0.05 level) associated to the outcome variable (the amount of PPI received in 2005 constant US$). Both regressions include the following explanatory variables: Government size index, amount of aid received, value added of services, industry, and agriculture (% of GDP), natural resource rents (% of GDP), freedom from corruption index, fiscal freedom index, availability of domestic credit, regime duration (in years), dummy variable indicating whether the country is a democracy, level of ethnic fractionalization, dummy indicating if the country is undergoing a civil war, dummy indicating whether the country follows common law traditions, level of inflation in consumer prices, and country’s openness to international trade (measured as trade as a percentage of GDP).
Robustness checks
Several alternative specifications are estimated to check the robustness of these results. In a first set of checks, I reintroduce the explanatory variables that were dropped because of
‐0.75 ‐0.25 0.25 0.75 1.25 1.75
ln(industry)
ln(population)
ln(domesticcredit)
inflation
aid
commonlaw
‐0.5 0 0.5 1 1.5 2
ln(industry)
ethnicfractionalization
ln(domesticcredit)
ln(population)
freedomfromcorruption
businessfreedom

48
multicollinearity and dropped those variables that were kept. In a second set, different proxies for the explanatory variables that are more perception-based measures (e.g., various indices of business environment and political stability) are used to make sure that the results are not driven by specific proxies. Finally, the SSA regressions are conducted without South Africa to ensure that the results are not biased due to the inclusion of a possible outlier. In effect, using the streamlined model established above as the starting point, I ran the following alternative specifications (see Appendix G for full results):
Regression (1): Indicators of structural aspects of the country’s economy (value added of services, industry, and agriculture) and the level of aid received are substituted with the GDP per capita.
Regression (2): In addition to substitutions made in (1), the indices of business and investment freedom are dropped, and the index of property rights protection from the IEF is added.
Regression (3): Alternative measures from the World Bank’s World Governance Indicators (WGI) are used to proxy for political stability, as well as government effectiveness and rule of law. Thus, the indicators for civil war, regime durability, and ethnic fractionalization are replaced by the WGI’s index for political stability and absence of violence, and the indices for business and investment freedom, and freedom from corruption are replaced by the WGI government effectiveness index, the WGI regulatory quality index, the WGI rule of law index, and the WGI index for control of corruption.
Regressions (4) and (5): I use alternative political stability measures in each regression. In (4), I replace political stability measures from the “streamlined model” (civil war, regime durability, and ethnic fractionalization) with the US State Department’s Political Terror Scale (PTS) measure of political violence and terror. In (5), I replace them with the WGI political stability and absence of violence index.
Regression (6): I substitute the business and investment freedom indices with an overall quality of government index from the International Country Risk Guide (ICRG).
Regression (7): For the SSA regressions, I run the streamlined model without South Africa.

49
For the overall sample of LMICs, the robustness checks generally support the main results. The level of GDP per capita, the extent of the service sector in the economy, tax burden on the private sector, and openness to trade, are all consistently significantly (and positively) correlated with a country getting PPI. Similarly, GDP per capita, population size, and industry value added are all positively and significantly correlated with the amount of PPI received given a non-zero level of PPI while following common law legal tradition is (mostly) consistently significant and negatively correlated. The only coefficient that is not consistently significantly associated with getting PPI is the form of government (whether or not the country is a democracy). Indeed, in three of the regressions where alternate measures of political stability and/or government effectiveness are used, democracy becomes insignificant. However, this may be due to a reduced sample size as the WGI, PTS, and ICRG measures have more restricted availability over time; the number of observation drops to 742 when using WGI and ICRG measures and to 501 when using PTS measures.
For the SSA sample, the robustness checks suggest that in addition to the size of the population, the burden of taxes on the private sector, and whether a country follows common law traditions, other factors including the level of GDP per capita and the level of openness to trade may also be important determinants of whether a country gets PPI. Further, the robustness checks reveal that the effect of the extent of the service sector is somewhat ambiguous, as its coefficient loses its significance in the regressions where alternate proxies are used. For the determinants of the amount of PPI contingent on a country receiving PPI, the robustness checks generally support the main findings with the exception of ethnic fractionalization, which becomes non-significant in the alternate specifications. Of note, corruption stays significantly and positively associated with the amount of PPI received given a non-zero PPI even when using alternative measures for corruption. Similarly, the coefficient on business freedom remains negatively and significantly correlated with the amount of PPI received. Finally, the robustness checks also suggest that taking South Africa out of the SSA sample does not change the results— the only difference is that the magnitude on the coefficient on the extent of the service sector in the economy is larger.
Discussion
The analysis shows that for both LMICs and SSA countries, the size of the service sector in the economy is the largest predictor of the probability that a country gets PPI, with the effect being even more pronounced for SSA countries. Given that the contribution of the service sector increases as a country develops and matures (Noland et al. 2012), this finding suggests that the more developed LMICs are the ones receiving PPI. This may be because consumers in these countries have higher ability to pay for infrastructure goods— a hypothesis supported by the robustness checks where GDP per capita was significantly and positively associated with PPI receipts, and/or that these countries have the needed regulatory environment, manpower, and

50
expertise to support the often complex contracting mechanisms that PPIs entail. Other consistent predictors of PPI receipts in all LMICs including SSA countries are larger market size (as proxied by population) and lower tax burdens on the private sector.
Where SSA differs is that SSA countries with common law legal origins are significantly more likely to get PPI compared to non-common law countries. There is evidence in the literature that suggests that common law countries are associated with more developed financial markets (La Porta et al. 1997, 1998; Mahoney 2001), better property contract rights, and limited government (Mahoney 2001), and perhaps, these factors are more important in the SSA context to attract potential private investors in infrastructure.
In terms of the amounts of PPI received given non-zero PPI, the results indicate that in both cases (LMICs and SSA) more industrialized countries (i.e., larger contribution of industry to GDP) receive higher amounts of PPI. This is most likely reflective of the fact that more industrialized countries attract larger infrastructure projects and therefore require more financing from diverse sources, including the private sector. For similar reasons, larger market size and higher consumers ability to pay is also significantly associated with larger amounts of PPI.
Furthermore, reflecting that larger projects require substantial upfront investments with profits spread out over the long run and low rates of return to investment, the availability of domestic credit is significantly and positively correlated with larger PPI amounts. Of note, for LMICs as a whole, common law legal origin is negatively correlated with the amount of PPI. This may be due to the fact that common law countries typically have smaller governments and fragmented governmental structures (compared to civil law countries), making larger scale projects with high government involvement less likely as well as harder to coordinate (Mahoney 2001).
The separate analysis of SSA countries reveals a more troubling finding: Higher regulatory burden, lower government efficiency in the regulatory process, as well as higher corruption are positively (and statistically significantly) associated with amounts of PPI received, suggesting that among the SSA countries receiving PPI, the more corrupt and least efficient governments attract larger amounts of PPI. This finding is similar to what Banerjee et al. (2006) find for the overall sample of developing countries; they hypothesize that this result may be driven by the fact that corrupt countries may also be the ones with important location-specific advantages that attract PPI in the first place. Another hypothesis is that corruption and weak government efficiency may be promoting large PPI deals with large private gains at the expense of public interest.
In sum, a key finding of the analysis is that while PPI investments in LMICs seem to be, in principle, determined by the expected factors (i.e., larger, open, more developed democracies with lower tax burden and more stable macroeconomic environment receive more PPI), PPI into SSA countries is sub-optimally allocated. In particular, when it comes to larger PPI investments the findings suggest that corrupt countries with inefficient governments seem to attract more PPI

51
in infrastructure. The risk here is that private funds going into infrastructure that may not necessarily be socially optimal projects but rather projects that serve only private interests.
In light of these findings, SSA governments and international policymakers should revise their policies around PPI so as to stimulate investments that provide more long-term potential for growth in environments with efficient regulatory regimes in place. In part, the findings here may also be a function of the fact that SSA countries are just starting to build experience with PPI, and relative to other developing countries, have very little experience with this financing mechanism. As SSA countries build this experience, the focus should therefore be on building institutional capacity and improving the regulatory process in order to attract higher quality PPI (i.e., PPI that contributes to economic growth and development).

52
5. Determinants of the Extent of Private Participation in SSA
While in the previous chapter, PPI is discussed as a homogeneous form of investment, it is important to recognize that PPI can come in many forms and projects can entail varying degrees of private involvement. Indeed, the level of private investment and risk are a function of the PPP contracts that are negotiated between the private and public entities when a project is considered. The main aim of this chapter is to explore these contracting mechanisms and assess the determinants of the extent of private involvement in PPIs in SSA as compared to LMICs. The chapter begins with some background and a synopsis of the existing research. The methodology and data are subsequently outlined, followed by the results and the robustness checks. The chapter then concludes with a discussion of the findings.
Background and related research
In order to maximize the benefits for both the public and private sectors, a number of contracting mechanisms have been devised varying the levels of private investment and risk depending on the expected profitability, the political sensitivity of the specific infrastructure domain and its inherent riskiness (Table 7)23: These range from simple management contracts, where the private entity takes over the management of the state-owned infrastructure facility for a certain period of time but does not commit any of its own capital nor assumes any commercial risk, to full or partial divestiture (or privatization), where the government sells parts or all of the state owned firm to private entities. There are also intermediate arrangements such as greenfields and concessions where the private entity builds a new facility or rehabilitates an existing one with its own capital at its own risk and the infrastructure reverts to the public sector after a period of time.
Table 7 PPI contract types by level of private sector engagement
Contract type Private
management and operation
Private sector assumes full commercial
risk
Private entity commits new investment
capital
Specified contract period
Full or partial private
ownership
Management X X Lease X X X Greenfield X X X X Concession X X X X
Divestiture X X X X Source: Adapted from Kerf and Smith (1996).
23 Table 1 in Appendix H provides the formal definition for each contract type.

53
The empirical evidence on contract choice in public-private agreements is very limited. Two papers have looked directly at the contractual determinants of PPIs. Albalate et al. (undated) use municipal and state data from 1985 to 2008 to explore the extent of private involvement in PPI in the United States, while Hammami et al. (2006) use data from 1990 to 2003 from the World Bank’s PPI database to explore the same question in the context of developing countries. The papers adopt a similar approach whereby they assign an ordered categorical value to each contract type based on the extent of private participation (i.e., lowest value for a management contract and highest value for full divestiture) and use an ordered multinomial logistic model to investigate the impact of economic, fiscal, political, and infrastructure-type variables on the degree of private participation.
Both papers find that low fiscal performance (e.g., high levels of public debt) is positively associated with a higher degree of private participation. However, most likely due to the different settings, the findings differ somewhat when it comes to the most important determinants. Albalate et al. (undated) find that the most important determinants are infrastructure related variables – in particular whether or not the infrastructure is part of a network, while Hammami et al. (2006) find that it is the rule of law. Indeed, in the case of Albalate et al. (undated) private involvement is less pronounced for infrastructure with network characteristics (e.g., water, road and railroad transportation) relative to those that do not have network characteristics (e.g., ports, airports, housing facilities). They hypothesize that this may be due to the fact that network infrastructure is associated with large sunk investments, as well as larger transaction costs and lower levels of competition. In contrast, Hammami et al. (2006) find that in the context of developing countries, the rule of law (proxied by the control of corruption and common law origin) is an important driver of the extent of PPI. They suggest that investor protection is important to attract PPI and that in general common law systems tend to do better in that respect. Similarly, they hypothesize that control of corruption is important for private investors as it protects them from “opportunistic behavior associated with corrupt government officials” (p. 18). This chapter adds to the existing knowledgebase by extending the analysis period to 2008, but most importantly by exploring how PPIs work in the context of SSA.
Methodology
Following the literature, the dependent variable, contracttype, is first constructed from project-level data by assigning an ordinal variable ranking to the contract type based on four categories of increasing levels of private involvement. Effectively, management and lease contracts24 are assigned a value of 1, greenfield projects a value of 2, concessions a value of 3, and divestitures a value of 4. An important caveat is that in reality, because contracts are
24 Management and lease contracts are aggregated into one category because of the relatively low numbers of such contracts.

54
negotiated on a case-by-case basis, the extent of private participation within each of these contract types is not uniform and the difference in the level of private involvement between each category of contracts is also not equal - that is, the difference in the level of private involvement in a management and a lease contract is not the same as the difference between a lease and greenfield contract.
In terms of explanatory variables, along the same logic applied in the previous chapter, three groups of independent variables are identified such that X represents the factors influencing government motivations, Y the factors influencing private sector motivations, and Z the factors influencing the enabling environment. In addition, following the findings of Albalate et al. (undated) that the infrastructure sectors themselves could be important determinants of the extent of private participation in infrastructure, sector-level dummies, S, are introduced as potential explanatory variables in the model.
For the specification of the model an ordered logit model is used due to the nature of the dependent variable. Thus, as described in Model 3 below, the specified regression estimates how country-level characteristics such as government fiscal stance, political and business environment, and market size, as well as the type of infrastructure project affects the level of private involvement in each PPI. To ensure robustness of results, a similar procedure to the one conducted in the previous chapter is followed: Time fixed effects are introduced to control for time-specific shocks, as are country-level controls to minimize the potential for omitted variable bias. Furthermore, potential multicollinearity is addressed by excluding collinear variables from the model, and in the robustness checks for the SSA regressions, South Africa is excluded as it represents a potential outlier.
Model 3:
Data
Extent of private participation in infrastructure
The dependent variable, contracttype, is constructed using the information on the contractual arrangements of each project available from the World Bank’s PPI database. In looking at the data, for the whole set of LMICs, the majority—over 60 percent of the PPI contracts negotiated between 1995 and 2008 have been greenfield projects, followed by divestitures (23 percent). Conversely, management and lease contracts represented only about 3 percent of the contracts, while concessions represented 13 percent. Projects in SSA are similarly distributed, although greenfield projects are even more prominent (77 percent all of PPI) while concessions and divestitures are not utilized as much (Figure 5).
nittnititititnit SZYXpeContractty 3210

55
Figure 5 PPI contracts negotiated in LMICs and SSA 1995-2008 (% of all PPI contracts)
When taking into account the infrastructure sector in which the project is undertaken, the
data suggests the contractual arrangements noticeably vary. Indeed, as shown in Table 8 , both LMICs in general and SSA in particular, use greenfield and divestiture contracts predominantly for telecommunication projects, concessions for transport, and management and lease contracts for water &sanitation projects. Where SSA differs from LMICs is in energy projects: On average 52 percent of all divestitures negotiated in LMICs were in the energy sector while that number was only 5.6 percent in SSA.
Table 8 PPI contracts negotiated in LMICs and SSA by sector 1995-2008 (% of all PPI contracts)
Management
and lease Concession Greenfield Divestiture
Energy LMICs 12.68 11.26 20.79 52.33 SSA 19.57 27.16 7.21 5.65
Telecom LMICs 6.57 2.18 67.46 41.77 SSA 6.52 0.00 91.02 92.74
Transport LMICs 25.35 62.54 6.84 3.88 SSA 23.91 70.37 1.54 1.61
Water & sanitation
LMICs 55.40 24.03 4.91 2.02 SSA 50.00 2.47 0.24 0.00
Explanatory variables
As described in the methodology section, the independent variables included in the model are the same as those used to explore the determinants of PPI in Chapter 4. The list of variables, their definitions, and their sources are provided in Appendix E.
313
62
23
4 7
77
11
0
20
40
60
80
100
Managementandlease
Concession Greenfield Divestiture
LMICs
SSA

56
Results
The full results are provided in Appendix I. Here I discuss the results with respect to the model that accounts for multicollinearity. The most salient finding for both LMICs and SSA is that the type of infrastructure sector that is receiving the private funds is the largest predictor of the extent of PPI. For LMICs, if the project is in energy and telecommunication (compared to water &sanitation) the odds that the contracting arrangement is a divestiture versus the combined other contractual mechanisms are respectively 59 and 34 times higher. The numbers are even more pronounced for SSA countries – the odds that the contracting arrangement is a divestiture versus the combined other contractual mechanisms is 7,739 times higher for a telecommunication project, 352 times higher for an energy project, and 45 times higher for a transportation project as compared to projects in water &sanitation. Of note, on average for LMICs, the extent of PPI is not significantly different between transportation and water &sanitation (Tables 9 and 10).
The other variables that appear to explain the extent of PPI in SSA countries are quite different from those in LMICs. For the latter, the availability of domestic credit, a larger market size, and the reduced overall burden of regulation and efficiency of government in the regulatory process are positively associated with increased private involvement, while being a common law country, having a smaller government, and higher levels of inflation are associated with less private involvement. In contrast, for SSA, countries with larger service sectors (as a percentage of GDP) are more likely to use PPP contracts with greater private involvement, while countries with larger resource rents (as a percentage of GDP) are more likely to have higher public involvement in PPPs in infrastructure (Tables 8 and 9).
Table 9 Determinants of the extent of PPI- LMICs
odds ratio government size 0.987***
(-5.5)
ln (population) 1.09** (-2.70)
ln (domestic credit) 1.24***
(4.16)
common law 0.572*** (-6.49)
business freedom 1.014*** (3.93)
inflation 0.998* (-2.29)
energy 59.306*** (32.14)

57
telecom 33.681*** (27.85)
N 6521 Notes: (1) t statistics in parentheses * p<0.05, ** p<0.01, *** p<0.001 (2) Only significant explanatory variables are shown. Other independent variables included in the model are: Amount of aid received (% of gross capital formation), value added of services, industry, and agriculture (% of GDP), natural resource rents (% of GDP), regime duration (in years), dummy variable indicating whether the country is a democracy, level of ethnic fractionalization, dummy indicating if the country is undergoing a civil war, the country’s openness to international trade (measured as trade as a % of GDP), and a dummy variable indicated that the infrastructure project is in transportation. (3) Water &sanitation is the excluded dummy against which the other infrastructure sectors are compared. (4) Year fixed effects are included in the model but not shown here.
Table 10 Determinants of the extent of PPI- SSA
odds ratio ln (services) 9.925**
(2.50)
ln (resource rents) 0.654**
(-2.90)
energy 351.664*** (7.47)
telecom 7739.439*** (11.06)
transport 45.2957***
(5.21)
N 602 Notes: (1) t statistics in parentheses * p<0.05, ** p<0.01, *** p<0.001 (2) Only significant explanatory variables are shown. Other independent variables included in the model are: Government size index, amount of aid received (% of gross capital formation), value added of industry, and agriculture (% of GDP), freedom from corruption index, fiscal freedom index, availability of domestic credit, regime duration (in years), dummy variable indicating whether the country is a democracy, level of ethnic fractionalization, dummy indicating if the country is undergoing a civil war, dummy indicating whether the country follows common law traditions, level of inflation in consumer prices, and the country’s openness to international trade (measured as trade as a percentage of GDP, (3) Water &sanitation is the excluded dummy against which the other infrastructure sectors are compared. (4) Year fixed effects are included in the model but not shown here.
Robustness checks
As in Chapter 4, alternative specifications are estimated to check the robustness of the results obtained above. Given that the explanatory variables included in model 3 are the same as those used in models 1 and 2 in the previous chapter, the alternative specifications explored here are

58
the same with the starting point being the model which accounts for multicollinearity. The models used for robustness checks are as follows:
Regression (1): Indicators of structural aspects of the country’s economy (value added of services, industry, and agriculture) and the level of aid received are substituted with the GDP per capita.
Regression (2): In addition to substitutions made in (1), the indices of business and investment freedom are dropped, and the index of property rights protection from the IEF is added.
Regression (3): The indicators for civil war, regime durability, and ethnic fractionalization are replaced by the WGI’s index for political stability and absence of violence, and the indices for business and investment freedom, and freedom from corruption are replaced by the WGI’s government effectiveness, regulatory quality, and rule of law, and control of corruption indices.
Regressions (4) and (5): I use alternative political stability measures in each regression. In (4), I replace political stability measures from the “streamlined model” (civil war, regime durability, and ethnic fractionalization) with the US State Department’s Political Terror Scale (PTS) measure of political violence and terror. In (5), I replace them with the WGI political stability and absence of violence index.
Regression (6): I substitute the business and investment freedom indices with an overall quality of government index from the International Country Risk Guide (ICRG).
Regression (7): For the SSA regressions, I run the streamlined model without South Africa.
In general, the robustness checks support the findings with some exceptions. For LMICs, in all the specifications, the sectoral dummies for energy and telecommunications remain significant and positively associated with higher levels of private involvement. Likewise, for SSA, the sectoral dummies for energy, telecommunications, and transportation remain significant across most specifications.25 In addition, for LMICs, smaller government size, being a common law country, and having a higher inflation remain significantly and negatively associated with higher levels of private involvement, while greater availability of domestic credit and reduced overall burden of regulation and efficiency of government remain significantly and positively associated with higher levels of private involvement across all alternate specifications. The latter finding is further corroborated by the fact that the WGI rule of law indicator is
25 When excluding South Africa from the SSA sample, because of the small sample size, the base sector was changed from water and sanitation to energy in order to be able to achieve convergence. This changed the results slightly in that relative to energy, the telecommunications sector is still positively and significantly associated with higher levels of private involvement but the transportation sector is negatively and significantly associated with higher levels of private involvement. The water and sanitation sector is negatively associated but insignificantly so. This may be due to the fact that all but one of the 21 projects are under lease and management contracts.

59
significantly correlated with higher levels of private involvement. For SSA, the only variable that stays consistently significant (and negatively) across most specifications is the level of resource rents of the country.
The robustness checks, however, suggest that some of the variables identified earlier as potentially important determinants of the extent of PPI may not be as relevant. For LMICs, the market size (as measured by population and GDP per capita) only comes out as being significantly correlated with the contract type in two out of the six alternative specifications. Likewise for SSA, the share of services in the economy is significantly correlated with the contract type in only one regression – the one where South Africa is excluded.
Conversely, the robustness checks identify potentially important determinants that did not come out as significant in the initial regressions, particularly for LMICs. In five out of the six alternative specifications, openness to trade is significantly and negatively correlated with higher levels of private involvement. Furthermore, where included, higher levels of investment freedom, i.e., lower levels of constraints on investment capital flows, is positively correlated with higher levels of private involvement, but the coefficient estimates remain very low (odds ratios of 1.005 and 1.01) suggesting that the impact (if any) is small.
Discussion
The findings of this chapter corroborate the overall findings in the literature. Indeed, as Albalate et al. (undated) found in the US, infrastructure sectors are the strongest determinants of the contractual mechanisms used for PPI throughout the developing world, with telecommunications and energy sectors having higher levels of private involvement in all LMICs, and transportation in SSA, and water&sanitation having the least amount of private involvement. In the next chapter, these sectoral aspects of contractual mechanisms will be explored in more detail. In short however, the infrastructure sector is an important determinant of the extent of private involvement as different sectors present different levels of market failures, which necessitate government intervention in the provision of infrastructure.
The robustness checks also validate the Hammami et al. (2006) findings that rule of law is an important determinant of the extent of private involvement in PPPs for infrastructure in developing countries. However, in contrast to Hammami et al. (2006), my results suggest that relative to non-common law countries, common law countries have lower levels of private involvement. This is nevertheless consistent with the findings in Chapter 4 that common law countries receive on average less PPI than non-common law countries.
Other important findings emerging from the analysis include that on average for LMICs the availability of domestic credit, reduced burden of regulation and more efficient governments, and lower inflation are associated with higher levels of private involvement in PPPs for infrastructure. Further, smaller governments are negatively associated with higher levels of

60
private involvement, perhaps suggesting that larger governments are more adept at negotiating PPP contracts where the private entity takes on more risk and invests more.
None of these variables, however, seem to matter when looking at SSA countries separately. Besides the sectoral distribution of projects, the only other factor that appeared to affect the extent of private involvement in PPPs is the amount of resource rents that the government receives; the higher the amount of resource rents, the lower the level of private involvement. This may be because the more resource endowed SSA countries have the means to invest public resources in large infrastructure projects and therefore prefer to engage the private sector for the management expertise rather than for the capital investments.

61
6. Determinants of the Optimal Contract
The main finding of the previous chapter is that the extent of private participation in infrastructure in developing countries, as manifested in the various contracting mechanisms of PPPs, is largely determined by the characteristics of the infrastructure sector itself. Historically, infrastructure services have been provided by the public sector because they present some form of market failure. The relatively recent participation of the private sector provides some advantages (e.g., additional financing, management expertise, production efficiency and self-sustainability of infrastructure facilities) and, in theory, the contractual mechanisms employed to enable PPIs should overcome the market failures associated with infrastructure sectors allowing for the optimal allocation of investment and risk between private and public entities. A well-developed theoretical literature on the broader topic of private delivery of public services generates useful results with respect to what that optimal allocation should be in the context of different types of market failures. However, there is little empirical evidence looking at the country-level determinants of the adoption of the optimal type of contract. The main aim of this chapter is to start looking into this question, and – building on the theoretical literature- empirically explore the country-level factors that affect the adoption of the optimal contract given the inherent market failures of the various infrastructure sectors. The chapter starts by outlining the underlying framework. Subsequently, the data, the empirical estimation methodology, and the results are presented. The chapter then concludes with a discussion of the findings.
Underlying framework
The starting point for the framework is that government intervention is needed where there are market failures. According to Stiglitz (1988) there are at least 8 types of market failures. Gomez-Barroso and Perez-Martinez (2005) categorize these into four groups, three of which I use to build the framework for my analysis. As shown in Table 11, the first group describes market failures related to the attribute of the good, including whether it is a public good26 and whether its production and/or usage generates externalities.27 The second group encompasses market failures related to the competitive state of the market in which the good is produced
26 A pure public good is one that is non-excludible (i.e., one cannot exclude an individual from consuming the good) and non-rivalous (i.e., the consumption of the good by one individual does not reduce the availability for others, or the marginal cost of an additional unit is very low). 27 An externality is an unintended cost or benefit to others generated by an individual’s consumption of a good. The cost/benefit generated by the externality is however not reflected in the price that the individual pays to consume the good.

62
and/or provided, in effect referring to the extent to which the production/provision of the good exhibits natural monopoly features, the presence of adequate competition in the production and/or provision of the good, as well as that of information asymmetries with respect to production costs. The third group denotes market failures associated with society’s valuation of the good, i.e., whether society values access of the good to all regardless of ability to pay. The final group refers to goods that a government chooses to support for macroeconomic reasons (e.g., a government may perceive the production/provision of a good as being critical for growth and can decide to explicitly support its production/provision as the market by itself may not be able to provide enough to achieve the growth rate desired). The type of good can however vary from country to country, and given that the overall aim of this dissertation is to produce generalizable policy recommendations broadly applicable to a number of countries, I will abstract from this last group in my analysis.
Table 11 Types of market failures
Type of failure Description
Inherent characteristic of the good
Public good: The good is non-excludible and non-rivalrous. Externalities: The production and/or usage of the good generates
negative and/or positive externalities.
Market situation Scope for competition: A natural monopoly is required to generate economies of scale.
Information failures: Asymmetric information Existence of providers
Equity considerations Merit good: Society values access for all (regardless of ability to pay)
Macroeconomic reasons
A government may push investment in the provision of specific goods for reasons of influence on economic growth and economic development.
Source: Adapted from Gomez-Barroso and Perez-Martinez (2005).
The infrastructure sectors of interest in this dissertation – telecommunications, power (electricity), transportation, and water &sanitation - display to varying degrees the three types of market failures. In what follows, the theoretical microeconomic literature on managing market failures in terms of the optimal arrangement between private and public entities is reviewed. Subsequently, the market failures exhibited by each of the infrastructure sectors is outlined and compared (in terms of the severity). Then, using the theory, each infrastructure sector is assigned an “optimal” contract type based on the inherent market failures that characterize it.
Economic theory on public sector interventions
In the simplest setup, public ownership is defined as a firm which is run by a government employee (“a bureaucrat”) whose main aim is to maximize social welfare, and private ownership

63
involves a management entity interested in maximizing profit (Vickers and Yarrow 1991). However, the delimitation between public and private ownership is not always clear. As noted by Sappington and Stiglitz (1987), private and public entities can be very similar in terms of how they are organized and how they function: Both have managers (bureaucrat or private manager) responsible to a higher authority—politicians for publicly owned companies and shareholders for privately owned firms—who delegates the responsibility of running the firm to the managers, and therefore gives them the ability to influence the day-to-day operation of the firm. As such, the critical differentiation between a public firm and a private one is that under public ownership, the government can intervene in production decisions directly if it deems it necessary, but can only do so in a limited fashion under private ownership through regulation. Thus, the difference lies in the control of residual rights, i.e., the right to make direct decisions concerning the firm which are not included in the initial contract (Hart, Shleifer, and Vishny 1997; Sappington and Stiglitz 1987; Hart 2003).
In their analysis, Sappington and Stiglitz (1987) focus on transaction costs incurred by the government when deciding to intervene. They argue that these costs are lowest under public ownership but this, according to them, entails costs and benefits that have to be weighed against each other before deciding on the optimal ownership structure. In their model, the government weights between achieving economic efficiency in production (i.e., productive efficiency) and equity in allocation of goods (i.e., allocative efficiency). In the ideal setting where firms are risk neutral and competition in bidding is developed, even under asymmetric information on production costs between the government and firms (where all firms have full knowledge on the least costly production technology and the government does not), privatization is optimal. However, when one introduces firm risk-aversion and limited competition, the government would have to pay a risk premium to the firms and absorb some of the risk, which may in-turn reduce firms’ incentives to produce efficiently. In addition, paying a risk premium may incentivize less risk-averse firms to bid for the work rather than the most efficient. Depending on the risk premium, it may therefore be optimal to have public ownership.
Rather than transaction costs, Hart et al. (1997) and Hart (2003) focus on the role of incomplete contracts in determining whether to privatize or not. In their framework, the allocation of residual control rights serves as an incentive for private entities to produce efficiently in the presence of moral hazard and adverse selection. They develop a model where the government can either own a facility and contract with an employee to manage it or can contract with a firm to run the facility. In addition, the employee and the firm can either invest in quality-improving and efficiency-enhancing ideas or cut costs which in-turn reduces the quality of services provided. Hart et al. (1997) and Hart (2003) argue that the bureaucrat does not have an incentive to do either because first, he/she would need approval to implement the investment (since the government retains the residual rights over the facility) and second, the employee would get very little in return in terms of increased compensation because he/she is replaceable. In contrast, the firm could be incentivized through the transfer of residual rights to do either.

64
Indeed with residual rights, the firm would not need approval from the government and would gain from cutting costs or could be incentivized to invest in quality-enhancing ideas by negotiating a higher price for the service with the government. The authors conclude that private ownership is preferable in areas where quality innovations are important, where quality benchmarks can be negotiated and contracted on (or the market is competitive enough to provide quality-enhancements), and where patronage inside the government is strong. In contrast, public ownership is desirable when quality is non-contractible or unimportant and where corruption in government procurement is a problem.
The theoretical literature also investigates the optimal contracting mechanism taking into account the nature of the public good in terms of how “pure” it is (i.e., non-excludability and non-rivalry of benefits). Besley and Ghatak (2001) suggest that under incomplete contracts, ownership should lie with the party that has a relatively higher value for benefits generated by the public good (i.e., “the party that cares most about the project”). Francesconi and Muthoo (2004) find a similar result but also find that the valuation of the public good is a function of how pure the good is. Further, as in Hart et al. (1997) and Hart (2003), they find that the optimal ownership allocation is a function of the level of innovation required (what they call “technology structure”) for the public good.
Market failures of infrastructure sectors
Inherent characteristic of the good All four sectors exhibit some characteristics of a public good and can be ranked on a
spectrum from pure private to pure public good (Figure 6). The telecommunications and electricity sectors are closest to private goods, while transportation and water & sanitation have relatively more public goods features. Government intervention is further justified because each of these sectors generate externalities (both positive and negative), albeit at varying degrees.
The literature has generally described the telecommunications and electricity as “mixed” goods (e.g. Gomez-Barroso and Feijoo 2010; Jaccard 1995) on the premise that access is excludable but use is non-rivalrous. In terms of externalities, telecommunications is associated with significant positive externalities; as individuals obtain access, the network of connected individuals expands, in turn making the network more valuable to the individuals already using the product as well as those thinking about joining (Gomez-Barroso and Perez-Martinez 2005; Gomez-Barroso and Feijoo 2010; Economides and Himmelberg 1995). While electricity is equally associated with some positive externalities (e.g., hydroelectric generation provides for irrigation and flood control), its generation has overwhelmingly negative environmental externalities. For example, hydroelectric dams negatively affect the aquatic ecosystems, hydroelectric reservoirs can flood large land areas and destroy wildlife habitats and agricultural land, combustion fossil fuels are associated with air pollution, and nuclear power plants are associated with safety concerns (Kessides 2004, Jaccard 1995). The extent of the externalities of

65
electricity as compared to telecommunications suggest a larger role for government in electricity, thus electricity is ranked more “public” than telecommunications.
While most countries only recognize water use rights and not private water ownership rights, water & sanitation as a network infrastructure is both excludible and rivalrous (Kessides 2004, Roger et al. 2002, Jooste 2008). However, it is associated with significant externalities (both positive and negative), providing a strong rationale for government intervention. Indeed, water supply is location specific and limited; as such sustainability of water resources is an important consideration. At the same time, water &sanitation infrastructure is associated with improved health and wellbeing (from access to greater quantities and better quality water as well as improved sanitation), time savings (i.e., individuals no longer have to spend time collecting water), and increased economic activity with greater access of water for activities such as livestock rearing and vegetable production (Jooste 2008, Rijsberman and Zwane 2008).
Transportation infrastructure has traditionally been considered a public good in that it is mostly non-excludible and non-rivalous. There are however noted exceptions; for example, a toll road is excludible while a congested road is rivalrous. Similarly to the other sectors, it is also associated with externalities. For example, road infrastructure is associated with positive externalities such as the development of the area around the road, as well as a number of negative externalities including air and noise pollution, accidents, congestion, and safety and/or social issues during construction (Jimenez 1995, Amos 2004).
Figure 6 Infrastructure sectors along the private to pure public good continuum
Market situation Two facets of the market failures have to be considered. The first has to do with the structure
of the sector itself in terms of the scope for competition in the provision of the good. The second is related to procurement and the level of competition among potential suppliers/operators to produce the good (i.e., potential private sector bidders).
For the first facet, a common feature among the four sectors is the scope for large economies of scale from market concentration. However, the degree to which it constrains competition differs across sectors and also “within” sectors, as many of these sectors have components which have natural monopoly features and others that are more favorable to competition (Kessides
Telecom
Electricity
Water&sanitation
Transport
Pure public
good
Pure private
good

66
2004). Again here, the four infrastructure sectors can be placed on a continuum from competitive market structure to natural monopoly (Figure 7).
While parts of the network still have natural monopoly features, the telecommunications sector is the most conducive to competition among all the sectors. Over the years due to technological innovation, the sector has become even more favorable to competition; according to Kessides (2004) “innovations have radically altered the industry’s cost structure and resulted in large, continuous increases in productivity.(…) Technological change has almost eliminated the natural monopoly in interexchange markets” (p. 39). Similarly, technological advancements have enabled more scope for competition in parts of the electricity network, in particular for generation (e.g., thermal generation). Nevertheless, certain forms of generation (e.g., hydroelectric and nuclear) remain natural monopolies. In addition, transmission and distribution maintain their natural monopoly features as electricity is expensive to store and electricity rights transmissions are difficult to define (Rosellón 2003). For transportation, the building of infrastructure facilities has natural monopolistic features but the operation of the physical network is more conducive to competition, especially in the presence of intermodal competition28 (Kessides 2004). Water & sanitation has the least scope for competition as most of the functions along the water delivery and waste disposal “chain” have natural monopolistic features (Rees 1998, Kessides 2004).
Figure 7 Scope for competition in infrastructure sectors
For the second facet, the barriers to potential new entrants as well as the number of potential
suppliers are important considerations (Figure 8). All four of the sectors are associated with large fixed costs upfront (sunk costs) and thus present substantial risks to potential new entrants in the market, but, as stated in the previous paragraph, technological advancements in telecommunications and power generation industries are reducing those costs substantially (Kessides 2004). The level of private firm concentration for the provision of infrastructure services is also of concern, particularly in the transportation and water & sanitation sectors. Estache and Serebrisky (2004) note that for transportation projects in developing countries the competition is very limited; for example, there are typically only about two to three serious bidders for concessions or greenfield projects. Similarly, for water & sanitation, four large
28 Refers to competition among the different types of transportation; e.g. trucking versus freight or railways.
Telecom
Electricity
Transport
Water&sanitation
Natural
monopoly
Competitive
market
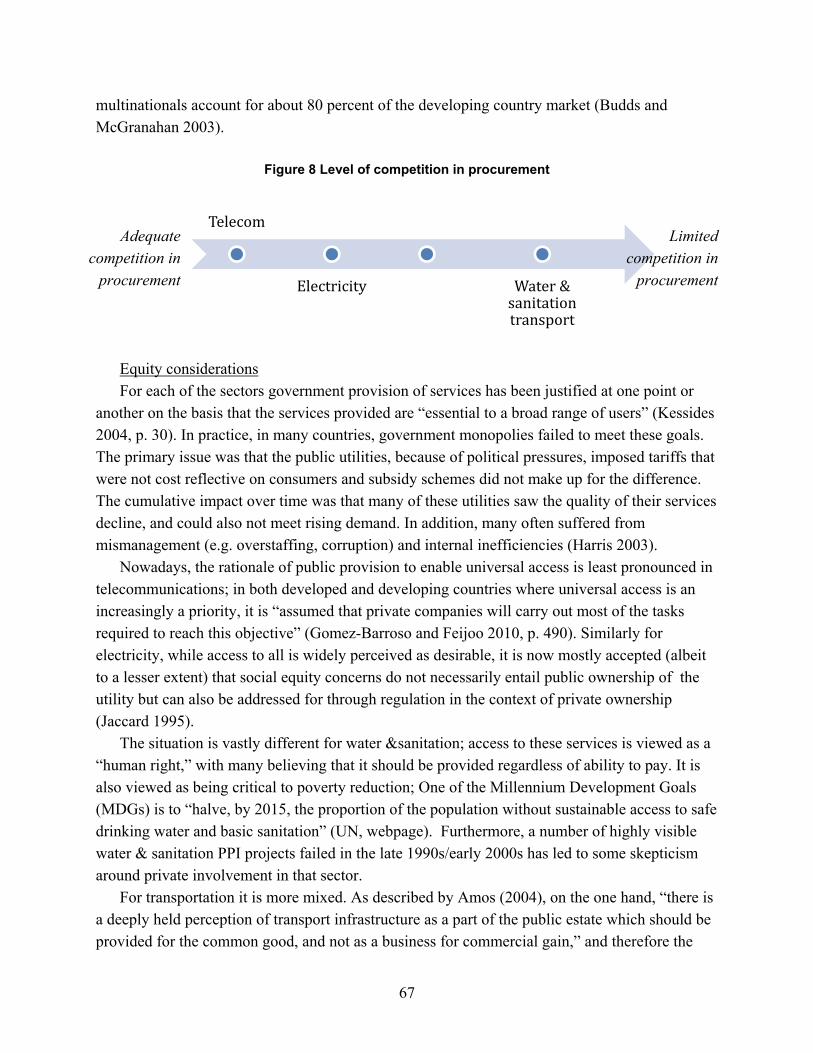
67
multinationals account for about 80 percent of the developing country market (Budds and McGranahan 2003).
Figure 8 Level of competition in procurement
Equity considerations For each of the sectors government provision of services has been justified at one point or
another on the basis that the services provided are “essential to a broad range of users” (Kessides 2004, p. 30). In practice, in many countries, government monopolies failed to meet these goals. The primary issue was that the public utilities, because of political pressures, imposed tariffs that were not cost reflective on consumers and subsidy schemes did not make up for the difference. The cumulative impact over time was that many of these utilities saw the quality of their services decline, and could also not meet rising demand. In addition, many often suffered from mismanagement (e.g. overstaffing, corruption) and internal inefficiencies (Harris 2003).
Nowadays, the rationale of public provision to enable universal access is least pronounced in telecommunications; in both developed and developing countries where universal access is an increasingly a priority, it is “assumed that private companies will carry out most of the tasks required to reach this objective” (Gomez-Barroso and Feijoo 2010, p. 490). Similarly for electricity, while access to all is widely perceived as desirable, it is now mostly accepted (albeit to a lesser extent) that social equity concerns do not necessarily entail public ownership of the utility but can also be addressed for through regulation in the context of private ownership (Jaccard 1995).
The situation is vastly different for water &sanitation; access to these services is viewed as a “human right,” with many believing that it should be provided regardless of ability to pay. It is also viewed as being critical to poverty reduction; One of the Millennium Development Goals (MDGs) is to “halve, by 2015, the proportion of the population without sustainable access to safe drinking water and basic sanitation” (UN, webpage). Furthermore, a number of highly visible water & sanitation PPI projects failed in the late 1990s/early 2000s has led to some skepticism around private involvement in that sector.
For transportation it is more mixed. As described by Amos (2004), on the one hand, “there is a deeply held perception of transport infrastructure as a part of the public estate which should be provided for the common good, and not as a business for commercial gain,” and therefore the
Telecom
Electricity Water&sanitationtransport
Limited competition in
procurement
Adequate competition in
procurement

68
majority of the basic infrastructure is publicly owned and operated across the world, but on the other hand, the private sector is “widely involved as designers and contractors, for both construction and maintenance” (p.4 - 5).
Figure 9 Level to which public provision of services is important for equity reasons
Optimal contracts suggested by theory
Bringing together the market failures in each of the infrastructure sectors and microeconomic theory on optimal contracting, I match the individual sectors with the respective “optimal” contract. According to the analysis of the degree of market failures in each infrastructure sector above, I find that the telecommunications sector exhibits the least need for public intervention/procurement, followed by the electricity sector. Transportation as well as water & sanitation on the other hand call for more public sector involvement due to the public sensitivity and perception when it comes to equity considerations, the significant externalities, and the limited competition in contracting. The optimal private participation for each of these sectors would thus suggest different contractual arrangements.
Effectively, given the relatively minor need for government intervention (beyond regulation), divestiture seems to be the most appropriate for telecommunications. With respect to electricity concession or greenfield arrangement s (e.g. ROT, BOT type contracts) may be more appropriate, as temporary “privatization” could soothe public concerns around equity issues, and substantial amounts of private capital can be mobilized to ensure the expansion of the power generation facilities and the distribution of the network (in particular with a greenfield arrangements). Transportation- particularly the building of the facilities- and water &sanitation seem to be the sectors that require the most government intervention. Therefore keeping the ownership rights with the government and having private entities take on the management risk seems optimal as such an arrangement could bring to bear private sector management expertise to the project (which is often missing in the public domain in SSA countries), while ensuring that equity concerns are addressed by the public sector (e.g., public investment in new networks to expand access).
Telecom
Electricity
Transport
Water&sanitation
Public provision is
important for
equity reasons
Public provision is not important for
equity reasons
69
It is important to note that a whole host of other considerations should be taken into account when deciding on the “optimal” contracting for a PPI project. The capacity to manage complex contracting mechanisms as well as experience with different types of mechanisms for example could affect what is considered “optimal.” However, these are issues that require a country-specific analysis which is outside the scope of this dissertation. Thus, this analysis is intended to provide a starting point to the exploration of these issues and should inform future research efforts in this complex issue.
Data
The project level World Bank PPI data indicate that in practice developing countries do not adopt “optimal” contracts. Indeed, between 1995 and 2008, about 54 percent of the PPI contracts negotiated in the electricity sector in developing countries were in the “optimal” contract form. For telecommunications and water &sanitation, it was approximately 19 and 18 percent respectively, while for transportation it was only about 4.72 percent. As elaborated in Chapter 5, greenfield contracts tend to dominate (62 percent of all PPI contracts). However, when exploring the sectoral breakdown (Figure 10), we see that greenfields dominate mostly in telecommunications, while for electricity projects the amount of greenfield contracts is almost equal to the amount of divestitures, for water &sanitation projects it is almost equal to the amount of concessions, and for transportation, concession contracts are actually the dominant form of contracting. The SSA specific data also indicates some potential differences across developing regions. Particularly for water &sanitation, SSA countries are adopting more “optimal” contracts in that management and lease contracts are used almost exclusively. These countries are also using more greenfield contracts and less divestiture for electricity projects (Figure 10).

70
Figure 10 Types of PPI contracts negotiated in LMICs by sector 1995-2008 (% of all PPI contracts)
Methodology
Using the project level World Bank PPI data, a binary dependent variable— Optimal— is first created for each project to indicate whether or not the specific project is in the optimal type of contract. In effect, the variable takes a value of 1 if the project uses the optimal contracting mechanism and zero otherwise, and a logit regression is used to estimate the model. In terms of potential determinants of the adoption of the optimal contract, similarly to what was done in Chapters 4 and 5, and as described in Model 4 below, three groups are identified such that X represents the factors influencing government motivations, Y the factors influencing private sector motivations, and Z the factors influencing the enabling environment. In addition, a dummy variable identifying the developing region in which the project is located (East Asia and Pacific, South Asia, Europe and Central Asia, Sub-Saharan Africa, and the Middle East and North Africa) is added in order to see how the developing regions compare to each other. To ensure robustness of results, time fixed effects and country-level controls are also introduced, and several alternative specifications are estimated in order to control for potential multicollinearity in the model.
Model 4:
0
10
20
30
40
50
60
70
80
90
100
LMIC SSA LMIC SSA LMIC SSA LMIC SSA
Telecom Energy Transport Waterandsanitation
ManagementandleaseConcessionGreenfieldDivestiture
nittnitititititn RZYXOptimal 43210

71
Results
Tables 1- 3 in Appendix K provide the results respectively for the telecommunications, electricity, and water &sanitation sectors. Because of a small number of projects in the “optimal” contract type for transportation (N=54 for a total of 1,145 transportation projects), the estimations did not yield meaningful results and are therefore not discussed here. For the other sectors, the explanatory variables that are significantly correlated with the optimal contract type across most of the specifications are reported in Table 12 below.
In effect, developing countries with greater availability of domestic credit to the private sector are significantly more likely to adopt divestitures for PPI in telecommunications, while countries with smaller government expenditures, those more open to trade, and those experiencing inflation are significantly less likely to adopt divestitures. For electricity, the presence of inflation actually works in the opposite direction: Countries experiencing inflation are more likely to adopt concessions or greenfield contracts. Population size and the regulatory burden also appear to matter: Countries with larger populations are significantly less likely to adopt concessions or greenfields, as are countries with larger regulatory burden and less efficient governments. For water &sanitation, the most salient explanatory variables are the political regime duration (i.e., the number of years since the most recent regime change or the end of transition period) and the freedom from corruption. The former is significantly and positively correlated with adopting a lease and management contract while the latter is significantly and negatively correlated with the adoption of a lease and management contract.
Table 12 Summary of results
Sector Significant and positive impact on
the adoption of the “optimal” contract
Significant and negative impact on the adoption of the “optimal”
contract
Telecommunications
Availability of domestic credit Smaller government
Presence of inflation
Trade openness
Electricity
Presence of inflation Large market size(as measured by population size)
Overall burden of regulation and efficiency of government in the
regulatory process (as measured by the index of business freedom and
regulatory quality index)
Water &sanitation Regime duration Freedom from corruption

72
When comparing developing regions, relative to Latin America and the Caribbean - the continent with the most experience with PPIs- South Asian countries are significantly less likely to negotiate divestitures for telecommunications. For electricity projects, South Asia, Sub-Saharan Africa, and the Middle East and North Africa are significantly more likely to negotiate concessions or greenfields, while Europe and Central Asian countries are significantly less likely to adopt these contractual forms. Furthermore, South Asia and Sub-Saharan Africa are significantly more likely to adopt management and lease contracts for water &sanitation projects.
Discussion
For the interpretation of the results it is important to note that the actual distribution of contract types across the infrastructure sectors is fairly dichotomous (see Figure 10): In the telecommunications sector, 97 percent of the negotiated contracts are either greenfields or divestitures, in electricity 99 percent are either divestitures or greenfields/concessions, and in water &sanitation 94 percent are either greenfields/concessions or management and lease contracts. Thus, the results of the empirical estimations provide insights on the determinants of the contract type that dominates and is not optimal. So, for example, one of the findings is that countries more open to trade are significantly less likely to privatize their telecommunications infrastructure, and because of the distribution of the contract types for telecommunications, this also means that open countries are significantly more likely to negotiate greenfield projects.
For telecommunications, the results indicate that the availability of domestic credit for the private sector is an important determinant of divestitures (over greenfields/concessions). This may be due to the fact that under divestitures the private entity purchases all or parts of the public utility, which requires substantial resources upfront. Conversely, the presence of inflation is significantly associated with the adoption of greenfields/concessions over divestitures. This may be a function of private sector preferences; indeed, there is some evidence that in riskier environments, BOT type contracts tend to be attractive in that they are more flexible than divestitures, and risks can be allocated in a variety of ways between private and public entities (Guislain and Kerf 1995). Another result is that smaller governments are significantly more likely to negotiate greenfields/concessions. While it is not immediately clear why that is, one hypothesis is that smaller countries may have traditionally not invested as much in telecommunications infrastructure, and therefore prefer to negotiate greenfield projects rather than divestitures as greenfield projects give them the ability to contract-in the types of new investments desired. The aforementioned result that less open countries are significantly more likely to divest their telecommunications infrastructure is counterintuitive and would require more research. Especially in light of evidence suggesting that when investing in foreign countries, multinational firms prefer to engage in BOT-type contracts rather than divestitures in culturally remote countries, i.e., countries with different values systems from that of the home

73
country of the investing firm (Barkema and Vermeulen 1998).29 Consequently, one would expect more telecommunications divestitures in more open countries, given that the majority of PPI in developing countries comes from multinational firms, and while cultural distance is not necessarily equal to restricted trade flows, the argument could be made that extensive international trade and participation in globalization align – at least with respect to business practices – the value systems or create at some familiarity with a foreign approach through experience in trade.
For electricity, as in telecommunications, the presence of inflation is significantly correlated with negotiating concessions/greenfields over divestitures. Conversely countries with a large market size are more likely to divest their electricity related infrastructure, reflecting the attractiveness of a large market for the private sector. Furthermore, countries with larger regulatory burdens and less efficient governments are more likely to negotiate divestitures. This is perhaps due to the complexity of the electricity market, making the negotiation of a BOT or ROT type contracts difficult in the sector.
For the water &sanitation sector, the results suggest that longer government tenure is significantly associated with management and lease contracts. This is likely reflective of the fact that such contracts require the public and private sectors to work closely with each other during a specified amount of time (usually three to five years). The results also indicate that corrupt governments are significantly more likely to adopt management and lease contracts over greenfields/concessions. It is not clear why that is but it is somewhat concerning given that this suggests that the adoption of the optimal contract is driven by an undesirable country characteristic.
The framework provided here is simple but provides a starting point for future research. There are a number of avenues in which the framework can be expanded. For example, the last point on corruption, and more generally the political aspect of PPI, is one area of possible expansion. There is some theoretical literature exploring this. For example, Shapiro and Willig (1990) highlight the political perspective of the private versus public ownership debate. In their model, the public firm is ran by a bureaucrat who would like to maximize social welfare and his own agenda, which can diverge from that of the public if he/she is malevolent (he/she maximizes the weighted average of the two). The private firm in contrast is run by a profit maximizing manager. Under public ownership, since the government has residual rights, a malevolent bureaucrat has full information on cost and can extract rents from having this information. As
29 Cultural remoteness is measured using an index of cultural distance, which was originally developed by Hofstede (1991), cultural distance takes into account five dimensions: (1) Power distance- “the extent to which the less powerful members of institutions and organizations within a country expect and accept that power is distributed unequally,” (2) Uncertainty avoidance— “the extent to which the members of a culture feel threatened by uncertain or unknown situations,” (3) Individualism versus collectivism—the extent to which “societies in which the ties between individuals are loose,” (4) Masculinity versus femininity— the extent to which “societies in which social gender roles are clearly distinct,” and (5) long-term orientation.

74
such, in the presence of a malevolent bureaucrat, private ownership can serve as a way of limiting the information available to him/her.
In sum, the analysis presented in this chapter is exploratory and the main contribution is to provide a framework that sets the stage for future research on the important aspects of optimal contracting in infrastructure finance. The present analysis is constrained by data availability, as well as the lack of granularity on contract types. In parallel further research should go into solidifying the initiated analysis of which contractual mechanisms is the optimal choice. This is in particular important in light of local particularities that might suggest an optimal contract mechanism different from the one suggested by the simplified theory.
75
7. Conclusions and Policy Implications
The main message emerging from this research is that unlike in the past, SSA countries have a more competitive landscape for infrastructure finance through access to a portfolio of possible financing instruments coming from a variety of sources— bilateral, multilateral and the private sector. Given that each instrument is associated with its own benefits and costs, these alternative forms of financing provide real choices for policymakers on the continent. However, in order to make the (societally) optimal choices, policymakers need to understand the range of possible financing sources as well as the tradeoffs associated with them. The main aim of this dissertation was to understand what these different sources are and shed light on the factors that policymakers should take into consideration to ultimately enable policymakers to make the most out of the infrastructure investments.
What are these new sources of infrastructure investment?
The new sources of finance come from both the public and private sectors. On the public side, the emergence of new donor countries, in particular China (and more
recently Brazil and Turkey), has enlarged the number of actors that participate in infrastructure finance on the continent. While the financing instruments used by these are generally closely aligned to those of traditional financiers – i.e., a mix of market-rate and concessional loans as well as grant financing – the delivery of these funds is very different. For one, the guiding philosophy of the new funders articulates the idea of equal partnership and mutual benefit with recipient countries where traditional donors have pursued a more paternalistic rapport. Secondly, the way of doing business varies dramatically in many respects. For example, as opposed to their western counterparts, Chinese agencies typically negotiate vague contracts with recipient governments. While the level of transparency in these negotiations is minimal, the understanding is that the stipulations of these contracts are often open for renegotiation throughout the lifecycle of the investment. In terms of process, traditional financiers typically co-fund infrastructure projects, while Chinese agencies tend to finance the entirety of the project. For recipient governments, this means less coordination among multiple donors (each of whom may have slightly different requirements). Finally, post-construction, China has focused on on-time delivery of the facility in contrast to traditional financiers whose focus has been on efficiency and sustainability of the project.
On the private side, SSA countries are increasingly attracting private funds for infrastructure through public-private partnerships. The analysis in this dissertation shows that this is particularly true for the more developed countries (with larger markets and more developed

76
financial markets) on the continent. Additionally, industrialized countries and those with larger market size and higher consumer ability to pay attract larger amounts of PPI.
Further, private funds for infrastructure are flexible in that for each project, the level of private involvement can be calibrated with respect to the private sector risk assumed and new capital investment committed through the type of PPP agreements negotiated by the public and private entities. In SSA the level of private investment seems to be driven mostly by the type of infrastructure and the amount of resource rents that the government receives; the higher the amount of resource rents, the lower the level of private involvement. The latter suggests that the more resource endowed SSA countries have the means to invest public resources in large infrastructure projects and therefore prefer to engage the private sector for the management expertise rather than for the capital investments. The “optimal” contract type depends partly on the infrastructure sector and the different types of market failures embedded in the production and provision of the good. These are associated with the inherent characteristics of the good (how pure of a public good it is), the competitiveness of the market for its provision, and the extent to which equity of access is viewed as important.
What are the benefits and the risks?
The analysis points to both the benefits and risks of the new sources of infrastructure finance for African policymakers. Arguably one of the biggest advantages of the Chinese funds is that they offer a real alternative to traditional donors. As noted by Woods (2008), “the rise of emerging donors is occurring against a background of disaffection among poor countries with the established development assistance regime.” On the project level, Chinese funded projects are also associated with fewer delays than those funded by traditional financiers. They impose fewer transaction costs, are more predictable, and have lower short-term risks. In terms of disadvantages, Chinese funds are associated with higher long-term costs given the less generous terms, as well as higher long-term risk in that the contracts are not very elaborate and, given the lack of transparency, could entail implicitly a number of costly future commitments such as preferential access to natural resources, or higher debt servicing costs. More systematically, the risks may be that in the context of non-benevolent recipient country policymakers, the lack of transparency as well as the lack of conditionalities around human rights, good governance, environmental and social protection, the availability of Chinese financing may be propelling corrupt governments that may not channel the new funds in a socially optimal way.
For PPI, the key benefits noted in the literature, besides increased access to financing for infrastructure, is access to management expertise, production efficiency and self-sustainability of infrastructure facilities. The risk is that the PPI received is not adequately channeled or does not optimally (from society’s perspective) distribute risks and new capital commitments between the private and public sectors. Indeed, the analysis in this dissertation points to the fact that this may be happening. Higher regulatory burden, lower government efficiency in the

77
regulatory process, as well as higher corruption are positively (and statistically significantly) associated with amounts of PPI received. This finding raises serious concerns that among the SSA countries receiving PPI, the more corrupt and least efficient governments attract larger amounts of PPI. It may be that corruption and weak government efficiency may be promoting large PPI deals with large private gains at the expense of public interest.
What are the policy implications?
The research points to several policy implications for recipient countries primarily but also for the donor countries and private sector stakeholders. For recipient countries, the analysis showed that the diverse sources of public finance are associated with both benefits and costs, and understanding these tradeoffs is important to adopt policies that maximize the gains from the new capital inflows in terms of accelerated economic growth and improved social outcomes. To that effect, a holistic view of infrastructure investments, from the planning to the post-construction stages (as proposed in this dissertation), can help policymakers identify more clearly the factors that should be taken into consideration when evaluating alternatives.
Additionally, the research shows that private sector funds are attainable, and that SSA policymakers can attract positive types of PPI by promoting prudent macroeconomic policies, and implementing policies that are conducive to private sector activities. Nevertheless, it is important for policymakers to recognize that contracting mechanisms for PPI can be complex and that the optimal level of private involvement depends on the infrastructure sector itself and its inherent market failures and the political sensitivities. Thus, it is important for SSA countries to build institutional capacity to select the right type of contract for PPIs, as well as to manage PPPs with private firms, and improve the regulatory process to better regulate the sectors that have newly been received private funds.

78
References
"Gabon's Belinga iron ore deal to be awarded as late as 2014," Reuters Africa, August 30, 2012. As of October 9, 2012: http://af.reuters.com/article/gabonNews/idAFL4E8JU4GN20120830
AFD, "Agence Française du Développement: Loans," 2011. As of April 30, 2013:
http://www.afd.fr/lang/en/home/outils-de-financement-du-developpement/prets
———, "AFD overview 2012-2013," 2012. http://www.afd.fr/webdav/site/afd/shared/PUBLICATIONS/Colonne-droite/Presentation-AFD-VA.pdf
AfDB, "Africa Infrastructure Knowledge Programme (AIKP)." http://www.infrastructureafrica.org
———, "The AfDB in 10: Structure Resources Interventions Impact," Tunis, Tunisia: African Development Bank Group, 2011.
———, "African Development Fund," 2013. As of April 28, 2013:
http://www.afdb.org/en/about-us/african-development-fund-adf/
———, "Nigeria Trust Fund (NTF)," 2013. As of April 28, 2013:
http://www.afdb.org/en/about-us/nigeria-trust-fund-ntf/
———, "Private Sector Development, Bank Group vision," 2013. As of April 28, 2013:
http://www.afdb.org/en/topics-and-sectors/sectors/private-sector-development/bank-group-vision/
———, "African Development Bank Private Sector Operations," Tunis, Tunisia, undated. As of April 28, 2013: http://www.afdb.org/fileadmin/uploads/afdb/Documents/Generic-Documents/OPSM%20booklet%20ANG.pdf
Albalate, D., G. Bel, and R. Geddes, "The determinants of contractual choice for private involvement in infrastructure projects in the United States " Working paper, undated.
Amos, P., Public and Private Sector Roles in the Supply of Transport Infrastructure and Services, Washington, D.C.: World Bank, 2004.
Andrianaivo, M., and C. Yartey, "Understanding the Growth of African Financial Markets," African Development Review, Vol. 22, No. 3, 2010, pp. 394-418.
Asiedu, E., "On the Determinants of Foreign Direct Investment to Developing Countries: Is Africa Different?," World Development, Vol. 30, No. 1, 2002, pp. 107-119.

79
Baldwin, J., and J. Dixon, "Infrastructure Capital: What Is It? Where Is It? How Much of It Is There?," Canadian Productivity Review, 2008.
Banerjee, S.G , J. Oetzel, and R. Ranganathan, "Private Provision of Infrastructure in Emerging Markets: Do Institutions Matter?," Development Policy Review, Vol. 24, No. 2, 2006, pp. 175-202.
Barkema, H., and F. Vermeulen, "International expansion through start-up or through acquisition: a learning perspective," Academy of Management Journal, Vol. 41, No. 1, 1998, pp. 7-26.
Block, S., "Does Africa Grow Differently?," Journal of Development Economics, Vol. 65, No. 2, 2001, pp. 443-467.
BMZ, "Mandate of the Ministry," 2012. As of April 28, 2013:
http://www.bmz.de/en/ministry/mandate/index.html
———, "Approaches: Financial cooperation," 2013. As of April 30, 2013:
Bräutigam, D., China's African aid: Transatlantic challenges, Washington D.C.: German Marshall Fund of the United States, 2008.
———, Chinese Aid and African Development: Exporting Green Revolution, London: Macmillan, 2008.
———, The Dragon's Gift: The Real Story of China in Africa Oxford University Press, 2009.
———, China, Africa and the International Aid Architecture, Washington, D.C., 2010.
———, "Ethiopia's partnership with China- China sees Ethiopia as a land of business opportunities, but the African country remains in charge of any deals," The Guardian, December 30, 2011. As of June 7, 2013: http://www.guardian.co.uk/global-development/poverty-matters/2011/dec/30/china-ethiopia-business-opportunities
Budds, J., and G. McGranahan, "Are the debates on water privatization missing the point? Experiences from Africa, Asia and Latin America," Envirionment and Urbanization, Vol. 15, No. 2, 2003, pp. 87-113.
Canning, D., and P. Pedroni, "Infrastructure, long-run economic growth, and causality tests for cointegrated panels " The Manchester School, Vol. 76, No. 5, 2008, pp. 504–527.
Cheru, F., and C. Obi, eds. The Rise of China and India in Africa: Challenges, Opportunities and Critical Interventions Zed Books, 2010.
Chiang, F, "One-China Policy and Taiwan," Fordham International Law Journal, Vol. 28, No. 1, 2004.

80
China Development Bank, "Mission Statement," November 18, 2012, 2005. http://www.cdb.com.cn/english/Column.asp?ColumnId=99
China EXIM Bank, "The Export-Import Bank of China," 2012. As of November 18, 2012:
http://english.eximbank.gov.cn/profile/intro.shtml
China-Africa Development Fund, "The Company Overview," 2012. As of November 18, 2012:
http://www.cadfund.com/en/NewsInfo.aspx?NId=48
China-Africa Research Center (CAITEC), China-Africa Trade and Economic Relationship Annual Report 2010, Beijing: Chinese Academy of International Trade and Economic Cooperation, Ministry of Commerce (MOFCOM) of the People's Republic of China, 2011. As of November 4, 2012: http://www.focac.org/eng/zxxx/t832788.htm
Christensen, B., China in Africa: A Macroeconomic Perspective, Washington, D.C.: Center for Global Development, 2010.
CIDA, DFID, WBI, and IPRCC, "Workshop report," Managing aid effectively: Lessons for China?, Beijing, March 27-28, 2008.
Corkin, L., C. Burke, and M. Davies, "China’s Role in the Development of Africa’s Infrastructure," SAIS Working Papers in African Studies, No. 04-08, 2008.
Davies, J., "Washington's Growth and Opportunity Act or Beijing's ‘Overarching Brilliance’: will African governments choose neither?," Third World Quarterly, Vol. 32, No. 6, 2011, pp. 1147-1163.
Davies, M., How China delivers development assistance to Africa, Stellenbosch: Centre for Chinese Studies, University of Stellenbosch, 2008.
———, How China is influencing Africa's development, OECD Development Center, 2010.
de Bettignies, J., and T. Ross, "The Economics of Public Private Partnerships," Canadian Public Policy, Vol. 30, No. 2, 2004.
de Renzio, P., L. Whitfield, and I. Bergamaschi, Reforming foreign aid practices: What country ownership is and what donors can do to support it, Oxford, UK: University of Oxford, Global Economic Governance Programme, 2008.
Dubash, N.K., ed. Power Politics: Equity and Environment in Electricity Reform. Washington, D.C.: World Resources Institute, 2002.
Economic Commission for Africa, African Development Bank, and African Union, "Mobilizing Public Financing Infrastructure and Structural Transformation in Africa," paper presented at Forum on Financing for Development: Mobilizing Resources for Economic Transformation in Africa, United Nations Conference Centre, Addis Ababa, Ethiopia, 2011.

81
EIC, EIC Position Paper on the Review of the World Bank’s Procurement Policy and Procedures, Berlin: European International Contractors, September 27, 2012.
Ellmers, B., Helping or hindering? Procurement, tied aid and the use of country systems in Bangladesh, European Network on Debt and Development (EURODAD) 2011.
Escribano, A., J. Guasch, and J. Pena, "Assessing the Impact of Infrastructure Quality on Firm Productivity in Africa-- Cross-Country Comparisons Based on Investment Climate Surveys from 1999 to 2005," Policy Research Working Papers, No. 5191, 2010.
Esfahani, H., and M. Ramirez, "Institutions, infrastructure, and economic growth," Journal of Development Economics, Vol. 70, 2003, pp. 443–477.
Estache, A., and T. Serebrisky, "Where do we stand on transport infrastructure deregulation and public-private partnership?," World Bank Policy Research Working Paper No. 3356, 2004.
Executive Research Associates, China in Africa- A strategic Overview, Institute of Development Economics- Japan External Trade Organization (IDE-JETRO), 2009.
Farooki, M., "The infrastructure and commodities interface in Africa: Time for cautious optimism? ," Journal of International Development, Vol. 24, No. 2, 2012, pp. 208-219.
Fletcher, H., Development Aid for Infrastructure Investment in Africa: Malian Relations with China, the European Commission and the World Bank, South African Institute for International Affairs, 2010.
Flyvbjerg, B., M. Holm, and S. Buhl, "Underestimating Costs in Public Works Projects. Error or Lie?," Journal of the American Planning Association, Vol. 68, No. 3, 2002, pp. 279- 295.
———, M. Holm, and S. Buhl, "What Causes Cost Overrun in Transport Infrastructure Projects?," Transport Reviews, Vol. 24, No. 1, 2004, pp. 3-18.
Foster, V., and C. Briceño-Garmendia, Africa’s Infrastructure: A Time for Transformation, Washington, D.C.: Agence Française de Développement and the World Bank, 2010.
Foster, V., W. Butterfield, and C. Chen, The changing landscape of infrastructure finance in Africa: Non-traditional sources take on a growing role, Washington, D.C.: World Bank Public Private Infrastructure Advisory Facility (PPIAF), 2008.
Foster, V., W. Butterfield, C. Chen, and N. Pushak, Building bridges: China’s growing role as infrastructure financier for Sub-Saharan Africa, Washington, D.C.: The World Bank, Public-Private Infrastructure Advisory Facility (PPIAF), 2009.
Francesconi, M., and A. Muthoo, "An Incomplete Contracting Model of Ownership of Impure Public Goods," University of Essex, 2004.

82
Garnett, H., R. Nayyar-Stone, and S. Pollen, Study on Aid Effectiveness in the Infrastructure Sector: Final Report, Washington, D.C.: Urban Institute Center on International Development and Governance, 2009.
Gómez-Barroso, J.L., and C. Feijóo, "A conceptual framework for public-private interplay in the telecommunications sector," Telecommunications Policy, Vol. 34, No. 9, 2010, pp. 487-495.
Grimm, S., R. Rank, M. McDonald, and E. Schickerling, Transparency of Chinese Aid: An analysis of the published information on Chinese external financial flows, Centre for Chinese Studies at Stellenbosch University and PublishWhatYouFund, 2011.
Grimsey, D., and M. Lewis, "Evaluating the risks of public private partnerships for infrastructure projects," International Journal of Project Management, Vol. 20, No. 2, 2002, pp. 107–118.
Guislain, P., and M. Kerf, Concessions- The way to privatize infrastructure sector monopolies, Washington, D.C.: World Bank, 1995.
Hadenius, A, and J. Teorell, " Pathways from Authoritarianism," Journal of Democracy, Vol. 18, No. 1, 2007, pp. 143-156.
Hall, D., E. Lobina, and R. de la Motte, "Public resistance to privatisation in water and energy," Development in Practice, Vol. 15, No. 3, 2005, pp. 286-301.
Hammami, M., J.F. Ruhashyankiko, and E.B. Yehoue, "Determinants of Public-Private Partnerships in Infrastructure," International Monetary Fund Working Paper No 06/99, 2006.
Harris, C., "Private Participation in Infrastructure in Developing Countries: Trends, Impacts, and Policy Lessons," World Bank Working Paper, No. 5, 2003.
Hart, O., "Incomplete Contracts and Public Ownership: Remarks, and an Application to Public-Private Partnerships," The Economic Journal, Vol. 113, No. 486, 2003, pp. C69-C76.
Hart, O., A. Shleifer, and R.W. Vishny, "The proper scope of government: theory and an application to prisons," Quarterly Journal of Economics, Vol. 112, No. 4, 1997, p. 1126.
Hertogh, M., S. Baker, P. Staal-Ong, and E. Westerveld, Managing Large Infrastructure Projects/ Research on Best Practices and Lessons Learnt in Large Infrastructure Projects in Europe: AT Osborne BV, 2008.
Hirschman, A., The strategy of economic development, New Haven, CT: Yale University Press, 1958.
Hodges, J., Unsolicited proposals- the issues for private infrastructure projects, Washington, D.C.: The World Bank, 2003.
ICA, ICA Annual Report 2009:Financial Commitments and Disbursements for Infrastructure in Africa, Tunis, Tunisia: ICA Secretariat, 2010.

83
———, Financial Commitments and Disbursements for Infrastructure in Africa for 2010, Tunis, Tunisia: The Infrastructure Consortium for Africa Secretariat, 2011.
IFC, "IFC's Vision, Values, & Purpose," 2013. As of April 28, 2013:
http://www1.ifc.org/wps/wcm/connect/corp_ext_content/ifc_external_corporate_site/about+ifc/vision
———, "Infrastructure - Subnational Finance," 2013. As of April 30, 2013:
http://www1.ifc.org/wps/wcm/connect/Industry_EXT_Content/IFC_External_Corporate_Site/Industries/Infrastructure/Sectors/Subnational_Finance/
———, "Infrastructure in Africa," 2013. As of April 30, 2013:
http://www1.ifc.org/wps/wcm/connect/REGION__EXT_Content/Regions/Sub-Saharan+Africa/Investments/Infrastructure/
Iimi, A., Infrastructure procurement and ex post adjustments: Evidence from ODA-financed road procurement in Africa mimeo, 2009.
Jacobs, B., "European programmes and Chinese projects: a modality clash on sustainable infrastructure development in Africa," paper presented at The 4th European Conference on African Studies, Uppsala, 2011.
Jansson, J., The Forum on China-Africa Cooperation (FOCAC), Stellenbosch and Johannesburg: Centre for Chinese Studies, University of Stellenbosch, 2009.
JBIC, JBIC Profile Role and Function, Tokyo, Japan: Japan Bank for International Cooperation, 2012. http://www.jbic.go.jp/en/about/role-function/pdf/jbic-brochure-english.pdf
———, "JBIC Financial Products," 2013. As of April 30, 2013:
http://www.jbic.go.jp/en/
Jerome, A., "Infrastructure, Economic Growth and Poverty Reduction in Africa," Journal of Infrastructure Development, Vol. 3, No. 2, 2011, pp. 127–151.
JICA, "Japan's ODA and JICA," 2013. As of April 30, 2013:
http://www.jica.go.jp/english/about/oda/index.html
———, "Types of Assistance," 2013. As of April 30, 2013:
http://www.jica.go.jp/english/our_work/types_of_assistance/index.html
Jimenez E, “Human and Physical Infrastructure: Investment and Pricing Policies in Developing Countries”, in the Handbook of Development Economics, Vol. 3B, edited by J Behrman and T.N. Srinivasan, 1995.

84
Jooste, S. F., and W. R. Scott, "Organizations enabling public–private partnerships: an organization field approach." Global Projects: Institutional and Political Challenges (2011): 377-402.
Hofstede, G., ”Cultures and Organizations—Software of the Mind.” London: McGraw-Hill, 1991.
Kerf, M., and A.K. Izaguirre, "Revival of Private Participation in Developing Country Infrastructure: A Look at Recent Trends and their Policy Implications," Gridlines, Note, No. 16, 2007.
Kerf, M., and W. Smith, Privatizing Africa's infrastructure: Promise and challenge, Washington, D.C.: The World Bank Group, 1996.
Kessides, I., Reforming infrastructure: Privatization, regulation and competition, Washington, D.C.: World Bank and Oxford University Press, 2004.
KfW, "About DEG- Our mandate," 2013. As of April 28, 2013:
https://www.deginvest.de/International-financing/DEG/Die-DEG/Auftrag/
———, "DEG Financial Products," 2013. As of April 30, 2013:
https://www.deginvest.de/International-financing/DEG/Unser-Angebot/Finanzierung-und-Beratung/Finanzierungsprodukte/
Kingombe, C., Mapping the new infrastructure financing landscape, Overseas Development Institute, 2011.
Kirkpatrick, C., D. Parker, and Y. Zhang, "Foreign direct investment in infrastructure in developing countries: Does regulation make a difference?," Transnational Corporations, Vol. 15, No. 1, 2006, pp. 143-171.
La Porta, R., F. Lopez-de-Silanes, A. Shleifer, and R. W. Vishny, "Legal determinants of external finance," The Journal of Finance, Vol. 52, No. 3, 1997, pp. 1131-1150.
———, "Law and finance," The Journal of Political Economy, Vol. 106, No. 6, 1998, pp. 1113-1155.
Lamech, R., and K. Saeed, "What International Investors Look For When Investing In Developing Countries Results from a Survey of International Investors in the Power Sector," Energy and Mining Sector Board Discussion Paper, No. 6, 2003.
Levine, R., and D. Renelt, "A Sensitivity Analysis of Cross-Country Growth Regressions," The American Economic Review, Vol. 82, No. 4, 1992, pp. 942-963.
Levine, R., and S. J. Zervos, "What we Have Learned about Policy and Growth from Cross-Country Regressions?," The American Economic Review, Vol. 83, No. 2, 1993, pp. 426-430.

85
Linder, S.H., "Coming to terms with the public-private partnership: A grammar of multiple meanings," American Behavioral Scientist, Vol. 43, No. 1, 1999, pp. 35-51.
Lum, T., H. Fischer, J. Gomez-Granger, and A. Leland, China's foreign aid activities in Africa, Latin America, and Southeast Asia, Washington, D.C.: Congressional Research Service, 7-5700, 2009.
Massa, I., Export finance activities by the Chinese government, Brussels: European Parliament, 2011.
Michel, S., and M. Beuret, China Safari: On the Trail of Beijing's Expansion in Africa: Nation Books, 2009.
Ministry of Commerce of the People Republic of China (MOFCOM), Statistical Bulletin of China’s Outward Foreign Direct Investment, Bejing, 2012. As of November 4, 2012:
http://english.mofcom.gov.cn/static/column/statistic/foreigninvestment.html/1
Ministry of Foreign Affairs (Japan), Japan's official development assistance charter, Ministry of Foreign Affairs Economic Co-operation Bureau August 29, 2003.
———, International cooperation and NGOs- Partnership between the Ministry of Foreign Affairs and Japanese NGOs, Ministry of Foreign Affairs International Cooperation Bureau, 2007.
Ministry of Foreign and European Affairs (France), Development cooperation: A french vision- Framework document, Paris, France: Ministry of Foreign and European Affairs, Directorate-General of Global Affairs, Development and Partnerships, 2011. http://www.afd.fr/webdav/site/afd/shared/PUBLICATIONS/Colonne-droite/Cooperation-francaise-VA.pdf
Mold, A., "Will it all end in tears? Infrastructure spending and African development in historical perspective" Journal of International Development, Vol. 24, No. 2, 2012, pp. 237-254.
Morrisset, Jacques, "Foreign Direct Investment to Africa: Policies Also Matter," Transnational Corporation, Vol. 9, 2000, pp. 107-125.
Moyo, D., Dead Aid: Why Aid Is Not Working and How There Is a Better Way for Africa: Farrar, Straus, and Giroux, 2009.
Noland, M., D. Park, and G. Estrada, "Developing the Services Sector as Engine of Growth for Asia: An Overview," Working Paper Series, No. 18, 2012.
OECD, Labour-based approaches to infrastructure building and maintenance. Joint Learning Event: Promoting Pro-Poor Growth Policy. Instrument Note # 6, Paris, France.
———, "Development Co-operation Report: Efforts and Policies of Members of the Development Assistance Committee," 2003. As of May 4, 2013:

86
http://stats.oecd.org/glossary/detail.asp?ID=3089
———, "Promoting pro-poor growth: Infrastructure," Promoting Pro-Poor Growth: Policy guidance for donors, Paris, France, 2006.
———, "Aid effectiveness: Paris Declaration and Accra Agenda for Action," undated. As of May 3, 2013:
http://www.oecd.org/dac/effectiveness/parisdeclarationandaccraagendaforaction.htm
———, "DAC Glossary of Key Terms and Concepts," undated. As of May 6, 2013:
http://www.oecd.org/dac/dacglossaryofkeytermsandconcepts.htm
OECD-Development Assistance Committee, Is it Official Development Assistance?, Paris, France: Organization for Economic Cooperation and Development 2008.
Polgreen, L., and H. French, "New power in Africa: China’s trade in Africa carries a price tag," The New York Times, August 21, 2007.
Pragal, S., "Regulation and private sector participation in infrastructure," Policy Research Working Paper, No. 3037, 2003.
Proparco, "Proparco About Us," 2012. As of April 28, 2013:
http://www.proparco.fr/lang/en/Accueil_PROPARCO/PROPARCO
Publish What You Fund, "2012 Aid Transparency Index," 2013. As of May 5, 2013:
http://www.publishwhatyoufund.org/index/2012-index/
Rijsberman, F. R., and A. P. Zwane, "Copenhagen Consensus 2008 Perspective Paper: Sanitation and Water.” Copenhagen, Denmark: Copenhagen Consensus (2008).
Roeder, P., "Ethnolinguistic Fractionalization (ELF) Indices, 1961 and 1985," 2001
2001. http://weber.ucsd.edu/~proeder/elf.htm
Rogers, P., R. De Silva, and R. Bhatia, "Water Is an Economic Good: How to Use Prices to Promote Equity, Efficiency, and Sustainability." Water policy 4, no. 1 (2002): 1-17.
Rosellón, J., "Different approaches towards electricity transmission expansion," Review of Network Economics, Vol. 2, No. 3, 2003, pp. 238-269.
Rotberg, R., ed. China into Africa: Trade, Aid, and Influence: Brookings Institution Press, 2008.
Sanghi, Apruva, Alex Sundakov, and Denzel Hankinson, "Designing and Using Public-Private Partnership Units in Infrastructure: Lessons from Case Studies Around the World," Gridlines, Note, No. 27, 2007.
Sappington, D., and J. Stiglitz, "Privatization, Information, and Incentives," Journal of Policy Analysis and Management, Vol. 6, No. 4, 1987, pp. 567-579.

87
Schubert, W., "Sovereign Wealth Funds and Dedicated Infrastructure Investment," Journal of Applied Business and Economics, Vol. 12 No. 6, 2011.
Shirley, M., Urban Water Reform: What We Know, What We Need To Know, St. Louis, MO: Ronald Coase Institute, 2007.
Søreide, T., "Tender manipulation: Large firms and infrastructure contracts," International public procurement conference, 21-23 September Rome, Italy, 2006.
Straub, S., "Infrastructure and Development: A Critical Appraisal of the Macro-level Literature," Journal of Development Studies, Vol. 47, No. 5, 2011, pp. 683–708.
Tenenbaum, B., and A. Izaguirre, "Private participation in electricity : The challenge of achieving commercial viability and improving services," Public Private Infrastructure Advisory Facility, No. 21, 2007.
Teorell, J. , N. Charron, M. Samanni, and S. Holmberg, Quality of Government Dataset, version 17June09. , University of Gothenburg: The Quality of Government Institute, 2009.
Teorell, J., M. Samanni, S. Holmberg, and B. Rothstein, The Quality of Government Basic Dataset made from The QoG Standard Dataset version 6Apr11, University of Gothenburg: The Quality of Government Institute, 2012.
Tetley, W., "Mixed Jurisdictions: Common Law V. Civil Law (Codified and Uncodified)," La. L. Rev., Vol. 60, 1999.
The Economist, "Special Report: China's quest for resources- Mutual convenience. Congo has something China wants, and vice versa," March 13, 2008. As of June 7, 2013: http://www.economist.com/node/10795773
Transparency International, "Sub-Saharan Africa." As of June 8, 2013:
http://archive.transparency.org/regional_pages/africa_middle_east/sub_saharan_africa
Tsangarides, Charalambos G., "Growth Empirics Under Uncertainty: Is Africa Different?," International Monetary Fund Working Paper, No. 05/18, 2005.
UNCTAD, World Investment Report: Transnational corporations, and the Infrastructure challenge, Geneva: United Nations Conference on Trade and Development, 2008.
United Nations, "Millenium Development Goals- Goal 7: Ensure environmental sustainability ". As of June 6, 2013: http://www.un.org/millenniumgoals/environ.shtml
Vickers, J., and G. Yarrow, "Economic perspectives on privatization," Journal of Economic Perspectives, Vol. 5, No. 2, 1991, p. 111-132.
Wells, J., and J. Hawkens, Increasing local content in the procurement of infrastructure projects in low income countries, Engineers Against Poverty and Institution of Civil Engineers, 2008.

88
Woods, N., "Whose aid? Whose influence? China, emerging donors and the silent revolution in development assistance," International Affairs, Vol. 864, No. 6, 2008, pp. 1205–1221.
World Bank, World Development Report 1994: Infrastructure for development, Washington, D.C., 1994.
World Bank, "Accessing Flexible Financing," 2013. As of April 30, 2013: http://treasury.worldbank.org/bdm/htm/financing.html
———,"International Bank for Reconstruction and Development (IBRD) Products and Services," 2013. As of April 28, 2013: http://go.worldbank.org/WIIMET0J30
———,"Private participation in infrastructure," 2013. As of April 7, 2013:
http://ppi.worldbank.org/resources/ppi_methodology.aspx
———,"What is IDA?," 2013. As of April 28, 2013:
http://www.worldbank.org/ida/what-is-ida.html
———,The World Bank Annual Report 2012, Washington, D.C., 2013.
Yartey, C. , and C. Adjasi, "Stock market development in Sub-Saharan Africa: critical issues and challenges," International Monetary Fund Working Paper, No. 209, 2007.

89
Appendix A List of sources for the comparative analysis
Type of information Specific source
Literature Peer-reviewed journals including African Studies Review, European Journal of Development Research, Journal of Contemporary African Studies, Journal of Infrastructure Development, Journal of International Development, Politikon: South African Journal of Political Studies, South African Journal of Economics, Sustainable Development Law & Policy, Third World Quarterly.
Reports & white papers (World Bank, African Development Bank, UNECA, OECD, Center for Global Development, Hong Kong Institute for Monetary Research, Overseas Development Institute, European Commission, South African Institute for International Affairs, SAIS Working Papers in African Studies, The Heritage Foundation’s China Global Investment Tracker)
Conference proceedings
Theses and dissertations
Government sources
MOFCOM (China-Africa Research Center, Statistical Bulletin)
The Export-Import Bank of China
China-Africa Development Fund
Websites China in Africa website from the Carter Center
Chine-Afrique: Seminaire d’Economie de la Chine (EHSS)
African Economic Research Consortium
South African Institute of International Affairs’ China in Africa project
Centre for Chinese Studies at Stellenbosch University
The China Africa project
Blogs China in Africa blog: Connecting the dots
China in Africa: The real story – digging into the myths and realities (Maintained by Dr. Deborah Bräutigam)
News Google news alerts on China and infrastructure in Africa
China Africa News
All Africa News
Informal conversations
Government officials at Ethiopian Road Authority and Ethio Telecom, World Bank Infrastructure Experts (Ethiopia and Washington D.C.), prominent scholar on the issue of China in Africa
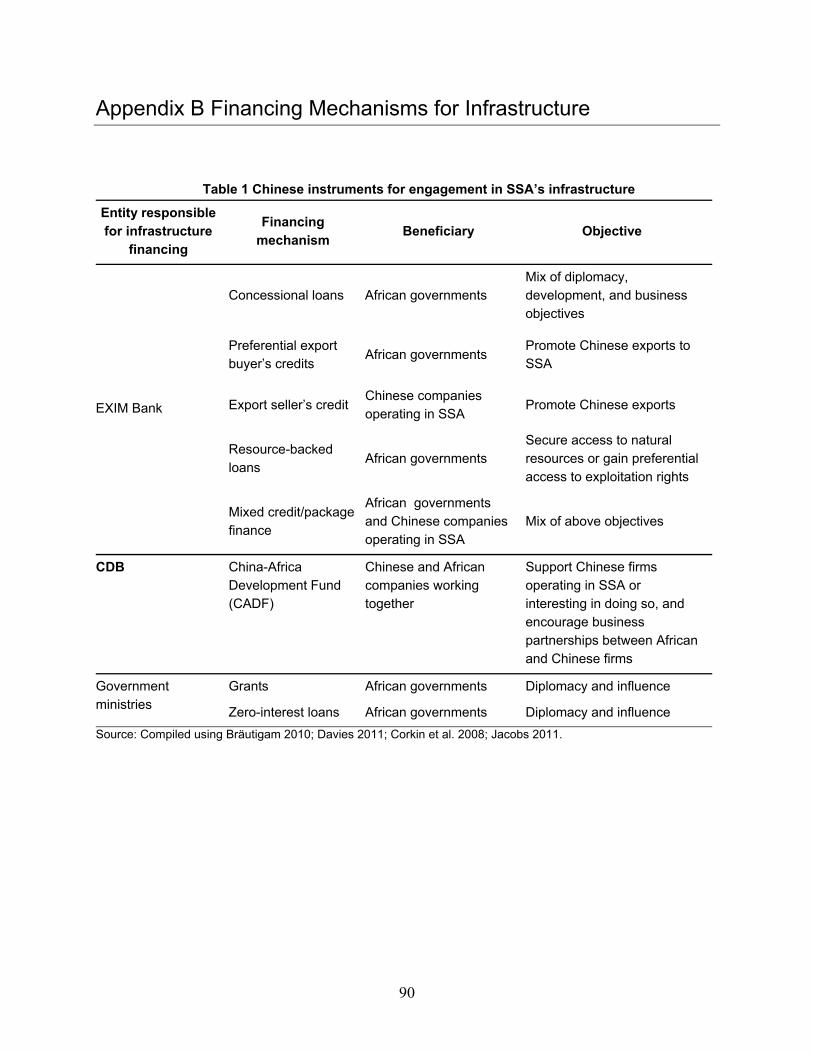
90
Appendix B Financing Mechanisms for Infrastructure
Table 1 Chinese instruments for engagement in SSA’s infrastructure
Entity responsible for infrastructure
financing
Financing mechanism
Beneficiary Objective
EXIM Bank
Concessional loans African governments Mix of diplomacy, development, and business objectives
Preferential export buyer’s credits
African governments Promote Chinese exports to SSA
Export seller’s credit Chinese companies operating in SSA
Promote Chinese exports
Resource-backed loans
African governments Secure access to natural resources or gain preferential access to exploitation rights
Mixed credit/package finance
African governments and Chinese companies operating in SSA
Mix of above objectives
CDB China-Africa Development Fund (CADF)
Chinese and African companies working together
Support Chinese firms operating in SSA or interesting in doing so, and encourage business partnerships between African and Chinese firms
Government ministries
Grants African governments Diplomacy and influence
Zero-interest loans African governments Diplomacy and influence Source: Compiled using Bräutigam 2010; Davies 2011; Corkin et al. 2008; Jacobs 2011.

91
Table 2 Traditional financiers’ instruments for funding SSA infrastructure30
Responsible entity
Financing mechanism Beneficiary Objective & descriptions
WO
RLD
BA
NK
GR
OU
P
IBRD
IBRD Flexible Loan
African governments
Promote sustainable development in middle income and creditworthy poorer countries
Provides favorable market terms and customized repayment terms (e.g. grace period) according to project needs or debt management requirements.
Interest rates slightly higher than those available to AAA-rated borrowers.
Local currency loans
African governments
Similar terms as IBRD Flexible Loans Borrowers have access to local currency at
disbursement or at any time during the life of the loan to reduce future vulnerabilities to foreign exchange risk.
Financing for subnationals with sovereign guarantee
State/ provincial/ local governments
Loans to subnational governments at with the same terms as national governments (national governments required to provide guarantee)
IDA
Subsidized loans ("credits")
African governments
Support a range of development activities (including infrastructure) in low-income countries and countries that lack the creditworthiness to borrow from IBRD
Zero and very low interest loans with repayments over 25 to 40 years and 5 to 10 years grace period
Grants African governments
Same goals as IDA loans Allocated on the basis of a country’s risk of debt
distress.
IFC
Loans Private sector firms and projects
Encourage private enterprise and mobilize other financing for private enterprise development
Finances up to 25 percent of the total cost of a project to ensure participation from other investors/ private sector lenders.
Subnational Finance
State/ provincial/ local governments
Provides funds for infrastructure to creditworthy subnational governments without needing sovereign guarantee
AFR
ICA
N D
EV
ELO
PM
EN
T B
AN
K
African Development
Bank
Sovereign and non-sovereign guaranteed loans
African governments or public sector enterprise
Promote economic growth and enhance social and economic well-being
Non-concessional loans Sovereign guaranteed loans must be guaranteed by
the borrowing country government
Local Currency Loans
African governments; public or private firms
Reduce borrowing countries foreign exchange risks, contribute to local capital markets and make available long term financing in borrowing countries’ currencies
Non-concessional terms Can be sovereign guaranteed or not
30 Most of these institutions offer a range of financial products. I have not included them all here- in particular, risk management products have been left out. Furthermore, part of the main functions of these institutions is also providing advisory services and technical assistance. These have also been left out of the analysis.

92
Responsible entity
Financing mechanism Beneficiary Objective & descriptions
African Development
Fund
Zero-interest loans
African governments
Provides loans to low income and “blend” countries (those eligible for both concessional and non-concessional financing)
50 year maturity with 10 year grace period.
Grants African governments
Provides grants to low income countries at high or moderate risk of debt distress (high receive 100% grants and moderate 50% grants)
Linked to expenditures that aim to address specific operational priorities, e.g. education, health, water and sanitation, HIV/AIDS programs, post-conflict reconstruction, and natural disaster assistance.
Nigeria Trust Fund
Concessional loans
Public or private sector projects
Zero interest loans with long term (20 years, + 7 years grace period) and short term maturities (15 years +5 year grace period)
Funding ceiling of US$ 10 million per project
Private sector window
Equity and Quasi-Equity
Public or private sector enterprises
Promote the emergence of a dynamic private sector and attract other investors and lenders to projects
Invest in equities either directly or indirectly ‐ through appropriate funds and other investment vehicles.
Non‐Sovereign Guaranteed Loans
Public or private sector enterprises
Similar terms to the sovereign guaranteed loans
JAP
AN
JICA
Grants African governments
Support for projects implemented for basic human needs, education, etc. (e.g. the construction of hospitals, schools and roads, or the procurement of materials and equipment for public transport vehicles, etc.)
ODA loans African governments
Provide low-interest, long-term and concessional funds to finance development efforts
JBIC
Buyer's Credit
African governments, firms (buyers of Japanese goods)
Promote Japanese exports (machinery and equipment produced in Japan)
Direct loans to foreign buyers and financial institutions
Loans
Japanese joint ventures, governments or banks
Loans to promote Japanese exports and investments To be eligible, project has to have substantial benefit
for Japanese companies and also preserve the global environment
Overseas investment loans
Japanese firms
Meet long term needs of Japanese firms for international business development
Equity participation
Japanese firms and overseas projects
Support overseas investment projects undertaken by Japanese firms
FRA
NC
E
AFD
Grants African governments
Support economic and social development Fund high-impact projects that do not generate
sufficient profit over the short or medium term to pay back market-rate loans
Subsidized or soft loans
National and local governments;
Underlying project must “present an additional nature (Does the operation make it possible to go further than usual practices or the national regulations in the

93
Responsible entity
Financing mechanism Beneficiary Objective & descriptions
State-owned companies, or NGO
relevant sector?” (ADF 2011, webpage) Can be sovereign or non-sovereign loans
Market rate loans
African governments
Market rate loans for countries with low levels of debt Can be sovereign or non-sovereign loans
PROPARCO
Private equity Private firms Minority investment stake to promote capital development
Non sovereign loans
private sector companies
Provided directly to investors with or without bank guarantees or restricted covenants
Project loans co-financed with other financiers (e.g. multilateral loans or other bilateral loans)
Loan maturity of up to 15 years with grace period when appropriate.
GE
RM
AN
Y
KfW
Grants African governments
Provided to Least Developed Countries (LDC) and for special projects (e.g. targeting climate protection or poverty reduction)
Subsidized loans
African governments
Provided to developing countries for the financing of development projects
Similar terms as the World Bank IDA loans
Development loans
African governments
Provided for financing infrastructure projects in developing countries that are deemed particularly important from a developmental perspective
Provided to countries not granted favorable lending terms by the World Bank
Low interest rates (significantly lower than those on the capital markets) and flexible maturity
Borrowers are usually states or implementing agencies in developing countries backed by a state guarantees
Promotional loans
African governments
Provided to middle income developing countries for projects which are both commercially cost-effective and valuable in terms of development policy
Near market rate interest rates
BMZ Export credits (Hermes guarantees)
Exporters and banks
Foreign trade promotion instrument- cover risks of non-payment for economic and political reasons in the export sector
Specially targeted at small and medium-sized German businesses
DEG Market rate loans
German and European firms
Provide capital to firms interested in investing in developing countries and "support all kinds of long-term intercompany cooperation, particularly with German and European enterprises " (KfW 2013b, webpage)
Source: Compiled using World Bank 2013d, IFC 2013c; JICA 2013a,b; JBIC 2012, 2013; BMZ 2013; ADF 2011, 2012; Proparco 2012; KfW 2013a,b.

94
Appendix C Historical Context of China-Africa Relations and Motivations of Chinese Involvement in SSA Infrastructure
Historical context China-Africa relations post-World War II date back to the late 1950s and early 1960s when
African countries gained independence. The drivers behind the Chinese engagement at the time were ideological and related to the political positioning of China in the new global system. Chiefly, the “One China Policy” and the associated competition with the Republic of China (i.e., Taiwan) to be recognized as the sole legitimate government of China on the international arena motivated China (i.e., the People’s Republic of China or PRC) to woo the newly independent African countries. Other foreign policy considerations included competition with the Soviet Union for influence in the Communist bloc, as well as China’s desire to appeal to countries in the non-allied movement during the Cold War (Large 2008).
China’s engagement with African countries during that time consisted of political exchanges, sometimes including donations of highly visible “prestige” projects such conference halls and stadiums, and project-by-project aid in the healthcare, agriculture, manufacturing and infrastructure sectors, emphasizing production, self-reliance, and the provision of technical expertise and social services. For the latter, most of the aid involved building state-owned factories and turnkey infrastructure projects, providing training for the management of the new factories, and sending teams of medical doctors modeled on the “barefoot” doctors to serve rural populations.
At the time too infrastructure was a central feature of China’s involvement in SSA. Indeed, the largest project undertaken was an infrastructure project: The Tazara Railway project (also known as the Tan-Zam railway), a 1,860 km long system that linked Zambia’s Copperbelt region to the Dar es Salaam Port in Tanzania, costing about US$ 500 million to build. The project was especially notable as it had been deemed too expensive to build by Western financiers and the World Bank, but China agreed to build it in 1967, and managed to do so, even finishing two years ahead of schedule (Bräutigam 2008; Large 2008; Bräutigam 2009; Davies 2010).
In the 1980s and 1990s, amid concerns for its own domestic economy, China turned more inward and curtailed its engagements and programs in SSA. The focus became the restructuring of domestic firms and attracting foreign direct investments (FDI) into China, with the main aim of preparing for entry in to the World Trade Organization (WTO) and improving domestic firms’ competitiveness on the global arena (Bräutigam 2008). The “Going Global Strategy” of the Chinese government in the next period was a natural progression of the two decades spent on strengthening Chinese firms. In essence, the strategy entailed the expansion of “the international operations of capable Chinese firms with a view to improving resource allocation and enhancing their international competitiveness.” In practice, strategic industries were identified, and firms

95
within these industries were provided with incentives such as export tax rebates, financial assistance and foreign exchange assistance to be more outward looking. The main considerations in terms of the selection of industries were as follows: The potential to increase access to natural resources in the context of a growing China with increasing needs for raw materials; the potential to increase foreign exchange receipts through exports of Chinese products and labor, as well as to promote Chinese technologies abroad; the potential to increase access to foreign advanced technologies and managerial skills; and the potential to increase Chinese firm penetration in foreign markets (Salidjanova 2011).
The “Going Global Strategy” was accompanied by increased government outreach to foreign countries through diplomacy, trade promotion, and, in the case of developing nations, development assistance. For the latter, China’s aid comes in a different format than the traditional OECD-country bilateral assistance. Often, Chinese aid is given in the context of an overall engagement in a country, featuring Chinese government backed investment projects in addition to concessional loans, which sometimes are linked to in-kind payments, as well as grants and debt cancellations (Lum et al. 2009).
While these are some of the central features of the Chinese re-engagement in SSA in the early 2000s, the re-engagement was also formalized through highly visible political events, most notably the launch of the Forum on China and Africa Cooperation (FOCAC) in Beijing on October 10-12, 2000. The conference, whose goal was to “promote both political dialogue and economic cooperation and trade, with a view to seeking mutual reinforcement and common development,” brought together Chinese and African leaders, and several representatives of international and regional organizations (Jansson 2009). Since, FOCAC has been hosted every three years and throughout, the rhetoric and dialogue have centered on promoting equality, south-south cooperation, mutual benefit, and sovereignty, in line with China’s eight principles of development assistance.
Effectively, the motivations underlying the current extensive Chinese outreach in Africa are mainly commercial and attempt to find a “win-win” through commercial exchange between China and the individual African countries. In essence, while Chinese engagement is not tied politically (with the exception of the adherence to the “One China Principle”), it is tied economically, directly supporting Chinese companies in their “going global” strategy- i.e., in search of new markets as well as access to abundant natural resources, and at the same time providing the continent with new sources of financing, and access to new products, technologies and expertise.
Motivations Infrastructure is one of the key areas of the China-Africa engagement. The existing literature
has extensively investigated the motives behind China’s involvement in Africa’s infrastructure. As noted by Bräutigam (2009), the focus on infrastructure mirrors China’s own development path.
96
In principle, infrastructure provides the opportunity to abide by the FOCAC philosophy, in terms of “south-south cooperation” and “mutual benefit.” Practically, there is a strong commercial interest: In line with the “Going Global Strategy”, the vibrant Chinese construction industry has found an opportunity in the infrastructural gap in Africa. Furthermore, infrastructural investments have served to increase China’s access to the much needed African natural resources, either directly through in-kind contracts (e.g., the construction of a road paid for by an oil contract or guarantee of future access to oil), or through the building of transport routes that facilitate the exports of natural resources to China (Centre for Chinese Studies 2007; Corkin, Burke, and Davies 2008). Besides the economic interests, as in the previous post- World War II engagement, there is also an element of winning and expanding influence on the continent by building prestige projects, which include major infrastructural projects.
New market opportunities for Chinese construction firms
China has a vibrant construction industry. Indeed, after World War II, the Chinese government embarked on rebuilding the country, focusing on bridges, hydroelectric power plants and heavy industry, and to support this, state-owned engineering and construction firms were created. The firms gained experience and expertise domestically, and over the years the industry grew to become an important component of the Chinese economy with its contribution to GDP rising from 3.8 percent in 1978 to 7 percent in 2003, and the number of construction related firms growing from 6,604 in 1980, employing about 6.5 million, to close to 50,000 in 2003, employing 24 million (Cheah, Kang, and Chew 2007). Some of these firms have also become global powerhouses; In 2012, according to the Engineering News Records (ENR), the top three contractors in the world – ranked in terms of construction revenue generated outside of home country—were Chinese,31 as were 7 out of the top 20 (ENR 2012).
In the 1980s, the construction industry was one of the benefactors of reform with the state owned enterprises (SOEs) being restructured and some even privatized. It was also one of the first industries elected to look beyond the domestic market in the context of ‘Going Global Strategy.” As such, both private construction firms and SOEs were allowed to operate in foreign markets and awarded favorable assistance to enable them to better compete abroad (Centre for Chinese Studies 2007). At the same time, as elaborated in the first section of this paper, SSA’s infrastructure in the 2000s was in dire need of rehabilitation and expansion. The traditional financiers of infrastructure were more focused on other issues, and SSA countries themselves had not built internal capacity to take on such projects. The vacuum thus provided Chinese firms— assisted with subsidies from the Chinese government— room to expand their operations on the continent.
31 The companies are: China Railway Group Ltd., China Railway Construction Corp. Ltd. and China State Construction Engineering Corp. Ltd.

97
In relatively few years, Chinese firms have become big players on the continent. As shown in Figure 1 below, their share of the market rose from 7 percent in 2000 to almost 39 percent in 2010, while during the same time, that of European and American firms fell from 53 and 18 percent respectively to 37 and 7 percent respectively (Figure 1). Chinese firms occupy an even greater share of the market depending on the region; Business Monitor International estimates that in 2011, Chinese firms accounted for almost 56 percent of the Eastern African market, where they feature prominently in the Sudan for example (where they occupy 72 percent of the market share), compared to 42 percent in Southern and Western Africa (BMI 2012).
Figure 1 African* market share of the top international contractors by nationality
Note: *Includes North Africa
Source: Chen et al. (2007); Reina and Tulacz (2011)
Chinese companies were able to gain such large market shares in a relatively small amount of time for several reasons. For one, similar to other donors, Chinese concessional loans to African countries are tied to Chinese enterprises. Thus, Chinese firms are generally awarded the projects that are funded through Chinese loans. However, notwithstanding this advantage, Chinese firms also tend to be quite competitive. Indeed, on competitive bids, they can sometimes undercut the competition’s prices by 50 percent, and as a result win a number of such bids. For example, in 2010, Chinese firms won 35 percent of the civil engineering projects funded through the AfDB. Part of the reason is that because of the funds available to Chinese firms through the Chinese government (see next section), the firms are able to operate on lower profit margins than others; while typically foreign firms operate on a profit margin of 15 to 25 percent, Chinese firms are able to operate on profit margins lower than 10 percent, and in some cases, even as low as 3 to 5 percent (Corkin, Burke, and Davies 2008). Secondly, because of the vast number of Chinese construction firms in SSA — around 800 in 2007— they tend to be very competitive with each other, driving down prices even further. Chinese firms also have access to cheaper material and labor, and pay their engineers close to local rates, unlike other foreign firms, whose engineers get
0
10
20
30
40
50
60
Chinese European American
2000
2005
2010

98
very high expatriate rates (Schiere and Rugamba 2011; Corkin, Burke, and Davies 2008; Chen et al. 2007).
Ensuring long-term access to natural resources
China’s rapid economic growth has meant a growing need for natural resources, and SSA countries have become a principal source for minerals and oil; on average between 2007 and 2011, 91 percent of Chinese cobalt imports came from SSA, as did, respectively, 44 and 39 percent of manganese and chromium imports. In addition, 20, 6 and 7 percent of Chinese crude oil, copper and iron ores imports respectively came from SSA (Figure 2).
Figure 2 Chinese imports of African minerals and crude oil as a percentage of total imports of
minerals and crude oil
Source:WorldBank(2012)
The intersection between the Chinese role in African infrastructure and access to natural resources plays out in two ways; (1) the use of resource-backed loans for the financing of key infrastructure (also known as the “Angola mode”), and (2) the focus on infrastructure that facilitate the transport of resources from extraction sites to ports (Farooki 2012; Foster et al. 2009).
For the latter, because mining and oil resources—particularly in Africa— are located in underdeveloped areas or offshore, and since most of the resources are destined for exports, the exploitation requires the development of transport infrastructure, particularly ports, roads and railroads. In addition, power plants are necessary for the operation of mines. As such, Chinese investments in natural resources are often bundled with investments in infrastructure facilities (Farooki 2012; Foster et al. 2009). A good example of this is the Belinga Iron Ore project in
0
10
20
30
40
50
60
70
80
90
100
Ironores Copperores Manganeseores Chromiumores Cobaltores Crudeoil
2007
2008
2009
2010
2011

99
Gabon, for which the Belinga-Santa Clara railway and the Poubara hydropower dam were proposed as part of the project in exchange for iron exploration rights to the China Machinery Engineering Corporation (CMEC), a Chinese engineering and trade firm.32 Other examples include the rehabilitation of key transport routes such as the Benguela railways, which links the copper mines in Zambia and DRC to the port of Lobita in Angola, and the construction of a 1000 MW capacity hydropower plan in Chad in exchange of four oil blocks in the Lake Chad Basin and the Niger Delta (Executive Research Associates 2009). Nevertheless, as stated earlier, according to estimates from the World Bank, only about 10 percent of Chinese infrastructure investments can be directly linked to natural resource exploitation (Foster et al. 2009).
As for resource-backed loans, these have become a prominent feature of the bilateral relations of China with natural resource-rich countries on the continent such as Angola, the Democratic Republic of Congo (DRC), and the Sudan, but also more recently with primary commodities exporters like Ethiopia (loans in exchange for sesame seed exports for example). The mechanism, which I review in more detail in the next section of the paper, is a way for China to grant a credit line to a resource-rich country which does not necessarily have sufficient financial guarantees to obtain a loan (Christensen 2010).
Prestige infrastructural projects
There are essentially two ways that Chinese investments contribute to funding prestige projects. The first is direct and comes in the form of a bilateral gift from China to a recipient country or regional organization. The intention is to build goodwill or “political capital” in SSA using “aid as a vehicle to gain influence on the African continent” (Gernot 2007). A recent example is the funding and construction of the new African Union (AU) headquarter building in Addis Ababa, worth US$ 200 million, which was inaugurated in early 2012 (BBC 2012).
The second way is more indirect and linked to China’s aid policy of non-interference and the associated provision of unconditional loans. Some authors (e.g., Christensen(2010), Mold (2012)), drawing a parallel to what happened in SSA in the 1960s and 1970s with respect to investments in infrastructure, have expressed concern these types of loans which do not take into consideration economic returns, may enable some governments to invest in “white elephant” projects, i.e., large, expensive, highly visible but non-productive investments that do not necessarily contribute to the growth of the local economy, and ultimately lead to unsustainable levels of debt.
32 The deal was later revoked by the Gabonese government due to “concerns about the environmental impact of the project and then over whether CMEC would be able to deliver” (Reuters Africa, Gabon's Belinga iron ore deal to be awarded as late as 2014, 2012).

100
Appendix D Exploring the Outcome Variable: PPI
Figure 1 below depicts the distribution of the outcome variable, the amount of private participation in infrastructure (PPI) received by a country in a given year. The distribution is left-skewed, with a 39 percent of the observations clumped at zero, as a number of countries did not receive any private capital in infrastructure in some years.
Figure 1 Distribution of outcome variable: PPI (in constant 2005 US$)
In a first cut of the analysis, in order to get the outcome variable to be more normally distributed I take the natural logarithm of it PPI after I have added 1 to it so that all the observations where PPI is equal to zero are not dropped from the analysis when I take the natural logarithm. As shown in Figure 2 below, ln(PPI+1) is not normally distributed.
Figure 2 Distribution of the transformed outcome variable: ln(PPI +1)
A two part model would be more appropriate to explicitly take into account the clustering
of PPI around zero. In a first part, using a logit regression, I can explicitly model whether or not I
01.
0e-0
42.
0e-0
43.
0e-0
4D
ensi
ty
0 20000 40000 60000 80000 100000(sum) PPIconstant
0.2
.4.6
.81
Den
sity
0 5 10logPPIconstant0

101
get a zero outcome (i.e., whether the country received PPI that specific year). I can then model the level of PPI conditional on the country having received PPI that year in a second part using an OLS specification, as I get a fairly normal distribution (figure 3 below).
Figure 3 Distribution of ln (PPI) conditional on having received PPI
0.0
5.1
.15
.2D
ensi
ty
0 5 10logPPIconstant

102
Appendix E Explanatory Variables- Determinants of PPI
Factor Proxy indicator Definition Source
Gov
ernm
ent m
otiv
atio
ns
Ability of the government to finance infrastructure
Aid (% of gross capital formation)
Aid includes both official development assistance (ODA) and official aid. Gross capital
formation consists of outlays on additions to the fixed assets of the economy plus net
changes in the level of inventories.
World Development
Indicators (WDI) 2009
(World Bank)
Index of government size
Indicator of the size of government expenditures. The range is between 0 and 100,
and the higher the score, the smaller the government.
Index of Economic
Freedom (IEF) 2010 (Heritage
Foundation)
Priv
ate
firm
mot
ivat
ions
Adequate regulatory framework and proper enforcement of laws
Freedom from corruption index
Measures the extent of corruption. Ranges from 0-100, 100= very little corruption
IEF 2010 Index of property rights protection
Measures degree to which country protects private property rights and the degree to which
its government enforces those laws. Range from 0-100, 100= private property fully
protected by government.
Access to credit Domestic credit to private sector (% of GDP)
Financial resources provided to the private sector, such as through loans, purchases of nonequity securities, and trade credits and other accounts receivable, that establish a
claim for repayment.
WDI 2009
Market size and consumers’ ability to pay for services
GDP per capita (constant 2005 international $)
Gross domestic product divided by mid-year population.
Total Population
Counts all residents regardless of legal status or citizenship--except for refugees not
permanently settled in the country of asylum, who are generally considered part of the
population of their country of origin. The values are midyear estimates
Government effectiveness and responsiveness
Index of investment freedom
Measure of the level of constraints on the flow investment capital (in and out). Range 0-100,
100= little constraints
IEF 2010
Index of business freedom
Measure of the ability to start, operate, and close a business- represents the overall
burden of regulation and efficiency of government in the regulatory process. Range
0-100, 100= best business environment

103
Factor Proxy indicator Definition Source
Index of fiscal freedom
Fiscal freedom is a measure of the tax burden imposed by government. It includes both the direct tax burden in terms of the top tax rates on individual and corporate incomes and the
overall amount of tax revenue as a percentage of GDP.
Political stability and public opinion on private provision of infrastructure services
Democracy Dummy variable (1 if democracy and 0
otherwise) constructed from the variable “Regime type” in Hadenius and Teorell (2007)
Hadenius and Teorell 2007
Civil War Dummy variable (1 if civil war and 0 otherwise) constructed from the variable “Regime type” in
Hadenius and Teorell (2007)
Ethnic fractionalization
Probability that two randomly selected people from a given country will not belong to the
same ethnolinguistic group
Roeder 2001
Regime durability
The number of years since the most recent regime change or the end of transition period
defined by the lack of stable political institutions.
Polity IV database 2008
Enab
ling
envi
ronm
ent
Macroeconomic environment
Annual inflation in consumer prices (%)
Reflects the annual percentage change in the cost to the average consumer of acquiring a
basket of goods and services that may be fixed or changed at specified intervals, such as
yearly.
WDI 2009
Openness Constructed as follows: (Total Imports + total
exports)/GDP
Economic structure
Total natural resources rents (% of GDP)
Total natural resources rents are the sum of oil rents, natural gas rents, coal rents (hard and
soft), mineral rents, and forest rents.
Value added is the net output of a sector after adding up all outputs and subtracting intermediate inputs. It is calculated without making deductions for depreciation of fabricated assets or depletion
and degradation of natural resources.
Agriculture, value added (% of GDP)
Agriculture includes forestry, hunting, and fishing, as well as cultivation of crops and
livestock production.
Industry, value added (% of GDP)
Industry includes mining, manufacturing, construction, electricity, water, and gas

104
Factor Proxy indicator Definition Source
Services, value added (% GDP)
Services includes value added in wholesale and retail trade (including hotels and
restaurants), transport, and government, financial, professional, and personal services
such as education, health care, and real estate services. Also included are imputed bank service charges, import duties, and any
statistical discrepancies noted by national compilers as well as discrepancies arising from
rescaling.

105
Appendix F Determinants of PPI- Results
Table 1 outlines the initial results where I include all the potential explanatory variables identified. The two estimated models are as follows. X represents the factors influencing government motivations, Y the factors influencing the private sector motivations, Z the factors influencing the enabling environment, I the total level of investment in the economy, and ϑt time fixed effects.
Model1ln PPI 1
Model2Part1:Pr 0
Part2:Pr | 0
Table 1 Results with all the relevant indicators considered
LMICS SUB SAHARAN AFRICA Model 1 Model 2 Model 1 Model 2
ln (PPI+1) Part 1 Part 2 ln (PPI+1) Part 1 Part 2
gfcfconstant 1.33E-12 2.09E-13 1.52e-12** 6.70E-13 2.69E-12 1.84E-11 (1.65) (0.2) (3.24) (0.37) (0.31) (0.79) aid -0.000771 -0.00141 -0.00296 0.000425 -0.00288 -0.00309 (-0.41) (-0.42) (-1.23) (0.18) (-0.86) (-0.84) government size 0.000214 0.016 -0.00574 0.0062 0.0179 0.00833 (0.03) (1.39) (-1.25) (0.45) (1.03) (0.7) ln (agriculture) -0.0104 0.094 -0.178 -0.295 -0.785 0.119 (-0.04) (0.16) (-0.83) (-0.66) (-1.05) (0.28) ln (industry) 0.329 -0.665 0.801 0.577 -0.998 2.135*** (0.62) (-0.74) (1.5) (0.81) (-0.99) (3.66) ln (services) 0.678 1.903 0.154 1.426 2.952* 0.713 (0.8) (1.58) (0.21) (1.66) (2.24) (0.73) ln (resource rents) -0.084 -0.0231 -0.099 0.00782 0.161 -0.132 (-0.80) (-0.15) (-1.30) (0.08) (1.08) (-1.13) ln (GDP per Capita) 0.981*** 1.044* 0.498* 0.504 0.607 0.0179 (3.34) (2.33) (2.56) (1.51) (1.05) (0.05) ln (population) 1.145*** 1.185*** 0.912*** 1.030*** 1.067*** 0.552* (13) (5.12) (12.19) (3.79) (3.38) (2.56) corruption -0.0119 -0.0117 -0.00528 -0.00038 -0.00512 -0.0143 (-1.17) (-0.91) (-0.79) (-0.03) (-0.31) (-1.65)

106
LMICS SUB SAHARAN AFRICA Model 1 Model 2 Model 1 Model 2
ln (PPI+1) Part 1 Part 2 ln (PPI+1) Part 1 Part 2 property rights 0.0108 0.00784 0.00803 0.00141 -0.0113 -0.00663 (0.96) (0.56) (1.11) (0.1) (-0.69) (-0.45) common law -0.24 0.559 -0.577* 0.904* 1.411** 0.323 (-0.88) (1.13) (-2.54) (2.04) (2.7) (0.83) ethnic fractionalization 0.0889 -1.004 0.451 0.715 -1.116 1.406** (0.18) (-1.06) (1.36) (1.06) (-0.98) (2.91) regime duration -0.0101 -0.00835 -0.00763 -0.0103 0.00567 -0.0113 (-1.25) (-0.63) (-1.52) (-0.62) (0.31) (-0.86) democracy 0.289 0.811* 0.154 -0.237 -0.452 0.365 (1.43) (2) (1.14) (-0.85) (-1.02) (1.05) civil war 1.420*** 23.74 -0.226 0.776 29.44 -0.665 (3.86) (0.0) (-0.49) (1.34) (0.0) (-1.34) ln (domestic credit) 0.275 -0.366 0.312*** 0.451* -0.218 0.697** (1.51) (-1.42) (3.34) (2.34) (-0.65) (3.12) fiscal freedom 0.0241 0.0293* 0.00953 0.0145 0.0367* 0.0145 (1.87) (2.18) (1.11) (1.1) (2.3) (1.05) business freedom -0.00103 -0.0154 0.00525 -0.0379* -0.04 -0.0376** (-0.10) (-0.94) (0.64) (-2.26) (-1.95) (-2.77) investment freedom 0.0124 0.00496 0.00705 0.00421 0.00935 0.00693 (1.6) (0.44) (1.65) (0.44) (0.63) (0.57) inflation -0.00193 -0.00253 -0.00135** -0.00336 -0.0236 0.0056 (-1.08) (-1.13) (-2.72) (-0.39) (-1.89) (0.67) openness 0.324 2.083** -0.179 0.252 1.526* -0.659 (1.03) (3.05) (-0.69) (0.51) (2.1) (-1.19) _cons -28.67*** -31.63*** -18.15*** -24.47*** -27.68* -16.32* (-5.53) (-3.40) (-3.83) (-4.02) (-2.52) (-2.41) N 1051 1051 854 340 340 225
Notes: (1) t statistics in parentheses (2) * p<0.05, ** p<0.01, *** p<0.001 (3) Standard errors clustered on countries (4) The estimations include year fixed effects (not shown here)
One potential problem in this set up is mutlicollinearity among the explanatory variables. Thus, to minimize mutlicollinearity among the independent variables, I calculate bivariate correlation coefficients between the independent variables and, in the event of high coefficients (greater than 0.5) between two variables, I exclude one of the two from the model. Table 2 below shows the bivariate correlation coefficients between the different independent variables and highlights the potentially problematic explanatory variables.

107
Table 2 Correlation tables indicate the potential for multicollinearity
aid government size ln (agriculture) ln (industry) ln (services) ln (resource rents) ln (GDP per capita) ln (population) freedom from
corruption aid 1 government size 0.0676 1 ln (agriculture) 0.5846 0.2292 1 ln (industry) -0.3899 -0.1557 -0.5889 1 ln (services) -0.3685 -0.1142 -0.5078 -0.2102 1 ln (resource rents) 0.119 0.0513 0.0588 0.3141 -0.4425 1 ln (GDP per capita) -0.709 -0.2594 -0.8543 0.505 0.5155 -0.1143 1 ln (population) -0.1313 0.2129 -0.0199 0.0812 0.0134 0.2376 -0.0362 1 freedom from corruption -0.2452 -0.2919 -0.4329 0.1352 0.3789 -0.2591 0.457 -0.0812 1
property rights -0.1747 -0.202 -0.3041 0.0033 0.3198 -0.3207 0.286 -0.0636 0.6342 ethnic fractionalization 0.3902 0.1128 0.1645 -0.2297 -0.1688 0.2643 -0.345 0.0556 -0.209
regime duration -0.2224 0.0391 -0.1569 0.2146 0.0532 -0.1042 0.2359 0.0366 0.2719 Democracy -0.2624 -0.1617 -0.4083 0.0778 0.3669 -0.309 0.4582 -0.1899 0.4248 civil war 0.0494 -0.0109 -0.0944 0.2354 -0.294 0.2178 -0.0225 -0.0842 -0.1073 ln (domestic credit) -0.4576 -0.0287 -0.4325 0.1444 0.5259 -0.2422 0.4555 0.2448 0.363 Fiscal freedom -0.0218 0.2839 -0.0221 -0.1416 0.1625 -0.2101 0.0742 -0.1466 0.0222 business freedom -0.281 -0.1049 -0.4172 0.0806 0.3747 -0.2593 0.4466 -0.0802 0.5069 investment freedom -0.0424 -0.081 -0.1721 -0.2128 0.4415 -0.3914 0.2152 -0.1217 0.4704 Inflation 0.1046 -0.2362 0.0489 0.0666 -0.0909 -0.0023 0.007 0.0068 -0.0488 Openness -0.1126 -0.2839 -0.0971 0.2816 -0.1052 -0.0054 0.1296 -0.4085 0.0451

108
Table 2 Correlation tables indicate the potential for multicollinearity (ctd.)
property
rights ethnic
fractionalization regime
duration democracy civil war ln
(domestic credit)
fiscal freedom
business freedom
Investment freedom inflation openness
property rights 1 ethnic fractionalization -0.0741 1 regime duration 0.0779 -0.2959 1 democracy 0.4211 -0.1963 0.1356 1 civil war -0.1573 0.1786 -0.0552 -0.0848 1 ln (domestic credit) 0.2719 -0.2787 0.2998 0.321 -0.2047 1 fiscal freedom 0.0307 -0.1894 -0.0108 0.1434 -0.0935 0.0703 1 business freedom 0.6226 -0.0895 0.158 0.4383 -0.1169 0.3052 0.1018 1
investment freedom 0.5248 -0.0838 0.1085 0.409 -0.155 0.2273 0.1502 0.5185 1 inflation -0.0545 -0.0523 -0.0792 -0.0605 -0.0309 -0.174 -0.0964 -0.1007 -0.1169 1 openness -0.0513 -0.2074 0.1168 0.0928 0.1062 0.1349 0.0121 0.0262 -0.15 0.0637 1

109
Taking into account these correlations, I streamline the model-- I drop GDP per capita which is highly correlated with structural indicators of the economy (value added of agriculture, services and industry to the economy) and the level of aid received by the country, as well as the index for property rights which is highly correlated with the freedom from corruption and the indices for investment and business freedom. Table 3 outlines the new results.
Table 3 Results accounting for multicollinearity
LMICS SUB-SAHARAN AFRICA
OLS Two- part model OLS Two- part model ln (PPI+1) Part 1 Part 2 ln (PPI+1) Part 1 Part 2 gfcfconstant 1.49E-12 2.96E-13 1.70e-12*** 9.84E-13 2.89E-12 1.78E-11 (1.76) (0.31) (4.24) (0.51) (0.59) (1.18) aid -0.00361 -0.00445 -0.00574* -0.00102 -0.0054 -0.00266 (-1.80) (-1.38) (-2.29) (-0.48) (-1.75) (-0.94) government size -0.00464 0.0107 -0.00746 0.007 0.014 0.00823 (-0.72) (0.95) (-1.58) (0.58) (0.94) (0.77) ln (industry) 1.414*** 0.353 1.600*** 1.531*** 0.773 1.982*** (3.58) (0.59) (4.27) (3.68) (1.42) (5.88) ln (services) 1.836** 2.968** 1.042 1.741* 4.055*** 0.515 (2.62) (3.15) (1.75) (2.49) (3.66) (0.66)
ln (resource rents)
-0.0673 0.00938 -0.1 -0.00857 0.145 -0.13 (-0.63) (0.06) (-1.30) (-0.09) (1.03) (-1.11)
ln (population) 1.069*** 1.074*** 0.849*** 0.852** 0.719** 0.581*** (11.05) (4.81) (10.29) (3.16) (2.96) (3.44)
freedom from corruption
-0.00306 -0.00408 0.000417 0.00832 0.00272 -0.0160* (-0.30) (-0.33) (0.07) (0.68) (0.18) (-2.20)
common law -0.548* 0.279 -0.716*** 0.970* 1.255* 0.281 (-2.13) (0.6) (-3.39) (2.2) (2.54) (0.75)
ethnic fractionalization
-0.0324 -1.211 0.492 1.203 -0.482 1.424** (-0.06) (-1.31) (1.35) (1.41) (-0.45) (3)
regime duration -0.00808 -0.00489 -0.00648 -0.00696 0.013 -0.0116 (-0.93) (-0.37) (-1.15) (-0.40) (0.74) (-0.94) democracy 0.425* 0.937* 0.228 -0.111 -0.338 0.302 (2.05) (2.33) (1.64) (-0.43) (-0.78) (0.97) civil war 1.580*** 23.77 -0.021 0.866 29.91 -0.685

110
LMICS SUB-SAHARAN AFRICA
OLS Two- part model OLS Two- part model ln (PPI+1) Part 1 Part 2 ln (PPI+1) Part 1 Part 2 (3.53) (0.0) (-0.04) (1.6) (0.0) (-1.60)
ln (domestic credit)
0.418* -0.255 0.405*** 0.575** -0.245 0.708*** (2.27) (-1.01) (4.3) (2.61) (-0.84) (3.94)
fiscal freedom 0.0270* 0.0325* 0.0129 0.0133 0.0394** 0.0124 (2.15) (2.45) (1.46) (1.06) (2.64) (1.02)
business freedom 0.0101 -0.00427 0.0108 -0.0297* -0.0315 -0.0397** (1.05) (-0.27) (1.29) (-2.01) (-1.72) (-3.14)
investment freedom
0.0131 0.0046 0.0075 -0.000604 -0.00274 0.0064 (1.88) (0.43) (1.84) (-0.07) (-0.21) (0.55)
inflation -0.00159 -0.00191 -0.00101* -0.00457 -0.0217 0.00592 (-0.85) (-0.87) (-1.99) (-0.48) (-1.73) (0.71) openness 0.174 1.898** -0.276 -0.0263 0.882 -0.621 (0.49) (2.86) (-0.99) (-0.06) (1.34) (-1.44) _cons -28.27*** -29.31*** -19.84*** -23.88*** -30.26*** -13.43*** (-7.75) (-5.13) (-6.07) (-4.67) (-5.21) (-3.39) N 1051 1051 854 340 340 225
Notes: (1) t statistics in parentheses (2) * p<0.05, ** p<0.01, *** p<0.001 (3) Standard errors clustered on countries (4) The estimation includes year fixed effects (not shown here)

111
Appendix G Determinants of PPI- Robustness Checks
For the robustness checks, using the streamlined model established above as the starting point, I run the following alternative specifications:
Regression (1): I substitute indicators of structural aspects of the country’s economy (value added of services, industry, and agriculture) and the level of aid received with the GDP per capita.
Regression (2): In addition to substitutions made in (1), I also substitute the indices of business and investment freedom with the index of property rights protection from the IEF.
Regression (3): I use alternative measures from the World Bank’s World Governance Indicators (WGI) to proxy for political stability (i.e., I substitute the indicators for civil war, regime durability and ethnic fractionalization with the WGI’s index for political stability and absence of violence), as well as for business and investment freedom and freedom from corruption (i.e., I substitute the IEF’s indices for business and investment freedom as well as freedom from corruption with the WGI’s government effectiveness, regulatory quality and rule of law, and control of corruption indices).
Regressions (4) and (5): I use two different measures of political stability respectively substituting civil war, regime durability, and ethnic fractionalization with the US State Department’s Political Terror Scale (PTS) measure of political violence and terror and the WGI political stability and absence of violence index.
Regression (6): I substitute the business and investment freedom indices with an overall quality of government index from the International Country Risk Guide (ICRG).
Regression (7): For the SSA regressions, I run the streamlined model without South Africa
Table 1 below gives definitions and sources for the alternate proxies used in (4), (5), and (6).
Tables 2 – 5 provide the respective two-part model results for regressions (1) through (6) for all LMICs and SSA countries. Finally, Table 6 provides the results for regression (7).

112
Table 1 Alternative proxies for perception-based measures Alternative
measure for Measure Definition Source
Civil war, regime durability, ethnic fractionalization
Political stability and absence of violence
Measures perceptions of the likelihood that the government will be destabilized or overthrown by unconstitutional or violent means, including
politically-motivated violence and terrorism.
Worldwide Governance Indicators (WGI), World
Bank
Political violence and terror
Measures levels of political violence and terror that a country experiences in a particular year
based on a 5-level “terror scale.”
US State Department data
Business freedom, fiscal freedom and investment freedom
Government effectiveness
Captures perceptions of the quality of public services, the quality of the civil service and the
degree of its independence from political pressures, the quality of policy formulation and
implementation, and the credibility of the government's commitment to such policies.
WGI, World Bank
Regulatory Quality
Captures perceptions of the ability of the government to formulate and implement sound
policies and regulations that permit and promote private sector development.
WGI, World Bank
Quality of government
Mean index of the ICRG variables “Corruption”, “Law and Order” and “Bureaucracy Quality”,
scaled 0-1. Higher values indicate higher quality of government.
International Country Risk Group (ICRG)
ratings
Property rights protection
Rule of Law
Captures perceptions of the extent to which agents have confidence in and abide by the
rules of society, and in particular the quality of contract enforcement, property rights, the
police, and the courts, as well as the likelihood of crime and violence.
WGI World Bank
Corruption Control of corruption
Captures perceptions of the extent to which public power is exercised for private gain, including both petty and grand forms of
corruption, as well as "capture" of the state by elites and private interests
WGI World Bank
Table 2 Robustness checks for all LMICs – Part 1
(1) (2) (3) (4) (5) (6)
gfcfconstant 2.96E-15 -5.07E-14 2.57E-11 4.13E-12 -1.01E-13 2.25E-11 (0.00) (-0.05) (-1.73) (-0.51) (-0.11) (-1.44)
government size 0.0166 0.0152 0.0147 -0.000408 0.0155 0.0186

113
(1) (2) (3) (4) (5) (6)
(-1.53) (-1.40) (-1.36) (-0.03) (-1.22) (-1.59)
ln (resource rents)
-0.166 -0.185 0.0448 -0.0512 -0.0201 0.0229 (-1.27) (-1.37) (-0.34) (-0.29) (-0.11) (-0.16)
ln (GDP per capita)
1.045*** 1.001*** (-3.75) (-3.64)
ln (population) 1.244*** 1.261*** 1.007*** 1.050*** 1.075*** 1.138*** (-5.41) (-5.43) (-4.87) (-4.12) (-4.28) (-5.00)
common law 0.267 0.339 0.576 0.0656 -0.0107 0.621 (-0.56) (-0.68) (-1.47) (-0.12) (-0.02) (-1.41)
ethnic fractionalization
0.0459 0.0238 -0.00325 (-0.05) (-0.03) (-0.00)
regime duration -0.0075 -0.00595 -0.00454 (-0.57) (-0.44) (-0.32)
democracy 0.899* 0.945* 0.417 1.221 1.048* 0.721 (-2.31) (-2.40) (-1.04) (-1.95) (-2.33) (-1.68)
civil war 23.75 23.91 24.21 (0.00) (0.00) (0.00)
ln (domestic credit)
0.0319 0.033 -0.529* -0.551 0.00951 -0.511 (-0.13) (-0.14) (-2.08) (-1.53) (-0.03) (-1.86)
business freedom
-0.0186 -0.0438 (-1.27) (-1.88)
investment freedom
-0.00109 0.0172 (-0.11) (-1.11)
fiscal freedom 0.0434*** 0.0426*** 0.0508*** 0.0757*** 0.0567*** 0.0553*** (-3.57) (-3.48) (-4.00) (-4.02) (-4.02) (-4.05)
inflation -0.00355 -0.00345 -0.0117 -0.0223* -0.00187 -0.0172 (-1.63) (-1.58) (-1.25) (-2.21) (-0.81) (-1.82)
openness 2.004** 2.031** 2.507*** 2.300** 1.879* 2.682*** (-3.25) (-3.25) (-3.76) (-2.7) (-2.44) (-3.68)
property rights -0.016 (-1.38)
aid -0.00602 -0.00682 -0.00582 -0.00598 (-1.57) (-1.47) (-1.47) (-1.53)

114
(1) (2) (3) (4) (5) (6)
ln (industry) -0.129 1.003 0.809 0.0469 (-0.22) (-1.36) (-1.15) (-0.08)
ln (services) 2.095* 2.606* 2.583* 2.657** (-2.33) (-2.06) (-2.23) (-2.73)
WGI political stability
0.0112 0.0213 (-0.04) (-0.07)
WGI govt. effectiveness
0.23 (-0.33)
WGI reg. quality 1.331** (-2.75)
WGI rule of law
-0.664 (-0.93)
WGI corruption -0.418 -0.0629 (-0.75) (-0.14)
freedom from -0.0119 -0.00632 corruption (-0.68) (-0.47)
PTS political stability
-0.512 (-0.77)
ICRG quality of government
-0.702 (-0.42)
_cons -31.16*** -31.43*** -27.28*** -31.52*** -34.20*** -32.89*** (-6.73) (-6.75) (-4.69) (-4.20) (-5.01) (-5.37)
lnsig2u
_cons 0.648 0.713* -0.62 0.217 0.46 0.0481 (1.78) (2.07) (-0.88) (0.38) (1.11) (0.1)
N 1088 1088 742 501 855 742 Notes: (1) The dependent variable is the dummy variable equal 1 when PPI is positive and 0 when PPI is zero (2) t statistics in parentheses; * p<0.05, ** p<0.01, *** p<0.001 (3) Standard errors clustered on countries (4) The estimation includes year fixed effects (not shown here)

115
Table 3 Robustness checks for all LMICs- Part 2
(1) (2) (3) (4) (5) (6)
gfcfconstant 1.55e-12** 1.57e-12** 1.59E-12 9.67E-13 1.75e-12*** 1.89E-12
(-3.03) (-2.89) (-1.38) (-0.74) (-3.90) (-1.67)
government size
-0.0044 -0.00463 -0.00603 -0.0108 -0.00451 -0.00403
(-0.95) (-0.99) (-1.07) (-1.61) (-0.89) (-0.70)
ln (resource rents)
-0.0705 -0.0725 -0.0508 0.0106 -0.170* -0.0672
(-1.10) (-1.08) (-0.58) (0.13) (-2.29) (-0.69)
ln (GDP per capita) 0.883*** 0.895***
(-6.67) (-7.24)
ln (population) 0.986*** 0.972*** 0.767*** 0.722*** 0.765*** 0.766***
(-16.04) (-15.73) (-8.76) (-6.38) (-8.63) (-8.38)
common law -0.448* -0.531** -0.486* -0.637* -0.471 -0.552*
(-2.27) (-2.64) (-2.11) (-2.39) (-1.92) (-2.36)
ethnic fractionalization 0.238 0.276 0.525
(-0.78) (-0.90) (-1.23)
regime duration -0.00733 -0.00721 -0.00849
(-1.55) (-1.50) (-1.51)
democracy 0.174 0.163 0.252 0.427* 0.212 0.279
(-1.31) (-1.20) (-1.71) (-2.13) (-1.32) (-1.74)
civil war 0.104 0.0673 -0.0712
(-0.35) (-0.23) (-0.17)
ln (domestic credit) 0.275** 0.279** 0.334*** 0.537*** 0.373*** 0.388***
(-3.02) (-2.97) (-3.47) (-3.88) (-3.85) (-3.78)
business freedom
0.00659 0.00735
(-0.79) (-0.70)
investment freedom
0.00885* 0.0108
(-2.15) (-1.73)
fiscal freedom 0.0056 0.00713 0.00668 0.01 0.0202* 0.0144
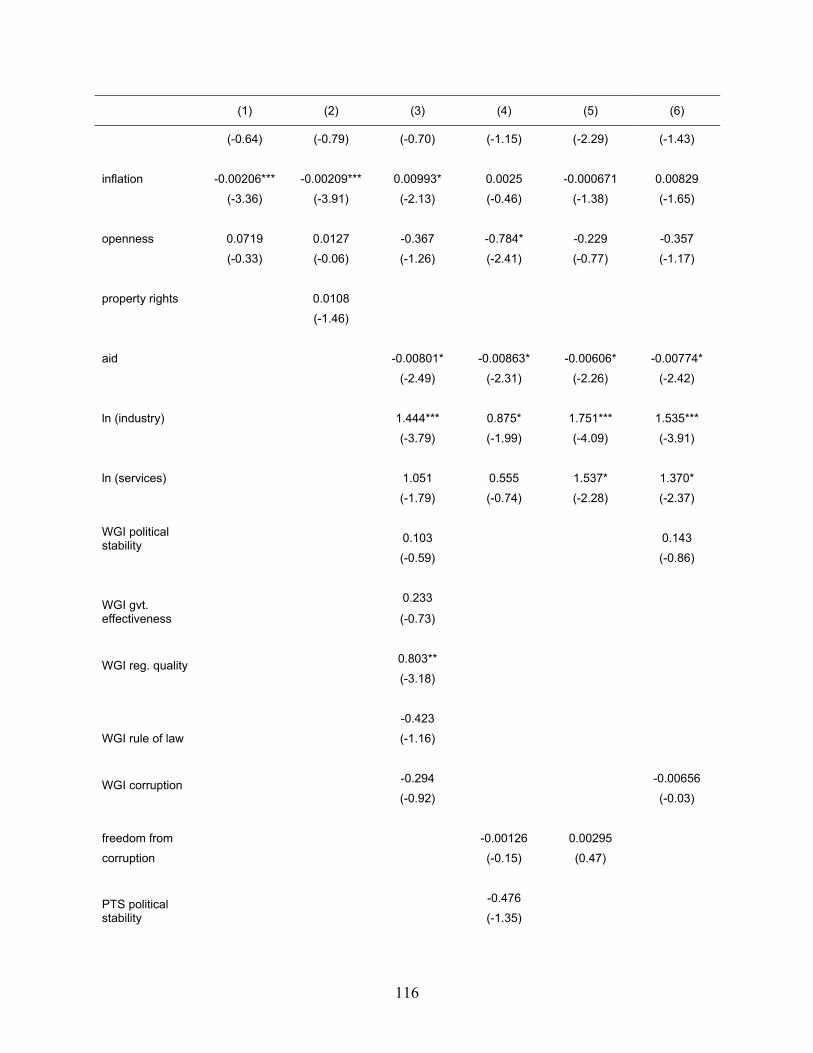
116
(1) (2) (3) (4) (5) (6)
(-0.64) (-0.79) (-0.70) (-1.15) (-2.29) (-1.43)
inflation -0.00206*** -0.00209*** 0.00993* 0.0025 -0.000671 0.00829
(-3.36) (-3.91) (-2.13) (-0.46) (-1.38) (-1.65)
openness 0.0719 0.0127 -0.367 -0.784* -0.229 -0.357
(-0.33) (-0.06) (-1.26) (-2.41) (-0.77) (-1.17)
property rights 0.0108
(-1.46)
aid -0.00801* -0.00863* -0.00606* -0.00774*
(-2.49) (-2.31) (-2.26) (-2.42)
ln (industry) 1.444*** 0.875* 1.751*** 1.535***
(-3.79) (-1.99) (-4.09) (-3.91)
ln (services) 1.051 0.555 1.537* 1.370*
(-1.79) (-0.74) (-2.28) (-2.37)
WGI political stability 0.103 0.143
(-0.59) (-0.86)
WGI gvt. effectiveness
0.233
(-0.73)
WGI reg. quality 0.803**
(-3.18)
WGI rule of law
-0.423
(-1.16)
WGI corruption -0.294 -0.00656
(-0.92) (-0.03)
freedom from -0.00126 0.00295
corruption (-0.15) (0.47)
PTS political stability
-0.476
(-1.35)

117
(1) (2) (3) (4) (5) (6)
ICRG quality of government 0.0188
(-0.02)
_cons -19.63*** -19.18*** -16.72*** -13.40** -20.46*** -19.12***
(-15.00) (-14.40) (-4.58) (-3.08) (-5.50) (-5.36)
N 886 886 616 415 719 616 Notes: (1) The dependent variable is ln(PPI constant) (2) t statistics in parentheses; * p<0.05, ** p<0.01, *** p<0.001 (3) Standard errors clustered on countries (4) The estimation includes year fixed effects (not shown here)
Table 4 Robustness checks for SSA- Part 1
(1) (2) (3) (4) (5) (6)
gfcfconstant 1.71E-12 1.21E-12 3.79E-10 4.55E-11 5.76E-13 4.08E-10 (-0.15) (-0.10) (-1.10) (-0.25) (-0.12) (-1.18)
government size
0.00675 0.00719 0.0322 -0.0406 0.029 0.0332 (-0.48) (-0.49) (-1.66) (-1.13) (-1.45) (-1.72)
ln (resource rents)
-0.0326 -0.0394 0.14 -0.21 0.118 0.174 (-0.27) (-0.31) (-0.71) (-0.58) (-0.43) (-0.93)
ln (GDP per capita)
0.901*** 0.820** (-3.51) (-3.04)
ln (population) 1.275*** 1.266*** 0.632* 1.268* 0.592* 0.669* (-4.81) (-4.61) (-2.08) (-2.17) (-2.12) (-2.17)
common law 1.165* 1.101* 1.434* 0.83 1.268* 1.488* (-2.48) (-2.20) (-2.38) (-0.72) (-2.31) (-2.51)
ethnic fractionalization
-0.685 -0.792 -0.991 (-0.69) (-0.76) (-0.39)
regime duration -0.00139 -0.00228 0.0111 (-0.08) (-0.13) (-0.45)
democracy -0.258 -0.349 -0.443 1.201 -0.858 -0.489 (-0.64) (-0.86) (-0.77) (-0.80) (-1.80) (-0.86)
civil war 28.63 22.49 29.66 (0.00) (0.00) (0.00)
ln (domestic credit)
0.0912 0.0734 -0.46 -0.238 0.00895 -0.427 (-0.34) (-0.27) (-1.17) (-0.26) (-0.03) (-1.07)
business freedom
-0.0295 -0.0854 (-1.69) (-1.69)

118
(1) (2) (3) (4) (5) (6)
investment freedom
-0.00697 0.00773 (-0.58) (-0.25)
fiscal freedom 0.0328* 0.0342* 0.0363 0.114** 0.0514** 0.0366 (-2.33) (-2.45) (-1.79) (-2.78) (-2.88) (-1.79)
inflation -0.0218 -0.02 -0.0198 -0.111* -0.0114 -0.0205 (-1.93) (-1.75) (-1.14) (-2.22) (-0.83) (-1.20)
openness 1.477** 1.608** 2.071* 1.31 1.03 2.067* (-2.58) (-2.59) (-2.15) (-0.61) (-1.01) (-2.13)
property rights -0.0162 (-1.21)
aid -0.00295 -0.00759 -0.00475 -0.00261 (-0.69) (-1.06) (-1.22) (-0.63)
ln (industry) -0.339 1.532 0.876 -0.312 (-0.40) (-1.06) (-1.21) (-0.37)
ln (services) 1.916 1.457 2.63 2.011 (-1.51) (-0.53) (-1.85) (-1.62)
WGI political stability
0.0732 0.027 (-0.16) (-0.07)
WGI gvt. Effectiveness
0.36 (-0.36)
WGI reg. quality
0.208 (-0.24)
WGI rule of law -0.558 (-0.52)
WGI corruption 0.672 0.727 (-0.87) (-1.13)
freedom from -0.0245 0.00498 corruption (-0.67) (-0.29)
PTS political stability
-2.294 (-1.37)
ICRG quality of government
-1.563 (-0.68)

119
(1) (2) (3) (4) (5) (6)
_cons -27.60*** -28.28*** -20.84* -27.67 -26.73*** -22.08** (-5.54) (-5.46) (-2.44) (-1.77) (-3.80) (-2.82)
lnsig2u -12.39 -3.104 -2.544 -0.363 -11.89 -1.934
_cons (-0.38) (-0.74) (-0.56) (-0.21) (-0.33) (-0.78) N 344 344 237 145 255 237
Notes: (1) The dependent variable is the dummy variable equal 1 when PPI is positive and 0 when PPI is zero (2) t statistics in parentheses; * p<0.05, ** p<0.01, *** p<0.001 (3) Standard errors clustered on countries (4) The estimation includes year fixed effects (not shown here)
Table 5 Robustness checks for SSA- Part 2
(1) (2) (3) (4) (5) (6)
gfcfconstant 6.08E-12 1.71E-13 3.25E-11 6.38E-12 2.69E-11 2.81E-11 (-0.34) (-0.01) (-1.64) (-0.24) (-1.39) (-1.67)
government size -0.00104 -0.00554 -0.00448 0.02 0.0258 -0.00258 (-0.10) (-0.47) (-0.40) (-0.99) (-1.95) (-0.26)
ln (resource rents) -0.00635 0.00624 0.0253 -0.101 -0.509*** 0.0227
(-0.06) (-0.06) (-0.18) (-0.41) (-3.32) (-0.17)
ln (GDP per capita) 0.651*** 0.605**
(-3.81) (-2.83)
ln (population) 0.745*** 0.803*** 0.757*** 0.835** 0.529* 0.733*** (-4.01) (-4.11) (-4.25) (-3.25) (-2.51) (-4.68)
common law 0.135 -0.101 -0.304 0.602 0.0202 -0.269 (-0.33) (-0.24) (-0.90) (-0.85) (-0.04) (-0.88)
ethnic fractionalization
1.152 1.212 1.231 (-1.88) (-1.80) (-0.87)
regime duration -0.0132 -0.00834 -0.0171 (-1.08) (-0.73) (-1.09)
democracy 0.0998 -0.000793 0.509 0.808 -0.531 0.497 (-0.32) (-0.00) (-1.37) (-1.25) (-1.49) (-1.25)
civil war -0.0764 -0.387 -1.144* (-0.20) (-1.05) (-2.32)
ln (domestic 0.663*** 0.651** 0.666* 0.451 0.745** 0.656** credit) (-3.54) (-3.06) (-2.54) (-1.51) (-2.64) (-2.83)

120
(1) (2) (3) (4) (5) (6)
business freedom
-0.0368** -0.0689** (-2.97) (-3.05)
investment freedom
0.0103 0.0193 (-0.90) (-0.89)
fiscal freedom 0.00791 0.0149 0.0119 -0.00384 0.0198 0.0162 (-0.62) (-1.02) (-0.66) (-0.26) (-1.52) (-1.00)
inflation 0.000615 0.00507 0.00317 0.00947 0.0125 0.002 (-0.09) (-0.67) (-0.38) (-0.19) (-1.00) (-0.26)
openness 0.167 0.212 -0.932* -2.002 -0.0632 -0.985*** (-0.42) (-0.48) (-2.42) (-1.74) (-0.07) (-3.29)
property rights -0.0153 (-0.96)
aid -0.00371 -0.00289 -0.000892 -0.00442 (-1.01) (-0.46) (-0.32) (-1.27)
ln (industry) 1.545*** 3.085*** 2.574*** 1.548*** (-3.51) (-4.09) (-5.61) (-3.59)
ln (services) 0.574 2.087 -0.192 0.545 (-0.65) (-1.49) (-0.20) (-0.58)
WGI political stability
0.273 0.282 (-1.13) (-1.38)
WGI govt effectiveness
-0.524 (-0.64)
WGI reg. quality 0.447 (-0.56)
WGI rule of law 0.186 (-0.37)
WGI corruption -1.165 -1.175** (-1.80) (-2.97)
freedom from -0.0374 -0.0266** corruption (-1.92) (-3.08)
PTS political stability
0.467 (-0.37)

121
(1) (2) (3) (4) (5) (6)
ICRG quality of government
-0.00565 (-0.00)
_cons -12.86*** -14.62*** -17.09** -24.64** -14.99** -16.91** (-3.60) (-4.04) (-2.97) (-2.58) (-2.70) (-3.00)
N 226 226 166 105 180 166 Notes: (1) The dependent variable is ln(PPI constant) (2) t statistics in parentheses; * p<0.05, ** p<0.01, *** p<0.001 (3) Standard errors clustered on countries (4) The estimation includes year fixed effects (not shown here)
Table 6 Results for SSA without South Africa
Part 1 Part 2
gfcfconstant 1.80E-12 3.79e-10***
(-0.16) (-4.09)
aid -0.00543 0.0024
(-1.77) (-0.75)
government size 0.0157 0.00867
(-1.06) (-0.74)
ln (industry) 0.745 1.851***
(-1.38) (-4.9)
ln (services) 4.134*** 0.957
(-3.71) (-1.02)
ln (resource rents) 0.135 -0.149
(-0.95) (-1.33)
ln (population) 0.671** 0.314
(-2.76) (-1.57)
freedom from corruption 0.00244 -0.0306**
(-0.16) (-3.10)
common law 1.204* 0.357
(-2.45) (-0.88)
ethnic fractionalization
-0.504 1.390**
(-0.47) (-2.95)

122
Part 1 Part 2
regime duration 0.0159 -0.0101
(-0.90) (-0.90)
democracy -0.365 0.37
(-0.84) (-1.27)
civil war 30.36 -0.717
(0.00) (-1.68)
ln (domestic credit)
-0.368 0.559**
(-1.18) (-2.92)
fiscal freedom 0.0424** 0.00253
(-2.80) (-0.20)
business freedom -0.0337 -0.0308*
(-1.82) (-2.38)
investment freedom
-0.00283 0.00949
(-0.21) (-0.78)
inflation -0.0204 -0.00325
(-1.63) (-0.35)
openness 0.936 -0.558
(-1.42) (-1.30)
_cons -29.67*** -10.54** (-5.15) (-2.65)
lnsig2u -12.42 _cons (-0.37)
N 327 212 Notes: (1) The dependent variable in Part 1 is the dummy variable equal 1 when PPI is positive and 0 when PPI
is zero; the dependent variable in Part 2 is ln(PPI constant) (2) t statistics in parentheses (3)* p<0.05, ** p<0.01, *** p<0.001 (4) Standard errors clustered on countries (5) The estimations include year fixed effects (not shown here)

123
Appendix H PPP Contracts for PPI- Definitions
The table below summarizes the types of PPP contracts that have been used to facilitate PPI. As described, the level of private involvement in each of the PPP contract varies in terms of capital invested by the private sector as well as the level of risk assumed.
Contract type Description Management Government pays a private operator to manage the facility. The operational risk
remains with the government (private entity does not assume full commercial risk for tariff collection or other things).
Lease The government leases the assets to a private operator for a fee. The private operator takes on the operational risk (no obligation for the private entity to invest in infrastructure but private entity operates and maintains the facility at its own commercial risk with income derived directly from tariffs).
Greenfield project (BLT, BOO, BOT)*
Private entity or a public-private joint venture builds and operates a new facility for the period specified in the project contract. The facility may return to the public sector at the end of the concession period.
Concession (ROT, RLT, BROT)**
Private entity takes over the management of a state-owned enterprise for a given period during which it also assumes significant investment risk (private entity has investment obligations to build, expand and/or rehabilitate facilities).
Divestiture (can be full or partial)
Private entity buys an equity stake in a state-owned enterprise through an asset sale, public offering, or mass privatization program.
*Build-Lease- Transfer; Build-Operate-Own; Build-Own-Operate-Transfer ** Rehabilitate-Operate-Transfer; Rehabilitate-Lease-Transfer; Build-Rehabilitate-Operate- Transfer
Source: PPI database glossary(World Bank 2012)

124
Appendix I Determinants of the Extent of PPI- Results
Model 3 below describes the model specification used to estimate the determinants of the extent of private participation in infrastructure. The dependent variable, contracttype, is constructed from project-level data by assigning an ordinal variable ranking to the contract type such that management and lease contracts are assigned a value of 1, greenfield projects a value of 2, concessions a value of 3, and divestitures a value of 4. For the independent variables, along the same lines as in Chapter 4, X represents the factors influencing government motivations, Y the factors influencing private sector motivations, and Z the factors influencing the enabling environment. In addition, sector-level dummies (S ) are introduced as potential explanatory variables, and time fixed effects are included to control for time-specific shocks.
An ordered logit is used to estimate the model, and the results are outlined in the table below. The results on the left hand side include all the relevant explanatory variables, and those on the right hand side address the potential multicollinearity in the model specifications by excluding the variables that may be collinear with each other.
Model 3:
Table 1 Determinants of the Extent of PPI
Results with all the relevant indicators
considered Results accounting for multicollinearity
LMICs SSA LMICs SSA
gfcfconstant 2.79E-14 -4.21E-11 8.37E-14 1.01E-12 (0.16) (-1.64) (0.50) (0.82)
aid 0.00115 0.00106 0.000426 -0.0006 (0.62) (0.26) (0.26) (-0.20)
government size -0.0136*** 0.00554 -0.0131*** 0.00179 (-5.53) (0.4) (-5.50) (0.15)
ln (agriculture) 0.208 -0.554 (1.71) (-1.08)
ln (industry) 0.27 0.622 -0.051 0.999 (1.03) (0.79) (-0.25) (1.75)
ln (services) 0.868* 1.982 0.381 2.295* (2.31) (1.84) (1.52) (2.50)
ln (resource rents) 0.036 -0.386* 0.0431 -0.425** (1.04) (-2.46) (1.30) (-2.90)
nittnititititnit SZYXpeContractty 3210

125
ln (GDP per Capita) 0.0589 -0.0635 (0.58) (-0.12)
ln (population) 0.114** 0.653* 0.0894** 0.378 (3.27) (2.20) (-2.70) (1.87)
corruption 0.00635 0.0183 -0.00144 0.0156 (1.76) (1.06) (-0.47) (1.01)
property rights -0.0129*** 0.00762 (-4.23) (0.46)
common law -0.472*** -0.154 -0.558*** -0.199 (-4.90) (-0.41) (-6.49) (-0.56)
ethnic -0.0143 -0.496 -0.0242 -0.0787 fractionalization (-0.09) (-0.40) (-0.15) (-0.07)
regime duration -0.00188 -0.00476 0.000149 0.000676 (-0.79) (-0.30) (0.07) -0.05
democracy 0.0973 -0.604 0.0215 -0.6 (1.39) (-1.49) (0.32) (-1.63)
civil war 0.121 0.725 -0.0507 0.659 (0.22) (0.78) (-0.10) -0.76
ln (domestic 0.219*** -0.00671 0.226*** -0.0889 credit) (4.00) (-0.02) (4.16) (-0.41)
fiscal freedom 0.00239 -0.016 0.0027 -0.011 (0.69) (-1.00) (0.78) (-0.75)
business 0.0178*** -0.0177 0.0141*** -0.0203 freedom (4.62) (-0.98) (3.93) (-1.20)
investment 0.00799** -0.0119 0.00502 -0.0092 freedom (2.84) (-0.90) (1.88) (-0.72)
inflation -0.00282** -0.0266* -0.00227* -0.00739 (-2.58) (-1.98) (-2.29) (-1.90)
openness -0.181 0.0855 -0.176 -0.0569 (-1.52) (0.13) (-1.50) (-0.10)
energy 4.087*** 5.999*** 4.083*** 5.863*** (32.09) (7.46) (32.14) (7.47)
telecom 3.527*** 9.225*** 3.517*** 8.954***
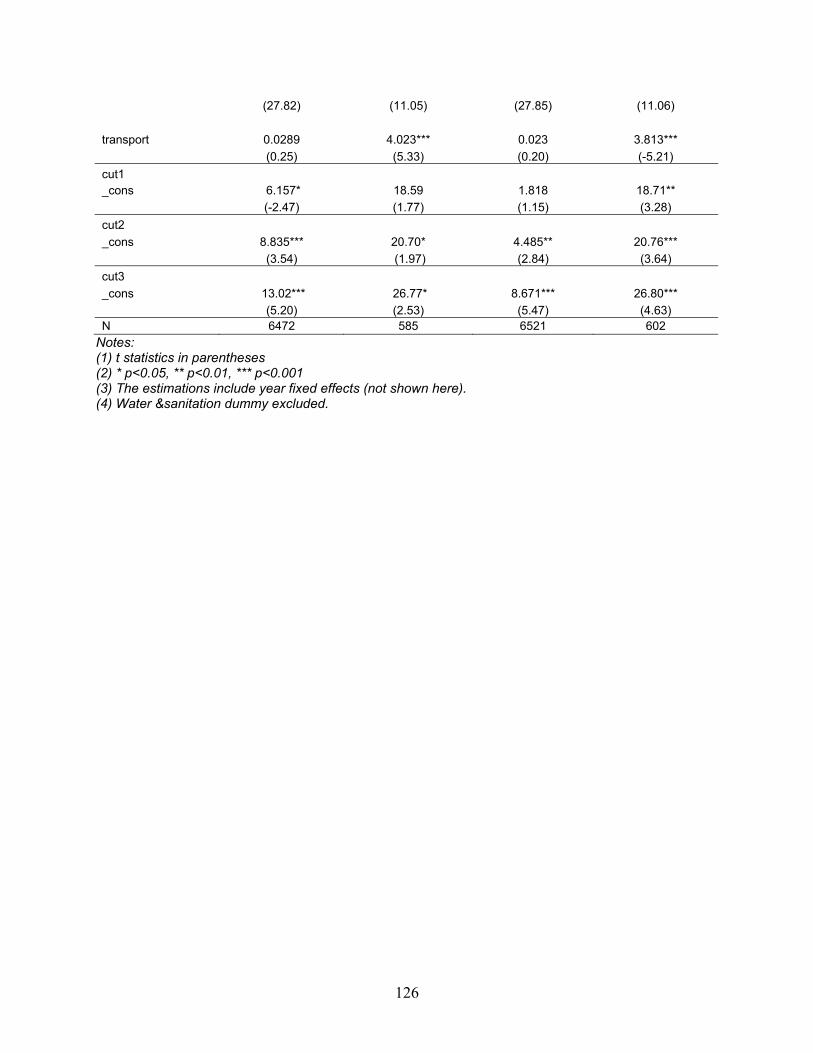
126
(27.82) (11.05) (27.85) (11.06)
transport 0.0289 4.023*** 0.023 3.813*** (0.25) (5.33) (0.20) (-5.21) cut1 _cons 6.157* 18.59 1.818 18.71** (-2.47) (1.77) (1.15) (3.28) cut2 _cons 8.835*** 20.70* 4.485** 20.76*** (3.54) (1.97) (2.84) (3.64) cut3 _cons 13.02*** 26.77* 8.671*** 26.80*** (5.20) (2.53) (5.47) (4.63) N 6472 585 6521 602
Notes: (1) t statistics in parentheses (2) * p<0.05, ** p<0.01, *** p<0.001 (3) The estimations include year fixed effects (not shown here). (4) Water &sanitation dummy excluded.

127
Appendix J Robustness Checks
For the robustness checks, using the model accounting for multicollinearity as the starting point, I run the following alternative specifications:
Regression (1): I substitute indicators of structural aspects of the country’s economy (value added of services, industry, and agriculture) and the level of aid received with the GDP per capita.
Regression (2): In addition to substitutions made in (1), I also substitute the indices of business and investment freedom with the index of property rights protection from the IEF.
Regression (3): I substitute the indicators for civil war, regime durability and ethnic fractionalization with the WGI’s index for political stability and absence of violence, as well the IEF’s indices for business and investment freedom and freedom from corruption with the WGI’s government effectiveness, regulatory quality and rule of law, and control of corruption indices.
Regressions (4) and (5): I use two different measures of political stability respectively substituting civil war, regime durability, and ethnic fractionalization with the US State Department’s Political Terror Scale (PTS) measure of political violence and terror and the WGI political stability and absence of violence index.
Regression (6): I substitute the business and investment freedom indices with an overall quality of government index from the International Country Risk Guide (ICRG).
Regression (7): For the SSA regressions, I run the streamlined model without South Africa
Table 1 in Appendix G gives definitions and sources for the alternate proxies used in (4), (5),
and (6). Tables 1 and 2 provide the respective robustness check results for all LMICs and SSA countries for regressions (1) – (6). Finally, Table 3 provides the results for regression (7).
Table 1: Robustness checks LMIC sample
(1) (2) (3) (4) (5) (6) gfcfconstant 7.77E-14 5.89E-14 -1.46E-13 1.53E-13 4.76E-14 -1.15E-13
(0.47) (0.35) (-0.73) (0.49) (0.28) (-0.58)
government -0.0134*** -0.0115*** -0.0106*** -0.00926* -0.0115*** -0.00920** size (-5.85) (-5.10) (-3.63) (-2.10) (-4.70) (-3.28)
ln (resource 0.0159 -0.00836 -0.0201 -0.0791 0.0636 0.0055 rents) (0.56) (-0.30) (-0.52) (-1.43) (1.75) (0.15)

128
ln (GDP per 0.0338 0.184*** Capita) (0.61) (3.65)
ln (population) 0.104*** 0.0415 0.0386 -0.00696 0.0417 0.0267 (3.39) (1.48) (1.06) (-0.12) -1.27 -0.75
common law -0.548*** -0.401*** -0.257* -0.476** -0.544*** -0.431*** (-6.25) (-4.39) (-2.21) (-2.82) (-5.98) (-4.34)
ethnic 0.0344 0.0079 -0.115 fractionalization (0.23) (0.05) (-0.68)
regime duration -0.00111 -0.00188 -0.00122 (-0.51) (-0.85) (-0.52)
democracy 0.019 0.126 0.0657 -0.262* 0.109 -0.00771 (0.29) (1.86) (0.76) (-2.03) (1.52) (-0.09)
civil war -0.29 -0.469 -0.184 (-0.58) (-0.94) (-0.35)
ln (domestic 0.196*** 0.244*** 0.288*** 0.331*** 0.301*** 0.279*** credit) (4.01) (4.97) (4.36) (3.51) (5.09) (4.24)
business 0.0144*** 0.0163** freedom (4.1) (2.58)
investment 0.00525* 0.00997* freedom (2.03) (2.12)
fiscal freedom 0.00406 0.0056 -0.00212 -0.00779 0.00308 -0.00074 (1.26) (1.76) (-0.51) (-1.21) -0.82 (-0.19)
inflation -0.00272* -0.00272* -0.00480* -0.0160* -0.00212* -0.00428* (-2.53) (-2.54) (-2.15) (-2.56) (-2.07) (-1.98)
openness -0.203 -0.357*** -0.398** -0.590** -0.348** -0.439** (-1.89) (-3.44) (-2.74) (-2.81) (-2.95) (-3.16)
energy 4.219*** 4.214*** 3.960*** 4.504*** 4.055*** 3.966*** (33.77) (33.77) (27.08) (18.16) (31.6) (27.15)
telecom 3.618*** 3.600*** 3.467*** 3.667*** 3.495*** 3.453*** (29.26) (29.16) (23.67) (15.16) (27.38) (23.61)
transport 0.15 0.168 -0.0565 -0.302 0.07 -0.0686 (1.34) (1.50) (-0.43) (-1.39) (0.61) (-0.52)
property rights -0.00395

129
(-1.64)
aid -0.00052 0.00209 -0.00056 -0.00027 (-0.29) (0.76) (-0.28) (-0.15)
ln (industry) 0.221 0.163 -0.219 0.238 (0.96) (0.49) (-0.96) -1.05
ln (services) 0.884** 0.441 0.224 1.080*** (2.96) (1.04) (0.82) (3.94)
WGI political 0.183* 0.148 Stability (2.23) (1.84)
WGI government 0.166 effectiveness (0.86)
WGI regulatory 0.0472 Quality (0.33)
WGI rule of law -0.562** (-3.09)
WGI corruption 0.148 -0.116 (0.88) (-1.16)
freedom from corruption -0.0179** 0.00582
(-2.89) (1.78)
PTS political 0.243 Stability (1.09)
ICRG quality of -0.514 government (-1.30) cut1 _cons 1.249 0.274 2.149 -0.536 -1.199 2.902
(1.60) (0.38) (1.11) (-0.19) (-0.66) (1.59) cut2 _cons 3.819*** 2.842*** 4.840* 2.443 1.525 5.590**
(4.90) (3.90) (2.50) (0.87) (0.84) (3.06) cut3 _cons 7.993*** 7.010*** 9.049*** 7.124* 5.664** 9.797***
(10.14) (9.51) (4.66) (2.53) (3.13) (5.33) N 6816 6816 4818 2258 6162 4818
Notes: (1) t statistics in parentheses (2) * p<0.05, ** p<0.01, *** p<0.001 (3)The estimations include year fixed effects (not shown here). (4) Water &sanitation dummy excluded.

130
Table 2 Robustness checks SSA sample
(1) (2) (3) (4) (5) (6)
gfcfconstant -1.79E-11 -1.97E-11 8.63E-13 2.37E-12 2.38E-12 1.17E-12 (-0.82) (-0.92) (0.67) (0.10) (1.72) (0.95)
government -0.00782 -0.0088 -0.0135 0.0126 0.0222 -0.0128 size (-0.66) (-0.76) (-0.95) (0.61) (1.42) (-0.97)
ln (resource -0.489*** -0.454*** -0.396* -0.166 -0.598* -0.464** Rents) (-4.00) (-3.84) (-2.37) (-0.57) (-2.51) (-2.94)
ln (GDP 0.427 0.363 per Capita) (1.73) (1.47)
ln (population) 0.489* 0.550* 0.17 -0.388 0.31 0.163 (2.08) (2.31) (0.82) (-1.09) (1.44) (0.83)
common law -0.0991 -0.295 -0.48 -0.229 -0.413 -0.281 (-0.28) (-0.86) (-1.24) (-0.42) (-1.13) (-0.86)
ethnic -0.054 -0.221 1.482 fractionalization (-0.05) (-0.21) (0.80)
regime duration -0.0075 -0.00653 0.0104 (-0.50) (-0.44) (0.62)
democracy -0.458 -0.618 -0.483 -1.086 -0.727 -0.254 (-1.28) (-1.69) (-1.06) (-1.40) (-1.82) (-0.59)
civil war 0.235 0.452 0.212 (0.31) (0.60) (0.23)
ln (domestic 0.0894 0.0822 0.221 0.0591 0.135 0.216 credit) (0.36) (0.33) (0.83) (0.13) (0.56) (0.89)
business -0.0157 -0.00931 freedom (-0.94) (-0.34)
investment 0.00365 -0.00262 freedom (0.30) (-0.12)
fiscal -0.0221 -0.0235 -0.0212 -0.0011 -0.00559 -0.0213 freedom (-1.64) (-1.75) (-1.12) (-0.03) (-0.33) (-1.22)
inflation -0.0266* -0.0257* -0.00791 -0.0305 -0.00231 -0.00634 (-2.08) (-2.01) (-1.50) (-1.02) (-0.49) (-1.58)
openness 0.112 0.00753 -0.529 -1.159 -0.53 -0.589 (0.21) (0.01) (-0.83) (-0.95) (-0.73) (-0.96)

131
energy 5.623*** 5.659*** 6.564*** 8.561*** 5.963*** 6.499*** (7.23) (7.26) (5.48) (6.80) (7.39) (5.44)
telecom 8.865*** 8.887*** 9.888*** 9.771*** 8.946*** 9.760*** (10.96) (10.94) (8.05) (8.31) (10.79) (8.00)
transport 3.693*** 3.727*** 4.904*** 4.272*** 3.937*** 4.815*** (5.05) (5.07) (4.20) (4.27) (5.30) (4.14)
property rights 0.00978 (0.66)
aid -0.000273 -0.000173 0.000755 -0.000193 (-0.09) (-0.03) (0.22) (-0.06)
ln (industry) 0.774 0.0536 1.058 0.866 (1.23) (0.06) (1.51) (1.53)
ln (services) 1.157 2.912 0.194 1.195 (1.22) (1.73) (0.17) (1.38)
WGI political -0.211 0.0492 Stability (-0.68) (0.19)
WGI government 0.643 effectiveness (0.77)
WGI regulatory -0.735 Quality (-0.96)
WGI rule of law 1.035 (1.29)
WGI corruption -0.924 -0.402 (-1.53) (-0.88)
corruption 0.0419 0.024 (1.43) (1.43)
PTS political -0.169 Stability (-0.10)
ICRG quality of government -2.609
(-1.27) cut1 _cons 10.48* 11.77** 10.53 7.647 13.50* 10.12
(2.33) (2.63) (1.51) (0.75) (2.18) (1.74) cut2
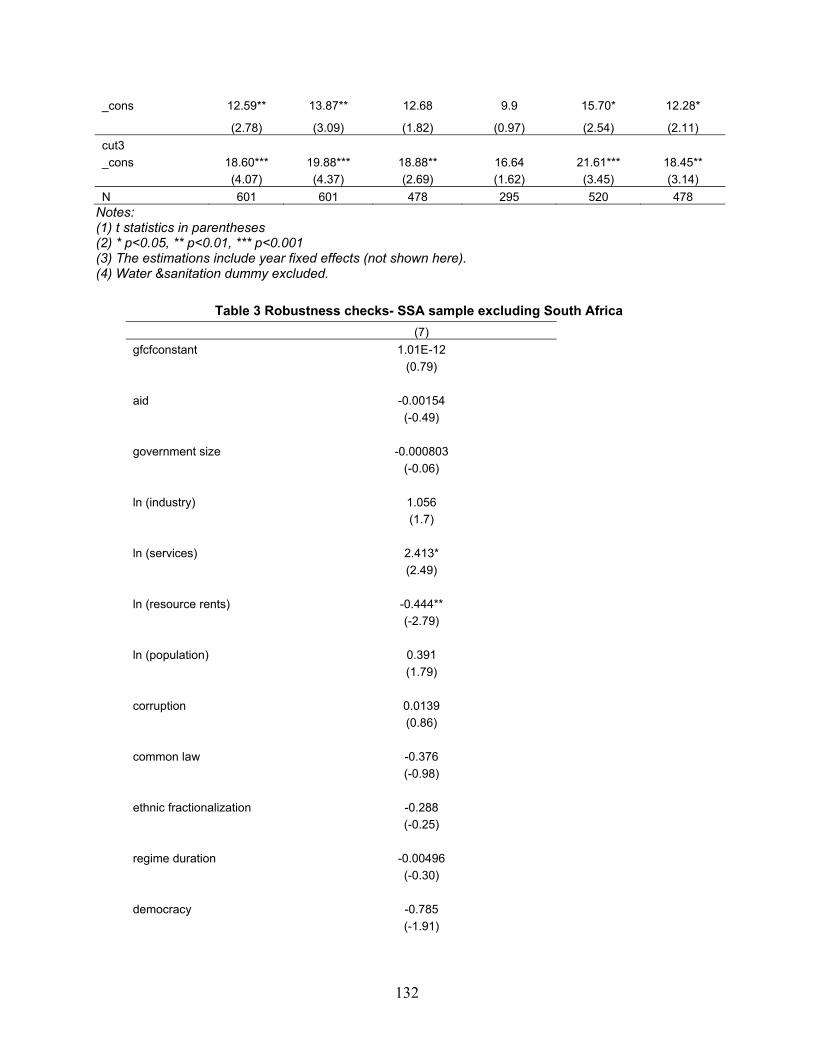
132
_cons 12.59** 13.87** 12.68 9.9 15.70* 12.28*
(2.78) (3.09) (1.82) (0.97) (2.54) (2.11) cut3 _cons 18.60*** 19.88*** 18.88** 16.64 21.61*** 18.45**
(4.07) (4.37) (2.69) (1.62) (3.45) (3.14) N 601 601 478 295 520 478
Notes: (1) t statistics in parentheses (2) * p<0.05, ** p<0.01, *** p<0.001 (3) The estimations include year fixed effects (not shown here). (4) Water &sanitation dummy excluded.
Table 3 Robustness checks- SSA sample excluding South Africa (7) gfcfconstant 1.01E-12
(0.79)
aid -0.00154 (-0.49)
government size -0.000803 (-0.06)
ln (industry) 1.056 (1.7)
ln (services) 2.413* (2.49)
ln (resource rents) -0.444** (-2.79)
ln (population) 0.391 (1.79)
corruption 0.0139 (0.86)
common law -0.376 (-0.98)
ethnic fractionalization -0.288 (-0.25)
regime duration -0.00496 (-0.30)
democracy -0.785 (-1.91)

133
civil war 0.617 (0.67)
ln (domestic credit) -0.129 (-0.46)
fiscal freedom -0.00621 (-0.39)
business freedom -0.00943 (-0.49)
investment freedom -0.0161 (-1.15)
inflation -0.00933* (-2.23)
openness -0.25 (-0.40)
telecom 3.740*** (7.24)
transport -1.968*** (-4.10)
water &sanitation -37.58 (-0.00)
cut1 _cons 13.40* (2.18) cut2 _cons 15.61*
(2.55) cut3 _cons 22.09*** (3.55) N 534
Notes: (1) t statistics in parentheses (2) * p<0.05, ** p<0.01, *** p<0.001 (3) The estimations include year fixed effects (not shown here). (4) Energy dummy excluded.
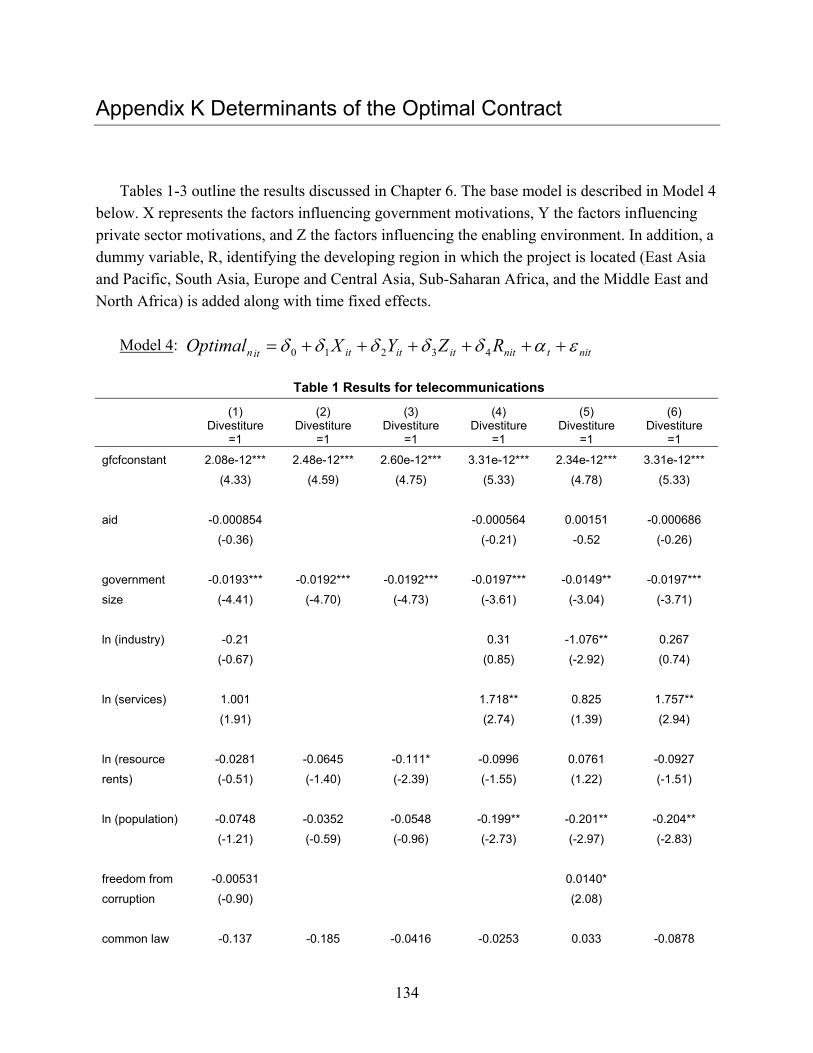
134
Appendix K Determinants of the Optimal Contract
Tables 1-3 outline the results discussed in Chapter 6. The base model is described in Model 4 below. X represents the factors influencing government motivations, Y the factors influencing private sector motivations, and Z the factors influencing the enabling environment. In addition, a dummy variable, R, identifying the developing region in which the project is located (East Asia and Pacific, South Asia, Europe and Central Asia, Sub-Saharan Africa, and the Middle East and North Africa) is added along with time fixed effects.
Model 4:
Table 1 Results for telecommunications
(1) (2) (3) (4) (5) (6) Divestiture
=1 Divestiture
=1 Divestiture
=1 Divestiture
=1 Divestiture
=1 Divestiture
=1
gfcfconstant 2.08e-12*** 2.48e-12*** 2.60e-12*** 3.31e-12*** 2.34e-12*** 3.31e-12***
(4.33) (4.59) (4.75) (5.33) (4.78) (5.33)
aid -0.000854 -0.000564 0.00151 -0.000686
(-0.36) (-0.21) -0.52 (-0.26)
government -0.0193*** -0.0192*** -0.0192*** -0.0197*** -0.0149** -0.0197***
size (-4.41) (-4.70) (-4.73) (-3.61) (-3.04) (-3.71)
ln (industry) -0.21 0.31 -1.076** 0.267
(-0.67) (0.85) (-2.92) (0.74)
ln (services) 1.001 1.718** 0.825 1.757**
(1.91) (2.74) (1.39) (2.94)
ln (resource -0.0281 -0.0645 -0.111* -0.0996 0.0761 -0.0927
rents) (-0.51) (-1.40) (-2.39) (-1.55) (1.22) (-1.51)
ln (population) -0.0748 -0.0352 -0.0548 -0.199** -0.201** -0.204**
(-1.21) (-0.59) (-0.96) (-2.73) (-2.97) (-2.83)
freedom from -0.00531 0.0140*
corruption (-0.90) (2.08)
common law -0.137 -0.185 -0.0416 -0.0253 0.033 -0.0878
nittnitititititn RZYXOptimal 43210

135
(-0.64) (-0.89) (-0.20) (-0.10) (0.14) (-0.36)
regime 0.00729 0.00184 0.0019 0.00873
duration (1.37) (0.37) (0.38) (1.61)
democracy -0.350** -0.378** -0.209 -0.161 -0.279 -0.214
(-2.58) (-2.85) (-1.60) (-0.96) (-1.93) (-1.31)
ln (domestic 0.116 0.222* 0.273** 0.260* 0.241* 0.236
credit) (1.08) (2.32) (2.85) (2.04) (1.98) (1.87)
fiscal freedom 0.00991 0.0131* 0.0132* 0.00883 -0.006 0.0109
(1.58) (2.17) (2.2) (1.2) (-0.84) (1.5)
business -0.00106 0.00372
freedom (-0.16) (0.6)
investment 0.00824 0.00503
freedom (1.77) (1.13)
inflation -0.0125*** -0.0140*** -0.0138*** -0.0309*** -0.0132*** -0.0330***
(-3.53) (-3.87) (-3.79) (-3.44) (-3.59) (-3.79)
openness -1.112*** -1.101*** -1.119*** -1.673*** -1.872*** -1.670***
(-4.31) (-4.42) (-4.59) (-5.33) (-6.40) (-5.34)
East Asia 0.226 -0.16 -0.24 0.587 0.931** 0.442
and Pacific (0.82) (-0.65) (-0.99) (1.75) (2.98) (1.39)
South Asia -1.473*** -1.520*** -1.578*** -0.945* -1.288*** -1.255**
(-4.03) (-3.96) (-4.12) (-2.11) (-3.52) (-3.21)
Sub Saharan -0.174 -0.242 -0.179 0.0314 -0.785** -0.0398
Africa (-0.69) (-0.93) (-0.70) (0.11) (-2.66) (-0.14)
Europe and -0.3 -0.234 -0.337* -0.117 0.016 -0.229
Central Asia (-1.67) (-1.44) (-2.07) (-0.52) (0.08) (-1.13)
Middle East -0.224 -0.33 -0.329 0.28 0.0238 0.012
& North Africa (-0.78) (-1.16) (-1.17) (0.74) (0.08) (0.04)
ln (GDP per -0.0586 0.074
capita) (-0.51) (0.69)

136
property -0.0167***
rights (-3.67)
WGI political 0.0358 -0.0596
stability (0.23) (-0.42)
WGI government -0.164
effectiveness (-0.45)
WGI regulatory 0.297
quality (1.11)
WGI rule of -0.475
law (-1.23)
WGI corruption -0.204 -0.420*
(-0.63) (-2.16)
ICRG quality -3.370***
of government (-4.62)
_cons -2.477 -0.175 0.379 -5.291 5.083 -5.08
(-0.93) (-0.12) (0.27) (-1.59) (1.64) (-1.63)
N 3106 3308 3308 2311 2823 2311 Notes: (1) t statistics in parentheses (2) * p<0.05, ** p<0.01, *** p<0.001 (3) The estimations include year fixed effects (not shown here). (4) Latin America and the Caribbean dummy excluded.
Table 2 Results for electricity
(1) (2) (3) (4) (5) (6) concession or greenfield=1
concession or greenfield=1
concession or greenfield=1
concession or greenfield=1
concession or greenfield=1
concession or greenfield=1
gfcfconstant 3.65e-12*** 3.53e-12*** 3.82e-12*** 3.95e-12*** 3.91e-12*** 3.62e-12***
(6.01) (5.77) (6.25) (5.63) (6.18) (5.58)
aid -0.0138* 0.0134 -0.0157* 0.0134
(-2.22) (1.44) (-2.41) (1.48)
government 0.0118 0.0181** 0.0150* 0.01 0.011 0.0143
size (1.6) (2.66) (2.2) (1.03) (1.38) (1.59)

137
ln (industry) -0.134 0.756 -0.326 0.774
(-0.23) (1.03) (-0.53) (1.05)
ln (services) -1.889* -1.589 -1.877* -0.572
(-2.38) (-1.52) (-2.27) (-0.60)
ln (resource rents) -0.17 -0.118 -0.108 -0.281* -0.127 -0.295*
(-1.77) (-1.61) (-1.50) (-2.33) (-1.20) (-2.47)
ln (population) -0.319** -0.420*** -0.291** -0.189 -0.359*** -0.157
(-3.01) (-4.18) (-3.07) (-1.61) (-3.34) (-1.39)
corruption 0.0118 0.00276
(1.76) (0.39)
common law 0.618 0.177 -0.0374 0.562 0.558 0.234
(1.84) (0.51) (-0.11) (1.43) (1.63) (0.64)
regime duration -0.00764 -0.00197 -0.000864 -0.00645
(-1.63) (-0.44) (-0.19) (-1.34)
democracy 0.125 0.0772 -0.168 0.176 0.067 0.0769
(0.82) (0.51) (-1.09) (0.82) (0.4) (0.4)
ln (domestic credit) -0.244 -0.135 -0.336* -0.481* -0.196 -0.384*
(-1.66) (-1.01) (-2.47) (-2.52) (-1.27) (-2.11)
fiscal freedom -0.00944 -0.00813 -0.0174* -0.0218 -0.0132 -0.00852
(-1.06) (-0.94) (-2.11) (-1.94) (-1.42) (-0.83)
business freedom -0.0278*** -0.0397***
(-3.48) (-4.67)
investment freedom 0.00375 0.00201
(0.6) (0.32)
inflation 0.0249** 0.0261** 0.0320*** 0.0279* 0.0301*** 0.0175
(2.85) (3) (3.63) (2.29) (3.31) (1.54)
openness 0.501 0.119 0.624 0.404 0.419 0.709

138
(1.41) (0.33) (1.82) (0.99) (1.18) (1.78)
East Asia 0.514 1.796*** 1.364*** 0.695 0.687 0.399 and Pacific (1.19) (4.25) (3.38) (1.29) (1.49) (0.79)
South Asia 1.170* 2.852*** 2.139*** 1.585* 1.414** 1.161 (2.25) (4.48) (3.5) (2.16) (2.62) (1.82)
Sub Saharan 1.222* 2.504*** 1.812*** 1.219* 1.502** 1.400* Africa (2.35) (4.11) (3.33) (2.11) (2.6) (2.38)
Europe and -1.691*** -1.380*** -1.513*** -1.711*** -1.393*** -1.612*** Central Asia (-4.90) (-5.25) (-5.62) (-3.95) (-3.49) (-4.02)
Middle East 2.616*** 3.541*** 3.246*** 3.285*** 2.733*** 2.348** (3.34) (4.5) (4.16) (3.69) (3.46) (2.86)
ln (GDP per Capita)
0.725*** 0.0205 (3.31) (0.11)
property 0.0167** rights (2.95)
WGI political 0.0115 -0.231 stability (0.05) (-1.13)
WGI government -0.431 effectiveness (-0.97)
WGI regulatory 1.648*** quality (4.71)
WGI rule of -0.588 law (-1.10)
WGI corruption 0.0194 0.463
(0.05) (1.87)
ICRG quality -0.0862 of government (-0.10)
_cons 14.94** 2.182 4.595 8.23 14.78** 2.328
(2.99) (0.88) (1.92) (1.25) (2.77) (0.37)
N 1888 1943 1943 1365 1830 1365 Notes: (1) t statistics in parentheses (2) * p<0.05, ** p<0.01, *** p<0.001

139
(3) The estimations include year fixed effects (not shown here). (4) Latin America and the Caribbean dummy excluded.
Table 3 Results for water &sanitation (1) (2) (3) (4) (5) (6)
Management & lease=1
Management & lease=1
Management & lease=1
Management & lease=1
Management & lease=1
Management & lease=1
gfcfconstant 1.17E-13 -1.74E-12 -1.64E-12 1.51E-10 -8.36E-13 4.04E-10
(0.06) (-1.37) (-1.32) (0.02) (-0.45) (0.13)
aid 0.0276 1.667 0.00983 1.212
(0.69) (0.01) (0.26) (0.02)
government 0.00309 -0.0091 -0.0198 2.089 0.00372 3.777
size (0.09) (-0.35) (-0.82) (0.02) (0.08) (0.03)
ln (industry) 0.462 -77.33 -0.714 91.56
(0.15) (.) (-0.19) (.)
ln (services) 0.253 -147.8 0.154 -185.7
(0.07) (.) (0.04) (-0.05)
ln (resource rents) 0.44 0.299 0.381 48.59 0.239 87.88
(0.94) (1.04) (1.35) (0.03) (0.45) (0.03)
ln (population) -0.755 -0.869* -0.687 -15.36 -0.911 -185.5
(-1.24) (-2.06) (-1.77) (-0.01) (-1.49) (-0.12)
corruption -0.120* -0.146*
(-2.15) (-2.14)
common 2.174 1.356 1.378 29.04 2.752 27.49
(1.06) (0.85) (0.85) (0.0) (1.14) (0.01)
regime duration
0.105* 0.0921** 0.103** 0.116* (1.98) (3.13) (3.24) (1.97)
democracy -0.9 -2.006** -2.287** 0.93 -1.405 -45.37
(-0.91) (-2.69) (-2.93) (0.0) (-1.20) (-0.05)
ln (domestic credit) 0.363 0.353 0.0314 65.84 0.38 299.9
(0.33) (0.63) (0.06) (0.02) (0.3) (0.09)

140
fiscal freedom 0.06 0.0604 0.0643 -0.0828 0.0851 14.23
(1.04) (1.6) (1.68) (-0.00) (1.35) (0.13)
business freedom
0.018 -0.0289 (0.35) (-0.74)
investment freedom
-0.0118 -0.0195 (-0.38) (-0.78)
inflation -0.0532 0.00527 0.00899 -2.677 -0.032 -1.319 (-1.06) (0.25) (0.42) (-0.02) (-0.53) (-0.03)
openness 0.212 -0.606 -0.203 79.91 -0.2 -126.7 (0.1) (-0.42) (-0.15) (.) (-0.10) (-0.02)
East Asia -2.426 -2.511 -2.382 -81.76 -1.555 -400.7 and Pacific (-1.12) (-1.58) (-1.53) (.) (-0.68) (-0.11)
South Asia 0.1 -0.333 -1.242 237.6 -1.167 621.8 (0.03) (-0.11) (-0.38) (.) (-0.26) (0.06)
Sub Saharan 6.022* 5.192** 5.468** 174.7 6.940** 412 Africa (2.48) (2.82) (2.86) (0.02) (2.65) (.)
Europe and 4.077** 3.349*** 3.625*** 88.64 4.550** -196.3 Central Asia (2.9) (3.76) (3.79) (0.01) (3.15) (-0.07)
Middle East 2.612 1.604 1.201 94.75 3.325 125.8 (1.3) (1.16) (0.94) (0.02) (1.42) (0.07)
ln (GDP per Capita)
-0.822 -1.306 (-1.09) (-1.78)
property rights 0.0158 (0.68)
WGI political 64.62 324.6 stability (0.02) (0.1)
WGI government effectiveness
-190.2
(-0.04)
WGI regulatory 224.5 quality (0.03)
WGI rule of law
-108.3 (.)

141
WGI corruption -36.78 -727.6
(.) (.)
ICRG quality of
government
2.227
(0.3)
_cons 3.407 15.81 16.61 478.1 10.12 1096.2 (0.15) (1.78) (1.93) (.) (0.42) (.)
N 536 557 557 424 534 424 Notes: (1) t statistics in parentheses (2) * p<0.05, ** p<0.01, *** p<0.001 (3) The estimations include year fixed effects (not shown here). (4) Latin America and the Caribbean dummy excluded.

OBJECTIVE ANALYSIS.EFFECTIVE SOLUT IONS.
C O R P O R A T I O N
RAND publications are available at www.rand.org
RGSD-316
R
HEADQUARTERS CAMPUS 1776 MAIN STREET, P.O. BOX 2138 SANTA MONICA, CA 90407-2138
OFFICESSANTA MONICA, CAWASHINGTON, DCPITTSBURGH, PANEW ORLEANS, LA/JACKSON, MSBOSTON, MA
DOHA, QA
CAMBRIDGE, UKBRUSSELS, BE
www.rand.org
This product is part of the Pardee RAND Graduate School (PRGS) dissertation series. PRGS dissertations are produced by graduate fellows of the Pardee RAND Graduate School, the world’s leading producer of Ph.D.’s in policy analysis. The dissertation has been supervised; reviewed; and approved by the faculty committee composed of Krishna B. Kumar (Chair), Gery Ryan, and Rafiq Dossani.