emerging industry workforce strategy report 01226010
TRANSCRIPT

Submitted by
January 22, 2010
EEMMEERRGGIINNGG IINNDDUUSSTTRRYY
WWOORRKKFFOORRCCEE SSTTRRAATTEEGGYY

Table of Contents
EXECUTIVE SUMMARY ................................................................................................. 1
INTRODUCTION AND PURPOSE .................................................................................. 5
INDUSTRY IDENTIFICATION ........................................................................................ 6
Theoretical Framework and Definition ......................................................................... 6
The Nexus Industries ................................................................................................... 9
The Nexus Industries on the Industry Life Cycle ........................................................ 11
Prioritization of the Nexus Industries .......................................................................... 13
EMPLOYMENT OUTLOOK AND SKILL SETS ............................................................. 14
Employment Outlook .................................................................................................. 15
Skill Sets .................................................................................................................... 22
NEXT STEPS ................................................................................................................ 28
BIBLIOGRAPHY/CITATIONS ....................................................................................... 33
APPENDIX A. METHODS ............................................................................................ 35
APPENDIX B. REGRESSION DETAIL ........................................................................ 44
APPENDIX C. REGRESSION TERM DEFINITION ..................................................... 49
Tables:
Table 1: Preliminary Forecasts of MSA GDP Growth Rates by Sector ......................... 10 Table 2: 2008-2009 Average Annual Total Employment Rate of Change Forecasts .... 16 Table 3: 2008-2009 Average Annual Total Employment Net Jobs Forecasts ............... 17 Table 4: 2008-2009 Average Annual Total Employment Forecasts .............................. 19 Table 5: Nexus Industry Skill Sets ................................................................................ 24 Figures:
Figure 1: Industry Life Cycle ........................................................................................... 7
Figure 2: Nexus Industries in Southwestern Pennsylvania ............................................. 9
Figure 3: Nexus Industry Positions on the Industry Life Cycle ..................................... 11
Figure 4: Nexus Industry Definitions............................................................................. 13
Figure 5: Nexus Skill Set Continuum ............................................................................ 23

In an effort to further strengthen workforce development initiatives in the Pittsburgh region and surrounding areas, CCAC, through the Workforce Alliance, sought to better understand regional emerging industries, related workforce needs of those industries, and opportunities for CCAC and the Workforce Alliance to aid in their fulfillment. This project addresses the following driving questions:
• What are the key emerging industries in southwestern Pennsylvania and what is their potential economic impact for Allegheny County?
• What are the anticipated job opportunities and requisite skill sets necessary for these emerging industries to be successful?
• What role should the Workforce Alliance play as an intermediary and convener of the emerging industries or clusters of emerging industries for CCAC?
A joint qualitative/quantitative approach was used to identify, evaluate, confirm, and further examine high-growth and emerging industries as well as the related skill sets required by these industries. The industries that show the most growth in employment and economic impact in terms of employer need are those that are located at the convergence of high-growth industries — Healthcare and Life Sciences, Energy, and Financial Services and Insurance — and the “liaison” sectors of Manufacturing and Information Technology (Figure ES1).
Figure ES1: The “Nexus Industries”
Emerging Industry Workforce Strategy Executive Summary
Introduction and Purpose
Findings
1 January 2010
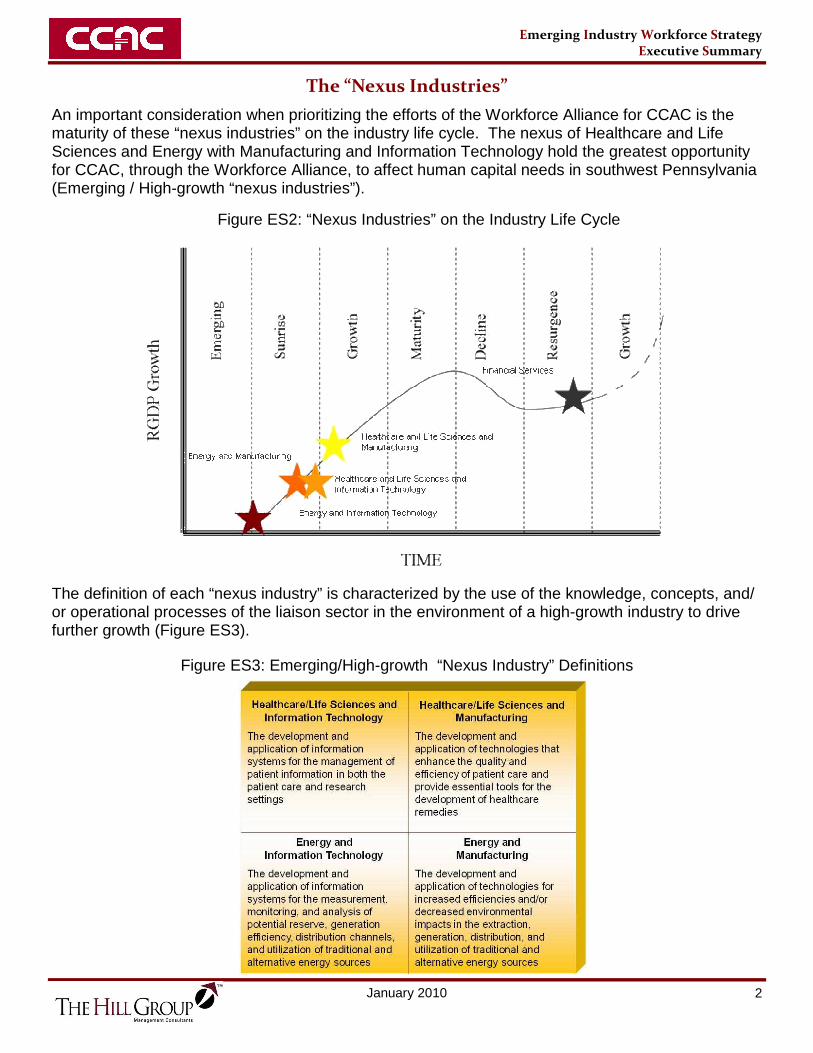
An important consideration when prioritizing the efforts of the Workforce Alliance for CCAC is the maturity of these “nexus industries” on the industry life cycle. The nexus of Healthcare and Life Sciences and Energy with Manufacturing and Information Technology hold the greatest opportunity for CCAC, through the Workforce Alliance, to affect human capital needs in southwest Pennsylvania (Emerging / High-growth “nexus industries”).
Figure ES2: “Nexus Industries” on the Industry Life Cycle
Figure ES3: Emerging/High-growth “Nexus Industry” Definitions
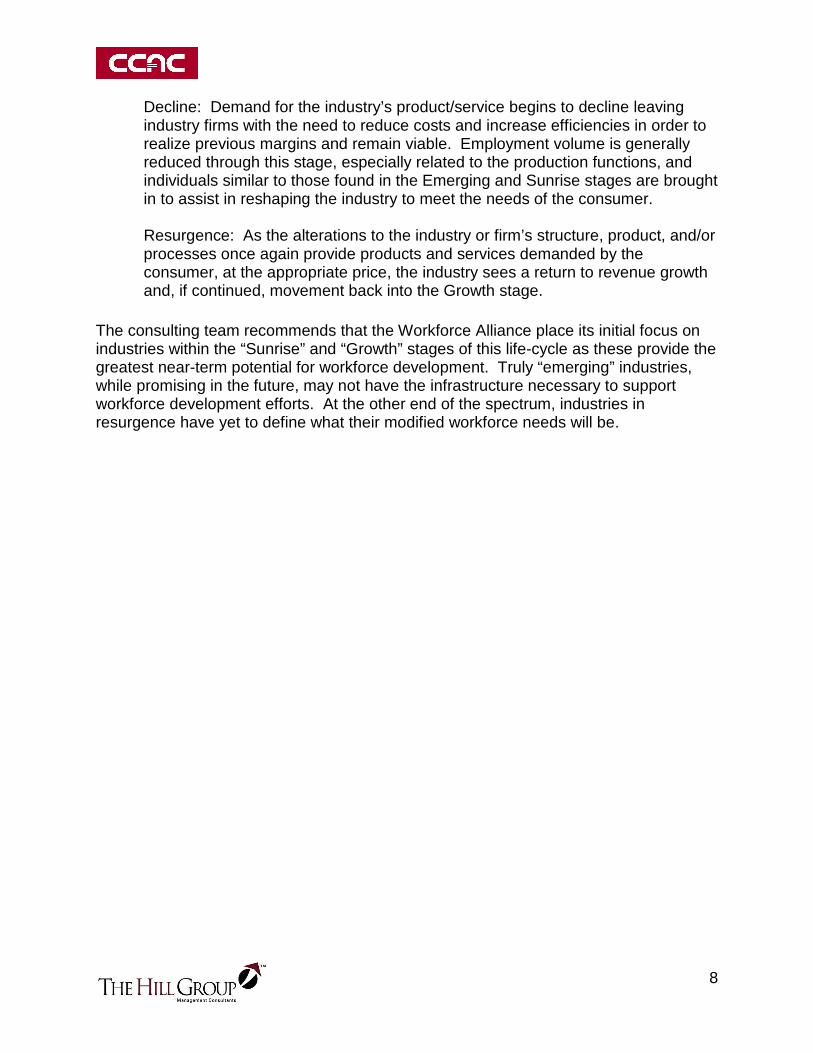
The definition of each “nexus industry” is characterized by the use of the knowledge, concepts, and/or operational processes of the liaison sector in the environment of a high-growth industry to drive further growth (Figure ES3).
Emerging Industry Workforce Strategy Executive Summary
The “Nexus Industries”
2 January 2010

While many of the firms interviewed could not identify specific occupation or position titles that they would need as they continue to grow, they consistently voiced a desire for new talent with strengths in the following areas:
• Technical Skills • Experience • Soft Skills/Work Readiness Skills
There is an emerging need for individuals to play a “liaison” role between the terms, concepts, and operational processes conducted in each of the “nexus industries”. These “liaison skills” enable individuals to use the knowledge base of one industry to serve the specific needs of another. Figure ES4, displays the Nexus Industry Skill Set Continuum where employee competencies range from traditional (competencies are focused to a single area of expertise) to “liaison” (competencies are in multiple technical areas and can be applied interchangeably).
Figure ES4: “Nexus Industry” Skill Set Continuum
High-Growth Industry(Healthcare, Energy,
Financial Services)
Liaison Sector (Manufacturing, IT)
100% 50% 0%
50%0% 100%
Traditional Skills
Traditional Skills
Liaison Skills
Employer Needs
Employers noted that prior level of experience directly relates to an employees’ success on the job. As a result, employers tend to recruit from competitors and educational institutions that provide experiential learning opportunities. The roles most often discussed by employers across all “nexus industries” were:
• Research and development • Process improvement • Sales and customer care
• Quality assurance • Regulatory and compliance assistance
The most apparent workforce need in the “nexus industries” is for individuals with strong soft skills and work readiness skills as these will position the individual to address workplace challenges and grow. These skills include:
• Critical thinking • Independent decision-making • Adaptability
• Ability to learn new skills quickly • Interpersonal skills • Emotional intelligence
3
• Ability to learn new skills quickly • Interpersonal skills • Emotional intelligence
January 2010
Skill Set Requirements of “Nexus Industries”
Emerging Industry Workforce Strategy Executive Summary
Technical Skills
Experience
Soft Skills/Work Readiness Skills

It is recommended that the Workforce Alliance assume the primary role and related responsibilities for identifying current and future industry workforce needs for CCAC while CCAC leads the development, integration, and promotion of programs that align with fulfilling the needs identified by the Workforce Alliance. The Workforce Alliance should consider taking seven action items – two related to identifying industry need and five related to fulfilling industry need – to maximize its impact on emerging workforce requirements in southwest Pennsylvania.
• Position the Workforce Alliance as primary liaison between industry and educational programs (Figure ES4)
• Monitor economic and policy environment impacts on targeted industries
• Integrate industry experience throughout time of study • Develop interdisciplinary study • Incorporate foundational business concepts and soft skill development throughout
programs • Promote career pathing into nexus industries • Implement a formalized process for evaluating and enhancing CCAC program offerings to
fulfill industry need
Figure ES5: Role of the Workforce Alliance
4 January 2010
Next Steps
Identify Industry Need
Fulfill Industry Need
Emerging Industry Workforce Strategy Executive Summary

5
INTRODUCTION AND PURPOSE The Community College of Allegheny County (CCAC) - Allegheny County Workforce Alliance (Workforce Alliance) is a strategic partnership among county and state economic development entities, local and state workforce development organizations, the foundation community, private industry, organized labor, and training providers that is designed to strengthen the region’s workforce development initiatives. It seeks to enhance southwestern Pennsylvania’s economic competitiveness through this project by identifying key emerging industries, convening the web of stakeholders (i.e. businesses, public sector, and training providers) to identify and prioritize key issues in these industries, and helping develop the strategic direction of the emerging clusters. This project addresses the following objectives:
• What are the key emerging industries in southwestern Pennsylvania and what is their potential economic impact for Allegheny County?
• What are the anticipated job opportunities and requisite skill sets necessary for
these emerging industries to be successful?
• What role should the Workforce Alliance play as an intermediary and convener of the emerging industries or clusters of emerging industries for CCAC?

6
INDUSTRY IDENTIFICATION The industries that show the most potential growth in employment and economic impact in southwest Pennsylvania are those that are located at the convergence of high-growth industries – Healthcare and Life Sciences, Energy, and Financial Services – and Information Technology and/or Manufacturing. This trend increasingly demands that organizations are able to adapt and apply the terms, concepts, and operational processes in each of the high-growth industries, and the supporting processes and technologies traditionally associated with Information Technology and Manufacturing. This section presents the theoretical framework for the project and builds the case for which industries the Workforce Alliance should focus its initial attention through the identification, definition, and prioritization of key nexus industries. THEORETICAL FRAMEWORK AND DEFINITION The Industry Life Cycle (ILC) illustrates a general pattern of growth and decline for products, businesses, and their industries. While multiple variations of the ILC have been developed to address the development of product, market, and/or industry, these variations generally contain the addition of a pre-commercialization or market development stage and/or a subtle modification to the stage names and descriptions to better align with the product, market, and/or industry. Below are some of the major models that have been introduced and their related stages.1
• Fox (1973): pre-commercialization, introduction, growth, maturity, decline • Wasson (1974): market development, rapid growth, competitive turbulence,
saturation/maturity, decline • Anderson & Zeithaml (1984): introduction, growth, maturity, decline • Hill & Jones (1998): embryonic, growth, shakeout, maturity, decline
Aspects from these leading models were utilized in the development of the ILC for use in this analysis (Figure 1).
1 Value Based Management.net. Product Life Cycle – industry Maturity Stages. www.valuebasedmanagement.net. Accessed: 12/8/2009

7
Figure 1: Industry Life Cycle2 Each segment along the ILC is characterized by the maturity of the industry relative to its products/services, processes, and operations. This maturity is defined along the y-axis of the model through the industry’s regional GDP growth rate (RGDP Growth).
Emerging: The industry is focused on research and development to meet an identified need for an existing or yet to be created market. Workforce requirements at this stage generally relate to a small number of individuals with specific expertise in the development of the product/service. Sunrise: The industry has begun to build its market and related revenues. Workforce requirements at this stage continue to include development expertise but are augmented with sales and support staff to continue to assist the industry in its continued growth. Growth: As demand for the industry product/service continues to grow, organizations within the industry require additional staff to fill production and support roles. It is through this stage that employment needs exponentially increase until the industry reaches maturity. Maturity: The industry’s supply of the product/service is generally in equilibrium with the demand for that good. Workforce needs in terms of volume are generally associated with the replacement of employees leaving the industry or the hiring of individuals who can assist the firm in realizing additional revenues from its current market.
2 Kotler, P. and Keller, K. 2009. Marketing Management 13th Edition. Pearson Education Inc. Upper Saddle River, NJ.
8
Decline: Demand for the industry’s product/service begins to decline leaving industry firms with the need to reduce costs and increase efficiencies in order to realize previous margins and remain viable. Employment volume is generally reduced through this stage, especially related to the production functions, and individuals similar to those found in the Emerging and Sunrise stages are brought in to assist in reshaping the industry to meet the needs of the consumer. Resurgence: As the alterations to the industry or firm’s structure, product, and/or processes once again provide products and services demanded by the consumer, at the appropriate price, the industry sees a return to revenue growth and, if continued, movement back into the Growth stage.
The consulting team recommends that the Workforce Alliance place its initial focus on industries within the “Sunrise” and “Growth” stages of this life-cycle as these provide the greatest near-term potential for workforce development. Truly “emerging” industries, while promising in the future, may not have the infrastructure necessary to support workforce development efforts. At the other end of the spectrum, industries in resurgence have yet to define what their modified workforce needs will be.

9
THE NEXUS INDUSTRIES A series of discussions with regional stakeholders including representatives from industry, education, trade associations, the public workforce investment system, and economic development identified the following regional high-growth industries:
• Energy (extraction and/or collection, distribution, and conservation) • Healthcare and Life Sciences • Financial Services and Insurance
The greatest potential for sustainable growth seems to be located at the convergence of Information Technology and/or Manufacturing and one of the high-growth industries. These industries include:
• Energy and Information Technology • Energy and Manufacturing • Financial Services and Insurance and Information Technology • Financial Services and Insurance and Manufacturing • Healthcare and Life Sciences and Information Technology • Healthcare and Life Sciences and Manufacturing
This model is illustrated in Figure 2 with examples of potential nexus industries provided along each of the intersections.
Figure 2: Nexus Industries in Southwestern Pennsylvania

10
The High-Growth Industries The three high-growth industries (Healthcare and Life Sciences, Energy, and Financial Services and Insurance) were validated through an independent, objective, and quantitative method, with a fourth sector (Professional and Technical Services) also showing high-growth.3 Forecasted Pittsburgh Metropolitan Statistical Area (MSA) Gross Domestic Product (GDP) growth rates for the years 2009-2011 by two-digit industry NAICS sector included in the analysis are displayed in Table 1. The sectors are sorted in descending order by average annual growth rate with the top four industry sectors highlighted.4
Table 1: Preliminary Forecasts of MSA GDP Growth Rates by Sector
Industry 2009 Forecast 2010 Forecast 2011 Forecast Average GrowthHealth care and social assistance 8.248% 6.370% 6.507% 7.042%Professional and technical services 8.185% 6.283% 6.111% 6.860%Natural resources and mining 1.983% 9.349% 6.730% 6.021%Finance and insurance 3.963% 6.658% 7.147% 5.923%Utilities 6.599% 5.434% 5.582% 5.872%Accommodation and food services 7.215% 5.282% 4.289% 5.595%Transportation and warehousing excluding Postal Service 3.179% 6.473% 5.847% 5.166%Educational services 5.295% 4.504% 5.060% 4.953%Information 1.932% 6.138% 6.609% 4.893%Construction 5.886% 2.989% 5.672% 4.849%Wholesale trade 4.185% 5.058% 4.546% 4.596%Arts entertainment and recreation 4.400% 2.406% 5.913% 4.240%Other services except government 2.622% 5.364% 4.141% 4.042%Manufacturing 4.466% 2.565% 3.754% 3.595%Real estate and rental and leasing 1.905% 4.751% 3.539% 3.399% The continued, steady, growth of the Healthcare/Life Sciences sector, one of the region’s perennial leaders, places the firms within that sector as a key factor in regional GDP growth. The Professional and Technical Services sector was not incorporated into the final determination of high-growth sectors as growth in these service areas is generally associated with growth in the service’s client sector (i.e. strength in the energy supply chain sector will generally result in growth in the professional and technical services associated with that sector). Growth in the other three high-growth sectors would have a strong correlation to growth in the Professional and Technical Services sector as firms are expanding and organizations are looking to solidify their strategy and enlist the services of firms to assist in helping them reach their potential.
3 Refer to Appendix B: Detailed Regression Results for additional detail on simple and multiple regression development and discussion on results. 4 One should be advised to not take these figures as precise predictions of future, regional, GDP growth rates as they are only able to reflect about 53 percent of the variability in GDP growth and have been developed using a relatively small amount of observations. However, while the numbers themselves may only represent half of the picture, the trends illustrated by the numbers do assist in the identification of sectors whose investments in information and communication technologies years ago, may result in high-growth over the next one to three years and provides us with a starting point upon which a more robust model (defined in Employment Outlook and Skill Sets) can be built.

11
The emergence of Natural Resources and Mining in the third position among sectors converges well with the new developing Marcellus Shale interests across the region and the continued growth in the coal industry, traditionally associated with the region due to its vast resources. This sector is paired with the Utilities sector in the fifth position to compose the Energy Supply Chain to include the collection, generation, transmission, conservation, and distribution of energies from traditional and alternative fuels that have been recently of focus on a global scale. Finance and Insurance is forecasted to be within the bottom four sectors as it relates to 2009 forecasted growth but manages to average almost 6 percent growth, due to support from the remaining two years. While it is believed that much of that later growth can be attributed to the sector’s efforts return to its baseline after the recent recession, it remains a strong industry in the region and provides significant potential for those with the appropriate competencies. THE NEXUS INDUSTRIES ON THE INDUSTRY LIFE CYCLE A joint qualitative and quantitative approach was used to identify the placement of the nexus industries on the ILC (Figure 3). The criteria for placement considered the state of the high-growth industry as it relates to regional GDP growth and the level of maturity in the relationship between the high-growth and liaison industry segments.
Figure 3: Nexus Industry Positions on the Industry Life Cycle
Healthcare and Life Sciences and Manufacturing
Healthcare and Life Sciences and Information Technology
Energy and Manufacturing
Financial Services
Energy and Information Technology

12
Healthcare and Life Sciences
The regional GDP forecasts reviewed earlier in this report suggest that Healthcare/Life Sciences is the most stable of all sectors and continues to have growth forecasts in the top-tier of industry sectors reviewed. This continued growth places the industry within the Growth stage of the ILC.
Healthcare/Life Sciences and Manufacturing is placed within the Growth stage of the ILC and seen as the most mature among nexus industries. Industry representatives discussed specific human capital needs, signifying further development in the workforce-related needs of the industry. Occupations also seem to be more standardized across firms in this space than what was seen in other nexus industries. Given the mature nature of the industry, regulatory policy focuses primarily on maintaining the health, safety, and quality standards of industry products. Healthcare/Life Sciences and Information Technology is placed at the end of the Sunrise and beginning of Growth on the ILC. Industry representatives discussed the need for developers and individuals with experience implementing and troubleshooting electronic medical records systems. Representatives also discussed a need for traditional healthcare occupations, such as nurses and doctors, to have a functional understanding of information technology, particularly regarding medical records and patient tracking. However, many organizations remain at the initial stages of development, certification, or implementation of these products, creating a large potential for growth. Policy requirements relating to the privacy, security, and exchange of patient data creates additional demand for these positions.
Energy
The energy sector (a combination of Natural Resources and Mining and Utilities) is projected to experience steady growth in utilities and a strong surge in growth from the mining industry - leading to stable activity in the remaining forecasted years. This pairing of continued growth along with a strong surge places the Energy industry sector between the end of the Sunrise and beginning of the Growth stages.
Energy and Manufacturing is placed in the Sunrise stage as the majority of the companies interviewed identified a greater need for engineering and product development expertise than that needed to market their product. Most of the companies discussed rapid growth over the next three to five years in both traditional and non-traditional energy sectors. Much of the non-traditional growth can be attributed to the upcoming deadlines for increased efficiency and domestic production of energy, dictated in recent policy and strengthened by customer demand for these products.

13
Energy and Information Technology is placed between the Emerging and Sunrise stages as many of the technologies related to this field remain in the development and testing phases. Industry representatives identified current needs for engineering and development personnel with production, implementation, and support positions not being required until the firms go-to-market.
Financial Services and Insurance
This sector is seen as undergoing resurgence after the recent decline in many of the industries within its sector based on findings of the regression analysis. The regression analysis shows that this resurgence is in the early stages and therefore, while it is believed that nexus industries will begin to form in the future, the shape, employment volume, and skill set requirements related to those industries could not be defined. PRIORITIZATION OF THE NEXUS INDUSTRIES The industries that show the most growth in employment and economic impact are those located at the convergence of high-growth industries – Healthcare and Life Sciences, Energy, and Financial Services – and Information Technology and/or Manufacturing. It is recommended that the Workforce Alliance’s initial focus is placed on the following four industries (Figure 4).
Figure 4: Nexus Industry Definitions It is recommended that the Workforce Alliance’s initial focus related to high-growth industries be placed on these four nexus industries. The next section details the employment outlook and skill sets for each.
Healthcare/Life Sciences and Manufacturing
The development and application of technologies that enhance the quality and
efficiency of patient care and provide essential tools for the development of
remedies to current health issues
Healthcare/Life Sciences andInformation Technology
The development and application of information systems for the management of patient information in both the patient care and research settings
Healthcare/Life Sciences and Manufacturing
The development and application of technologies that enhance the quality and efficiency of patient care and provide essential tools for the development of healthcare remedies
Energy andInformation Technology
The development and application of information systems for the measurement, monitoring, and analysis of potential reserve, generation efficiency, distribution channels, and utilization of traditional and alternative energy sources
Energy andManufacturing
The development and application of technologies for increased efficiencies and/or decreased environmental impacts in the extraction, generation, distribution, and utilization of traditional and alternative energy sources
14
EMPLOYMENT OUTLOOK AND SKILL SETS This section provides findings regarding employment outlook for high-growth industries and the nexus industries as well as skill sets required in each nexus industry. High-level findings include:
• Employment Outlook � The high-growth industries identified through analysis of their regional GDP
also are growing in terms of employment � Specific occupations are difficult for nexus industry representatives to
discuss, but all indicate their respective industry is growing � Policy and regulations play a significant role in decision-making and
workforce needs in an industry
• Skill Sets � Technical skills: The analysis revealed an emerging need for individuals to
play a “liaison” role between the terms, concepts, and operational processes in each of the nexus industries. These technical skills seem to center around research and development, process improvement, sales and customer care, quality assurance, and regulatory understanding
� Experience: Employers noted that their employees’ prior level of experience directly relates to their ability to be successful in the kinds of roles employers need
� Soft and work readiness skills: Soft skills and work readiness skills enable workers to be successful in the nexus industries
The Employment Outlook sub-section provides employment data for high-growth industries based on the second regression model, findings from interviews conducted with industry representatives, and a review of major policies that affect the nexus industries. The Skill Sets sub-section provides findings regarding human capital needs based on interviews conducted with industry representatives. The section is organized by type of skill set – technical skills, soft and work readiness skills, and experience/education. Findings around technical skills are discussed for each nexus industry. Soft and work readiness skills and experience/education seem to apply to all four nexus industries and are discussed in aggregate.

15
EMPLOYMENT OUTLOOK Industry Employment Forecasts The completion of a quantitative analysis on MSA “total employment”5 at the 3-digit NAICS level of industry classifications resulted in the following:
• Industries involved (directly or indirectly) in the collection, refinement, transportation, and transmission of energy are forecasted to have the fastest growing total employment rate of change
• Industries in healthcare are forecasted to have the largest increase in total
employment, when viewed by the number of positions from the previous year. It was also identified that the majority of this growth will likely be seen in medical practitioner and other medical professional roles rather than support functions. These positions are also generally expected to be concentrated in organizations within the Ambulatory Health Care Services industry
• Industries in financial services indicated some recovery of lost employment due
to the recent recession. This current effort to reach their average employment base may delay the timeline for emergence of nexus industries related to this sector
The dependent variable used was 2007-2008 Total Employment Rate of Change and therefore, the 2008-2009 values for this same variable were able to be forecasted. The results of this forecast can be found in Tables 2 – 4. Industries within or primarily related to the sectors identified as Sunrise and Growth from the quantitative and qualitative Emerging Industry Identification have been highlighted. Refer to Appendix II: Detailed Regression Results for additional detail on simple and multiple regression development and discussion on results. One will notice that those industries within, or directly related to, the energy sectors, including the mining, distribution, and support activities for natural energy resources compose much of the top 25 percent of the listing. Industries within the healthcare and life sciences and finance and insurance sectors help to round out the top third.
5 NOTE: Total Employment is defined by the U.S. Census Bureau’s Local Employment Dynamics as the “Total number of workers who were employed by the same employer in both the current and previous quarter”. http://lehd.did.census.gov/led/gdocs/Metadata4_QWI.htm

16
Table 2: 2008-2009 Average Annual Total Employment Rate of Change Forecasts
NAICS Code Industry Title
2008-2009 Average Annual Total
Employment Rate of Change
Rate of Change
Rank486000 Pipeline Transportation 9.05% 1213000 Support Activities for Mining 8.71% 2211000 Oil and Gas Extraction 7.82% 3531000 Real Estate 5.95% 4331000 Primary Metal Manufacturing 5.69% 5325000 Chemical Manufacturing 4.56% 6512000 Motion Picture and Sound Recording Industries 4.06% 7624000 Social Assistance 2.46% 8522000 Credit Intermediation and Related Activities 2.02% 9339000 Miscellaneous Manufacturing 1.70% 10523000 Securities, Commodity Contracts, and Other Financial Investments 1.65% 11621000 Ambulatory Health Care Services 1.49% 12721000 Accommodation 1.29% 13493000 Warehousing and Storage 1.26% 14561000 Administrative and Support Services 1.19% 15332000 Fabricated Metal Product Manufacturing 1.06% 16511000 Publishing Industries (except Internet) 0.74% 17327000 Nonmetallic Mineral Product Manufacturing 0.73% 18212000 Mining (except Oil and Gas) 0.69% 19326000 Plastics and Rubber Products Manufacturing 0.52% 20333000 Machinery Manufacturing 0.31% 21562000 Waste Management and Remediation Services 0.17% 22324000 Petroleum and Coal Products Manufacturing 0.09% 23335000 Electrical Equipment, Appliance, and Component Manufacturing -0.55% 24313000 Textile Mills -1.16% 25713000 Amusement, Gambling, and Recreation Industries -1.22% 26532000 Rental and Leasing Services -1.35% 27311000 Food Manufacturing -1.38% 28722000 Food Services and Drinking Places -1.91% 29323000 Printing and Related Support Activities -2.00% 30622000 Hospitals -2.61% 31322000 Paper Manufacturing -2.81% 32711000 Performing Arts, Spectator Sports, and Related Industries -3.17% 33113000 Forestry and Logging -3.94% 34337000 Furniture and Related Product Manufacturing -3.95% 35485000 Transit and Ground Passenger Transportation -4.23% 36334000 Computer and Electronic Product Manufacturing -4.84% 37481000 Air Transportation -5.67% 38321000 Wood Product Manufacturing -6.11% 39484000 Truck Transportation -9.01% 40315000 Apparel Manufacturing -12.06% 41525000 Funds, Trusts, and Other Financial Vehicles -14.33% 42
LEGENDEnergy and related industriesHealthcare/Life Sciences and related industriesFinancial Services and related industries
However, the picture shifts from heavy focus on energy to that of healthcare and life sciences when those forecasted percentages are used to calculate the net effect on average annual total employment in terms of positions (Table 3).

17
Table 3: 2008-2009 Average Annual Total Employment Net Jobs Forecasts
NAICS Code Industry Title
2008-2009 Average Annual Total
Employment Net JobsNet Jobs
Rank621000 Ambulatory Health Care Services 15,886 1624000 Social Assistance 14,107 2561000 Administrative and Support Services 12,727 3531000 Real Estate 10,192 4331000 Primary Metal Manufacturing 9,305 5522000 Credit Intermediation and Related Activities 8,840 6325000 Chemical Manufacturing 8,536 7332000 Fabricated Metal Product Manufacturing 3,980 8493000 Warehousing and Storage 2,997 9721000 Accommodation 2,646 10339000 Miscellaneous Manufacturing 1,979 11523000 Securities, Commodity Contracts, and Other Financial Investments 1,926 12213000 Support Activities for Mining 1,862 13512000 Motion Picture and Sound Recording Industries 1,305 14511000 Publishing Industries (except Internet) 1,028 15326000 Plastics and Rubber Products Manufacturing 835 16211000 Oil and Gas Extraction 779 17327000 Nonmetallic Mineral Product Manufacturing 777 18333000 Machinery Manufacturing 719 19486000 Pipeline Transportation 641 20212000 Mining (except Oil and Gas) 367 21562000 Waste Management and Remediation Services 109 22324000 Petroleum and Coal Products Manufacturing 24 23113000 Forestry and Logging -120 24313000 Textile Mills -231 25335000 Electrical Equipment, Appliance, and Component Manufacturing -619 26532000 Rental and Leasing Services -1,168 27711000 Performing Arts, Spectator Sports, and Related Industries -2,152 28481000 Air Transportation -2,725 29323000 Printing and Related Support Activities -2,734 30713000 Amusement, Gambling, and Recreation Industries -3,003 31322000 Paper Manufacturing -3,090 32337000 Furniture and Related Product Manufacturing -3,372 33311000 Food Manufacturing -3,810 34315000 Apparel Manufacturing -4,019 35321000 Wood Product Manufacturing -6,487 36485000 Transit and Ground Passenger Transportation -7,068 37334000 Computer and Electronic Product Manufacturing -7,644 38525000 Funds, Trusts, and Other Financial Vehicles -9,270 39484000 Truck Transportation -22,504 40622000 Hospitals -26,737 41722000 Food Services and Drinking Places -27,369 42
LEGENDEnergy and related industriesHealthcare/Life Sciences and related industriesFinancial Services and related industries
This shift from energy to healthcare and life sciences may be seen as an indicator of industry maturity in the region as the healthcare and life sciences growth has been occurring for some time and amassed a large amount of the region’s total employment. Industries in the energy sector are earlier in the growth cycle, as it relates to this new emergence, as a strong center for employment.

18
This hypothesis is also seen in the preliminary regression model (see Table 1) where Healthcare and Social Assistance is forecasted to have a somewhat steady three-year growth process – achieving between 6 percent and 8 percent growth in each of the three years. Natural Resources and Mining is forecasted to grow at a forecasted 2 percent in 2009, jump to over 9 percent in 2010, and settle back to around 6.7 percent in 2011 for a three-year average of around 6 percent. By averaging these two perspectives, there is an emergence of a hybrid listing that takes the rate of the increase in average annual total employment and the net jobs that this increase is projected to produce. Table 4, below, includes all of the information seen in Tables 7 and 8, with an additional column Rank Average which displays the average ranking of the industry from both listings. This is also the column upon which the listing is sorted. With this perspective in mind, it becomes apparent that the initial industry sectors selected remain accurate from a quantitative perspective. While there may be other industries intermixed within the top ten in each listing, much of the forecasted growth in these industries may be their recovery from the massive employment losses suffered in prior years, due to the recent recession, and not indicative of the high-growth or emergence of these industries in the region.

19
Table 4: 2008-2009 Average Annual Total Employment Forecasts
NAICS Code Industry Title
2008-2009 Average Annual Total
Employment Rate of Change
Rate of Change
Rank
2008-2009 Average Annual Total
Employment Net JobsNet Jobs
RankRank
Average531000 Real Estate 5.95% 4 10,192 4 4624000 Social Assistance 2.46% 8 14,107 2 5331000 Primary Metal Manufacturing 5.69% 5 9,305 5 5621000 Ambulatory Health Care Services 1.49% 12 15,886 1 6.5325000 Chemical Manufacturing 4.56% 6 8,536 7 6.5522000 Credit Intermediation and Related Activities 2.02% 9 8,840 6 7.5213000 Support Activities for Mining 8.71% 2 1,862 13 7.5561000 Administrative and Support Services 1.19% 15 12,727 3 9211000 Oil and Gas Extraction 7.82% 3 779 17 10339000 Miscellaneous Manufacturing 1.70% 10 1,979 11 10.5512000 Motion Picture and Sound Recording Industries 4.06% 7 1,305 14 10.5486000 Pipeline Transportation 9.05% 1 641 20 10.5493000 Warehousing and Storage 1.26% 14 2,997 9 11.5721000 Accommodation 1.29% 13 2,646 10 11.5523000 Securities, Commodity Contracts, and Other Financial Investments 1.65% 11 1,926 12 11.5332000 Fabricated Metal Product Manufacturing 1.06% 16 3,980 8 12511000 Publishing Industries (except Internet) 0.74% 17 1,028 15 16326000 Plastics and Rubber Products Manufacturing 0.52% 20 835 16 18327000 Nonmetallic Mineral Product Manufacturing 0.73% 18 777 18 18333000 Machinery Manufacturing 0.31% 21 719 19 20212000 Mining (except Oil and Gas) 0.69% 19 367 21 20562000 Waste Management and Remediation Services 0.17% 22 109 22 22324000 Petroleum and Coal Products Manufacturing 0.09% 23 24 23 23313000 Textile Mills -1.16% 25 -231 25 25335000 Electrical Equipment, Appliance, and Component Manufacturing -0.55% 24 -619 26 25532000 Rental and Leasing Services -1.35% 27 -1,168 27 27713000 Amusement, Gambling, and Recreation Industries -1.22% 26 -3,003 31 28.5113000 Forestry and Logging -3.94% 34 -120 24 29323000 Printing and Related Support Activities -2.00% 30 -2,734 30 30711000 Performing Arts, Spectator Sports, and Related Industries -3.17% 33 -2,152 28 30.5311000 Food Manufacturing -1.38% 28 -3,810 34 31322000 Paper Manufacturing -2.81% 32 -3,090 32 32481000 Air Transportation -5.67% 38 -2,725 29 33.5337000 Furniture and Related Product Manufacturing -3.95% 35 -3,372 33 34722000 Food Services and Drinking Places -1.91% 29 -27,369 42 35.5622000 Hospitals -2.61% 31 -26,737 41 36485000 Transit and Ground Passenger Transportation -4.23% 36 -7,068 37 36.5321000 Wood Product Manufacturing -6.11% 39 -6,487 36 37.5334000 Computer and Electronic Product Manufacturing -4.84% 37 -7,644 38 37.5315000 Apparel Manufacturing -12.06% 41 -4,019 35 38484000 Truck Transportation -9.01% 40 -22,504 40 40525000 Funds, Trusts, and Other Financial Vehicles -14.33% 42 -9,270 39 40.5
LEGENDEnergy and related industriesHealthcare/Life Sciences and related industriesFinancial Services and related industries

20
Occupation-Based Findings The consultants conducted interviews with nexus industry representatives to validate the findings of the quantitative analysis and understand the job opportunities in each nexus industry. This section describes overarching findings regarding expected employment growth and occupations that seem to apply to all of the industries. High-growth occupations, other than engineers, were difficult to determine due to dynamism that is associated with the nature of Sunrise and Growth industries. The relatively high rate of change in the industries means that occupations are not yet fully solidified or consistent. The companies also indicated that their regulatory and economic environments are constantly in flux, and required skill sets may change based on new or unanticipated regulations. Therefore, workforce needs are not well-defined in terms of specific occupations, are highly specialized, and are relatively small in number. Needs are discussed in terms of skill sets and employers are looking for a combination of experience and education when it comes to hiring. As a result, our analysis decouples job opportunities and skill sets to mirror the way employers discuss their needs. Industry representatives indicated that they look for specific specialties within engineering, particularly mechanical and electrical engineers. Other specialties included biomedical, plastics, computer science, and petroleum. They noted that these specialties are difficult to recruit locally; many companies recruit outside the region. Despite the difficulty naming specific occupations other than engineers, nearly all industry representatives indicated that they anticipate growth in their respective industries. They noted the changing policy and economic landscapes in their respective industries weighed heavily on workforce decisions. They cited the constant state of flux in the industry to be one reason for their difficulty in naming specific occupations or discussing growth in terms of actual numbers. Policy One reason repeatedly noted for this flux was the policy environment in which each industry functions. Policies and regulations concerning energy and healthcare and life sciences are ample and drive many industry professionals’ motivations. With this point in mind, the team conducted evaluations of major federal policies enacted in recent years and their impacts on the industries identified in this project. The regulatory requirements imposed on the healthcare and life sciences industries are increasingly related to the creation, storage, transmission and disposal of protected

21
health information. These policies require individuals to acquire additional skill sets beyond that traditionally associated with their profession. Healthcare and Life Sciences: A clear contributor to healthcare policy is the presence of the Health Insurance Portability and Accountability Act (HIPAA). HIPAA was most recently modified in 2003, and its provisions were refined and extended in the American Recovery and Reinvestment Act (ARRA). HIPAA provides the healthcare industry and its affiliated industries (i.e. – health insurance) with guidelines regarding the creation, storage, transmission, and disposal of protected health information. As patients change doctors and/or are referred to specialists, HIPAA lays the regulatory framework for providing the ability to exchange that information accurately and without fear of security breach. The cost of HIPAA compliance is all but solely shouldered by those who are required to adhere to its guidelines (covered entities and their business associates). Furthermore, enforcement of HIPAA provisions is tightly and jointly monitored by the Departments of Health and Human Services and Justice. In tandem with HIPAA, the federal government passed the Patient Safety and Quality Improvement Act of 2005 (PSQIA). PSQIA is designed to provide a clearinghouse for the reporting of patient safety and quality control issues before they are subject to punitive action. This measure authorizes the creation of nonprofit organizations to gather and analyze these reports. Its intention is to (1) identify chronic problems among healthcare entities and (2) develop common solutions for those problems. This act is unfunded by the federal government. Healthcare communities are responsible for the creation of these cooperative nonprofits. Consequently, enforcement measures are comparatively low. More recently, federal policy’s focus has become more specific. Regulation has shifted from discussing what will be protected to exactly how that information will be protected and by when. ARRA provides a significant source of policy change in this light. Incorporated in ARRA is the Health Information Technology for Economic and Clinical Health (HITECH) Act. The HITECH Act first establishes the Office of the National Coordinator for Health Information Technology. It then requires that all healthcare providers have an electronic medical record system by 2014. Incentives are included for early implementation of HITECH. The federal government has appropriated grants to that end throughout the upcoming few years. However, penalties are enforced after the 2014 deadline. Energy: Recent energy policy has led to an increased focus on domestic sourcing of energy to reduce foreign dependence. It also has shifted from purely regulatory measures in traditional energy to greater initiatives in both traditional and non-traditional energy collection, storage, and distribution since 2005. The first of such recent initiatives, the Energy Policy Act of 2005, was the first omnibus energy bill passed in over ten years. Its major provisions include revamped electricity and utility regulations. Additionally, those regulations work in tandem with mandates and incentives for cleaner fuels and alternative energy production. Regarding workforce

22
initiatives, the Act provides incentives for training and education programs to augment specializations to meet alternative energy research and implementation needs. Specifically, Title XI divides workforce needs into six sections: • Section 1101 calls for workforce trend monitoring and the creation of responding
training programs. • Section 1102 mandates resources for (1) R&D, (2) competitive events and
internships, (3) facilitation among schools, institutes, companies, and government, and (4) funding the National Academy of Public Administration.
• Section 1103 directs the Secretaries of Energy and Labor to coordinate guidelines for a modernized electricity system and its resulting workforce needs.
• Section 1104 supports the National Center for Energy Management and Building Technologies.
• Section 1105 directs DOE support for minority entry into energy and science programs and jobs
• Section 1106 creates the National Power Plant Operations Technology and Educational Center
The Energy Independence Act of 2007 creates a comprehensive program for the reduction of U.S. reliance on foreign sources of energy. The Act addresses, primarily, the following areas: • Energy efficiency measures and standards • Fossil fuel use, efficiency, and procurement • Energy infrastructure research, development, and investment (Smart Grid) • Transportation efficiency and standards • Alternative energy research, development, and implementation
The Act additionally allocates $125 million for workforce development in green jobs areas. Furthermore, the Act identifies needs for implementation of new and/or restructured systems and programs. Each of those programs is to be funded by the federal department under which it operates. Funding for programs outside the immediate administration of the federal government is supported by a series of block grants. The most recent of energy initiatives is the American Recovery and Reinvestment Act (ARRA). Energy provisions in ARRA are concentrated in Titles IV and VIII. Title IV calls for energy standards at the state level bringing commercial buildings to more stringent ANSI codes and residential to more rigorous efficiency standards. Title VIII allocates $750 million to energy-related workforce training and job placement. SKILL SETS Human capital needs are changing rapidly in the nexus industries. They are framed by combinations of skill sets and specialty areas. Roles are specialized and require the ability to be flexible to adapt to changing regulatory and economic environments. Candidates are expected to possess three traits to ensure their success – technical
23
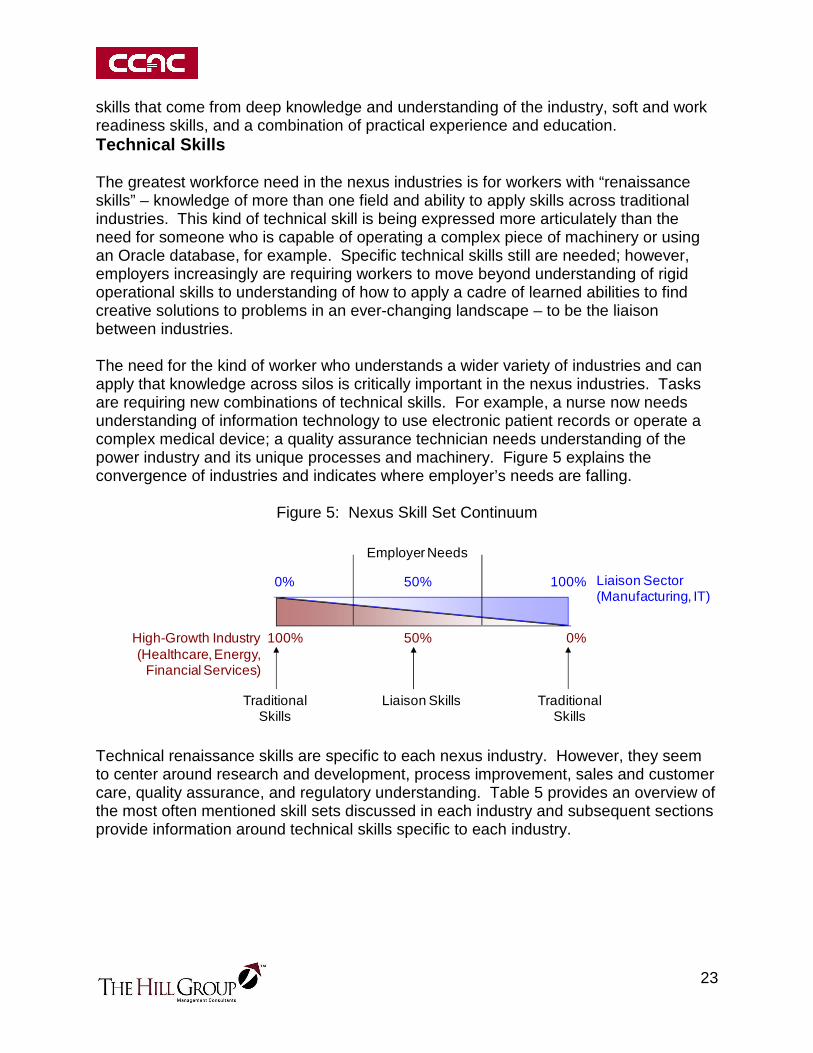
skills that come from deep knowledge and understanding of the industry, soft and work readiness skills, and a combination of practical experience and education. Technical Skills The greatest workforce need in the nexus industries is for workers with “renaissance skills” – knowledge of more than one field and ability to apply skills across traditional industries. This kind of technical skill is being expressed more articulately than the need for someone who is capable of operating a complex piece of machinery or using an Oracle database, for example. Specific technical skills still are needed; however, employers increasingly are requiring workers to move beyond understanding of rigid operational skills to understanding of how to apply a cadre of learned abilities to find creative solutions to problems in an ever-changing landscape – to be the liaison between industries. The need for the kind of worker who understands a wider variety of industries and can apply that knowledge across silos is critically important in the nexus industries. Tasks are requiring new combinations of technical skills. For example, a nurse now needs understanding of information technology to use electronic patient records or operate a complex medical device; a quality assurance technician needs understanding of the power industry and its unique processes and machinery. Figure 5 explains the convergence of industries and indicates where employer’s needs are falling.
Figure 5: Nexus Skill Set Continuum
High-Growth Industry(Healthcare, Energy,
Financial Services)
Liaison Sector (Manufacturing, IT)
100% 50% 0%
50%0% 100%
Traditional Skills
Traditional Skills
Liaison Skills
Employer Needs
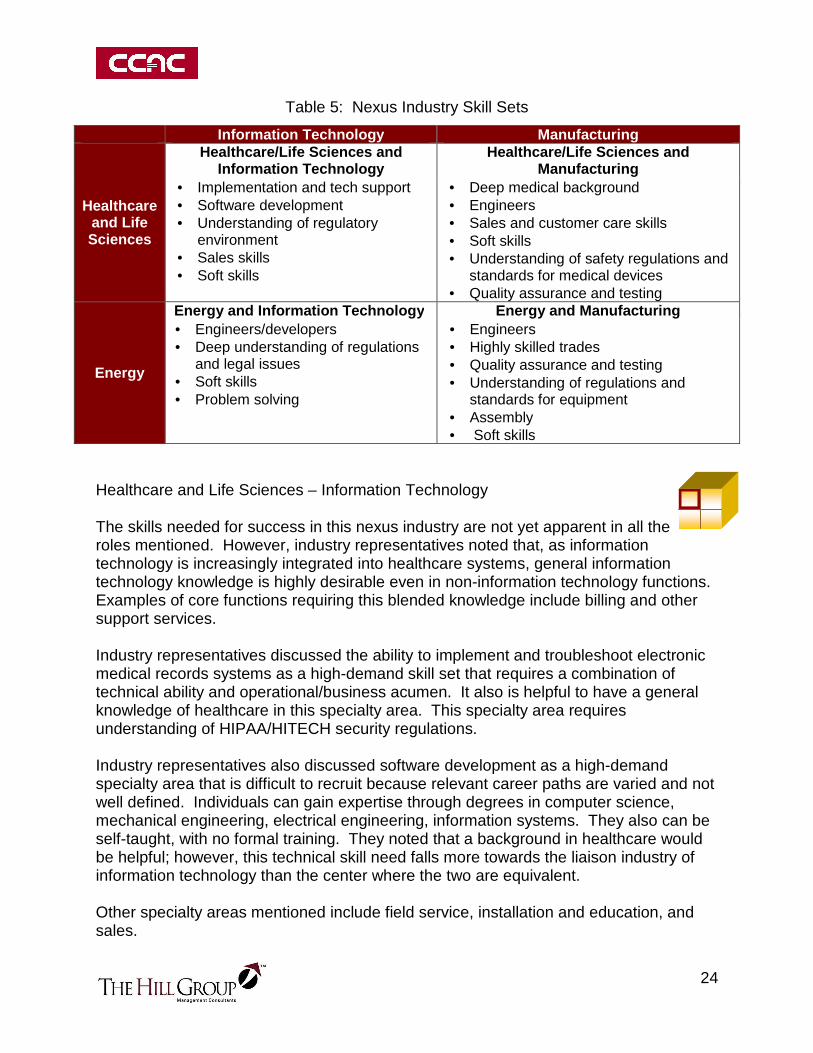
Technical renaissance skills are specific to each nexus industry. However, they seem to center around research and development, process improvement, sales and customer care, quality assurance, and regulatory understanding. Table 5 provides an overview of the most often mentioned skill sets discussed in each industry and subsequent sections provide information around technical skills specific to each industry.
24
Table 5: Nexus Industry Skill Sets
Information Technology Manufacturing
Healthcare and Life Sciences
Healthcare/Life Sciences and Information Technology
Healthcare/Life Sciences and Manufacturing
• Implementation and tech support • Software development • Understanding of regulatory
environment • Sales skills • Soft skills
• Deep medical background • Engineers • Sales and customer care skills • Soft skills • Understanding of safety regulations and
standards for medical devices • Quality assurance and testing
Energy
Energy and Information Technology Energy and Manufacturing • Engineers/developers • Deep understanding of regulations
and legal issues • Soft skills • Problem solving
• Engineers • Highly skilled trades • Quality assurance and testing • Understanding of regulations and
standards for equipment • Assembly • Soft skills
Healthcare and Life Sciences – Information Technology The skills needed for success in this nexus industry are not yet apparent in all the roles mentioned. However, industry representatives noted that, as information technology is increasingly integrated into healthcare systems, general information technology knowledge is highly desirable even in non-information technology functions. Examples of core functions requiring this blended knowledge include billing and other support services. Industry representatives discussed the ability to implement and troubleshoot electronic medical records systems as a high-demand skill set that requires a combination of technical ability and operational/business acumen. It also is helpful to have a general knowledge of healthcare in this specialty area. This specialty area requires understanding of HIPAA/HITECH security regulations. Industry representatives also discussed software development as a high-demand specialty area that is difficult to recruit because relevant career paths are varied and not well defined. Individuals can gain expertise through degrees in computer science, mechanical engineering, electrical engineering, information systems. They also can be self-taught, with no formal training. They noted that a background in healthcare would be helpful; however, this technical skill need falls more towards the liaison industry of information technology than the center where the two are equivalent. Other specialty areas mentioned include field service, installation and education, and sales.

25
Healthcare and Life Sciences – Manufacturing Industry representatives discussed a need for salespeople and customer care more than the need for people in development or assembly. Sales positions all required a strong background in healthcare or at least a background selling medical devices. This industry requires a strong technical background. Customer care representatives, also called clinical territory managers, require a strong clinical background in the healthcare setting where the company’s product is deployed (e.g. nursing, respiratory therapy, critical care). These technical skills fall on the continuum of healthcare and customer service rather than healthcare and manufacturing. Industry representatives also discussed a need for engineers. They most often mentioned mechanical and electrical engineers and a variety of specialties such as plastics, biomedical, and industrial engineering. These positions are highly specialized and require experience working with specific types of manufactured devices. Industry representatives discussed a need for people who are trained in product management and have a deep understanding of regulatory issues. This role combines healthcare and manufacturing with a third liaison skill – regulatory experience. These people assist engineers in product development, ensure quality standards, and take products to market. They engineer processes and manufacturing practices and provide quality assurance. Quality and assurance technicians were not as readily discussed as being one of the higher growth occupations, but they were mentioned. These positions need experience in quality control or electronic manufacturing. They also require knowledge of healthcare products. Assemblers were the lowest skilled position. These positions require an Associate’s degree in electrical engineering. Industry representatives noted that these positions are easy to fill. An understanding of healthcare products is helpful, but not required. Energy – Information Technology Industry representatives most often discussed a need for people in research and development. They were unable to discuss exactly what kinds of skills were needed. They cited a need for “people who can think,” and “backgrounds that are eclectic.” It seems that this emerging industry’s needs best fit the definition of a “renaissance”-worker – people who have a broad-based understanding of both information technology and energy and can connect the two skill sets to solve complex problems. Workers must be able to apply technical knowledge from both disciplines and utilize soft skills and savvy to accomplish the work that needs to be done.

26
Industry representatives discussed skill sets being in research and development, computer science, and computer programming. However, they also discussed a need for people with backgrounds in engineering or other sciences. They noted that this diversity is desired. They hire people with diverse backgrounds for their intellect, then train them in specific processes and programs they would need to accomplish tasks. Energy – Manufacturing Industry representatives most often mentioned assembly and testing, quality assurance, field service, advanced manufacturing, and research and development as specialty areas that are in high demand. Despite company-specific variation, all of the industry representatives indicated that their needs were specialized and specific to the energy industry, noting things like “all our positions require experience in energy and power,” “requires rotating equipment experience,” and “90 percent of the positions are highly specialized.” One interviewee indicated that none of their positions were truly entry-level at the Associate’s-prepared level; and that new employees go through varying degrees of training at a local educational institution to fill skill gaps. Within these skill sets, the industry representatives differed on specific type of specialization and degree of need. One interviewee indicated that research and development was one of the two highest growth specialty areas, while another indicated that research and development was not likely to grow. Experience and Education Nearly every interviewee indicated that their high-growth occupations require a combination of education and experience. Many of the skill sets they discussed can only be mastered on the job (i.e. experience using and working on a specific kind of machinery or in a particular setting). The kind of work that is being conducted in nexus industries require someone who has seen issues and been part of finding solutions in practice. They hire only a few employees directly out of school with no practical experience and limit the number of these hires per year. Most skill needs require Bachelor’s-prepared candidates, given the nexus industries’ focus on development rather than large-scale production or implementation. Industry representatives indicated that engineers, software developers, tech support, systems analysts, sales people, customer care specialists, and project managers, for the most part, require four-year degrees. It is important to note, however, that the educational and experience requirements seemed to differ across companies. Someone in field services could be Associate’s-prepared in one company, but would require a Bachelor’s degree in another company.

27
Typically, each interviewee was able to name one or two specialty areas in which they hire Associate’s-prepared candidates, if at all. These types of occupations most often were in assembly (in manufacturing-related nexus industries) and quality assurance and field service (in all nexus industries). They required at least one year of experience on the job and specialized knowledge of the industry. A few mentioned that, despite these positions being Associate’s-prepared, they require a unique blend of technical skills, soft skills, and experience. Industry representatives did not indicate a need for a large number of these types of occupations. Given their relative size and position on the industry life cycle, their processes and operations do not yet require a large number of support staff. Industry representatives noted that continuing education is important for all of their workers, given the changing landscape and rate of change in technology. Finally, industry representatives discussed difficulty in recruiting for specialty areas, Bachelor’s-prepared or Associate’s-prepared. Thus, many companies have national hiring pools. They indicated that they work with staffing agencies to fill some vacancies, recruit from competition, recruit veterans (in manufacturing-related nexus industries), increase visa sponsorship, and use a co-op network to enhance their recruitment efforts. Soft and Work Readiness Skills Companies generally indicated that they require highly skilled workers who are capable of solving complex problems and making decisions rather than rigidly-trained, inflexible workers. The kinds of job tasks they discussed require a high level of independent decision making and problem solving, such as “upgrade our platforms and work with cyber outsourcing firms,” “understand processes and quality assurance and guide a product to market,” and “know what machines to use and how to use them.” These kinds of tasks require not only a deep technical knowledge of the field, but also maturity and critical thinking. These types of positions require workers with well-developed soft skills, interpersonal skills, and business etiquette. Transferring knowledge between two industries requires the ability to effectively communicate with a variety of people (i.e. someone in electronic medical records must be able to communicate with practitioners, office staff, and outside vendors) and contribute to a cross-functional team. They require organizational savvy because they typically cross traditional silos – people need to know who to go to with a specific issue. The types of roles discussed also require a strong ability to learn and adapt quickly given the constant state of flux in the industries. They require flexibility, aptitude, and curiosity.

28
NEXT STEPS
It is recommended that the Workforce Alliance assume the primary role and related responsibilities for identifying current and future industry workforce needs for CCAC while CCAC leads the development, integration, and promotion of programs that align with fulfilling the needs identified by the Workforce Alliance. The Workforce Alliance should consider taking seven action items – two related to identifying industry need and five related to fulfilling industry need – to maximize its impact on emerging workforce needs in southwest Pennsylvania. Identify Industry Need
• Position the Workforce Alliance as primary liaison for CCAC between industry and educational programs
• Monitor economic and policy environment impacts on targeted industries Fulfill Industry Need
• Integrate industry experience throughout time of study • Develop interdisciplinary study • Incorporate foundational business concepts and soft skill development throughout
programs • Promote career pathing into nexus industries • Implement a formalized process for evaluating and enhancing CCAC program
offerings to fulfill industry need Position the Workforce Alliance as primary liaison for CCAC between industry and educational programs
In its first year, the Workforce Alliance focused on identifying and getting on-board key community members, developing and conducting preliminary due diligence on primary employers, and forming its infrastructure for future success. Given the success of these early activities, it is now poised for action. The Workforce Alliance should position itself as the primary liaison and point-of-contact for CCAC between industry firms and educational programs with the purpose of fulfilling identified industry needs.

29
This positioning will allow CCAC, through the Workforce Alliance, to build strong partnerships with industry and other stakeholders and, in turn, identify opportunities for CCAC’s degree-granting and non-degree granting programs while mitigating confusion among stakeholders regarding their multiple points of contact with CCAC (Figure 6).
Figure 6: Role of the Workforce Alliance Monitor economic and policy environment impacts on targeted industries In order to better understand the constantly changing workforce requirements of key regional industries, the Workforce Alliance should perform the following monitoring functions:
• Review of policy developments in each targeted industry and assess the impact on workforce related needs
• Assess key economic indicators and past total employment statistics to continue refining the quantitative model and identify future changes in workforce demand
• Develop and maintain strong relationships with industry representatives to identify opportunities for CCAC, through the Workforce Alliance, to partner in addressing current, and future, industry needs
The outcome of these monitoring activities should translate into the identification of potential curriculum revisions and opportunity identification for CCAC. Integrate industry experience throughout time of study Industry experience was identified as a critical factor in recruiting employees. The ability for students to attain industry experience throughout their coursework is vital for attaining employment post-graduation. This experience can be achieved in the following ways:
• Developing internship/externship/job shadowing agreements with industry firms • Use of industry experts in curriculum development and classroom education

30
Develop Interdisciplinary study As noted in this report, the skills required for many growing occupations are no longer isolated to one area of study but have become a balance of theory and application from multiple disciplines to assist firms in confronting the challenges they currently face. Such interdisciplinary areas include the application of information technology and manufacturing competencies in the areas of healthcare and life sciences and energy firms. This integration of multiple disciplines can be achieved through the following action items:
• Inventory current offerings in context of the emerging industries to identify current competencies
• Utilize current curricula to enhance existing programs of study and/or develop new ones that mesh the competencies from multiple areas of study
• Develop specialized programs to address specific needs of industries • Partner with other higher-education institutions to form articulation agreements to
create a single program that incorporates the strengths of all participating institutions and increases cost effectiveness for the student. Interview analysis suggests that Duquesne University’s Health Management Systems Bachelors program could be a logical fit given its emphasis on clinical skills, business skills, and information technology skills
Once these programs have been developed, the promotion of their existence to potential students and the industries whose needs they seek to fulfill will assist both schools in strengthening a single program enrollment and placement rates. Incorporate foundational business concepts and soft skill development throughout programs While CCAC is a recognized leader for its programs with regard to technical skills, the incorporation of foundational business concepts and continued focus on soft skill development across its programs would assist in preparing students in the application and communication of their technical competencies in the workplace. An understanding of primary business, technical, and soft skills among all workforce entrants is seen as an item of significant importance among those industries included in this study.

31
These include the development of the following: • Foundational Business Concepts
o General understanding of business processes o Knowledge of industry-specific processes o Awareness of industry-specific regulatory/compliance environment
• Soft skills o Written and verbal communication o Critical thinking o Independent decision-making (problem solving) o Adaptability o Ability to learn new skills efficiently and effectively o Emotional intelligence
Promote career pathing into nexus industries The emergence of interdisciplinary skill-set requirements among industries directly translates into the ability for individuals with a balanced background to pursue career paths outside those traditionally associated with their primary area of study. In many cases, these paths are focused on the use of one’s primary skill-set in a specific industry or function. For instance, the information technology professional is no longer limited to programming or data base administration at a general level but, with a supplemental knowledge of a particular industry, the individual can utilize their knowledge in that specific capacity (i.e. health information systems analyst). CCAC, through the Workforce Alliance, should continue to work to increase awareness of all career paths stemming from each skill-set among career services, the student body, and prospective students. This will enable each individual to be more aware of the potential opportunities their education affords them. Implement a formalized process for evaluating and enhancing CCAC program offerings to fulfill industry need The perception of the success and relevance of the CCAC and its workforce development efforts will hinge on its ability to identify the human capital needs of industry and respond in an efficient and effective manner. The previous four recommendations provide suggestions for specific items CCAC should begin to integrate across its degree granting and non-degree granting programs, based on industry feedback and quantitative analysis. In addition to these recommendations, an operations model should be developed to formalize the process of identifying current and future industry needs, evaluating the ability of CCAC’s key programs to fulfill those needs, and making any required modifications to the programs offered or related packaging to fill the related gaps on a continuous and dynamic basis.

32
The development and implementation of this model will allow for the realization of further efficiencies in the program development and course design processes as well as provide opportunities for feedback from the stakeholders in the process - the students and organizations in which they desire employment.

33
BIBLIOGRAPHY/CITATIONS
Bureau of Economic Analysis. Gross Domestic Product by Metropolitan Area. http://www.bea.gov/regional/gdpmetro/ Bureau of Economic Analysis. Investment in Private Nonresidential Fixed Assets. (Equipment codes EP11, ENS0, EP20) http://www.bea.gov/national/FA2004/Details/Index.html Bureau of Economic Analysis. Investment in Private Nonresidential Fixed Bureau of Labor Statistics. Occupational Projections and Training Data. http://www.bls.gov/emp/optd/ Accessed: 11/19/2009 Google News Archives. http://www.google.com/news Kotler, P. and Keller, K. 2009. Marketing Management 13th Edition. Pearson Education Inc. Upper Saddle River, NJ. Public Law 104 – 191. Health Insurance Portability and Accountability Act of 1996. Public Law 109 – 41. Patient Safety and Quality Improvement Act of 2005. Public Law 109 – 58. Energy Policy Act of 2005. Public Law 110 – 140. Energy Independence and Security Act of 2007. Title X., Sec.1002. 2007. Public Law 111 – 5. American Recovery and Reinvestment Act of 2009. Title IV. 2009. Public Law 111 – 5. American Recovery and Reinvestment Act of 2009. Title VII. 2009. Public Law 111 – 5. American Recovery and Reinvestment Act of 2009. Title XIII. 2009. U.S. Census Bureau. County Business Patterns Data. http://www.census.gov/econ/cbp/download/index.htm U.S. Census Bureau: Local Employment Dynamics. State of Pennsylvania. http://lehd.did.census.gov/led/datatools/qwiapp.html U.S. Congressional Research Service. Energy Independence and Security Act of 2007: A summary of Major Provisions. RL34294; 21 December 2007, by Fred Sissine.

34
U.S. Congressional Research Service. Energy Policy Act of 2005: Summary and Analysis of Enacted Provisions. RL33302; 8 March 2006, by Mark Holt and Carol Glover. U.S. Patent and Trademark Office. Patent Technology Monitoring Team (PTMT). http://www.uspto.gov/web/offices/ac/ido/oeip/taf/clsstca/pastccl_gd.htm U. S. Department of Health and Human Services. Administrative Requirements; Final Rule. 45 CFR Part 162. 2003. U.S. Department of Health and Human Services. Patient Safety and Quality Improvement; Final Rule. 42 CFR Part 3. 2008. U. S. Department of Health and Human Services. Standards for Privacy and Individually Identifiable Health Information; Final Rule. 45 CFR Parts 160 and 164. 2003. U. S. Department of Health and Human Services. Summary of the HIPAA Privacy Rule. 2003. Value Based Management.net. Product Life Cycle – industry Maturity Stages. www.valuebasedmanagement.net. Accessed: 12/8/2009

35
APPENDIX A. METHODS This appendix provides a detail project methodology organized by objective:
1. What are the key emerging industries in southwestern Pennsylvania and what is their potential economic impact for Allegheny County?
2. What are the anticipated job opportunities and requisite skill sets necessary for
these emerging industries to be successful?
3. What role should the Workforce Alliance play as an intermediary and convener of the emerging industries or clusters of emerging industries?
The consultants utilized a blended approach including qualitative data collection and analysis, quantitative data collection and analysis, and a review of relevant policy and other literature. INDUSTRY IDENTIFICATION This section provides an overview of methods used to identify and recommend the nexus industries on which the Workforce Alliance should focus its preliminary efforts.
The consultants reviewed the business and policy literature to identify and adapt a model to classify and prioritize key industries of interest. The Industry Life-Cycle (ILC) model was chosen. The consultants also developed and utilized five criteria to define high-growth industries:
Criteria 1: The industry’s growth rate is faster than the economy Criteria 2: A need for change in the market has been identified or articulated Criteria 3: New technologies are being used for applications traditionally completed by
older technologies Criteria 4: New socioeconomic or political conditions are emerging (i.e. causing
growth, decline, or negligible impact) Criteria 5: The industry is sustainable within the region
These criteria formed the basis for variable identification in the regression analyses and protocol development for the interviews. Interviews with Regional Stakeholders The consultants conducted interviews with regional stakeholders including representatives from industry, education, trade associations, public workforce

36
investment system, and economic development. The interviews identified what stakeholders believed to be growing industries and their priorities for these industries. Regression The purpose of this stage in the model is to identify industry sectors from an independent, objective, and quantitative viewpoint in the Pittsburgh, Pennsylvania metropolitan statistical area (MSA) that are forecasted to have the highest growth potential in gross domestic product (GDP). Variable Selection The rate of change in GDP within the Pittsburgh MSA for each sector6 was used as the dependent variable. The following potential independent variables were selected to assist in explaining the subsequent criteria from a quantitative perspective. Data availability constraints prohibited the collection of all data elements at the MSA level. Therefore, variables were collected at the most granular level possible.
• National Information Communication Technology investment7 - Criteria 3 • National Fixed Asset investment8 - Criteria 3 • Establishments within the MSA9 - Criteria 1 • Utility Patent Grants by Technology Class within the State10 - Criteria 3 • Sector News Coverage with Local and National Content Focus11 - Criteria 2
6 Bureau of Economic Analysis. Gross Domestic Product by Metropolitan Area. http://www.bea.gov/regional/gdpmetro/ 7 Bureau of Economic Analysis. Investment in Private Nonresidential Fixed Assets. (Equipment codes EP11, ENS0, EP20) http://www.bea.gov/national/FA2004/Details/Index.html 8 Bureau of Economic Analysis. Investment in Private Nonresidential Fixed Assets. http://www.bea.gov/national/FA2004/Details/Index.html 9 U.S. Census Bureau. County Business Patterns Data. http://www.census.gov/econ/cbp/download/index.htm 10 U.S. Patent and Trademark Office. Patent Technology Monitoring Team (PTMT). NOTE: Subjective association between BEA industry areas and NAICS sectors was conducted to associate grants with appropriate sectors. http://www.uspto.gov/web/offices/ac/ido/oeip/taf/clsstca/pastccl_gd.htm 11 Google News Archives. NOTE: Collection efforts used Boolean queries that included sector name and geographic location to return quantitative news counts at both the local (Pittsburgh) and national (Unites-States OR U.S.) level. http://www.google.com/analytics

37
Observation Selection The sectors detailed in Table 1 are included within the preliminary regression model. In order to remain objective, sectors are only excluded from the analysis if related data is unavailable at the time of review. Analysis The rate of change for each variable is calculated for all years analyzed to remove some of the variability associated with industries of differing sizes and units of measure. A simple linear regression was performed for each potential explanatory variable against the industry’s 2005-2006 MSA GDP Growth Rate, using varying lag periods. The objective of this analysis was to identify independent variable significance as it relates to MSA GDP, and the coefficient direction and magnitude of the relationship. Utilizing the information gathered from the simple linear regression, a multiple regression model was constructed to assist in the identification of emerging sectors within the Pittsburgh MSA. This model was used to forecast the MSA GDP rate of change for each sector in the years 2009, 2010, and 2011. These results are compared with that derived from the qualitative methods to determine:
1. Do discrepancies exist between the quantitative and qualitative conclusions? What are the root findings for these conclusions?
2. Is the variable significance and coefficient direction of all explanatory variables aligned with the general understanding of these economic relationships? If not, what would be the cause of this unexpected result?
Table 1: Industry Sectors in Preliminary Quantitative Analysis
NAICS Code(s) Sector
21 Natural Resources and Mining22 Utilities23 Construction
31-33 Manufacturing42 Wholesale Trade48 Transportation51 Information52 Finance and Insurance53 Real Estate and Rental and Leasing54 Professional, Scientific, and Technical Services61 Educational Services62 Health Care and Social Assistance71 Arts, Entertainment, and Recreation72 Accommodation and Food Services81 Other Services (except Government)

38
Policy Analysis The consultants selected, reviewed, and analyzed specific federal regulations and policies to assess their potential impact on industry growth based on the preliminary due diligence with regional stakeholders. The selected policies include those listed in Table 2. A detailed explanation of the policy evaluation and list application can be found on page 42 in this appendix.
Table 2: Policies Selected for Evaluation
Industry Policy Title Year
Enacted/Modified
Healthcare and Life Sciences
Health Insurance Portability and Accountability Act (HIPAA)
1996/2003
Patient Safety and Quality Improvement Act (PSQIA)
2005
Health Information Technology Act (HITECH)
2009
Energy
Energy Policy Act 2005 Energy Independence and Security Act
2007
American Recovery and Reinvestment Act (ARRA)
2009
EMPLOYMENT OUTLOOK AND SKILL SETS Next, the consultants focused on identifying the employment outlook and skill sets necessary to be successful in each nexus industry. This was accomplished by conducting a secondary round of interviews with stakeholders in each nexus industry; developing a second regression model to forecast total annual employment; and continuing to evaluate policies affecting each nexus industry. Interviews with Industry Stakeholders The consultants compiled a list of potential interview contacts in each nexus industry using the following resources:
• Dunn and Bradstreet data • Pittsburgh Business Times, Book of Lists • Pittsburgh Business Times and Pittsburgh Post-Gazette articles • Allegheny Conference on Community Development and Pittsburgh Regional
Alliance, Regional Data • Pittsburgh Technology Council’s Membership Directory • Leaders in the field and recommendations from industry representatives
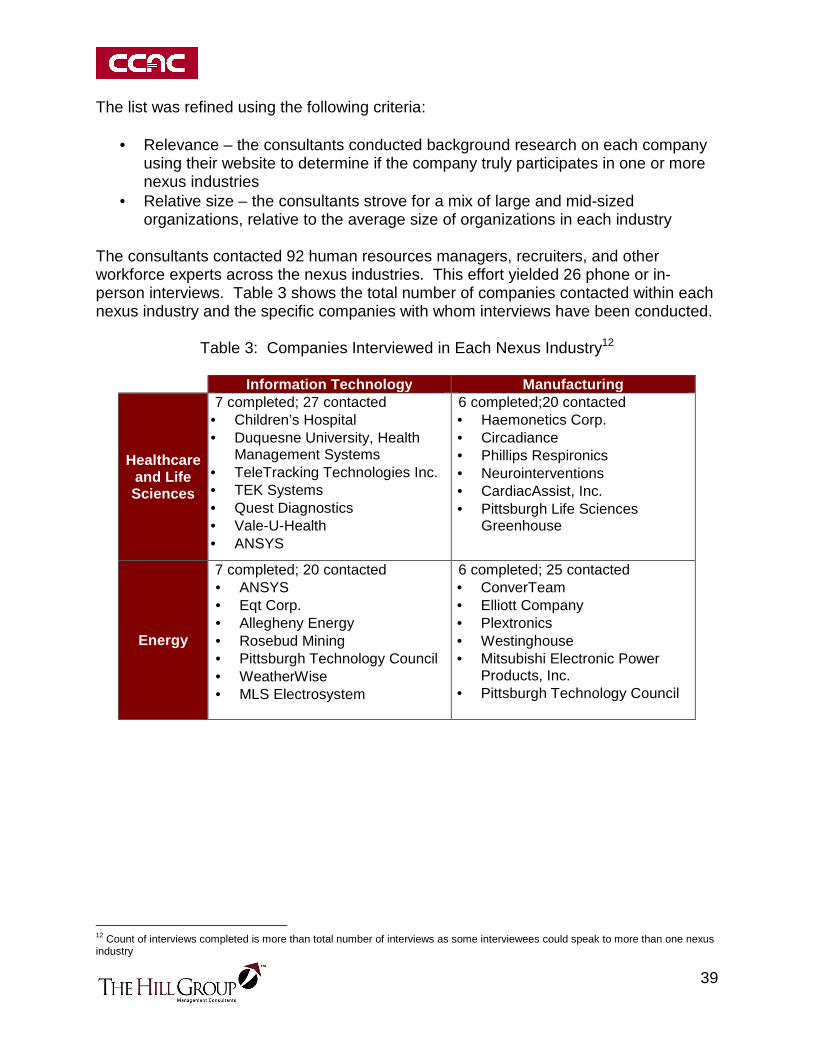
39
The list was refined using the following criteria:
• Relevance – the consultants conducted background research on each company using their website to determine if the company truly participates in one or more nexus industries
• Relative size – the consultants strove for a mix of large and mid-sized organizations, relative to the average size of organizations in each industry
The consultants contacted 92 human resources managers, recruiters, and other workforce experts across the nexus industries. This effort yielded 26 phone or in-person interviews. Table 3 shows the total number of companies contacted within each nexus industry and the specific companies with whom interviews have been conducted.
Table 3: Companies Interviewed in Each Nexus Industry12
Information Technology Manufacturing
Healthcare and Life Sciences
7 completed; 27 contacted • Children’s Hospital • Duquesne University, Health
Management Systems • TeleTracking Technologies Inc. • TEK Systems • Quest Diagnostics • Vale-U-Health • ANSYS
6 completed;20 contacted • Haemonetics Corp. • Circadiance • Phillips Respironics • Neurointerventions • CardiacAssist, Inc. • Pittsburgh Life Sciences
Greenhouse
Energy
7 completed; 20 contacted • ANSYS • Eqt Corp. • Allegheny Energy • Rosebud Mining • Pittsburgh Technology Council • WeatherWise • MLS Electrosystem
6 completed; 25 contacted • ConverTeam • Elliott Company • Plextronics • Westinghouse • Mitsubishi Electronic Power
Products, Inc. • Pittsburgh Technology Council
12 Count of interviews completed is more than total number of interviews as some interviewees could speak to more than one nexus industry

40
Quantitative Analysis The purpose of this stage in the model is to identify potential explanatory variables, their significance, magnitude, and coefficient direction, in forecasting the rate of change in an industry’s annual “total employment”13 using an objective methodology, independent from the qualitative review. Variable Selection This iteration of the model uses the growth rate of an industry’s annual total employment14 as the dependent variable to better forecast specific human capital requirements vis a vis growth in occupations in the Pittsburgh MSA. The following variables utilized in the preliminary regression analysis, and strongly tied to the initial Growing Industry Definition Criteria (GIDC), were included as potential explanatory variables in the second regression model.
• National Information Communication Technology investment15 - GIDC 3 • National Fixed Asset investment16 - GIDC 3 • Industry News Coverage with Local and National Content Focus17 - GIDC 2 • MSA Gross Domestic Product (GDP)18 – GIDC 1
However, data availability constraints prohibited the collection of data elements at the MSA scale. Therefore, variables were collected at the most granular scale possible. A review of the Bureau of Labor Statistics’ Occupational Projections and Training Data indicates that job replacements and job growth are two of the main criterion for forecasting human capital needs. It was also noted that, in “most occupations”, vacancies due to replacements outnumber those openings due to job growth. These findings prompted the inclusion of two additional dependent variables for analysis:
• Pittsburgh MSA Industry Separation Rate19 • Pittsburgh MSA Industry Job Creation Rate20
13 NOTE: Total Employment is defined by the U.S. Census Bureau’s Local Employment Dynamics as the “Total number of workers who were employed by the same employer in both the current and previous quarter”. http://lehd.did.census.gov/led/gdocs/Metadata4_QWI.htm 14 SOURCE: U.S. Census Bureau: Local Employment Dynamics. State of Pennsylvania. http://lehd.did.census.gov/led/datatools/qwiapp.html 15 SOURCE: Bureau of Economic Analysis. Investment in Private Nonresidential Fixed Assets. (Equipment codes EP11, ENS0, EP20) http://www.bea.gov/national/FA2004/Details/Index.html 16 SOURCE: Bureau of Economic Analysis. Investment in Private Nonresidential Fixed Assets. http://www.bea.gov/national/FA2004/Details/Index.html 17 SOURCE: Google News Archives. Collection efforts used Boolean queries that included industry name and geographic location to return quantitative news counts at both the local (Pittsburgh) and national (Unites-States OR U.S.) level. To further strengthen this variable for the model, the value of the news variables is a rate of change in the percentage of total news coverage that was identified as being linked to the industry. http://www.google.com/analytics 18 SOURCE: Bureau of Economic Analysis. Gross Domestic Product by Metropolitan Area. http://www.bea.gov/regional/gdpmetro/ 19 NOTE: Separation rate was calculated by identifying all areas in which the total employment in an industry declined year over year within a specific age group, summing those differences, and dividing that number by the sum of the annual total employment for all age groups in the prior year. This results in the percentage decrease in total employment from one year to the next (or rate of separation). SOURCE: U.S. Census Bureau: Local Employment Dynamics. State of Pennsylvania. http://lehd.did.census.gov/led/datatools/qwiapp.html

41
It was also determined that in order to incorporate all explanatory variables identified as having potential significance, the model would not be able to forecast beyond the three-digit NAICS code. Observation Selection The regression model includes the industries detailed in Table 4. Industries are only excluded from the analysis if related data is unavailable at the time of review.
Table 4: Industries in Secondary Quantitative Analysis
Analysis The rate of change for each variable was calculated for all years analyzed to remove some of the variability associated with industries of differing size and units of measure. A simple linear regression was performed for each potential explanatory variable against the industry’s 2006-2007 MSA Total Employment Rate of Change using varying lag periods. The objective of this analysis was to identify independent variable significance, as it related to MSA Total Employment, and identify the coefficient direction and magnitude of the relationship. Utilizing the information gathered from the simple linear regression, a multiple regression model was constructed to assist in the identification of industries within the Pittsburgh MSA that were perceived to have the largest employment growth in the near future. This model was used to forecast the 2008-2009 Pittsburgh MSA Employment growth rate and 2009 total employment figures within each observed industry. These results were compared with that derived from the qualitative methods to determine:
20 SOURCE: U.S. Census Bureau: Local Employment Dynamics. State of Pennsylvania. http://lehd.did.census.gov/led/datatools/qwiapp.html
NAICS Code Industry Title
NAICS Code Industry Title
113000 Forestry and Logging 481000 Air Transportation211000 Oil and Gas Extraction 484000 Truck Transportation212000 Mining (except Oil and Gas) 485000 Transit and Ground Passenger Transportation213000 Support Activities for Mining 486000 Pipeline Transportation311000 Food Manufacturing 493000 Warehousing and Storage313000 Textile Mills 511000 Publishing Industries (except Internet)315000 Apparel Manufacturing 512000 Motion Picture and Sound Recording Industries321000 Wood Product Manufacturing 522000 Credit Intermediation and Related Activities322000 Paper Manufacturing 523000 Securities, Commodity Contracts, and Other Financial Investments323000 Printing and Related Support Activities 525000 Funds, Trusts, and Other Financial Vehicles324000 Petroleum and Coal Products Manufacturing 531000 Real Estate325000 Chemical Manufacturing 532000 Rental and Leasing Services326000 Plastics and Rubber Products Manufacturing 561000 Administrative and Support Services327000 Nonmetallic Mineral Product Manufacturing 562000 Waste Management and Remediation Services331000 Primary Metal Manufacturing 621000 Ambulatory Health Care Services332000 Fabricated Metal Product Manufacturing 622000 Hospitals333000 Machinery Manufacturing 624000 Social Assistance334000 Computer and Electronic Product Manufacturing 711000 Performing Arts, Spectator Sports, and Related Industries335000 Electrical Equipment, Appliance, and Component Manufacturing 713000 Amusement, Gambling, and Recreation Industries337000 Furniture and Related Product Manufacturing 721000 Accommodation339000 Miscellaneous Manufacturing 722000 Food Services and Drinking Places

42
1. Do the industries forecasted as having the highest growth and largest number of
positions reject our phase I hypothesis on the growing sectors? 2. Do discrepancies exist between our quantitative and qualitative conclusions?
What are the root findings for these conclusions? 3. Is the significance and coefficient direction of all explanatory variables aligned
with the general understanding of these economic relationships? If not, what would be the cause of this unexpected result?
Policy Impact With the notion that regulatory conditions often drive industry changes and/or innovations, the team evaluated major policies and policy changes regarding the industries in question. Major policies were selected based on (1) their relevance to identified high-growth industries, (2) their recency on the federal legislative agenda, and (3) their coinciding with spikes in news coverage concerning the issue they confront. Those policies were evaluated using the metric designed by the project team shown in Table 5 below.
Table 5: Policy Impact Evaluation Tool
1 - Low 2 3 4 5 - High
ScopeFew, less significant elements affected
Few elements of greater significance affected
More elements of less significance affected
More elements of greater significance affected
Most elements affected
Magnitude
Implementation has little to no impact on industry
Implementation has minimal impact on industry
Implementation has some impact on industry
Implementation has considerable impact on industry
Implementation requires complete restructuring within industry
LongevityIn effect for less than 1 year In effect for 1-3 years In effect for 4-5 years
In effect for 6-10 years
In effect for greater than 10 years
Time SensitivityWill take effect in more than 10 years
Will take effect in between 6 and 10 years
Will take effect in between 4 and 5 years
Will take effect in between 1 and 3 years
Will take effect in less than one year
Compliance Cost
Funded completely by third party (non-industry) sources
Primarily funded by third-party (non-industry) sources with some matching
Joint third-party (non-industry) and industry firm cost sharing
Primarily funded by industry firms with some incentive from third-party (non-industry) sources
Entirely funded by industry firms
Enforcement
Incentive-driven with little to no enforcement structure
Incentive-driven with potential for future enforcement
Disincentive-driven but with weak or non-existent enforcement
Disincentive-driven with moderate enforcement
Disincentive-driven with strong enforcement
Impact LevelsCriterion
The consultants selected the criterion above to capture an overarching view of a policy’s impact on identified industries and its possible impacts on human capital issues:
• Scope – While a policy might impact a targeted industry, how much of that industry is affected assists in determining how much of that industry and how many occupations also are affected.
• Magnitude – The size of the impact is not limited to number of elements, but also how deeply those elements are changed.
43
• Longevity – While some policies may have sizable impact, that impact may not affect longer-term outlooks for an industry. For example, Cash for Clunkers had significant impact but ended after a very short period of time.
• Time sensitivity – Timing of policy implementation may not be immediate. While many begin “from the date of enactment of this Act,” some allot a specific time frame prior to their taking effect.
• Compliance cost – While many resources are committed from many parties in a policy, legislation generally delineates what portions of government support will be provided. The rest is taken on by an industry group.
• Enforcement – Enforcement measures are often incorporated into legislation. This criterion examines not only those measures but the likelihood of their being enforced.
NEXT STEPS The consultants used the results from interviews with regional and industry stakeholders and policy analysis to develop recommendations contained in the Next Steps section.
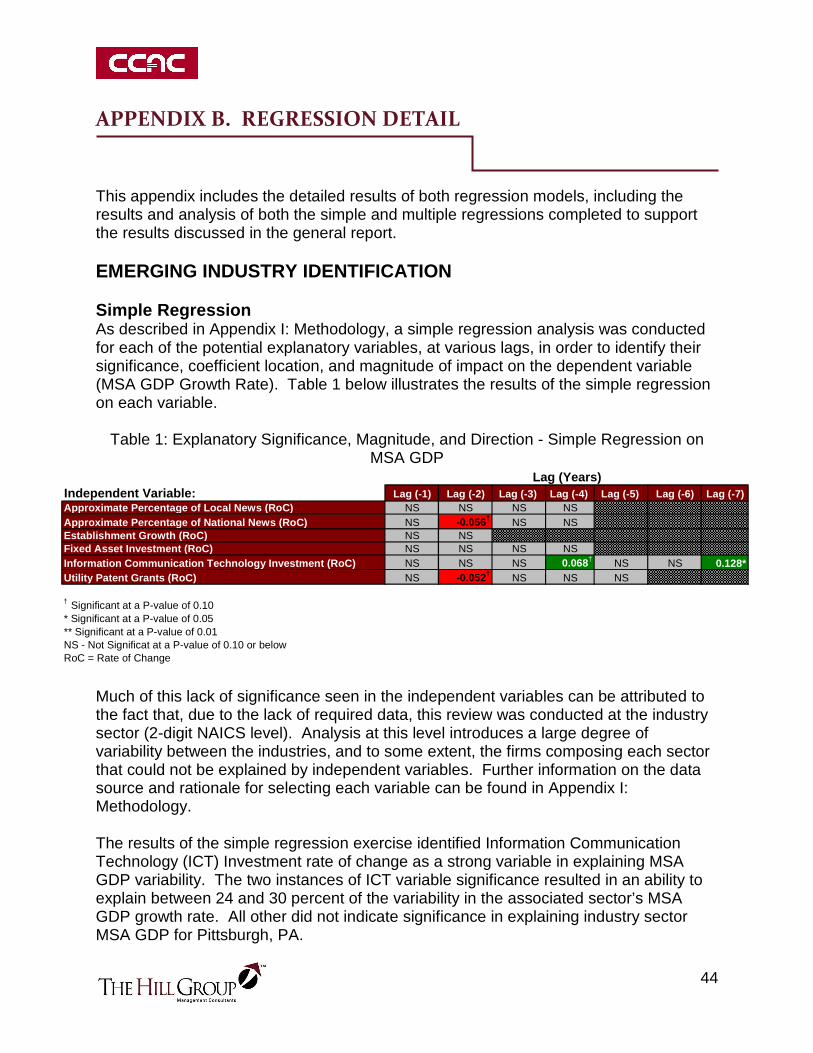
44
APPENDIX B. REGRESSION DETAIL This appendix includes the detailed results of both regression models, including the results and analysis of both the simple and multiple regressions completed to support the results discussed in the general report. EMERGING INDUSTRY IDENTIFICATION Simple Regression As described in Appendix I: Methodology, a simple regression analysis was conducted for each of the potential explanatory variables, at various lags, in order to identify their significance, coefficient location, and magnitude of impact on the dependent variable (MSA GDP Growth Rate). Table 1 below illustrates the results of the simple regression on each variable.
Table 1: Explanatory Significance, Magnitude, and Direction - Simple Regression on
MSA GDP
Much of this lack of significance seen in the independent variables can be attributed to the fact that, due to the lack of required data, this review was conducted at the industry sector (2-digit NAICS level). Analysis at this level introduces a large degree of variability between the industries, and to some extent, the firms composing each sector that could not be explained by independent variables. Further information on the data source and rationale for selecting each variable can be found in Appendix I: Methodology. The results of the simple regression exercise identified Information Communication Technology (ICT) Investment rate of change as a strong variable in explaining MSA GDP variability. The two instances of ICT variable significance resulted in an ability to explain between 24 and 30 percent of the variability in the associated sector’s MSA GDP growth rate. All other did not indicate significance in explaining industry sector MSA GDP for Pittsburgh, PA.
Independent Variable: Lag (-1) Lag (-2) Lag (-3) Lag (-4) Lag (-5) Lag (-6) Lag (-7)Approximate Percentage of Local News (RoC) NS NS NS NSApproximate Percentage of National News (RoC) NS -0.056† NS NSEstablishment Growth (RoC) NS NSFixed Asset Investment (RoC) NS NS NS NSInformation Communication Technology Investment (Ro C) NS NS NS 0.068† NS NS 0.128*Utility Patent Grants (RoC) NS -0.052† NS NS NS
† Significant at a P-value of 0.10* Significant at a P-value of 0.05** Significant at a P-value of 0.01NS - Not Significat at a P-value of 0.10 or belowRoC = Rate of Change
Lag (Years)

45
Multiple Regression Based upon the results of the simple regression the ICT investment variable at a four - and seven - year lag was incorporated within a multiple regression model in order to provide preliminary direction as to which sectors would be experiencing the most growth in the near future. A Boolean variable, “High Reliance” was also included within the analysis21. In this model, the ICT ROC (-4) and ICT ROC (-7) variables were significant at the 0.10 level and the Boolean variable not significant below a P-value of 0.10, but showing improvement in the model through the Adjusted R Square value. The significance of the model’s F-statistic was also significant at the 0.05 level. Table 2 below displays the key statistics from the preliminary regression.
Table 2: MSA GDP Regression - Key Statistics
Variable Coefficients P-value Standard ErrorMultiple R 0.7280 Intercept 0.0363 0.0047 0.0103R Square 0.5300 ICT RoC (-4) 0.0637 0.0576 0.0300Adjusted R Square 0.4020 ICT RoC (-7) 0.0935 0.0938 0.0510Standard Error 0.0250 High Reliance (Boolean) 0.0185 0.1987 0.0135Observations 15Significance F 0.034
Regression Statistics
INDUSTRY AND HUMAN CAPITAL ANALYSES With the high-level industry sectors forecasted to have the highest growth in MSA GDP isolated, the purpose of this stage in the model is to determine the industries that have the greatest potential for growth related to “total employment”22. A secondary output from this analysis is the identification of potential explanatory variables, their significance, magnitude, and coefficient direction, in forecasting total employment to assist in the development of a repeatable method for identifying areas of interest for the Workforce Alliance and the Community College of Allegheny County as a whole. While the sectors believed to have the highest potential for growth were identified in the initial regression, this model remains objective and independent from the qualitative reviews performed and the initial quantitative analysis. Refer to Appendix I: Methodology for additional information.
21 The “High Reliance” variable was included to indicate whether the industry was traditionally highly reliant on technology as it would be expected that those industries that are not generally highly reliant on technology would have a different relationship with ICT investment than those that are. 22 NOTE: Total Employment is defined by the U.S. Census Bureau’s Local Employment Dynamics as the “Total number of workers who were employed by the same employer in both the current and previous quarter”. http://lehd.did.census.gov/led/gdocs/Metadata4_QWI.htm

46
Simple Regression As described within Appendix I: Methodology, a simple regression analysis was completed for each of the potential explanatory variables at various lags in order to identify their significance, coefficient direction, and magnitude of impact on the dependent variable (MSA Total Employment Growth Rate). Table 3 below illustrates the results of the simple regression on each variable. Further information on the data source and rationale for selecting each variable can be found in Appendix I: Methodology.
Table 3: Explanatory Significance, Magnitude, and Direction – Simple Regression on Total Employment
As a result of the simple regression, it was determined that some degree of significance can be seen within each potential variable, except the Average Percentage of Local News. One possible cause for this lack of significance is the variability inherent in news coverage. These values would incorporate all tones in coverage which, while all considered exposure for the industry, could have far different impacts on employee and recruit sentiment toward the industry. An example of this would be the recent coverage in the growth of electronic health records and a call for skilled employees against coverage relating to the massive job losses in the automotive industry. The variables for these industries may indicate the same percentage of news coverage, but the related impact on employment in the industry may be far different. Another key finding from this stage of the analysis, which is also of interest, is the change in the nature of the relationship (direct to inverse) seen within the Fixed Asset Investment and ICT Investment values. However, there remains a wide array of items that can be classified as Information Communications Technology and an even larger set seen as Fixed Assets. The variability in these items and their related impact on the workplace (reducing or increasing the need for employees) may be the reason for this shift. MULTIPLE REGRESSION The final regression model includes each of the variables that proved significant in the simple regression and results in a model with significance (F-statistic significance) below 0.01 and an ability to explain an estimated 77 percent of the variability in regional total employment growth with a relatively low standard error of +/- 0.04 percent.
Independent Variable: Lag (-1) Lag (-2) Lag (-3) Lag (-4) Lag (-5) Lag (-6) Lag (-7) Lag (-8) Lag (-9) Lag (-10) Lag (-11) Lag (-12 )Approximate Percentage of Local News (RoC) NS NS NS NS NS NS NSApproximate Percentage of National News (RoC) NS NS NS 0.0614† NS NS NSFixed Asset Investment (RoC) NS 0.1314* NS -0.0888** NS NS 0.2048* NS NS NS NS NSInformation Communication Technology Investment (Ro C) NS NS NS NS NS NS NS 0.1452† -0.1595* NS NS NSJob Creation (RoC) 0.0360* NS NS 0.0565* NS NS NS NS NS NSRegional GDP (RoC) 0.7622** 0.3296** 0.2383* NS 0.1929* NSSeparation Rate (RoC) 0.6800* NS NS NS NS NS NS NS NS NS
† Significant at a P-value of 0.10* Significant at a P-value of 0.05** Significant at a P-value of 0.01NS - Not Significat at a P-value of 0.10 or belowRoC = Rate of Change
Lag (Years)

47
Table 4 below outlines some of the key statistics associated with the multiple regression model including the independent variable coefficients and significance to the total model.
Table 4: Employment Growth Regression - Key Statistics Variable Coefficients P-value Standard Error
Multiple R 0.8751 Intercept 0.0159 0.1544 0.0109R Square 0.7659 ICT RoC (-9) -0.1657 0.0001 0.0370Adjusted R Square 0.7257 Fixed Asset RoC (-4) -0.0895 0.0001 0.0200Standard Error 0.0352 MSA GDP RoC (-1) 0.4235 0.0023 0.1291Observations 42 Separation RoC (-1) 0.5659 0.0109 0.2104Significance F 1.01115E-09 National News RoC (-3) 0.0333 0.1007 0.0197
Job Creation RoC (-1) 0.0297 0.0006 0.0079
Regression Statistics
One will notice the inverse relationship between total employment rate of change and the ICT and Fixed Asset Investment variables as these investments generally result in increased efficiencies in the organization and thereby a reduced need for additional employment. Also, as expected, the most significant variables as it relates to coefficient magnitude are the MSA GDP and Separation Rate. The model predicts that a percentage increase in these variables will result in an average increase in total employment growth rate of half a percent in the following year. This finding aligns itself with that expressed by the Bureau of Labor Statistics in its Occupational Projections and Training Data23 where it identified replacement rate (of which separation rate is a foundational component) and industry output (namely, GDP) as core components of projecting employment. However, the standard error for all variables remains somewhat high as it relates to the coefficients and, therefore, that variability should be accounted for in the analysis of this relationship. A low degree of correlation is present among dependent variables as well with the highest correlation being 0.4 between MSA GDP and Separation Rate for the same year (an outcome that would be expected as Separation Rate is always reported as a negative number and an increase in the GDP of an industry would generally result in a reduction of separations from that industry). The dependent variable correlation table, Table 5, displays the correlation coefficients for each of the variables included in the model.
Table 5: Dependent Variable Correlation Coefficients Dependent Variable ICT (-9) Fixed Asset (-4) MSA GDP (-1) Separation (-1) National News (-3) Job Creation (-1)
ICT (-9) 1Fixed Asset (-4) 0.043715187 1MSA GDP (-1) 0.132646811 -0.203443604 1Separation (-1) -0.063481174 0.292027081 0.408725579 1National News (-3) -0.119710447 0.069139661 0.143174774 0.093360579 1Job Creation (-1) 0.068038158 0.000620369 0.239120994 0.003143249 0.091148046 1 23 Bureau of Labor Statistics. Occupational Projections and Training Data. http://www.bls.gov/emp/optd/ Accessed: 11/19/2009

48
Another area of interest in this correlation matrix is the somewhat significant inverse relationship between the industry’s MSA GDP from a year ago and their fixed asset investment growth rate from four years prior. This finding becomes increasingly interesting when viewed in comparison to a similar magnitude in the direct correlation between the same MSA GDP rate and the industry’s ICT investment nine years prior. Additional investigation would need to be performed, but a preliminary discussion on these relationships may indicate that much of the substantial fixed asset investments may have a longer return on investment (ROI) time horizon that the three years provided (thus the change in the relationship five years prior). Using the data collected in this analysis, the correlation between fixed asset investment rate and MSA GDP growth rate has an inverse relationship in three instances between a zero - and three-year lag and then remains direct from a lag of four - to nine-years. Due to the minimum lag in the model being one year, forecasts of total employment for industries could only be projected for one year without having to first forecast three of the six independent variables (MSA GDP, Separation, and Job Creation). At the time the forecast was conducted, MSA GDP data was not yet available at the three-digit NAICS level and, therefore, these values were calculated by averaging the previous five MSA GDP growth rates.

49
APPENDIX C. REGRESSION TERM DEFINITION

50