emerging east asia’s growth and restructuring—a …emerging east asia’s growth and...
TRANSCRIPT
Emerging East Asia’s Growth and Restructuring—A Regional UpdateEconomic Performance in the First Half of 2006
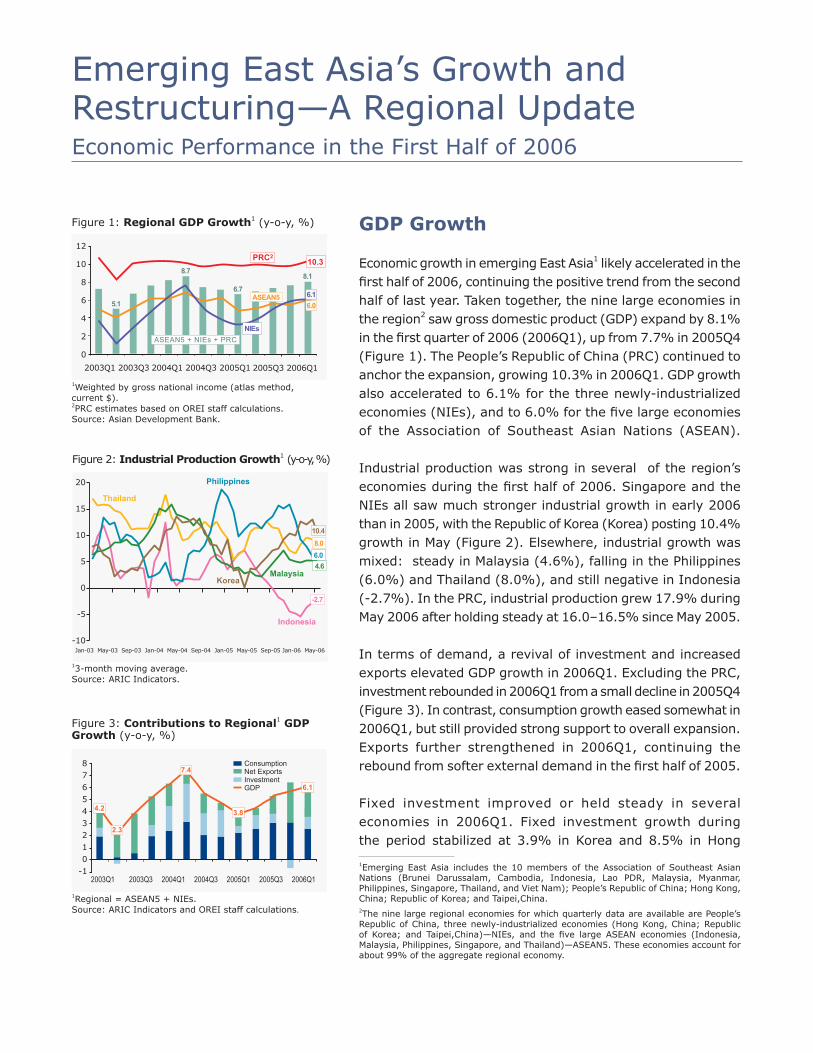
Figure 2: Industrial Production Growth1 (y-o-y, %)
-10
-5
0
5
10
15
20 Philippines
Malaysia
Indonesia
Korea
Jan-03 May-03 Sep-03 Jan-04 May-04 Sep-04 Jan-05 May-05 Sep-05 Jan-06 May-06
10.48.06.04.6
-2.7
Thailand
13-month moving average.Source: ARIC Indicators.
GDP Growth
Economic growth in emerging East Asia1 likely accelerated in the first half of 2006, continuing the positive trend from the second half of last year. Taken together, the nine large economies in the region2 saw gross domestic product (GDP) expand by 8.1% in the first quarter of 2006 (2006Q1), up from 7.7% in 2005Q4 (Figure 1). The People’s Republic of China (PRC) continued to anchor the expansion, growing 10.3% in 2006Q1. GDP growth also accelerated to 6.1% for the three newly-industrialized economies (NIEs), and to 6.0% for the five large economies of the Association of Southeast Asian Nations (ASEAN).
Industrial production was strong in several of the region’s economies during the first half of 2006. Singapore and the NIEs all saw much stronger industrial growth in early 2006 than in 2005, with the Republic of Korea (Korea) posting 10.4% growth in May (Figure 2). Elsewhere, industrial growth was mixed: steady in Malaysia (4.6%), falling in the Philippines (6.0%) and Thailand (8.0%), and still negative in Indonesia (-2.7%). In the PRC, industrial production grew 17.9% during May 2006 after holding steady at 16.0–16.5% since May 2005.
In terms of demand, a revival of investment and increased exports elevated GDP growth in 2006Q1. Excluding the PRC, investment rebounded in 2006Q1 from a small decline in 2005Q4 (Figure 3). In contrast, consumption growth eased somewhat in 2006Q1, but still provided strong support to overall expansion. Exports further strengthened in 2006Q1, continuing the rebound from softer external demand in the first half of 2005.
Fixed investment improved or held steady in several economies in 2006Q1. Fixed investment growth during the period stabilized at 3.9% in Korea and 8.5% in Hong
1Emerging East Asia includes the 10 members of the Association of Southeast Asian Nations (Brunei Darussalam, Cambodia, Indonesia, Lao PDR, Malaysia, Myanmar, Philippines, Singapore, Thailand, and Viet Nam); People’s Republic of China; Hong Kong, China; Republic of Korea; and Taipei,China.2The nine large regional economies for which quarterly data are available are People’s Republic of China, three newly-industrialized economies (Hong Kong, China; Republic of Korea; and Taipei,China)—NIEs, and the five large ASEAN economies (Indonesia, Malaysia, Philippines, Singapore, and Thailand)—ASEAN5. These economies account for about 99% of the aggregate regional economy.
Figure 3: Contributions to Regional1 GDP Growth (y-o-y, %)
876543210
-12003Q1 2003Q3 2004Q1 2004Q3 2005Q1 2005Q3 2006Q1
4.2
2.3
7.4
3.8
6.1
ConsumptionNet ExportsInvestmentGDP
1Regional = ASEAN5 + NIEs.Source: ARIC Indicators and OREI staff calculations.
Figure 1: Regional GDP Growth1 (y-o-y, %)
2003Q1 2003Q3 2004Q1 2004Q3 2005Q1 2005Q3 2006Q1
12
10
8
6
4
2
0
ASEAN5 + NIEs + PRC
5.1
8.7
6.7
8.1
ASEAN5
PRC2
NIEs
6.1
10.3
6.0
1Weighted by gross national income (atlas method, current $).2PRC estimates based on OREI staff calculations. Source: Asian Development Bank.

R E G I O N A L U P D A T E
�
Figure 4A: Fixed Investment Growth (y-o-y, %)
Source: ARIC Indicators and OREI staff calculations.
-15
-10
-5
0
5
10
15
20
25
2003Q1 2003Q3 2004Q1 2004Q3 2005Q1 2005Q3 2006Q1
Taipei,China
Korea
Hong Kong, China
Singapore
8.5
3.9
-4.0
10.2
Figure 4B: Fixed Investment Growth (y-o-y, %)
Source: ARIC Indicators and OREI staff calculations.
-10
-5
0
5
10
15
20
25
Thailand
Philippines
Indonesia
Malaysia
11.4
6.6
2.9
-3.4
2003Q1 2003Q3 2004Q1 2004Q3 2005Q1 2005Q3 2006Q1
Figure 5: Consumption Growth (y-o-y, %)
Source: ARIC Indicators and OREI staff calculations.
-2
-1
0
1
2
3
4
5
6
7
8
2003Q1 2003Q3 2004Q1 2004Q3 2005Q1 2005Q3 2006Q1
-1.3
6.8
5.1
6.5
4.53.9
ASEAN5 NIEs
Kong, China following slow 2005 growth (Figure 4A). In Singapore, fixed investment grew 10.2% in 2006Q1, showing continued volatility. After a surge in growth in 2004 and early 2005, fixed investment in Taipei,China plunged 11.8% in 2005Q4, but the decline slowed to -4.0% in 2006Q1. Like Singapore, Malaysia’s fixed investment rebounded strongly, with a 2006Q1 increase of 11.4%, as global demand solidified for information technology (IT) products—a key Malaysian export (Figure 4B). Indonesia, however, saw only a mild rise in investment growth, to 2.9%, after the financial turbulence last year triggered a sharp slowdown in the second half. Similarly, investment growth continued to ease in Thailand, to 6.6%, in part due to political uncertainty. Continued political uncertainty also affected Philippine investment, which has experienced a prolonged contraction. Investment has been much stronger and sustained in the PRC than elsewhere in the region. Monthly growth of real fixed asset investment edged up to an average 27.7% in 2006Q1 from 25.7% in 2005Q4.
Growth in consumption fell slightly in 2006Q1, after a strong 6.5% growth in ASEAN5 at the end of 2005, and despite the slight increase in the NIEs (Figure 5). In ASEAN5, especially Indonesia, there was a surge in public consumption from 2005Q4 to 2006Q1. Strong consumer credit growth in Malaysia and continued growth in Philippine remittances maintained the robust and stable growth in the two economies. Among the NIEs; Hong Kong, China saw public consumption in 2006Q1 emerge from a prolonged contraction. In Korea, private consumption continued to recover as the workout of the 2003 household debt problem progressed.
Evidence from retail sales data suggests that slowing consumption growth in ASEAN5 in 2006Q1 may have continued in recent months (Figure 6). Although the seasonal distortion caused by holiday sales makes trends over 2005Q4–2006Q1 difficult to interpret in the NIEs, consumption growth appears to be strengthening, at least in Hong Kong, China. In the PRC, monthly retail sales growth averaged 13.2% monthly in the first 5 months of 2006.
Exports continued to strengthen for both the NIEs and ASEAN5 in 2006Q1, contributing strongly to the region’s economic expansion (Figure 7). But ASEAN5 also saw a softening in domestic demand growth in 2006Q1. This

R E G I O N A L U P D A T E
�
restrained import growth and thus boosted net exports for the third straight quarter—contributing 4.2 percentage points (or more than two-thirds) of total GDP growth in 2006Q1. In contrast, rebounding domestic demand in the NIEs accelerated import growth, eroding the contribution of net exports to 1.9 percentage points (or about one-third) of total GDP growth in 2006Q1. Trade data show that these trends—rising net exports in ASEAN5 and falling net exports in the NIEs—continued through the first half of 2006. The trade surplus in the PRC grew by 39% in US dollar terms in 2006Q1, indicating that net exports provided strong support to economic expansion. The PRC trade surplus grew at an even higher 63% in April–June 2006 over the same period last year, meaning the contribution of net exports to GDP growth was probably significant in 2006Q2 as well.
Inflation
The sustained global increase in oil and other commodity prices—accelerating in 2005 and into the first half of 2006—continued to build inflationary pressures throughout the region. The extent to which these pressures fed inflation varied across economies with the region’s average inflation rate at 3.0% for the first 5 months of 2006, about the same rate as in 2005. This was mainly because inflation temporarily eased in the early months of 2006 but then began to trend higher. In the PRC and NIEs, inflation remained relatively subdued but inched up in recent months. In many ASEAN economies, it was either trending up strongly or remained at elevated levels. In several economies, such as Malaysia and Thailand, higher inflation accompanied higher economic growth in the first half of 2006. In others, such as the Philippines and Viet Nam, inflation fell in early 2006 from previous peaks, but remained high despite the gradual recovery in agriculture, particularly food production, since the poor harvests in 2004–05. After dipping early in the year, inflation inched up in PRC; Hong Kong, China; Korea; and Taipei,China; but stayed below 3.0% (Figure 8A). The gradual decline of Korea’s inflation since 2004Q3 was helped by the won appreciation, which mitigated the impact of rising import prices. In the PRC, despite rapid demand growth, inflation has been contained thus far in 2006 by energy price controls, excess capacity in
Figure 6: Retail Sales Growth (y-o-y, %)
Source: CEIC.
-10
-5
0
5
10
15
20
25
30
Singapore
PRC
Hong Kong, China
Jan-05 Mar-05 May-05 Jul-05 Sep-05 Nov-05 Jan-06 Mar-06 May-06
14.2
6.7 5.9
Korea
Figure 7: External Contributions to Growth (y-o-y, %)
Source: ARIC Indicators and OREI staff calculations.
-5
0
5
10
15
20
2003Q1 2003Q3 2004Q1 2004Q3 2005Q1 2005Q3 2006Q1
ASEAN5 ExportsNIEs ExportsASEAN5 Net ExportsNIEs Net Exports
17.6
12.6
9.6
4.2
1.9
Figure 8A: Low Inflation1 Economies—Headline Rates (y-o-y, %)
1 Low inflation is defined as below 3% average inflation from Jan 2005 to most recent month where data are available.Sources: OREI staff calculations based on data from ARIC Indicators, Hong Kong Monetary Authority, and Central Bank of China (Taipei,China).
-5
-3
-1
1
3
5
7
Hong Kong, China
Singapore
Taipei,China
PRC5.3
2.6
1.4
-4.0
Korea
Jan-03 Jun-03 Nov-03 Apr-04 Sep-04 Feb-05 Jul-05 Dec-05 May-06

R E G I O N A L U P D A T E
�
manufacturing, and good harvests. In Hong Kong, China; and Taipei,China, inflation rose from previously very low levels.
Among moderate inflation economies, inflation fell from the December 2005 level in Cambodia and Viet Nam (Figure 8B). Indonesia also saw inflation easing to (a still high) 15.5% in June 2006 after surging to 17.9% in October 2005 after fuel subsidies were lowered. In Thailand, which earlier removed fuel subsidies, inflation remained high in June 2006. A 20% hike in fuel prices in Malaysia spiked headline inflation in February 2006. In the Philippines, higher fuel prices and an increase in value-added tax (VAT)—to 12%—drove inflation higher early in the year.
The extent of the pass-through effect of rising energy costs into core inflation varied across the region (Figure 9). The effects were relatively large in the Philippines—where higher fuel costs are quickly transmitted into higher utility prices—but subsequently began to appear elsewhere in the region. In Malaysia, the February 2006 fuel price hike quickly led to higher transportation costs. In Thailand, core inflation edged up to 2.7% but remained within the central bank’s target range.
Balance of Payments In the first half of 2006, a regional export rebound was underway across emerging East Asia, with growth stronger relative to late 2005. In turn, balance of payments surpluses increased, as current and capital account balances improved. Coupled with official interventions in exchange markets, this led to a build-up of foreign exchange reserves.
Aggregate regional merchandise exports grew at an average 18.0% in the first 5 months of 2006, compared with 16.3% in the last 3 months of 2005. This was anchored by a reacceleration of exports in the PRC, after a sharp decline in late 2005 (Figure 10A). For ASEAN5, a relatively broad-based, modest rebound—from an average 15.6% export growth in 2005Q4—benefited from the improved global IT demand, high commodity prices, and the 2005 quotas placed on PRC textile exports. For the NIEs, export growth rose in early 2006, propelled by stronger global IT demand and a recovery in import demand from the PRC—the NIEs’ largest export market.
Figure 8B: Moderate Inflation1 Economies— Headline Rates (y-o-y, %)
1 Moderate inflation is defined as above 3% or above average inflation from Jan 2005 to most recent month where data are available.Sources: OREI staff calculations based on data from ARIC Indicators.
0
2
4
6
8
10
12
7.5
5.9
3.9
6.7
Thailand
Malaysia
Philippines
Cambodia
Viet Nam
Jan-03 Jun-03 Nov-03 Apr-04 Sep-04 Feb-05 Jul-05 Dec-05 May-06
Figure 9: Core Inflation Rates (y-o-y,%)
Note: Official figures, except Malaysia (ex. food, fuel, utilities) and Singapore (ex. food, private transport).Sources: OREI staff calculations from Bloomberg data, Bank of Thailand, and Bangko Sentral ng Pilipinas.
Figure 10A: Merchandise Export Growth1
($ value, y-o-y, %)
13-month moving average.Sources: ARIC Indicators and CEIC.
45
40
35
30
25
20
15
10
5
0
ASEAN5
PRC
NIEs
24.021.7
15.616.4
8.811.3
25.027.8
40.5
Jan-03
May-03
Sep-03
Jan-04
May-04
Sep-04
Jan-05
May-05
Sep-05
Jan-06
May-06
-2
0
2
4
6
8
10
Jan-03 Jun-03 Nov-03 Apr-04 Sep-04 Feb-05 Jul-05 Dec-05 May-06
Philippines
Malaysia
KoreaThailand
Singapore
5.45.8
2.7
2.2
0.6

R E G I O N A L U P D A T E
�
Emerging East Asia’s merchandise imports grew by an average of 15.7% in the first 4 months of 2006, compared with 15.3% in the last 3 months of 2005. On average, PRC monthly imports grew 22.0% in the first half of 2006, about the same pace as in 2005Q4 (Figure 10B). Import trends in the NIEs, in turn, largely followed export trends, except that import growth rebounded more strongly through March 2006. Aggregate NIEs import growth fell in April and May because of a sharp drop in import growth in Hong Kong, China. In contrast, import growth in Korea and Taipei,China continued to strengthen through May 2006. For ASEAN5 economies, import growth continued to slow in early 2006 because of the negative or sharply lower import growth in Indonesia and Thailand, due to fading economic momentum. However, for Malaysia and Singapore, strong export and investment growth drove import growth higher in the first 4 months of 2006.
Although variable seasonality makes trends difficult to interpret, in the first half of 2006 the PRC and ASEAN5 economies showed generally higher trade surpluses than a year earlier, whereas trade balances in the NIEs were weaker (Figure 11). The service and transfers components have remained relatively stable, while net income moved into surplus in 2005 due to higher interest earnings on reserves. Thus, it appears likely that the current account continued to strengthen in the first half of 2006 alongside the trade balance.
The aggregate current account surplus of ASEAN5 increased relative to GDP—from 8.0% in 2005Q4 to 9.4% in 2006Q1 (Table 1A). In Singapore the increase was slight—from 30.4% of GDP in 2005Q4 to 30.8% in 2006Q1. In Malaysia, it rose from 12.9% in 2005Q4 to 15.4% in 2006Q1. During the same period, Thailand’s current account surplus widened to 3.4% of GDP, Indonesia’s to 4.1%, and the Philippines’ to 4.4%.
In the NIEs, aggregate current account balances narrowed in 2006Q1 relative to 2005Q4 (Table 1B). There was a reversal in Korea’s current account balance, from 2.5% in 2005Q4 to –0.6% in 2006Q1, as the trade surplus narrowed and the services deficit increased along with stronger domestic demand. In Hong Kong, China, the current account surplus also narrowed but remained large at 10.2% of GDP. In Taipei,China, it fell from 10.5% of GDP in 2005Q4 to 7.1% in 2006Q1.
Figure 10B: Merchandise Import Growth1
($ value, y-o-y, %)
13-month moving average.Sources: ARIC Indicators and CEIC.
0
10
20
30
40
50
60
PRC
NIEs
51.5
24.9
18.5
29.6
11.2
24.4
12.1ASEAN5
Jan-03
May-03
Sep-03
Jan-04
May-04
Sep-04
Jan-05
May-05
Sep-05
Jan-06
May-06
Figure 11: Trade Balance1 ($ billions)
13-month moving average.Sources: ARIC Indicators and CEIC.
-4
-2
0
2
4
6
8
10
12
ASEAN5
PRC
NIEs
12.7
7.7
11.2
4.97.6
3.8
8.0
0.2
3.2
Jan-03
May-03
Sep-03
Jan-04
May-04
Sep-04
Jan-05
May-05
Sep-05
Jan-06
May-06
14

R E G I O N A L U P D A T E
�
Current Account
Trade balance
Net Services
Net Income
Net Transfers
Capital Account
Financial Account
Net Direct Investment
Net Portfolio Investment
Net Other Investment
Net Errors & Omissions
Overall Balance
6.3
8.5
-1.2
-2.1
1.1
0.0
-1.1
2.2
1.0
-4.3
0.0
5.1
4.5
7.3
-1.2
-2.8
1.2
0.0
1.4
4.2
-1.4
-1.3
-1.0
4.9
7.4
10.4
-1.5
-2.9
1.4
0.0
-4.0
2.8
0.5
-7.3
-1.0
2.3
8.0
11.9
-2.3
-3.0
1.3
0.1
-8.5
1.9
-2.3
-8.1
0.1
-0.4
9.4
11.8
-1.6
-2.0
1.1
0.0
-1.4
4.0
4.5
-9.9
-0.3
7.7
2005Q1 2005Q2 2005Q3 2005Q4 2006Q1
Table 1A: Balance of Payments—ASEAN�(% of GDP)
Sources: Bank Indonesia, Bangko Sentral ng Pilipinas, International Financial Statistics Online (International Monetary Fund), and CEIC.
Current Account
Trade balance
Net Services
Net Income
Net Transfers
Capital Account
Financial Account
Net Direct Investment
Net Portfolio Investment
Net Other Investment
Net Errors & Omissions
Overall Balance
4.7
3.1
0.9
1.5
-0.7
-0.3
1.6
-0.6
-4.1
6.4
1.2
7.2
2.6
2.7
0.4
0.2
-0.7
-0.3
1.4
0.2
-3.9
5.1
-1.1
2.7
2.8
3.2
0.2
0.0
-0.7
-0.2
-2.5
-1.4
-2.4
1.3
0.9
1.0
6.0
4.3
1.6
0.8
-0.6
-0.2
-4.6
1.3
2.0
-7.9
0.8
2.1
3.0
1.5
0.9
1.3
-0.7
-0.2
-1.3
0.6
-0.8
-1.2
1.4
2.8
2005Q1 2005Q2 2005Q3 2005Q4 2006Q1
Table 1B: Balance of Payments—NIEs (% of GDP)
Sources: International Financial Statistics Online (International Monetary Fund) and CEIC.

R E G I O N A L U P D A T E
�
As trade and current account balances were strengthening overall in emerging East Asia in the first half of 2006, financial balances in 2006Q1 were generally stronger relative to 2005Q4 in ASEAN5 and the NIEs. This reflected a partial reversal in 2006Q1 of the general increase in financial outflows from the region, excluding the PRC, in the second half of last year. Fluctuations in the financial account over the last half of 2005 and the first half of 2006 were grounded in changing trends in portfolio and other investment flows. Rising short-term US interest rates reduced the profitability of carry trades and raised expectations that US long-term interest rates would also rise. This reduced inflows into the region in 2005Q3–Q4. Yet, by early 2006, the increase in US long-term rates failed to materialize. Thus, the search for yield brought financial flows back to the region’s asset markets, sharply reducing financial account deficits. These trends translated into larger balance of payments surpluses in the region, especially in ASEAN5 and the PRC (Table 2). After accumulating $207 billion in official foreign reserves in 2005, the PRC absorbed another $56 billion through March 2006. Reserve accumulation elsewhere in the region—that had slowed in 2005—also accelerated slightly in response to the strong inflows. These trends continued until mid-May 2006, when the region—together with other emerging markets—underwent a financial market correction.
Table 2: Foreign Exchange Reserves (excluding gold)
-4.1
1.0
33.7
0.57
-5.6
5.7
1.3
5.7
14.7
21.4
3.2
6.4
4.2
25.8
16.9
0.5
0.9
614.5
123.5
35.0
199.0
0.2
66.4
0.7
13.1
112.2
241.7
48.7
7.0
1,463.5
0.5
1.0
821.5
124.2
33.0
210.3
0.2
70.2
0.8
15.9
115.8
257.3
50.7
9.1
1,710.2
. . .
1.0
877.6
125.9
38.2
217.3
0.2
73.4
. . .
17.8
121.4
257.1
53.7
. . .
. . .
Country/Region
Brunei Darussalam
Cambodia
PRC
Hong Kong, China
Indonesia
Korea, Rep. Of
Lao PDR
Malaysia
Myanmar
Philippines
Singapore
Taipei,China
Thailand
Viet Nam
Emerging East Asia
4.9
15.7
50.6
4.4
0.0
28.2
7.0
49.1
22.2
-3.9
17.2
17.0
18.5
13.1
29.9
. . .
. . .
. . .
126.5
38.1
224.3
. . .
78.5
. . .
18.2
128.7
260.4
56.4
. . .
. . .
Dec 04 Dec 05 Dec 05 Mar 06 Jun 06Dec 04
(% change, y-o-y) Value ($ billions)
. . . = not availableSources: International Financial Statistics Online (International Monetary Fund) and Institute of International Finance.

R E G I O N A L U P D A T E
10
Financial and Exchange Markets
Regional financial markets were volatile in the first half of 2006, with asset prices and exchange rates rising through mid-May, only to suffer a sharp correction from mid-May through mid-June. Before the downturn, stock market gains on the year ranged from 5.9% in Korea to 34.2% in the PRC (Figures 12A, 12B). But after United States (US) core inflation began to climb more than expected and the US Federal Reserve seemed to lean toward further upward rate adjustments, global investors suddenly adjusted their risk appetite. The correction affected all stock markets in the region except the PRC, where financial regulatory reforms triggered a burst of enthusiasm in May 2006. Some markets were affected more than others. Overall, through June 2006, Korean equities lost 10.0% after the large gains in 2005, while Thailand’s market lost 7.4%. In contrast, stock markets in Hong Kong, China; Indonesia; and PRC registered gains in the first half of this year—ranging from 4.8% to 37.6%. Other stock markets were about even on the year.
The adjustment seemed generally more severe in equity markets as local investors moved into local fixed-income assets. In Thailand, for example, the yield curve—which shifted up from June 2005 to April 2006 as policy rates moved up in tandem with US rates—did not change significantly from late April to mid-June 2006 (Figure 13A). This was mimicked in several markets, such as Korea, although rate hikes were less than those in Thailand. Moreover, in some cases, such as in Taipei,China; long-term rates increased slightly in June 2006, whereas in others (such as Singapore) they fell.
The trend in the Philippines was different. The yield curve shifted markedly downward from June 2005 through April 2006 as spreads compressed across maturities (Figure 13B). Global trends were one cause, but so was reduced political uncertainty and improved fiscal performance. The trend, however, sharply reversed by mid-June 2006 and the curve shifted upward as risk aversion increased. In the PRC, bonds enjoyed the same strong demand as stocks as long-term rates fell even while short-term rates rose—the result of monetary tightening. Thus, the yield curve flattened appreciably.
Figure 12B: Composite Stock Price Indexes1 —ASEAN� (weekly average, first week of Jan 2004 = 100, local index)
1Weekly averages of JCI (Indonesia), KLCI (Malaysia), TWSE (Taipei,China), SET (Thailand). Source: OREI staff calculations from Bloomberg data.
Figure 12A: Composite Stock Price Indexes1 —NIEs and PRC(weekly average, first week of Jan 2004 = 100, local index)
1Weekly averages of Hang Seng (HK, China), PCOMP (Philippines), KOSPI (Korea), STI (Singapore). The PRC index is based on the Shanghai and Shenzhen composite, weighted by market capitalization.Source: OREI staff calculations from Bloomberg data.
Hong Kong, China
Korea
PRC
170 158
119
112 113
77
130
117
Jan-04
May-04
Sep-04
Jan-05
May-05
Sep-05
Jan-06
May-06
Taipei,China
180
160
140
120
100
80
60
Philippines
Malaysia
Thailand
Singapore
Indonesia
181
167
144 145
133 133
114 113
9386
Jan-04
May-04
Sep-04
Jan-05
May-05
Sep-05
Jan-06
May-06
220
200
180
160
140
120
100
80
60
R E G I O N A L U P D A T E
11
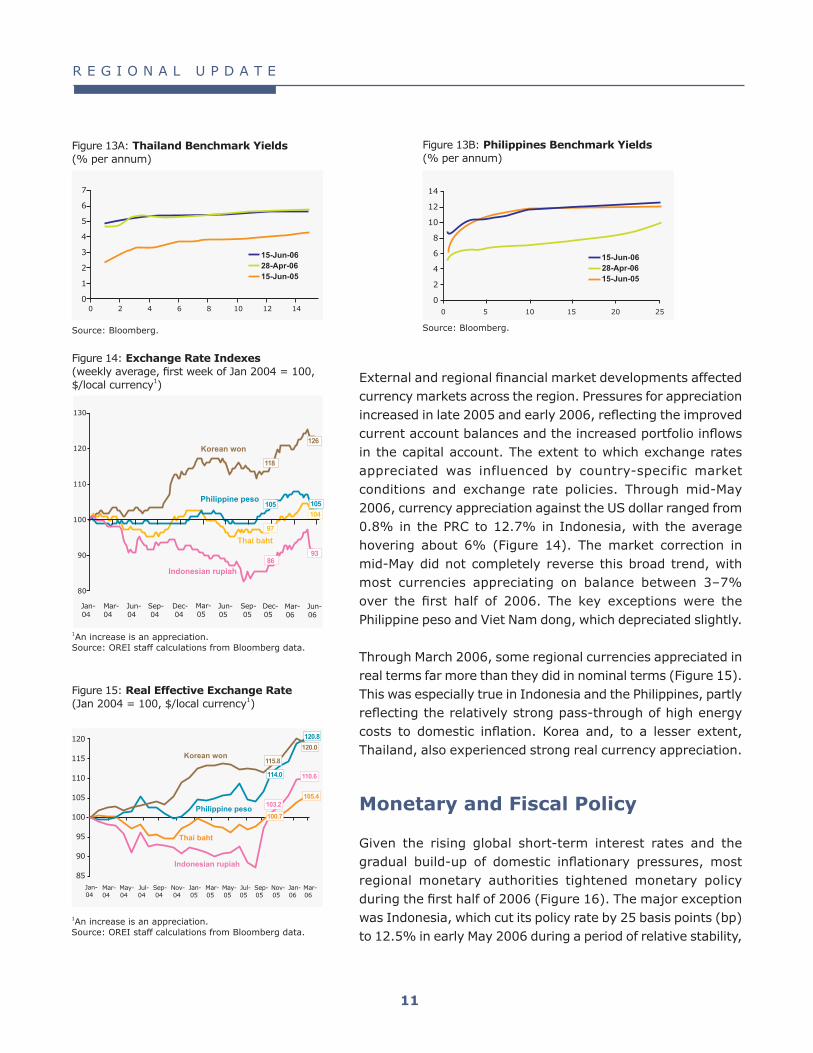
External and regional financial market developments affected currency markets across the region. Pressures for appreciation increased in late 2005 and early 2006, reflecting the improved current account balances and the increased portfolio inflows in the capital account. The extent to which exchange rates appreciated was influenced by country-specific market conditions and exchange rate policies. Through mid-May 2006, currency appreciation against the US dollar ranged from 0.8% in the PRC to 12.7% in Indonesia, with the average hovering about 6% (Figure 14). The market correction in mid-May did not completely reverse this broad trend, with most currencies appreciating on balance between 3–7% over the first half of 2006. The key exceptions were the Philippine peso and Viet Nam dong, which depreciated slightly.
Through March 2006, some regional currencies appreciated in real terms far more than they did in nominal terms (Figure 15). This was especially true in Indonesia and the Philippines, partly reflecting the relatively strong pass-through of high energy costs to domestic inflation. Korea and, to a lesser extent, Thailand, also experienced strong real currency appreciation.
Monetary and Fiscal Policy Given the rising global short-term interest rates and the gradual build-up of domestic inflationary pressures, most regional monetary authorities tightened monetary policy during the first half of 2006 (Figure 16). The major exception was Indonesia, which cut its policy rate by 25 basis points (bp) to 12.5% in early May 2006 during a period of relative stability,
Figure 14: Exchange Rate Indexes(weekly average, first week of Jan 2004 = 100, $/local currency1)
1An increase is an appreciation.Source: OREI staff calculations from Bloomberg data.
Philippine peso
Korean won
Thai baht
130
120
110
100
90
80
Indonesian rupiah
126
118
105105104
97
9386
Jan-04
Mar-04
Jun-04
Sep-04
Dec-04
Mar-05
Jun-05
Sep-05
Dec-05
Mar-06
Jun-06
Figure 13A: Thailand Benchmark Yields (% per annum)
Source: Bloomberg.
7
6
5
4
3
2
1
00 2 4 6 8 10 12 14
15-Jun-0628-Apr-0615-Jun-05
Figure 13B: Philippines Benchmark Yields (% per annum)
Source: Bloomberg.
14
12
10
8
6
4
2
00 5 10 15 20 25
15-Jun-0628-Apr-0615-Jun-05
Figure 15: Real Effective Exchange Rate(Jan 2004 = 100, $/local currency1)
1An increase is an appreciation.Source: OREI staff calculations from Bloomberg data.
120
115
110
105
100
95
90
85
Philippine peso
Korean won
Thai baht
Indonesian rupiah
120.0
115.8
120.8
114.0 110.6
103.2105.4
100.7
Jan-04
Mar-04
Jul-04
Sep-04
Jan-05
Mar-05
Jul-05
Sep-05
Mar-06
May-04
Nov-04
May-05
Nov-05
Jan-06

R E G I O N A L U P D A T E
12
after hiking the policy rate by more than 500 bp in 2005 in response to third quarter financial market turbulence. It then made a second cut to 12.25% in early July, when markets had stabilized in the wake of the correction. Another exception was the Philippines, which held rates steady through June 2006, as they were well above US rates. In contrast, Hong Kong, China and Thailand basically matched US rate hikes. Other economies made fewer upward adjustments. The PRC raised its policy rate (1-year working capital rate) by 27 bp in late April 2006 and followed it by raising reserve requirements for banks.
Through mid-May 2006, currency appreciation partially mitigated the pressure to tighten monetary policy rates arising from imported inflation. Still, despite currency appreciation and tighter policy rates, growth in liquidity accelerated in several countries through April 2006, especially PRC; Hong Kong, China; and Thailand (Figure 17). In contrast, liquidity growth was more modest or slowed in Korea and Malaysia. In some cases, the effects of higher policy rates on liquidity conditions were partially offset by imperfectly sterilized exchange market interventions.
Against a backdrop of generally strong economic expansion, gradually rising inflation, and tightening monetary policies, authorities left fiscal policies generally unchanged in 2006, although some continued to cut deficits. The main exceptions were the modest programmed increases in the deficit in PRC; Taipei,China; and Viet Nam. In contrast, Malaysia and the Philippines aimed to further reduce fiscal deficits in 2006, while in Indonesia; Hong Kong, China; and Thailand; for example, there were no major changes in fiscal policy stances (Table 3).
Generally, the trend of withdrawing fiscal stimulus and strengthening public finances—begun in 2002—is expected to continue this year. Although central government debt continues to rise in Korea, it remains relatively low, as it does also in Thailand (Table 4). Though still high in Indonesia, central government debt has fallen sharply over the past several years. In the Philippines, after rising over 2000–04, central government debt fell in 2005, aided by a narrowing fiscal deficit. Debt remains somewhat high in Malaysia as well, but most of it is denominated in ringgit. Overall, fiscal consolidation in the region has been rewarded with better financing
Figure 16: Policy Rates1 (% per annum)
1Hong Kong, China: Discount Base; Malaysia: Overnight Policy Rate; Philippines: Reverse Repo Rate;Thailand: 14-day Repo Rate; Korea: Overnight Call Rate; Taipei,China: Official Discount Rate.Sources: Bloomberg and CEIC.
Philippines
KoreaThailand
Indonesia
Hong Kong, China
Malaysia
12.2512.75
7.50
6.75
5.755.00
4.00
3.75
4.25
3.00
3.50
2.25 2.50
14
12
10
8
6
4
2
0
01-Jun-04 01-Nov-04 01-Apr-05 01-Sep-05 01-Feb-06 01-Jul-06
Taipei,China
Figure 17: Liquidity Growth1 (y-o-y, %)
1Liquidity = M2.Sources: ARIC Indicators and Bloomberg.
0
5
10
15
20
25
30
35
Philippines
Malaysia
Korea
Thailand
PRC
Jan- Apr- Jul- Oct- Jan- Apr- Jul- Oct- Jan- Apr- Jul- Oct- Jan- Apr-03 03 03 03 04 04 04 04 05 05 05 05 06 06
18.9
16.1
9.2
6.8

R E G I O N A L U P D A T E
13
conditions, low sovereign—and hence corporate—spreads and improved investor confidence. Moreover, fiscal positions—in terms of both revenues and debt levels—are becoming healthier. Externally held debt, in particular, is low and maturity profiles are stronger than just a few years ago.
Table 4: Gross Central Government Debt (% of GDP)
2000
2001
2002
2003
2004
2005
Indonesia
97.9
84.5
72.3
65.4
61.3
52.7
Korea
17.4
18.2
18.5
21.9
25.2
29.6
Malaysia
36.6
43.6
45.6
47.8
48.1
46.2
Philippines
64.6
65.7
71.0
77.7
78.5
71.8
Thailand
23.5
24.8
31.0
27.5
27.8
26.1
Source: ARIC Indicators.
Table 3: Fiscal Balance of Central Government (% of GDP)
1 Fiscal year.2 Excludes investment income and interest income.Sources: Asian Development Outlook 2006 (Asian Development Bank), official sources, and OREI staff calculations.
PRC
Hong Kong, China
Indonesia
Malaysia
Philippines
Singapore
Taipei,China
Thailand
Viet Nam
2003
-2.2
-3.3
-1.7
-5.3
-4.7
-1.1
-3.0
0.6
-4.3
2004
-1.3
-0.3
-1.1
-4.3
-3.9
-0.1
-2.1
0.3
-2.0
2005
-1.2
0.3
-0.5
-3.8
-2.7
0.2
-1.8
0.2
-2.3
2006
-1.4
0.4
-0.7
-3.5
-2.1
-1.4
-2.5
0.5
-3.0
1, 2
1
1

R E G I O N A L U P D A T E
1�
In the twelve months to June 2006, financial vulnerability in emerging East Asian economies generally declined, suggesting an improved resilience to financial shocks across the region. After the 1997–98 Asian financial crisis, the financial sectors in emerging East Asian economies recovered steadily as a result of structural changes and workouts initiated by the banking and corporate sectors, and a major policy thrust toward strengthening regulatory frameworks. Banks across the region have improved their financial positions, with nonperforming loan (NPL) ratios falling, bank profitability improving, and capital adequacy ratios (CARs) exceeding the 8% international norm since 2000 across the region. Reforms in banking sectors also included upgrading of the regulatory environment with heightened supervision of banks and nonbank financial institutions. Raising competition in the financial sector, strengthening corporate governance, and developing local capital markets and equity financing were also part of the policy mix. At the same time, corporations helped increase economic efficiency and improve debt-servicing capabilities by introducing effective cost-cutting measures and major restructuring plans.
Nonperforming Loans
NPLs have steadily declined as a percentage of total commercial bank loans in five of the nine emerging East Asian economies where latest data are available (Figure 18). For these economies, NPL ratios are now below 10%. The PRC recorded the largest decline in NPLs since December 2005—from 8.9% to 8.3% in March 2006—while Malaysia’s NPL ratio remained at 5.6% in May 2006. However, the ratio increased in Indonesia—from 8.3% in December 2005 to 9.2% in April 2006—due to rising interest rates that induced increased credit risks. In Korea; Hong Kong, China; and Taipei,China, the NPL ratio remained well below 3%.
In general, the continued decline in NPL ratios across the region was primarily due to workouts of distressed loans. These included transfers to public or private bank-owned asset management companies (AMC) for resolution, along
Assessment of Financial Vulnerability
Figure 18: NPLs1 of Commercial Banks (% of total commercial bank loans)
1Data on NPLs exclude those transferred to AMCs. NPLs are on a 3-month accrual basis in Malaysia, and 3-months or more in Korea and Thailand.2Banking sector NPLs.3 Local commercial bank NPLs as % of nonbank loans.Sources: ARIC Indicators, Monetary Authority of Singapore, China Banking Regulatory Commission, Hong Kong Monetary Authority, Central Bank of China (Taipei,China), and CEIC.
0 2 4 6 8 10 12 14
latest availableDec-05Dec-04
Taipei,China
Hong Kong, China
Thailand
Singapore
Philippines
Malaysia
Korea
Indonesia
PRC 8.3 Mar 06
9.2 Apr 06
1.0 Mar 06
5.6 May 06
8.2 Apr 06
3.8 Mar 06
8.1 May 061.4
2.5 May 06
2
2
3

R E G I O N A L U P D A T E
1�
with improved risk management, which helped reduce new NPLs from more recent lending. The workout process has largely been completed in Malaysia and Thailand, while in the PRC, where the decline in NPL ratio was largely due to public recapitalization programs and the transfer of NPLs to AMCs, 15 transactions amounting to $11.4 billion were announced between September 2005 and February 2006. Although several more transfers are expected to be completed over the rest of 2006, a risk remains that NPLs in the PRC may start rising again partly due to an increasing exposure of banks to real estate, combined with a persistent lack of clear guidelines for lending and still poor credit assessment capacity of domestic banks.
In the Philippines, the Special Purpose Vehicle law was extended for 18 months in April 2006, and the Philippine central bank (Bangko Sentral ng Pilipinas) expects this to reduce the NPL ratio below 7% by the end of the year. In Thailand, the Bank of Thailand (BOT) hopes to reduce the NPL ratio to 5% by the end of 2006 and to 2% by the end of 2007. To achieve this ambitious target, the BOT mandated the Bangkok Commercial Asset Management Company as key bidder for domestic problem loans—following its merger with the Thai Asset Management Corporation. In Taipei,China, the NPL ratio has remained low, as government regulations make it difficult for banks with high NPL ratios to apply for new business licenses or set up new branches. An increase in the size of outstanding bank loans was partly responsible for the decline in NPL ratios for most of emerging East Asia, with the exception of the Philippines, where total loans outstanding fell.
Capital Adequacy Ratios and Bank Profitability
The average CARs of emerging East Asian commercial banks are well above the 8% international norm (Figure 19). Malaysia‘s CAR declined from 13.5% in December 2005 to 12.6% in May 2006, as bank credit expanded and authorities continued to implement tighter prudential regulations. Slight increases, however, occurred in the CARs in Korea and Thailand. While CARs usually increase as economic fundamentals improve, prudential regulation is tightened, risk management improves, and bank profits increase, high CARs in Indonesia and the Philippines can be
Figure 19: Capital Adequacy Ratios of Commercial Banks (%)
1Refers to CAR of banking system.Sources: ARIC Indicators, Monetary Authority of Singapore, Hong Kong Monetary Authority, Central Bank of China (Taipei,China), and CEIC.
0 2 4 6 8 10 12 14 16 18 20 22 24
Thailand
Taipei,China
Singapore
Philippines
Malaysia
Korea
Indonesia
Hong Kong, China
latest availableDec-05Dec-04
15.0 Mar 06
21.5 Apr 06
12.8 Mar 06
12.6 May 06
17.7 Sep 05
15.4 Mar 0610.3
14.3 Apr 06
1

R E G I O N A L U P D A T E
1�
mainly attributed to a lack of profitable lending opportunities. In these countries, in fact, as interest rates rise, banks usually prefer holding low-risk government securities, which increases the risk of portfolio losses from falling bond prices. In Indonesia, in particular, where credit growth remained low, the average CAR increased substantially to 21.5% in April 2006, partly due to a decline in commercial bank assets.
During the 12 months through December 2005, banking sector profitability among emerging East Asian economies either improved or remained stable, with the exceptions of Indonesia and Taipei,China (Table 5). In the Philippines, return on assets (ROA) increased from 1.0% in December 2004 to 1.1% in December 2005, as banks profited from improvement in loan quality and an expansion in investments. In Singapore and Thailand, the ROA remained at 1.2% and 1.3%, respectively, at the end of 2005. In contrast to these trends, the ROA of the Indonesian banking sector declined to 2.6% in December 2005, partly due to narrowing interest margins—reflecting a rise in deposit rates—and the introduction of tighter classification standards for loans. The ROA also marginally declined in Taipei,China, approaching the level of a zero return, mainly due to substantial write-offs of nonperforming cash and credit card loans, totaling $2.2 billion. As a result, banks in Taipei,China are now more conservative in new lending and have become very aggressive
Table 5: Banking Sector Profitability1 (%)
1Rate of return on assets for all commercial banks (Indonesia, Korea, Philippines, and Thailand); banking system (Malaysia); domestic banks (Singapore and Taipei,China); and retail banks (Hong Kong, China). 2As of April 2006 for Indonesia and March 2006 for the Philippines and Singapore. Sources: Hong Kong Monetary Authority, Bank Indonesia, Financial Supervisory Service (Republic of Korea), Bank Negara Malaysia, Bangko Sentral ng Pilipinas (Philippines), Monetary Authority of Singapore, Central Bank of China (Taipei,China), and Bank of Thailand.
Hong Kong, China
Indonesia
Korea
Malaysia
Philippines
Singapore
Taipei,China
Thailand
2002
1.4
1.9
0.6
1.3
0.8
0.8
-0.5
0.3
2003
1.4
2.5
0.1
1.3
1.2
1.1
0.2
0.7
2004
1.6
3.5
0.9
1.4
1.0
1.2
0.6
1.3
2005
1.7
2.6
1.0
1.4
1.1
1.2
0.3
1.3
2006
n.a.
2.6
n.a.
n.a.
1.2
1.2
n.a.
n.a.
2
R E G I O N A L U P D A T E
1�
in managing NPLs. Latest available data suggest that in 2006Q1 the average ROA of commercial banks remained about the same as 2005 in Indonesia, Philippines, and Singapore.
Bank Lending
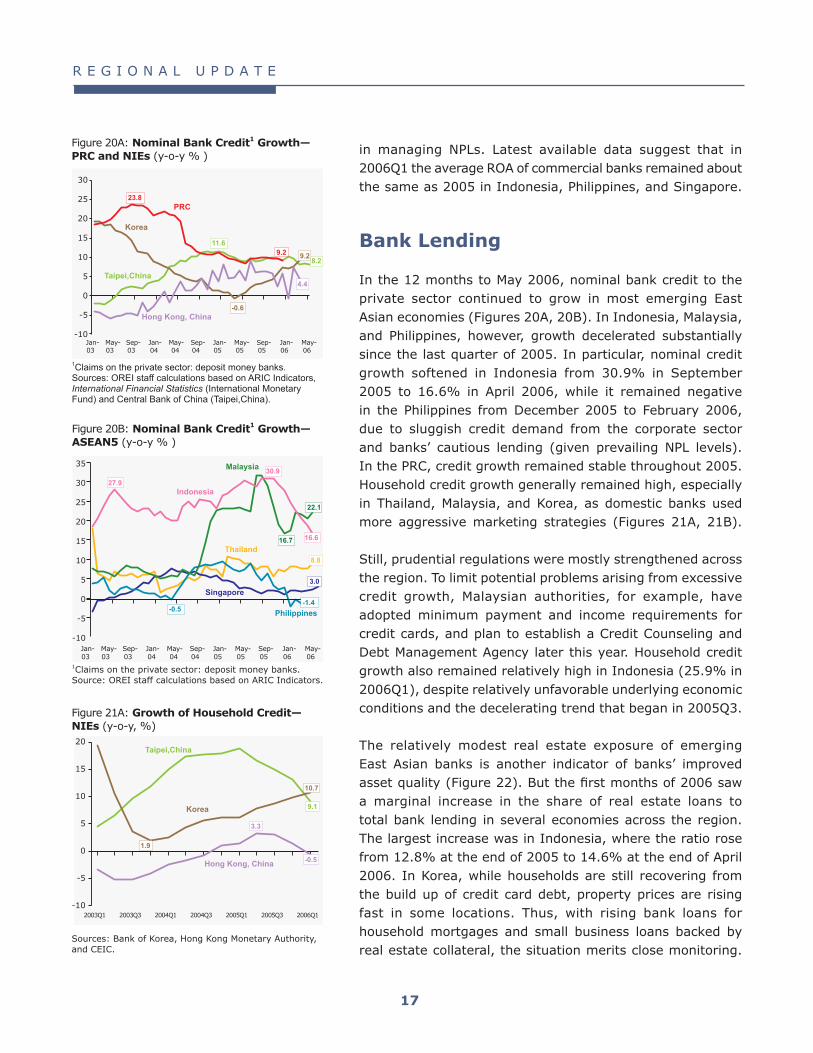
In the 12 months to May 2006, nominal bank credit to the private sector continued to grow in most emerging East Asian economies (Figures 20A, 20B). In Indonesia, Malaysia, and Philippines, however, growth decelerated substantially since the last quarter of 2005. In particular, nominal credit growth softened in Indonesia from 30.9% in September 2005 to 16.6% in April 2006, while it remained negative in the Philippines from December 2005 to February 2006, due to sluggish credit demand from the corporate sector and banks’ cautious lending (given prevailing NPL levels). In the PRC, credit growth remained stable throughout 2005.Household credit growth generally remained high, especially in Thailand, Malaysia, and Korea, as domestic banks used more aggressive marketing strategies (Figures 21A, 21B).
Still, prudential regulations were mostly strengthened across the region. To limit potential problems arising from excessive credit growth, Malaysian authorities, for example, have adopted minimum payment and income requirements for credit cards, and plan to establish a Credit Counseling and Debt Management Agency later this year. Household credit growth also remained relatively high in Indonesia (25.9% in 2006Q1), despite relatively unfavorable underlying economic conditions and the decelerating trend that began in 2005Q3.
The relatively modest real estate exposure of emerging East Asian banks is another indicator of banks’ improved asset quality (Figure 22). But the first months of 2006 saw a marginal increase in the share of real estate loans to total bank lending in several economies across the region. The largest increase was in Indonesia, where the ratio rose from 12.8% at the end of 2005 to 14.6% at the end of April 2006. In Korea, while households are still recovering from the build up of credit card debt, property prices are rising fast in some locations. Thus, with rising bank loans for household mortgages and small business loans backed by real estate collateral, the situation merits close monitoring.
Figure 20A: Nominal Bank Credit1 Growth—PRC and NIEs (y-o-y % )
1Claims on the private sector: deposit money banks.Sources: OREI staff calculations based on ARIC Indicators, International Financial Statistics (International Monetary Fund) and Central Bank of China (Taipei,China).
-10
-5
0
5
10
15
20
25
30
Hong Kong, China
Taipei,China
PRC
Korea
23.8
11.6
8.29.29.2
4.4
-0.6
Jan-03
May-03
Sep-03
Jan-04
May-04
Sep-04
Jan-05
May-05
Sep-05
Jan-06
May-06
Sources: Bank of Korea, Hong Kong Monetary Authority, and CEIC.
Hong Kong, China
Taipei,China
Korea
-10
-5
0
5
10
15
20
10.7
1.9
9.1
3.3
-0.5
2006Q12005Q32005Q12004Q32004Q12003Q32003Q1
Figure 21A: Growth of Household Credit—NIEs (y-o-y, %)
1Claims on the private sector: deposit money banks.Source: OREI staff calculations based on ARIC Indicators.
Philippines
Malaysia
Thailand
Singapore
-10
-5
0
5
10
15
20
25
30
35
Indonesia
Jan-03
May-03
Sep-03
Jan-04
May-04
Sep-04
Jan-05
May-05
Sep-05
Jan-06
May-06
-1.4
3.0
8.8
22.1
16.6
30.927.9
16.7
-0.5
Figure 20B: Nominal Bank Credit1 Growth—ASEAN� (y-o-y % )

R E G I O N A L U P D A T E
1�
External Vulnerability Indicators
The ratio of total external debt to gross foreign exchange reserves has generally declined or remained stable throughout the region, although significant differences exist across economies (Table 6). As of 2006Q1, the ratio was 3.5 in Indonesia, 3.1 in Philippines, 2.1 in Singapore, 1.1 in Thailand, 0.9 in Korea, 0.7 in Malaysia, and 0.3 in PRC.
However, the ratio of short-term external debt to gross international reserves generally remained stable in all emerging East Asian economies for which data are available (Table 7). The ratios in 2006Q1 were 0.2 in the PRC and Malaysia; 0.3 in Korea and Philippines; and 0.4 in Thailand.
Available data on total debt service as a percent of total exports of goods and services show the ratio continued to decline in Malaysia and the Philippines in 2005, but increased slightly in Korea and Thailand (Table 8). Indonesia’s debt service ratio, however, increased substantially to 38.6%.
While sovereign spreads for US dollar bonds issued in Korea and the PRC remained relatively stable, spreads in the Philippines and Indonesia have been declining from 2005Q2 through April 2006, reflecting a general return of investor interest (Figure 23). Since May 2006, however, spreads began to widen again in these two countries, signaling resurgent risk aversion among investors to emerging markets. Also since May 2006, spreads have increased somewhat in Korea but declined in the PRC, suggesting the need for close monitoring of international sentiment.
Increasing long-term yields among emerging East Asian economies represents a risk to the banking sector, as higher yields reduce bond and asset valuations on balance sheet. Latest available data show that commercial banks in Indonesia, Korea, Malaysia, and Thailand have a combined $170.7 billion worth of local currency sovereign bonds on their balance sheets.
Sources: Bank Indonesia, Bank Negara Malaysia, Bangko Sentral ng Pilipinas, and Bank of Thailand.
Philippines
Malaysia
Thailand
Indonesia
0
5
10
15
20
25
30
35
40
45
2006Q12005Q32005Q12004Q32004Q12003Q32003Q1
14.3
23.9
18.8
25.9
7.3
15.5
32.5
Figure 23: Sovereign Spreads (10-year yields against US 10-year benchmark, basis points)
Source: Bloomberg.
Figure 21B: Growth of Household Credit— ASEAN� (y-o-y, %)
0 10 20 30 40
LatestDec-05Dec-04Dec-03
Thailand
Taipei,China
Philippines
Malaysia
Korea
Indonesia
Hong Kong, China 19.5 Mar 06
14.6 Apr 06
9.9 Mar 06
36.0 May 06
11.8 Mar 06
36.9 May 06
18.9 Mar 06
Sources: Bank Indonesia, Financial Supervisory Service (Korea), Bank Negara Malaysia, Bangko Sentral ng Pilipinas, Bank of Thailand, Hong Kong Monetary Authority, and CEIC.
Figure 22: Real Estate Loans—NIEs (% of total loans)
0
150
300
450
600
0
75
150
225
300
Philippines (LHS)
Indonesia (LHS)
Korea (RHS)
PRC (RHS)
Jun-03 Sep-03 Dec-03 Mar-04 Jun-04 Sep-04 Dec-04 Mar-05 Jul-05 Oct-05 Jan-06 Apr-06 Jul-06
234.5
79.5
184.7
56.7
504.9
271.0
47.5

R E G I O N A L U P D A T E
1�
Table 6: Ratio of Total External Debt to Gross Foreign Exchange Reserves
Sources: OREI staff calculations based on ARIC Indicators and data from the Joint BIS-IMF-OECD-World Bank statistics database, Institute of International Finance, and CEIC.
PRC
Hong Kong, China
Indonesia
Korea
Malaysia
Philippines
Singapore
Taipei,China
Thailand
2002
0.6
3.1
4.2
1.2
1.4
4.0
2.0
0.3
1.6
2003
0.5
3.1
3.9
1.0
1.1
4.2
1.8
0.3
1.3
2004
0.4
3.5
3.9
0.9
0.8
4.2
2.0
0.3
1.1
2005
0.3
3.6
4.0
0.9
0.7
3.4
2.0
0.3
1.0
2006Q1
0.3
3.6
3.5
0.9
0.7
3.1
2.1
n.a.
1.1
Table 7: Ratio of Short Term External Debt to Gross Foreign Exchange Reserves
PRC
Indonesia
Korea
Malaysia
Philippines
Taipei,China
Thailand
2002
0.2
0.4
0.4
0.2
0.4
0.2
0.3
2003
0.2
0.4
0.3
0.2
0.5
0.2
0.3
2004
0.2
0.5
0.3
0.2
0.4
0.3
0.3
2005
0.2
0.6
0.3
0.2
0.4
0.3
0.3
2006Q1
0.2
n.a.
0.3
0.2
0.3
n.a.
0.4
Sources: OREI staff calculations based on ARIC Indicators and data from the Joint BIS-IMF-OECD-World Bank statistics database, Institute of International Finance, and CEIC.
Table 8: Debt Service Ratio (% exports of goods and services)
Source: Asian Development Outlook 2006 (Asian Development Bank).
PRC
Indonesia
Korea
Malaysia
Philippines
Thailand
2001
8.0
36.0
14.4
6.8
15.8
20.8
2002
7.3
32.1
7.8
6.6
16.4
19.6
2003
7.5
29.8
6.5
6.2
16.9
16.0
2004
7.5
31.2
5.6
4.4
13.8
8.5
2005
n.a.
38.6
5.8
4.0
13.3
9.8

R E G I O N A L U P D A T E
20
Outlook, Risks, and Policy Issues
External Economic Environment
The evolving global economic environment facing emerging East Asia remains broadly favorable. On balance, the external economic environment is expected to support regional economies much as it did in 2005. Strong growth of external demand is a key positive element, with major export markets likely to sustain or strengthen their expansions, thus boosting external demand for the region’s exports. However, two mitigating elements increase the complexity of the external environment. First, energy prices will likely remain elevated, at least through mid-2007, leading to sustained inflationary pressures throughout the period.Second, monetary authorities in major industrial countries are expected to continue raising short-term interest rates. For export-oriented economies with generally robust external balances, strong public finances, and resilient financial sectors, these conditions tend to play to their strengths. This is especially true to the extent that rising energy prices are a consequence of a strong global economic expansion, which enhances external demand even as it adds to costs.
The outlook for external demand hinges to a large extent on prospects for the US, Europe, and Japan, which together account for about 40% of total exports from emerging East Asia, or about two-thirds of its extra-regional exports. The outlook for the remainder of 2006 and 2007 is for (i) a strong but moderating US economic expansion, (ii) an accelerating expansion in the euro area, and (iii) a strengthening of the economic recovery in Japan. Looking through a different prism, the stronger demand for global IT products should improve the export and growth prospects for several emerging economies.
The US economy is running near capacity: the labor market is tightening, core inflation is rising, and import growth is strong. Consumption bounced back in 2006Q1, pulling GDP growth to a seasonally adjusted annualized rate of 5.6% (Figure 24). Still, growth momentum is likely to ease because of the cumulative effects of higher oil prices, higher interest rates, and the lagged effects of a narrowing government deficit—
Figure 24: Contributions to Growth—US(seasonally adjusted, annualized, % change)
-2
-1
0
1
2
3
4
5
6
7
8
Personal Consumption
2006Q12005Q3 2005Q1 2004Q3 2004Q1 2003Q3 2003Q1
Private Domestic InvestmentNet Exports
Government Expenditure
Real GDP Growth
1.7
3.7
7.2
3.6
4.3
3.5 4.03.3 3.8 3.3
4.1
1.7
5.6
Source: US Bureau of Economic Analysis.

R E G I O N A L U P D A T E
21
Figure 25: US Consumer and Business Confidence Indexes
40
50
60
70
80
90
100
110
120
Consumer Confidence Index
Business Confidence Index53
60
67 66
7370
63 61 62
5550
56 57
105.7
Jan-03
May-03
Sep-03
Jan-04
May-04
Sep-04
Jan-05
May-05
Sep-05
Jan-06
May-06
Notes: 1. Consumer confidence (1985=100). 2. A business confidence index above 50 means there are more positive than negative responses. 3. Consumer confidence is monthly, business confidence is quarterly. Source: Bloomberg.
from 4.7% of GDP in 2004 to 3.8% in 2005. The June 2006 FED Beige Book Report showed signs of a cooling residential real estate market and moderating consumption growth, coinciding with indicators of easing momentum in services and a small drop in consumer confidence (Figure 25).31 Yet, the labor market is tightening—with unemployment down to a seasonally adjusted 4.6% in June 2006 from 5.0% a year earlier. And, 3-month core inflation jumped from a seasonally adjusted annualized rate of 2.0% in February to 3.8% in May. Further, there are signs of stronger activity in the corporate sector, commercial real estate, and energy markets. These trends point to the possibility of stronger investment, as does an increase in factory orders for business equipment in May and the upturn in business confidence. Higher import growth and a wider trade deficit would likely accompany a shift from consumption-led to more investment-led growth in 2006. Overall, the economy is expected to move toward its 3.0–3.3% potential rate of growth in 2006 and 2007.
At an earlier point in its business cycle, the euro area is undergoing a surge in economic momentum: unemployment is falling, inflation is rising, and import growth is accelerating. Stronger consumption, in particular, led GDP growth higher in 2006Q1 (Figure 26). There is an improvement in consumer confidence and a marked surge in business sentiment (Figure 27). The June business climate indicator was at its highest level since 2000 in the euro area. In Germany, which accounts for a third of the euro area economy, business confidence in June reached its highest level since 1991. Supported by still accommodative monetary conditions, growth in domestic demand is gathering momentum, despite the drag of higher oil prices and slightly tighter fiscal policies. Unemployment in the euro area fell to 7.9% in May 2006 compared with 8.8% a year earlier. Moreover, inflation crept up to 2.5% in May and June from 2.2% in March, and has remained above the European Central Bank (ECB) target for more than a year. However, excluding energy, inflation was 1.5% for May 2006. With rising domestic demand, import growth should rise, a favorable trend for trade-dependent emerging East Asia. Euro area GDP growth is forecast to strengthen to about 2.0% rate over 2006–07.
3The Institute for Supply Management’s index of non-manufacturing business activity slipped from 60.1 in May 2006 to 57.0 in June, though remaining above 50, which indicates a slowing but sustained expansion of activity in the services sector. The manufacturing index dipped from 54.4 to 53.8 from May to June.
Figure 26: Contributions to Growth—euro area (seasonally adjusted, annualized, % change)
Real GDP Growth
-3
-2
-1
0
1
2
3
4
5
2006Q12005Q3 2005Q1 2004Q3 2004Q1 2003Q3 2003Q1
Private Consumption
InvestmentNet Exports
Government Consumption
0.6
-0.3
2.01.8
3.1
1.7
1.00.5
1.41.6
2.6
1.2
2.4
%
Source: Eurostat.
Figure 27: Euro Area Consumer Confidence and Business Climate Indicators
Source: Bloomberg.
-2.0
-1.5
-1.0
-0.5
0.0
0.5
1.0
1.5
May-06
Jan-06
Sep-05
May-05
Jan-05
Sep-04
May-04
Jan-04
Sep-03
May-03
Jan-03
Sep- 02
May-02
Jan-02
-25
-20
-15
-10
-5
0
5
10
15
20
25
Business ClimateIndicator
Consumer ConfidenceIndicator
2.0Business Consumer
1.4
-9.0

R E G I O N A L U P D A T E
22
As with the euro area, the Japanese economic recovery is strengthening, the labor market is tightening, and deflation is fading. The economic recovery was sustained in 2006Q1 by a stronger contribution from domestic demand (Figure 28). And with sustained external demand, rising income and profits, and accommodative monetary conditions, confidence is rising and business conditions are improving (Figure 29). The latest Tankan Survey indicates that corporations are boosting planned capital spending. With strong above-trend growth, the unemployment rate fell to 4.0% in May 2006 from 4.4% a year earlier. At the same time, inflation is crawling more firmly into positive territory, with the headline consumer price index rising 0.6% in June 2006, up from 0.3% in May. However, excluding fresh food, inflation was at 0.3%, led by fuel price increases. With improving domestic demand, import growth is strong (23% in April), although this is in part a consequence of higher import prices. In its fourth year of recovery, the economy is expected to grow by 2.9% in 2006, before settling to a more sustainable pace of 2.4% in 2007.
The favorable growth outlook for the US, euro area, and Japan is complemented by a stronger global IT industry (Figure 30). Increased IT demand has already helped export and overall GDP growth in the region in the first half of 2006. With the general deepening and broadening of economic expansions in developed markets, trade prospects globally are broadly favorable. The World Trade Organization (WTO) forecasts that world trade volume for goods will expand by 7% in 2006 compared with 6% in 2005.
Against these positive prospects for export markets, there are two mitigating elements of the external environment—elevated energy prices and tightening global monetary conditions. After rising rapidly in 2002–05, energy prices continued to climb in 2006. Through June, they rose a further 18%, while metals prices climbed 34% (Figure 31). With robust global demand continuing to press against tight supply, concerns about supply stability will likely keep oil prices both high—around $70/bbl—and volatile over 2006–07 (Box 1). This trend has not yet severely disrupted regional economies or strained their external finances. Yet, several economies must deal with rising inflation rates. Moreover, the region is generally vulnerable to higher energy costs because of its poor energy efficiency.
Figure 28: Contributions to Growth—Japan(seasonally adjusted, annualized, % change)
Real GDP Growth
Private Consumption
InvestmentNet Exports
Government Consumption
-4
-2
0
2
4
6
8
10
2006Q12005Q3 2005Q1 2004Q3 2004Q1 2003Q3 2003Q1
-1.1
2.9
2.2
6.6
2.9
-1.0
0.8
-0.5
5.15.5
1.0
4.5
3.1
Source: Cabinet Office, Government of Japan.
Figure 29: Japan Tankan Survey—Business Conditions Indicators (Manufacturing)
-60
-40
-20
0
20
40
2006Q22005Q32004Q42004Q12003Q22002Q32001Q42001Q1
LargeEnterprises
Medium Enterprises
Small Enterprises
21
137
Source: Bloomberg.
Figure 30: New US IT Orders1 ($ billion)
16-month moving average. Source: Bloomberg.
20
22
24
26
28
30
32
34
22.5
27.5
Jan-01
Jul-01
Jan-02
Jul-02
Jan-03
Jul-03
Jan-04
Jul-04
Jan-05
Jul-05
Jan-06

R E G I O N A L U P D A T E
23
Even as the export outlook remains favorable, rising commodity prices are adding to global inflationary pressures, suggesting that global monetary conditions will continue to tighten. Policy rate hikes began earliest in the US, but most major central banks were withdrawing liquidity by early 2006. After the evenly-paced increase in the US Federal Reserve (FED) funds target rate to 5.25% on 29 June 2006, the US FED signaled that future adjustments would be determined by economic developments, but that inflation risks remain a concern. For the ECB, which raised its policy rate by 25 bp to 2.75% in early June 2006, inflation risks remain a concern, but future decisions will likely weigh these risks against the resilience of the economic recovery. Similarly, the Bank of Japan (BOJ), which ended quantitative easing while maintaining the “zero interest rate” policy in March 2006, changed the guideline for the uncollateralized call rate to 0.25% on 14 July, thus lifting the “zero interest rate” policy. For the BOJ, evaluating the market’s response to the rate hike and monitoring both economic activity and inflation trends will be important in the months ahead.
Diverging from past experience of US monetary tightening—and despite a rise in global short-term interest rates through June 2006—long-term yields have remained relatively low, resulting in a flattening of the yield curve (Figure 32). In June 2006, the yield on 10-year US Treasury bonds was at 5.14%, up about 100 bp from a year earlier, despite a 200 bp rise in short-term rates. Like the spreads between long and short maturities, corporate and sovereign risk premiums were compressed, continuing a multi-year trend.
Accompanied by low volatility in asset prices, these unusually benign financial conditions were tested from mid-May through mid-June this year by a market correction stemming from increasing concern about US inflation. Like most emerging East Asian stock markets, the US and other major equity markets saw sharp losses that erased much or all of this year’s gains (Figure 33). However, after dropping sharply since 2002, sovereign spreads rose only modestly during the correction—primarily where fundamentals were perceived as weak. To the extent that improved financial resiliency and public sector finances are the source of risk premium compression—rather than high global liquidity—low sovereign spreads and favorable financial conditions should persist over 2006–07.
Figure 31: Primary Commodity Price Indexes (1995 = 100)
1 Crude oil, natural gas, coal. 2 Copper, aluminum, iron, tin, nickel, zinc, lead, uranium. 3 Cereal, vegetable oils, meat, seafood, sugar, bananas, oranges, coffee, tea, cocoa. 4Timber, cotton, wool, rubber, hides. Source: International Monetary Fund website.
50
75
100
125
150
175
200
225
250
275
300
325
350
375
Energy1
2
4
248
368
Jun-06
Jan-06
Aug-05
Mar-05
Oct-04
May-04
Dec-03
Jul-03
Feb-03
Sep-02
Apr-02
Nov-01
Jun-01
Jan-01
All PrimaryCommodities
Metals
3Food and Beverage
Agriculture Materials
215
95
106
Figure 32: US Interest Rates and Sovereign Spreads
Sources: US Federal Reserve and JP Morgan.
0
100
200
300
400
500
600
700
800
0
1
2
3
4
5
6
7
8
Jan-02 Jul-02 Dec-02 Jul-03 Dec-03 Jul-04 Dec-04 Jul-05 Dec-05 Jul-06
10-yr US Treasury securities (LHS)
Fed Funds Target Rate (LHS)
EMBI Global ex Argentina (RHS)
5.3
200
% basis points
Figure 33: G3 Stock Market Indexes (weekly average, 1 July 2005 = 100)
1capitalization-weighted index of 50 European blue chips.Source: OREI staff calculations from Bloomberg data.
95
100
105
110
115
120
125
130
135
140
145
150
155Nikkei 225 (Japan)
Dow Jones Stoxx50 (EU)
Dow Jones (US)
134
112109
Jul-05
Sep-05
Nov-05
Jan-06
Mar-06
May-06
Jul-06
1

R E G I O N A L U P D A T E
2�
Box 1: High and Volatile Oil Prices: A Need for Improving Energy Efficiency
world GDP growth in 2002. On average, while global oil demand grew at about 1 million bbl per day (mbd) in the 1990s, it grew by 1.5 mbd between 2002 and 2005. Much of this came from rapid economic growth of the PRC and other large
emerging economies. PRC demand increased from 2 mbd in 1990 to 7 mbd in 2005. With emerging economies now accounting for a larger share of the world economy, energy demand is growing faster relative to the global economy.1
However, a l though growth in global oil consumption slowed from 4% in 2004 to 1.3% in 2005—and is expected to remain somewhat subdued at 1.5% in 20062—oil prices have continued to rise. This suggests that other factors besides energy demand are also at work in keeping energy prices high.
Part of the explanation is that the prolonged period of relatively low oil prices over 1986–2002 induced limited investment in exploration or o ther upst ream activit ies with high costs and long gestation periods. As a result, global spare capacity for crude oil production
1Emerging East Asia’s consumption of world energy more than doubled from 8.4% in 1980 to 21.2% in 2005. Energy consumption in non-Organisation for Economic Co-operation and Development (OECD) economies is expected to account for 75% of the growth in world energy consumption and, in 2015, to surpass that of OECD economies. International Energy Outlook 2006, Energy Information Administration, US Department of Energy.2 Energy Information Administration. 2006. Oil Market Report. Washington, DC, May.
Oil prices began to climb in mid-2003 after remaining below $25 per barrel (bbl)—apart from spikes—for 17 years. Prices rose by 33% in 2004, 42% in 2005, and 20% in the first half of 2006. These are historic highs in nominal terms, although about 16% below the highs of 1979–1980 in real terms (Figure B1.1). During much of this ascent, 6-month futures were priced higher than 12-month futures, suggesting that oil prices were expected to decline (Figure B1.2). However, in late 2005, near-term prices fell below longer-term prices, meaning the market expects a longer period of elevated oil prices. Since then, the differential has stayed near zero.
Rapidly growing demand, limited spare capacity, geopolitical uncertainties in oil-producing regions, supply disruptions, and increased interest from portfolio investors in global oil markets have worked in tandem to generate both high and volatile oil prices.
From the demand side, w o r l d G D P g r o w t h h istor ica l ly outpaced ene rgy consumpt i on growth (Figure B1.3). The gap was widest in the early 1990s and the late 1990s. However, growth in energy consumption accelerated with the recovery from the global slowdown in 2001, surpassing
0
10
20
30
40
50
60
70
80
Jan-71
Jan-76
Jan-81
Jan-86
Jan-91
Jan-96
Jan-01
Jun-06
68.9
54.4Real Price
Nominal price
4045505560657075
Jun-06Jan-06Sep-05May-05
Nominal price
Real Price
65.1
Figure B1.1: Brent Crude Oil Prices, January 1��1–June 200� ($/barrel)
Note: Real Brent price deflated using producer’s price index of all commodities with Dec 2001 as base year.Sources: International Financial Statistics Online (International Monetary Fund), Bloomberg, and US Bureau of Labor Statistics.
Figure B1.2: �-month Minus 12-month Futures Oil Price, NYMEX ($/bbl)
Source: Bloomberg.
01-Jan-02
-2
-1
0
1
2
3
4
5
30-Jul-02 25-Feb-03 23-Sep-03 21-Apr-04 19-Nov-04 29-Jun-05 07-Jul-06
3.9
-0.1
-1.7

R E G I O N A L U P D A T E
2�
has fallen over the last decade. For example, excess production capacity among Organization of the Petroleum Exporting Countries (OPEC) fell from about 10 mbd in 1985 to 2.8 mbd in the first four months of 2006.
Further feeding high energy prices is a refinery mismatch. On one hand, the proportion of oil reserves of the more easily-refined light sweet crude is falling. On the other, upgrading refineries for the more complex process of maximizing light petroleum products (such as gasoline and diesel) extracted from heavy sour crude oil is lagging.3 Underinvestment in upgrading refining capacity over the past 15 years has created a mismatch that further increases prices of gasoline and diesel. An indirect indication of the capacity constraint is the rapid rise in the difference in profit margins between the two refining processes, which averaged more than $10/bbl in 2005 compared with about $3/bbl during 1995–2000. If the refineries of all European members of the Organisation for Economic Co-operation and Development (OECD) were upgraded to full-conversion facilities, an additional 2 mbd of light petroleum products could be produced.4
In the short-term, both the demand and supply of energy are relatively inelastic. Yet, if oil prices remain elevated, adjustments will occur over time—as happened after the
3Heavy sour crude oil has a higher wax and sulfur content than light sweet crude oil.4Energy Information Administration. op cit.
two oil price shocks in the 1970s. Consumers learn ways to conserve energy, or use it more efficiently, while supply increases as investments in oil exploration, refining capacity, and transport infrastructure become more profitable.5
Still, in the near term, limited or declining spare capacity is a major factor that would keep oil prices high. Currently, the market is also particularly sensitive to political disturbances and geopolitical risks in oil-producing regions, as well as other temporary disturbances to supply, such as hurricanes Katrina and Rita in late 2005, which damaged major production and refining facilities in the US.
Moreover, because of rising energy prices portfolio funds have leapt into global energy markets (especially
given the low yields of more traditional financial assets). Institutional investors have increased the share of their investments in oil—the so-called paper barrel.6 And, as with other tradable assets, speculative factors drive short-term oil price movements, adding to price volatility.
Most of the economies in emerging East Asia are net importers of energy and relatively energy inefficient (in part because of large manufacturing bases). With economies potentially vulnerable to energy supply shocks, the region’s policymakers are focusing increasingly on
energy policies. On the supply side, beyond stockpiling of strategic reserves, stable and transparent investment regimes are needed, conducive to private sector involvement in high-risk exploration and development of new energy sources, especially renewable energy. On the demand side, greater energy efficiency is required—using market prices as incentives to avoid waste.
5There are reports that the world’s largest oil company, Saudi Aramco, recently launched its biggest expansion program in many years (in Saudi Arabia). The PRC is also examining more closely domestic oil exploration and building refining capacity to meet its growing oil demand.6In April 2006, the first exchange-traded fund allowing US investors to put money directly on the price of crude, the US Oil Fund, was launched on the American Stock Exchange.
Figure B1.3: World GDP Growth vs. Energy Consumption Growth (%)
Note: Growth rate of 2005 GDP is ADB estimate.Sources: Statistical Review of World Energy 2006, BP, and World Development Indicators (World Bank).
5.0
4.5
4.0
3.5
3.0
2.5
2.0
1.5
1.0
0.5
0.0
World GDP
EnergyConsumption
4.5
2.4
3.4
1985 1987 1989 1991 1993 1995 1997 1999 2001 2003 2005

R E G I O N A L U P D A T E
2�
In 2005, despite slowing external demand, rising global interest rates, and sharply higher energy costs, emerging East Asian economies maintained a strong average GDP growth rate of 7.2% (Table 9). Through the first half of 2006, the region continued to adjust admirably to higher energy costs, persistent inflationary pressures, tighter monetary conditions, and increased financial volatility. Moreover, there was a revival of external demand during the first half of 2006 and several economies exhibit strengthening domestic demand. These factors should help emerging East Asia to maintain strong GDP growth. For the third consecutive year, emerging East Asia is thus forecast to post an average GDP growth of over 7% in 2006 before slowing marginally in 2007. The outlook for the PRC economy is key to the region’s strong growth prospects. PRC economic growth should rise further from its rapid 9.9% expansion in 2005 to 10.1% in 2006 before easing to 9.0% in 2007. This projection is based on expectations that policy tightening will begin to show its effects during the second half of 2006. This would alleviate pressures on the economy from overheating in sectors such as construction and real estate. At the same time, PRC imports should rebound somewhat from the exceptionally low growth in 2005, which was caused, in part, by delayed commodity imports as producers drew down inventories in an effort to avoid rising costs of imported materials. Stronger PRC imports will provide sustained support to the rest of the region, particularly the NIEs. Sustained demand from the PRC, the global rebound in IT, and stronger domestic demand should propel overall economic growth higher among NIEs—from 4.5% in 2005 to 5.1% in 2006, before slowing somewhat in 2007. In Hong Kong, China, growth should slow from the very rapid 2004–05 pace, but remain elevated as a result of close economic ties with the PRC. ASEAN economies are expected to maintain a steady GDP growth of 5.5% in 2006, reflecting the stable external outlook, with slight variations up or down across economies. Despite slowing external demand, growth of the ASEAN economies should edge up in 2007 based on country-specific factors such as the recovery from the August 2005 mini-crisis in Indonesia, strong remittance growth in the
Regional Economic Outlook for 2006–2007

R E G I O N A L U P D A T E
2�
Table 9: Annual GDP Growth Rates (%)
1 Aggregates are weighted according to gross national income levels (atlas method, current US dollars) from World Development Indicators (World Bank).2 Excludes Brunei Darussalam and Myanmar for all years as weights are unavailable.3 For Indonesia, GDP growth rates from 1996–2000 are based on 1993 prices, while growth rates from 2001 onward are based on 2000 prices.4 For FY April–March.Sources: Asian Development Bank; Prime Minister’s Office, Brunei Darussalam (Brunei Economic Bulletin); Eurostat website (euro area); Economic and Social Research (Japan); Bureau of Economic Analysis (US).
2000
7.8
6.6
2.8
8.4
4.9
5.8
8.9
13.7
6.0
10.0
4.8
6.8
7.9
10.0
8.5
5.8
8.4
2.9
3.7
3.9
2001
4.4
1.8
3.0
5.5
3.6
5.8
0.3
11.3
1.8
-2.3
2.2
6.9
1.4
0.6
3.8
-2.2
8.3
0.4
0.8
1.9
2002
6.8
4.7
2.8
5.2
4.5
5.9
4.4
12.0
4.4
4.0
5.3
7.1
5.3
1.8
7.0
4.2
9.1
0.1
1.6
0.9
2003
6.7
5.3
3.2
7.0
4.8
5.8
5.5
13.8
4.9
2.9
7.0
7.3
3.2
3.2
3.1
3.4
10.0
1.8
2.7
0.8
Emerging East Asia
ASEAN
Brunei Darussalam
Cambodia
Indonesia
Lao PDR
Malaysia
Myanmar
Philippines
Singapore
Thailand
Viet Nam
NIEs
Hong Kong, China
Rep. of Korea
Taipei,China
PRC
Japan
US
Euro area
Average
1996–2004
6.2
3.8
0.8
6.9
2.6
6.1
4.7
10.4
4.1
5.0
2.7
7.1
4.4
3.6
4.6
4.5
9.0
1.1
3.0
1.9
2004
7.9
6.4
1.7
7.7
5.1
6.9
7.2
13.6
6.2
8.7
6.2
7.8
5.7
8.6
4.7
6.1
10.1
2.3
4.2
2.1
2005
7.2
5.5
3.6
8.4
5.6
7.2
5.2
12.2
5.0
6.4
4.5
8.4
4.5
7.3
4.0
4.1
9.9
2.6
3.5
1.3
2006
7.5
5.5
. . .
6.3
5.4
7.3
5.5
. . .
5.0
6.1
4.7
7.8
5.1
6.5
5.1
4.4
10.1
2.9
3.3
2.1
2007
6.9
5.7
. . .
6.4
6.0
6.5
5.8
. . .
5.3
4.6
5.5
8.0
4.7
5.2
4.9
4.0
9.0
2.4
3.1
2.0
ADB Forecasts
1,2
2
3
4
Philippines, and reduced political uncertainty in Thailand. (For outlooks, risks, and policy issues for individual economies, see Part IV.)
With headline and core inflation already rising in recent months in several emerging East Asian economies, the outlook is for higher inflation on average in 2006 than last year. Reinforcing this expectation is evidence of higher inflation momentum in the region (Figure 34). Although still relatively low in the PRC and the NIEs—especially compared with ASEAN—the seasonally-adjusted series show inflation

R E G I O N A L U P D A T E
2�
Figure 34: Inflation Rates1 (m-o-m, seasonally adjusted, %)
-0.4
-0.2
0.0
0.2
0.4
0.6
0.8
May-06Mar-06Jan-06Nov-05Sep-05Jul-05May-05
Emerging East Asia
NIEs
PRC
0.6
0.4
0.3
1 Weighted by gross national income (atlas method, current $).Source: OREI staff calculations based on ARIC Indicators.
accelerating somewhat in April 2006. For emerging East Asia overall, annual inflation is expected to rise from 3.0% in 2005 to 3.5% in 2006, increasing in the PRC from 1.8% to 2.3%, in the NIEs from 2.4% to 2.6%, and in the ASEAN economies from 6.3% to 7.3%.
Risks to the Outlook
The forecast of a strong regional expansion over the near term is contingent on the assumption that no serious adverse shocks occur over the forecast period. Yet, there are several risks to this outlook. These risks can be grouped into two broad categories. The first includes near-term, cyclical risks: (i) a sharp fall in external demand; (ii) vulnerabilities due to an overheating PRC economy; (iii) higher-than-expected energy prices; and (iv) a significant deterioration in global financial conditions. The second category includes those that have a relatively low probability of occurring in the near term but would seriously disrupt the region’s economies if they occur: (v) a sudden and disruptive adjustment of the global payments imbalance; and (vi) an avian flu pandemic.
The risk of a sharp slowdown in external demand hinges on whether or not the US economy would slow much more than expected. The last US recession was accompanied by a drop in external demand for emerging East Asia, which contributed to the sharp economic slowdown in the region in 2001. Up until now, rapid growth of household wealth underpinned the US expansion by spurring consumption growth. However, the US real estate market is beginning to cool. If that would be hastened by, for example, rising US interest rates, consumption growth and thus the US economy could slow more sharply than expected. The OECD composite leading indicator for the US shows that the risk of such a downturn has recently increased (Figure 35). However, there is no such indication in the euro area or Japan, which are strengthening and rebalancing sources of global growth. A more balanced global expansion implies that while a sharper-than-expected US slowdown would reduce growth projections in the region, it need not derail the expansion.
The 2006–07 growth forecast for the PRC is based on expectations that, with more assertive monetary tightening
Figure 35: OECD Composite Leading Indicators1 (% change)
-4
-2
0
2
4
6
8
10
12
14
Apr-06Nov-05Jun-05Jan-05Aug-04Mar-04Oct-03May-03Dec-02Jul-02
US CLI
Euro zone CLI
Japan
2
2
2
5.1
3.63.2
1 Composite leading indicators (CLIs) are constructed to signal turning points in growth cycles of aggregate economic activity.2 6-month, annualized, trend restored.Source: OECD website.

R E G I O N A L U P D A T E
2�
by the authorities, the economy will slow to a sustainable but still strong growth rate. However, given current indications of an overheating economy, such as overinvestment and rapidly rising real estate prices in selected areas, there is a risk that the economy may slow more sharply. Given its importance as an export market to the rest of the region, this could trigger a broader slowdown.
Against the backdrop of rising inflation in the region, a spike in oil prices could significantly exacerbate inflationary pressures—especially if it is sustained or perceived as permanent. Given that fuel prices have already increased, further hikes would be onerous to producers and consumers alike. Even if the spike turns out to be short-lived, it could be difficult to absorb on top of already high prices. To the extent that governments try to insulate economies by limiting pass-through effects, there could be adverse fiscal impacts.
A sharp deterioration in global financial conditions could occur, for example, if the US FED continued to raise short-term rates faster than expected. They could also arise from a sudden upward adjustment in long-term US interest rates—a much steeper US yield curve. Or there could be a more severe correction in emerging financial markets that markedly impact risk premiums. In general, the scope for regional monetary authorities to mitigate the impact of higher interest rates might well be limited if the adjustment is accompanied by significant turbulence. If authorities respond by tightening monetary policy more than anticipated, investment spending could weaken, and the region could face some intense financial headwinds.
The possibility of a sudden and disorderly unwinding of the global payments imbalance is relatively remote over the forecast period. However, to the extent that a globally-shared approach to resolving the current payments imbalance is not emerging, there is an increasing concern over the medium-term stability of global financial markets. If, for example, a financial shock hits the US, the consequences for emerging East Asia could be large. Immediate effects on the region’s financial markets might not be severe, but they would likely require authorities to manage significant capital inflows and pressures on their currencies to appreciate. Inflows could be so large as to make sterilized intervention impractical.

R E G I O N A L U P D A T E
30
Nonetheless, although potential capital losses on official reserves could be large—especially if currencies appreciate against both the US dollar and the euro—the direct financial impact of a rapid reduction of the US current account deficit might well be manageable. But the secondary effect—plunging US imports—would not. The sudden evaporation of a large external market would impose a significant adjustment cost on the region’s economies.
The final risk—an avian flu pandemic—is also a remote possibility, but with potentially severe consequences. The structure of the poultry industry in much of the region—with many small-scale, backyard flocks—makes the region more vulnerable to the disease. The potential costs are outlined in the December 2005 edition of the Asia Economic Monitor and the Asian Development Outlook 2006. Since then, the disease has spread significantly, and cases of human-to-human contagion are suspected in Indonesia. However, efforts have been stepped up at the international, regional, and national levels to put effective mitigation and control measures in place (Box 2).
Policy Issues
Given the outlook for robust external demand, sustained regional economic growth, and the risks outlined above, near-term economic policies in emerging East Asia should focus mainly on managing persistently high energy costs and the associated inflationary pressures. Inflation needs to be managed within the context of expectations that global interest rates will rise further. This in turn has consequences for both the conduct of monetary policies and the management of external balances. At the same time, structural policies are needed to address the risks arising from the heavy reliance on external demand, increased vulnerability to global energy market shocks, and the threat of an avian flu pandemic.
In terms of monetary policy, while a tightening bias remains a generally appropriate policy stance for most emerging East Asian economies for maintaining price stability, the appropriate speed and degree of adjustment will depend on several internal and external conditions. A critical factor for monetary authorities is the extent to which rising global

R E G I O N A L U P D A T E
31
Box 2: Impact of Avian Flu—an Update
By end-June 2006, a total of 54 countries had reported avian flu outbreaks in wild birds or poultry,1 with 38 new cases in the first half of the year. The disease spreads primarily through poultry trade but also through migration of wild birds. Even cats were found to be infected with the disease in Germany, Austria, and most recently, in Indonesia.
In July 2006, the World Health Organization (WHO) reported that there were 229 confirmed human cases worldwide since 2003, with 131 fatalities (Table B2). In emerging East Asia, confirmed human infections increased by 33% since December 2005; while 79% of those resulted in death.
Indonesia had 35 new human avian flu cases, the most in the region. Most worrying was a cluster of seven fatalities among extended fami ly members in the Karo district of North Sumatra who were in close contact with each other, but only some of whom were in contact with infected birds. This raises the possibility that the virus mutated, allowing human to human transmission. Eleven new human infections were reported in the PRC, seven of which were fatal. In Cambodia, two human deaths were confirmed, with chickens and ducks in neighboring areas testing positive for the avian flu virus. In February 2006, Malaysia reported its first poultry outbreak since 2004, in Setapak City. Poultry
1FAOAIDE News. Update on the Avian Influ-enza Situation, no. 40. Food and Agriculture Organization, June 2006.
infections were subsequently detected in other areas too. Myanmar reported its first poultry outbreaks in Mandalay and Sagoing provinces in March 2006 leading to the culling of 660,000 poultry. On a more positive note, in Viet Nam and Thailand, where human deaths occurred due to avian flu in 2003 and 2004, no new cases have been reported since January 2006.
Backyard poultry, the livelihood for many rural Asian families, and urban wet markets, where birds are openly slaughtered and displayed, increase the probability
of humans coming into contact with the disease. Inadequate health infrastructure, especially in rural areas, is also a problem because it increases the risks of an outbreak going undetected and rapidly getting out of control.
Encouragingly, however, efforts are underway at the global, regional, and national levels to combat the disease. At the global level, an International Ministerial Pledging Conference was held in Beijing, PRC in January 2006, where almost $1.9 billion was pledged to support programs to combat the disease. ADB, for example, pledged $400 million in loans and $69 million in grants for regional projects. WHO published a “Pandemic Flu Draft Protocol for Rapid Response and Containment,” also in January, mapping out a strategy that would reduce the threat of a
pandemic. In May, the Food and Agriculture Organization held an international scientific conference on avian f lu that confirmed the role of migrating birds in transporting the virus over long distances, resulting in a $6.8 million plan to survey the migratory behavior of wild birds. Also in May, delegates to the World Health Assembly agreed to advance implementation of the International Health Regulations directly related to avian flu and to the threat of a pandemic. And in June, a high-level avian flu conference was held in Vienna, Austria to assess the current situation, the preparations made in case a pandemic occurs, and to follow up pledges and commitments made at the
Beijing conference.
Within the region, the first East Asia Summit held in Kuala Lumpur, Malaysia in December 2005 issued a declaration on Avian Flu Prevention, Control, and Response. WHO
Table B2: Confirmed Human Cases of Avian Flu A/(H�N1) Reported to WHO as of � July 200�
Notes: 1. Total number of cases includes number of fatalities. 2. WHO reports only laboratory-confirmed cases. Source: World Health Organization.
Emerging East Asia (I)
Cambodia
PRC
Indonesia
Thailand
Viet Nam
Other regions (II)
Total (I)+(II)
cases
fatalities
cases
fatalities
cases
fatalities
cases
fatalities
cases
fatalities
cases
fatalities
cases
fatalities
cases
fatalities
fatalities (%)
2003
3
3
0
0
0
0
0
0
0
0
3
3
0
0
3
3
100
2004
46
32
0
0
0
0
0
0
17
12
29
20
0
0
46
32
70
2005
95
41
4
4
8
5
17
11
5
2
61
19
0
0
95
41
43
2006
48
38
2
2
11
7
35
29
0
0
0
0
37
17
85
55
65
Total
(A)
192
114
6
6
19
12
52
40
22
14
93
42
37
17
229
131
57

R E G I O N A L U P D A T E
32
published a Regional Flu Pandemic Preparedness Plan (2006–2008) in January 2006 to complement national efforts. In May, the APEC ministerial meeting announced an Action Plan to help its members detect and respond to avian flu outbreaks. And in June, ASEAN+3 officials held a 3-day meeting in Myanmar focusing on bird flu.
At the national level, too, initiatives are being taken to combat the disease. Indonesia has a strategy involving vaccination, animal and human health surveillance, and
depopulation of infected areas. In the Karo district, the government decreed strict avian flu monitoring and culling of all poultry within one-kilometer of each confirmed case of the disease. The Ministry of Health and Ministry of Agriculture are also preparing National Preparedness Plans. The PRC has taken several steps, including the prohibition of human anti-flu drugs in poultry (which could allow drug-resistant strains of the virus to evolve). In June 2006, the PRC and WHO established a WHO Collaborating Centre for Surveillance, Research
and Training on Emerging Infectious Diseases in Guangzhou. And in the same month, the Ministry of Agriculture issued an emergency order to monitor areas below the flight paths of migratory birds, lakes, and other sites where avian flu appeared. The Hong Kong Hospital Authority requires hospitals to report pneumonia cases of those who traveled in affected countries before falling ill. And Viet Nam has established production zones to relocate farms and to provide farm sanitation.
energy prices pass through into domestic—especially core—inflation. Effective management of these inflationary pressures—and liquidity conditions in general—hinges on the degree of exchange rate flexibility allowed, and the degree of sterilization. Other factors that will affect policy choices include the degree of trade and financial openness, the sensitivity of capital flows to short-term interest rate differentials, and the pace of monetary tightening by major central banks around the world.
Box 3 highlights monetary policy options available for emerging East Asian economies in responding to potential shocks to the economy. In open economies, monetary conditions are influenced jointly by interest rate and exchange rate movements. In some cases, the latter is a more powerful instrument than the former. In other words, the greater the degree of exchange rate flexibility allowed, the greater the scope for decoupling domestic interest rate policy from global interest rate trends. Monetary authorities across the region tend to follow US FED policy rate changes, to a greater or lesser extent. The more the exchange rate adjusts against the US dollar in response to a given shock, the less authorities need to rely on domestic interest rate adjustment.
The appropriate mix of interest rate changes and exchange rate adjustments would depend upon a host of macroeconomic conditions specific to each economy: the balance of payments position, the cyclical phase of the economy, and the underlying nature of the inflationary pressures. However, where pressure

R E G I O N A L U P D A T E
33
Box 3: Monetary Policy Options for Emerging East Asia
The period since the second half of 2004 has seen an unwinding of the very stimulatory monetary policies pursued by the United States (US) Federal Reserve (FED). The US FED funds target rate has risen from an historic low of 1.00% in 2003–2004 to its current rate of 5.25%—through a series of seventeen 25-basis point (bp) increases. While emerging East Asia’s economies have broadly followed the global monetary policy cycle, only in Hong Kong, China have policy rate adjustments kept up with the US—because of the linked exchange rate system. There has been a declining interest rate differential between other emerging East Asia’s policy rates and the US FED funds rate.
While the pol icy interest rate is the primary tool for conducting monetary po l i cy in larger industrial economies l i ke the US—as trade is smal ler relat ive to total output—for smaller open economies, exchange ra tes play a more central role in impacting domestic inflation (a pass-through from imported prices) and output (the impact on net exports). For instance, even if a country’s interest rates do not keep up with world rates, to the extent that its currency appreciates, monetary conditions might effectively be relatively tight (relative to a base year). Therefore, in order to obtain a better measure of the overall
monetary policy stance, it is important to assess both interest rates and exchange rates.
This is the central idea behind a monetary conditions index (MCI) which defines the combination of interest rate and exchange rate that is consistent with a particular monetary policy stance. The weight of each variable in the MCI depends on the relative impact on inflation. The actual computation of the MCI is more involved, as the weights for the exchange rate and interest rate ideally need to be derived formally from a structural model of the economy. Table B3 provides a rough indication of the impact
of a one basis point change in interest rates and a 1% change in exchange rates on domestic inflation. For example, while a 1% change in the effective exchange rate in Japan is equivalent to only a 3bp change in interest rate, it is equivalent to an average of almost 60bp change in several emerging East Asian economies. The general
appreciation of most emerging East Asian currencies (in trade-weighted terms) since mid-2004 thus suggests that the overall monetary condition is tighter than is indicated by the change in policy interest rates. This is particularly true for Korea, which has seen a significant appreciation of its trade-weighted exchange rate since mid-2004, as it is for Singapore.
Given that the actual monetary condition is determined by both the interest rate and the exchange rate, the key policy question is—assuming monetary policies need to be altered—what is the appropriate mix between changes
in interest rates and exchange rates?
T h e a n s w e r depends on the monetary policy and exchange rate framework. For example, if a small economy operates a fixed exchange rate and is open to international cap i t a l f l ows , i t e f f e c t i v e l y forsakes monetary policy autonomy and hence i ts
policy rates have to change more or less in step with the partner country rates. Hong Kong, China is a case in point.
Monetary authorities in most emerging East Asian economies, however, have shifted toward either formal or informal inflation targeting in recent years with
Table B3: Effect on Inflation of Changes in Interest and Exchange Rates (in basis points)
Source: CLSA Asia-Pacific Markets, The Infofax, 1 July 2006.
Hong Kong, China
Korea
Malaysia
Singapore
Taipei,China
Thailand
Average
Japan
Effect of a 1 basis point
change in interest rate
1.08
0.56
0.21
0.36
0.29
0.43
0.49
1.37
Effect of a 1% change in exchange rate
49
21
14
43
14
14
26
4
Interest rate equivalent (in bp) of a
1% change in exchange rate
45
38
68
119
48
33
59
3

R E G I O N A L U P D A T E
3�
increasingly flexible exchange rates. An inflation-targeting monetary authority in a relatively small, open economy must consider exchange rate movements when choosing the appropriate interest rate to attain the desired monetary stance.
But there is a second consideration. For each policy interest rate, there is a specific currency value that places the foreign exchange market in equilibrium (when supply and demand for the currency are equal). Thus, there is an optimum combination of exchange rate and interest rate that allows the inflation target to be met without exerting undue pressure—either to appreciate or depreciate—on the exchange rate.1
Suppose an inflation-targeting author i ty faces increas ing inflationary pressures and decides to raise the policy interest rate to tighten monetary conditions. This will attract capital inflows and thus cause a fully floating exchange rate to appreciate—resulting in tighter monetary conditions and reducing the required interest rate adjustment. But suppose the monetary authority wants to limit
1This discussion is based on background pa-pers prepared by OREI.
the exchange rate adjustment, then the interest rate must bear a higher weight of the required change. This then induces larger capital inflows than otherwise and builds even greater pressure for the currency to appreciate. In this case, authorities must intervene in the exchange market to buy up the excess foreign currency and then sterilize the effect this has on the domestic monetary base (and it must be done continuously to maintain the desired monetary stance). To the extent that these interventions are not perfectly sterilized, monetary policy will tend to be looser than intended and inflationary pressures can persist, requiring further tightening through interest rate hikes.
Consider the case in which the inflation-targeting monetary authority is faced with both an increase in inflationary pressure and an increase in foreign currency inflows—as happened during the first quarter of 2006 in much of emerging East Asia. In this case, increased foreign demand for local currency would likely lead to currency appreciation, under a floating rate regime, and result in tighter monetary conditions. Depending on the relative size of the two external shocks, the
currency appreciation might be sufficient to reestablish low and stable inflation with no (or minimal) adjustment to the interest rate required. If there should be no exchange rate adjustment under a fixed rate regime, the change in policy rate would be required. But the interest rate increase induces capital inflows and resulting additional appreciation pressures would force the authorities to scale up ongoing exchange market intervention requiring further sterilization efforts.
These examples show that, for a relatively small and open economy, a flexible exchange rate can be a shock absorber to partially insulate the domestic economy from external shocks by minimizing the size of the policy rate adjustment needed to attain the inflation target. In short, the greater the exchange rate flexibility, the easier it is to maintain autonomy in monetary policy.
The same logic would also apply to a large economy, like the PRC, in order to alleviate the strains on liquidity growth arising from reserve accumulation. Greater exchange rate flexibility can also assist in resolving some of the global payments imbalances.
exists for currency appreciation, appropriate exchange rate adjustment can reduce the need for hikes in the policy interest rate. In the PRC, for example, achieving the necessary degree of monetary tightening will likely require both increases in deposit and lending rates to cool domestic demand and further currency appreciation to support monetary policy tightening as well as alleviate external imbalances. For Korea, where the current account surplus is narrowing and the policy rate has been raised twice this year, most recently in June, further fine-tuning of monetary conditions needs to proceed with caution. Thailand—which has tightened monetary policy

R E G I O N A L U P D A T E
3�
significantly—will need to balance sustained inflationary pressures against a weaker expansion in domestic demand. In contrast, against decelerating but still high inflation and weaker external balances, the focus in the Philippines and Indonesia will have to be on maintaining stability of both internal and external balances. This may mean continuing to lower the elevated rates in Indonesia without igniting inflation and exacerbating external conditions.
Fiscal conditions and policy options vary greatly across the region. In Korea and Singapore, where public finances are generally strong, the focus could turn to addressing such long-term priorities as preparing for an aging population and sustaining economic growth through enhanced research and development. In contrast, in the PRC, a critical need is to shift the public spending focus toward high priority and quality investments in environmental protection, energy efficiency, social protection, human capital, and rural development without adding to economic overheating. In the Philippines and Indonesia, where fiscal vulnerabilities remain despite recent improvements, reducing inefficiencies and prioritizing development needs can help guard against macroeconomic instability. As the smaller ASEAN economies implement fiscal reforms, improving the efficiency of fiscal administration is an important challenge, especially in tax collection and management of still relatively low level of expenditures. In Myanmar, however, fiscal sustainability is threatened by the persistent monetization of the fiscal deficit.
To address external imbalances and reduce vulnerability to external shocks, the region should enhance domestic demand. In the PRC, efforts to stimulate consumption—especially in rural areas or through social sector reforms such as pension reforms—are appropriate. Excluding the PRC, unexploited investment opportunities—both in the private sector and public sector-led infrastructure projects—remain large in several emerging East Asian economies. Appropriate structural reforms and policies that improve domestic business climates and stimulate investment would be valuable. This could include adopting initiatives aimed at strengthening the efficiency of domestic financial institutions, particularly banks, as well as developing efficient domestic capital markets—particularly bond markets. While bank balance
R E G I O N A L U P D A T E
3�
sheets in emerging East Asia have strengthened significantly in recent years, continued efforts to improve profitability and to reduce financial vulnerabilities are essential to withstand ongoing challenges. Banks across the region need to continue strengthening their resilience to shocks—as less benign macroeconomic and market conditions may emerge in the months ahead. Such efforts are needed even more as banks—beginning this year—start implementing the Basel II capital adequacy framework, which aims to improve measurement and management of risk by adjusting and refining traditional capital adequacy measures. Addressing corporate sector vulnerabilities and improving corporate governance is also critically important. Implementing effective mechanisms to channel regional savings into regional investment would also help reduce external payments imbalances and support sustained economic growth across the region.
It is also important for emerging East Asian economies to improve energy efficiency and reduce dependence on external sources of energy. This can be achieved by (i) promoting the adoption of technologies using renewable energy sources; (ii) providing market incentives to reduce energy consumption; (iii) removing subsidies and price controls; (iv) introducing regulatory and administrative measures to ensure the use of energy-friendly production and construction standards; and (v) increasing public awareness on the relevance of enhancing energy efficiency and conservation. While the adoption of domestic energy policies will depend on each economy’s degree of energy self-sufficiency, it is imperative to strengthen regional cooperation on energy policy—a shared approach and collective action can better address common concerns.
Enhancing the region’s capability to manage a possible avian flu pandemic is another policy priority for emerging East Asian economies. Implementing initiatives to combat the recent, renewed spread of the disease is essential. Authorities should introduce a proper mix of containment programs at the country-specific and regional level aimed at strengthening surveillance and disease control mechanisms, providing timely and accurate information on the incidence and spread of the disease—including updates of flu outbreaks and cases of human infection—and developing contingency plans in coordination with the private sector to minimize the social and economic consequences of a pandemic outbreak.