emergency conservation regulation update · december 2014 residential gallons per capita per day...
TRANSCRIPT
Emergency Conservation Regulation Update
Carlos Mejia, Katheryn Landau, Mark Emmerson, Eric Oppenheimer
Office of Research, Planning, and PerformanceFebruary 3, 2015
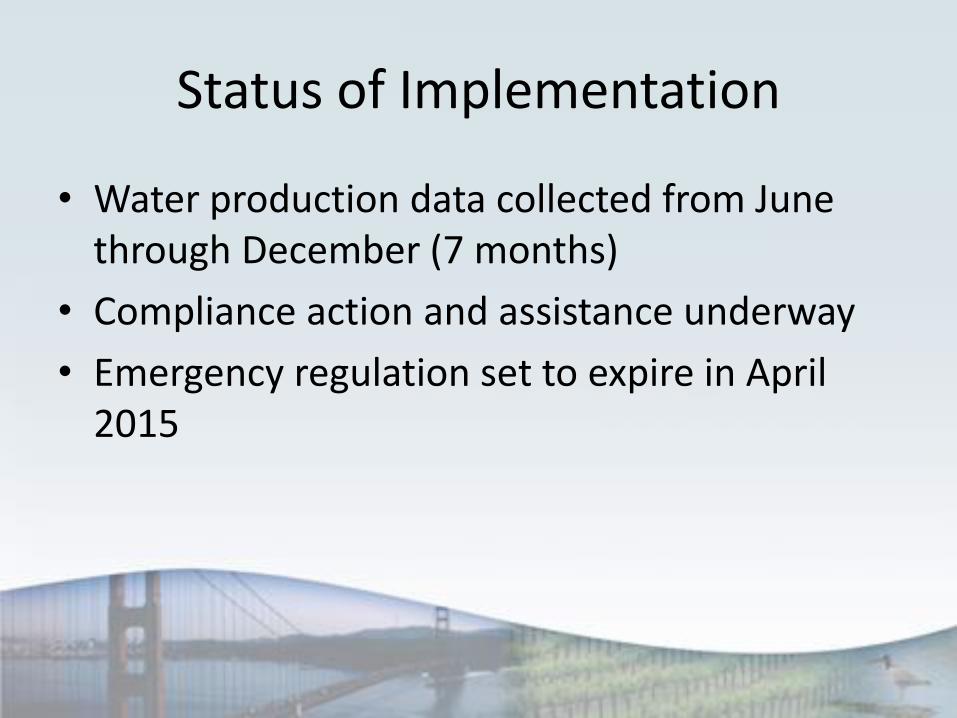
Status of Implementation
• Water production data collected from June through December (7 months)
• Compliance action and assistance underway
• Emergency regulation set to expire in April 2015
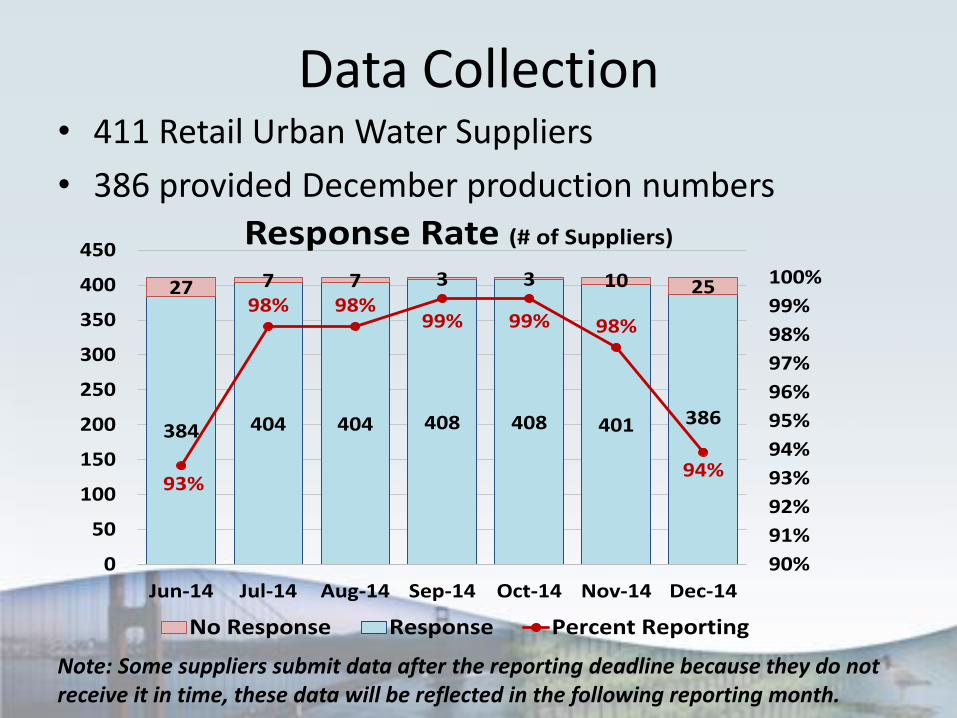
Data Collection• 411 Retail Urban Water Suppliers
• 386 provided December production numbers
384 404 404 408 408 401 386
27 7 7 3 3 10 25
93%
98% 98%99% 99% 98%
94%
90%
91%
92%
93%
94%
95%
96%
97%
98%
99%
100%
0
50
100
150
200
250
300
350
400
450
Jun-14 Jul-14 Aug-14 Sep-14 Oct-14 Nov-14 Dec-14
Response Rate (# of Suppliers)
No Response Response Percent Reporting
Note: Some suppliers submit data after the reporting deadline because they do not receive it in time, these data will be reflected in the following reporting month.
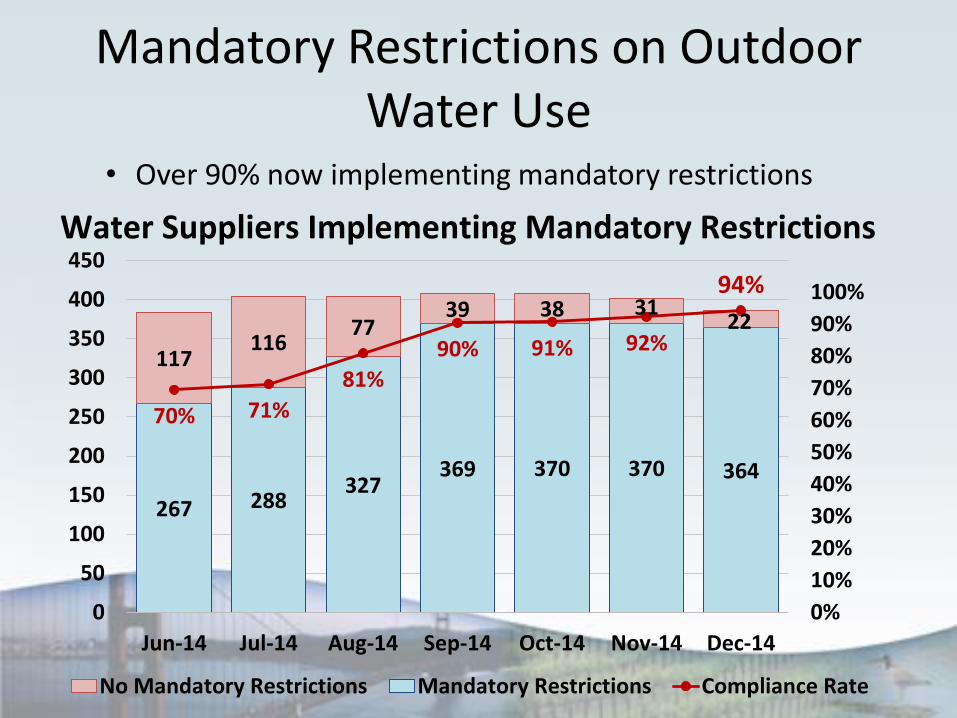
Mandatory Restrictions on Outdoor Water Use
• Over 90% now implementing mandatory restrictions
267 288327
369 370 370 364
117116
7739 38 31
22
70% 71%
81%
90% 91% 92%
94%
0%
10%
20%
30%
40%
50%
60%
70%
80%
90%
100%
0
50
100
150
200
250
300
350
400
450
Jun-14 Jul-14 Aug-14 Sep-14 Oct-14 Nov-14 Dec-14
No Mandatory Restrictions Mandatory Restrictions Compliance Rate
Water Suppliers Implementing Mandatory Restrictions
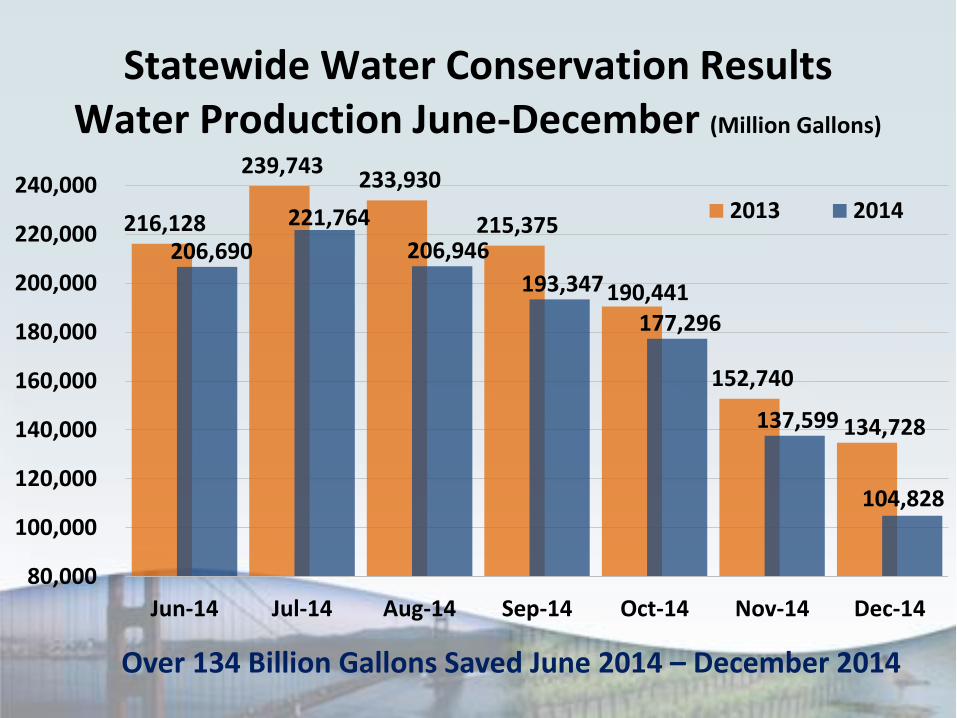
Over 134 Billion Gallons Saved June 2014 – December 2014
216,128
239,743 233,930
215,375
190,441
152,740
134,728
206,690
221,764
206,946
193,347
177,296
137,599
104,828
80,000
100,000
120,000
140,000
160,000
180,000
200,000
220,000
240,000
Jun-14 Jul-14 Aug-14 Sep-14 Oct-14 Nov-14 Dec-14
2013 2014
Statewide Water Conservation ResultsWater Production June-December (Million Gallons)

Over 413,102 Acre-Feet Saved June 2014 – December 2014,enough to provide 1.8 million Californians with water for 1 year
134.61
9.44
17.98
26.98
22.03
13.14 15.14
29.90
-
20
40
60
80
100
120
140
-
5
10
15
20
25
30
35
Jun-14 Jul-14 Aug-14 Sep-14 Oct-14 Nov-14 Dec-14
Cumulative Water Conserved
Statewide Water Conservation ResultsWater Conserved June-December (Billion Gallons)
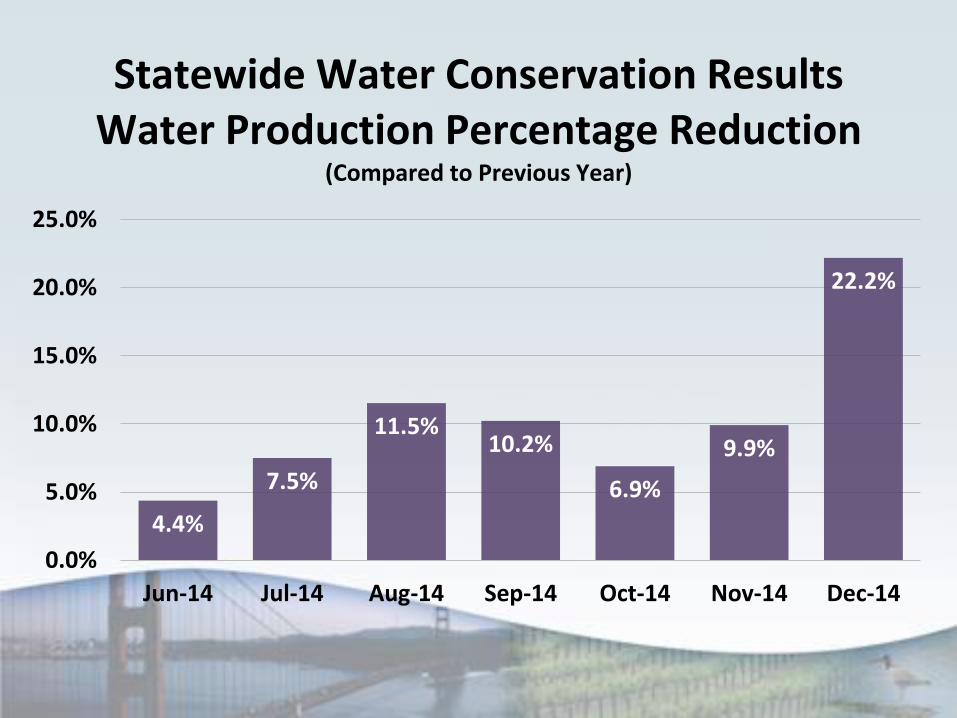
4.4%
7.5%
11.5%10.2%
6.9%
9.9%
22.2%
0.0%
5.0%
10.0%
15.0%
20.0%
25.0%
Jun-14 Jul-14 Aug-14 Sep-14 Oct-14 Nov-14 Dec-14
Statewide Water Conservation ResultsWater Production Percentage Reduction
(Compared to Previous Year)
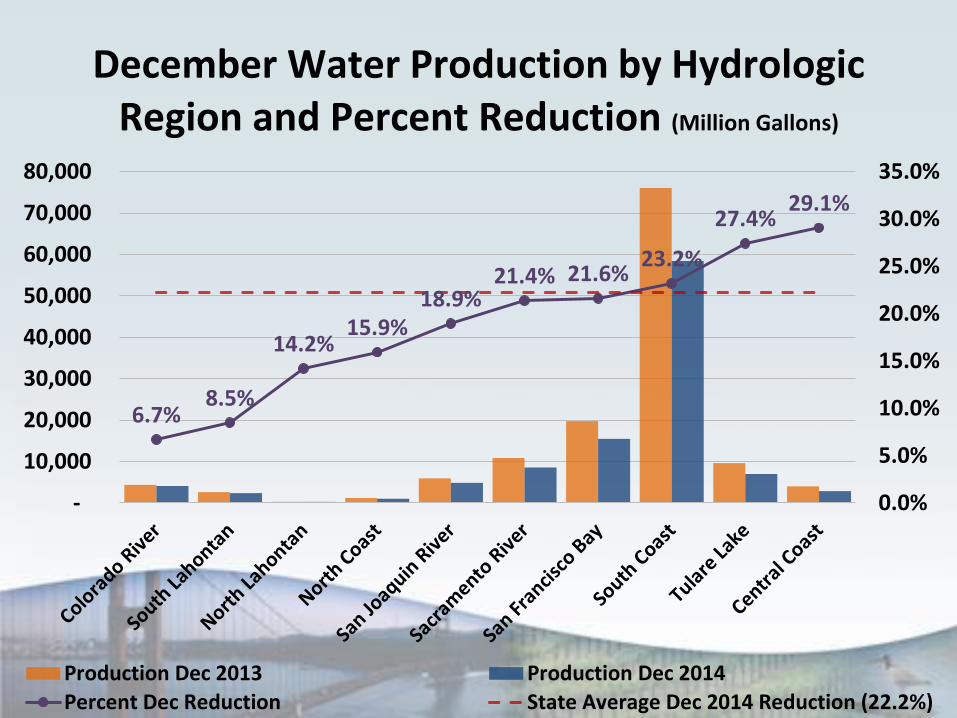
6.7%8.5%
14.2%15.9%
18.9%21.4% 21.6%
23.2%
27.4%29.1%
0.0%
5.0%
10.0%
15.0%
20.0%
25.0%
30.0%
35.0%
-
10,000
20,000
30,000
40,000
50,000
60,000
70,000
80,000
Production Dec 2013 Production Dec 2014
Percent Dec Reduction State Average Dec 2014 Reduction (22.2%)
December Water Production by HydrologicRegion and Percent Reduction (Million Gallons)
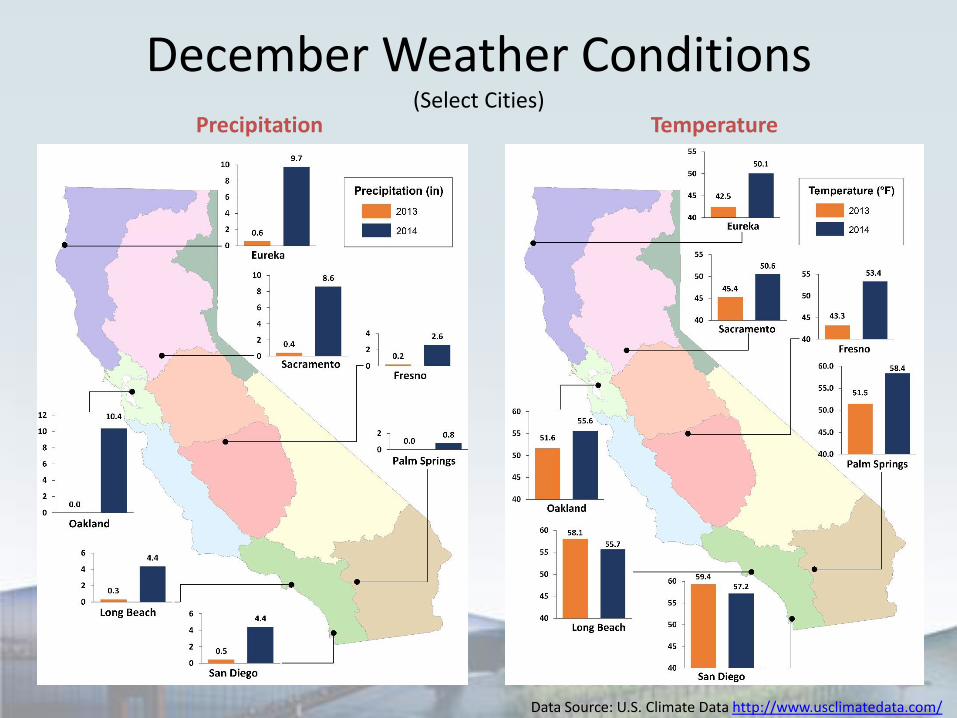
December Weather Conditions(Select Cities)
Precipitation Temperature
Data Source: U.S. Climate Data http://www.usclimatedata.com/
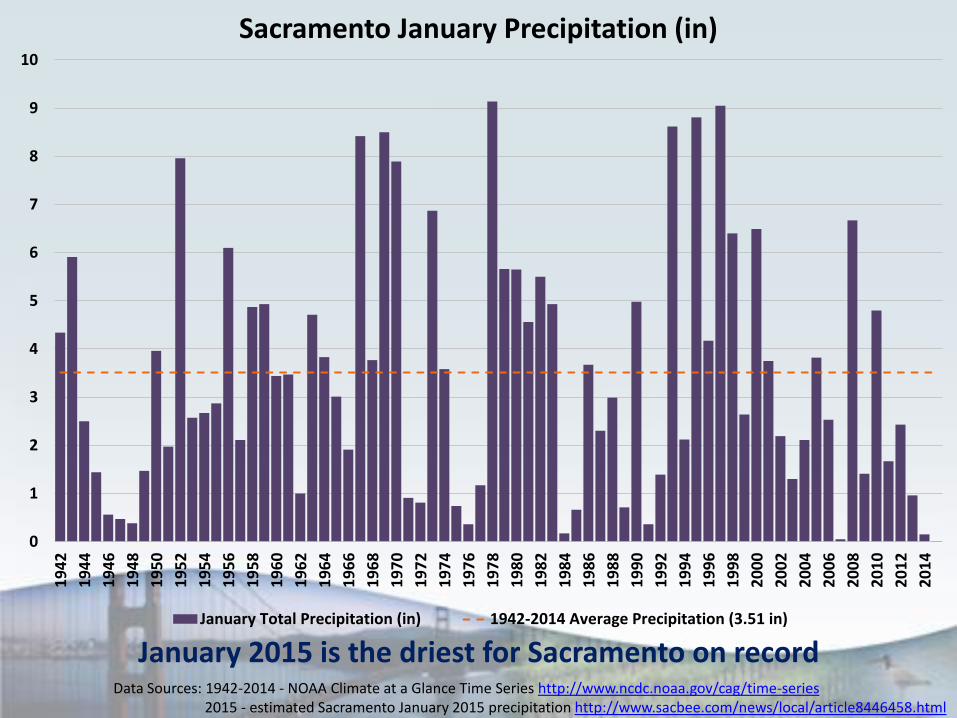
Data Sources: 1942-2014 - NOAA Climate at a Glance Time Series http://www.ncdc.noaa.gov/cag/time-series2015 - estimated Sacramento January 2015 precipitation http://www.sacbee.com/news/local/article8446458.html
January 2015 is the driest for Sacramento on record
0
1
2
3
4
5
6
7
8
9
101
94
2
19
44
19
46
19
48
19
50
19
52
19
54
19
56
19
58
19
60
19
62
19
64
19
66
19
68
19
70
19
72
19
74
19
76
19
78
19
80
19
82
19
84
19
86
19
88
19
90
19
92
19
94
19
96
19
98
20
00
20
02
20
04
20
06
20
08
20
10
20
12
20
14
Sacramento January Precipitation (in)
January Total Precipitation (in) 1942-2014 Average Precipitation (3.51 in)
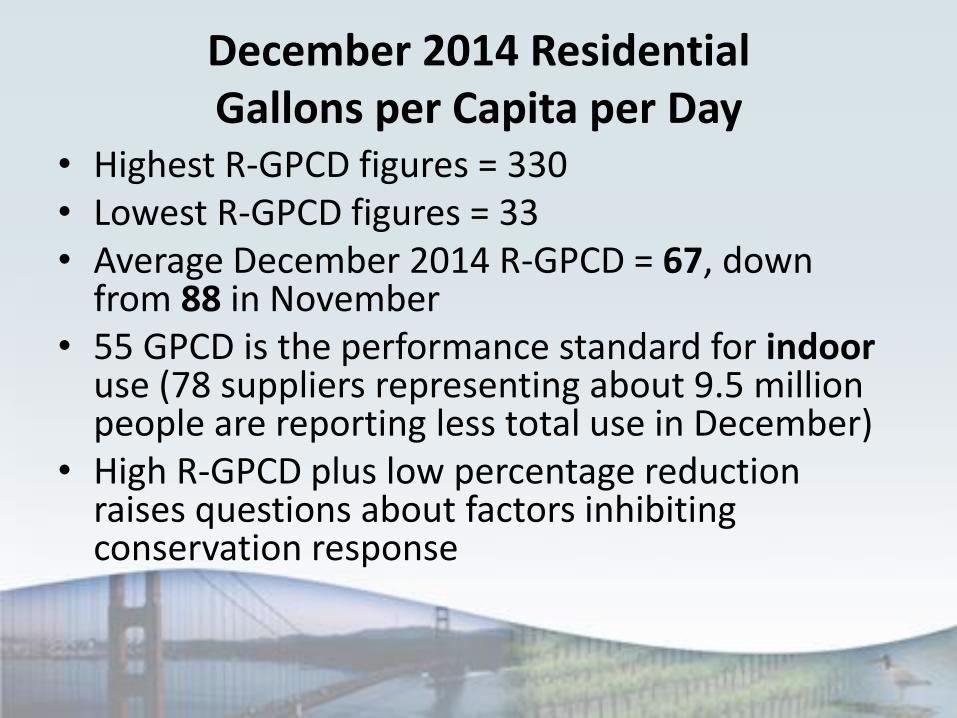
December 2014 Residential Gallons per Capita per Day
• Highest R-GPCD figures = 330• Lowest R-GPCD figures = 33• Average December 2014 R-GPCD = 67, down
from 88 in November• 55 GPCD is the performance standard for indoor
use (78 suppliers representing about 9.5 million people are reporting less total use in December)
• High R-GPCD plus low percentage reduction raises questions about factors inhibiting conservation response
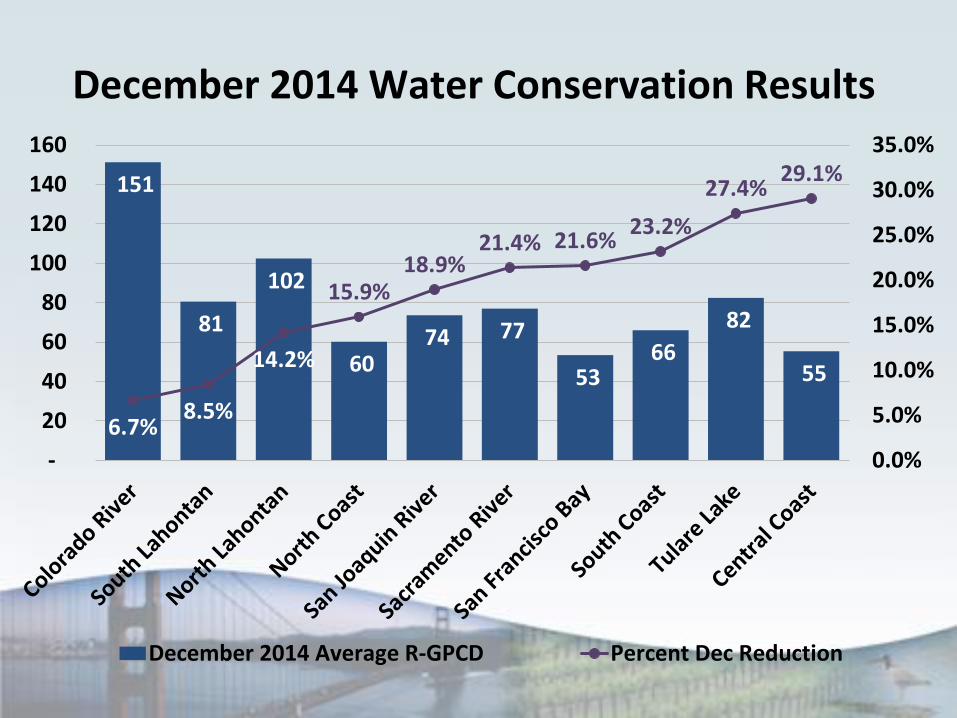
151
81
102
60 74 77
53 66
82
55
6.7%8.5%
14.2%
15.9%18.9%
21.4% 21.6%23.2%
27.4%29.1%
0.0%
5.0%
10.0%
15.0%
20.0%
25.0%
30.0%
35.0%
-
20
40
60
80
100
120
140
160
December 2014 Average R-GPCD Percent Dec Reduction
December 2014 Water Conservation Results
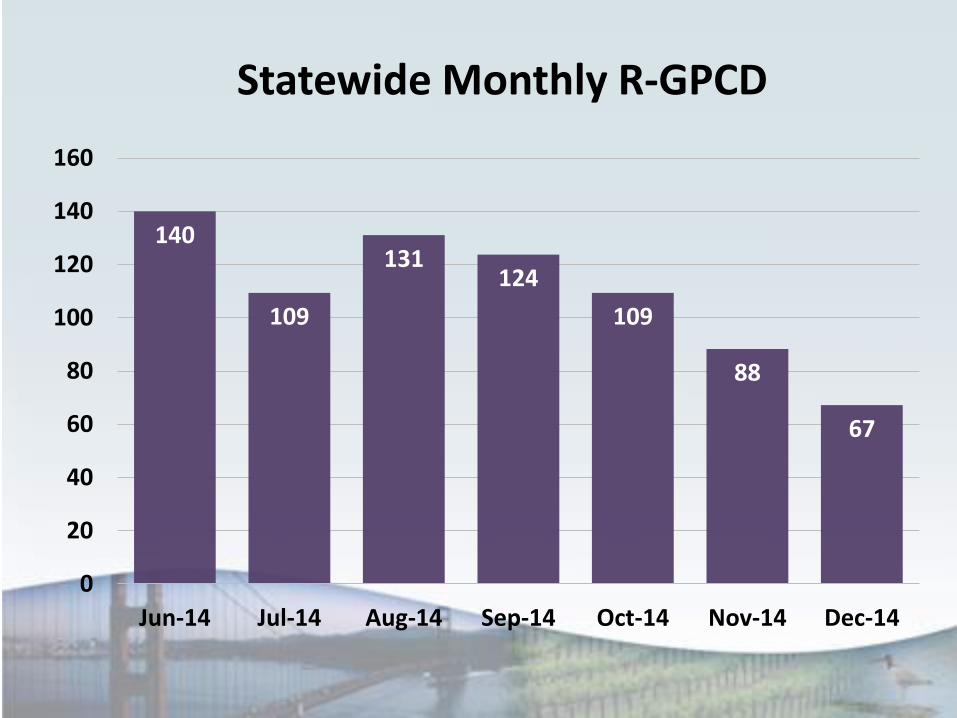
140
109
131124
109
88
67
0
20
40
60
80
100
120
140
160
Jun-14 Jul-14 Aug-14 Sep-14 Oct-14 Nov-14 Dec-14
Statewide Monthly R-GPCD
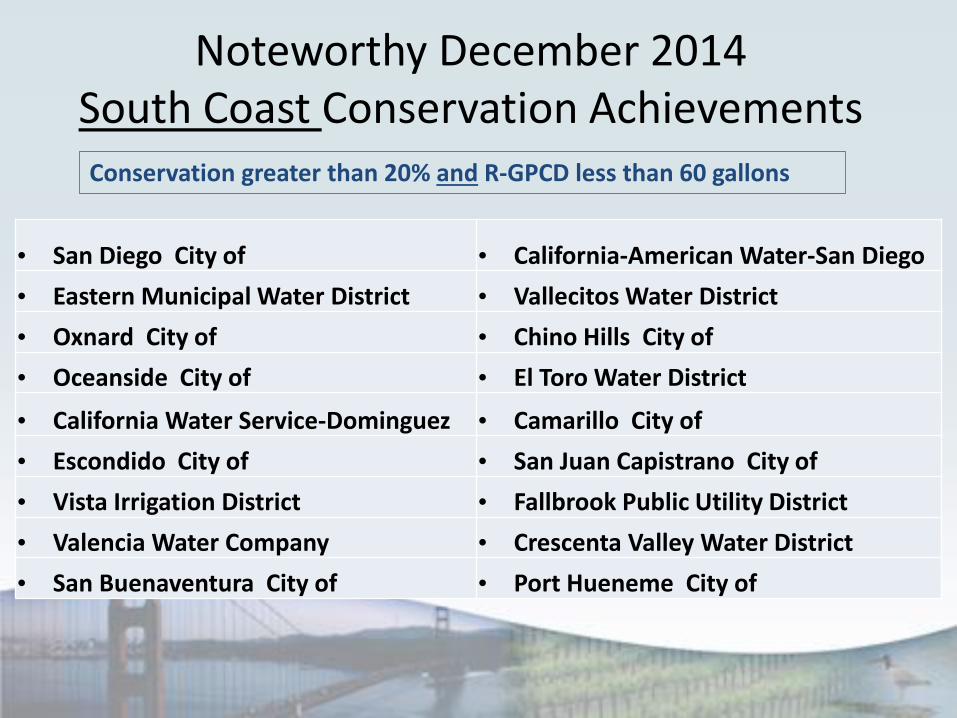
Noteworthy December 2014 South Coast Conservation AchievementsConservation greater than 20% and R-GPCD less than 60 gallons
• San Diego City of • California-American Water-San Diego
• Eastern Municipal Water District • Vallecitos Water District
• Oxnard City of • Chino Hills City of
• Oceanside City of • El Toro Water District
• California Water Service-Dominguez • Camarillo City of
• Escondido City of • San Juan Capistrano City of
• Vista Irrigation District • Fallbrook Public Utility District
• Valencia Water Company • Crescenta Valley Water District
• San Buenaventura City of • Port Hueneme City of
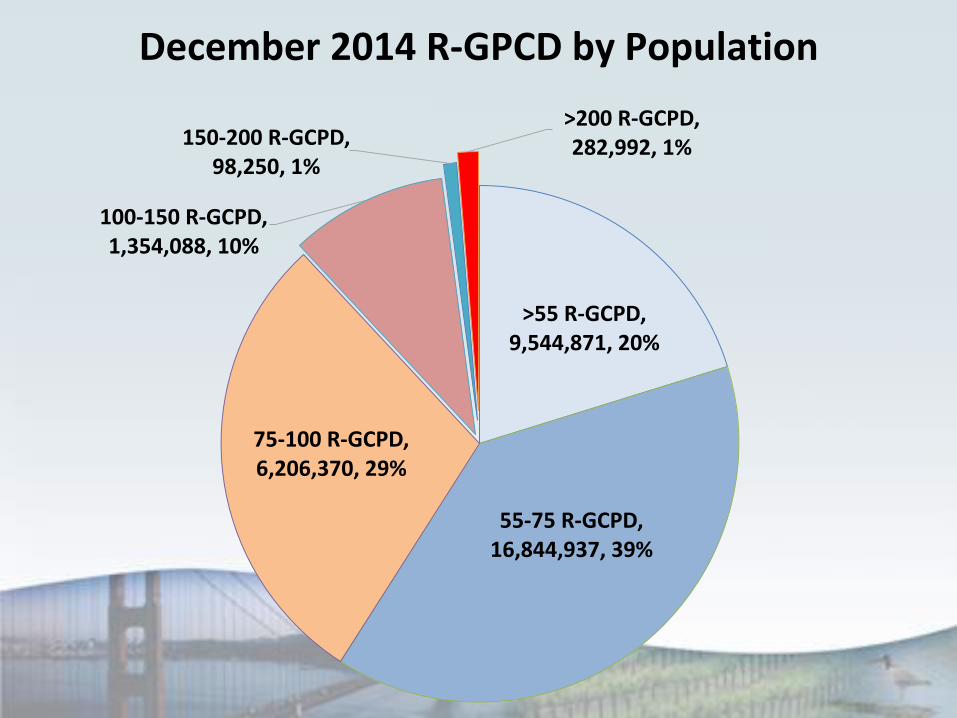
>55 R-GCPD, 9,544,871, 20%
55-75 R-GCPD, 16,844,937, 39%
75-100 R-GCPD, 6,206,370, 29%
100-150 R-GCPD, 1,354,088, 10%
150-200 R-GCPD, 98,250, 1%
>200 R-GCPD, 282,992, 1%
December 2014 R-GPCD by Population
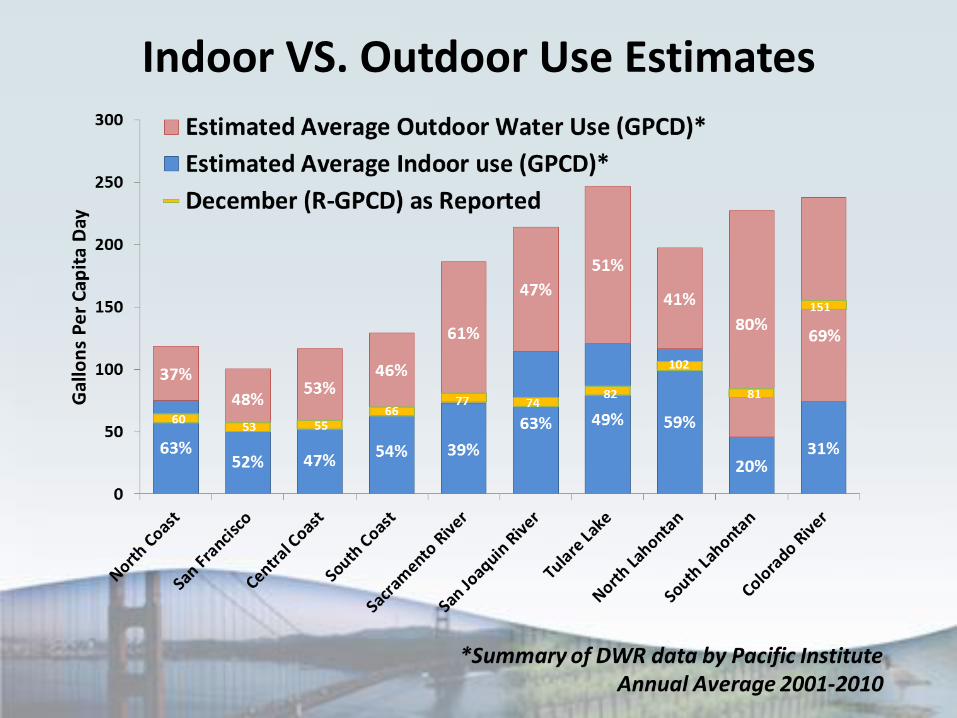
Indoor VS. Outdoor Use Estimates
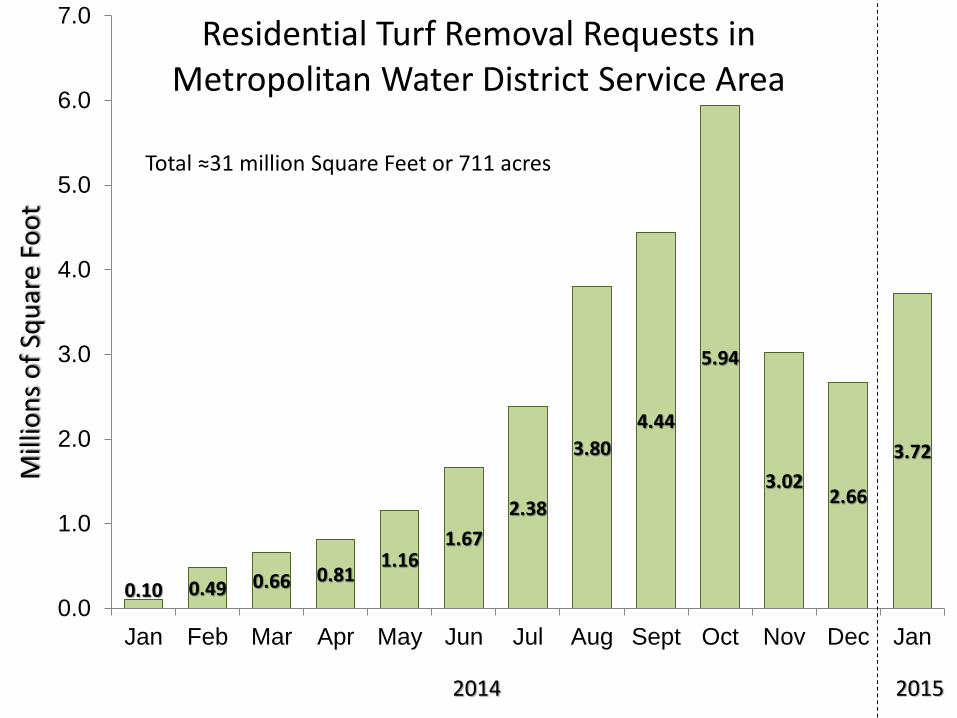
0.10 0.49 0.66 0.811.16
1.67
2.38
3.80
4.44
5.94
3.022.66
3.72
0.0
1.0
2.0
3.0
4.0
5.0
6.0
7.0
Jan Feb Mar Apr May Jun Jul Aug Sept Oct Nov Dec Jan
Mill
ion
s o
f Sq
uar
e Fo
ot
Residential Turf Removal Requests in Metropolitan Water District Service Area
2014 2015
Total ≈31 million Square Feet or 711 acres
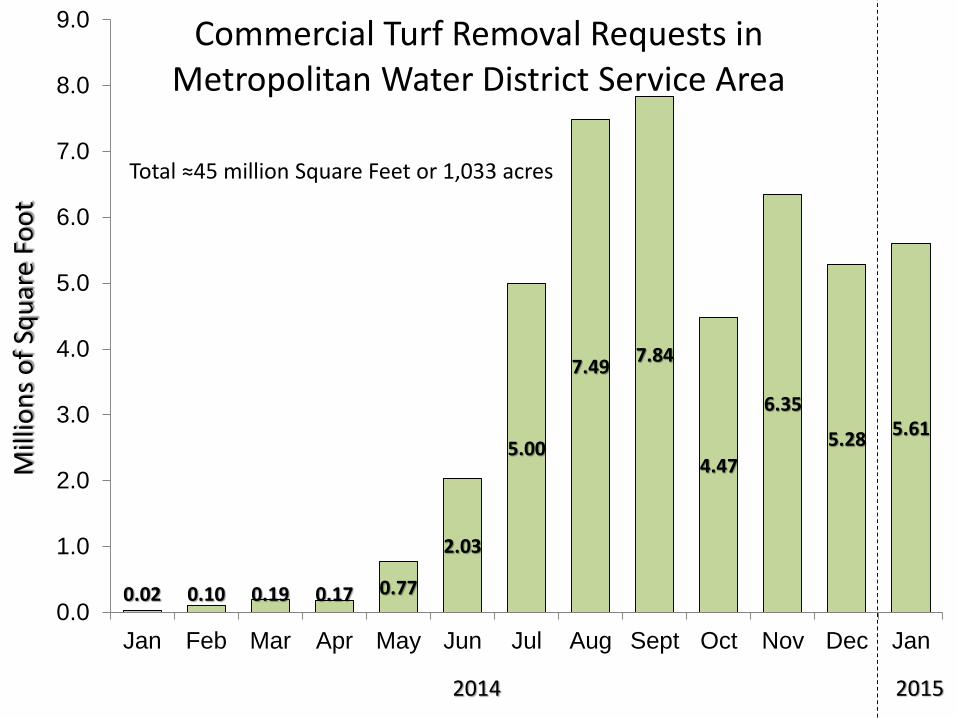
0.02 0.10 0.19 0.17 0.77
2.03
5.00
7.497.84
4.47
6.35
5.285.61
0.0
1.0
2.0
3.0
4.0
5.0
6.0
7.0
8.0
9.0
Jan Feb Mar Apr May Jun Jul Aug Sept Oct Nov Dec Jan
Mill
ion
s o
f Sq
uar
e Fo
ot
Commercial Turf Removal Requests in Metropolitan Water District Service Area
Total ≈45 million Square Feet or 1,033 acres
2014 2015
Next Steps
• Continue working with suppliers to achieve compliance with emergency regulation
• Evaluate recommendations from December 17 workshop and written comments
• Present an Information Item at February 17-18 Board Meeting focused on potential options for next steps-Including:– Extending and/or augmenting current emergency
regulation before April 2014 expiration date– Funding Opportunities– Focused/location specific use of other authorities