emep-wmo workshop on fine particles – emissions, modelling
TRANSCRIPT

EMEP-WMO Workshop on fineparticles – emissions, modelling
and measurements
Interlaken, Switzerland22–25 November 1999
Edited byJan Erik Hanssen, Richard Ballaman and Robert Gehrig
WorldMeteorologicalOrganization
Swiss Agency for theEnvironment, Forests
and Landscape
Swiss FederalLaboratories for Materials
Testing and Research
NorwegianInstitute for Air
Research
EM
EP/C
CC
-Report 9/2000


NILU : EMEP/CCC-Report 9/2000REFERENCE : O-98134DATE : OCTOBER 2000
EMEP Co-operative Programme for Monitoring and Evaluationof the Long-range Transmission of Air Pollutants
in Europe
EMEP-WMO Workshop on fineparticles – emissions, modelling and
measurements
Interlaken, Switzerland22–25 November 1999
Edited byJan Erik Hanssen, Richard Ballaman and Robert Gehrig
Norwegian Institute for Air ResearchP.O. Box 100, N-2027 Kjeller, Norway

2
EMEP/CCC-Report 9/2000

EMEP/CCC-Report 9/2000
3
Preface
This Workshop was organized in co-operation between Swiss Agency for theEnvironment, Forests and Landscape (BUWAL) and Swiss Federal Laboratoriesfor Materials Testing and Research (EMPA). The organizers wish to thank theparticipants for their contributions to the success of the Workshop and the chairpersons and rapporteurs for valuable assistance.
The Chemical Co-ordinating Centre of EMEP (CCC) will express its gratitude toBUWAL and EMPA for their excellent organization of the Workshop.
This Workshop has given a valuable input to the planning of the coming work inEMEP on fine particles, with excellent presentations given by leading scientistswithin their field of environmental research.
Jan Erik HanssenSenior scientistCCC-EMEPNorwegian Institute for Air Research

EMEP/CCC-Report 9/2000
4
EMEP/CCC-Report 9/2000
5
Contents
Page
1. Introduction ........................................................................................................9
2. Scope of the Workshop ....................................................................................10
3. Conclusions and recommendations ................................................................133.1 Conclusions and recommendations from Working group on
emissions..................................................................................................133.2 Conclusions and recommendations from Working group on
measurements...........................................................................................143.3 Conclusions and recommendations from Working group on
modelling .................................................................................................15
Appendix A List of participants .........................................................................19
Appendix B Agenda .............................................................................................29
Appendix C Papers and posters presented ........................................................35Opening of the workshop / Aim of the workshop byUrs P. Nyffeler .........................................................................................37
Fine particles under the convention on LRTAPDiscussions/Decisions by the EMEP Steering Body 1998–1999E. Lumme Secretary of the EMEF Steering Body UN/ECE....................39
Plans of the European Commission regarding particulate matterby Lynne Edwards...................................................................................47
Health aspects of fine particles by Michal Krzyzanowski .....................49
Emission inventories of primary fine particles byM. Woodfield, P. Van Der Most, J. Goodwin, J. McAughey..................53
European PM10 and PM2.5 Emission Inventory of anthropogenicSources by Jan J.M. Berdowski and Antoon J.H. Visschedijk ..............57
Current measurement techniques for compliance monitoring offine particles by Robert Gehrig..............................................................63
Aerosol Measurements Within the WMO Global AtmosphereWatch Programme: Providing Data Related to Climate Forcingand Air Quality by U. Baltensperger......................................................67
EUROTRAC-2 subproject AEROSOL Composition/sizeevolution of the secondary aerosol An introduction byHarry ten Brink ........................................................................................71
The regional aerosol transport and dynamics model MADE –applications to Europe by I.J. Ackermann, H. Hass andB. Schell...................................................................................................75
Concentrations of Primary Particulate Matter over Europe byH.M. ApSimon & T. Gonzalez del Campo..............................................81
EMEP/CCC-Report 9/2000
6
Results of the heavy metal measurements at the EMEP Stationsin Latvia by D. Bahareva, I. Lyulko and M. Frolova .............................87
Aerosol Measurements: Providing the Data for theQuantification of Aerosol Impact on Climate byU. Baltensperger, E. Weingartner, S. Henning, S. Nyeki ........................95
Modelling the formation and long range transport of secondaryparticulate matter by Dick Derwent .....................................................101
Cost-efficient measurements of PM10 using simple samplingequipment by Martin Ferm, Kjell Peterson, Per-Arne Svanbergand Gun Lövblad ...................................................................................105
Chemical composition of PM2.5 and PM10 at Birkenes byJan Erik Hanssen, Willy Maenhaut and Arne Semb..............................111
Application of Receptor Models for Source Apportionment ofPM10 and PM2.5 in Switzerland by Ch. Hueglin, W. Devos,R. Gehrig, J. Kobler, W.A. Stahel, M. Wolbers ....................................117
Trace element air pollution monitoring studies in Slovenia byR. Ja• imovi• , Z. Jeran, B. Smodiš ......................................................121
Mathematical Modelling of Turbulent Reacting Plumes –Modelling of Particulate Matter Processes by Mihalis Lazaridis ........127
Special Aerosol Characterization Studies in Urban, Rural, andRemote Regions in Canada by Shao-Meng Li, Jeff Brook,Richard Leaitch, Pierrette Blanchard, Ann Marie Macdonald,Amy Leithead, Desiree Toom-Sauntry ..................................................131
Modelling Primary and Secondary Particulates using the NAMELong Range Dispersion Model by A.L. Malcolm andA.J. Manning .........................................................................................139
Mass Median Diameters (MMD’s) of Aerosol Substances byJürgen Müller.........................................................................................143
A new beta gauge monitor for the measurement of PM10 airconcentration by Cinzia Perrino, Antonio Febo, Ivo Allegrini............147
Ionic content of atmospheric PM2.5 sampled by the diffusiondenuder/filter pack technique by Cinzia Perrino .................................153
Natural and anthropogenic sources of PM10 and PM2.5 in Spain.Incidence on the new PM10 limit values exceedances byF. Plana, A. Alastuey, B. Artíñano, D. Alonso, S. Rodríguez,P. Salvador, E. Mantilla, P.P. Ricote, A. López-Soler andX. Querol ...............................................................................................157
Influence of the anthropogenic sources on the air quality inLjubljana region by M.Puc, M.Budnar ................................................165
Measurement of particles at the monitoring station of the JointResearch Centre, Ispra, 1988 - 1998 by Diana Rembges,Laure Dutaur, Claude Brun and Wilfried Leyendecker .........................171

EMEP/CCC-Report 9/2000
7
Comparison of continuous particulate monitors byJaroslav Šantroch ...................................................................................173
Analyses of results obtained with High volume aerosol samplerand Andersen low volume sampler in capital city of Macedoniaby Radmila Simeva ...............................................................................175
Preliminary model investigations of the fine particlesdistribution in the Northern Hemisphere by M. Sofiev .......................179
Receptor modelling of PM10 concentrations at a site in CentralLondon by John R. Stedman, Emma Linehan, Beth Conlan ...............185
Number concentration and chemical composition of fineparticles measured at EMEP station Preila by V. Ulevi• ius,D. Šopauskien• , G. Mordas, K. • eromskien• ,S. Stap• inskait• ...................................................................................191
Seasonal and diurnal variation of aerosol size distributions (10 <D <750 nm) at a high-alpine site (Jungfraujoch 3580 m asi) byE. Weingartner, S. Nyeki, S. Henning and U. Baltensperger.................195
Measurements of Airborne Particle Mass, Number and SizeDistribution at Urban Sites in the United Kingdom byJianxin Yin, Roy M. Harrison, David Mark, Jeff Booker,Steve Moorcroft .....................................................................................201

EMEP/CCC-Report 9/2000
8
EMEP/CCC-Report 9/2000
9
EMEP-WMO Workshop on fine particles – emissions, modellingand measurements
Interlaken, Switzerland22–25 November 1999
1. Introduction
The EMEP-WMO Workshop on fine particles – emissions, modelling andmeasurements took place from 22–25 November 1999 in Interlaken, Switzerland.The Workshop was organized by the Swiss Agency for the Environment, Forestand Landscape (BUWAL) and Swiss Federal Laboratories for Materials Testingand Research (EMPA).
The Workshop was attended by 69 participants form Austria, Belgium, Canada,Croatia, Cyprus, Czech Republic, Estonia, Finland, France, Germany, Italy,Latvia, Lithuania, Netherlands, Norway, Russian Federation, Slovenia, Spain,Sweden, Switzerland and United Kingdom.
The following international organizations and centres where present: EuropeanCommission, Joint Research Centre of the European Commission, UN-ECE,World Health Organization, World Meteorological Organization, Chemical Co-ordinating Centre of EMEP, Meteorological Synthesizing Centre East of EMEPand Meteorological Synthesizing Centre West of EMEP.
The Workshop was organized in three main parts: Oral presentations, postersessions and discussions in Working Groups.
Twelve oral presentations were given as an introduction to the discussions in theWorking Groups. 25 posters were presented during two poster sessions. ThreeWorking Groups covering emission, modelling and measurements werediscussing in parallel sessions before presenting their conclusions andrecommendations in the plenary.
In Appendix C the papers available for the editors are printed. Some of the paperswere not available in electronic form, consequently some of the figures are not ofa good quality.

EMEP/CCC-Report 9/2000
10
2. Scope of the Workshop
There is a growing concern relating to the health effects of fine particles. Recentstudies have demonstrated consistent associations between concentrations of fineparticles (PM10 and PM2.5) and adverse effects on human health (respiratorysymptoms, morbidity and mortality) at concentrations commonly encountered inEurope and North America.
A significant fraction of the ambient concentrations of fine particles in Europe ismade up from the so-called secondary aerosol, i.e. particles formed byatmospheric reactions involving long-range transboundary pollutants, primarilyoxides of sulphur and nitrogen as well as ammonia.
Consequently, this issue is now placed in the work programme of the Conventionon Long Range Transboundary Air Pollution, which has established a joint TaskForce with the World Health Organization to deal with the topic. The WMOScientific Advisory Group on Aerosols is addressing the issue of aerosolmeasurements on the global scale. Moreover, EMEP will provide furtherinformation on the transboundary aspects of this problem. In this context, theEMEP Steering Body in co-sponsorship with the WMO has welcomed thearranging of an international scientific workshop, with the aim to carefully reviewemission inventories, modelling, and measurement of fine particles. A mainobjective of the workshop is to provide recommendations for future EMEP/WMOactivities on this issue.
The workshop will include invited introductory plenary presentations of themain topics dealt with and poster presentations. Ample time will be devoted toexpert discussions both in working groups and in the plenary in the following3 areas :
• Emissions: For most countries there is a lack of quantitative data on emissionsof primary particulate matter. More or less rough estimates of the emissionsfrom the main sources, such as the combustion of solid fuels, road and off-road transport, and industrial processes have been carried out in somecountries. Suitable approaches for improving emission inventories (andemission estimates) and the submittal and archiving of the emission datatherefore need to be discussed and developed. This group will e.g. address thefollowing questions:
− Are regional emission inventories of primary particles available andrequired? If that is the case, for which components are they available?
− An example of emission inventory for primary particles covering thewhole of Europe is the one estimated by TNO. Can this inventory be usedas a first estimate? Would it be useful to submit the TNO data to theParties to be checked and authorized by the countries for their validity?
− Is there an useful correlation between primary particle emissions withother already registered pollutants (e.g. NOx)?

EMEP/CCC-Report 9/2000
11
− How to improve the EMEP/CORINAIR emission inventory guidebook forthe inclusion of particulate matter?
− What emission estimation procedures can be recommended?
− Which particle sizes should be distinguished and reported?
− What information relating to chemical composition of primary particles isplausible to report?
− To what extent is it possible (and/or necessary) to provide emission data offine particles with their chemical speciation?
• Modelling: A thorough review of the general state of the art of modelling thelong range transport of fine particulates is needed in order to identify usefulapproaches for the purposes of EMEP and WMO. Present EMEP models forthe acidifying pollutants have already been used to estimate the concentrationof particles arising from gaseous emissions of SO2, NOx and NH3. Thesesecondary particles generally constitute a significant part of the fine aerosol(PM2.5). This group will e.g. address the following questions:
− Which models covering Europe are actually available and what is theirusefulness for the EMEP purposes? Should EMEP develop a new model oris it enough to modify/improve existing models?
− What are the main input data required for the modelling exercise?
− Which measuring frequency (daily values or weekly means or other) arerequired for the model validation? Which type of data series are required(pilot measuring campaigns or rather daily values over a long time periodor annual average)?
− How can we validate or evaluate the performance of the models(concentrations of PM2.5)? Does the modellers need information relating tothe chemical composition of the measured PM?
− Which level of detail relating to particle size distribution is needed forcomparison with the model results?
− Long-range transboundary transport is clearly identified for fine particlesbelow 2.5 µm. Air quality guidelines are established on the basis ofepidemiological studies for PM10. How to fill the gap between the modelsresults and the measuring data requirements?
− What is the expected impact of existing protocols on the concentrations ofsecondary particles?
− Is it conceivable to compare the performance of the available model resultswith the measured data in several sites in Europe (mainly in urban areas)?
− What about the representativeness of the measuring stations (mainlylocated in urban areas) for the purpose of model validation ?
• Measurements: Measuring ambient air concentrations of suspended particlesis a difficult task. The currently used methods (manual gravimetric procedures,

EMEP/CCC-Report 9/2000
12
automatic monitors etc.) all have their drawbacks and artefacts and, therefore,can give different results. Suitable approaches how to measure fineparticulates for the EMEP needs have to be discussed. In most Europeancountries monitoring activities of PM10 (but also PM2.5) have already startedor will start soon in order to comply with the requirements of the first EUdaughter directive on air quality, which is expected to be adopted shortly. Thisgroup will e.g. address the following questions:
− Which particle size should be measured (PM10, PM2.5 or other)? Whichmeasurement method(s) should we recommend (manual gravimetry ormonitors)? Can we use CEN or US standard methods or are other methodsmore appropriate for EMEP needs?
− Should a small number of "super stations" provide in addition moresophisticated particle information, including chemical speciation and/orparticle size distributions?
− Which time resolution (daily, weekly or other) is needed for the EMEPpurpose and required from the health survey community?
− As a starting phase, should EMEP launch a pilot measuring campaign in alimited number of EMEP stations or in other sites (in urban areas forexample)? Which measurements should be made (PM, chemicalcomposition)?
− Can we use correlations with other available pollutant data like blacksmoke, nitrogen oxides or carbon monoxide to get useful information?
− What is the available experience from the various countries?
− Are information relating to the chemical composition of PM needed andavailable for the validation of the models?
− What about the representativeness of the EMEP measuring stationsconcerning PM exposure of the population ?

EMEP/CCC-Report 9/2000
13
3. Conclusions and recommendations1/
3.1 Conclusions and recommendations from Working group on emissions
1. The sessional working group on emissions was attended by about17 participants, both users and providers of inventories, representing modelling,regulatory, government and industry interests. The working group explored andprioritized the issues associated with establishing fine particulate inventoriesbefore 2003. The following items were identified as needing special attention:
− The physical and chemical characteristics of particles;− Source apportionment;− Data quality and confidence;− Speed of delivery.
2. To meet any future reporting requirements under the Convention andprovide input for the CORINAIR/EMEP Atmospheric Emission InventoryGuidebook, Parties should prepare an interim emission inventory by the end of2000. A formal system will be required by 2001 for reporting fine particleemissions. 1995 would be a suitable base year from a technical point of view.
3. The inventory of the Netherlands Organization for Applied ScientificResearch (TNO) for 1990 could be used as a basis for the interim emissioninventory. It should be revised and updated during 2000. The Executive Bodyshould include this activity in its 2000 work-plan2/. The revision should beundertaken by a contractor and funding should be earmarked for this purpose. Thework should be supervised by Parties to the Convention. This inventory will besupplemented by national information where available.
4. From 2001 onwards the Executive Body should include establishing afine particulate emission inventory in its annual work-plan. This will requirestrong involvement from the Task Force on Emission Inventories and Projections.PM10 and PM2.5, heavy metal, elemental/organic carbon and mineral dust datashould be reported at a minimum at SNAP level 2. Also, the reporting instructionsshould be revised to reflect this. In addition, the SNAP coding and any linkingstatistics should be extended and the Guidebook revised accordingly.
5. The experience of the European Environment Agency is highly relevantto the establishment of high-quality fine particulate inventories. The EuropeanCommunity expressed its strong interest in this work and it was agreed that it,
1/ As adopted by the participants and finalized by the ECE secretariat in consultation with
the representatives of the host country, Switzerland and the Chairman of the EMEP SteeringBody. The conclusions and recommendations will be submitted to the EMEP Steering Body at itstwenty-fourth session (4–6 September 2000).
2/ At its seventeenth session (29 November-3 December 1999), the Executive Body tookthe action proposed in paragraphs 2 and 3 into account when finalizing its work-plan for 2000. Inthis context, it also agreed that a decision on including a fine particulate emission inventory in theannual work-plans from 2001 onwards would be taken at its eighteenth session, following the finaladvice of the EMEP Steering Body.

EMEP/CCC-Report 9/2000
14
possibly through the European Environment Agency, should be invited, tocontinue with its valuable contribution to the EMEP programme.
6. Inventory quality management should be introduced as a prerequisite fordata validation and inventory verification. Guidance on the quality management ofthe inventories should be included in the Guidebook.
7. The working group recognized the value and relevance of work on fineparticulate emissions by a number of other organizations. Wherever possibleEMEP should cooperate with these groups to avoid duplication and to promoteharmonisation. In particular, contact should be maintained with the fine particulateprogramme of the United States Environment Protection Agency (US/EPA) andthe inventory best practice programme of the Intergovernmental Panel on ClimateChange (IPCC).
8. Assistance should be provided to characterize temporal variations ofemissions through a formal liaison with the European Experiment on theTransport and Transformation of Environmentally Relevant Trace Constituents inthe Troposphere over Europe (EUROTRAC) via the GENEMIS programme.
3.2 Conclusions and recommendations from Working group onmeasurements
9. The sessional working group on measurements was attended by about30 participants, mainly measurement experts involved in EMEP and in othernational and international research programmes. They explored the possibilitiesfor introducing measurements of fine particulates into the future EMEPmeasurement programme, bearing in mind:
− The needs of the data users, in particular the modellers;− The current state of measurement techniques for sampling and
analysis;− The limitations of resources at most EMEP sites;− The possible synergistic effects of cooperation with other scientific
programmes.
10. EMEP should give first priority to PM10 measurements. For this purposethe gravimetric method is the preferred method, particularly because the filtersallow subsequent chemical analysis for quantification of different compounds.Monitors are acceptable if they have been shown to deliver equivalent results forthe specific site and for all seasons.
11. EMEP sites should also determine secondary inorganic particulatematter, i.e. ammonium sulphate and ammonium nitrate, as well as other water-soluble ions when these make up a significant part of PM10 mass.
12. Measurements of particles with an aerodynamic diameter less than 2.5 or1 µm should be carried out in the near future when the definition of the Europeanreference method is in place.
EMEP/CCC-Report 9/2000
15
13. For chemical characterization, determination of elemental and organiccarbon is highly desirable. The subsequent determination of organic and elementalcarbon by thermodesorption and oxidation is subject to artefacts, and care has tobe taken to avoid results that are not comparable. There are also sampling artefactsrelated to organic compounds. EMEP will need to consult with other bodies onthese issues. If they can be resolved, centralized laboratories for the determinationof elemental and organic carbon should be established for the analysis of samplesfrom EMEP sites.
14. More detailed size fractionated chemical speciation would be desirableand should be done in the context of scientific projects.
15. “Superstations” should be set up together with other scientificorganizations and programmes. These could be used for a number of chemical andphysical measurements that go beyond the scope of the “normal” EMEP site, e.g.for determination of some of the organic compounds, size distribution, detailedsize fractionated chemical speciation, optical properties, water uptake, cloudcondensation nuclei, vertical distribution and better time resolution (1 hour) forcertain parameters.
16. EMEP welcomes closer collaboration with other international initiatives,such as the Global Atmospheric Watch (GAW) of the World MeteorologicalOrganization (WMO) and EUROTRAC, as well as national programmes. Thiscollaboration would concern both measurements and modelling, in particular theEUROTRAC subproject AEROSOL. It would accelerate the exchange of scienti-fic and technical information and improve understanding between EUROTRACand EMEP.
17. EMEP and WMO see a large potential for collaboration in the fineparticulate programme. Many measurement sites in Europe are already bothEMEP and GAW sites. This could still be extended. In particular, global GAWstations could possibly be designated as “superstations” within EMEP (see para.15 above). It is expected that the newly formed Task Force on Measurements andModelling, which is co-chaired by Austria and WMO, will be best suited toaddress this task. These joint activities at common sites will help to produce morecomprehensive results.
18. The EMEP/CCC website (http://www.emep.int) should be used to shareinformation on ongoing and planned research and intercomparison of measure-ment techniques.
3.3 Conclusions and recommendations from Working group on modelling
19. The sessional working group on modelling was attended by about15 participants, mainly modelling experts involved in EMEP and in other nationaland international research programmes. The working group discussed the mainobjectives for modelling particulate matter and set requirements for:
− The development of chemical and physical model parametrization;− The necessary input emission data;

EMEP/CCC-Report 9/2000
16
− The necessary measurement data for model validation and modeldevelopment.
20. The working group appreciated the MSC-W proposal to couple theEulerian photo-oxidant model with an aerosol model and encouraged the ongoingcollaboration between the Meteorological Synthesizing Centre-West (MSC-W),the Chemical Coordinating Centre (CCC), the University of Helsinki, theUniversity of Stockholm and the Finnish Meteorological Institute, in the frame-work of the Nordic Research Council (NMR). This modelling effort is likely toproduce preliminary initial results on the long-range transport of particulate matterin the EMEP area by the beginning of 2001.
21. The working group requested MSC-W to investigate cloud effects, gas-aerosol interaction through evaporation and condensation processes, sea-saltchemistry and resuspension processes, already at the initial model developmentstages.
22. EMEP welcomes cooperation with national and international researchprogrammes. In particular, areas for cooperation were identified, both in terms ofprocess studies and suggestions for parametrization schemes, model inter-comparisons and testing of different model approaches with national experts fromthe United Kingdom and the research group at Ford Aachen.
23. As a first priority, the particulate matter model used by EMEP shouldprovide daily values of PM10 and PMx and be able to characterize the chemicalspeciation of the aerosol. Concerning the size distribution of the aerosol, themodel approach should be flexible enough to allow for any changes in the rangesdefined by legislation. Monitoring sites should include daily measurements ofPM10 and PM2.5 and chemical characterization of secondary inorganic aerosolsand other water-soluble ions.
24. Chemical speciation of particulate matter is important for source alloca-tion and it is recommended that secondary inorganic particulate matter should beseparated from the other components of particulate mass. The quantification ofelemental carbon and organic carbon is also desirable, as these represent the majorpart of the primary emissions of particulate matter. In view of the technicaldifficulties in the separate determination of elemental carbon and organic carbon,centralized laboratory facilities should be established to ensure compatible data.
25. A minimum of 5 to 10 sites should be selected to carry out detailedchemical speciation and chemical mass balance of measured PM10 and eventuallyalso PM2.5 or PM1. These sites should be part of the basic EMEP measurementnetwork, or other related monitoring activities, and should cover the followingareas: southern Europe (Saharian dust, biomass burning), eastern Europe (biomassburning), central Europe (anthropogenic), marine and remote areas. CCC, incooperation with WMO, should select them.

EMEP/CCC-Report 9/2000
17
26. In addition, campaign sites and “superstations” (see para. 15 above)related to the specific research programmes would be specially useful for thetesting of the model parametrization.
27. The working group also considered the requirements for emissionsinventories which were further considered by the working group on emissions.Natural and biogenic emissions and resuspended material should be directlytreated by models in collaboration with emission experts.
28. Work should be initiated within the Task Force on Integrated AssessmentModelling to investigate, in collaboration with the Working Group on Effects andthe World Health Organization, the robustness of different statistics that can beused in atmospheric modelling as indicators of the effect of particulate matter onhuman health.

EMEP/CCC-Report 9/2000
18

EMEP/CCC-Report 9/2000
19
Appendix A
List of participants
EMEP/WMO Workshop onfine particles – emissions, modelling and
measurements

EMEP/CCC-Report 9/2000
20

EMEP/CCC-Report 9/2000
21
AUSTRIAMarkus AmannIIASA – International Institute for AppliedSystems AnalysisSchlossplatz 1A-2361 LAXENBURG
Phone: +43 2236 807 432Fax: +43 2236 807 533E-mail: [email protected]
Marina FröhlichUmweltbundesamtSpittelauer Laende 5
A-1080 WIEN
Phone: +431 31304 5862Fax: +431 31304 5800E-mail: [email protected]
Wolfgang SchöppIIASA – International Institute for AppliedSystems AnalysisSchlossplatz 1A-2361 LAXENBURG
Phone: +43 2236 807 309Fax: +43 2236 807 533E-mail: [email protected]
BELGIUMMirka Van der ElstFlemish GovernementE. Jacqmainlaan 156-8
B-1000 BRUSSELS
Phone: +32 2553 7876Fax: +32 2553 7695E-mail: [email protected]
CANADAShao-Meng LiAtmospheric Environment Service,Environment Canada4905 Dufferin St.DownsviewONTARIO M3H 5T4
Phone: 416 739-5731Fax: 416 739-5708E-mail: [email protected]
CROATIAIvan BeslicInstutute for Medical Research andOccupational HealthKsaverska c. 210000 ZAGREB
Phone: +385 1 4673 188Fax: +385 1 4673 303E-mail: [email protected]
CYPRUSSavvas KleanthousDepartment of Labour, Ministry of Labourand Social Insurance12, Apellis Str1480 NICOSIA
Phone: +357 2 300333Fax: +357 2 663788E-mail: [email protected]
CZECH REPUBLICJaroslav SantrochCzech Hydrometeorological InstituteNa Sabatce 1714306 PRAHA
Phone: ++4202 40167 19Fax: ++4202 40108 00E-mail: [email protected]
ESTONIAMargus KörtEstonian Environmental Research CentreMarja 4DTALLINN 10617
Phone: 372 6112 903Fax: 372 6112 901E-mail: [email protected]
EMEP/CCC-Report 9/2000
22
FINLANDLeena KangasFinnish Meteorological InstituteSahaajankatu 20EFIN-00810 Helsinki (Finland)Phone: +358 9 19291Fax: +358 9 1929 5403E-mail: [email protected]
FRANCEJean Pierre FontelleCITEPA10, rue du Faubourg Poissionère
F-75010 PARIS
Phone: +331 4483 6883Fax: +331 4022 0483E-mail: [email protected]
Guy LandrieuINERIS, National Institute for IndustrialEnvironment and RisksBP No2, Parc AlataF-60550 VERNEUIL EN HALATTE
Phone: +333 4455 6392Fax: +333 4455 6899E-mail: [email protected]
Isabelle LecuyerEDF /R&D Division6 quai Watier
F-78401 CHATOU
Phone: +33 1 30 87 78 16Fax: +33 1 30 87 81 40E-mail: [email protected]
Luc Musson-GenonEDF-Division, R et D EnvironmentDepartment6, quai WatierF-78401 CHATOU
Phone: 01 308781 18Fax: 01 308783 34E-mail: [email protected]
Emmanuel RiviereCITEPA10, rue du Faubourg PoissionèreF-75010 PARIS
Phone: +331 4483 6883Fax: +331 4022 0483E-mail: [email protected]
GERMANYIngmar AckermannFord Research Centre AachenSüsterfeldstr. 200D-52072 AACHEN
Phone: +49 241 9421205Fax: +49 241 9421304E-mail: [email protected]
Jost HeintzenbergInstitute for Tropospheric ResearchPermoserstr. 15D-04318 LEIPZIG
Phone: +49 341 235 2321Fax: +49 341 235 2141E-mail: [email protected]
Wolfgang JunkermannFraunhofer Institut für atmosphärischeUmweltforschungGARMISCH-PARTENKIRCHEN
Phone: +49 8821 183180Fax: +49 8821 73573E-mail: [email protected]
Jürgen MüllerUmweltbundesamtPaul-Ehrlich-Str. 29D-63225 LANGEN
Phone: 06103 704134Fax: 06103 704147E-mail:

EMEP/CCC-Report 9/2000
23
Markus WallaschUmweltbundesamtPaul-Ehrlich-Str. 29D-63225 Langen (Germany)Phone: +49 6103 704 163Fax: +49 6103 704 147E-mail: [email protected]
ITALYCinzia PerrinoC.N.R. Institute of Atmospheric PollutionVia Salaria km 29,300; CP10I-00016 MONTEROTONDO STAZIONE(ROMA)
Phone: +3906 90672263Fax: +3906 90672660E-mail: [email protected]
LATVIADiana BaharevaLatvian Hydrometeorol. Agency165, Maskavas Str.LV-1019 RIGA
Phone: 371 7032643Fax: 371 71 45 154E-mail: [email protected]
LITHUANIAVidmantas UleviciusInstutute of PhysicsA. Gostauto Str. 12LT-2600 VILNIUS
Phone: 3702 641 827Fax: 3702 321 975E-mail: [email protected]
NETHERLANDSJan BerdowskiTNO MEPPO Box 342NL-7300 APELDOORN
Phone: +31 55 549 31 71Fax: +31 55 549 32 52E-mail: [email protected]
Henk BloemenRIVM Air Research LaboratoryP.O. Box 1NL-3720 BA BILTHOVEN
Phone: +3130 2742389Fax: +3130 2287531E-mail: [email protected]
Peter MergelsbergENCI-Mastricht Bv.Lage kanaal dijk 115NL-6212 NA MAASTRICHT
Phone: +31 43 3297 508Fax: +31 43 3297 470E-mail:
Harry ten BrinkECNP.O. Box 1NL-1755 ZG PETTEN
Phone: +31 224 564568Fax: +31 224 563488E-mail: [email protected]
Pieter van der MostInspectorate for Environmental ProtectionP.O. Box 30945, IPC 680DEN HAAG
Phone: +31 70 3394606Fax: +31 70 3391908E-mail: [email protected]
EMEP/CCC-Report 9/2000
24
SLOVENIARadojko JacimovicJ. Stefan Institute, Laboratory forRadiochemistryJamova 39, p.p. 3000SI-1001 LJUBLJANA
Phone: +386 61 1885 353Fax: +386 61 1885 346E-mail: [email protected]
Brigita JesenovecHydrometeorological Institute of SloveniaVojkova 1/b
SI-1000 LJUBLIANA
Phone: +386 61 327 461Fax: +386 61 133 1396E-mail: [email protected]
Miha D. PucJ. Stefan Institute, Microanalytical CentreJamova 39, p.p. 3000SI-1001 LJUBLJANA
Phone: +386 61 188 5261Fax: +386 61 123 2120E-mail: [email protected]
SPAINDiana AlonsoCIEMAT Research CentreAv. Complutense 2228040 MADRID
Phone: 91 3466220Fax: 91 3466121E-mail: [email protected]
Marta Martinez TrepatMCV S.A.Crta. N-II Km, 575. Cami de Can DolcetCOLLBATO (BARCELONA)
Phone: 93 777 0500Fax: 93 777 0550E-mail: [email protected]
SWEDENMartin FermIVL Swedish Environmental ResearchInstitute Ltd.P.O. Box 47086SE-40258 GOTHENBURG
Phone: +46 31 725 6224Fax: +46 31 725 6290E-mail: [email protected]
Karin SjöbergIVL Swedish Environmental ResearchInstitute Ltd.P.O. Box 47086SE-40258 GOTHENBURG
Phone: +46 31 725 6245Fax: +46 31 725 6290E-mail: [email protected]
SWITZERLANDHugo AmackerSwiss Agency for the Environment, Forestsand LandscapeAir Pollution Control DivisionCH-3003 BERN
Phone: +4131 322 80 82Fax: +4131 324 0137E-mail: [email protected]
Richard BallamanSwiss Agency for the Environment, Forestsand LandscapeAir Pollution Control DivisionCH-3003 BERN
Phone: +4131 322 64 96Fax: +4131 324 0137E-mail: [email protected]

EMEP/CCC-Report 9/2000
25
Urs BaltenspergerPaul Scherrer Institute
CH-5232 VILLIGEN PSI
Phone: +4156 310 2408Fax: +4156 310 4435E-mail: [email protected]
Paul FilligerSwiss Agency for the Environment, Forestsand LandscapeAir Pollution Control DivisionCH-3003 BERN
Phone: +4131 322 68 58Fax: +4131 324 0137E-mail: [email protected]
Jann ForrerSwiss Federal Laboratories for MaterialsTesting and ResearchÜberlandstr. 129CH-8600 DÜBENDORF
Phone: +411 823 5511Fax: +411 821 6244E-mail: [email protected]
Robert GehrigSwiss Federal Laboratories for MaterialsTesting and ResearchÜberlandstr. 129CH-8600 DÜBENDORF
Phone: +411 823 4234Fax: +411 821 6244E-mail: [email protected]
Peter HoferSwiss Federal Laboratories for MaterialsTesting and ResearchÜberlandstr. 129CH-8600 DÜBENDORF
Phone: +411 823 4134Fax: +411 821 6244E-mail: [email protected]
Christoph HüglinSwiss Federal Laboratories for MaterialsTesting and ResearchÜberlandstr. 129CH-8600 DÜBENDORF
Phone: +411 823 5511Fax: +411 821 6244E-mail: [email protected]
Urs NyffelerSwiss Agency for the Environment, Forestsand LandscapeAir Pollution Control DivisionCH-3003 BERN
Phone: +4131 322 69 63Fax: +4131 324 0137E-mail: [email protected]
Stefan ReimannSwiss Federal Laboratories for MaterialsTesting and ResearchÜberlandstr. 129CH-8600 DÜBENDORF
Phone: +411 823 5511Fax: +411 821 6244E-mail: [email protected]
Ernest WeingartnerPaul Scherrer Institute5232 VILLIGEN PSI
Phone: 056 310 2405Fax: 056 310 4435E-mail: [email protected]
UNITED KINGDOMHelen ApsimonImperial College, Air Poll. Group, T.H.Huxley SchoolPrince Consort Rd.SW1 2A2 LONDON
Phone: +44171 594 9292Fax: +44171 594 9266E-mail: [email protected]
Richard DerwentMeteorological OfficeLondon Road, Bracknell
RG12 2SZ BERKSHIRE
Phone: +44 1344 854624Fax: +44 1344 854493E-mail: [email protected]

EMEP/CCC-Report 9/2000
26
Roy HarrisonEnvironmental Health, Institute of Public andEnvironmental HealthUniversity of BirminghamPublic Health Building, EdgbastonB15 2TT BIRMINGHAM
Phone: 0044 121 414 3494Fax: 0044 121 414 3709E-mail: [email protected]
John HoskinsIndependant consultant27 Furzefield Crescent
RH2 7HQ REIGATE
Phone: +44 1737 221360Fax: +44 1737 221588E-mail: [email protected]
Emma LinehanAEA Technology EnvironmentE5 Culham, AbingdonOX14 3DB OXON
Phone: 01235 463674Fax: 01235 463011E-mail: [email protected]
Alison MalcolmUK Met. Office, RM 152London Rd.RG12 2SZ BRACKNELL, BERKS.
Phone: 01344 854 223Fax: 01344 854 493E-mail: [email protected]
John PearsonCEFIC European Chemical Industry2 Badgers Close, Christleton
CH3 7BR CHESTER
Phone: +44 1244 335101Fax: +44 1244 336389E-mail: [email protected]
Martin WilliamsDepartment of the Environment, the Transportand the Regions, Head of Technical Policy,Air and Environment;Ashdown House, 123 Victoria StreetSW1E 6DE LONDON
Phone: +44 171 890 6280Fax: +44 171 890 6290E-mail: [email protected]
Michael WoodfieldAEA TechnologyCulham, AbingdonOX14 3DB OXFORDSHIRE
Phone: +44 123546 3195Fax: +44 123546 3038E-mail: [email protected]
Chemical Co-ordinating CentreKevin BarrettNorwegian Institute for Air ResearchP.O. Box 100N-2027 KJELLER (Norway)
Phone: +47 6389 8245Fax: +47 6389 8050E-mail: [email protected]
Jan Erik HanssenNorwegian Institute for Air ResearchP.O. Box 100N-2027 KJELLER (Norway)
Phone: +47 6389 8000Fax: +47 6389 8050E-mail: [email protected]
Mihalis LazaridisNorwegian Institute for Air ResearchP.O. Box 100N-2027 KJELLER (Norway)
Phone: +47 6389 8035Fax: +47 6389 8050E-mail: [email protected]
Jan SchaugNorwegian Institute for Air ResearchP.O. Box 100N-2027 KJELLER (Norway)
Phone: +47 6389 8156Fax: +47 6389 8050E-mail: [email protected]

EMEP/CCC-Report 9/2000
27
Arne SembNorwegian Institute for Air ResearchP.O. Box 100N-2027 KJELLER (Norway)
Phone: +47 6389 8000Fax: +47 6389 8050E-mail: [email protected]
Meteorological Sythesizing Centre West(MSC-W)Leonor TarrasonNorwegian Meteorological InstituteP.O. Box 43, BlinderenN-0313 OSLO (Norway)
Phone: +47 2296 3300Fax: +47 2269 6355E-mail: [email protected]
Svetlana TsyroNorwegian Meteorological InstituteP.O. Box 43, BlinderenN-0313 OSLO (Norway)
Phone: +47 2296 3301Fax: +47 2269 6355E-mail: [email protected]
Meteorological Sythesizing Centre East(MSC-E)Alexei GusevEMEP/MSC-EKedrova str. 8-1117292 MOSCOW (Russia)
Phone: 007095 124 4758Fax: 007095 310 7093E-mail: [email protected]
Alexej RyaboshapkoEMEP/MSC-EKedrova str. 8-1117292 MOSCOW (Russia)
Phone: 007095 125 2409Fax: 007095 310 7093E-mail: [email protected]
World Health OrganizationMichal KrzyzanowskiWHO, European Centre for Environment andHealthA. van Leeuwenhoeklaan 9, P.O. Box 10NL-3730 AA DE BILT (Netherlands)
Phone: 0031 302295 323Fax: 0031 302294 120E-mail: [email protected]
World Meteorological OrganizationLiisa JalkanenWMO – Environment Division7 bis, av. de la PaixCase postale No 2300CH-1211 GENEVA (Switzerland)
Phone: +4122 730 8587Fax: +4122 730 8049E-mail: [email protected]
European CommissionLynne EdwardsEuropean Commission, DG XI200, Rue de la Loi
B-1049 BRUSSELS (Belgium)
Phone: +32 2296 8698Fax: +32 2299 1069E-mail: [email protected]
Joint Research Centre of the EuropeanCommissionDiana RembgesJRC IspraEnvironment Institute – Air QualityT.P. 290I-21020 ISPRA (VARESE) (Italy)
Phone: +39 0332 785953Fax: +39 0332 785924E-mail: [email protected]

EMEP/CCC-Report 9/2000
28
UN/ECEEija LummeUN/ECE – Environment and HumanSettlements DivisionPalais des Nations1211 GENEVA (Switzerland)
Phone: +41 22 9172650Fax: +41 22 9070107E-mail: [email protected]

EMEP/CCC-Report 9/2000
29
Appendix B
Agenda

EMEP/CCC-Report 9/2000
30

EMEP/CCC-Report 9/2000
31
EMEP/WMO Workshop on fine particles – emissions, modellingand measurements
22–25 November 1999Interlaken, Switzerland
Organized bySwiss Agency for the Environment, Forests and Landscape
Swiss Federal Laboratories for Materials Testing and Researchin co-operation with
Chemical Co-ordination Centre (CCC)Meteorological Synthesizing Centre West (MSC-W)
World Meteorological Organization (WMO)
Programme
Sunday, 21 November
18.00 Early registration19.00 Dinner
Monday, 22 November
08.30 Registration
Plenary session Chair: U. Nyffeler
09.00 – 09.20 Opening of the workshop U. NyffelerAim of the workshop
09.20 – 09.30 Fine particles, a new pollutant under E. Lumme/the UN/ECE Geneva convention? M. Williams
09.30 – 09.40 Activities on fine particles within L. JalkanenWMO/GAW
09.40 – 10.00 Plans of the European Commission L. Edwardsregarding particulate matter
10.00 - 10.30 Break
10.30 – 11.00 Health aspects of fine particles M. Krzyzanowski
11.00 – 11.30 Emission inventories of primary fine particles M. Woodfield
11.30 – 12.00 European PM10 and PM2.5 emission inventory J. Berdowskifrom anthropogenic sources

EMEP/CCC-Report 9/2000
32
12.00 – 12.30 Long-range transport modelling of fine particles L. Tarrason
12.30 Lunch
14.00 – 14.30 Current measurement techniques for compliance R. Gehrigmonitoring of fine particles
14.30 – 15.00 Advanced measurement techniques J. Heintzenberg
15.00 – 15.30 Aerosol measurements within WMO/GAW U. BaltenspergerProviding data related to climate forcing andair quality
15.30 – 16.00 Break
16.00 – 16.30 Introduction to the activities on fine particles H.M. ten Brinkwithin EUROTRAC
16.30 – 18.00 Poster session (First part)
19.0 Dinner
Tuesday, 23 November
09.00 – 09.20 Introduction to the workshops (Plenary) R. Gehrig
Chairpersons:09.30 – 12.15 Discussions in the working groups A. Semb (Measurements)
(Individual break) M. Woodfield (Emissions)L. Tarrason (Modelling)
12.30 LunchChair: J. Schaug
14.00 – 15.00 Plenary presentation of the status of work WG-Rapporteurs
15.00 – 16.00 Plenary discussion of the status of work
16.00 – 16.30 Break
16.30 – 18.00 Poster session (Second part)
19.00 Dinner
Wednesday, 24 November
09.00 – 10.30 Discussions in the working groups includingpreparation of the draft conclusions andrecommendations
10.30 – 11.00 Break

EMEP/CCC-Report 9/2000
33
Chair: R. Ballaman11.00 – 12.15 Plenary presentation and discussion of the
draft conclusions and recommendations of WG-Rapporteursthe working groups
12.30 Lunch
14.00 Technical excursion
19.30 Dinner
Thursday, 25 November
Final plenary session Chair: M. Williams
09.00 – 10.30 Final discussion and adoption of theconclusions and recommendations ofthe workshop
Closing of the workshop

EMEP/CCC-Report 9/2000
34

EMEP/CCC-Report 9/2000
35
Appendix C
Papers and posters presented

EMEP/CCC-Report 9/2000
36

EMEP/CCC-Report 9/2000
37
Opening of the workshop / Aim of the workshop
by
Urs P. Nyffeler
Swiss Agency for the Environment, Forests and Landscape
Ladies and gentlemen
On behalf of the Swiss government I have the great pleasure to welcome you inInterlaken and to open this EMEP / WMO workshop on fine particles.
I am particularly glad to see that we have a broad participation: more than60 experts from 22 countries are a clear sign that important items are on theagenda of this workshop. A great variety of problems will be discussed in depthand proposals for advanced solutions need to be elaborated. It is expected that theannounced contributions will lead to many interesting conclusions which you maytake with you at the end of this workshop.
In the last decade many studies, conducted in various parts of the world as well asin Switzerland, have shown a clear link between a wide range of health effects andexposure to particulate matter in ambient air. The small size fraction of theambient aerosol, measured as PM10 and PM2.5, is considered to be responsible formost of the health effects. In the report of the World Health Organisation entitled“Health Costs due to Road Traffic-related Air Pollution” (published in June 1999)there is shown that e.g. in Switzerland - with a population of 7 Million - there are3'300 additional cases of mortality estimated from the PM10 exposure-responsefunction. The related health costs of the mortality together with the morbiditycosts are estimated over 4 Billion Euros per year. It is therefore important toincrease the awareness of the problem of air pollution by particles and thewillingness to implement adequate solutions.
I think that this workshop can contribute in this context. Let me say some wordson the aims of the workshop.
Even though most countries have national networks for monitoring particulatematter there are still considerable gaps in the knowledge of PM10 and particularlyPM2.5 mass concentrations across Europe, especially in less populated areas. Onthe other hand the EMEP monitoring programme includes measurement ofsecondary inorganic compounds which are major contributors to PM10 mass inrural areas. One aim of the workshop is therefore to make good recommendationson the type of compounds to be measured, the location of monitoring sites to beselected and the frequency of measurement to be performed.
Fine particles have a relatively long residence time in the atmosphere. For thatreason they may travel over long distances. This is especially true for thesecondary particles which also are significant contributors to the total exposure of
EMEP/CCC-Report 9/2000
38
the European population to airborne particles. Even if there are good models forsome precursors of the secondary particles it is important to develop further theassessment of the contribution of long-range transport to particle concentrations.
With respect to emission inventories of primary particles it is required to reducethe uncertainties on the size distribution of the particles emitted by the differentsources and on the emission factors. An in-depth analysis of the available data anda certain harmonisation of the methods at the international level are also importantaims.
To improve our knowledge on particulate matter and to implement tailoredabatement strategies we need better models as well as more ample and preciseinput data for the models in terms of emission inventories and ambient airpollution measurements. For me there is no doubt that during this week yourexperience will greatly contribute to improve the level of knowledge and allow abreakthrough in the development of the relevant new activities under the EMEPwork programme.
In Switzerland we developed an intensive monitoring programme to follow theimplementation of the new air quality standards adopted in December 1997 forPM10. An annual mean of 20 µg/m3 and a daily mean of 50 µg/m3 to be exceededonly once a year were set as standards in the Ordinance on Air Pollution Control.To document the evolution of the fine particulate matter concentrations over years,we have conducted several parallel monitoring campaigns of TSP, PM10 as well asPM2.5. During this week you will have the opportunity to take note of differentreports in relation to the experience acquired in Switzerland in this field.
In conclusion, we should always keep in mind that air quality measurements andmodelling by themselves do not improve the quality of the environment. But theygive information about the sources of particulate pollution, they help to evaluatethe effect of emission changes and allow a comparison with the air quality goals.A better air quality can only be realized by implementing appropriate measures toreduce the emissions of air pollutants.
With this ultimate goal in mind – namely to improve air quality – I finish myopening remarks. The workshop on fine particles is opened.

EMEP/CCC-Report 9/2000
39
Fine particles under the convention on LRTAP
Discussions/Decisions
by
the EMEP Steering Body 1998–1999E. Lumme
Secretary of the EMEF Steering BodyUN/ECE
• 1997 the Executive Body: the need for a protocol onparticles? Established a joint task force with theWorld Health Organization to investigate thescientific and health-related issues.
• 1998 discussion paper on the visions for the EMEPwork by 2005/2010 EB.AIR/GE.1/1998/3/Rev. 1.
• 1998 MSC-W and CCC background notes for theSteering Body’s twenty-second session.
• 1999 workplan for EMEP.
• 1999 Steering Body twenty—third session
• Draft 2000 workplan for EMEP.

EMEP/CCC-Report 9/2000
40
Fine particles under the convention on LRTAPDiscussions/Decisions
by the EMEP Steering Body 1998-1999E. Lumme
Secretary of the EMEP Steering BodyUN/ECE
The 1998 discussion paper on the visions for the EMEP work by 2005/2010(EB.AIR/GE.1/1998/3/Rev.1) addressed, for the first time, problems related to thelong-range transport of fine particulates. It had been recognized that the healtheffects of fine particles are more important than previously thought.Epidemiological studies, initially in the United States, but more recently also inEurope, had derived associations between PM10 and PM2.5 and mortality. Overallrisk estimates had suggested that, of the pollutants covered by current legislation,those associated with particles tended to be among the highest. Moreover, asignificant fraction of ambient concentrations of fine particles in Europe arisedfrom the long-range transboundary transport of particles formed by atmosphericreactions chiefly involving sulphur and nitrogen oxides and ammonia.
The Executive Body had, at the end of 1997, duly discussed the need for aprotocol on particles and decided to establish a joint task force with the WorldHealth Organization to investigate the scientific and health-related issues. Thework of EMEP was expected to provide this task force and the Executive Bodywith further information on the transboundary transport of particles.
Furthermore, in the 1998 considerations, it was assessed that the present EMEPmodels for the acidifying pollutants could be used to estimate the concentration ofparticles arising from gaseous emissions of SO2, NOx and NH3. These particlesgenerally constitute a large part of the small aerosol (PM2.5) but a smaller part ofthe large aerosol (PM10). The models for acidifying pollutants could, therefore, beused with some adjustment to estimate the regional concentrations of the smallparticles but not of the large ones. Developing models for the long-range transportof the large aerosol would be a major effort. It would be necessary, inter alia, toestablish a finer geographical resolution than 50 km.
It was also noted that much of the needed research for sulphur, ozone and fineparticulate matter overlapped. Atmospheric oxidation reactions were importantalso in particle formation, besides ozone. Modelling the transport and fate ofsulphur, ozone and particles relied on similar meteorological processes, the samecomputational framework, similar emission inventories and model initializations.However, there were a number of necessary steps required for performing arealistic modelling of particulate matter. This would involve considerations ofemission inventories for primary particles, the atmospheric chemistry of secondaryparticle formation including fog and cloud processes, the incorporation of aerosoldynamics and deposition, and the characterization of background aerosols. In

EMEP/CCC-Report 9/2000
41
1998, in the EMEP long-term strategy paper it was estimated that, as a first step,the existing EMEP models could be modified as follows:
(a) The sulphate and nitrate concentrations are already determined by theacid deposition models. These contribute to the aerosol mass in the sizerange below 2.5 µm;
(b) The Lagrangian model, or one of the models which are being used tomodel HM transport, may both be easily modified to describe theconcentration of primary aerosol particle components, provided thatadequate emission data can be made available;
(c) Secondary organic aerosol concentrations will be estimated by theEMEP photo-oxidant model, adding a secondary organic aerosolformation module;
(d) Adding an aerosol dynamics module, which is necessary to determinethe size distribution of the aerosol components, will require thecombination of information from three models.
Further, it was noted that the measurement of particles is a complex task, andproposed that, as a first step, the following action could be taken:
(a) The existing EMEP monitoring sites should be used for PM2.5 and PM10
monitoring. This will achieve multiple monitoring objectives for amoderate increase in costs. The PM2.5 and PM10 measurements will needto be carried out with at least daily time resolution, in order to determineactual exposure of human receptors;
(b) A network of core monitoring sites could be established for determiningthe chemical composition of the aerosols, and relate the aerosol mass todifferent types of primary aerosol emissions and secondary aerosolformation under different conditions and in different parts of Europe.These core monitoring sites should also be able to carry out denudermeasurements to separate nitrate in aerosols from HNO3;
(c) The Working Group on Effects under the Convention has highlightedthe need for measurements of the base cation content of aerosols, and forseparation of the gaseous and particulate nitrogen species in air. Theseobjectives should also be taken into account.
In 1998, MSC-W’s and CCC’s background notes facilitated the Steering Body’sdiscussion at its twenty-second session on needs and possibilities to start EMEPwork on fine particles. It was agreed that there was enough scientific evidence ofthe adverse health effects of fine particles on health and that their long-rangetransport played an important role. The Steering Body supported starting EMEPwork in this field. It agreed that EMEP will, by 2000, evaluate the basic long-range transboundary problems of small particles and, as needed, develop itsmonitoring and modelling activities in this field to be able to respond to the issues

EMEP/CCC-Report 9/2000
42
raised under the Convention. EMEP would also contribute to the work of the jointTask Force with the World Health Organization set up by the Executive Body.
Based on the above considerations, the 1999 workplan for EMEP set asobjective of the first phase to provide the joint Task Force and the Executive Bodywith further information on the transboundary transport of fine particles. It wasagreed that this year
(a) The EMEP centres will provide background information to the TaskForce on health aspects on available long-range transported monitoringand modelling results of the atmospheric concentrations of primary andsecondary particles;
(b) CCC will, in cooperation with the other EMEP centres, evaluate thequality of the available expert emission estimates of primary particles.Based on these analysis MSC-W will evaluate the possibility ofincluding primary aerosols in the Eulerian acid deposition model;
(c) MSC-W will develop further the Eulerian acid deposition model in orderto include secondary aerosols resulting from the atmospheric oxidationof volatile organic compounds;
(d) The Task Force on Emission Inventories will consider work needed foremission inventories;
(e) Switzerland, in cooperation with the EMEP centres, will organize aworkshop to consider further the state of the art in particle measurementsand modelling and to prepare recommendations on future work inautumn 1999.
The workplan defines the expected output of this year work be: Backgroundinformation to the joint Task Force on health aspects of fine particles. Progressreport on modelling activities. Recommendations by the workshop on directionsand priorities of the future work.
At the twenty-third session of the Steering Body in September 1999, CCCreported on progress in producing and collecting background information on thelong-range transport of primary and secondary particles. As requested in the work-plan, MSC-W and CCC had actively contributed to the work of the Task Force onthe Health Aspects of Air Pollution of the Working Group on Effects. A documenthad been prepared for the Working Group’s 1999 session (EB.AIR/WG.l/1999/11). Steering Body welcomed the fact that fine particulates wereincorporated in the Convention’s 1999 work-plan and that the situation would befurther considered in detail at this workshop.
Unfortunately the outcome of this workshop was not yet available when thesecretariat had to draft a workplan for 2000. The Executive Body will consider itat its seventeenth session starting 29 of November 1999. The draft work-plangives the following description/objectives for the work in 2000: Develop transport
EMEP/CCC-Report 9/2000
43
and integrated assessment models to provide the Steering Body, the Task Force onthe Health Aspects of Air Pollution and the Executive Body with furtherinformation on the transboundary transport of fine particulates. Draw uprecommendations for emission reporting and monitoring of air concentrations ofatmospheric particles relevant to the Convention.
Furthermore, it details the main activities and their time schedule as follows:
(a) The Task Force on Emission Inventories will consider work needed foremission inventories. The discussions at the EMEP workshop inInterlaken in November 1999 are expected to provide input for theseconsiderations;
(b) The discussion of measurement at the EMEP workshop in Interlaken isalso expected to form the basis for the drawing-up of detailed proceduresand recommendations with respect to quality assurance. Themeasurements of fine particles within EMEP should be compatible withrecent regulations concerning the measurements of PM10 and PM2.5 inurban areas. On the basis of these discussions CCC will put forward aproposal with monitoring requirements for atmospheric particles usefulto EMEP;
(c) MSC-W will evaluate the possibility of including primary aerosols in theEulerian acid deposition model. It will develop the Eulerian modelfurther in order to include secondary aerosols resulting from theatmospheric oxidation of volatile organic compounds. MSC-W, incooperation with Nordic experts, will initiate the incorporation of anaerosol dynamic module in the Eulerian model. The discussions at theEMEP workshop in Interlaken are expected to help direct the modellingwork as well;
(d) MSC-E, in cooperation with MSC-W, will study further the physico-chemical properties of primary particles which are relevant for themodelling of heavy metals;
(e) The Task Force on Integrated Assessment Modelling will also includefine particulates in its work. To support this, IIASA/CIAM will initiatework to integrate particulate matter into the model and present aprogress report. It will also report on the work conducted for the GermanFederal Environmental Agency (UBA) and the United Kingdom’sDepartment for the Environment, Transport and the Regions;
(f) The centres will present a joint progress report to the Steering Body andinform the Task Force on the Health Aspects of Air Pollution about theirwork.

EMEP/CCC-Report 9/2000
44
1979 Convention on LRTAP
1984 EMEP
1985 Sulphur
1988 Nitrogen oxides
1991 Volatile organic compounds
1994 Sulphur
1998 Heavy metals
1998 Persistent organic pollutants
1999 Multi-pollutant multi-effect

EM
EP/
CC
C-R
epor
t 9/2
000
45
Exe
cuti
ve B
ody
Exe
cuti
ve B
ody
ICIC
EM
EP
EM
EP
WG
SRW
GSR
WG
EW
GE
TF
H
ICP
s
TF
M
TF
EIP
Cen
tres
TF
MM
TF
IAM
Exe
cuti
ve B
ody
Exe
cuti
ve B
ody
ICIC
EM
EP
EM
EP
WG
SRW
GSR
WG
EW
GE
TF
H
ICP
s
TF
M
TF
EIP
Cen
tres
TF
MM
TF
IAM

EMEP/CCC-Report 9/2000
46
New under EMEP
Seventh-phase programme 1999-2001 fivethematic areas:
♦ 1. Acidification and eutrophication2. Photo-oxidants3. Heavy metals4. Persistent organic pollutants5. Fine particulates
♦ Problem-oriented workplan
♦ Problem-oriented analysis of results andreporting together by the EMEP centres
♦ Closer cooperation between centres andParties and with other organizations
♦ Closer links to scientific research includingeffect-related research
♦ Change of focus from supportingnegotiations to following the outcome ofagreements
EMEP/CCC-Report 9/2000
47
Plans of the European Commission regarding particulate matter
by
Lynne Edwards
European Commission, DG XI
There is a large body of European legislation that is directly or indirectlyconcerned with particulate matter. Most notably, Directive 1999/30/EC setsambient air quality limit values for PM10, to be met in 2005. From 2001 EUMember States will be required to measure PM10 and PM2.5, to identify areas wherelimit values may not be met without additional measures, and to draw up actionprogrammes to ensure that they are met on time. These action programmes willhave to identify sources, identify the contribution of transboundary pollution, andset out the measures that will be used to reduce concentrations. Countries whichhave applied to join the European Union will also be implementing this legislationover the next few years.
In addition, the Directive sets more stringent indicative limit values for PM10, witha deadline of 2010. These indicative limit values will not, however, come intoforce unless the Commission brings forward a proposal to confirm them, and theEuropean Parliament and the Council adopt the proposal.
The Commission will report to Parliament and Council by the end of 2003 onimplementation of the Directive and on the latest evidence on health effects,technical matters and abatement possibilities. It will bring forward any necessaryspecific proposals at this time. The Commission intends also to report by the endof 2004 on an integrated air quality strategy, which may also be accompanied byproposals.
No decision has yet been made on whether the Commission will proposeconfirming the indicative limit values for PM10 or propose a change, for exampleto some other metric. It is however clear that the Commission will need to takeinto account both local sources and transboundary pollution. Any action ontransboundary aerosols will need to be integrated with action against troposphericozone, acidification and eutrophication.
The scientific and technical base for EU decisions on both local and long-rangeparticle pollution contains many gaps. It urgently needs improvement. There areimportant unsolved questions concerning the mechanism by which particles affecthealth, which particles are most important, what the most important sources areand concerning air chemistry and transport. It would be unrealistic to expect allthese uncertainties to be resolved by 2003/2004. Decisions will nevertheless haveto be made even if the scientific and technical base still contains important gaps.There is no “no-decision” option. Doing no more than is already being done is adecision with risks and consequences. It will be important to be clear about

EMEP/CCC-Report 9/2000
48
uncertainties, about the risks of potential decisions and to try to makerecommendations as far as possible for “no regrets strategies”.
Legislators will wish to take a snapshot of the scientific evidence on health effectsat the latest possible moment before 2003/2004 and develop a comprehensivestrategy covering the types of particle to be tackled as a priority and the technicalmeasures needed to succeed. Some decisions must however be taken before2003/2004 even though they will only have their effect after that date.Manufacturers need to gear up some years in advance in order to produceequipment or reorganise processes. Measurement standards also take some yearsto develop.
Current legislation sets timetables for making decisions on fuel quality from 2005,on technical aspects of motor vehicles, and on emission standards for stationarysources under IPPC and other legislation, all of which may affect particleconcentrations. These decisions cannot be postponed but it is important that theyshould not unnecessarily constrain scope for future decision making. Researchers,regulators and officials working in different areas need to be aware ofdevelopments and to try to minimise potential constraints.
The Commission is now considering how best to develop an integrated air qualitystrategy, making sure that all interests are properly involved. Co-ordination withEMEP will be important. In particular the technical base for developing strategiesto deal with transboundary aerosols must be consistent with the technical base ofany future UN-ECE protocol. DG Environment hopes to hold a workshop duringthe autumn of 2000 to launch the development phase of the programme. EMEPwill be invited to participate.

EMEP/CCC-Report 9/2000
49
Health aspects of fine particles
by
Michal Krzyzanowski
WHO European Centre for Environment and Health, Bilthoven Division
The evidence on adverse impact of suspended particulate matter on health hasbeen growing rapidly over the last decade. Most of the evidence comes from theepidemiological studies. While only two-three studies per year on that subjectwere published in the 1980s, ten to thirty research reports from relevantepidemiological studies appeared each year in the 1990s. Vast majority of theavailable studies analyze the relationship of health with a mass concentration ofparticulates with aerodynamic diameter less than 10 µm (PM10); fewer considerspecifically the fine fraction of the particulates, measured as PM2.5. Chemicalcomposition of the particles is quite complex, but its characteristics have rarelybeen included into the assessment of health impacts. This is a result of the use ofexisting, routinely collected, air quality monitoring data for estimation ofpopulation exposure in most of the completed studies.
In spite of the relatively crude description of the exposure, the range andmagnitude of health effects of PM10, and PM2.5, is quite consistent across a largevariety of environments, climatic conditions and predominant pollution sources.The impacts range from decrements in lung function, through increased incidenceof acute respiratory or cardiovascular symptoms, to increased mortality. Theincreased incidence of symptoms is reflected by the frequency of the use of healthservices, such as health care visits or hospital admissions on, or directly following,the days with the elevated air pollution levels. Several studies show also theeffects of the prolonged exposure, expressed by an increased mortality, increasedincidence of chronic pulmonary diseases and chronically decreased lung function.The latter effects create the most significant burden to population health.
In the process of the update of WHO Air Quality Guidelines, the informationgathered until 1996 has been assessed. The Guidelines do not specify a concen-tration of PM10 or PM2.5 below which no effects would be expected and providerisk estimates for standard setting. The Guidelines assume a linear relationshipbetween the considered health effects and ambient concentration of PM10 andPM2.5. The more recent epidemiological studies confirm the validity of theapproach proposed by the updated guidelines.
Mechanisms of the observed health effects are still not certain and are a subject ofintensive research. Better understanding of the mechanisms through laboratoryexperiments and a more precise description of exposures in epidemiologicalstudies are necessary to identify which of the many components of particulatematter, or which physical or chemical characteristics, are responsible for theobserved health effects. The few epidemiological studies where PM2.5 wasmeasured directly or as a concentration of sulphates (also present as fine aerosol in

EMEP/CCC-Report 9/2000
50
the atmosphere) are suggestive of the predominant health significance of the finefraction of the particulates. It is consistent with the exposure assessment studies,which show that the ambient concentrations of fine fraction of the particulates(PM2.5) tend to be better correlated with personal exposures than the PM10
concentrations.
Some toxicological experiments have suggested that it is the number concen-tration of fine particles, and not their mass concentration, which is the health-relevant parameter for the exposure. Few epidemiological studies, where thenumber concentration of particles was assessed, tend to confirm the possiblerelevance of that parameter. However, this does not explain the relation of healthto PM10 mass concentration, which is largely uncorrelated with the particlenumber.
Other existing hypotheses consider particle surface area, particle surface chemistry(e.g. metals contents or acidity) and the ability to create oxidative stress in thetarget tissue as the parameters responsible for, or contributing to, the observedhealth effects. However, more toxicological and epidemiological research isneeded to verify if, and which, hypothesis may be correct.
The joint Task Force of WHO and UNECE, has been created in 1998 to assessHealth Aspects of Long Range Transboundary Air Pollution. The Task Forceconsidered particulate matter as its first topic for evaluation. The Task Forcereport1, presented to the Workshop participants, states that the particlestransported over long distances or created in the atmosphere from gaseousemissions contribute a significant part of the ambient concentration of PM10 andPM2.5. In many populated areas, particularly where there are no heavily pollutinglocal sources of particulate matter, as much as 40-60% of PM10 levels may beattributable to long-range transport.
The Task Force made an attempt to estimate the possible health burden of theparticulate matter from the LRTAP in Europe. The exposure estimates, derived bythe experts from EMEP and from the Imperial College, London, combined withthe information on exposure – response associations derived from epidemiologicalstudies on the effects of long-term exposure to particles, indicate that as many asbetween 95 thousand and 382 thousand premature deaths per year may beassociated with the exposure to particulate matter from LRTAP in Europe. Some75% of this number is attributable to the exposure to secondary particles,calculated by the models using the emission data from 1996. Validity of thesecalculations depends on the applicability of the results of epidemiological studies,which were conducted mostly in respect to urban air pollution. It is not certain towhat extent the different composition and low concentration of the particles fromlong-range transport have the same effects.
The estimated impacts vary considerably across Europe, with the largest effectsexpected to occur in the densely populated parts of central and Western Europe.The changes of emission of (gaseous) pollutants in the 1990s should have resultedin overall reduction of the impacts and in the shift of the most affected areas to thesouth of Europe.

EMEP/CCC-Report 9/2000
51
The present exposure estimates, and their changes in time, are rather uncertain.While the emission inventories of gaseous precursors of secondary particles arerelatively well established, calculations of primary PM10 and PM2.5 emissions aremuch more uncertain. This hampers the modelling of the spatial distribution ofPM levels. Also the models used to estimate air pollution with particulates are inthe early stages of development and the pollution levels predicted by the existingmodels are associated with substantial uncertainties.
The report of the Task Force illustrates the potential significance of the health riskof the particulate air pollution from the pollution transported over long distancesand identifies areas where new information is necessary for reduction ofuncertainties in the present assessment. The improvement of the air pollutioncharacteristics, together with the better understanding of health effects of thepollution, are urgently needed to provide a more precise advice to the policymakers and to devise pollution abatement strategies protecting health moreeffectively.
Reference:
1. Task Force of Health Aspects of Long Range Transboundary Air Pollution. HealthRisk of Particulate Matter from Long Range Transboundary Air Pollution.Preliminary Assessment. WHO European Centre for Environment and Health,Bilthoven Division, 1999 (56 pages).

EMEP/CCC-Report 9/2000
52

EMEP/CCC-Report 9/2000
53
Emission inventories of primary fine particles
by
M. Woodfield, P. Van Der Most, J. Goodwin, J. McAughey
The aim of this paper is to review the current status of fine particulate inventoriesand to comment on the problems facing their further development. It will alsodescribe the activities in the Task Force on Emission Inventories and suggestimprovement opportunities for discussion at the Workshop.
Background:
There are a number of activities setting or driving the ‘operational requirements’of fine particulate inventories, these include:
− state of the environment reporting at national and regional level (for air qualityimprovement, health and amenity purposes etc.),
− transboundary pollution modelling (LRTAP Convention and the POPs andHeavy Metals Protocols),
− the development of national and international regulatory controls (which needto take into account the effectiveness of alternative remedies and theirinteraction with other regulations or instruments - such as the impact of POPsand HM on particulate emission levels),
− regulatory compliance testing (for UN ECE, OSPAR, and EU Air QualityDirective for instance).
However ‘fine particulate matter’ is not a single entity but a short hand term usedto encompass a range of particle related characteristics including: particle mass,size and number. The inventory compiler is faced with the dilemma of knowingexactly where to apply his limited resources and which of these to inventorisefirst.
There is a considerable amount of inventory development work ongoing at bothinternational and national level but too often the focus of this work is splitbetween toxicological, epidemiological and methodology issues and is not co-ordinated. There are a number of different groups involved, each with their ownspecial interests - be it academic, commercial or regulatory.
Current Status of Fine Particulate Inventories From Primary Sources:
International level:
There are very few truly international inventories. That of TNO was compiled toassist international policy development and is the only inventory presently

EMEP/CCC-Report 9/2000
54
available which has self consistently, estimated, size differentiated particulateemissions for the whole of Europe. It broke down emissions from five majoremission categories (Stationary combustion, process industries, transport, wasteincineration, and agriculture) and suggested default emissions for three sizefractions (PM10,2.5,0.1) for about 25 countries. It used literature values and expertjudgement to develop emission factor defaults, it did not include natural sources.
CORINAIR, the initiative of the European Environment Agency, is stimulatingthe collection and reporting of a range of emissions from European countries. Theprogramme collects emissions for a range of pollutants, including PM10, on aregular basis. The CORINAIR system encourages quality control and consistencyof approach between contributing countries and is becoming increasinglyimportant. Guidance for the estimation of emissions for reporting is provided bythe EMEP/CORINAIR Guidebook. This document (available via the EEA websitehttp://eionet.eea.eu.int/aegb/default.htm) sets out in considerable detail how toestimate emissions from most known sources of emission. It provides guidance ata basic level for inexperienced compilers or less important sources and at moredetailed levels for more comprehensive reporting.
Work is proceeding in the UN ECE regional area under the long rangetransboundary air pollution convention (LRTAP) to control the emission andtransport of acidifying, eutrophying, photochemical and toxic and persistentpollutants, all these in various forms require the estimation of particulateemissions and the modelling of their capacity to be carried long distances. As aresult the EMEP centres MSC-W and MSC-E (Moscow) are developingparticulate models and examining the likely distribution of POPs and heavymetals in Europe. Much of the predictive work on POPs and heavy metals is beingdone with the TNO inventory. The task force on integrated assessment modelling(TFIA) also uses the TNO inventory when integrating particulates into the IIASARains and other models, the data being disaggregated as a function of NOx
emission data.
Other international organisations/groups carrying out activities requiring fineparticulate inventories include the GAEI project, GENEMIS (part of theEUROTRAC programme), the OECD/Eurostat - which collects TSP and PM10
information in its joint questionnaire process, and the Auto-oil II consortium.
National Programmes
Much inventory activity is ongoing in the US/N America where interest isprogressing from PM10 to PM2.5. A PM2.5 committee has been set up to discuss theinventory issues and to develop the emission estimation tools needed to enableindividual states to report their emissions (see Airchief site http://www.epa.gov/ttn/chief/eiip/eiip_p25.htm). The major output will be a report which will describecurrent PM2.5 emission estimation techniques and evaluate emission factors,specify the precursor emission data requirements, and prioritise issues requiringfurther work.
Work is also progressing within a number of Europe and the EU members states –examples include the Dutch (to be described by Berdowski) and UK work

EMEP/CCC-Report 9/2000
55
(described in NAEI http://www.environment.detr.gov.uk/airq/aqinfo.htm andhttp://www.etsu.com/en env).
Inventory Development Issues:
In developing particulate inventories the following factors need to be taken intoaccount:
i) The size distribution of particles of the particle mixture making up totalsuspended particulate (TSP). In the light of current knowledge especialattention is being paid to PM10/2.5/1/0.1.
ii) The chemical composition, health concerns relating to both toxicity andcarcinogenicity are drawing attention to particulate bound heavy metals (Cd,Ni, Hg and As) and organic carcinogens (polycyclic aromatic compoundsPAH).
iii) The development of consistent and comprehensive source lists, especially forpoorly defined particulates (tyre wear, road re-suspension and ‘natural’emissions such as sea salt from oceans, wind blown dust/soil and volcanicash).
iv) The nature of the emission and whether it is a contained or fugitive emission.
v) Whether the source is stationary or mobile (i.e. transport related).
vi) Whether emission factors are based on measurement or are estimation. Ofrelevance here is weather reported data has been validated and consequentlywhether inventories as a whole are of sufficient quality that they can beverified by an independent source.
vii) In allocating valuable and limited resources is there a minimum acceptablecoverage (i.e. is it sufficient or possible to characterise the to 80% ofemissions relatively quickly?)
EMEP Task Force on Emission Inventories:
The EMEP/CORINAIR Guidebook, referred to above, is a source of informationand a vehicle for co-ordinating information exchange. The Task Force, via anumber of Expert Panels, compiles and manages the Guidebook, updating it asand when necessary. In view of the importance of fine particulate emissions anincreasing amount of effort is being directed to including PM estimation whenupdating.
Some groundbreaking work has been carried out by Van Der Most, the IFAREteam (University of Karlsruhe) and AEA Technology to develop ‘model chapters’to guide the work of the Expert Panels in the production of their chapters of theguide book. This has entailed extending process descriptions to include all thestages which can give rise to PM emissions; in the past, for example, the handlingof process raw material and the handling of waste products would not have beenincluded. The chapter revisions will also need to feature extended descriptions ofprocess emission abatement and default emission factors.

EMEP/CCC-Report 9/2000
56
A number of other new features will need to be added to the Guidebook.Additional emission categories will also be needed. A means of estimating andreporting size fractions must be developed; an approach similar to that used forestimating PAH speciation is being considered. This entails identifying a smallnumber of reference processes and tabling a default size fractionation which is tobe used until measured data becomes available.
Way Forward:
1. Inventory developers need clear and unambiguous priorities to function,particular regarding what is important for health: is it numbers of particles, asit is for miners; particulate shape as for asbestosis; or is it chemicalcomposition as for toxicity.
2. Resources are extremely limited and should be pooled wherever possible; soestablishing effective communication between groups will be critical factor inthe future. This will require the linking of expert networks where they havebeen established (as for, example, that used by the TFEI).
3. An undue reliance is currently placed on estimation technique. As a result of anumber of recent regulatory initiatives an increasing amount of measurementwork is being undertaken which can be used to supplement, extend and verifyinventories. The ECE Protocols and EU emission reduction directives willrequire substantial source measurement programmes. Similarly EMEP activityand EU air quality management initiatives will result in the generation of anincreasing amount of size resolved, good quality, ambient data. Effectivecommunication and access to monitoring data developed for regulatorypurposes will become increasingly important. This in turn will require thatprocedures for making, compiling and reporting data will be important.
Acknowledgements:
The authors wish to acknowledge the assistance from the following people incomposing this review:
H. ApSimonC. BenkovitzJ. Berdowski

EMEP/CCC-Report 9/2000
57
European PM10 and PM2.5 Emission Inventory of anthropogenicSources
by
Jan J.M. Berdowski and Antoon J.H. Visschedijk
TNO Institute of Environmental Sciences, Energy Research and Process InnovationP.O. Box 342, 7300 AH Apeldoorn, The Netherlands
E-mail [email protected]
Introduction
For the outlining of policy on the ambient air concentration of fine particulates inthe Netherlands by the Ministry of Environment additional knowledge onparticulate emissions was required on a European scale. This information had tobe suitable as input for atmospheric dispersion modelling, for scenario calculationand for presentation purposes. A sector-split European emission inventory hasbeen prepared for PM10 and PM2.5 for the years 1990 and 1993 on a 0.5° x 1°latitude – longitude grid scale [1]. The inventory has been restricted to primaryaerosols from a number of sectors, which are expected to cover the bulk of theanthropogenic sources: stationary combustion, industrial process emissions,transport (including maintenance, tyre wear, road abrasion and re-suspension forroad transport), agricultural practise (pig and chicken factory farming) and wasteincineration.
General and country specific information was collected on emission control for arange of combustion and production processes [1,2]. Subsequently, the emissionswere calculated by applying emission factors for each process to a certain activityrate. The emission factors for PM10 were derived from open literature and specificmeasurement reports. Activity rates for combustion and production processes foreach country were used from official statistics or when absent from other interna-tional emission databases. The PM2.5 emissions were calculated by characterizingthe PM10 emissions with respect to the PM2.5 fractions. Firstly, total emissionestimates were set for the individual source groups for each individual Europeancountry. Next, the country totals were spatially distributed in a 0.5° x 1° latitude –longitude grid by using specific point source information (location, capacity) for alarge number of combustion and production plants, population density distributiondata and land use information.
Emission inventory results
The total European (excluding the former SU) anthropogenic PM10 and PM2.5
emissions were about 5100 and 2900 ktonnes for 1990 respectively (figure 1).Including the European part of the former SU would roughly double theseemission figures. For PM10 and PM2.5, stationary combustion processescontributed about 55% of total emissions, while industrial processes and transportcontributed between 14-19% of total emissions.

EMEP/CCC-Report 9/2000
58
Figure 1: PM emissions in Europe (excluding the former SU) in 1990 by main sourcecategory.
Power generation accounted for about 55% of total stationary combustionemissions. The contribution of residential combustion to total stationarycombustion equals more or less the contribution of industrial combustionprocesses, but tends to be increase in importance for the most fine PM fractions.
The industrial process emissions of PM10 were dominated by activities from theiron and steel industry and refineries. The contribution of refineries emissionsincrease in importance for the finer PM fractions.
For the transport sector, the PM emissions were dominated by the contribution ofheavy duty vehicles (60-70%). It is important to realize that in 1990, non-tail pipeemissions (tyre wear, re-suspension processes on roads etc.) accounted for 30-40% of the total PM emissions of transportation.
Between 1990 and 1993 the PM emissions decreased because of economicdevelopments and change in especially the type of fuel used for residentialcombustion in a number of countries.
Scenario results for 2010
For the year 2010, three types of emission predictions have been prepared [2]: a‘Business as usual’ scenario, assuming no emission reduction activity in Europeand applying the RAINS 7.2 Official Energy Pathway Scenario (OEP); a‘Baseline’ scenario, applying OEP and assuming a range of agreed emissionreduction activities (e.g. 2nd Sulphur Protocol); a ‘Best Available Technology’scenario, applying OEP and BAT. The scenario results for 2010 presented inFigure 2, together with the 1990 PM10 emission data.

EMEP/CCC-Report 9/2000
59
Figure 2: PM10 emissions in 1990 and predictions for Europe (excluding the formerSU) in 2010.
When no emission reduction activities are applied the 2010 PM10 emission wouldincrease slightly compared to the 1990 emission values (Business as usual).Especially, transport emissions would increase strongly. When a series ofreduction measures will be applied (Baseline scenario), the 2010 emissions wouldprobably be about 30% less than in 1990. When all Best Available Technologywould be applied as well, an emission reduction of about 55% could be achieved,especially by the decrease of the emissions from stationary combustion andindustrial production processes. The contribution of transportation emissionswould hardly be reduced further compared to the Baseline scenario. The reasonfor this is that non-tailpipe emissions will hardly be reduced and are expected tobecome relatively more important (about 50% of total forecast transportemissions). Also, the strict EU regulations (EURO 4) have already been accountedfor in the baseline scenario and will not lead to further decrease in the BATscenario.
Uncertainties
A very first approach to calculate the uncertainties in the inventory data, has beenbased on the statistical analysis of the information on emission factors. For thesources considered, the uncertainty in emissions for total Europe (without theformer Soviet Union) range between 10 - 20% for the different PM fractions.
In the Netherlands a qualitative approach to determine emission inventory data isbeing explored [4]. The emission factors and activity data are characterized byfive quality classes, ranging from A to E. A - the highest quality - stands for afigure based on a large number of measurements of representative installations,while E - the class of lowest quality - represents a figure resulting from a technicalcalculation, which is based on a number of assumptions. The relative contributionof the five quality classes in the PM10 emission inventory of known sources for1997 is strongly dominated by the classes A (34%) and E (53%). It can be seenthat especially the emissions of transportation and residential activities are highlyuncertain in the Netherlands (figure 3, below). Within the sector transportation,inland shipping and harbour activities are important contributors to overall

EMEP/CCC-Report 9/2000
60
uncertainty. Wood combustion accounts for a large part of the uncertainty ofresidential activities.
Figure 3: Relative contribution of sectors to quality classes A (above - 34% of total)and E (below - 53% of total) of the PM10 emission inventory in theNetherlands in 1997.
Verification
Modelled annual average PM10 concentrations of ambient air in the Netherlands(among others based on these inventory results) are about 50, 60 and 75% of themeasured concentrations for respectively rural, urban and industrial areas [3]. Thiscould indicate an underestimate of the emissions in this European scale inventory.This can be expected as a number of sources was not covered by this inventory(e.g. non-anthropogenic sources, incomplete re-suspension). On the other hand, itshould be realized that both the measurement data and the model applied and theemission estimates contribute to the overall uncertainty observed as well, so thatthe discrepancy between measured and modelled concentrations cannot beattributed to only the inaccuracy of emission data.
Concluding remarks
It is clear that the emission inventory results as presented here can be improvedfurther and become more complete by applying more up-to-date information, byevaluating the results with national experts and by adding non-anthropogenic

EMEP/CCC-Report 9/2000
61
sources and more complete re-suspension information. Also, the results could beimproved by using verification methods, e.g. by applying the combination ofmeasurements of concentration, size distribution and chemical speciation of PM inthe ambient air, atmospheric models and chemical characterization of theemissions of different sources.
Large uncertainties with respect to source contribution can be attributed to:
• Non-combustion emissions from Transportation• Several Industrial Processes• Diffuse sources, e g.
Crops, Agricultural Soils, TillageRe-suspension processes
• European background concentrations (Ocean, other continents)• Volcanoes, Wild fires etc.• Residential activities
Several countries have prepared PM10 emission inventories by now. Comparingthese data gives the impression that no uniform sets of emission factors areapplied and that not in all cases the same set of emission sources is considered.This implies that using these national inventory data on a European scale willcause uncertainties with respect to especially:
• Differences in emission factors• Incompleteness of sources
Non-combustion emissions road traffic;Agriculture;Construction/demolition activities;Several industrial processes;e.g. foundries, storage and handling;Biomass burning, wild fires;Shipping;Smoking;etc.
References
1. Berdowski, J.J.M., W. Mulder, C. Veldt, A.J.H. Visschedjjk & P.Y.J. Zandveld(1997). Particulate matter emissions in Europe in 1990 and 1993. TNO-MEP-R96/472, Apeldoorn, The Netherlands.
2. Berdowski, J.J.M., M.P.J. Pulles & A.J.H. Visschedijk (1998). Incremental cost andremaining emission in 2010 of Heavy Metals resulting from the implementation ofthe draft HM Protocol under the UN/ECE Convention on Long RangeTransboundary Air Pollution. TNO-MEP-R 98/020, Apeldoorn, The Netherlands.
3. Bloemen, H.J.Th., L. van Bree, E. Bruringh, P.H. Fischer, S. de Loos, M. Marra &P.J.A. Rombout (1998). Fine dust in the Netherlands. A Preliminary balance (InDutch). RIVM R 650010 006, Bilthoven, The Netherlands.
4. Van der Most, P.F.J., M.M.J. van Loon, J.A.W. Aulbers & H.J.A.M. van Daelen(1998). Methods to determine emissions to air and water (in Dutch). Publicationseries Emission Inventory no. 44, ‘s-Gravenhage, The Netherlands.

EMEP/CCC-Report 9/2000
62
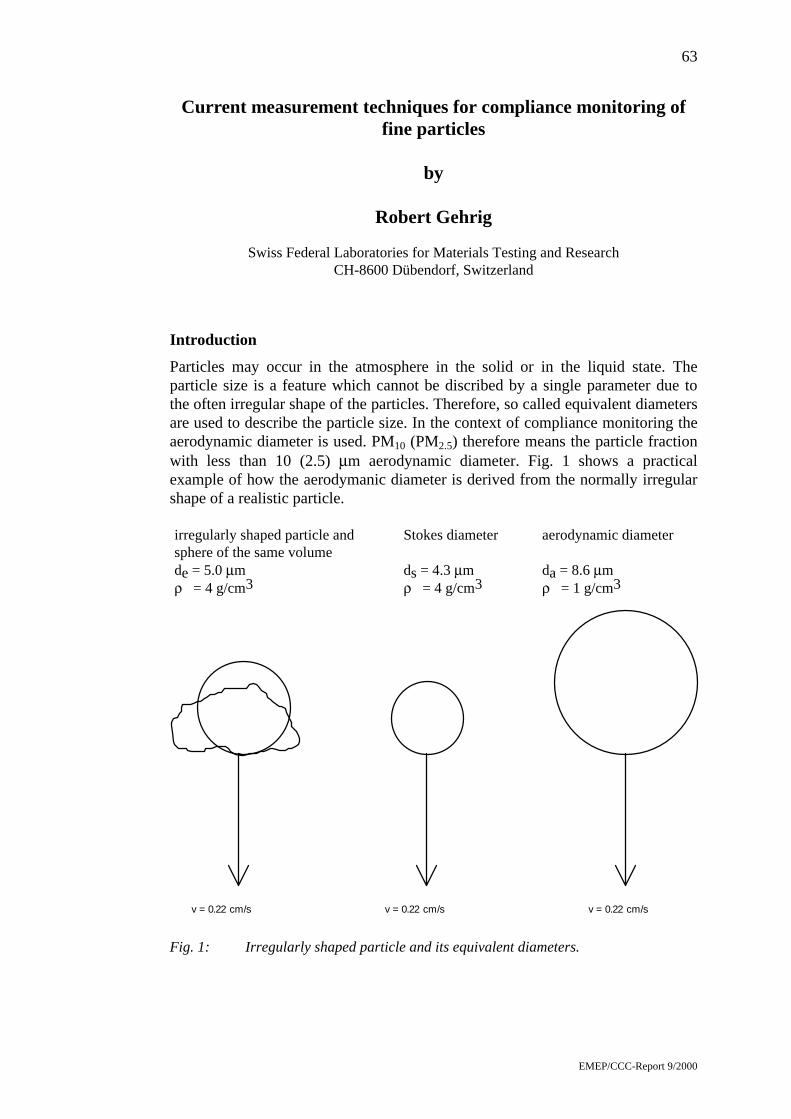
EMEP/CCC-Report 9/2000
63
Current measurement techniques for compliance monitoring offine particles
by
Robert Gehrig
Swiss Federal Laboratories for Materials Testing and ResearchCH-8600 Dübendorf, Switzerland
Introduction
Particles may occur in the atmosphere in the solid or in the liquid state. Theparticle size is a feature which cannot be discribed by a single parameter due tothe often irregular shape of the particles. Therefore, so called equivalent diametersare used to describe the particle size. In the context of compliance monitoring theaerodynamic diameter is used. PM10 (PM2.5) therefore means the particle fractionwith less than 10 (2.5) µm aerodynamic diameter. Fig. 1 shows a practicalexample of how the aerodymanic diameter is derived from the normally irregularshape of a realistic particle.
irregularly shaped particle andsphere of the same volumede = 5.0 µmρ = 4 g/cm3
Stokes diameter
ds = 4.3 µmρ = 4 g/cm3
aerodynamic diameter
da = 8.6 µmρ = 1 g/cm3
v = 0.22 cm/s v = 0.22 cm/s v = 0.22 cm/s
Fig. 1: Irregularly shaped particle and its equivalent diameters.

EMEP/CCC-Report 9/2000
64
Harmonisation of PM10- and PM2.5 measurements in Europe
According to Community Directive 96/62/EC on ambient air quality assessmentand management and Directive 1999/30/EC relating to the establishment of limitvalues, inter alia also for particulate matter, all member states of the EU areobliged to report PM10 and PM2.5 data. In order to assess air quality across Europeon a consistent basis the measurements need to be performed with standarizedmeasurement techniques. Therefore the European Commission has mandated theEuropean Normalization Centre CEN to establish reference methods formeasurement of PM10 and PM2.5 and to define requirements for alternativemethods to be considered as equivalent methods.
The work for PM10 is now completed and has led to the standard EN12341 whilethe work on PM2.5 is still in its beginning phase. As it is already the case for PM10,also for PM2.5 a manual gravimetric reference method will be most probablydefined as reference. With this procedure Europe is in line with the correspondingUS-American methods as defined by the EPA.
Elements of the manual gravimetric methods
Basically a manual gravimetric method consists of an inlet system providing thedesired particle fraction, a filter on which the particles are deposited, a regulatedsampling pump and a detailled procedure for the gravimetric analysis of thefilters.
Inlet systems:The main task of an inlet system is to prevent particles which are larger than thedesired fraction (e.g. PM2.5) to enter the sampling line. Most of the currently usedinlets work on the principle of impaction. Fig. 2 shows as an example the WINSimpactor for PM2.5 which is part of the American reference method for PM2.5.This is an example of an inline impactor i.e. it is used after a PM10 preseparatorwhich protects the fine nozzles from being clogged by coarse particles. Thesedevices need to be cleaned and greased or oiled frequently. Fig. 3 shows a newlydeveloped inlet system on the cyclone principle, the so-called sharp cut cycloneSCC with similar performance characteristics as the WINS but longermaintenance intervals.
Filters:Generally filters are used to separate the particles from the carrier gas. They shallhave a collection efficiency of >99.5% for particles around 0.3 µm aerodynamicdiameter. Smaller and larger particles are usually collected with even betterefficiency due to the involved deposition mechanisms (see Fig. 4). The filtermaterials used are, inter alia, glass and quartz fibre filters and membrane filtersmade of teflon, cellulose nitrate, cellulose acetate and polycarbonate.
Weighing procedure:The mass of the particles collected on the filter is determined by weighing thefilter before and after sampling after conditioning at defined climatic conditions.

EMEP/CCC-Report 9/2000
65
PM10 aerosol from inlet PM10 aerosol from inlet
PM2.5 aerosol to filter PM2.5 aerosol to filter
Fig. 2: WINS-impactor (EPA) Fig. 3: Sharp cut cyclone (SCC)
0
20
40
60
80
100
120
0.01 0.1 1 10aerodynamic diameter [µm]
% s
epar
atio
n
contribution of diffusion
contribution of impaction andinterception
total filter efficiency
Fig. 4: Efficiency of a (bad) filter as a function of particle diameter
Automatic monitors
The manual gravimetric method is rather time consuming and normally gives onlydaily mean values. In order to obtain on-line data with higher time resolution,monitors are used in many air pollution networks. Most of them work either onthe principle of the oscillating microbalance (TEOM) or the absorbtion of betaradiation.

EMEP/CCC-Report 9/2000
66
To avoid water droplets (fog or condensation) being measured as particle mass,the inlets and filters of these monitors are generally heated to 35 – 50 °C. At thistemperatures volatile particles (e.g. ammonium nitrate) are at least partly lost.Therefore the monitor data are not directly comparable to manual gravimetricdata.
Compliance monitoring methods and EMEP needs
The main purpose of compliance monitoring of fine particles is not necessarily ascientifically sound measurement of the "true" concentrations but rather to checkwether health related limit values are respected or exceeded. These limit valuesare based on epidemiologic studies of adverse health effects and/or mortalitycaused by ambient exposure to fine particle concentrations. These latter weremostly measured with manual gravimetric methods.
However, for EMEP purposes measurement methods would be desirable whichgive data which are directly comparable to modelled aerosol concentrations fromemission of primary particles and aerosol formation in the atmosphere. Methodswhich are biased by sampling artefacts and losses (as the described manualgravimetric procedure and the monitors) are certainly not ideal.
It is therefore an open question in which way EMEP can make use of thecompliance monitoring data which have the advantage to be available over largeparts of Europe but with the disadvantage of not necessarily reflecting "true"ambient aerosol concentrations.

EMEP/CCC-Report 9/2000
67
Aerosol Measurements Within the WMO Global AtmosphereWatch Programme: Providing Data Related to Climate Forcing
and Air Quality
by
U. Baltensperger
Paul Scherrer Institute, CH-5232 Villigen PSI, Switzerland
The World Meteorological Organization's (WMO) Global Atmosphere Watch(GAW) Programme has been established to provide measurements, scientificassessments, and other information on changes in the global chemical compositionand related physical characteristics of the atmosphere (WMO, 1997). Atmosphericaerosols influence our environment in various ways (IPCC, 1995; Baltenspergerand Nyeki, 1998), and characterization of their properties has therefore beenincluded in the GAW programme. Since the atmospheric residence time of aerosolparticles is relatively short, a large number of measuring stations are needed. Inaddition, information on seasonal variations is required, which is mostlyunavailable at present. Furthermore it is the goal of GAW to ensure long-termmeasurements in order to detect trends. In summary, the objective of the GAWaerosol programme is to determine the spatio-temporal distribution of aerosolproperties related to climate forcing and air quality up to multi-decadal timescales.
For this purpose, the harmonization of aerosol measurements on the global scale isimportant in order to make results comparable. WMO therefore establishedScientific Advisory Groups (SAGs) for various components of the measuringprogramme, including the SAG on Aerosols and Aerosol Optical Depth. TheAerosol SAG had its first meeting in December 1997, and two more in thefollowing years. The SAG is currently formulating guidelines for measurementand quality assurance procedures in the extensive global programme. It is plannedto publish these guidelines in the year 2000. In addition, an overview of all GAWparameters will be published as a combined effort of all SAGs. (For moreinformation: The official GAW Web site can be accessed from the WMO site(www.wmo.ch) - go to AREP, then GAW. The front page of the WMO site willbe revised in the near future so that GAW will appear immediately rather thanthrough AREP).
Presently, GAW consists of 20 Global stations, which cover different types ofaerosols: Clean and polluted continental, marine, arctic, dust, biomass burning,and free troposphere. These stations include Mauna Loa in Hawaii, Ny-Ålesund inSpitsbergen, Cape Point in South Africa, South Pole, and the Jungfraujoch in theAlps (WMO, 1997). Most of these sites are located in pristine areas and therefore,the SAG recently made additional recommendations that would provide bettercoverage of the polluted continental aerosol type. In addition, there are about

EMEP/CCC-Report 9/2000
68
300 Regional stations where measurements are made closer to the source areas. Inthis way, Global stations may then serve as standards for Regional stations.
Priorities were set for measurements at the Global and Regional stations.According to the recommendations of the SAG, Regional stations will be expectedto measure optical depth, mass concentration in two size fractions, major chemicalcomponents in two size fractions, and the scattering coefficient. At Globalstations, a larger number of measurements are envisaged, with optical depth, massconcentration in two size fractions, major chemical components in two sizefractions, the scattering and hemispheric backscattering coefficient at variouswavelengths, the absorption coefficient, aerosol number concentration, cloudcondensation nuclei (CCN) at 0.5% supersaturation, as well as diffuse, Global anddirect solar radiation. Additional parameters such as aerosol size distribution,detailed size fractionated chemical composition, dependence on relative humidity,and vertical distribution of aerosol properties should be measured intermittently atthe Global stations. Further research is needed, as for some parameters there is nosuitable commercial instrumentation available (e.g., CCN), or calibration pro-cedures are presently unclear (e.g., absorption coefficient).
The establishment of a World calibration centre for aerosols within GAW is anessential part of this process, however, due to funding problems no solution hasbeen found so far.
A further essential part of the concept is a dedicated data centre, which makes thedata available for their users in a most efficient way. The World Data Centre forAerosols in Ispra (Italy) is currently undertaking all actions needed to fulfil thistask.
While much of the recent international focus has been directed at assessing theimpact of human activities on regional and global scales, there is growingrecognition that the management of urban environments requires special attention.The poor air quality in many cities is the result of both high emissions and localmeteorological conditions. It is clear that more effective management of urban/regional problems must be science-based, and will require a marked enhancementin monitoring and modelling capabilities and infrastructure. GAW plans tocontinue its focus on high quality measurements, with added emphasis on dataanalysis and interpretation, and will continue to work with national andinternational organizations (such as WHO) on improving measurements in andaround urban environments.
Furthermore, collaboration with other international programmes such as IGAC,WCRP is envisaged in order to obtain the optimum benefits from a combinationof long-term measurement programmes and dedicated field campaigns.
While it is premature to give all operating procedure details, a few points mayalready be mentioned. No particular PM10 design is recommended in preferenceto others, but the apparatus should be characterized. The optimum size cut fordifferentiation between coarse and fine mode was decided by the SAG to be eitherof the two following: 10 µm ambient and 1 µm dry, or 10 µm ambient and 2.5 µm

EMEP/CCC-Report 9/2000
69
ambient, where 1 µm dry refers to 1 µm at low RH. A cut-off diameter at 1 µm forlow RH and 2.5 µm ambient RH (wet) are expected to give roughly the sameresults. The dry value should be obtained by lowering the RH to 30-50% (aim for40%) using a heater with absolute maximum heating temperature set at 40°C.Heating will introduce problems, e.g. due to nitrate and organic carbon losses. Ifdrying by heating is problematic, then a diffusion drier (such as silica gel) ordilution with dry air is recommended. It was agreed that drying would posedifficulties at tropical sites. Another problem is very cold arctic conditions, whereRH values are very low. However, humidifying of the samples is notrecommended as being necessary.
References
Baltensperger, U. and S. Nyeki, (1998) Atmospheric Aerosols. In: Physical andChemical Properties of Aerosols, I. Colbeck (ed.), Blackie Academic & Professional,London, pp. 280-330.
IPCC (1995) Climate Change 1994, J.T. Houghton, L.G. Meira Filho, J. Bruce, HoesungLee, B.A. Callander, E. Haites, N. Harris, and K. Maskell (eds), IntergovernmentalPanel on Climate Change, Cambridge University Press, Cambridge.
WMO (1997) The Strategic Plan of the Global Atmosphere Watch (GAW), No. 113,World Meteorological Organization, TD-No. 802, Geneva.

EMEP/CCC-Report 9/2000
70

EMEP/CCC-Report 9/2000
71
EUROTRAC-2 subproject AEROSOLComposition/size evolution of the secondary aerosol
An introduction
by
Harry ten Brink
ECN, PO Box 1, 1755 ZG Petten, Netherlands
EUROTRAC
AEROSOL is one of twelve subprojects in EUROTRAC. The subproject has theaim of filling in gaps in knowledge on aerosol formation in Europe. EUROTRACin total comprises some three hundred researchers. Every individual participation(via Principle Investigators) has been approved of and is documented in a two-page document. Every year an annual report of the subprojects is produced, whichcontains the contributions of the individual PI’s. The work in EUROTRAC is of ageneric nature and is basically performed on a voluntary basis. However severalcountries only support national projects on atmospheric chemistry when they areperformed within the EUROTRAC framework.
The subproject(s) in EUROTRAC are divided into task-groups with co-ordinatorswho form the steering group. The EUROTRAC framework provides, via theresponsible International Executive Committee and the EnvironmentalAssessment (Advisory) Group of experts, a direct link with European and nationalpolicy. The Scientific Steering Committee watches over the scientific level of theresearch and co-ordinates the overall program. Via the secretariat exchange ofinformation is provided, for instance by printing the annual reports, editing thenewsletter and organisation of the biannual EUROTRAC symposium. Thissymposium is the central point of gathering of the atmospheric scientists inEurope.
AEROSOL
The subproject AEROSOL was officially approved at the end of 1997 and istherefore new in the EUROTRAC program, which has now been in existence forover 10 years. At present AEROSOL has 33 PI’s from all over Europe.
In AEROSOL attention is not only on PM-related scientific questions, but thework is also aimed to provide relevant information on the reflection of light byaerosol. This reflection leads on the one hand to a reduction in solar irradiationand is thereby a key climate issue in Europe. On the other hand reflection of lightleads to visibility impairment. Aerosol particles are also the sites on whichheterogeneous reactions of gaseous trace constituents occur. Information shouldtherefore become available on the composition of the aerosol surface. Thissurface, in turn, is mostly composed of the secondary compounds which eitherhave condensed onto it or formed there. The focus of AEROSOL is on PM2.5

EMEP/CCC-Report 9/2000
72
because all of the phenomena mentioned are associated with particles of that size.AEROSOL serves also as the “mother” for information on aerosols in othersubprojects.
AEROSOL has the following 6 year work planning:
First the problems of measurement and modelling of the semi-volatile secondaryaerosol constituents are addressed, in particular that of the organic fraction. Thereis a lack of instrumentation for measurement of these aerosol components.Therefore, one of the subproject’s objectives is to develop necessaryinstrumentation for the representative measurement of semi-volatile aerosolcomponents in the fine aerosol fraction and in well-defined size classes.
The instrumentation will then be applied to determine the aerosol componentswhich constitute the total aerosol mass. The sum of the analytically determinedmasses of the individual components will systematically be compared to the totalweighted mass, and the degree of ‘closure’ will serve as a consistency test. Thesechemical mass closure experiments will be performed during intensivecampaigns at seleeted (“super”) sites, which include well-defined backgroundsites to more complex polluted urban sites.
The sources of the major aerosol constituents will be identified according togeneral categories, e.g. local versus regional sources, anthropogenic versus naturalsources, using compositional data (chemical mass balance), in combination withtracers, isotope measurements and back-trajectory analysis.
Where very large aerosol and precursors sources are to be expected, twoAEROSOL sites will be simultaneously operated, one inside the source area andone outside, in a prevailing downwind location. Differences in composition/size atthese twin-sites will provide insight in the relative importance of primaryemissions inside the source region and secondary aerosol (formation) downwind.These data will be used to test models of aerosol evolution.
The data and models will finally guide the planning for one or two Lagrangianprocess-studies in which the evolution of aerosol properties will be followed as afunction of travel time from a major source area. These process studies willnecessitate fast physical aerosol characterisation to complement the relativelyslow chemical measurements.
Models and field studies will be used in an iterative way to evaluate and improvemodel descriptions of secondary aerosol formation and evolution. Thesedescriptions will be incorporated in 3-D regional transport models.
Structure of AEROSOL and relation with other subprojects
At the workshop the structure of the subproject will be presented. It can also befound in the workplan of AEROSOL. Information necessary for our research, likeemissions of gaseous precursors and particles and chemical transformation ofgases, to name a few items, come from other subprojects in EUROTRAC. Thesubproject AEROSOL has a close co-operation with the group of atmospheric
EMEP/CCC-Report 9/2000
73
scientists working on the mechanism of he transformations of VOC’s. The reasonis that important end products of these reactions are aerosol components.
Activities
1998 Annual report
The 1998 annual report, which is at the moment in print and will be available viathe secretariat of EUROTRAC, provides information on the activities. Thehighlight in 1998 was the PIPAPO campaign in early summer, see below.
AEROSOL-3-day workshop March 1999
In March 1999 a 3-day symposium was held at which the PI’s presented theirindividual annual reports and where the task-groups discussed the status ofresearch and plans. Also the concept of the twin-sites was extensively discussed,using experience in the PIPAPO campaign, see below. The need of modellers foraerosol data and the availability of data was discussed, first within the task-groupsand thereafter in a plenary discussion. Results of the workshop were documentedin the minutes of the meeting in which also the main conclusions of the subtask-groups on measurements were reported in detail.
Major conclusions coming from the workshop are:
• Black carbon: several presentations showed that the instrumental absorptionefficiency of 19 m2/g as used in the aethalometer is too high, and values of 9.3to 10 m2/g were suggested instead.
• Within the problem of elemental and organic carbon one should also discusshow sampling artefacts (mainly of the organics) are avoided. Examples: O3
denuder during sampling
Twin-site approachThe “Twin”-site concept of AEOSOL was extensively discussed on the basis ofexperience gained in the PIPAPO campaign, see below, and at the twin-site ofLeipzig-Melpitz. It was concluded that a simple source receptor relation is noteasy to establish and furthermore it appears that the two stations of a twin-siteshould be situated at larger distances than projected in the design-phase ofAEROSOL. The larger distance should allow sufficient time for formation of thesecondary products to be detectable. This will be further discussed at the comingworkshop of AEROSOL in March 2000 to come to optimum design of such“simple” Lagrangian studies.
Analysis of carbon in aerosolIn conjunction with the mentioned “carbon shoot-out” there was a livelydiscussion on the collection of aerosol for assessment of the amount of organicaerosol material. At present, none of the participants is handling possible“positive” (adsorption of gases) or negative (evaporation of collected material)sampling artefacts. Some had experimented with the use of double (sequential)filters to assess the extent of such artefacts. Differentiation could be done in broadclasses according to solubility, such as water-soluble and organic solventextractable, with the latter separated in subclasses according to polarity.

EMEP/CCC-Report 9/2000
74
PIPAPO
This was a EUROTRAC-LOOP initiative near the city of Milan, in which3 institutes of AEROSOL participated to search for a possible correlation betweenoxidant and aerosol formation. Automated devices to measure the major ionicspecies in aerosol were successfully operated there for the first time side by side.Whatman 41 paper filters had much better agreement with the continuous aerosolcollector systems for nitrate and ammonium than quartz filters. Other,preliminary, results of the campaign can be found in the 1998 annual report ofAEROSOL. The campaign showed the real-life complexity of the simple source-receptor concept of “Twin”-sites.
Carbon shoot-out
In the course of 1998 a major initiative of H. Puxbaum, which fitted extremelywell with our plans, was put under the umbrella of AEROSOL: This is the“carbon-shoot-out” which aims in first making an intercomparison of techniquesused for determination of the amount of total carbon and “organic” carbon, usingprepared filter samples and filters with collected material from at various sites.Those were/are: A) Urban high exposure B) Urban high exposure preextracted C)Urban low exposure. The first results are currently under evaluation.
Ammonium nitrate sampling workshop
In June 1999 a workshop was held at which an automated device for measurementof ammonium nitrate and other artefact-free tools for proper collection andanalysis were compared. (The Swiss group suffered a severe accident on the wayto the workshop and was not present with their automated instrument). Alsosimple filter techniques were involved. The tests were performed with pureammonium nitrate in the reproducible setting of a wind-tunnel. The incompletesampling of ammonium nitrate on quartz filters, as found in the PIIPAPOcampaign, could be substantiated. It was further found that paper-filter collectsnitric acid gas. This first evaluation of the results and other findings, recentlyevaluated by the participants, will be used as input in the discussion at the presentworkshop. The detailed results will be presented on the EUROTRAC symposiumof March 2000.
Activities 2000
A field intercomparison in Melpitz near Leipzig is in preparation in which allparticipants are involved, either having either measuring tools there or analysingcollected material.
Twin-site studies were proposed within the 5th framework program of the EU.Unfortunately these efforts were not approved of. The new approach is based on(bi)national initiatives. It would be very welcomed when these efforts could andwould be combined with EMEP initiatives for supersites.
EMEP/CCC-Report 9/2000
75
The regional aerosol transport and dynamics model MADE –applications to Europe
by
I.J. Ackermann, H. Hass and B. Schell
Ford Research Centre AachenSüsterfeldstr. 200, D- 52066 Aachen, Germany
The Aerosol Model MADE
In order to fulfill their scientific tasks state-of-the-art air quality models have to becapable of predicting particulate matter in addition to the gas-phase concen-trations. A suitable model aerosol model has for the application in complexregional transport models has to provide sufficient information on the chemicalcomposition as well as on the size distribution of the particles. Furthermore it hasto be integrated into a photochemical model in order to be able to represent thenumerous interactions between the phases. On the other such a model has to becomputationally efficient to enable its use for numerous sensitivity studies. Such amodel has been developed with MADE which is based on the Regional ParticulateModel (RPM) and has been implemented into the regional model system EURAD.The model system has been applied in a one-way nesting scheme from theregional to the urban scale.
Figure 1 shows the current model structure of the aerosol model. The sizedistribution is approximated by three different modes spanning the size range ofatmospheric particles. Each mode is described by a log-normal size distributionthat is specified by the number concentration, the surface concentration and themass concentration in each mode. The mass concentration is further sub-dividedinto the chemical compounds of tropospheric particles that are currently given byinorganic ions (sulfate, nitrate and ammonium), secondary organic compounds (in4 different biogenic and anthropogenic species each), water and secondaryparticles. The model can treat different kinds of secondary particles depending onthe availability of appropriate emission inventories. New particle formation bynucleation, growth by condensation, coagulation, sedimentation, aerosol-cloudinteraction and transport processes are taken into account.
Although this model describes a rather complex aerosol system, it still can be usedon large grids without causing an extensive computational burden.
Secondary Organic Particles
The aerosol model has recently been extended to include secondary organicparticles, i.e. the particles that result from the low-vapor pressure products that areformed in gas-phase oxidation processes in the atmosphere. First applications ofthis model system to an episode in July 1994 show that these compounds cannotbe neglected in assessing the tropospheric PM load.

EMEP/CCC-Report 9/2000
76
Figure 2 shows an example of the daily average secondary organic PM massresulting from biogenic and anthropogenic precursors. It can be clearly seen thatthe biogenic contribution to the total mass is significant. However these results arestrongly sensitive to the biogenic VOC emission parameterization used. Due tothe formation process of these particles, where the new mass formation isdependent on the mass that is already available, strong and non-linear interactionsbetween the phases might occur.
Secondary Inorganic PM
Inorganic ions comprise a major fraction of tropospheric PM2.5. Figure 3 showsthe response of the model to a reduction in SO2 emissions, i.e. one of the mostimportant precursor species of these aerosol particles. Whereas the sulphateaerosol concentration shows the expected reduction due to the precursor reduction,it can be seen that the atmospheric bad of nitrate particles is increasing in someregions. This replacement of sulphate with nitrate aerosol might offset the benefitof emission reduction measures significantly, in some instances even leading to anincreased PM2.5 load.
An additional effect is a possible change in particle size distribution. Due to thestrong impact of sulphuric acid vapour on nucleation processes, a reduction ofSO2 emissions might enhance nucleation, thus reducing the aerosol mass bad butincreasing the number concentration.
Standard Stringency
Since two new EU-wide PM air-quality standards are planned for 2010 it seemsworthwhile to investigate the relative stringency of these standards. Given thevalues for the annual and daily standard the ratio as defined in figure 4 can beused for this investigations. For values of this ratio larger 2.5 the daily standardcan be considered more stringent and vice versa.
An analysis of PM10 measurements for different European countries in 1997 astaken from the EEA database shows strong geographical differences, with e.g. theannual standard being more stringent in the UK in contrast to the Czech Republic.Both standards where commonly exceeded in 1997.
Acknowledgments
The continued support from Dr. Francis S. Binkowski from the US-EPA and fromthe EURAD group (University o. Cologne), in particular E. Friese and Dr.M. Memmesheimer is gratefully acknowledged.

EMEP/CCC-Report 9/2000
77
Figure 1: Structure of the Aerosol Dynamics Module MADE.

EMEP/CCC-Report 9/2000
78
Figure 2: Simulated secondary organic aerosol concentration on July 26th 1994, 24-hour-averages in µg/m3. Shown are results for the anthropogenic (top) andbiogenic (bottom) secondary aerosol component in the model surface layer.

EMEP/CCC-Report 9/2000
79
Figure 3: Response of accumulation mode sulphate aerosol (top) and accumulationmode nitrate aerosol (bottom) to a 50% reduction in SO2 emissions. Valuesare given in µg/m3 in the model surface layer as difference betweenreduction and base case simulation.

EMEP/CCC-Report 9/2000
80
Figure 4: Analysis of relative stringency of daily and annual PM standard. See Textfor further details.

EMEP/CCC-Report 9/2000
81
Concentrations of Primary Particulate Matter over Europe
by
H.M. ApSimon & T. Gonzalez del Campo
Imperial College, London
Introduction
As a result of epidemiological evidence linking adverse effects on human health toparticulate exposure, there is currently much concern about concentrations of fineparticulate matter (PM10 and PM2.5). The European Commission has introducednew limits on particulate matter under an Air Quality Daughter Directive,reflecting control of episodic exposure (24-hour concentrations in excess of 50 µgm-3), and annual mean concentrations. In this context local pollution in populatedareas has to be superimposed on pollution imported from long-range transport,which can be substantial. We have previously indicated that a new multi-pollutantmulti-effect protocol will bring a significant improvement in reducing theconcentrations of secondary particulate material resulting from oxidation ofgaseous SO2, NOx and NH3 emissions across Europe. This note is concerned withthe complementary contribution from long-range transport of primary particulateemissions.
European emissions of primary particulate material
The only consistent pan-European inventory currently available is from a study byTNO (TNO, 1997), which provided estimates for emissions of the years 1990 and1993. Recognising that it may be the finer particulate fraction below 2.5 micronsin size which is most important for human health, in addition to PM10 emissions,TNO have also estimated emissions of PM2.5; and also of the ultra fine particles,PM0.1. The total European emission of PM10 (excluding the former Soviet Union)in 1990 is estimated at 5.1 million tonnes. Corresponding totals for PM2.5 andPM0.1 are 2.9 million tonnes and 3.8 thousand tonnes, respectively. This sizedifferentiation is also important for modelling the atmospheric transport of theparticles. According to the TNO inventory over half the 5.1 million tonnes of PM10
arose from stationary combustion (2.8 million tonnes). In addition there is 0,84million tonnes from transport, another 0.94 from process emissions and 0.44 fromagriculture.
For the modelling results presented below the TNO emissions have been mappedonto the EMEP grid by assigning national emissions to grid squares in proportionto the NOx emissions. This is an approximation to the real distribution, but issufficient for preliminary modelling studies and commensurate with the level ofdetail in the inventories.

EMEP/CCC-Report 9/2000
82
Annual average concentrations of primary PM10 and PM2.5 for 1990emissions
A simple model has been applied to simulate the atmospheric transport of primaryparticulate material across Europe, coupled with the emissions inventorydescribed above. The model is derived from a model originally used forradioactive material. It is a statistical model, based on trajectory roses, andincludes gravitational settling and dry deposition, which are dependent on theparticle size; wet deposition is treated probabilistically by transitions from dry towet and wet to dry periods along trajectories. The calculated concentrationsrepresent average values over EMEP grid cells, but without allowing for therestricted local scale dispersion close to major sources or within urban areas.
The first and second figures appended give maps for the 1990 emissions describedabove, of the modelled concentrations of PM10 and PM2.5, respectively, withouttaking into account the contributions from the local sources, i.e. only consideringlong-range transport. The highest concentrations of PM10 indicated are around 8 to9 µg m-3 over central Europe, falling to 1–2 µg m-3 in the peripheral areas ofEurope. For PM2.5 the highest concentrations are lower at about 6 µg m-3, but thereis less difference from the total PM10 in more remote areas. This is consistent withlonger-range transport of the finer PM2.5 part of the overall PM10 emissions.
Although the concentrations in outer areas of Europe are small, the model impliesthat long-range transport can still give rise to substantial contributions to episodesof high concentration. For example with trajectories from central Europe to theUK corresponding to winter anti-cyclonic conditions with limited mixing, theimported contributions over London can be up to 15 to 30 µg m-3 (AEPG report,1999).
The third and fourth figures show the modelled concentrations of PM10 and PM2.5
respectively, taking into account the contribution from the local sources. In thiscase, the highest concentrations of PM10 can reach a maximum of 18 µg m-3, with anumber of areas over central Europe reaching 10 to 12 µg m-3. Again in this case,the peripheral areas of Europe have concentrations of 1–2 µg m-3. For PM2.5 thehighest concentrations are lower at about 10 to 11 µg m-3, with, again, lessdifference from the total PM10 in more remote areas.
For development of integrated assessment modelling to address primary PM10,preliminary source-receptor matrices have already been derived on a country togrid basis for the whole of Europe. These can be improved as more detailedmodelling is undertaken. We are now concerned with the emissions data andassociated cost curves. It is also recognised that steps taken to reduce SO2 andNOx will also reduce primary particulate emissions; for example fitting FGD willalso scrub particulate material efficiently. Thus primary PM10 emissions andconcentrations will be reduced over central Europe since 1990 with the measuresalready taken there. It would therefore be useful to assess the side benefit of themeasures indicated in the G5/2 scenario with respect to primary PM10 as well assecondary particulates.

EMEP/CCC-Report 9/2000
83
References:
TNO (1997) particulate matter emissions (PM10, PM
2.5, and PM
0.1) in Europe in 1990 and
1993. TNO report TNO-MEP-R96/472. Netherlands, February 1997.
APEG (1999) Source apportionment of airborne particulate matter in the UnitedKingdom.
N.B. A more detailed paper on the modelling of primary particulates over Europeis in preparation.
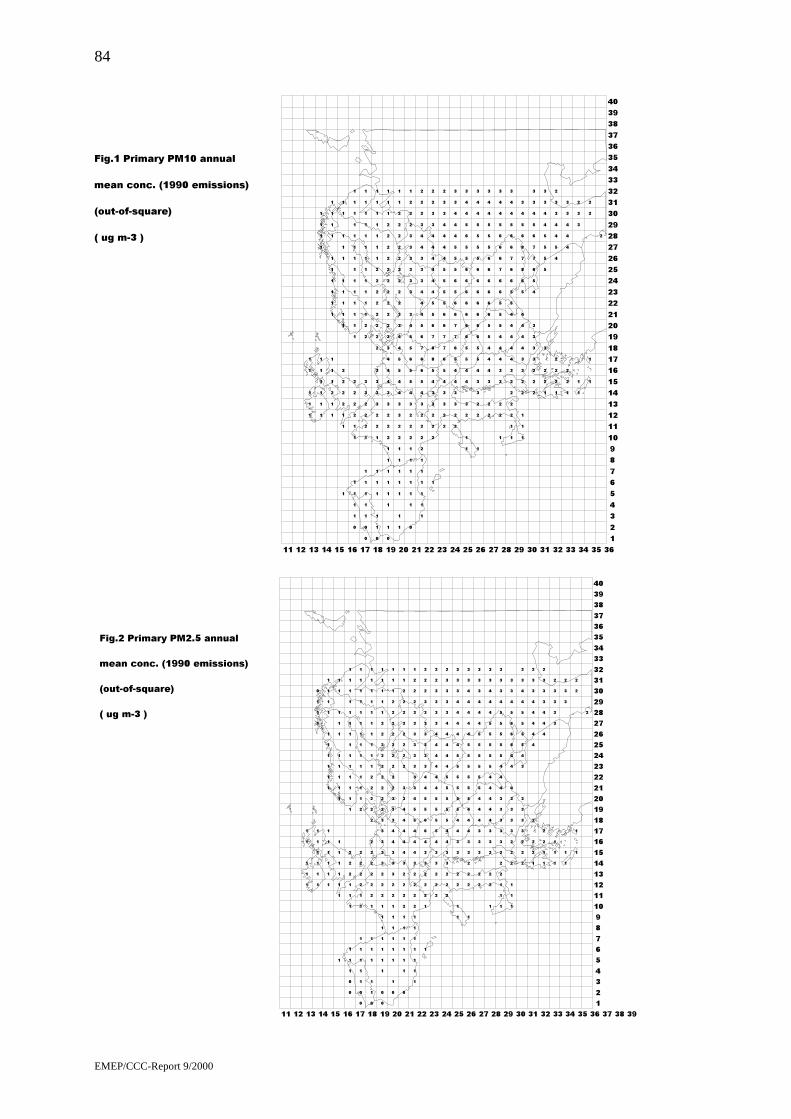
EMEP/CCC-Report 9/2000
84
1
1
1
1
1
1
1
1
1
1
1
1
1
1
1
1
1
2
1
1
1
1
1
1
1
1
1
1
1
1
1
1
1
1
2
2
2
2
1
1
1
1
1
1
1
1
1
1
0
1
1
1
1
1
1
2
2
2
2
1
1
1
1
1
1
1
1
1
1
1
1
1
1
0
0
1
1
1
1
1
1
2
2
2
3
3
2
2
1
1
1
1
1
1
1
1
1
1
1
1
0
1
1
1
1
1
1
2
2
3
3
3
3
2
2
2
2
2
2
2
2
1
1
1
1
1
1
1
0
1
1
1
1
1
1
1
2
2
2
3
3
4
4
4
3
3
2
2
2
2
2
2
2
2
2
2
1
1
1
1
1
1
1
1
1
1
2
2
3
3
4
4
5
5
4
4
3
3
2
2
2
2
2
2
2
2
2
1
1
0
1
1
1
1
1
1
2
2
2
3
4
5
5
6
5
5
4
3
3
3
3
3
3
3
2
2
2
1
1
1
1
1
1
1
2
2
2
2
3
4
5
6
6
7
6
5
4
4
4
3
3
3
4
4
3
2
2
2
1
2
2
2
3
3
4
5
8
8
7
6
5
5
4
4
4
4
4
4
3
3
2
2
2
2
3
3
4
5
6
7
7
6
6
5
5
5
5
4
4
4
4
3
3
2
2
2
3
3
4
4
5
6
7
7
6
6
5
6
5
5
5
4
4
4
3
3
1
1
2
3
4
4
5
5
6
6
6
6
6
6
6
5
5
6
5
4
4
3
1
2
2
3
3
4
5
5
6
6
6
6
6
6
6
5
5
5
5
4
4
3
2
2
3
4
4
4
5
5
6
6
6
6
6
6
5
5
5
4
4
3
1
2
2
3
3
4
4
4
5
5
5
6
6
7
6
6
6
5
4
4
3
1
1
2
2
2
2
3
4
4
4
4
4
5
5
6
6
7
6
6
5
4
4
3
1
1
1
2
2
3
3
4
4
4
4
5
6
8
7
8
6
5
4
3
2
2
2
3
3
3
3
4
5
6
7
7
6
5
4
3
3
1
2
2
3
5
5
5
5
4
4
3
3
1
2
2
2
4
5
4
4
3
3
2
1
2
2
4
4
4
3
3
1
1
3
3
2
1
1
2
2
2
Fig.1 Primary PM10 annual
mean conc. (1990 emissions)
(out-of-square)
( ug m-3 )
11 12 13 14 15 16 17 18 19 20 21 22 23 24 25 26 27 28 29 30 31 32 33 34 35 3612345678910111213141516171819202122232425262728293031323334353637383940
1
1
1
1
1
1
1
1
1
1
1
1
1
1
0
1
1
1
1
1
1
1
1
1
1
1
1
1
1
1
1
1
1
1
1
1
1
1
1
1
1
1
1
1
1
1
1
1
0
0
1
1
1
1
1
1
2
2
2
1
1
1
1
1
1
1
1
1
1
1
1
1
1
0
0
1
1
1
1
1
1
1
2
2
2
2
2
1
1
1
1
1
1
1
1
1
1
1
1
1
0
1
1
1
1
1
1
2
2
2
2
2
2
2
2
2
2
2
1
1
1
1
1
1
1
1
1
1
0
0
1
1
1
1
1
1
1
2
2
2
3
3
3
3
3
2
2
2
2
2
2
2
2
2
1
1
1
1
1
0
1
1
1
1
1
1
1
2
2
3
3
3
4
4
3
3
3
2
2
2
2
2
2
2
2
2
1
1
1
0
1
1
1
1
1
1
2
2
2
2
3
4
4
4
4
4
3
3
2
2
2
2
2
2
2
2
1
1
1
1
1
1
1
1
1
2
2
2
2
3
4
4
4
5
5
4
3
3
3
3
3
3
3
3
2
2
2
1
1
1
2
2
2
3
3
4
6
6
5
5
4
4
3
3
3
3
3
3
3
2
2
2
2
2
2
3
3
4
5
5
5
5
4
4
4
4
4
4
3
3
3
3
2
2
2
2
2
3
3
4
4
5
5
5
5
5
4
4
4
4
4
3
3
3
3
2
1
1
2
2
3
3
4
4
5
5
5
5
5
5
4
4
4
4
4
3
3
3
1
2
2
2
3
3
4
4
4
5
5
5
5
5
5
4
4
4
4
4
3
3
2
2
3
3
3
4
4
4
5
5
5
5
5
5
4
4
4
3
3
3
1
2
2
2
3
3
4
4
4
4
4
5
5
5
5
5
4
4
4
3
3
1
1
1
2
2
2
3
3
3
3
3
4
4
4
5
5
5
5
5
4
3
3
3
1
1
1
2
2
2
3
3
3
3
4
4
4
6
6
6
5
4
3
3
2
2
2
3
3
3
3
3
4
5
5
5
5
4
4
3
2
1
2
2
2
4
4
4
4
4
3
3
2
1
1
2
2
4
4
4
3
3
3
2
1
1
1
3
3
3
3
2
1
1
3
3
2
1
1
2
2
2
Fig.2 Primary PM2.5 annual
mean conc. (1990 emissions)
(out-of-square)
( ug m-3 )
11 12 13 14 15 16 17 18 19 20 21 22 23 24 25 26 27 28 29 30 31 32 33 34 35 36 37 38 3912345678910111213141516171819202122232425262728293031323334353637383940

EMEP/CCC-Report 9/2000
85
18
17
15
12
12
12
12
11
11
11
10
10
10
10
10
9
9
9
9
9
9
9
8
8
8
8
8 8
8
8
8
8
8
8
8
8
8
8
8
8
8
8
7
7
7
7
7
7
7
77
7
7
7
7
7
7
7
7
7
7
7
7
7
7
77
7
7
77
7
7
7
7
7
7
7
6
6
6
6
6
6
6
6
6
6
6
6
6
6
6
6
6
6
6
6
6
6
6
6
6 6
6
6
6
6
6
6
6
6
6
6
65
5
5
5
5
5
5
5
5
5
5
5
5
5
5
5
5
5
5
5
5
5
5
5
5
5
5
5
5
5
5
5
5
5
5
5
5
5
5
5
5
5
5
5
5
5
5
5
4
4
4
4
4
4
4
4
4
4
4
4
4
44
4
4
4
4
4
4
4
4
4
4
4
4
4
4
4
4
4
4
4
4
4
4
4
4
4
4
4
4
4
4
4
4
4
4
4
4
4
4
4
4
3
3
3
3
33
3
3
3
3
3
3
3
3
3
3
3
3
3
3
3
3
3
3
3
3
3
3
33
3
3
3
3
3
3
3
3
3
3
3
3 3
3
3
3
33
3
3
3
3
3
3 3
3
3
3
3
3
3
3
3
3
3
2
2
2
22
2
2
2
2
2
2
2
2
2
2
2
2
2
2
2
2
2
2
2
2
2
2
2
2
2
2
2
2
2
2
2
2
2
2
2
2
2
2
2
2
2
2
2
2
2
22
2
2
2
2
2
2
2
2
2
2
2
2
2
2
2
2
2
2
2
2
2
2
2
2
2
2
2
2
2
2
2
2
2
2
2
2
2
2
2
2
1
1
1
1
1
1
1 1
1
1
1
1
1
1
1
1
1
1
1
1
1
1
1
1
1
1
1
1
1
1
1
1
1
1
1
1
1
1
1
1
1
1
1
1
1
1
1
1
1
1
1
1
1
1
1
1
1
1
1
1
1
1
1
1
1
1
1
1
1
11 1
1
1
1
1
1
1
1
1
1
1
1
1
1
1
1
1
1
1 1
1
1
1
1
1
1
1
1
1
1
1
1
1
1 11
1
11
1
1
1
11
1
1
1 1
1
1
1
1 1
1
0 0
Fig 3. Primary PM10 annual
mean conc. (1990 emissions)
(incl. in-square)
( ug m-3 )
11 12 13 14 15 16 17 18 19 20 21 22 23 24 25 26 27 28 29 30 31 32 33 34 35 36 37 38 3912345678910111213141516171819202122232425262728293031323334353637383940
11
11
10
8
8
8
8
8
8
7
7
7 7
7
7
7
6
66
6
6
6
6 6
6
6
6
6
6
6
6
6
6
6
6
6
6
6
6
6
6
6
5
55
5
5
5
5
5
5
5
5
5
5
5
5
5
5
5
5
5
5
5
55
5
5
5
5
5
5
5
5
5
5
5
5
5
5
5
5
5
5
5
5
5
5
5
5
5
5
5
5
5
5
5
5
5
5
5
5
4
4
4
4
4
4
4
4
4
4
4
4
4
4
4
4 4
4
4
4 4
4
4
4
4
4
4
4
4
4
4
4
4
4
4
4
4
4
4
4 4
44
4
4
4
4
4
4
4
4
4
4
4
4
4
4
4
4
4 4
4
4
4
4
4
3
3
3
3
3
3
3
3
3
3
3
3
3
3
3
3
3
3
3
3
3
3
3
3
3
3
3
3
3
3
3
3
3
3
3
3
3
3
3
3
3
3 3
3
3
3
3
3
3
3
3
3
3
3
3
3
3
3
3
3
3 33
3
3
3
3
3
3
3
3
3
3
3
33
3
3
2
2
2
2
2
2
2
2
2
2
2
2
2
2
2
2
2 2
2
22
2
2
2
22 2
2
2
2
2
2
2
2
2
2
2
2
2
2
2
2
2
2
22
2
2
2
2
2
2
22
2
2
2
2
2
2
2
2
2
2
2
2
2
2
2
2
2
2
2
2
2
2
2
2
2
2
2
22
2
2
2
2
2
2
2
2
2
2
2
2
2
1
1
1
1
1
1
1
1
1
1
1
1
1
1
1
1
1
11
1
1
1
1
1
1
1
1
1
1
1
1
1
1
1
1
1
1
1
1
1
1
1
1
1
1
1
11
1
1
1
1
1
1
1
1
1
1
1
1
1
1
1
1
1
1
1
1
1
1
1 1
1
1
1
1
1
1
1
1
1
1
1
1
1
1
1
1
1
1
1
1
1
1
1
1
1
1
1
1
1
1
1
1
1
1
1
1
1
1
1
1
1
1
1
1
1
1
1 11 1
1
1
1
1
1
1
1
1
1
1
1
1
1
1
1
1
1
11
1
1
11
1
1
1
1
1
1
1
1
11
0
0
00 0
Fig 4. Primary PM2.5 annual
mean conc. (1990 emissions)
(incl. in-square)
( ug m-3 )
11 12 13 14 15 16 17 18 19 20 21 22 23 24 25 26 27 28 29 30 31 32 33 34 35 36 37 38 3912345678910111213141516171819202122232425262728293031323334353637383940

EMEP/CCC-Report 9/2000
86

EMEP/CCC-Report 9/2000
87
Results of the heavy metal measurements at the EMEP Stations inLatvia
by
D. Bahareva, I. Lyulko and M. Frolova
Environmental Quality Observation DepartmentLatvian Hydrometeorological Agency
165, Maskavas str., Riga LV-1019, LatviaFax: 7 145 154, tel.: 7 032 639, e-mail: [email protected]
I. Introduction
The Latvian Hydrometeorological Agency started the heavy metal measurementsin 1972, first in river waters than in the air and precipitation. In the areas of theLatvian integrated monitoring stations, Zn, Pb, Cu and Cd measurements havebeen included in the programme activities of the EMEP stations Rucava andZoseni since 1993-1994 (Table 1).
The present material provides the characterization of heavy metals in air andprecipitation at the EMEP stations in the period 1994-1998.
Table 1: Heavy metal measurement programme.
Subprogramme Parameters Started Periodicity
Precipitation (DC) Cu, Cd, Pb, Zn 1993 Monthly exposure
Ambient air (AC) Cu, Cd, Pb, Zn 1994 Weekly exposure
Figure 1: Scheme of Rucava and Zoseni stations.

EMEP/CCC-Report 9/2000
88
The regional GAW/EMEP station Rucava is situated between 56°10'N 21°11'E, inthe south-west of Latvia, some 10 km east from Baltic Sea and 50 km south fromthe city of Liepaja. The altitude is 18 above the Baltic Sea level.
The regional GAW/EMEP station Zoseni is situated between 57°08'N 25°55'E, inthe east of the country, some 10 km south-east from the city of Cesis. The altitudeof the station is 183 m.
II. Methodology
The analyses techniques for metals determination are acidification, filtration andmetal concentration by liquid extraction (for precipitation samples) and ashing,evaporation to wet salts, dissolution (for aerosol samples). The Cu and Zn wereanalyzed by Flame Atomic Absorption Spectrometry and Cd, Pb by GraphiteFurnace Atomic Absorption Spectrometry.
The analyses of heavy metals from the various environments rested on themonthly mean, annual mean and mean for 1994-1998 concentrations (Table 2).
The present results help us to compare the heavy metal concentrations betweentwo stations, and follow up the intraannual dynamics of heavy metals in air andprecipitation.
Table 2: Heavy metals, mean annual concentrations.
Rucava 1994 1995 1996 1997 1998 1994-98
Air, ng/m3
Cd 0.32 0.28 0.27 0.38 0.14 0.28Cu 2.41 4.48 1.77 1.88 0.79 2.27Pb 9.78 7.34 6.72 10.49 1.65 7.20Zn 24.10 26.35 28.59 36.13 14.46 25.9
Precipitation, µg/lCd 0.28 0.22 0.29 0.16 0.21 0.23Cu 3.56 1.35 5.48 1.67 0.88 2.59Pb 5.91 5.61 7.02 5.08 3.11 5.33Zn 19.69 19.98 16.78 18.50 15.70 18.1
Zoseni 1994 1995 1996 1997 1998 1994-98
Air, ng/m3
Cd 0.46 0.27 0.18 0.16 0.21 0.26Cu 6.06 2.94 1.38 1.77 1.02 2.63Pb 4.19 5.85 3.34 3.47 2.75 3.92Zn 34.14 37.50 26.19 *** 9.49 26.8
Precipitation, µg/lCd 0.34 0.16 0.23 0.38 0.09 0.24Cu 5.30 4.39 4.33 5.19 2.12 4.27Pb 3.63 6.38 4.72 4.57 2.32 4.32Zn 15.11 19.88 18.34 14.88 19.08 17.46

EMEP/CCC-Report 9/2000
89
III. Results
The Zn concentrations in the air and precipitation at the EMEP stations were atthe same level (Figure 2).
Somewhat higher concentrations of Zn in the air of the EMEP stations wererecorded in the cold period of the year. The increase is more marked at Zoseni.
The concentration of Zn decreased as a rule with the increase in the precipitationamount, especially at the EMEP station Zoseni (Figure 3).
The concentrations measured in the air and precipitation at the EMEP stationswere normally 3 to 10 times lower than those observed in towns close to thestations.
The lowest mean annual wet Zn depositions measured 10.7 mg/m2 at Rucava(EMEP) and 10.2 mg/m2 at Zoseni (EMEP). The observational stations located insmall and large towns reported concentration from 12.4 mg/m2 and 42.7 mg/m2.
�
�
��
��
��
��
��
$& HPHS '& HPHS
Rucava =RVKQL
Figure 2: Zinc annual average concentrations in air (ng/m3) and precipitation (µg/l),1994-1998.
Rucava Zoseni
020406080
100120140
I II III IV V VI VII VIII IX X XI XII
Zn prec. Zn air H, mm
0
20
40
60
80
100
120
I II III IV V VI VII VIII IX X XI XII
Zn prec. Zn air H, mm
Figure 3:Intraannual dynamics of Zn in precipitation (µg/l) and air (ng/m3), 1994-1998.

EMEP/CCC-Report 9/2000
90
Higher concentrations of Pb were measured at Rucava that at Zoseni (Figure 4).
$& HPHS '& HPHSR ucava =RVKQL
Figure 4: Pb annual average concentrations in air (ng/m3) and precipitation (µg/l),1994-1998.
The intraannual dynamics of Pb in the air and precipitation showed the maximumvalues in the cold period of the year in poor precipitation (Figure 5).
Rucava Zoseni
02468
101214
I I I I V V I I I X XI
Pb
02040608010 012 014 0
H,m
m
Pb p rec . Pb a ir H, mm
0
2
4
6
8
1 0
1 2
I III V V II IX X I
Pb
0
2 0
4 0
6 0
8 0
1 00
1 20
H,m
m
P b p re c . P b a ir H , m m
Figure 5: Intraannual dynamics of Pb in precipitation (µg/l) and air (ng/m3),1994-1998.
The air and precipitation concentrations of Pb were 2-7 times and 1.5 times lowerat the EMEP stations Rucava and Zoseni, respectively as compared to thoseobserved in the neighbouring towns.
The Cu concentrations are alike in the atmospheres of both EMEP stations(Figure 6).
In the intraannual dynamics, copper peaked in the air and precipitation in the coldperiod of the year, in low water discharge and poor precipitation (Figure 7).

EMEP/CCC-Report 9/2000
91
00.5
11.5
22.5
33.5
44.5
$& HPHS '& HPHS
Rucava =RVKQL
Figure 6: Cu annual average concentrations in air (ng/m3) and precipitation (µg/l),1994-1998.
In the intraannual dynamics, copper peaked in the air and precipitation in the coldperiod of the year, in low water discharge and poor precipitation (Figure 7).
Rucava Zoseni
0
1
2
34
5
6
7
8
I III V V II IX X I
Cu
02 04 06 08 01 0 01 2 01 4 0
H,m
m
C u p re c . C u a ir H , m m
02468
1 01 21 41 61 8
I III V V II IX X I
Cu
0
2 0
4 0
6 0
8 0
1 0 0
1 2 0
H,m
m
C u p re c . C u a ir H , m m
Figure 7: Intraannual dynamics of Cu in precipitation (µg/l) and air (ng/m3),1994-1998.
The EMEP stations reported the same levels of Cd in the air and precipitation(Figure 8).
The cold period of the year was characterized by increased Cd concentrations inthe air and precipitation (Figure 9).

EMEP/CCC-Report 9/2000
92
0
0.05
0.1
0.15
0.2
0.25
0.3
$& HPHS '& HPHSRucava =RVKQL
Figure 8: Cd annual average concentrations in air (ng/m3) and precipitation (µg/l),1994-1998.
Rucava Zoseni
0
0 .2
0 .4
0 .6
0 .8
I III V V II IX X I
Cd
02 04 06 08 01 0 01 2 01 4 0
H,m
m
C d p re c . C d a ir H , m m
0
0.1
0 .2
0 .3
0 .4
0 .5
0 .6
I III V V II IX XI
Cd
0
20
40
60
80
100
120
H,m
m
C d p rec . C d a ir H , m m
Figure 9: Intraannual dynamics of Cd in precipitation (µg/l) and air (ng/m3),1994-1998.
The values of Cd at background stations correlate with those in the areas underhigh anthropogenic impact.
Conclusions
The observation results for the period 1994-1998 allow to establish that:
• the heavy metal concentrations in air and precipitation are higher during thecold period of the year, in poor precipitation;
• the Zn and Cd concentrations are alike of both EMEP stations; the higher leadconcentrations are present in air at the Rucava station ; the station Zosenireported higher Cu concentration in precipitation;
• the Zn, Pb and Cu concentrations measured in the air and precipitation at theEMEP stations were lower than those observed in towns close to the stations,the values of Cd at the background stations correlate with those in the areasunder high anthropogenic impact;

EMEP/CCC-Report 9/2000
93
• for the provision of the adequate assessment of the heavy metal concentrationit is necessary to unify the sampling equipment and enhance the analytical andsampling facilities, including reagents, standards, spare parts.
References
1. Background quality of the natural environment in the Republic of Latvia(observation results under the regional GAW/EMEP/ICP-IM, 1994-1996). InI. Lyulko (ed.). Latvian Hydrometeorological Agency, Environmental PollutionObservation Centre, Riga, 1998.
2. Environmental quality in Latvia. Annual Report 1998. In I. Lyulko (ed.). LatvianHydrometeorological Agency, Environmental Pollution Observation Department,Riga, 1998.

EMEP/CCC-Report 9/2000
94

EMEP/CCC-Report 9/2000
95
Aerosol Measurements: Providing the Data for the Quantificationof Aerosol Impact on Climate
by
U. Baltensperger, E. Weingartner, S. Henning, S. Nyeki
Paul Scherrer Institute, CH-5232 Villigen PSI, Switzerland
Aerosols may influence the atmosphere in two important ways, through direct andindirect effects (see Schwartz, 1998). Direct effects refer to the scattering andabsorption of radiation and their subsequent influence on planetary albedo and theclimate system. Indirect effects refer to the increase in available cloudcondensation nuclei (CCN) due to an increase in anthropogenic aerosol concen-tration. This is suspected to increase the cloud droplet number concentration for aconstant cloud liquid water content (LWC). As a result, the increase in cloudalbedo is predicted to influence the Earth’s radiation budget. Cloud lifetimes andprecipitation frequencies are also thought to be affected. Despite the uncertainty, itis believed that in regions with high anthropogenic aerosol concentrations, aerosolforcing may be of the same magnitude, but opposite in sign to the combined effectof all greenhouse gases (Schwartz and Andreae, 1996). More information may forinstance be found in IPCC (1995) or Baltensperger and Nyeki (1998).
It is the goal of GAW to ensure long-term measurements in order to detect seculartrends (WMO, 1997). With respect to aerosols, the objective of GAW is todetermine the spatio-temporal distribution of aerosol properties related to climateforcing and air quality up to multi-decadal time scales. Here it is interesting tonote that while much of the recent international focus has been directed atassessing the impact of human activities on regional and global scales, there isgrowing recognition that the management of urban environments requires specialattention, and has resulted in an increasing interest in regional air quality withinWMO.
Since the atmospheric residence time of aerosol particles is relatively short, a largenumber of measuring stations are needed. GAW consists of 20 Global stationswhich cover different types of aerosols: Clean and polluted continental, marine,arctic, dust, biomass burning, and free troposphere. Recently, the scientificadvisory group (SAG) for aerosols and optical depth within GAW madeadditional recommendations, mainly concerning better coverage of the pollutedcontinental aerosol type. In addition, there are about 300 Regional stations. WhileGlobal stations are expected to measure as many of the key variables as possible,Regional stations generally carry out a smaller set of observations.
In order to quantify the aerosol impact on climate, a range of aerosol parametersneed to be measured, as shown in equation 1 (Haywood and Shine, 1995):
( ) ( ) ( ){ }ωβωωβτ∆ /12112
1 220 −−−−−= RRATFF c . (1)

EMEP/CCC-Report 9/2000
96
Here, ∆F is the change in outgoing shortwave flux at the top of the atmosphere, F0
is the incoming solar flux at the top of the atmosphere, T is the transmittance ofthe atmosphere above the aerosol layer, Ac is the fractional cloudiness, τ is themean aerosol optical depth, β is the mean upscatter fraction (fraction of radiationscattered into the upward hemisphere), R is the surface reflectance, and ω is thesingle scattering albedo, which describes the ratio of the scattering coefficient σSP
to the extinction coefficient σEXT (σAP = absorption coefficient):
ω = σSP/σEXT = σSP / (σSP + σAP) (2)
The minus sign in equation (1) denotes convention that a negative forcing is acooling influence. The factor ½ arises from the fact that only half of the planet isilluminated at any time. The factor (1-R)2 accounts for multiple reflection betweenthe aerosol layer and the surface.
At the last SAG meeting, a revised list of aerosol parameters was presented withrecommendations that Regional stations should measure the optical depth, massconcentration and major chemical components in two size fractions, and thescattering coefficient. At Global stations, a larger number of measurements areenvisaged and are to include the Regional parameters list as well as, the scatteringand hemispheric backscattering coefficients at various wavelengths, the absorptioncoefficient, aerosol number concentration, cloud condensation nuclei (CCN)concentration at 0.5% supersaturation, and diffuse, global and direct solarradiation. Additional parameters such as the aerosol size distribution, detailed sizefractionated chemical composition, dependence on relative humidity, CCNconcentration at various supersaturations, and the vertical distribution of aerosolproperties should be measured intermittently at Global stations. However, suitableinstrumentation is not presently available for some of these parameters, and somecalibration procedures require further international research efforts.
Data measured at the Jungfraujoch since July 1995 show a seasonal variation ofσSP, the backscattering coefficient σBSP (which is related to β), σAP, the numberconcentration, and the surface area concentration S of aerosol particles at theJungfraujoch (Nyeki et al., 1998a), with a maximum in summer and a minimumin winter. This seasonal variation is about one order of magnitude except for theCN concentration where the variation is much smaller. A similar variation isfound in long-term aerosol measurements at the same site (Baltensperger et al.,1997) and is mainly due to the seasonal variation of thermal convection inducedby solar radiation (Lugauer et al., 1998).
One of the largest uncertainties in calculating direct aerosol forcing is as a resultof uncertainty in the single scattering albedo ω. All parameters in equation (2) areessentially known. However, at present there is no internationally acceptedcalibration procedure for the determination of σAP, which calls for urgent researchon this topic. A further point of uncertainty is that σSP is usually measured underdry aerosol conditions, even though relative humidity (RH) has a strong effect onσSP. Therefore, measurements which investigate the response of aerosolparameters to a change in RH will soon be started at the Jungfraujoch, using a so-

EMEP/CCC-Report 9/2000
97
called Hygroscopicity Tandem Differential Mobility Analyzer (Weingartner et al.,1997, 1999a).
The indirect effects are far more complex and more difficult to assess than thedirect effects, because they depend on a chain of phenomena that connect aerosolchemical and physical properties to concentrations of CCN, CCN concentrationsto cloud droplet concentrations (and size) and these, in turn, to cloud albedo.Global coverage of aerosol volume concentrations will increasingly becomeavailable by satellite measurements, however, accurate descriptions of sizedistributions are needed to transform these data into number concentrations ofaerosol particles which are sufficiently large to act as CCN. Initial measurementsof the aerosol size distribution at the Jungfraujoch (Nyeki et al., 1998b) illustratean accumulation mode (i.e., particles with a diameter d between 0.1 and 1 µm)that seasonally varies in concentration but retains a stable distribution shape.However, more worldwide data are needed in order to establish a relationshipbetween the aerosol volume and number concentrations.
Size determination is also important for source assessment. Atmospheric aerosolsgenerally consist of an accumulation mode and a coarse mode (with d > 1 µm),which may be differentiated by their chemical composition as well as by theirsources. In an ongoing field campaign, the cutoff diameter to distinguish betweenboth modes at the Jungfraujoch is being investigated. Preliminary results indicatethat a cutoff at d ~ 1 µm is optimal (Streit et al., 1999).
Chemical information is required both for a better understanding of the direct andindirect effects. At the Jungfraujoch, such measurements have so far only beenperformed for certain components such as elemental/organic carbon (Lavanchy etal., 1999) and in various field campaigns. These measurements begun at the JFJ inspring 1999.
Recent efforts have focused on understanding formation processes of newparticles in the free troposphere (Weingartner et al., 1999b). The number sizedistribution in the submicron d = 10 - 750 nm range was monitored at theJungfraujoch over a 14-month period. Again, a high seasonality was found forparticles in the accumulation mode. In contrast, ultrafine particles with d < 18 nmexhibited different behavior and exhibited a number concentration maximum inwintertime. An analysis of diurnal variations shows that these particles are mainlyformed by photochemical reactions. The formation of new particles and themaintenance of a certain number concentration have also been observed in the freetroposphere. Such mechanisms are of global importance and would therefore needto be further investigated.
Measurements conducted at the Jungfraujoch and elsewhere, only gain their fullvalue in the international scientific community when made available from amanaged database. Steps are presently being undertaken to centralize this task atthe Joint Research Centre, Ispra, Italy. For the same reason, collaboration withother international programmes such as IGAC, WCRP is judged to be of highimportance.

EMEP/CCC-Report 9/2000
98
Another prerequisite for achieving the goals of GAW is an appropriate qualityassurance programme. The WMO, through the Aerosol SAG, is striving for thisby setting guidelines for the extensive global programme. The establishment of aWorld calibration centre for aerosols within GAW is an essential part of thisprocess, however, this aspect remains to be urgently addressed.
Acknowledgment
We would like to thank the international foundation of the high-alpine researchstations Jungfraujoch and Gornergrat (HFSJG) for their support.
References
Baltensperger, U., S. Nyeki; Atmospheric aerosols, in: I. Colbeck (ed.), Physical andChemical Properties of Aerosols, Blackie Academic & Professional, London, 280-330, 1998.
Baltensperger, U., H.W. Gäggeler, D.T. Jost, M. Lugauer, M. Schwikowski, E.Weingartner, P. Seibert; Aerosol climatology at the high-alpine site Jungfraujoch,Switzerland, J. Geophys. Res. 102, 19707-19715, 1997.
Haywood, J.M., K.P. Shine, The effect of anthropogenic sulfate and soot aerosol on theclear sky planetary radiation budget, Geophys. Res. Lett. 22, 2509-2512, 1995.
IPCC; Climate Change 1994, J.T. Houghton, L.G. Meira Filho, J. Bruce, Hoesung Lee,B.A. Callander, E. Haites, N. Harris, and K. Maskell (eds), Intergovernmental Panelon Climate Change, Cambridge University Press, Cambridge, 1995.
Lavanchy, V.M.H., H.W. Gäggeler, S. Nyeki, U. Baltensperger; Elemental carbon (EC)and black carbon (BC) measurements with a thermal method and an aethalometer atthe high-alpine research station Jungfraujoch, Atmos. Environ. 33, 2759-2769, 1999.
Lugauer, M., U. Baltensperger, M. Furger, H.W. Gäggeler, D.T. Jost, M. Schwikowski, H.Wanner; Aerosol transport to the high alpine sites Jungfraujoch (3454 m) and ColleGnifetti (4453 m), Tellus 50B, 76-92, 1998.
Nyeki, S,. U. Baltensperger, I. Colbeck, D.T. Jost, E. Weingartner, H.W. Gäggeler; TheJungfraujoch high-alpine research station (3454 m) as a background continental sitefor the measurement of aerosol parameters, J. Geophys. Res. 103, 6097-6107, 1998a.
Nyeki S., F. Li, E. Weingartner, N. Streit, I. Colbeck, H.W. Gäggeler, U. Baltensperger;The background aerosol size distribution in the free troposphere: An analysis of theseasonal cycle at a high-alpine site, J. Geophys. Res. 103, 31749-31761, 1998b.
Schwartz, S.E., M.O. Andreae; Uncertainty in climate change caused by aerosols,Science 272, 1121-1122, 1996.
Schwartz, S.E.; Role of aerosols in radiative forcing of climate change: Global meansand uncertainties, Proc. Global Atmosphere Watch (GAW) Conference, 14-15October, 1998, Zurich, Bundesamt für Umwelt, Wald und Landschaft, andSchweizerische Meteorologische Anstalt, Bern, pp. 86-89, 1998.
Streit, N., E. Weingartner, C. Zellweger, M. Schwikowski, H.W. Gäggeler, U.Baltensperger, Characterization of size fractionated aerosol from the Jungfraujoch(3580 m asl) using total reflection X-ray fluorescence (TXRF), Int. J. Environ. Anal.Chem., in press, 1999.

EMEP/CCC-Report 9/2000
99
Weingartner, E., H. Burtscher, U. Baltensperger, Hygroscopic properties of carbon anddiesel soot particles, Atmos. Environ. 31, 2311-2327, 1997.
Weingartner, E., S. Nyeki, S. Henning, U. Baltensperger, Hygroscopic properties ofaerosol particles at low temperatures (T < 0°C), J. Aerosol Sci. 30, Suppl. 1, S17-S18,1999a.
Weingartner, E., S. Nyeki, U. Baltensperger, Seasonal and diurnal variation of aerosolsize distributions (10 <D < 750 nm) at a high-alpine site (Jungfraujoch 3580 m asl), J.Geophys. Res., in press, 1999b.
WMO; The Strategic Plan of the Global Atmosphere Watch (GAW), No. 113, WorldMeteorological Organization, TD-No. 802, Geneva, 1997.

EMEP/CCC-Report 9/2000
100

EMEP/CCC-Report 9/2000
101
Modelling the formation and long range transport of secondaryparticulate matter
by
Dick Derwent
Meteorological Office, Bracknell, UK
1. Introduction
Whilst the formation of secondary particulate matter arising from the emissions ofSO2, NOx and NH3 has been widely studied in Europe, little attention had hithertobeen given to the formation of secondary organic particulate matter. Laboratorystudies have identified two major pathways that may potentially lead to theformation of atmospheric secondary organic particulate matter. The first pathwayinvolves the photo-oxidation of aromatic organic compounds largely emitted byhuman activities. The second pathway involves the photo-oxidation of terpenesemitted by natural biogenic sources. A photochemical trajectory model has beenused to investigate the formation of semi-volatile organic degradation productsfrom the atmospheric photo-oxidation of terpenes during a summertime, regional-scale photochemical pollution episode.
2. The UK photochemical trajectory model
The formation of secondary organic particulate matter during a summertimeregional scale pollution episode has been described using the UK PhotochemicalTrajectory Model. This model treats the detailed chemical development in an airparcel as it moves across the European emissions grid following a six-daytrajectory from Austria through to its arrival point in Wales. The chemistry isdescribed for a single air parcel whose base is at the surface and whose upperboundary is at the top of the atmospheric boundary layer. Temperatures,humidities, boundary layer depths, wind speeds and wind directions were alldiurnally-varying and given values appropriate to the conditions of regional scalepollution episodes.
The UK PTM employs the Master Chemical Mechanism to describe thephotochemical ozone production from 123 emitted organic compounds thatgenerate 3482 reaction and degradation products and take part in over 10500chemical reaction processes. The MCM also includes the reactions of the simpleatoms and radicals containing oxygen, hydrogen and nitrogen and those of CO,SO2 and H2O2 that together describe the fast photochemistry of the pollutedatmospheric boundary layer. The MCM version 2.0 may be downloaded via theworld wide web at:
http://chem.leeds.ac.uk:80/Atmospheric/MCM/mcmproj.html

EMEP/CCC-Report 9/2000
102
The fast photochemistry and regional photochemical ozone production occurringin the UK PTM are driven by the emissions picked up by the air parcel as ittraverses Europe. The emissions of NOx, CO, SO2, isoprene and VOCs wereemployed at 150 km x 150 km scale across Europe based on EMEP emissions, at50 km x 50 km where available from either EMEP or EC CORINAIR and at10 km x 10 km within the United Kingdom from the NAEI. The emissions of totalVOCs were split into the emissions of individual organic compounds using thedetailed speciated emission inventory available for the United Kingdom from theNAEI and this same speciation was assumed to hold across Europe.The model also treated the dry deposition and surface removal of ozone, nitricacid, hydrogen peroxide and the peroxyacylnitrates.
3. Model treatment of secondary organic particulate matter
The formation of secondary organic particulate matter in the UK PTM was drivenby the emissions of terpenes from natural biogenic emissions as the air parceltraversed Europe. Emissions of terpenes at a spatial resolution of 1o x 1o and forthe month of July for Europe were taken from the GEIA emissions database :
http://blueskies.sprl.umich.edu/geia/
It was assumed that all the terpene emissions occurred into the UK PTM as• -pinene. No explicit temperature- or time-dependence was assumed for theseemissions and the emissions from a particular grid square were held constant atthe monthly average emission rate.
The Master Chemical Mechanism version 2.0 was used to describe the reactionsof • -pinene with OH radicals and ozone during the daylight and with NO3
radicals and ozone during night-time. Altogether the • -pinene degradationscheme contained over XY reactions and formed a number of low volatilitydegradation products which are classed as semi-volatile organic compounds,including:
• pinonaldehyde,• peroxypinonic acid• pinonic acid• norpinonaldehyde• hydroperoxypinonaldehyde.
These semi-volatile organic compounds have been scavenged in the UK PTM bypre-existing aerosol species in competition with their subsequent atmosphericdegradation. No loss of semi-volatile organic matter from the aerosol back into thegas-phase was allowed in order to simulate the upper limit concentrations ofsecondary organic particulate matter.
4. Results
Figure 1 presents the calculated concentrations of • -pinene, its degradationproducts and secondary organic particulate matter in the UK PTM as the air parcel

EMEP/CCC-Report 9/2000
103
traverses Europe from Austria across to Wales. Because no loss of semi-volatileorganic matter from the aerosol once scavenged has been allowed, theconcentrations of secondary organic particulate matter represent an upper limit tothose anticipated in the real atmospheric boundary layer.
The modelled concentrations of 5–10 µg m-3 for secondary organic particulatematter suggest that natural biogenic • -pinene may potentially make a significantcontribution to the concentration of secondary particulate matter and hence totalfine particulate matter during summertime regional pollution episodes. However,significant uncertainties remain concerning the scavenging of the semi-volatileterpene degradation products by the ambient aerosol and the subsequent fate ofthis aerosol.
5. Acknowledgements
This work was supported as part of the Air Quality Research Programme of theUnited Kingdom Department of the Environment, Transport and the Regionsunder contract EPG 1/3/128. Thanks are due to Michael Jenkin of NETCEN,Culham Laboratory and Sandra Saunders, Nicola Carslaw and Michael Pilling ofthe University of Leeds with the development of the Master Chemical Mechanismv2.0.
FIGURE 1. Alpha-pinene and its degradation products calculated during a summertime regional pollution episode.
0
2
4
6
8
10
12
1 5 9 13 17 21 25 29 33 37 41 45 49 53 57 61 65 69 73 77 81 85 89 93 97 101
Travel time , hours
Co
nce
ntr
atio
n ,
ug
/m3
APINENE
PINAL
PINONIC
APINAER

EMEP/CCC-Report 9/2000
104

EMEP/CCC-Report 9/2000
105
Cost-efficient measurements of PM10 using simple samplingequipment
by
Martin Ferm, Kjell Peterson, Per-Arne Svanberg andGun Lövblad
IVL Swedish Environmental Research InstituteP. O. Box 47086, SE-402 58 Gothenburg, Sweden
Introduction
In Sweden there is a need for low-cost equipment for automatic diurnal samplingof PM10 and PM2.5. Except for gravimetric analysis there is sometimes also a needfor chemical characterization. The European Union Daughter Directive states limitvalues for PM10 in ambient air as 24-hour averages and yearly means. EU furtherrecommends the member countries to measure PM2.5. A Daughter Directive withlimit values for PAHs in ambient air is foreseen. PM10 measurements are also ofinterest in other contexts, for example in rural air at the EMEP stations.
To be used for compliance measurements the sampler must fulfil certainrequirements specified in the test procedure CEN (1998). A low volume sampler,Kleinfiltergerät, fulfils the requirements and is now a proposed reference method.An automated version for weekly sampling (8 samples) of this instrument isavailable, but for surveillance of a country, with almost no earlier PM10 measure-ments, less costly sampling equipment is needed.
Measurements of soot in Sweden started in Gothenburg in 1959 (Brosset andÅkerström, 1972). In 1966 measurements in background air started at a number oflighthouses along the Swedish coast. The results from these measurements gaveone of the first implications of long range transport of particle pollution. The sootmethod is simple. Air is sampled on a cellulose filter and the black carbon(graphite) amount is measured as reflection of visible light. The reflectance is thenconverted to a particle concentration expressed in µg m-3 using a standardisedcorrelation. The method has been standardised (OECD 1964). Soot measurementsare today performed in Swedish background air at the EMEP sites and in anumber of small to medium-size Swedish towns (Svanberg et al., 1998).
Particle measurements within the EMEP project is carried out using the so called"filter pack" method. Chemical analysis of the particle fraction is made forsulphate and the total (gas + particle) concentrations of ammonium and nitrate.The sampling efficiency of the filter pack as a function of size varies with windspeed, but there is mainly a problem for the larger particles (such as sodiumnitrate).
To fill the need of a simple and robust sampler, based on daily sampling and withthe possibility of chemical analysis of the particles, IVL started to develop low

EMEP/CCC-Report 9/2000
106
cost samplers for PM10 and PM2.5. Some test results for the PM10 sampler ispresented here. The PM2.5 sampler has also done well compared to Kleinfiltergerät,but the results will be published elsewhere.
Principle of PM10 sampling
PM10 is a target specification for sampling thoracic particles (particles whichpenetrate beyond the larynx). The mass fraction as a function of aerodynamic sizeis specified in a table. A particle having an aerodynamic diameter of 10 µm hasthe same fall speed (3 mm/s) as a spherical particle of density 1000 kg m-3.According to the table for an ideal PM10 sampler, the sampling efficiency of forinstance a 10 µm particle should be 55.1 %. The sampling efficiency shouldfurther be independent of wind velocity. This implies that larger particles mustenter the inlet of the sampler and later be partitioned according to the PM10 curve.The mass fraction is weighted at 20 °C and 50% r.h. Particles can be separated inmany ways (cyclone, filter, foam plug, virtual impactor). PM10 particles areusually separated by a conventional impactor. The cut-off depends on the sampledair flow, which has to be constant.
Experimental
PM10 measurements using different methods have been made in severalmonitoring series during 1999. We have used Kleinfiltergerät as a referencemethod and made parallel measurement with the IVL method and with a TEOMinstrument. The measurements have been carried out at different sites on rooflevel in central Gothenburg, partly influenced by traffic. For the Kleinfiltergerätquarts fibre filters were conditioned in a room with constant temperature andhumidity before weighting. Soot measurements were also performedsimultaneously.
The IVL method
A prototype of a new PM10 sampling head that could easily be manufactured inlarge quantities to a low cost has been produced. It is made of a plastic materialthat in the future can be casted in a mould. The inlet was designed in connectionwith wind tunnel tests to minimise losses of particles at high wind speeds. Thehead is 12 cm high and 7 cm in diameter, see Figure 1. An impactor was designedand tested with artificial particles using an aerodynamic particle counter.
The sampler has also been compared to the reference sampler in a field test. Theflow was kept constant by utilising a vacuum pump with a capillary and using alow-pressure drop filter in the sampler. The comparison was made in Gothenburgca 10 m above the ground.

EMEP/CCC-Report 9/2000
107
Figure 1: Outline of IVL’s PM10 sampler.
Results
Scatter plots for the PM10 values obtained by IVL’s sampler versus the referencemethod and for the TEOM results versus the reference sampler are given inFigure 2 and Figure 3.
A comparison of soot measurements and PM10 are shown for the same place andtime period in Figure 4.

EMEP/CCC-Report 9/2000
108
0
5
10
15
20
25
30
0 5 10 15 20 25 30
PM10 Gothenburgµg m-3
KFG, µg m-3
IVL
IVL=KFG*0.91+0.3r=0.98, S.D.=1.1
Figure 2: Comparison between PM10 sampled by IVL’s prototype and Kleinfiltergerätin Gothenburg.
0
10
20
30
40
50
0 10 20 30 40 50
TEOM
µg m-3
KFG µg m-3
PM10, Gothenburg
TEOM=0.59*KFG+4r=0.72, S.D.=4.7
Figure 3: Comparison between PM10 sampled by Kleinfiltergerät and a TEOMinstrument in central Gothenburg.

EMEP/CCC-Report 9/2000
109
0
10
20
30
40
50
0 10 20 30 40 50
Soot
µg m-3
PM10 µg m-3
Soot=0,31*PM10 +0.4
Gothenburg
Figure 4: Comparison between soot measurements and PM10 sampled by Kleinfilter-gerät, in central Gothenburg.
Discussion
The soot measurements represent mainly the blackness of accumulation modeparticles since no special design of the inlet is used. It is therefore not surprisingthat the soot value is not well correlated with the PM10 value (r=0.63). The TEOMinstrument gave on the average 17 % lower values with a standard deviation fromthe liner regression line of 4.7 µg m-3. In the TEOM instrument the particles areheated to 50 °C on the oscillating balance. Water and other volatile substances arethereby lost. The correlation is very poor (r=0.72). The measurements with IVL’slow-cost intake show about 9% systematic lower PM10 values than Kleinfilter-gerät, but the correlation is good (r=0.98). Further tests will be made this winter inSweden.
Acknowledgement
The authors are thankful to Dr. Bengt Steen for the original idea and valuablediscussions during the development. We would also like to thank Dr AndersGudmundsson for the laboratory tests and for valuable comments.
References
Brosset C. and Åkerström Å. (1972) Long distance transport of air pollutants-measurements of black air-borne particulate matter (soot) and particle-borne sulphurin Sweden during the period of September-December 1969. Atmos. Environ., 6, 661-673.

EMEP/CCC-Report 9/2000
110
CEN (1998) Air-quality - Determination of the PM10 fraction of suspended particulatematter - Reference method and field test procedure to demonstrate referenceequivalence of measurement methods. European Committee for Standardization EN12341.
OECD (1964) Methods of Measuring Air Pollution: Report of the Working Party onMethods of Measuring Air Pollution and Survey Techniques (Organisation ofEconomic Co-operation and Development, Paris, 1964) OECD Publication No.17913, January 1965, pp. 15-34.
Svanberg P.-A., Grennfelt P. and Lindskog A. (1998) The Swedish urban air qualitynetwork-a cost efficient long term program. Atmos. Environ., 32, 1407-1418.

EMEP/CCC-Report 9/2000
111
Chemical composition of PM2.5 and PM10 at Birkenes
by
Jan Erik Hanssen1, Willy Maenhaut2 and Arne Semb1
1 Norwegian Institute for Air Research2 Rijksuniversiteit Gent, Instituut voor Nucleaire Wetenschappen
1. Sampling and chemical analyses
Before 1991: Campaigns with high-volume samplers, neutron activation, atomicabsorption and other chemical analyses.
1991–1995: Sampling with ”Gent” stacked filter unit, PM10 impactor inlet,followed by two Nucleopore filters in a NILU filter holder. The air intake and thefilter holder arrangement is shown diagrammatically in Figure 1.
The first Nucleopore filter (”coarse”) has a 8 µm nominal pore size, and is coatedwith Apiezon silicon grease to prevent blow-off. At a flow rate of 15-16 lpm, thisgives a 50% efficiency cut-off at 2 µm EAD. The second filter is also aNucleopore filter with a nominal pore size of 0.4.
The filters have been weighed at NILU, and analysed with PIXE at the Universityof Gent (W. Maenhaut, F. Francois). Black carbon is determined with a lightreflection technique by J. Cafmeyer, University of Gent.

EMEP/CCC-Report 9/2000
112
ng/m
3
2. Annual averages and trends
Annual averages for Birkenes are indicated in Table 1. In order to determine thecontributions from different sources to the particle mass, the followingcomponents have been defined:
Inorganic minerals:Based on Al, Si, Fe, nss Ca and nss K – and the average contribution of Al to thecomposition of the earth’s crust (except the oxides of the quantified elements).Sea-salt. Sodium and chloride, with associated dissolved elements, estimated fromNa. Chloride is depleted relative to Na in most filter samples.
Secondary inorganic aerosol:Only sulphur has been determined by PIXE. Other measurements have shown thatsulphate is mainly present as ammonium sulphate, and that nitrate at Birkenesoccurs in the coarse particle fraction, in association with sea-salt particles. Thecontribution of ammonium sulphate to the PM2.5 mass is very substantial.
Elementary and organic carbon:Only elementary carbon has been determined with an optical method, which is notan absolute method. Nevertheless, the measured average concentrations (0.5-0.6 µg/m3) are close to expected values.
Undefined components:The difference between the calculated contributions from the components whichhave been quantified on the basis of chemical analyses, and the particulate massdetermined by weighing of the sample filters, have been labelled ”undefined”.
Figure 2: Summary of aerosol composition at Birkenes, 1973-1993.
0
1000
2000
3000
4000
5000
6000
7000
8000
9000
Spring 1973 Autumn 1973 1978-79 1985-86 1991, coarse 1991, fine 1992 coars 1992 fine 1993 coarse 1993 fine
UnexplainedBlack carbonSecondary inorganicSea-saltMinerals

EMEP/CCC-Report 9/2000
113
Table 1: Overview of aerosol concentrations at Birkenes, 1973-1993. Allconcentrations are given in nanogrammes/m3. Inferred values in italics.Spring 1973 and Autumn 1973 are neutron activation data by Rahn,compiled by Semb (1978); 1978-1979 data are from Pacyna et al. (1984);1985-1986 data are from Amundsen et al. (1992), data from 1991 onwardsare from Maenhaut et al. (1996).
Spring1973
Autumn1973
1978-79
1985-86
1991,coarse
1991,fine
1992,coarse
1992,fine
1993,coarse
1993,fine
Si 433 323 304 277 115 68 131 46 66 33
Al 114 85 80 73 58 14 64 14 26 10
Fe 96 95 84 61 35 14 41 13 17 10
Ca 80 74 47 11 47 12 31 11
nss Ca 65 37 7 35 8 13 4
K 138 - 37 36 39 24 29 28
nss K 123 27 32 27 20 12 22
Zn 29 35 15 2 6 1.5 4.2 1.7 6.4
Pb 23 18 11 1 4 1.10 3.20 0.70 3.50
Minerals 1658 1090 1019 908 561 257 620 195 280 148
Na 403 478 508 350 273 116 329 118 464 179
Cl 60 256 566 380 258 33 316 17 600 84
Br 4.7 5.3 1.03 2.55 1.29 2.68
I 0.2 0.8 0.72
Sea-salt 568 858 1206 821 602 179 730 165 1185 310
SO4 2560 4260 3060 393 2712 354 1797 378 1740
nss SO4 2520 4217 3031 370 2702 326 1787 339 1725
NO3 n.a. n.a. n.a. n.a. n.a.
NH4 960 1598 1148 147 1017 133 674 142 653Secondaryinorganic
3480 5815 4178 518 3719 459 2461 481 2378
Black carbon 80 544 90 410 80 514Sum quantifiedcomponents
5429 8040 5907 1760 4699 1899 3231 2026 3349
Measured 2800 6780 3120 5018 2898 5037
Unexplained 1040 2081 1221 1787 872 1688
3. Some observations
The contribution from minerals, determined on the basis of Si, Al, Fe and Ca, ishighly episodic. The high concentrations in May-June 1992 are associated withtrajectories across southern Sweden from the Baltic countries, possiblyimplicating emission sources in the Narva-Leningrad region. We believe that theminerals are from anthropogenic emissions, combustion of solid fuels, cementproduction, iron and steel industry.
Sea-salt is also a main contributor to the coarse particle fraction. Chloride isdepleted relative to sodium in most of the samples, particularly in the fine particlefraction. Part of the depletion is caused by reaction of nitric acid with the sea-saltparticles, displacing hydrochloric acid. However, these data are not suitable forestablishing a quantitative relationship.

EMEP/CCC-Report 9/2000
114
A number of elements are ”enriched” in aerosols relative to their abundance in theearth’s crust or in seawater. These are mainly found in the fine fraction, andinclude elements such as lead, cadmium, zinc, arsen, antimony, selenium, bromineand iodine. Neither of these contributes significantly to the particle mass, and,
Coarse fraction 1991
0
500
1000
1500
2000
2500
3000
3500
910129 910325 910520 910715 910909 911021 911216
Fe
Ca
Si
Al
Coarse fraction, 1992
0
500
1000
1500
2000
2500
3000
3500
2.3
16.3
30
.3
58.3
72
.3
86.3
100.
3
114.
3
128.
3
142.
3
156.
3
170.
3
184.
3
198.
3
212.
3
226.
3
240.
3
254.
3
268.
3
296.
3
310.
3
324.
3
338.
3
352.
3 1.
3
Julian day
Fe
Ca
Si
Al
Birkenes 1992
0
5
10
15
20
25
30
35
40
2.3 30.3 58.3 86.3 114.3 142.3 170.3 198.3 226.3 254.3 310.3 338.3 1.3
UnexplainedBCMineralsSea-saltSecondary inorganic
µ3
ng/m
33

EMEP/CCC-Report 9/2000
115
since lead-free petrol has become common, none are no longer valuable as tracersof particular emission sources either.
The main constituents in the fine fraction appear to be ammonium sulphate,elementary carbon and organic compounds. Clearly, good analytical methods forthe two latter components are desirable for the full quantification of the fineparticle fraction, although minerals and sea-salts are also of some importance.
The measurements of the fine particle mass are quite consistent in time, with goodcorrelation between the total mass and the identified components.
Some tentative conclusions:
− The Ghent stacked filter unit is useful for quantifying PM10 and PM2.5, and canprovide samples for subsequent chemical analyses. The low air volumes makethe weighing somewhat demanding, and the membrane filters are also subjectto electrostatic charging. On the other hand, these filters do not need thecareful ”conditioning” which has to be carried out when weighing glass fibrefilters.
− Secondary inorganic particulate matter is the main constituent in the PM2.5
fraction at background sites, explaining 30-50% of the total mass.
− The second most important component in the PM2.5 fraction is black carbon orsoot, with associated organic compounds from combustion processes. Quanti-fication of this component, preferably with more detailed characterisation ofthe organic fraction, is the key to understanding the composition andproperties of PM2.5, including the formation of secondary organic aerosols.
− Sea-salt components and minerals are of minor importance for the PM2.5
fraction but account for a major part of the PM10–PM2.5. These are importantin connection with deposition of sea-salt ions, and alkaline base cations.
References
Amundsen, C.E., Hanssen, J.E., Semb, A., and Steinnes, E. (1992). Long-range transportof trace elements to southern Norway. Atmos. Environ., 26A, 1309-1324.
Hopke, P.K., Ying Xie, Raunemaa, T., Biegalski, S., Landsberger, S., Maenhaut, W.,Artaxo, P., and Cohen, D. (1997). Characterisation of the Gent Stacked Filter UnitPM10 Sampler. Aerosol Sci. and Techn., 27, 726-735.
Maenhaut, W., Francois, F., and Cafmeyer, J. (1993). Proceedings, First Research Co-ordination Meeting of the International Atomic Energy Agency (IAEA): Co-ordinatedResearch Programme on Applied Research on Air Pollution using Nuclear-RelatedAnalytical Techniques. Vienna, Austria, 20 March-2 April.
Pakkanen, T.A., Hillamo, R.E., Keronen, P., Maenhaut, W., Ducastel, G., and Pacyna,J.M. (1996). Sources and physico-chemical characteristics of the atmospheric aerosolin Southern Norway. Atmos. Environ., 30, 1391-1405.
Pacyna, J.M., Semb, A., and Hanssen, J.E.(1984). Emission and long range transport oftrace elements in Europe. Tellus, 36B, 163-178.

EMEP/CCC-Report 9/2000
116
Pacyna, J.M., Ottar, B., Hanssen, J.E., Kemp, K.(1984). The chemical composition ofaerosols measured in Southern Scandinavia. Norwegian Institute for Air Research,Kjeller (NILU OR 66/84).
Semb, A. (1978). Deposition of trace elements from the atmosphere in Norway. SNSFProject, Ås, Norway. (SNSF FR 13/78.)
Semb, A., Hanssen, J.E., Francois, F., Maenhaut, W., and Pacyna, J.M.(1995). Longrange transport and deposition of mineral matter as a source for base cations. Water,Air, Soil Pollut., 85, 1933-1940
Tørseth, K., Hanssen, J.E., and Semb, A.(1999). Temporal and spatial variations ofairborne Mg, Cl, Na, Ca and K in rural areas of Norway. Sci. Tot.Environ. 234, 75-85.

EMEP/CCC-Report 9/2000
117
Application of Receptor Models for SourceApportionment of PM10 and PM2.5 in Switzerland
by
Ch. Hueglin1, W. Devos1, R. Gehrig1, J. Kobler1, W.A. Stahel2,M. Wolbers2
1Swiss Federal Institute for Materials Testing and Research (EMPA),CH-8600 Dübendorf, Switzerland
2Seminar for Statistics, ETH, CH-8092 Zurich, Switzerland
Various recent studies have shown a positive correlation between theconcentration of airborne particulate matter and adverse health effects. As aconsequence, air quality standards for ambient fine particles (PM10) wereintroduced in Switzerland. Since March 1998, an annual standard of 20 µg/m3
(arithmetic mean) and a daily standard of 50 µg/m3 (not to be exceeded more thanonce a year) are in force. The new standards are regularly exceeded at urban andsuburban locations. In order to develop emission control strategies and to predictthe trend of future PM10 concentrations a quantitative understanding of sourcecontributions to ambient PM10 levels is required.
The objective of this study is to identify the main emission sources of airborneparticulate matter (PM10 and PM2.5) and to quantify their contributions at locationswhich are representative for typical air pollution levels in Switzerland. Dailysamples of PM10 and PM2.5 from urban, suburban and rural sites were taken onquartz fibre filters (High-volume sampler). Particle samples from every 4th daybetween February 1998 and March 1999 were analysed for total mass, traceelements, water soluble ions, elemental carbon, and organic carbon. The generateddatasets are examined by means of a multivariate statistical method (receptormodel), which was developed at the Swiss Federal Institute of Technology (ETH)in Zurich.
This study is closely related to a recently published report, where a dispersionmodel for PM10 was developed and applied for estimation of annual meanconcentrations and annual mean road traffic contributions to PM10 in Switzerland(BUWAL, 1999). The receptor modelling approach used in this study can beconsidered as complementary to dispersion models. Based on chemicalcomposition data, receptor models are used to apportion sources of primaryparticulate matter without quantitative source information. In contrast, dispersionmodels require emission rates for the main sources and knowledge of the relevantphysico-chemical atmospheric processes to predict concentrations of ambientparticulate matter. Comparison of receptor and dispersion modelling resultsprovides an independent way to confirm source contribution estimates.
In order to assess the source resolution capability and to validate the appliedreceptor model, the following investigations were performed:

EMEP/CCC-Report 9/2000
118
• A well-documented simulated data set (Currie et al., 1984) was used to test themodel. The obtained source contribution estimates were found to be consistentwith the known true values. However, of the nine sources present, only sixwere identified. It is evident from this data evaluation, that sources with lowcontributions (poor signal to noise ratio) cannot be resolved by the model.Moreover, sources with similar emission profiles (collinearity) cannot beresolved either, but are typically grouped into a common source category.
• The receptor model was applied to data from two nearby measuring sites inZurich. One of the sites is located in a large courtyard surrounded by buildings(Zurich Kaserne, measuring site of the Swiss National Air PollutionMonitoring Network). The air pollution level at this site is considered to berepresentative for the urban background. The second site is next to a streetwith heavy traffic (Zurich Wiedikon, measuring site of the Department ofHealth and Environment of the City of Zurich). The distance between the twosites is about 900m. Therefore, the local road traffic contribution to PM10 at theroadside site may be assessed from the difference in PM10 at both sites.Consequently, the difference in modelled road traffic contribution at ZurichWiedikon and Zurich Kaserne should correspond with the difference in PM10.In fact, the difference in modelled road traffic contributions agrees well withthe difference in PM10 at both sites.
With the receptor model applied to the dataset of primary PM10 characterization atZurich Kaserne, a total of six source categories were identified. Those are:
• Resuspended mineral dust
• Resuspended road dust
• Road traffic (tail pipe and abrasion particle emissions)
• Street salt
• A thallium source (presumably cement fabrication)
• A source category including emissions from wood and agricultural wastecombustion, waste incineration, and long range transport.
Evaluation of data from the other measuring sites leads to similar categories.Source attribution of particulate matter that is formed in the atmosphere(secondary particulate matter, defined here as the sum of ammonia, nitrate andsulphate) is assessed by combined evaluation of transboundary import exportbudgets (EMEP, 1998) and an emission inventory of the precursor gases(Corinair, 1990).
Road traffic was found to be the dominating single source of PM10 in Switzerland.Results of preliminary estimations of the total road traffic contribution to PM10 arecompared with the dispersion modelling results reported in BUWAL (1999).Figure 1 shows annual averages of total road traffic contributions for differentclasses of PM10 as determined by dispersion modelling, as well as the receptormodelling results at the measuring sites Zurich Kaserne, Zurich Wiedikon, Basel(suburban site), and Bern (urban roadside site).

EMEP/CCC-Report 9/2000
119
Figure 1: Comparison of total road traffic contributions to PM10 as determined by twoindependent methods: Dispersion modelling (BUWAL, 1999) and receptormodelling (this work). The indicated concentrations at the receptor sitescorrespond to the mean PM10 of the analysed samples during a period of oneyear. Note that the result for the Zurich Wiedikon site is not an annualaverage, but corresponds to the average road traffic contribution to PM10
during two measuring campaigns in summer 1998 and winter 1999.
References
BUWAL (1999) Modellierung der PM10-Belastung in der Schweiz. SchriftenreiheUmwelt Nr. 310, Bundesamt für Umwelt, Wald und Landschaft, Bern.
Corinair (1990) http://www.aeat.co.uk/netcen/airqual/TFEI/unece.htm
Currie, L.A., Gerlach, R.W., Lewis, C.W., Balfour, W.D., Cooper, J.A., Dattner, S.L.,Cesar, G.E., Gordon, G.E., Heisler, S.L., Hopke, P.K., Shah, J.J., Thurston, G.D.,Williamson, H.J. (1984) Interlaboratory comparison of source apportionmentprocedures: Results for simulated data sets. Atmos. Environ., 18, 1517-1537.
EMEP (1998) Transboundary acidifying air pollution in Europe. MSC-W Report, Part 1and 2, Norwegian Meteorological Institute, Oslo.
PM -Class (µg/m3)
0
10
20
30
40
50
60
70
80
Roa
d T
raffi
c C
ontr
ibut
ion
(%)
<10 10-15 15-20 20-25 25-30 30-35 35-40 >40
Dispersion ModelReceptor Model
Zurich Kaserne (24.5µg/m3)
Basel (25.0µg/m3)
Bern (39.6µg/m3)
Zurich Wiedikon (42.1µg/m3)

EMEP/CCC-Report 9/2000
120

EMEP/CCC-Report 9/2000
121
Trace element air pollution monitoring studies in Slovenia
by
R. Jac imovic1, Z. Jera n1 , B. Smo diš 2
1 Jozef Stefan Institute, Jamo v a 39, PO B 3000, SI-1001 Ljubljana, Slovenia2 Division of Human Health, IAEA, POB 100, A-1400 Vienna, Austria
1. Introduction
Up to now, only a few investigations have been performed in Slovenia involvingcomprehensive studies of trace elements, toxic elements, heavy metals andradionuclides in the atmosphere. For better knowledge of the state of air pollutionfrom industrial emissions and others polluters we participated in an InternationalAtomic Energy Agency (IAEA) coordinated research programme of appliedresearch on air pollution using nuclear-related analytical techniques. The programinvolved the sampling and analysis of ambient airborne particulate matter usingthe Gent Stacked Filter Unit (SFU) PM10 sampler. The sampler design, describedby Maenhaut [1], is based on sequential filtration through two Nuclepore filterswith different pore sizes. The "Gent" SFU sampler operates at a flow rate of 15-16 l/min, is equipped with a pre-impaction stage that acts as a PM10 (particulatematter 10 µm) inlet, and utilizes two 47-mm diameter Nuclepore polycarbonatefilters with pore sizes of 8 µm (Apiezon-coated) and 0.4 µm that are placed inseries inside Norwegian Institute for Air Research (NILU) double filter cassettes.The coarse filter collects the 2-10 µm equivalent aerodynamic diameter (EAD)particle size fraction, and the fine filter the particles <2 µm EAD. One of thesamplers manufactured in Belgium was compared with one built to the samedesign in the U.S.A. [2], and the results showed relatively good agreement. Theaim of above studies was the development and application of nuclear and nuclear-related analytical techniques for air pollution studies, leading to formation of adatabase concerning the trace element air pollution of Slovenia. Results obtainedby the k0-standardization method of instrumental neutron activation analysis(INAA) for aerosols (coarse and fine fractions) collected at two stations in urbanand in rural regions of Slovenia are presented and discussed.
Close collaboration has been established with the Hydrometeorological Instituteof Slovenia for provision of meteorological data, and with the Institute for NuclearSciences of the State University of Gent, Belgium (quality of analytical data).
2. Methods
2.1. Sample collection and preparation
As stated above, aerosols were collected on two Nuclepore polycarbonatemembrane filters with different pore sizes by a Gent SFU sampler. The air entersthe unit through an impactor stage designed to have a 50% collection efficiency atfor particles of 10 µm equivalent aerodynamic diameter. The sample inlets arepositioned 1.8 m above the ground. The initial filter is an 8 µm pore 47 mm

EMEP/CCC-Report 9/2000
122
Nuclepore filter and the second filter is an 0.4 µm pore Nuclepore filter. A totalof 86 samples were collected at an urban site (Hydrometeorological Institute ofSlovenia (HIS) - Ljubljana city) form June 1993 to June 1994, each for a period of24h, on a twice-a-week basis and a total of 49 samples at a rural site (Iskrba) fromNovember 1995 to October 1996 for a period of 24h on a once a week basis.
The characteristics of the HIS stations are:
Name: Ljubljana-Be• igradCo-ordinates: 46°04' N latitude
14°31' E longitudeElevation: 298 m above mean sea-level
Start of station operation: 1968 (SO2 + black smoke), 1971 (precipitation quality),1981 (automatic monitoring).
The characteristics of the Iskrba station, which is completely new, are:
Name: IskrbaCo-ordinates: 45°33'43''N latitude
14°51'45'' E longitudeElevation: 520 m above mean sea-level
Loaded filters are weighed on a Mettler balance (AE 163) having a precision of10 µg (Mettler Instruments AG, Switzerland), after neutralising the charge with aNuclepore static eliminator (Nuclepore, Cambridge, USA). Filters were kept inPetri dishes prior to analysis.
The procedure for samples to be analysed by instrumental neutron activationanalysis is as follows:
APM loaded filters are pelletised with a manual press (Mod. 25011, Specac, UK)in a pellet die of 5mm diameter and packed in polyethylene ampoules (Kartell,Noviglio, Italy), together with an Al-0.1% Au alloy wire (Central Bureau forNuclear Measurements, Geel, Belgium) of 1.0 mm diameter and a 0.125 mm Zrfoil (Goodfellow, Cambridge, UK), which serve as comparator and fluence ratemonitors.
2.2. k0-based instrumental neutron activation analysis (INAA)
All irradiations were performed in the channels of the TRIGA Mark II reactor ofthe Jo• ef Stefan Institute (IJS): for short irradiation (from 2 to 5 min) in thepneumatic tube at a thermal flux of 3.5⋅1012 neutrons⋅cm-2⋅s-1, and for longerirradiations in the carousel facility at a thermal neutron flux of 1.1⋅1012
neutrons⋅cm-2⋅s-1 (irradiation time for each sample was 18-20 h). After irradiationthe samples were transferred to clean 5 ml polypropylene mini scintillation vials(Atom Medical Ltd., Hove, UK) for measurement. The radionuclides used in thedetermination of up to 50 elements in each sample, their half-lives and gamma-energies measured were given elsewhere [3]. The samples were measured on HP

EMEP/CCC-Report 9/2000
123
Ge detectors (Ortec, USA) with 40% relative efficiency connected to a CanberraS 100 multichannel analyser. For the k0-standardization method we needabsolutely calibrated detectors [4]. Spectra were processed by the SAMPO 90program [5]. Elemental concentrations and effective solid angle calculations werecalculated by a new software packet called KAYZERO/SOLCOI [6].
3. Results and discussion
The primary aim was to analyse two fractions of aerosols (coarse and fine) usingthe k0-based INAA method to obtain information about the levels of elements inthe atmosphere and to identify significant pollution sources. Principal ComponentAnalysis (PCA) and Factor Analysis were applied to a data set of the 30 elementsAl, As, Ba, Br, Ca, Cd, Ce, Cl, Co, Cr, Cs, Cu, Fe, Hg, I, K, La, Mg, Mn, Mo, Na,Rb, Sb, Sc, Se, Sm, Th, Ti, V and Zn, which was selected from the elementsdetermined as the most important ones for the identification of pollution sources.It has been found that concentration patterns in coarse and fine fractions ofaerosols yielded 7 and 9 factors (source types) for the HIS and Iskrba stations,respectively. Results obtained from above statistical treatment for the HIS stationare presented in Table 1. Similar results for the reference Iskrba station wereobtained. In Table 1 factor 1 and factor 2 represent the coarse and fine fractions ofaerosols. This is one piece of evidence that the sampler used was working well.For Br we obtained dispersion in the factors. This means that Br was present in theblank filters in high concentration and neutron activation analysis is very sensitivefor the determination of Br.
Table 1: Factor loadings and estimated communalities obtained by factor analysisfor the aerosols collected at HIS station.
El. Factor 1 Factor 2 Factor 3 Factor 4 Factor 5 Factor 6 Factor 7 Estimated Comm.Al 0.95 0.94As 0.86 0.81Ba 0.78 0.69Br 0.46 0.31 0.28 0.60Ca 0.89 0.91Cd 0.71Ce 0.87 0.83Cl 0.90 0.89Co 0.57 0.52Cr 0.76 0.66Cs 0.67 0.53Cu 0.31 0.58 0.60Fe 0.83 0.92Hg 0.71 0.57I 0.79 0.77K 0.93 0.91La 0.88 0.83Mg 0.87 0.82Mn 0.78 0.83Mo 0.68 0.20 0.61Na 0.88 0.87Rb 0.89 0.81Sb 0.66 0.24 0.55Sc 0.96 0.93Se 0.79 0.79Sm 0.53 0.63Th 0.81 0.69Ti 0.52 0.30 0.64V 0.76 0.66Zn 0.69 0.34 0.83

EMEP/CCC-Report 9/2000
124
Detailed results for APM (coarse and fine fractions) at the two stations for thewinter season are shown in Figure 1. These results show that the two stations arecompletely different. For the urban station (denoted by triangles and square forfine and coarse particles, respectively) we have higher variations in the data sets,whereas variations are smaller for the rural station (signs "-" and "+" for fine andcoarse particles, respectively).
Figure 1: Comparison of the results obtained by PCA for HIS and Iskrba stationsduring the winter season.
4. Conclusions
By application of factor analysis for each location it was found that that first twofactors, which represent the coarse and fine fraction, account around 30 and 21 %of the total variability in the original data. It was found further that the elementsAl, Ba, Ca, Ce, Fe, La, Mg, Sc and Th are attached to the coarse fraction, but As,I, K, Rb, Sb, Se V and Zn to the fine fraction.
Acknowledgement
We thank the Hydrometeorological Institute of Slovenia (HIS), EnvironmentalProtection Department, for cooperation and access to their meteorological data.
References
[1] Maenhaut, W., Francois, F., Cafmeyer, J.: The "Gent" Stacked Filter Unit (SFU)Sampler for the Collection of Atmospheric Aerosols in Two Size Fractions:Description and Instructions for Installation and Use. Report No. NAHRES-19,IAEA, Vienna, pp. 249-263 (1993).
[2] Hopke, P.K., Xie, Y., Raunemaa, T., Biegalski, S., Landsberger, S., Maenhaut, W.,Artaxo, P., Cohen, D.: Characterization of Gent Stacked Filter Unit PM10 Sampler.Aerosol Sci. Technol., 27: 726-735 (1997).

EMEP/CCC-Report 9/2000
125
[3] Smodiš, B., Jac imovic , R., Stegnar, P., Jovanovic , S.: Multielement analysis ofNIST proposed SRM 1547 Peach Leaves. J. Radioanal. Nucl. Chem., Articles 160 1(1992) 101-108.
[4] Smodiš, B., Jac imovic , R., Jovanovic , S., Stegnar, P., Vukotic , P.: Vestn. Slov.Kem. Drus., 35 (1988) 397-408.
[5] Aarnio, P. A., Routti, J.T., Sandberg, J.V.: J. Radioanal. Nucl. Chem., Articles 1242 (1988) 457-466.
[6] Kayzero/Solcoi for reactor-neutron activation analysis (NAA) using the k0-standardization method. DSM Research, Geleen, Netherlands, Dec. 1996.

EMEP/CCC-Report 9/2000
126

EMEP/CCC-Report 9/2000
127
Mathematical Modelling of Turbulent Reacting Plumes –Modelling of Particulate Matter Processes
by
Mihalis Lazaridis
Norwegian Institute for Air Research (NILU), PO Box 100, Kjeller, Norway
ABSTRACTThis work presents an approach for modelling photochemical gaseous and aerosolphase processes in subgrid plumes from major localized (e.g. point) sources(``plume-in-grid'' modelling). This approach employs the Reactive Plume Model(RPM-AERO) which extends the regulatory model RPM-IV by incorporatingaerosol processes and heterogeneous chemistry. The physics and chemistry ofelemental carbon, organic carbon, sulphate, sodium, chloride and crustal materialof aerosols are treated and attributed to the PM size distribution. A modifiedversion of the Carbon Bond IV chemical mechanism is included to model theformation of organic aerosol. Aerosol dynamics modelled include mechanisms ofnucleation, condensation and gas/particle partitioning of organic matter.Comparison of the model with field data from a power plant plume in Mohave(Nevada) is quite satisfactory.
1. Introduction
Photochemical Air Quality Simulation Models (PAQSM) provide a link betweenemissions and ambient air pollutant concentrations and so they are necessary toolsfor understanding the physics, chemistry and transport of pollutants and fordeveloping environmental policies. Until recently, PAQSMs were focusingmainly on the modelling of gaseous species in the atmosphere. However, concen-trations of fine particulate matter (PM) in the atmosphere are being recognizedmore and more as a major health concern, thus necessitating the detailed study ofprocesses leading to the formation of PM. Relatively few modelling studies haveexamined the combined dynamics of gaseous and particulate matter processes inthe atmosphere; some recent modelling studies of PM formation in the atmosphereinclude [4]-[7].
In order to evaluate control strategies for precursor emissions reductions, and inorder to estimate human exposure to aerosols, it is necessary to study aerosoldynamics simultaneously at both the regional and local scales. The regional scalemodels are typically grid-based, with a grid resolution in the range 4-40 km.However, the grid-based models have a limit on the minimum grid cell size,reflecting the range of validity of the assumptions used in the formulation of thesemodels (K-theory for the Atmospheric Diffusion Equation). Insight into the ``subgrid'' phenomena can be obtained by coupling the grid-based models withtrajectory-based plume aerosol models. This is necessary in order to evaluate the

EMEP/CCC-Report 9/2000
128
effect of industrial stack emissions on local PM concentrations, and the associatedenvironmental consequences, while not ignoring regional scale effects.
The main objective of this work is the development of a mechanistic plume modelthat can be coupled directly with existing regional scale grid-based photochemicaland aerosol process models, such as the Urban Airshed Model UAM-AERO [5].Such a coupling is expected to enhance the understanding of the impact of point-source emissions on specific locales of interest, while considering regional scaleand local effects in tandem. Hence, the Reactive Plume Model with Aerosolchemistry (RPM-AERO) is developed as an extension to an existing regulatoryplume model, the Reactive Plume Model, version IV (RPM-IV) [1]. Modificationsto the original model include the addition of modules that describe aerosolchemistry, deposition, nucleation and condensation processes, while retaining thebasic structure of RPM-IV.
Numerical plume models make use of dispersion/reaction equations similar inform to the atmospheric diffusion equation, but with dispersion parameters thatevolve with time. RPM-AERO considers a control volume that moves andexpands downwind along the plume trajectory, and solves the dispersion/reactionequations that incorporate mechanisms for nonlinear photochemistry. It describesshort term behaviour of the plume, typically ranging from 1 hour to less than24 hours. The model in the present paper is checked against a field study datafrom the Mohave power plant in Nevada. Comparison of the RPM-AERO modelwith field data is also qualitative satisfactory.
2. RPM-AERO: Model description
The RPM-AERO is an extension of the regulatory model Reactive Plume Model(RPM), developed to simulate the atmospheric processes and dynamics ofparticulate matter following emissions from point source plumes. The modeladopts a trajectory-based framework, where the emissions plume is divided intocells containing equal masses, according to a Gaussian plume evolution. The cellstravel downwind, and expand in a way such that the amount of a (fictitious)emitted inert species remains constant within each cell.
The width and the depth of the cells are computed as functions of horizontal andvertical dispersion parameters. The chemistry term is solved using the Carbon-Bond mechanism, version IV (CB-IV) [1] as a default; however the user can inputany alternative description of atmospheric photochemistry.
2.1 Modelling of the Aerosol Processes
RPM-AERO can quantify the relationships between point source emissions andprimary and secondary aerosol species formation and dynamics under variousmeteorological conditions. The aerosol size distribution and chemical compositionis modelled using 16 aerosol-size bins for the PM10 aerosol, where the sizedistribution employs a nodal point scheme [3]. In addition to the equilibriumscheme used above (CB-IV chemical mechanism) an aerosol dynamics approach

EMEP/CCC-Report 9/2000
129
is currently under development. Processes such as nucleation, condensation anddeposition are incorporated in the aerosol dynamics modules of RPM-AERO.
The RPM-AERO model adopts a method which is similar to the one employed inthe UAM-AERO model [5], where the condensable organic compound (COC)yields for the lumped organic compounds are used. A flexible gas-phase chemicalmechanism interface that allows user modification is adopted, with the CarbonBond IV (CB-IV) chemical mechanism [1] as the default option. Modeling of theaerosol size distribution proceeds in a manner similar to that adopted by Lazaridisand Koutrakis [3]. In the description of the background size distribution weemployed a nodal point scheme [3].
2.2 Aerosol Dynamics
The RPM-AERO model has the capability to calculate the binary nucleationprocess for the sulphuric acid–water system. The nucleation process of additionalgaseous species can be easily implemented provided that the necessarythermodynamic properties are available. The binary nucleation of the system iscalculated in a manner analogous to the one provided by the revised classicaltheory [3].
The condensation rate onto the pre-existing aerosol particles is described by amodified Mason equation, which includes the transitional correction factors [3]. Inthe RPM-AERO two alternative methods are used to describe the mechanism ofdry deposition for particles and gaseous species. The first method utilizesavailable experimental data for different species. The second method is based onquantifying the transfer of material from the atmosphere to the surface throughdifferent resistance mechanisms, i.e. the aerodynamic resistance, the surfaceresistance, and the transfer resistance.
3. Results and discussion
The RPM-AERO model is applied here to study dispersion and formation ofsulphate aerosols from a power plant plume in Mohave (Nevada). The model iscompared with field performed by Hegg et al. [2]. Emission data for SO2, NOx
and particulate matter as well as meteorological data were obtained from Hegg etal. [2]. Comparison between model predictions and field measurements as well asthe aerosol size distribution of primary aerosols at different distances from thesource are performed. The field studies performed at 27 August 1979 at downwinddistances of 5.5 and 27.8 kilometres. Comparisons between the model predictionsand the measurements are quite satisfactory for SO2, NO, NO2 and O3. Forsulphate the model underestimates the mass concentration near the plume butoverestimates it by a factor of two at 27.8 kilometres downwind the source. Thereason is probable due to presence of aged aerosol masses that are mixed with thepolluted plume. However, the results for sulphate mass are quite reasonable and inqualitative close agreement with the field studies.

EMEP/CCC-Report 9/2000
130
References
1. Gery, M.W., G.Z. Whitten and J.P. Killus (1988) Development and testing of theCBM-IV for urban and regional modeling. Technical report, Systems ApplicationInc., San Rafael, CA.
2. Hegg, D.A., P.V. Hobbs and J.H. Lyons (1985) Field studies of a power plant plumein the arid south-western United States. Atmos. Environ., 19, 1147-1167.
3. Lazaridis, M. and P. Koutrakis (1997) Simulation of formation and growth ofatmospheric sulfate particles. J. Aerosol Sci., 28, 107-119.
4. Lazaridis, M., S. Isukapalli and P.G. Georgopoulos (1998) Modeling aerosolprocesses at the local scale. In A & WMA’s Annual Meeting, San Diego.
5. Lurmann, F.W., A.S. Wexler, S.N. Pandis, S. Musara, N. Kumar and J.H. Seinfeld(1997) Modeling urban and regional aerosols-II Application to California’s SouthCoast Air Basin. Atmos. Environ., 26A, 2269-2282.
6. Seigneur, C., X.A. Wu, E. Constantinou, P. Gillespie, R.W. Bergstrom, I. Sykes,A. Venkatram and P. Karamchandani (1997) Formulation of a second-generationreactive plume and visibility model. J. Air Waste Managem. Assoc., 47, 176-184.
7. Wexler, A.S., F.W. Lurmann and J.H. Seinfeld (1994) Modeling urban and regionalaerosols: I. Model development. Atmos. Environ., 28, 531-546.

EMEP/CCC-Report 9/2000
131
Special Aerosol Characterization Studies in Urban, Rural, andRemote Regions in Canada
by
Shao-Meng Li, Jeff Brook, Richard Leaitch, Pierrette Blanchard,Ann Marie Macdonald, Amy Leithead, Desiree Toom-Sauntry
Atmospheric Environment Service4905 Dufferin Street, Downsview, Ontario M3H 5T4 Canada
In recent years, the Atmospheric Environment Service (AES), EnvironmentCanada, launched several short-term field studies on aerosol particles to probe thephysical and chemical characteristics, formation, and evolution of aerosol particlesin urban, rural, and remote regions in Canada. Figure 1 shows the locations of thesites and regions where the studies took place. In these studies, a large array ofaerosol physical probes and sampling instruments were used, including DMAs,PCASPs, ASASP’s, lidars, nephelometers, mass measurements, different cascadeimpactors, different bulk filterpacks with size selected inlets, and differentchemical analysis methods. In most cases, the measurements were coupled toconcurrent oxidant measurements involving ozone, NOx, and VOCs. Some studieswere ground based while others were airborne. We summarize here the majorfindings on aerosol chemical and physical characterization from these special fieldstudies.
Figure 1: A map of Canada showing the sites of studies. Names of the field studies areshown. The areas indicate airborne studies.
1. Urban and Rural Studies
The primary objectives of the urban air quality studies are to determine thecontributions of the transport sectors to the particle mass in the cities and insuburban surroundings, and the formation process of fine (<2.5 µm) particulatematter. The first urban study took place in the city of Toronto in the summer andwinter of 1998. The results show significant formation of new particles that isheavily influenced by road traffic. Figure 2 shows the particle number sizedistributions, from 10 nm to 300 nm, measured using a DMA, that show a largenumber of new particles produced within air masses directly influenced by thenear by rush hour traffic. Typically, very fine particles of about 10 nm diameter

132
are formed starting at around 8 am and last until about 12 am. These ultrafineparticles gradually grew into Aitken mode and accumulation mode particles overthe day. At the same time, a large number of Aitken mode particle (30-100 nmdiameter) is consistently present. Mass and chemical characterization indicates afraction of >50% of the particle mass as organic carbon and a significant part iselemental carbon. In comparison, inorganic constituents, such as sulphate,accounted for <30% of the mass.
Figure 2: Particle size distribution from 10 to 300 nm, from a DMA(left), and thechemical composition (right), at an urban site in Toronto, Ontario.
At the rural site at Egbert, Ontario, 80 km north of Toronto and downwind, thesame instrumentation package was setup in the summer of 1998 as a part of thecity-rural comparison. Here, the particle numbers and mass are much lower thanin Toronto. Figure 3 shows the particle number size distribution from 10 to300 nm, along with the chemical composition. Generally, ultrafine particles arenot present except a few distinct cases such as those found at midday July 25th and26th, where there was clear evidence of new particle generation. These ultrafineparticles were associated with biogenic sources as it was found that the carbonpreference index (CPI) of long-chain alkanes in particles is well above 5 duringthese events. Chemical measurements of the particles indicate that a significantamount of organics were present throughout the study period, accounting for20-65% of the particle mass at <2.5 µm diameter. Mass size distributions fromconcurrent MOUDI impactor sampling show that the most of the carbon mass isin the accumulation mode peaking at 0.2 µm diameter.
0
2
4
6
8
10
12
14
16
Egbert-Recon Egbert-Mass Evans-Recon Evans-Mass
Con
cent
ratio
n ( µ
g m
-3)
Other
NaCl
Soil
NH4
NO3
SO4
EC
OC
EMEP/CCC-Report 9/2000
Figure 3: Particle number size distribution, chemical composition, and particlecarbon size distribution at Egbert during summer of 1998.

EMEP/CCC-Report 9/2000
133
Similar urban and rural studies are planned, including a continuation of theToronto urban study and a new study in Lower Fraser Valley surroundingVancouver, Canada’s third largest city. The objectives are similar, to obtaininformation on the emission, formation, and evolution of particles.
2. Rural and Remote Regions
On the east coast of Canada over the Gulf of Maine and Bay of Fundy, three fieldstudies were conducted in 1993 (North Atlantic Regional Experiment, NARE),1995 (Radiation, Aerosol, Cloud Experiment, RACE), and 1996 (North AmericanResearch Strategy of Tropospheric Ozone – Canada East, NARSTO-CE). SeeFigure 1 for locations of the studies. Both NARE and RACE were airborne studiesover the Gulf of Maine and Bay of Fundy, at altitudes up to 5000 meters, whileNARSTO-CE was ground based in a forest clearing. During these experiments,efforts were made to characterize the chemical compositions and the relationshipsto their physical characteristics.
During NARE, it was found that sulphate comprises of 23% of total particle massin clear marine aerosols while accounts for over 70% in pollution aerosols fromeastern North America (Figure 4). Sulphate was also found to correlate withaccumulation mode particle volume, indicating that it exists in the accumulationmode. This feature was similarly found during the RACE in the same region twoyears later during RACE, where a further effort was made to partition particlemass as a function of size.
Figure 4: (left) sulfate vs. total particle mass in NARE. (right) coefficient ofdetermination R2 between particle volume and mass of sulfate andammonium is shown for both low and high TPM. Particle volumes atdifferent sizes are from PCASP probes.
Figure 5 shows the partitioning of particle mass with three chemical components,(NH4
++SO4
=), carboxylates, and sea salt in pollution and clear boundary layer airmasses at different particle diameters. It shows that sulfate is a major componentrelative to other group of compounds. However, a large mass still cannot beexplained by these components, especially in the accumulation mode. This“missing” mass is suggested to be some secondary organic matter.
Total Partic le M ass (µg m -3)
0 10 20 30 40 50 60 70
Ns
sS
O 4=
an
d O
rga
nic
Ma
ss
(µg
m-3
)
-5
0
5
10
15
20
25
30
35
nssSO 4= (TPM <15 µg m -3
)
nssSO 4= (TPM >15 µg m -3
)y= -5.4 + 0.72x; r2=0.90
y=0.01 + 0.23x; r2=0.48
Diameter (µm)
0.1 1
R2
0.00
0.25
0.50
0.75
Diameter (µm)
0.1 1 10
nssSO4= NH4
+

EMEP/CCC-Report 9/2000
134
Figure 5: Partition of mass with three chemical components.
During the NARSTO-CE field study at the Kejimkujik National Park on the eastcoast of Canada, particle chemical and physical properties as a function of sizewere investigated in more details. Figure 6 shows the size distribution of sulfateand hydrogen ion in particles during this study. It can be seen that sulfate exists inthe accumulation mode most of the time, but can extend to 1 µm, and is stronglyinfluenced by episodes. The episodes are clearly accompanied by free acidity inthe aerosols. However, not all free acidities were associated with sulfate, as duringday of year 174-175, 181-182, and 186-187 when free acidities were found toextend to very small particles, most likely contributed by organic acids. Figure 7shows the temporal pattern of mass size distributions of three organic acids(acetate, formate, oxalate, and propionate) in aerosol particles. These organic acidsshow size distribution patterns with a strong accumulation mode. These temporalpatterns eliminate the doubt that they were due to sampling problems. Indeed,these organic acids occur during different periods of time from those for sulfate,and their peak particle diameters, at <0.3 µm, appear to be slightly lower thansulfate. In fact, concurrent DMA measurements indicate rapid generation of fineparticles during the high periods of the organic acids, indicating that these organicacids may be linked to the new particle generation.
2D Graph 1
Geometric Diameter (µm)
0.2 0.3 0.4 0.5 0.6 0.7 0.8 0.9 21
Me
dia
n P
erc
en
tag
e C
on
trib
utio
ns
0
20
40
60
80
100
0
20
40
60
80
100
120
Pollution Aerosols (>800 cm-3)
Clean Aerosols (<300 cm -3)
Seasalt
Carboxylates
NH 4++nssSO 4
=
Total
ASASP (100%)
Carboxylates
Seasalt
NH 4++nssSO 4
=
Total
ASASP (100%)

EMEP/CCC-Report 9/2000
135
174 176 178 180 182 184 186 188 190 192 194
Day of Year
Geo
met
ric
Dia
met
er (
um
)
0 .0
0.4
0.8
1.2
1.6
2.0
2.4
2.8
3.2
3.6
4.0
0.01
0.1
1
10
174 176 178 180 182 184 186 188 190 192 194
Day of Year
0.000
0.005
0.010
0.015
0.020
0.025
0.030
0.035
0.040
0.045
0.0500.100
Figure 6: dM/dlogD (µg/m3) of nssSO4
= (left) and free acidity H+ (right).
174 176 178 180 182 184 186 188 190 192 194
geo
met
ric
dia
met
er (
um
)
0.000
0.005
0.010
0.015
0.020
0.025
0.030
0.035
0.040
0.045
0.050
0.100
0.01
0.1
1
10
174 176 178 180 182 184 186 188 190 192 1940.000
0.010
0.020
0.025
0.030
0.035
0.040
0.045
0.050
0.055
0.060
174 176 178 180 182 184 186 188 190 192 194
Day o f Year
0.00
0.03
0.04
0.05
0.06
0.07
0.08
0.09
0.10
0.11
0.12
0.20
Figure 7: dM/dlogD of Organic Acids: acetate (left), formate (center), and oxalate(right) during the NARSTO-CE experiment.
3. The Arctic Troposphere: Emphasis on Carbonaceous Aerosols
In April-May 1998, the FIRE III Experiment was carried out to study the radiativebalance in the Arctic troposphere. Figure 1 shows the location of the airbornestudy, which covers the southern part of Beaufort Sea off the coast of Alaska andYukon Territory and over a large polynya north of the Mackenzie River delta. Aninstrument package of aerosol characterization, similar to those used in the otherstudies, was deployed that measures the particle size distribution from 10 nm to10 µm and determines the chemical properties in aerosols.
So far, extensive chemical characterization has been done on bulk filter samples,emphasizing the carbonaceous components. Figure 8 shows the size distributionof mass and total carbon obtained from MOUDI sampling during two flights. Nearthe surface, carbon existed primarily in a course mode >1 µm and even close to10 µm, but there is evidence of accumulation mode and Aitken mode carbon. Athigh altitude from the other flight, carbon existed in two distinct modes, anaccumulation mode that extends into sizes <0.1 µm, and a course mode. Thestrong accumulation mode carbon was probably a result of secondary organicaerosol formation at lower altitude and transported to the Arctic. In contrast, thecoarse mode carbon was more likely a result from ice crystal growth fromaccumulation mode aerosols in stratus clouds (often observed in the winter-springArctic troposphere) or in the first flight from open polynya. It should be noted thatthe magnitude of the carbon mass is similar to that of sulfate, as further shown inFigure 9.

EMEP/CCC-Report 9/2000
136
Figure 8. Mass and carbon size distribution in the Arctic from two flights, one at closeto surface and the other at 5.5 km altitude.
Bulk filter samples collected on board the aircraft were analyzed for a number ofchemical species. Inorganic ions, including sulfate, were determined. However,emphasis was given to carbonaceous components. Total carbon, water solubleorganic carbon, short (<C4) and long chain (C12-C18) organic acids, long chainalkanes (C19-C33), and 10 PAHs were determined. Figure 9 shows that totalcarbon accounts for 40% of the total mass. This total carbon is further brokendown into a portion of 45% that is water soluble, 49% that is water-insoluble, andabout 6% carbonate. Of the water-insoluble carbon fraction, 25% can beaccounted with the long chain organic acids from C12-C18, and 1% is in the longchain alkanes (C19-C33).
Figure 9. The proportion of carbon in total mass (left), its breakdown into watersoluble, insoluble, and carbonate (center), and the various insoluble carbonspecies.
The long chain alkanes, from C19 to C33, show a CPI index of approximately 1,as shown in Figure 10, strongly suggesting that carbon in the aerosols has verylittle input from direct biogenic emissions. This is not surprising, given the seasonof the study and the distance from vegetation.
Flight 3, Beaufort Sea, Haze Layer A ltitude = 400 ft Particle Count = 120
Geometric Diameter (µm )
0.01 0.1 1 10
dM
/dlo
gD
( µg m
-3)
0
2
4
6
8
10
Total Carbon
Mass
Flight 10, Inuvik - Barrow Flight Altitude = 18 kft
Geometric Diameter (µm)
0.01 0.1 1 10
dM
/dlo
gD
( µg
m-3
)
0
1
2
3
4
5
Total Carbon
Aerosol Mass
Non-carbon Components
(60.5%)
Carbon
(39.5%)
Average Breakdown of Total Carbon
Water Soluble Organic Carbon (WSOC)
(45%)
Carbonate (6%)
Insoluble Organic Carbon + Elemental Carbon
(49%)
Alkanes (1%)
Breakdown of Water-Insoluble Carbon
Carboxylic acids (C12-C18)
25%
Unknown 74%

EMEP/CCC-Report 9/2000
137
Carbon Number
18 19 20 21 22 23 24 25 26 27 28 29 30 31 32 33 34
Co
nc
en
tra
tion
(n
g m-3)
0
2
4
6
8
10
12
14
16
Long Chain Alkanes
Figure 10: The alkane concentration versus carbon number.
Although small in absolute quantities compared to the total carbon observed, thePAH concentration were strong correlated with the water-insoluble organiccarbon. Furthermore, they were similar to the concentrations found at Egbert.Figure 11 shows the concentration of four of the 10 PAHs measured during thestudy. The level of concentrations is somewhat surprising, given the remoteness ofthe study area. Furthermore, most of the samples were collected in mid-altitudesof 2-5 km. There are two possibilities of these high levels of PAHs in the midtroposphere in the Arctic. One is direct transport from lower latitudes. Anotherpossibility is the emissions from jet diesel combustion from commercial jetlinerswhich can flight at altitudes as low as 8-9 km. Trajectory analysis is underway toassociate the high PAH events with potential source areas.
Sample Number
0 5 10 15 20 25
Co
nce
ntr
atio
n (
pg
m-3
)
0
5
10
15
20
25Fluorene
Sample Number
0 5 10 15 20 25 300
2000
4000
6000
8000
10000Phenanthrene
Sample Number
0 5 10 15 20 25
Con
cent
ratio
n (p
g m-3
)
0
50
100
150
200
250
300Anthracene
Sample Number
0 5 10 15 20 25 300
20
40
60
80
100
120
Fluoranthene
Figure 11: Four of the 10 PAHs found in aerosols in the Arctic troposphere duringFIRE III.
EMEP/CCC-Report 9/2000
138
4. Summary
The recent work on aerosol particles in different regions of Canada has producedsome very interesting results in terms of physical and chemical characterizationand new particle formation. It is important that these results are explored in muchmore depth to reveal information on the particle formation and evolutionprocesses in these different environments, in particular those related tocarbonaceous components. The results here give certain guidance to future aerosolparticle research, in particular the upcoming Pacific 2001 field study, which isplanned for the Lower Fraser Valley on the Pacific coast of Canada.
Acknowledgment
Data on the composition of aerosol particles are provided through the Egbert 98study from the GAViM sampling work. Ray Hoff, George Isaac, and JanBottenheim provided the leadership roles in organizing the Egbert 98, FIRE III,and NARSTO-CE field studies.
EMEP/CCC-Report 9/2000
139
Modelling Primary and Secondary Particulates using the NAMELong Range Dispersion Model
by
A.L. Malcolm and A.J. Manning
Public Met. Services Research, Meteorological Office,London Road, Berkshire RG12 2SZ, UK
Introduction
The fine fraction of airborne particulate matter (PM10) is a matter of growingconcern with respect to human health. The UK Met Office’s Lagrangiandispersion model NAME has been used to model both primary particulates andsulphate aerosol, a major component of secondary PM10. The NAME modelsimulates the dispersion of pollutants by releasing large numbers of particles in tothe three-dimensional model atmosphere defined by the UK Met. Office’snumerical weather prediction model, the Unified Model (Cullen, 1993). The three-dimensional wind field passively carries the released particles, with turbulentdispersion simulated by random walk techniques (Ryall and Maryon, 1998). Dryand wet deposition processes are parameterized, cloud and precipitationinformation being obtained from the Unified Model.
In order to model the transport of primary PM10 it is necessary to adequatelyrepresent the meteorological processes occurring in the atmosphere. That is themodel must accurately link the sources to the corresponding receptors andrepresent any deposition processes. In order to model the sulphate aerosolcomponent of secondary PM10 the model must also parameterize the key chemicalprocesses involved. The NAME sulphur chemistry scheme models both gaseousand aqueous phase oxidation of sulphur dioxide. Gas phase oxidation isdominated by the reaction with the hydroxyl radical (OH). The aqueous phasechemistry is based on the mechanism used in STOCHEM the Met Office’s globalchemistry model (Collins et al 1997) and includes both oxidation by hydrogenperoxide (H2O2) and ozone (O3). Cloud pH is calculated to drive the ozoneoxidation and this requires the ammonia life cycle to be modelled.
The aim of this study was to investigate the feasibility of modelling total PM10 atLondon. The model is validated by comparison with the average of PM10
measured at 6 London monitoring sites.
Model Setup
The work reported here is a study of August 1997. Three model runs have beenundertaken, the results of which can be added together to estimate the total PM10 atany location. The model domain was longitude 15.0°W to 50.0°E and latitude43.0°N to 65.0°N. The first model run used emissions of UK primary PM10 only,taken from the 1 km area National Atmospheric Emissions Inventory for 1996

EMEP/CCC-Report 9/2000
140
(http://www.aeat.co.uk/netcen/airqual/index.html). The data was split into trafficand industrial sources, the traffic particulates being released from 0-20 m and theindustrial from 20–40 m. Large emitters were kept at 1 km resolution, whilstlower emitting grid squares were combined to give 10 km area sources. Thesecond NAME run was to model primary PM10 emissions from Europe (excludingthe UK). The emissions data were derived using EMEP 1996 50 km area NOX
emissions (http://www.emep.int/emis_tables/tab1.html), scaled by the countrytotals for primary PM10 obtained from the TNO database (APEG, 1999). The thirdmodel run was to generate sulphate aerosol (a combination of sulphuric acid andammonium sulphate) by releasing sulphur dioxide and ammonia (EMEP 1996,50 km area) over the model domain. The resulting time series are then addedtogether to estimate the total PM10 and then plotted against an averaged Londonmeasurement. This estimate is lacking the contribution to secondary PM10 fromsources other than sulphate aerosol.
The measurement data was obtained from the National Air Quality InformationArchive provided by NETCEN (National Environmental Technology Centre) onbehalf of the Department of the Environment Transport and the Regions (DETR)(http://www.aeat.co.uk/netcen/airqual/index.html). The UK automatic urbannetwork of measurement sites use direct reading TEOM (Tampered ElementOscillating Microbalance) instruments. These have the advantage of real timemass concentration measurements (obtained at hourly intervals), however thefilter has to be kept at 50°C, which has lead to differences between massconcentrations measured by co-located (unheated) gravimetric filter samplers.Generally the TEOM sampler’s read lower, due to evaporation of semi-volatilespecies such as ammonium nitrate and some organic compounds. Care musttherefore be taken with estimation of the secondary component of PM10 based onthis measurement data. The secondary sulphate aerosol modelled in this study willbe detected by the TEOM, however, the magnitude of secondary aerosol detectedfrom other sources is not clear.
Results and Discussion
The current UK air quality standard for PM10 is 50 µgm-3 as a 24 hour runningaverage (based on TEOM monitoring data). Figure 1 is the result of applying a24 hour running average to the data. The three modelled components (red =sulphate aerosol, blue = primary UK PM10, green = primary European PM10) areplotted against a 24 hour running average of the London measurement data(averaged over 6 sites) for August 1997.
The model is clearly picking up the pattern of the PM10 episode over this period,although it is not achieving the actual magnitude observed. Further detailed studyat a shorter time resolution is required to resolve this model under prediction.

EMEP/CCC-Report 9/2000
141
Figure 1: NAME model output (red = sulphate aerosol, blue = primary UK PM10,green = primary European PM10) plotted against observed PM10 at Londonin •g/m3. A running 24 hour average has been applied to both sets of data.
References
APEG (Airborne Particles Expert Group) Report (1999) Source Apportionment ofAirborne Particulate Matter in the United Kingdom. Dept. of the Environment,Transport and the Regions, London, UK.
Collins, W.J., Stevenson, D.S., Johnson, C.E. and Derwent, R.G. (1997) Troposphericozone in a global scale three dimensional Lagrangian Model and its response to NOx
emission controls. J. Atmos. Chem., 26, 223-274.
Cullen, M.J.P. (1993) The Unified Forecast/Climate Model. Meteorological Magazine,(U.K.), 1449, 81-94.
Ryall, D.B. and Maryon, R.H. (1998) Validation of the UK Met Office's NAME modelagainst the ETEX dataset. Atmos. Environ., 32 (no. 24), 4265-4276.

EMEP/CCC-Report 9/2000
142

EMEP/CCC-Report 9/2000
143
Mass Median Diameters (MMD’s)of Aerosol Substances
by
Jürgen Müller
Umweltbundesamt, Paul-Ehrlich-Strasse 29, DE-63225 Langen
ABSTRACTParticulate matter of ambient air consists of many substances. Empirically it wasfound that the Mass Median Diameter (MMD) of every aerosol compound can berelated to its melting point and boiling point. A formula is given in which theMMD is described as a function of the melting and boiling point and ambient airtemperature. Thus it can be predicted which compounds are bound in fine particlesand which ones are in coarse particles. The calculated MMD’s of many inorganicand organic compounds are listed.
Relevance of MMD
The MMD of an aerosol substance mainly influences its tropospheric residencetime, the deposition velocity, the bioavailability in soil and water and the depth ofinhalability for human beings. A substance which accumulates in fine particles hassignificantly different properties than substances which are found in coarseparticles. Toxic substances in fine particles become more harmful to fauna, floraand human beings due to enhanced bioavailability and deeper inhalability.Accumulation mode particles (fine particles of diameter between 0.1 and 2.5 µm)which can be transported more than 1000 km predominantly consist of salts andacids which to a large extent are captured by clouds and rain and therefore maycause acidification and eutrophication.
Calculated MMD’s
Empirically it was found that the MMD can be related to the boiling point (TB)and melting point (TF) as well as ambient air temperature (T in °C):
−
+= 1
15.273
2
TC
TmdMMD o
$
(1)
( ) mdTT
CT oBF
m µ5.02
=+=$
For many substances the melting and boiling points are known. In the case ofinorganic compounds on an average TB and TF are related by:

EMEP/CCC-Report 9/2000
144
FB TT4
7= (2)
In Table 1 the calculated MMD’s of many inorganic compounds and severalPAH-compounds are listed.
Discussions and Conclusions
By use of formula (1) it can be considered that aerosol compounds of Tm between150°C and 900°C are incorporated in the fine particle mode. Compounds of Tm
beyond 900°C (particle diameter bigger than 2.5 µm) belong to coarse particles.Compounds of Tm below the vicinity of 150°C have sufficiently high specificvapour pressures to induce them to be totally in gas-phase under ambient airconditions.
Compounds roughly in the Tm-range between 150°C and 300°C under ambient airconditions partly exist in gas-phase and partly in particulate-phase as often hasbeen measured within the last two decades.
Compounds of Tm roughly above 300°C were observed to be totally in particulate-phase. Up to date heavy volatile species in particulate matter of ambient air onlyinsufficiently can be analyzed. Elements but no species can be measured by AAS,ICP-MS or several nuclear analytical methods (NA or PIXE).
However, by use of measured elemental mass size distributions of particulatematter also inorganic species can be determined. To each mode of the elementalmass size distribution due to different specific vapour pressures different speciescan be assigned (Müller, 1998). A measured mass size distribution also is a finger-print of the existing species. Thus the MMD of many species also can bemeasured.
In Table 1 can be seen that the fine particle mode mainly consists of electrolytis.The calculated MMD’s of the PAH-compounds also belong to this size range.This is consistent with the measurement of the MMD’s of PAH-compounds inparticulate matter of ambient air.
In the coarse mode mostly heavy volatile metaloxides are found. However, thecatalytic species Fe2O3 and V2O5 accumulate at the relatively small MMD of 3 µm.Thus they contribute also to gas-particle-reactions and enhance the formation ofsecondary aerosols.
Reference
[1] Müller, J. (1998) Measurement of Inorganic Species in Aerosols by Aid of ImpactorSampling. J. Aerosol Sci., 29, Suppl. 1, pp. 219-220.

EMEP/CCC-Report 9/2000
145
Table 1: Calculated Mass Median Diameters (MMD’s) of substances (inorganiccompounds and PAH-compounds) in airborne particulate matter.
MMD (µm)
0.1 – 0.2 H2SO4, SbBr2
0.2 – 0.4 NH4NO3
0.4 – 0.6 AlCl3, Cr(VI)O3, FeCl3, KHSO4, TlNO3, BbF
0.6 – 0.8 CHR, BkF, BaP, BeP
0.8 – 1.0 NaNO3, U3O8, PER, BghiP, DahA
1.0 – 1.2 As2O3, COR
1.2 – 1.4 As2S3, Cd(met.), PtO2, ZnCl21.4 – 1.6 KNO3, TlCl
1.6 – 1.8 PbO
1.8 – 2.0 NH4Cl, (NH4)2SO4, PbCl2, PbBr2
2.0 – 2.2 CdCl22.2 – 2.4 AlF3, CuCl2, Sb2S3, ThCl42.4 – 2.6 CoCl2, KOH, Sr(NO3)2
2.6 – 3.0 CuCl, Fe2O3, MnCl2, MnSO4, Pb(met.), PdCl2, Tl2O3
3.0 – 3.5 Al2(SO4)3, KCl, MgCl2, Na2CO3, NaCl, NiS, Sb4O6, TiCl2, UCL2
3.5 – 4.0 CaCO3, CaSO4, K2CO3, Na2O, Na2SO4, PdS, RuO2, V2O5
4.0 – 4.5 CaCl2, CdSO4, CdS, CoSO4, K2SO4, LaCl2, NiCl2, PbSO4, SrCl24.5 – 5.0 CrCl3, MgSO4, PbS, RhO
5.0 – 5.5 CoO, Cu2O, Fe2SiO4
5.5 – 6.0 CuO, Cu(met.)
6.0 – 6.5
6.5 – 7.0 Fe3O4, La(met.), Mn3O4, Ni(met.), SrSO4
7.0 – 7.5 Fe(met.), SiO2, TiO2
7.5 – 8.0 Al2O3, 3SiO2, CoO, MnO3, Ti(met.)
8.0 – 8.5 NiO, Pd(met.), Ti2O3
8.5 – 9.0 Al2O3, Cr2O3, SrO, VO, ZnO
9.0 – 9.5 Rh(met.)
9.5 – 10.0 CaO, Pt(met.)
10.0 – 10.5 La3O3
10.5 – 11.0 Ir(met.), Ru(met.)
11.0 – 11.5
11.5 – 12.0 ThO2
12.0 – 12.5 MgO, UO2

EMEP/CCC-Report 9/2000
146

EMEP/CCC-Report 9/2000
147
A new beta gauge monitorfor the measurement of PM10 air concentration
by
Cinzia Perrino, Antonio Febo, Ivo Allegrini
C.N.R. Istituto Inquinamento AtmosfericoVia Salaria Km 29,300 - C.P. 10 - IT-00016 Monterotondo Stazione (Roma) – ITALY
Introduction
As a consequence of the growinginterest in the measurement of fine par-ticles, an advanced system for samplingand measuring the air concentration ofsuspended particulate matter has beendevised. The new instrument (ADAM:Atmospheric Dust Automatic Monitor)collects atmospheric particles on stan-dard 47-mm membrane filters and per-forms the determination of the collectedamount of particles by using the betarays attenuation method. Sampled filtersare then available for any subsequentchemical analysis of the particulatematter and for possible gravimetricdetermination of the collected massamount.
Figure 1: The Atmospheric Dust AutomaticMonitor.
One of the most important features of the instrument is its ability to perform boththe sampling and the beta measurements on two different filters at the same time:this allows to increase the beta measurement time to 2 hours and to get a very highaccuracy of the results. The accuracy is also assured by the many automaticQuality Control procedures implemented in the ADAM. The features of thisinstrument make it a very valuable tool in monitoring networks.
Instrument description
The Atmospheric Dust Automatic Monitor is made of the following sections: – asampling head; – a sampling module that includes a flow rate control module; – amass measurement module; – a separate pneumatic circuit able to generate aknown and constant flow rate, used to automatically check the calibration of theflow rate reading. A schematic drawing of the instrument is reported in Figure 2.
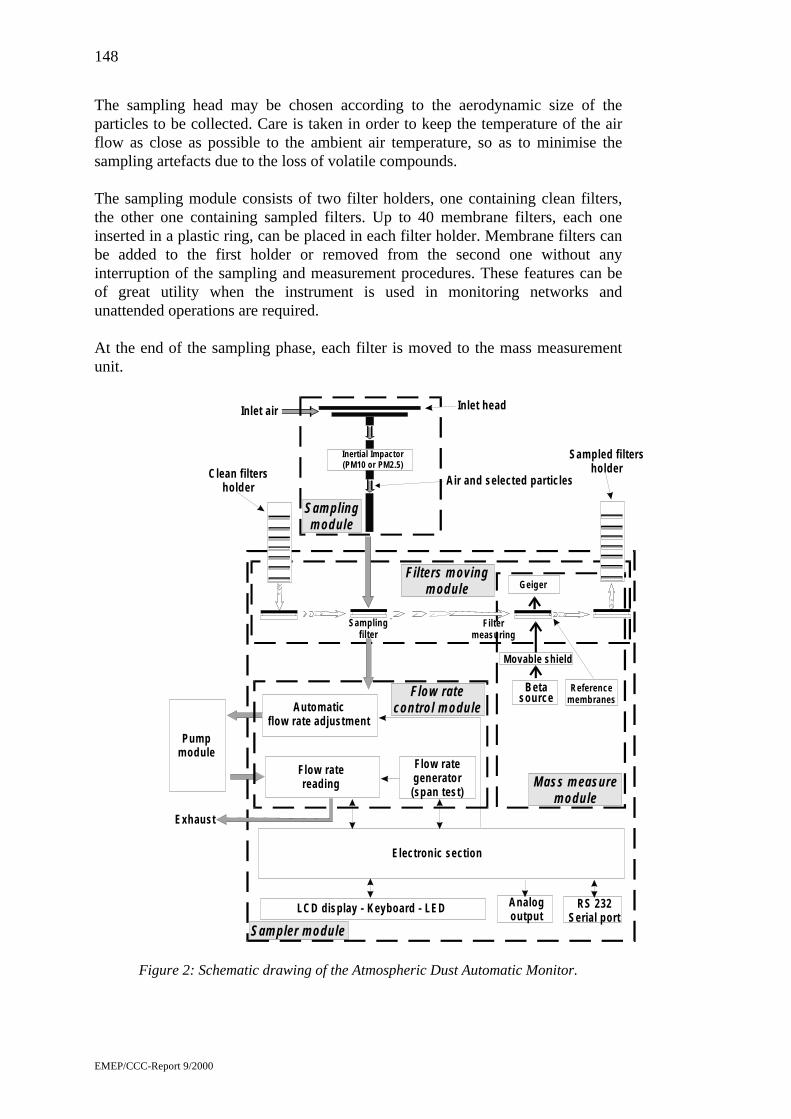
EMEP/CCC-Report 9/2000
148
The sampling head may be chosen according to the aerodynamic size of theparticles to be collected. Care is taken in order to keep the temperature of the airflow as close as possible to the ambient air temperature, so as to minimise thesampling artefacts due to the loss of volatile compounds.
The sampling module consists of two filter holders, one containing clean filters,the other one containing sampled filters. Up to 40 membrane filters, each oneinserted in a plastic ring, can be placed in each filter holder. Membrane filters canbe added to the first holder or removed from the second one without anyinterruption of the sampling and measurement procedures. These features can beof great utility when the instrument is used in monitoring networks andunattended operations are required.
At the end of the sampling phase, each filter is moved to the mass measurementunit.
Figure 2: Schematic drawing of the Atmospheric Dust Automatic Monitor.
In let head
Samplingmodule
Inlet air
Inertial Impactor(PM10 or PM2.5)
A ir and selected particlesC lean filtersholder
Sam pled filtersholder
Pum pm odule
Exhaust
Autom aticflow rate adjustm ent
Flow ratereading
Flow rategenerator(span test)
Flow ratecontrol module
Filters movingmodule
Mass measuremodule
Referencem embranes
Betasource
Sam plingfilter
Filterm easuring
Movable shield
G eiger
Electronic section
Sampler module
LCD display - Keyboard - LED Analogoutput
RS 232Serial port

EMEP/CCC-Report 9/2000
149
The sampling flow rate is controlled by means of motorised valves, so as to assurean independence of the flow rate from both the thermodynamic conditions and thepressure drop across the filter membrane (that is, from the filter loading). TheADAM automatically carries out a series of checks on the sampling flow rate, inorder to assure a high accuracy in the determination of the sampled volume. Thesechecks include: leak test, pressure drop monitoring, check of the stability and ofthe calibration of the pressure transducers, span test. The detection of seriousfailures in the tests causes the interruption of the sampling, while minor problemsare reported to the operator. The results of the span test over a one-month period(1 test per day) are reported in Figure 3.
-2.0
-1.5
-1.0
-0.5
0.0
0.5
1.0
1.5
2.0
1 3 5 7 9 11 13 15 17 19 21 23 25 27 29 31
Dif
fere
nce
%
Figure 3: Span test: trend of the % difference with respect to the original calibrationof the flow rate.
The mass measurement module consists of a C14 sealed beta source and a Geigerdetector that provides the beta counts measurement allowing the determination ofthe dust mass. The principle of operation is the physical law governing theattenuation of beta rays when passing through a thin layer of matter. Theattenuation of the beta rays emitted from the C14 source is measured by the Geigerdetector before (blank filter) and after (loaded filter) the sampling step. Thegeometry of the ADAM allows that a new filter undergoes the sampling stepwhile the previous one is subjected to the measurement phase, avoiding any lost oftime and increasing the time duration of beta measurement phase.
The accuracy and the precision in the measurement of the particles mass amountdepend on the following parameters: - density of the air layer between the betasource and the Geiger; - filter positioning during the blank and the measurementphases; - stability of the high voltage to the Geiger detector; - natural radioactivityof the collected particles.

EMEP/CCC-Report 9/2000
150
In order to take into account the small variations in the density of the air layerbetween the source and the Geiger, the pressure and temperature in themeasurement chamber is measured and a correction is calculated and applied. Thetemporal trend of the beta flux before and after the air density correction isreported in Figure 4.
Figure 4: Temporal trend of the betaflux before and after the correction forthe air density.
Figure 5: Stability of the high voltage to theGeiger.
An accurate control of the positioning of the filters in the measurement unit iscarried out, so as to assure that the possible difference in the position of the blankand the loaded filter is minimised.
A good performance of the Geiger detector is closely linked to the stability of thehigh voltage. For this reason, the ADAM continuously monitors this parameterand normalises the flux value to a reference high voltage value. The stability ofthe high voltage to the Geiger over a 52 days period is reported in Figure 5; thestandard deviation is 0.2 volt, that is 0.03 %.
The presence of short-life Radon daughters on the particulate matter causes apositive artefact in the beta flux measurement aimed to determine the particulatemass collected on the filter. In order to avoid this artefact, immediately beforecarrying out the measurement of the loaded filter the ADAM measures theresidual beta activity on the particles and carries out a quantitative correction ofthe beta flux.
The determination of the natural radioactivity of the collected particles providesan additional piece of information that has proven to be extremely useful for thecharacterisation of the atmosphere under study. The temporal variations in theRadon daughter air concentration are in fact closely linked to the variations in theheight of the mixed layer; this parameter, therefore, offers precious informationabout the ability of the atmosphere to dilute pollutants.
182000
183000
184000
185000
186000
187000
188000
189000
1 11 21 31 41 51 61 71 81 91 101 111 121
Run#
Bet
a fl
ux
(cp
m)
Beta flux
Beta flux corr
595
596
597
598
599
600
601
602
603
604
605
1 8 15 22 29 36 43 50
Day
Vo
lt

EMEP/CCC-Report 9/2000
151
The overall precision of the ADAM on 24-hour samplings is 0.7 µg/m3 (standarddeviation). The detection limit is 2 µg/m3 and the quantitation limit is 7 µg/m3.The accuracy is 2% of the read value.
Comparison with gravimetric analysis
The ability of the Atmospheric Dust Automatic Monitor to perform any kind ofphysico-chemical measurements on the collected filter offers the possibility tocompare the results obtained by the automatic beta gauge instrument with theresults obtained by applying the traditional gravimetric procedure to the samefilters. The result of this comparison is reported in Figure 6. The temporal trend ofthe measurements (Figure 6a) and the scatter plot (Figure 6b) show that there is avery good agreement between the two sets of measurements, with a very highcorrelation coefficient between the data (R2 = 0.99).
Figure 6: Comparison of the beta and the gravimetric 24-hour measurement ofparticle concentration: temporal trend (a) and scatter plot (b).
y = 0 .998 6x + 0 .68 99R 2 = 0 .99
0
20
40
60
80
100
0 20 40 60 80 100
G R AV IM E T R IC AD AM
BE
TA
AD
AM
0
20
40
60
80
100
1 2 3 4 5 6 7 8 9 10 11 12 13 14 15 16 17 18 19 20 21 22 23 24 25 26
24-HOUR SAM PLING S
MA
SS
CO
NC
EN
TR
AT
ION
ug
/m3
BETA ADAMGRAVIM ETRIC ADAM

EMEP/CCC-Report 9/2000
152
Conclusions
The Atmospheric Dust Automatic Monitor proves to be a very reliable tool for thedetermination of the atmospheric concentration of particulate matter. Its features(40 days of unattended operation on 24-hour samplings, possibility of an overallremote control, automatic QC/QA procedures) make it very suitable for beingused in atmospheric networks.

EMEP/CCC-Report 9/2000
153
Ionic content of atmospheric PM2.5 sampled by the diffusiondenuder/filter pack technique
by
Cinzia Perrino
C.N.R. Istituto Inquinamento AtmosfericoVia Salaria Km 29,300 - C.P. 10 - IT-00016 Monterotondo Stazione (Roma) – ITALY
Introduction
The ionic content of atmospheric particles having aerodynamic diameter lowerthan 2.5 µm can be determined by using diffusion lines made of a series of annulardiffusion denuders and a filter-pack. A typical diffusion line used in the EMEPstation of Montelibretti is shown in Figure 1. The line is made of five denuders setin series: two NaCl-coated, two Na2CO3 plus glycerol-coated and one phosphorousacid-coated device. The denuders allow the determination of the followingpollutants in the gaseous phase: nitric acid, sulphur dioxide, ammonia,hydrochloric acid, nitrous acid. The use of diffusion denuder upstream of thecyclone and filters allows avoiding any interference of the gaseous compounds onthe collected particles.
Figure 1: Diffusion line used in the EMEP sampling station of Montelibretti.
Downstream to the denuders, a cyclone allows the collection of the coarse fractionof the particulate matter. Downstream to the cyclone, particles having aero-dynamic diameter lower than 2.5 µm (at the operative flow rate of 15 l/min) arecollected on a Teflon membrane filter; the gaseous species evolved from theTeflon filter are recovered on the two back-up filters (acid gases on the Nylonfilter, alkaline gases on the acid-coated filter). The analysis of the collectedspecies is carried out by ion chromatography.
The possibility to take into account the gaseous species that are released from thefirst filter of the line in the course and after of the sampling constitutes animprovement with respect to the other methods for determining PM2.5 that can be,in some conditions, important. An evaluation of the extent of this phenomenon in
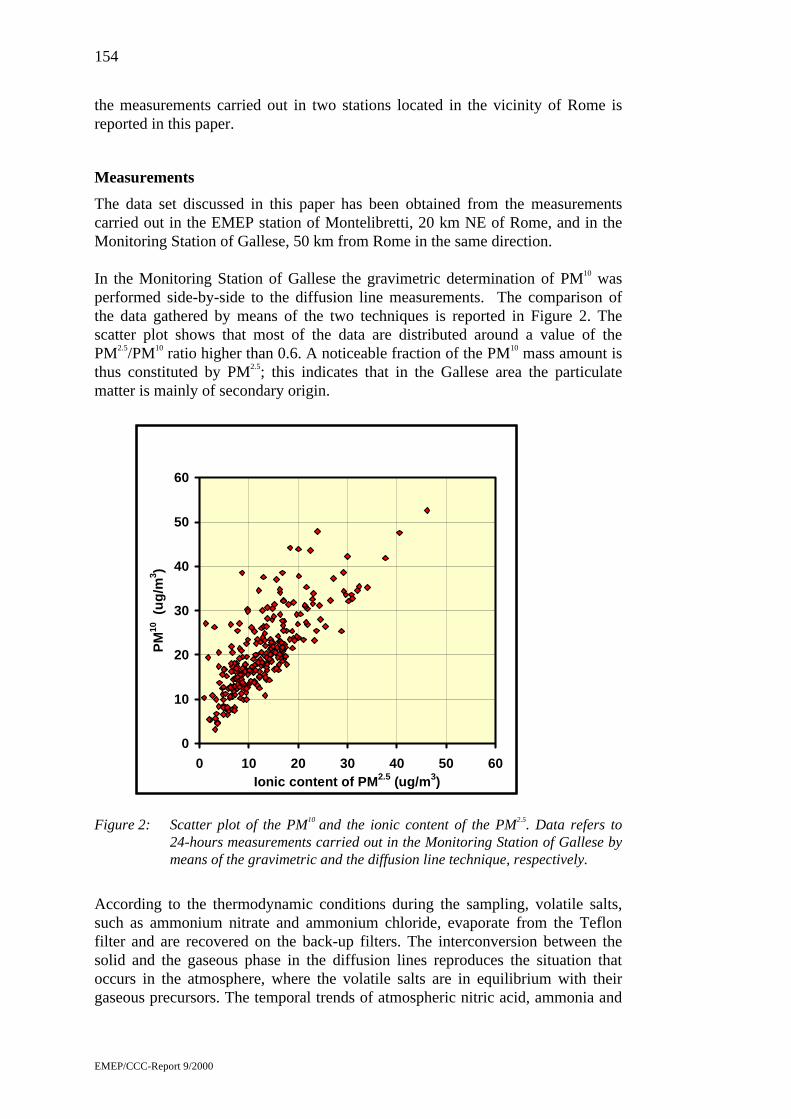
EMEP/CCC-Report 9/2000
154
the measurements carried out in two stations located in the vicinity of Rome isreported in this paper.
Measurements
The data set discussed in this paper has been obtained from the measurementscarried out in the EMEP station of Montelibretti, 20 km NE of Rome, and in theMonitoring Station of Gallese, 50 km from Rome in the same direction.
In the Monitoring Station of Gallese the gravimetric determination of PM10 wasperformed side-by-side to the diffusion line measurements. The comparison ofthe data gathered by means of the two techniques is reported in Figure 2. Thescatter plot shows that most of the data are distributed around a value of thePM2.5/PM10 ratio higher than 0.6. A noticeable fraction of the PM10 mass amount isthus constituted by PM2.5; this indicates that in the Gallese area the particulatematter is mainly of secondary origin.
Figure 2: Scatter plot of the PM10 and the ionic content of the PM2.5. Data refers to24-hours measurements carried out in the Monitoring Station of Gallese bymeans of the gravimetric and the diffusion line technique, respectively.
According to the thermodynamic conditions during the sampling, volatile salts,such as ammonium nitrate and ammonium chloride, evaporate from the Teflonfilter and are recovered on the back-up filters. The interconversion between thesolid and the gaseous phase in the diffusion lines reproduces the situation thatoccurs in the atmosphere, where the volatile salts are in equilibrium with theirgaseous precursors. The temporal trends of atmospheric nitric acid, ammonia and
0
10
20
30
40
50
60
0 10 20 30 40 50 60Ionic content of PM2.5 (ug/m3)
PM
10 (
ug
/m3 )
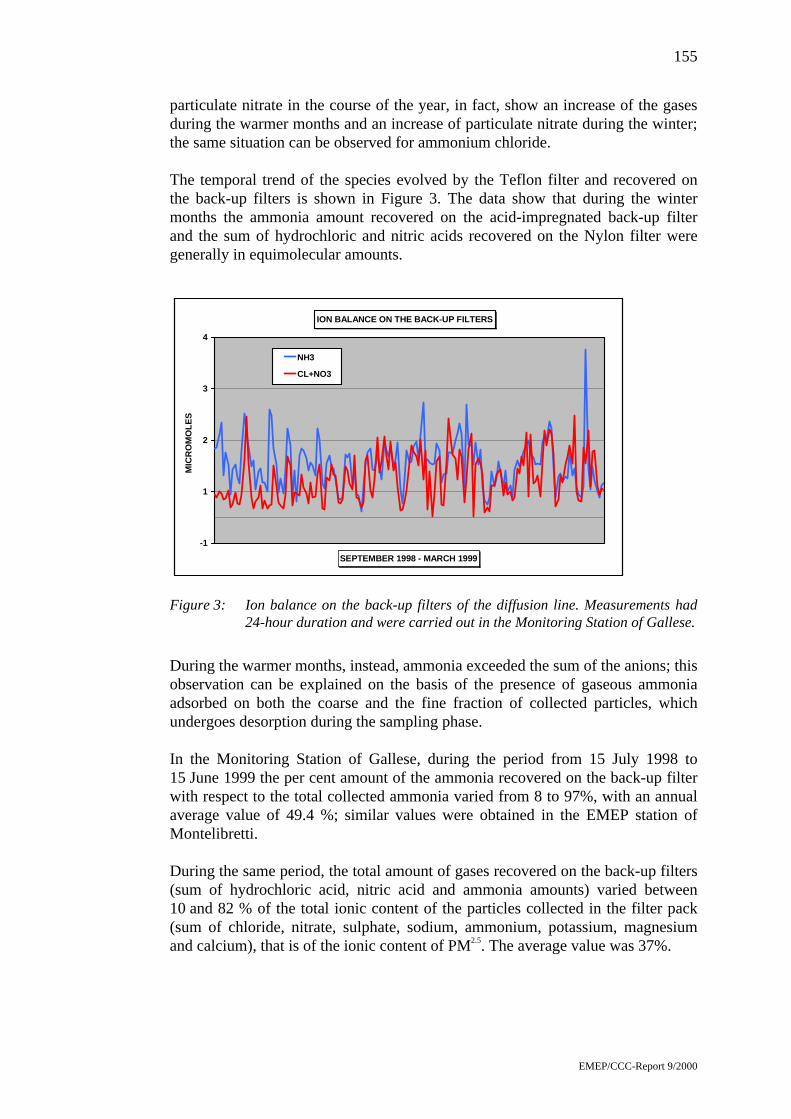
EMEP/CCC-Report 9/2000
155
particulate nitrate in the course of the year, in fact, show an increase of the gasesduring the warmer months and an increase of particulate nitrate during the winter;the same situation can be observed for ammonium chloride.
The temporal trend of the species evolved by the Teflon filter and recovered onthe back-up filters is shown in Figure 3. The data show that during the wintermonths the ammonia amount recovered on the acid-impregnated back-up filterand the sum of hydrochloric and nitric acids recovered on the Nylon filter weregenerally in equimolecular amounts.
Figure 3: Ion balance on the back-up filters of the diffusion line. Measurements had24-hour duration and were carried out in the Monitoring Station of Gallese.
During the warmer months, instead, ammonia exceeded the sum of the anions; thisobservation can be explained on the basis of the presence of gaseous ammoniaadsorbed on both the coarse and the fine fraction of collected particles, whichundergoes desorption during the sampling phase.
In the Monitoring Station of Gallese, during the period from 15 July 1998 to15 June 1999 the per cent amount of the ammonia recovered on the back-up filterwith respect to the total collected ammonia varied from 8 to 97%, with an annualaverage value of 49.4 %; similar values were obtained in the EMEP station ofMontelibretti.
During the same period, the total amount of gases recovered on the back-up filters(sum of hydrochloric acid, nitric acid and ammonia amounts) varied between10 and 82 % of the total ionic content of the particles collected in the filter pack(sum of chloride, nitrate, sulphate, sodium, ammonium, potassium, magnesiumand calcium), that is of the ionic content of PM2.5. The average value was 37%.
ION BALANCE ON THE BACK-UP FILTERS
-1
1
2
3
4
SEPTEMBER 1998 - MARCH 1999
MIC
RO
MO
LE
S
NH3
CL+NO3

EMEP/CCC-Report 9/2000
156
Conclusions
The determination of the soluble fraction of PM2.5 by means of the diffusion linesallowed to highlight that a significant fraction of the collected particles mayundergo desorption and evaporation phenomena; the extent of the release dependson the thermodynamic condition of the atmosphere under study.
In the examined location, the soluble fraction of PM2.5 constituted more than 50%of PM10, indicating that release of volatile compounds can be of importance also inthe determination of the PM10 fraction.
The described phenomena constitute a bias in the determination of particulatematter concentration by means of methods that do not take into account evolvedgases.

EMEP/CCC-Report 9/2000
157
Natural and anthropogenic sources of PM10 and PM2.5 in Spain.Incidence on the new PM10 limit values exceedances
by
F. Plana1, A. Alastuey1, B. Artíñano3, D. Alonso3, S. Rodríguez1,P. Salvador3, E. Mantilla2, P.P. Ricote4, A. López-Soler1 and
X. Querol1
1 Institute of Earth Sciences (CSIC) C/Lluis Solé y Sabarís s/n, 08028 Barcelona,Tf: 34 93 409 5410
2 Centro de Estudios Ambientales del Mediterráneo, (CEAM)3 Centro de Investigaciones Energéticas, Medioambientales y Tecnológicas, (CIEMAT)
4 Environment Spanish Ministry
Introduction
The implementation of the recent European air quality Directive (99/30/CE) willrequire an assessment of the ambient levels of several pollutants in the MemberStates. With respect to particulate matter, source apportionment studies will beneeded to discriminate its natural/anthropogenic origin. This would imply sizedistribution and chemical characterisation, in order to evaluate the differentcontributions mainly in the Mediterranean and south European areas, where theproposed PM10 levels could be exceeded by natural particulate inputs, likeSaharan air mass intrusions, resuspension of natural soils particles, wild fires, etc
In Spain, a project has been launched aimed at characterising the naturalcontribution of the particulate matter levels recorded in regional air qualitynetworks. The main objectives of this study are:
• To establish a methodology to discriminate anthropogenic/natural and local/remote PM10 sources in the regional air quality networks in Spain.
• To determine when the future PM10 limits are exceeded by natural causes.According to this issue, the suitability of measuring PM10/PM2.5 as a localindicator of the anthropogenic contribution.
• To reach and apply a methodology to establish equivalent measurementmethods to the PM10 reference method in the networks monitoring stations.
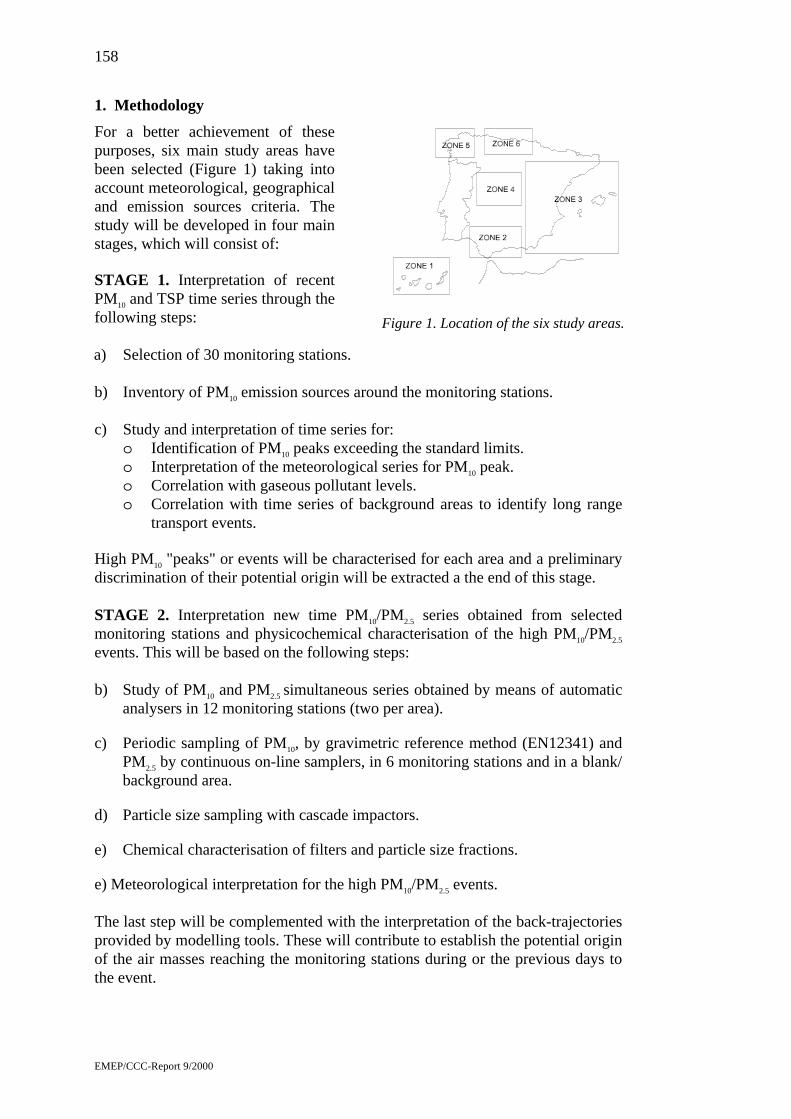
EMEP/CCC-Report 9/2000
158
1. Methodology
For a better achievement of thesepurposes, six main study areas havebeen selected (Figure 1) taking intoaccount meteorological, geographicaland emission sources criteria. Thestudy will be developed in four mainstages, which will consist of: STAGE 1. Interpretation of recentPM10 and TSP time series through thefollowing steps:
Figure 1. Location of the six study areas.
a) Selection of 30 monitoring stations.
b) Inventory of PM10 emission sources around the monitoring stations.
c) Study and interpretation of time series for:o Identification of PM10 peaks exceeding the standard limits.o Interpretation of the meteorological series for PM10 peak.o Correlation with gaseous pollutant levels.o Correlation with time series of background areas to identify long range
transport events. High PM10 "peaks" or events will be characterised for each area and a preliminarydiscrimination of their potential origin will be extracted a the end of this stage.
STAGE 2. Interpretation new time PM10/PM2.5 series obtained from selectedmonitoring stations and physicochemical characterisation of the high PM10/PM2.5
events. This will be based on the following steps:
b) Study of PM10 and PM2.5 simultaneous series obtained by means of automaticanalysers in 12 monitoring stations (two per area).
c) Periodic sampling of PM10, by gravimetric reference method (EN12341) andPM2.5 by continuous on-line samplers, in 6 monitoring stations and in a blank/background area.
d) Particle size sampling with cascade impactors.
e) Chemical characterisation of filters and particle size fractions.
e) Meteorological interpretation for the high PM10/PM2.5 events.
The last step will be complemented with the interpretation of the back-trajectoriesprovided by modelling tools. These will contribute to establish the potential originof the air masses reaching the monitoring stations during or the previous days tothe event.

EMEP/CCC-Report 9/2000
159
STAGE 3. Intensive measurements in identified situations when PM10 levelscould exceed the new PM10 standards by natural inputs. These will be carried outunder those meteorological scenarios in which high PM10 events usually occur.The selection of the scenarios could be done after the results of the previousstages, and will be performed for each selected area. The field campaigns willinclude:
a) Simultaneous sampling of PM10 and PM2.5 by means of Hi-Vol samplers.
b) Particle size sampling by means of cascade impactors.
c) Meteorological characterisation during single events.
d) Physicochemical characterisation of particles.
STAGE 4. A final phase of integration of the results obtained in the previousstages is foreseen in order to achieve the defined objectives.
2. Preliminary results
Previous experimental results obtained by the working group in some areas ofSpain have contributed to define the work hypotheses.
Figure 2 shows an example of what could be expected from the time seriesanalysis to be performed in STAGE 1. Seasonal patterns of the PM10 exceedancesof the daily limit values depend on the contribution of the different sources in eachregion. In this way, it can be observed the higher number of daily exceedances at arural environment in the South of Spain (CARBONERAS) during spring andsummer (Figure 2 a). This could be related to the greater influence of naturalprocesses during these seasons, i.e. higher levels of soil-related particles producedby strong convective conditions, lower aerosol scavenging potential (scarcerainfall periods), and higher influence of Sahara air masses intrusions. Figure 2 b)depicts the typical winter maximum at an urban site (Madrid) where the PM10
number of exceedances in this season is related to the major man-made emissions(mainly the road traffic exhausts and heating devices) and the strong atmosphericstability conditions. Finally, at the bottom (Figure 2 c)), corresponding to Sagrera,near Barcelona, the typical distribution of PM10 maxima at urban sites is not soclearly observed as in addition to the winter maximum PM10 exceedances are alsoachieved in spring, probably due to external or remote influences.
External influences have frequently been documented at this site, like the episodeof March, the 9th-10th in 1999 shown in Figure 3. An increase of the PM10 levelswas clearly observed in Barcelona at this occasion (Figure 3 a). The 850 hPa windfield forecasting of the previous day (Figure 3 b) confirmed a long range transportevent from the Sahara desert, related to the presence of a high pressure systemover the central Mediterranean and an air mass trajectory passing through thenorth African coast.

EMEP/CCC-Report 9/2000
160
a)
b)
c)
Figure 2 a), b) and c):Number of daily exceedances of the new PM10 daily average limit value(50 µg/m3) at a rural site a), an urban site b) and an externally influencedurban site c).
a) b)
Figure 3 a) and b):

EMEP/CCC-Report 9/2000
161
PM10 daily average values at and 850 hPa wind field forecasted by theSKIRON system on March, the 8th.
The PM10 and PM2.5 chemical analysisrevealed that the PM10 fraction was affectedby the intrusion, but not the PM2.5, as can beextracted from Table I. The large differencebetween the PM10 concentration calculatedby gravimetric measurements and by thesum of major ions was due to the highlevels of SiO2 and CO3
2- in the Saharan dust(not measured).
Table I: Chemical analyses of the PM10 andPM2.5 fractions during the 09-10/03/99 episode.
Other long-range transport event of particulate matter from North Africa occurredending April 1999 in the area of Barcelona. In this case it was due to thesimultaneous presence of an anticyclone in the Central Mediterranean and a low-pressure system at the Southwest of the Iberian Peninsula. The TSP and PM10
levels were affected by the western extreme of the dust plume passing overBarcelona (northeast coast). In contrast, the PM2.5 and PM1 levels only showed aslightly perturbed evolution, (Figure 4).
Figure 4: Impact of a Sahara intrusion episode on the TSP, PM10, PM2.5 and PM1 timeseries.
A basic objective of the project is to define a good indicator of the anthropogenicor natural contribution based on PM10/PM2.5 measurements. Under a very stableatmospheric situation in Barcelona, associated to a high pressure system placedover the Iberian peninsula, the highest pollution levels are usually registered. Inthese conditions the PM2.5 and PM1 levels experience a large increase, as occurredduring December, the 18th and 19th 1998 (Figure 5). On 20th and 21st, when the

EMEP/CCC-Report 9/2000
162
anticyclone moved, the PM2.5 and PM1 levels decreased, while the TSP and PM10
ones did not show a significant variation. So, it could be concluded that PM10
could be a good indicator of the natural sources influence on the particulate matterlevels, whilst the finer fractions, namely PM2.5 and PM1, are better related to theanthropogenic sources. Nevertheless further experiments are required to verifythis behaviour at other sites with different sources contributions.
Figure 5: TSP, PM10, PM2.5 and PM1 time series during a high pressure situation inwinter in Barcelona.
Finally, intercomparison exercises are being performed to achieve the lastobjective of the project. At present, experimental results show a good correlationbetween the reference gravimetric method for PM10 with the Graseby Andersendevice and other gravimetric devices (MCV, DIGITEL) as well as with acontinuous method (GRIMM). Although no reference method is yet establishedfor PM2.5, a good correlation has been also obtained between the gravimetric andthe continuous device (Figure 6) for this fraction.

EMEP/CCC-Report 9/2000
163
Figure 6: Comparison between PM10 and PM2.5 samplers used during intensivemeasurements.
Acknowledgements: This study has been supported by the Spanish Ministry ofEnvironment, the Plan Nacional de I+D under project AMB98-1044, and the PlanRegional de I+D de la Comunidad de Madrid CAM (Ref: 07M/0014/1998). Wewould like to express our gratitude to ENDESA, the Direcció General de QualitatAmbiental from the Generalitat Valenciana, and the Township of Madrid for theirhelp in supplying the air quality data.

EMEP/CCC-Report 9/2000
164

EMEP/CCC-Report 9/2000
165
Influence of the anthropogenic sources on the air quality inLjubljana region
by
*M. Puc, †M. Budnar
*University of Ljubljana, Faculty of Chemistry, Ljubljana, Slovenia†J.Stefan Institute, Jamova 39, p.p.3000, SI-1001 Ljubljana, Slovenia
Introduction
The understanding of the fine particulate (PM10 and PM2.5) transport is importanton the local, regional as well global level. The information about the elementalcomposition of the particulates serves for identification of the sources andcontributes to the estimation of the anthropogenic pollution influences. Thequantitative data on emissions from combustion of solid fuels, road and citytransport, and industrial processes are necessary for evaluation of these influences.The receptor modeling needs to be done properly taking into account the air masstransport and meteorological parameters. The prerequisite for the mentionedactivities are the quality assured sampling and measuring procedures developedfor the specific tasks related to the air quality issues.
Ljubljana, a capitol of the Republic of Slovenia, has been taken in the study as apotential pollution source, and the regional influences from industry and traffichas been studied. The city with around 400.000 inhabitants and area of 75 km2 hasseveral factories which are the pollution sources, uses combustion of coal forheating, and is crossed with highways, some of them connecting the EU south-west with east countries. A burden with heavy traffic transport to some of theMediterranean harbors through Ljubljana is increasing. Besides, the meteorologi-cal and topological conditions in Ljubljana are not in favor of this increasingburden. The location of the town in between the mountains generates the condi-tions for temperature inversions, especially in the winter time. Also the winddirections, predominantly blowing in the SW-NE direction, coincide with themost inhabitated areas of the town. All that mentioned was strong enough awarning signal to start the study of the fine particulate emissions and theirtransport in the region.
The sampling and analytical approach is described, and the preliminary results arepresented, definitely showing the anthropogenic source emissions influences.
Sampling and analysis
For the sampling the “Gent” type of the sampler has been applied. The samplerwhich selects between the PM2.5 and PM10 fine particles is located at theaccelerator centre of J. Stefan Institute, approximately 10 km from the Ljubljanadowntown in the NE direction. The sampler is equipped with the simplemeteorological station which enables the measurement of the wind speed, wind

EMEP/CCC-Report 9/2000
166
direction, air temperature, and humidity on the sampling spot. The meteorologicaldata at the sampler are permanently checked with the representative data from thenearby meteorological station. The samples are colleted twice per week,Wednesday and Saturday, giving the 24 hour averages over these two days. Theparticulate material collected on the filters is used then for the elementalconcentrations determination.
The Proton Induced X-ray Emission (PIXE) method is applied for the samplesanalysis. The standard PIXE in-vacuum arrangement is used, having the protonswith energies of 2 MeV, and the currents of up to 50 nA. The current doses arenormally equal to 100 µC. The X-rays produced by the proton bombardment aremeasured with semiconductor detector, and the concentrations of the chemicalelements above Al are determined simultaneously. The PIXE method is sensitiveenough to trace the presence of the elements bound to aerosols at levels far bellowng/m3. The measurement of the X-ray spectra and their computer analysis aremade automatically to overcome the cumbersome manipulation of the big amountof samples.
The computer codes were written for sorting the measured data in a time scale,and to correlate the information with the most important meteorological data, thewind speed and direction.
Results
Time variation of mass concentrations
Fourteen elements above Al are being detected in the particulate samples. Ca, Tiand Fe, which are known as mostly of natural origin, show very similar timevariation patterns. Their PM2.5 mass concentrations are generally lower than PM10
mass concentrations. Behavior of K and Mn is similar in coarse fraction but theyhave higher fine fractions with somehow different patterns.
On the other hand each of anthropogenic elements (Pb, Cu, S) shows unique timevariation pattern with some common characteristics. They are mainly present infine fraction and perform very strong and sudden peaks in mass concentration ofboth fractions. The peaks of different elements do not necessarily coincide. It isnot yet known whether the peaks are of very local origin (such as near chemicalfactory or agricultural activity) or are they to stem from the activities in Ljubljanaregion.
An increase of K and S fine fractions is found in late July and August. This can beunderstood as seasonal variation due to very stable and dry weather. There is alsono Cl observed in late spring.
Correlations of concentrations with the wind direction and speed
As our samples are 24 hour averages we calculated wind averages for thesampling days. For each chemical element we plotted a 3D histogram havingaverage wind direction and speed on x- and y-axis respectively and correspondingconcentrations on vertical axis (Figure 2). We eliminated the effect of uneven

EMEP/CCC-Report 9/2000
167
distribution of wind by dividing each bin by the number of its hits. This made thesecond histogram.
For most elements there is evidence of higher concentrations coming from thedirection of Ljubljana (SW). For some elements we are observing high concen-tration coming from NE, possibly from more distant industrial towns.
Objectives
Another sampling station is being planed to be installed on the opposite side ofLjubljana in order to distinguish its contributions from the background and toeliminate local contributions. The concentration-wind correlation will be deter-mined with greater certainty when more data is gathered.
We expect to detect an influence of a major highway which is being built near ourfirst sampling site (approx. 500 m). It will come into operation in late 2000 or2001.
Conclusions
The sampling and analytical procedures were installed to follow the emissionsfrom the activities in the Ljubljana region. The measured data show the sourceswhich can be related to the anthropogenic activities. The meteorological datadetermination at the sampling spot has been proven as a reliable auxiliary tool forthe source emitter identification.
References
[1] N. Frank, J. Homolya, Guideline on Speciated Particulate Monitoring, U.S. EPA,1998.
[2] Applied Research on Air Pollution Using Nuclear-Rrelated Analytical Techniques,NAHRES-19, IAEA, 1994.
[3] Applied Research on Air Pollution Using Nuclear-Rrelated Analytical Techniques,NAHRES-26, IAEA, 1995.

EMEP/CCC-Report 9/2000
168
Figure 1: Dependence of absolute concentrations of Fe and S in coarse and finefractions.
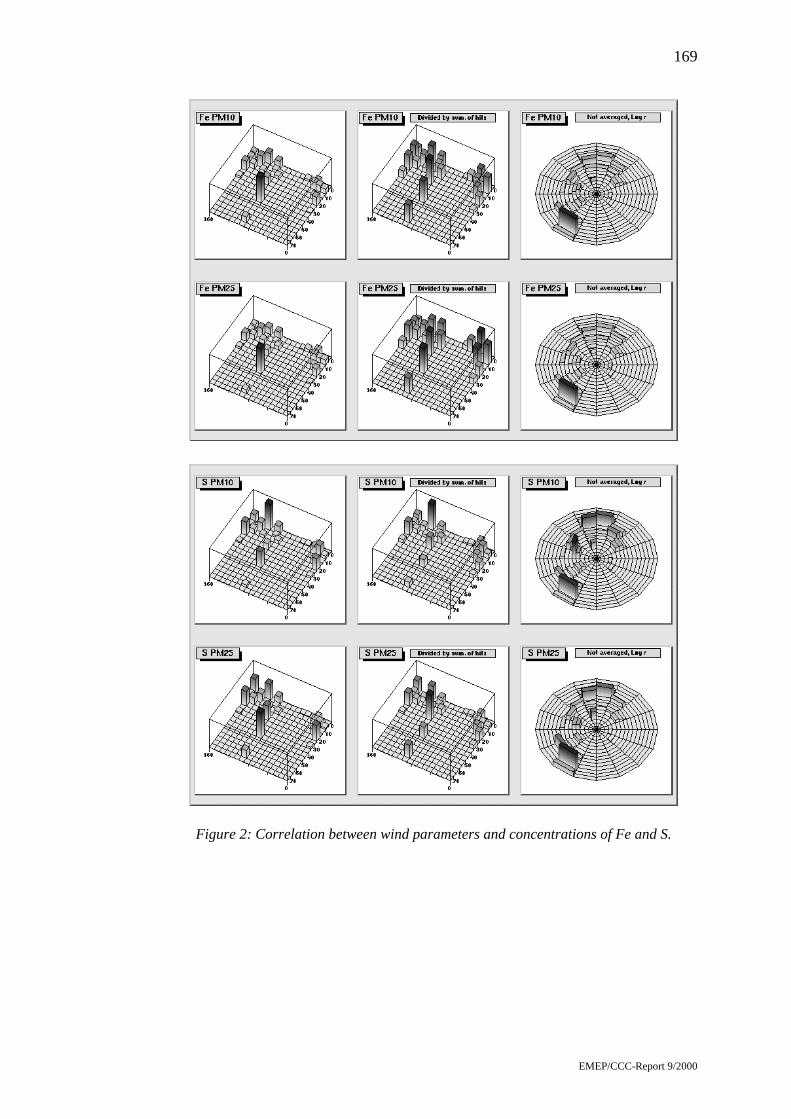
EMEP/CCC-Report 9/2000
169
Figure 2: Correlation between wind parameters and concentrations of Fe and S.

EMEP/CCC-Report 9/2000
170

EMEP/CCC-Report 9/2000
171
Measurement of particles at the monitoring station of the JointResearch Centre, Ispra, 1988 - 1998
by
Diana Rembges, Laure Dutaur, Claude Brun andWilfried Leyendecker
Joint Research Centre Ispra, Environment Institute, Air Quality, IT–21020 Ispra (VA)
Since the end of 1985, when the station has been set up, the station is managed bythe Joint Research Centre Ispra, Environment Institute, Air Quality Unit and isoperating on a regular basis in the EMEP measurement programme. The station issituated in a semi-rural region close to the Lago Maggiore, between the Alps tothe north and the Po-Valley to the south and far away from Milano, about 60 kmto the southeast.
The measurement of the total suspended particles (TSP) as part of the basicEMEP measurement programme, was set up at the Ispra EMEP Station in 1985.The data of these long time measurements show significant annual changes in theTSP air concentration with maximum values from the end of September toFebruary / March. These annual changes can be observed during all years. Until1994 there is a significant decrease in the air concentration of the TSP (average aswell as maximum values), while in the following years the TSP air concentrationsas well as the annual variations remain at the same level, with a slightlydecreasing trend. The composition of the basic ions NO3, NH4 and SO4 on thecollected aerosol filters remain the same during the measurement period.
The comparison of the periods with the highest air concentrations for the TSPwith the air monitoring data show increasing NO2 and NH4 air concentration withincreasing particulate air concentration while the trend for O3 is vice versa.
Some pilot studies of parallel sampling of TSP, PM2.5 and PM10 were carried out in1998 at the Ispra EMEP Station with further analysis of the aerosol filters onheavy metals by the means of X-ray fluorescence. Some preliminary results willbe presented in this poster.

EMEP/CCC-Report 9/2000
172
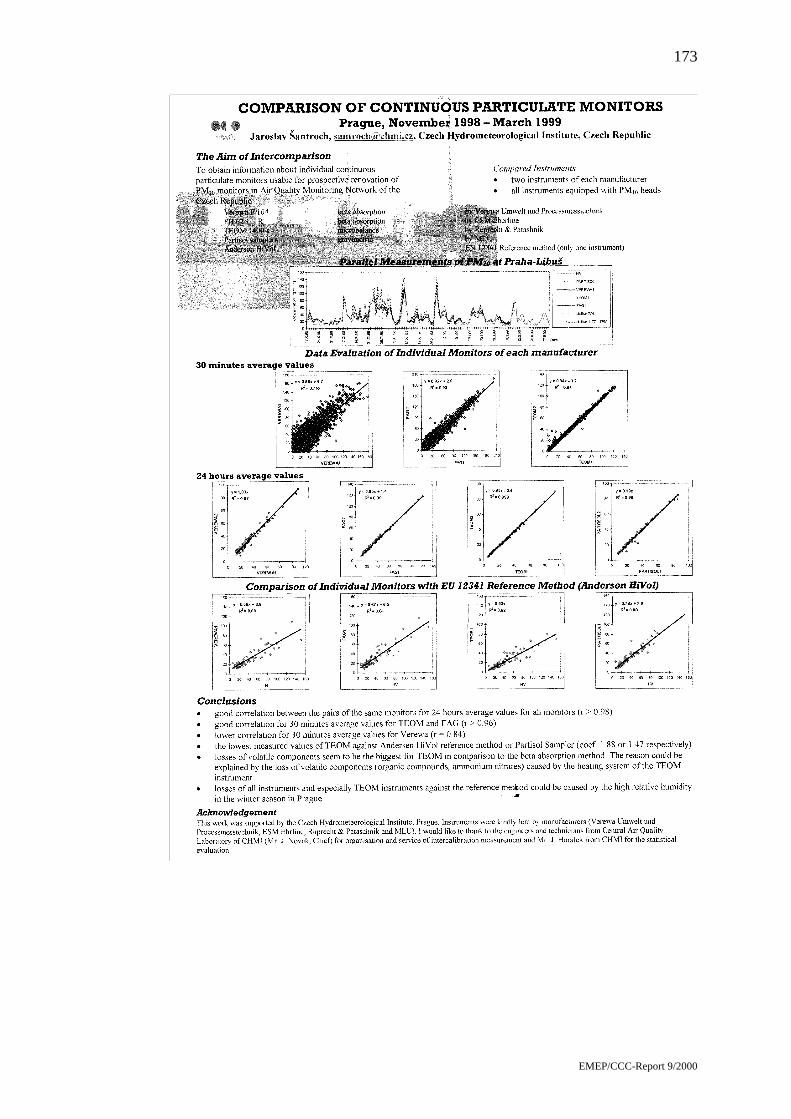
EMEP/CCC-Report 9/2000
173
Comparison of continuous particulate monitors
by
Jaroslav Šantroch

EMEP/CCC-Report 9/2000
174

EMEP/CCC-Report 9/2000
175
Analyses of results obtained with High volume aerosol samplerand Andersen low volume sampler in capital city of Macedonia
by
Radmila Simeva
Section Air Quality/Republic Hydrometeorological Institute, Skopje, Republic ofMacedonia (not presented)
Introduction
The monitoring of SPM in capital city of Macedonia, Skopje is established from1997 on four automatic stations. A Study Team from Japan InternationalCooperation Agency (JICA) and Ministry of Environment carried out “The Studyon Air Pollution Monitoring System in the Republic of Macedonia” together withthe cooperation of other relevant institutions.
Among the target substances stipulated by EU directive, the following pollutantshave been measured continuously in Macedonia
o The compound -Specific Directive (CSD): SO2 (24 hr), Black smoke (BS)(24hr), NO2, O3
o The Exchange of information decision (EoI): SO2 (24hr), BS (24hr)
In addition to this instrument, the following substances were monitored by JICA’smonitoring instruments
CSD: SO2, PM10, NO2, O3
EoI: SO2 (1hr), CO (1hr), NO2 (1hr), O3(1hr)
Continuous monitoring of SPM was also possible using PM10 instead of traditionalBS monitoring. Furthermore, 24-hour monitoring of heavy metals from SPM ofambient air was made after installing a High volume air sampler. During theproject the study team has carried out sampling and ingredient analysis of PM2,5,PM5 and PM10 for research besides the survey program of its visit. These data arevery important to analyze ambient air pollution because the results of statisticalanalysis on health damage by respiratory disease in Skopje are very serious.
Data of SPM in Ambient Air
1. Survey by High Volume Sampler
Sampling and components analysis of SPM including heavy metals by a highvolume sampler was performed. The method of survey and the results of surveyare as follows:

EMEP/CCC-Report 9/2000
176
a) The Method of Survey• Measurement points:
Automatic continuous measurement points in four different locations.• Measurement method:
24 hours sampling per mouth. Samplings were for heavy metals and carbonanalysis, and suction flow rate was 455 l/min respectively. Diameters ofparticle of SPM were three stages including PM2.0, PM2.0-10, > PM10. PM2.5
was utilized for components analysis as large amount of extracted SPM• Components analysis:
Pb, Cd, Cr, Ni, Fe, Cu, Zn, Mn, Na, K, Ca, Mg, C-ele, C-arg, etc.• Analysis method:
Republic Hydrometeorological Institute analyzed components by using anatomic absorption spectrophotometer which is provided by JICA.
b) Results of surveyIn heavy metal components, Pb (less than 0,4 µg/m3) was not exceeded theenvironmental standard level (0,7 µg/m3). In Carbon components, C-ele andC-arg levels are the same. C-total dominated about 30% of SPM.
2. Particle Size Distribution by Andersen-type low-volume Sampler
The purpose of the sampling of particulate matter by size (PM2.5, PM5, PM10) is theevaluation of emission source contribution by SPM size.
a) Survey Method- Survey Period: December 24,1997 to February 21,1998- Survey Point : No.1: Kinder Galten, No.2 RHMI, No.3 Railway Station- Sampling time: 24 hours- Sampling method: The filters for heavy metal analysis carbon are made of
Teflon and Quartz respectively. Sampling was avoided rainy weather.- Measurement Method:
• SPM concentration The direct reading type balance weighed SPM volume. Such balance measuredless than 0.1mg weight. SPM concentration was approximated by SPM weightdivided by flow volume aspirated.
• Heavy metal analysis Analytical instruments in use were XRF analyzers and ICP analyzer Metalcomponents measured were same as SPM sampling by high volume sampler.
• Carbon analysis was done by NDIR about elemental as well as organic carbon.a) Monitoring Method
The distribution of particle sizes of aerosols suspended in the air by an impactmethod equipped with multistage, multi-hole jet nozzle was measured by theAndersen Samples.
b) Result of AnalysisThe result of carbon analysis is show in Table 1.
XRF analysis is non-distractive and allow the simultaneous multi componentanalysis but deviation by type is found large in terms of sensitivity as well asaccuracy. Also analytical method like AAS result applied after acid dissolution

EMEP/CCC-Report 9/2000
177
often shows wide variance, which necessitates the use of analytical result infocareful consideration. Table 2 shows effort of XRF analytical data evaluation bygrouping the sampling filters (due to small SPM available) and subjecting to aciddissolution and AAS. The analysis data are show in term of component dissolvedin SPM, µg/mg.
The result of AAS analysis clearly showed the high content of Pb and as comparedthe sample taken near RHMI (Sample 1, 2, 3) the sample 4, 5 showed the higherPb concentration. As for carbon RWS point showed higher value of carboncontent in SPM size between < 2,5µm and that of < 10 µm showed the highervalue of carbon in < 2,5 µm SPM.
Table 1: The Results of Carbon Analysis in SPM (Andersen Low Volume Samples).
SamplingPoint
Sampling Date PM SPM Carbon
C-org C-ele C-totalDate Month Year
Conc.(µg/m3) Conc.
(µg/m3)Content
(%)Conc.
(µg/m3)Content
(%)Conc.
(µg/m3)Content
(%)
24-25 12 1997 PM10 221 9.2 4.2 24.3 11.0 33.5 15.1
25-26* 12 1997 PM10 126 7.6 6.1 17.6 14.0 25.3 20.1
26-27 12 1997 PM10 371 10.5 2.8 29.3 7.9 39.8 10.7
8-9 1 1998 PM2.5 163 12.8 7.9 30.8 18.9 43.6 26.8
9-10 1 1998 PM2.5 166 14.1 8.5 38.3 23.1 52.3 31.6
RHI
10-11 1 1998 PM2.5 13 1.5 11.3 2.6 19.5 4.1 30.8
17-18 2 1998 PM10 325 38.8 11.9 83.1 25.6 121.9 37.5
18-19 2 1998 PM10 153 16.5 10.8 47.7 31.0 64.2 41.8
19-20 2 1998 PM10 130 17.4 13.4 47.3 36 64.7 49.8
20-21 2 1998 PM10 245 29.7 12.1 78.7 32.1 108.4 44.2
RWS
21-22 2 1998 PM10 261 35.4 13.6 86.9 33.3 122.3 46.9
Note RHI: Republic Hydrometeorological InstituteRWS: Rail Way stationContent (%): Ratio of component for SPM25-26*: It is not 24 hours flow (problem with pomp)
Table 2: Results from Metal Analysis from Mixed Filter Samples of SPM taken byAndersen-type Low-Volume Sampler.
Element, µg/mgMonth/station
Totalmassmg Na K Zn Mg Fe Pb Mn Cr Cu Ni Cd
Sample 1 13.3 1.128 5.732 0.226 1.977 6.240 1.278 0.748 0.145 0.154 0.172 0.0375
Sample 2 8.25 2.624 8.564 0.1576 3.164 7.758 1.273 1.067 0.0958 0.091 0.201 0.071
Sample 3 9.44 0.567 5.713 0.1695 1.086 3.072 1.006 0.577 0.0095 0.159 0.147 0.0106
Sample 4 3.96 2.487 15.05 0.581 4.90 13.89 7.071 0.795 0.0417 0.53 0.303 0.0353
Sample 5 9.79 1.798 8.655 0.398 7.666 21.55 3.473 1.236 0.136 0.408 0.202 0.0215
Sample 1 (RHMZ, PM 10 µm): T1; T2; T8; T10 and T12Sample 2 (RHMZ, PM 10 µm): T23; T45; T49; T51 and T53Sample 3 (RHMZ, 2 samples 2,5 µm; 3 samples 5.0 µm): T4; T5; T7; T9 and T11Sample 4 (Majcin Dom, PM 10 µm): T44; T50; T52; T54 and T60Sample 5 (Railway Station, PM 10µm): T61; T63; T64; T65 and T66

EMEP/CCC-Report 9/2000
178

EMEP/CCC-Report 9/2000
179
Preliminary model investigations of the fine particles distributionin the Northern Hemisphere
by
M. Sofiev
Finnish Meteorological Institute, Vuorikatu 19, 7th floor, FIN-00 100 Helsinki, Finlande-mail: [email protected]
Introduction
There is a growing concern about various negative effects caused by the anthropo-genic aerosols. This issue is included in the work programme of the Conventionon Long Range Transboundary Air Pollution, which has established a joint TaskForce with the World Health Organization to investigate it. World MeteorologicalOrganization is addressing the problem of fine particles monitoring at a globalscale.
Current study is aimed at preliminary numerical simulation of the production anddistribution of acid chemical aerosol, which is primarily formed from the oxidisedsulphur, nitrogen and ammonia during the atmospheric transport and transform-ations of those pollutants. The 3-D Dispersion Model of Atmospheric TransportDMAT-acid used for the calculations was developed in the scientific team of M.Galperin. Its current version is described in Sofiev (1999) with the multi-layervertical structure outlined in Sofiev & Grigoryan (1996).
The calculations cover the whole year 1995 and were made for the NorthernHemisphere to the north of 10°N with spatial resolution of 150 x 150 km2 in polarstereographic projection. The emission data were taken from Global EmissionInventory Activity GEIA DB (Benkovitz et al., 1996) for oxidised sulphur andnitrogen. Ammonia emission was the same as in Galperin & Sofiev (1998).
The model outline
The DMAT model v.2.0 is based on 3-D Eulerian advection scheme, which can beclassified as “pseudo-Lagrangian” one. Its advantages are zero numerical viscosityand high computational efficiency. The disadvantage is considerable non-monotonicity of the instantaneous concentration fields. These fluctuations do notbreak the scheme stability and can be reduced by averaging over certain timeperiod. According to the experience of the model exploitation, a weekly averagingis enough to reduce the non-monotonicity down to ~10% of the mean values.
Current model version can work with two vertical structures – semi-analyticalcontinuous profile and “classical” multi-layer construction with up to 10 layers ofvariable thickness. For current calculations the 10-layer scheme was employed,providing the model top at 7650 m above the relief.

EMEP/CCC-Report 9/2000
180
The model chemical scheme considers 11 species and 17 reactions including5 ones of second order for SO2, H2SO4, SO4
=, NO, NO2, HNO3, NO3
-, NH3, NH4
+,PAN, O3 and extends the scheme described in (Pressman et al., 1991). The mainaddition is connected with ammonia part based on (Finlayson-Pitts & Pitts, 1988).Dry deposition parameterization distinguishes the water and land surfaces. Forterrestrial systems the effects of soil moistening and water freezing at lowtemperatures are taken into account. For oceans and seas the deposition velocityincreases proportionally to the second power of wind velocity, which takes intoaccount the process of wave creation. Wet deposition of SO2 is considered to benon-linear with regard to atmospheric concentrations (Galperin, 1989). Thesaturation effect introduced in the model decreases the washout efficiency in theregions with very high air concentrations, which well corresponds to the observedphenomena. For oxidised nitrogen this effect is smaller, and for cationproducingsubstances like ammonia it is not considered.
Discussion of calculation results and model accuracy
The results of calculations include maps of concentrations and depositions for allconsidered pollutants. The most important for current study are near-surfaceconcentrations of sulphates and nitrates, as well as their total column burden(Figure 1). In general they confirm that in the Northern Hemisphere there are threemainly self-polluted regions – Europe, South-East Asia and North America. Theirinter-action is quite small and episodic. At monthly or annual levels of averagingthe absolute values of cross-depositions are within the model precision limits.
It is important that concentrations of nitrogen aerosol (if taken in moles) arecomparable and often higher than those of sulphates. It means that the amount ofparticles produced from nitrates is larger than sulphate ones. Nitrogen species aregenerally transported over longer distances than sulphur compounds, so thenegative effects can be observed over much broader areas.
The model validation in Europe for 1995 was split to two parts. First, the dailyand monthly values were compared with EMEP air quality observations(Hjellbrekke et al., 1997) – see Table 1. Second, the spatial distribution of thepollutants with annual averaging was compared – see scatter plots in Figure 2. Notall the stations measuring in 1995 were included into the analysis. The selectedsites have met the following criteria: the completeness of time series should bemore than 50% for each substance separately; the station should belong to thequality group 1 or 2 in EMEP quality list (see e.g. Barret & Berge (1996) fordetails); station height above the sea level should not differ from the mean gridcell value for more than 150 m, which assures the station location inside 1st or 2nd
levels of the model.
Considering the agreement of daily values it is necessary to take into account thatrepresentativeness of daily measurements for 150 km grid cell is very low.According to EMEFS inter-calibration experiments (Seilkop, 1994) the 95%confidence limit for daily point measurement of SO2 in air for 80 km grid cell isbetween -76% and +172%. For SO4
= the corresponding range is from -40% up to+56%. This means that daily averaging is insufficient and one monitoring site

EMEP/CCC-Report 9/2000
181
cannot reproduce the meteorological and pollution patterns in the area of80 x 80 km2 and, consequently, in 150 x 150 km2 grid. In this light the correlationbetween daily modelled and observed concentrations and depositions becomessurprisingly good. Monthly concentrations, correlate considerably better foralmost all substances. Station representativeness at this averaging level is better(relative standard deviation is 20–30% depending on the substance – see (Galperin& Sofiev, 1994)), and also the non-monotonicity of the advection scheme issmoothed.
Mean annual values correspond well for all substances – the deviation is not morethan 20–25%, which is within the fluctuations of the values themselves(represented by the standard deviations in the last two columns of Table 1).
For other parts of the model domain (North America and South-East Asia)additional work is needed for correct assessment of the model accuracy. Thedifficulties are caused by the different principles of the site locating in UnitedStates, where the bulk of the stations are very close or inside cities, which raisescertain doubts in their representativeness for the regional pollution (EPA, 1997).In Asia the data are scarce and not well inter-calibrated with the others.
Table 1: Daily and monthly time series comparison for 1995. Results are averagedover EMEP network.
Substance, unitNbr of
stationsMean
observedMean
calculated
Correlationcoefficient
daily
Correlationcoefficientmonthly
Standarddeviationobserved
Standarddeviationmodelled
Precip., mm 59 2.59 2.49 0.42 0.72 5.76 4.76
SO2 55 1.49 2.37 0.36 0.52 1.82 2.84
NO2 53 2.02 2.58 0.22 0.35 1.28 1.74
SO4= 70 0.90 0.75 0.31 0.39 0.74 1.26
NO3- 13 0.56 0.71 0.20 0.33 0.49 1.02
NH4+ 19 0.99 0.82 0.26 0.23 0.81 1.21
HNO3+NO3- 36 0.44 0.53 0.22 0.29 0.40 0.79
NH3+NH4+ 31 1.41 1.39 0.20 0.19 1.21 1.16
NO3-wet dep. 57 0.96 0.88 0.16 0.25 2.25 1.70
NH4+ wet dep. 58 1.30 1.05 0.19 0.38 3.60 1.66
SO4= wet dep. 60 1.68 2.16 0.23 0.33 4.25 3.33
Conclusions
The numerical simulations performed for the Northern Hemisphere for thecomplete year 1995 for sulphur and nitrogen oxides and ammonia have shown thecomparable amount of sulphate and nitrate aerosol over the whole domain.Fraction of nitrogen particles becomes larger in remote areas, which is caused bythe larger transport distance of those species.
The model demonstrated good accuracy of annual values – the differences havenot exceeded 25%. Correlation coefficients are quite diversed for differentsubstances and averaging intervals. Still even for daily values the deviations

EMEP/CCC-Report 9/2000
182
between the model and observations are comparable with the uncertainties of themeasurements themselves. For monthly averaging better representativeness of themonitoring data enables to highlight the groups of substances reproduced better(mainly primary pollutants) and the others, whose accuracy needs furtherimprovement.
Figure 1: Maps of mean annual concentrations (above, unit µg S/N m-3) and columnburdens (below, unit mg S/N m-2) for sulphates (left) and nitrates (right).
Figure 2: Annual model-measurement comparison for 1995 for EMEP stations.

EMEP/CCC-Report 9/2000
183
References
Barret K., Berge E. (1996) Transboundary air pollution in Europe. Part I. Estimateddispersion of acidifying agents and of near surface ozone. EMEP/MSC-W Statusreport 1/1996, DNMI, Oslo, Norway, 180 p.
Benkovitz C.M., Scholtz T., Pacyna J., Tarrason L., Dignon J., Voldner E.C., Spiro P.A.,Logan J.A. and Graedel T.E. (1996) Global gridded inventories of anthropogenicemissions of sulphur and nitrogen. J. Geophys. Res., 101 (22), 29239-29253.
EPA (1997) National Air Quality and Emission Trend Report. US EPA, ResearchTriangle Park, NC., 184 p.
Finlayson-Pitts B.J., Pitts J.N. (1988) Atmospheric chemistry fundamentals andexperimental techniques. John Wiley & Sons, NY.
Galperin M.V. (1989) Adsorption-kinetic nonlinear washout model of sulphur andnitrogen compounds from the atmosphere. In: Air Pollution Modeling and ItsApplication VII. N.Y. & London, Plenum Press, p. 475-484.
Galperin M., Sofiev M. (1994) Errors in the validation of models for long-rangetransport and critical loads stipulated by stochastic properties of pollution fields.Proc. of EMEP workshop on the Accuracy of Measurements, EMEP/CCC Rep. 2/94.
Galperin M., Sofiev M. (1998) The long-range transport of ammonia and ammonium inthe Northern Hemisphere. Atmos. Environ., 32, No. 3, 373-380.
Hjellbrekke A.-G., Schaug J., Hanssen J.E., Skjelmoen J.E. (1997) EMEP CCC Datareport 1995 Part 2. Norwegian Institute of Air Research, Kjeller, Norway.
Pressman A.Ya., Galperin M.V., Popov V.A., Afinogenova O.G., Subbotin S.R.,Grigoryan S.A., Dedkova I.S. (1991) A Routine Model of Chemical Transformationand Transport of nitrogen compounds, ozone and PAN within a regional scale. Atmos.Environ., 25A, No. 9, 1851-1862.
Seilkop S.K. (1994) Representativeness of a site in an 80 km grid. Proc. of EMEPWorkshop on the Accuracy of Measurements, EMEP/CCC Rep. 2/94.
Sofiev M. (1999) A model for the evaluation of long-term airborne pollution transport atregional and continental scales. Accepted by Atmos. Environ.
Sofiev M.A., Grigoryan S.A. (1996) Numerical modeling of hemispheric air transport ofacid compounds. Comparison of three approaches. EMEP/MSC-E report 6/96,Moscow, 30 p.

EMEP/CCC-Report 9/2000
184

EMEP/CCC-Report 9/2000
185
Receptor modelling of PM10 concentrations at a site in CentralLondon
by
John R. Stedman, Emma Linehan, Beth Conlan
AEA Technology, Environment, National Environmental Technology Centre, E5Culham, Abingdon OX14 3ED, UK
Introduction
The European Union ‘Daughter Directive’ proposes ‘Stage 1’ limit values for PM10
to be achieved by 1 January 2005: annual mean value of 40 µgm-3 and 24-hourlimit value of 50 µgm-3, not to be exceeded more than 35 times a year(approximately equivalent to a 90th percentile of 50 µgm-3). Additional indicative‘Stage 2’ limit values have been proposed for achievement by 1 January 2010.
The UK National Air Quality Strategy (NAQS, DoE, et al., 1997) includes aprovisional objective for PM
10 of the daily maximum of the 24-hour running mean
of 50 µgm-3, measured as the 99th percentile, to be achieved by the end of 2005.The recently reviewed NAQS (DETR, et al., 1999) concluded that the provisionalobjective is unlikely to be achievable across a large part of the country. It wastherefore proposed that action should be concentrated in the short term onachieving the EU Stage 1 limit values, replacing the existing objective.
The conclusions of the review were based, in part, on projections of future PM10
concentrations derived from a receptor model method developed within theframework of the UK Airborne Particles Expert Group (APEG, 1999; Stedman etal., 1998). These projections were derived from a receptor modelling analysis ofdaily PM
10 measurement data from 1995, 1996 and 1997. Projections derived from
receptor modelling of 1998 monitoring data have now been completed and theresults highlight the large year to year variability in PM
10 concentrations in the
UK.
PM10 receptor modelling was undertaken for the London Bloomsbury site in
Central London and projected concentrations have been compared with theoriginal NAQS objective and proposed limit values. The monitoring site atLondon Bloomsbury is an urban background site, approximately 35 metres from amajor road. PM
10 and PM
2.5 are measured hourly using a Tapered Element
Oscillating Microbalance (TEOM) instrument and NOx measurements are made
using a chemiluminescent monitor. Daily mean particulate sulphate concentrationshave been measured at two rural sites in south-east England. Annual meanconcentrations of PM
10, NO
x and particulate sulphate are shown in Table 1.

EMEP/CCC-Report 9/2000
186
Table 1: Annual mean concentrations of PM10, NOx and particulate sulphate* atLondon Bloomsbury 1996-98.
PM10 (µgm-3) NOx (µgm-3) SO4 (µg SO4m-3)
1996 30.3 151.3 4.81997 26.6 160.6 3.41998 22.7 128.2 2.8
* Particulate sulphate concentration is the average of the measure-ments at two rural monitoring sites in south east England
Annual mean PM10 concentrations in the UK fell rapidly over the three year
period. Annual mean particulate sulphate also declined rapidly during these threeyears. Annual mean NO
x was highest in 1997 and lowest in 1998.
Source apportionment of monitoring data
The receptor modelling technique enables the measured daily mean PM10
concentration at a monitoring site to be divided into three components (APEG,1999; Stedman, 1997; Stedman, 1998):
• primary combustion particles• secondary particles• ‘other’ particles, are assumed to be coarse particles (diameters of 2.5 to
10 µm), which are primarily made up of resuspended dust and sea salt Oxides of nitrogen (NO
x) measurements are used as an indicator for primary
combustion particles and rural sulphate measurements are used as an indicator forsecondary particles. A multiple regression analysis is carried out to determine thecoefficients A and B for primary combustion and secondary particleconcentrations:
[measured PM10] = A [measured NOx] + B [measured sulphate] + C
The daily mean concentration of ‘other’ particles is determined by difference. Thevalue of the regression coefficients is reasonably consistent through 1996, 1997and 1998.
Figure 1 shows the annual mean PM10 concentrations at London Bloomsbury in
1996, 1997 and 1998, apportioned into primary, secondary and ‘other’ contribu-tions. Measured PM
10 concentrations decreased from 30.3 µgm-3 to 22.7 µgm-3
during the period. The measured fall in particulate sulphate is reflected in the fallin the modelled secondary contribution. The primary contribution is highest in1997.
It could be suggested that particulate sulphate is becoming a poorer indicator ofsecondary PM
10 during this period due to the decline in primary combustion
emissions and concentrations of secondary particles. As these concentrationsdecline the proportion of variance in daily mean PM
10 concentrations that is

EMEP/CCC-Report 9/2000
187
unexplained by the model is increasing. It is important to note that sulphates donot necessarily make a dominant contribution to secondary PM
10 in comparison to
nitrates. The relative proportions of sulphate and nitrate will depend on theemissions and atmospheric chemistry that takes place in air mass. We are forcedto focus on using sulphate as an indicator because of the scarcity of nitratemonitoring sites. The effectiveness of this indicator is dependent on the degree towhich sulphate and nitrate concentrations vary in the same manner.
Figure 1: Estimated contributions to annual mean PM10 at London Bloomsbury in1996-98.
Figure 2 shows the daily mean PM10 concentrations at London Bloomsbury in
1998, apportioned into primary, secondary and ‘other’ contributions, and themeasured coarse particle concentration (PM
10 concentration - PM
2.5 concentration).
One of the key uncertainties within the receptor modelling method is theassignment of the residual PM
10, remaining after the assignment of primary
combustion and secondary particle contributions, to the ‘other’ particle fraction.An examination of the difference between measured PM
10 and PM
2.5 concentrations
enabled us to confirm our assignment of the bulk of this residual to coarseparticles of diameter in the range from 2.5 to 10 µm. The modelled coarse particleconcentration varies in the same way as the measured concentrations. There isreasonable correlation between the measured and modelled coarse concentrations,although the modelled value consistently overestimates. This is to be expectedsince any particles whose concentration does not vary in the same way as eitherNO
x or particulate sulphate is included in the ‘other’ contribution. For 1998 data,
the measured annual mean coarse concentration was 7.1 µgm-3 and the modelledannual mean ‘other’ concentration was 9.3 µgm-3. The correlation coefficient r2
was 0.41.

EMEP/CCC-Report 9/2000
188
Figure 2: Estimated contributions to daily PM10 and the daily measured coarseconcentrations at London Bloomsbury in 1998.
Projecting PM10 concentrations in future years
By separating measured PM10 concentrations into their component parts in this
way, we can make relatively sophisticated estimates of both annual mean and highpercentile PM
10 concentrations for future years. We apply appropriate reductions to
concentrations based on an understanding of the likely impact of current policieson future levels.
Projections of the 90th percentile of the 24-hour mean are shown in Figure 3. TheStage 1 limit value can be approximated to be 50 µgm-3 as the 90th percentile of24-hour means. The European Union ‘Daughter Directive’ specifies that thestandard instruments for measuring PM
10 are the gravimetric instruments. An
appropriate scaling factor (1.3) has been applied to the measured and projectedconcentrations to adjust for the fact that TEOM instruments were used in thisstudy.
This statistic displays a large amount of year to year variability. The highestpredictions result from 1996 data and the lowest are based on 1998 data.Predictions based on 1997 and 1998 data suggest that the EU Daughter Directivetarget will be reached, but 1996 based projections predict it will be exceeded byaround 3µgm-3. Unusual meteorological conditions lead to significant episodes ofsecondary particles throughout the UK during the early part of 1996 (Stedman,1997).

EMEP/CCC-Report 9/2000
189
Figure 3: Projected and actual 90th percentile concentrations of PM10 at LondonBloomsbury.
The model also projects backwards to previous years. The measured values liewithin the range of projected concentrations in all years, but this range ofprojected concentrations is very large, spanning 18 µgm-3 in 2005.
Acknowledgements
This work was funded by the UK Department of the Environment, Transport andthe Regions in partnership with the Scottish Executive, The National Assemblyfor Wales and Department of the Environment for Northern Ireland as part of theirAir Quality Research Programme.
References
DETR et al. (1999) The Air Quality Strategy for England, Scotland, Wales and NorthernIreland, Department of the Environment, Transport and the Regions in partnershipwith the Scottish Executive, The National Assembly for Wales and Department of theEnvironment for Northern Ireland.
DoE et al. (1997), The United Kingdom National Air Quality Strategy, (1997)Department of the Environment in partnership with the Scottish Office, The WelshOffice and Department of the Environment for Northern Ireland.
Stedman, J.R. (1997) The secondary particle contribution to elevated PM10 concentrations
in the UK. AEA Technology, National Environmental Technology Centre. Report20008001/007. AEAT-2959.
Stedman, J.R., Linehan, E., Espenhahn, S., Conlan, B., Bush, A., Davies, T. (1998)Predicting PM
10 concentrations in the UK. AEA Technology, National Environmental
Technology Centre. AEAT-4630.

EMEP/CCC-Report 9/2000
190
UK Airborne Particles Expert Group (1999) Source Apportionment of AirborneParticulate Matter in the United Kingdom, Report for Department of theEnvironment, Transport and the Regions in partnership with the Scottish Office, TheWelsh Office and Department of the Environment for Northern Ireland.

EMEP/CCC-Report 9/2000
191
Number concentration and chemical composition of fine particlesmeasured at EMEP station Preila
by
V. Ulevic ius, D. Šopauskiene , G. Mordas, K. Z eromskiene ,S. Stapc inskaite
Institute of Physics, A.Goštauto 12, LT-2600 Vilnius, LithuaniaEnvironmental Physics and Chemistry Laboratory
The recently revised interest can be observed in the health effect of particulate airpollution in the urban and non-urban areas during last decade. General studieshave shown that short-term variation in levels of particulate air pollution areassociated with adverse respiratory health effects even on the low levels ofpollution observed currently in Western Europe. It may by that the adverse effectof pollution on public health is number, not mass concentration dependant. It hasbeen hypothesized that the high number of fine particles in air may be theexplanation of the observed health effects. Therefore, it is important to studyrelationship between number concentration and chemical composition of aerosolparticles.
The goal of this presentation is to study relationship between aerosol numberconcentration and mass concentration of major inorganic ions in fine particles in arural coastal station located in Preila.A newly developed virtual impactor with the cutoff size of 2.5 µm has beenemployed for the collection of aerosol particles classified into two size fractions.Air sampling was performed at the research station Preila situated on the CuronianSpit, which separates the Curonian Bay and the Baltic Sea. Two field measure-ment campaigns were carried out within the European BASYS project in summer1997 and in winter 1998. Aerosol samples collected onto the Whatman 40cellulose filters were extracted with 30 ml of deionized water. Concentrations ofanions (SO4
2-, NO3-, and Cl-) in aerosol water extracts were measured by means of
ionic chromatography with the conductivity detector. Meanwhile, spectrophoto-metric method was used for measurements of NH4
+ and flame photometry - forNa+. Commercial optical aerosol counter AZ-5 have been used for continuousaerosol (d > 0.4 µm) number concentration measurements.
Mass concentrations of major constituents found in fine particles and numberconcentration presented in Figures 1-2. The highest mass concentration of majorinorganic ions (14.8 µg/m3) and number concentration (39 cm-3) were measured inwinter season. Similar situation occurred with constituents of major ions. Lowestnumber concentration in both seasons was related with air mass back trajectoriesfrom northwest and highest - from south.
The correlation coefficient is highest between ammonium mass concentration andnumber concentration in winter season (R = 0.604). The lowest correlationcoefficient is calculated between nitrate mass concentration and numberconcentration in summer (R = 0.257). As can be seen from Figures 1-2 that

EMEP/CCC-Report 9/2000
192
sometimes course of mass concentration of major ions follows numberconcentration curve in a very similar way. However, on the other hand, sometimesseems that other constituents in fine particles are more important than major ions.The measured mass concentration of major ions and number concentration variedfrom 1.8 to 6.3 µg/m3, from 7 to 22 cm-3 in summer season and from 4.2 to14.8 µg/m3, from 7 to 39 cm-3 in winter season, respectively. The calculatedcorrelation coefficients are generally enough low (< 0.7). Nevertheless in someepisodes relationship between number and major inorganic ions concentrationscan be high and indirectly represent variation of mass concentration of fineparticles.

EMEP/CCC-Report 9/2000
193
Figure 1: Mass concentration of major inorganic ions in fine particles and numberconcentration measured in Preila at July 1997.
�����
�����
�����
�����
�����
�����
�����
�����
�����
�����
�����
�����
�����
�����
�����
�����
�����
�����
�����
�����
���
���
���
� ��
R=0.576
Time, day
�
�
1+�
�
���
���
���
���
R=0.257
�
�
�
12�
�
�
�
�
�R=0.389
�
�
�
62�
��
�
�
�
�
�
������������������
µ � ��
�
����������
µ ��
62�
��
�12�
�
�1+�
�
�1D�
�&O�
�
��
��
��
�
�
��
��
��
�
�
��
��
��
�
�
��
��
��R=0.415
���������������������
�
����������
µ��

EMEP/CCC-Report 9/2000
194
Figure 2: Mass concentration of major inorganic ions in fine particles and numberconcentration measured in Preila at February 1998.
�����
�����
�����
�����
�����
�����
�����
�����
�����
�����
�����
�����
�
�
�
�
�
R=0.604
Time, day
�
�
1+�
�
�
�
�
�
�
�
�
R=0.599
12�
�
�
�
�
�
�
�
�
� R=0.523
�
�
�
62�
��
�
�
��
��
�
������������������
µ ��
�
����������
µ��
62�
��
�12�
�
�1+�
�
�1D�
�&O�
�
��
��
��
�
�
��
��
��
�
�
��
��
��
�
�
��
��
��R=0.603
���������������������
�
����������
µ��

EMEP/CCC-Report 9/2000
195
Seasonal and diurnal variation of aerosol size distributions(10 < D <750 nm) at a high-alpine site (Jungfraujoch 3580 m asi)
by
E. Weingartner1, S. Nyeki1,2, S. Henning1 and U. Baltensperger1
1 Paul Scherrer Institute, CH-5232 Villigen-PSI, Switzerland2 Chemistry Dept., Univ. of Essex, Colchester 004 350, England
Introduction
Because of the importance of monitoring long-term trends of gaseous and aerosolparameters in the free troposphere, the high-alpine research station Jungfraujoch(JFJ, 3580 m asl), Switzerland, has been conducting measurements under theGlobal Atmosphere Watch (GAW) program. The following climatically importantaerosol parameters have been measured since July 1995 (Baltensperger et al.,1997; Nyeki et al., 1998; Weingartner et al., 1999): Total and backwards hemi-spheric scattering coefficients (σSP, σBSP; TSI 3563 IN), absorption coefficient (σAP;Magee AE-10), surface area concentration (S; PSI Instrument), condensationnuclei concentration (CN; TSI CNC 3010), and the cloud liquid-water content(LWC). In this work, results are presented from a 14-month campaign during theperiod March 1997 to May 1998 to measure the submicrometer number sizedistribution at the Sphinx Observatory at the JFJ.
Inlet Design
Owing to its exposed location on a mountain col, the JFJ experiences a highfrequency of clouds (annual average ~37%). Therefore, the main aerosol inlet wasdesigned to sample the interstitial aerosol as well as the activated droplets. Itconsists of a heated and insulated vertical stainless-steel tube (length: 200 cm;diameter: 6 cm) and a heated snow-hood. The temperature of the sampled air wasmeasured and electronically regulated to +20°C. Heating was necessary (1) toessentially dry all activated droplets as early as possible to reduce transmissionlosses and (2) to prevent riming of the inlet system during harsh conditions,especially in winter. The inlet was designed such that cloud droplets withD < 40 µm were sampled up to a wind speed of 20 m s-1. The relative humidity ofsampled air at the instrumental inlet was < 20% (laboratory temperature 22-23°C)throughout the campaign. Calculations for the above typical wind speeds anddroplet sizes showed that virtually all activated droplets were sampled.
Seasonal Variations
The SMPS data set is illustrated in Figure 1 in the form of a two-dimensionalcontour plot of dN/dlnD as a function of D and time for the whole measuringperiod. In addition, Figure 2 shows seasonal averages of the number distributionsduring the campaign and their bimodal parameterizations.

EMEP/CCC-Report 9/2000
196
Figure 1: Time history of dN/dlnD size spectra (24 -hour average) at the Jungfraujochin form of a contour plot. Data are not edited for cloudless conditions.
Figure 2: Measured size distributions averaged for the four seasons (points) andbimodal fits (lines).
Monthly averaged spectra were fitted with a bimodal size distribution and thefitparameters are shown in Table 1. The number concentration is observed to begoverned by the Aitken mode concentration, and is shifted toward smaller particlesizes during the colder months.
It is interesting that fitted modal diameters (DAit, DAcc) and standard deviations (σAit,σAcc) exhibit a low seasonality. The shape of the measured number size distributionis mainly determined by the number concentrations NAit and NAcc. These valuesexperience a strong seasonal variation which is more distinct for the accumulationmode. This variation of NAcc is mainly due to transport of planetary boundary layerair to the station and has an important influence on the seasonality of the surfacearea (as well as the volume) concentration in the submicrometer size range. Incontrast, particles with D < 20 nm exhibit an inverse seasonality (higherconcentration during winter). This feature is observed to result from a higher

EMEP/CCC-Report 9/2000
197
fraction of small particles that are produced by homogeneous nucleation duringthe colder seasons.
Table 1: Results of fitting monthly average dN/dlnD spectra for FT and “All”conditions, as the sum of two lognormal size distributions. Number concentrations indifferent size bins, average values (AVE), standard deviations (ST ERR), and theseasonality (SEA) are also presented. SEA is the ratio of summer to winter values. A SEA< 1 denotes higher values in winter than in summer.
Diurnal Variations
The diurnal variation of the SMPS spectra is illustrated in Figure 3 for four daysin summer and winter. During summer, planetary air masses arrive at the JFJ atabout noon, and the aerosol concentration reaches its highest value at about 1900hours. In winter, the JFJ is decoupled from the PBL which results in a smallerdiurnal variability. In winter a shift toward increased number concentrations forD < 40 nm is apparent and results from the increased formation of particles byhomogeneous nucleation.
During all seasons, nucleation mode particles (10 nm < D < 18 nm) are probablyformed by homogenous nucleation. This hypothesis is corroborated by the factthat the number concentration of particles in the size range D = 10–18 nm exhibitsa diurnal variation (see Figure 4), which is most probably due to photochemicalprocesses. During values of N10–N18 exhibit two distinct maxima that may beexplained as follows: The onset of solar radiation in the morning triggers thephotochemical production of new particles, for example, SO2 + OH → H2SO4. Ifthe pre-existing aerosol surface area concentration is low enough, homogeneousnucleation is favoured, and new particles are formed. These nucleation modeparticles are not detected until they grow into the “visible” size range of theinstruments. At noon, the precursor vapour gas reservoir is exhausted whichresults in lower production rates. Concentrations of N10–N18 then increase againdue to thermal convection which provides new precursor gases from the PBL. Thedecrease in new particle formation from 1500-1800 hours is most probably due to

EMEP/CCC-Report 9/2000
198
the increase in surface area and the decrease in solar radiation. In winter highernucleation mode concentrations are found. This may be due to the lower surfacearea concentration. In addition, the lower temperatures during winter may alsofavour the formation and growth of new particles.
Figure 3: Examples of the diurnal variation (30 min resolution) during 4 days insummer (top) and winter (bottom). Note that the colour concentration scalesare different in both graphs.
Figure 4: Average diurnal variations of the surface area concentration measured bythe SMPS (bold line with stars, right-hand scale) and numberconcentrations in different size bins (see legend, left-hand scale). Averagesolar radiation intensity measurements are also shown.

EMEP/CCC-Report 9/2000
199
The Influence of Clouds on the Size Distributions
SMPS data with a time resolution of 1 hour were classified into five differentLWC ranges and average measured number size distributions for different LWCare shown in Figures 5 for “All” conditions and the ET period 0300-0900 hours.The spectra exhibit a bimodal shape and were parameterized by the sum of twolognormal size distributions.
Figure 5: Average number size distributions for clear-sky and different liquid watercontents (LWC) during in-cloud conditions. Symbols and solid linesrepresent measurements and lognormal distribution fits, respectively.Measurements are presented for the period February to May 1998 inclusive.
It is found that the bimodality is more distinct during cloudy events which aremost probably due to preferential scavenging of the smallest particles by clouddroplets. Accumulation mode particles grow from DAcc = 120 nm under clear-skyconditions to DAcc ~137 nm under cloudy conditions which can be explained by theabsorption of trace gases onto cloud droplets. Aqueous phase reactions thenproduce additional aerosol material. Upon evaporation of the droplet, the residueis larger than the original CON on which the droplet was formed. The increase inDAcc is responsible for the separation in the size spectrum at the critical particlediameter that depends on the cloud supersaturation and the particle chemicalcomposition (Hoppel et al., 1990). This process is an important factor in shaping

EMEP/CCC-Report 9/2000
200
the background aerosol size distribution, as more than 90% of clouds re-evaporatewithout the formation of precipitation.
Acknowledgments: The financial support of the Swiss Meteorological Institute(Global Atmosphere Watch) and the Bundesamt für Bildung und Wissenschaft(BBW) is highly appreciated. In addition, we acknowledge the InternationalFoundation for the High Altitude Research Stations Jungfraujoch and Gornergrat(HFSJG) who made it possible for us to conduct research at the Jungfraujoch.
References
Baltensperger U., Gäggeler H.W., Jost D.T., Lugauer M., Schwikowski M., WeingartnerE., and Seibert P. (1997) Aerosol Climatology at the high-alpine site Jungfraujoch,Switzerland. J. Geophys. Res. D102, 19,707-19,715.
Hoppel W.A., Fitzgerald, J.W., Frick G.M., Larson R.E., and Mack E.J. (1990) Aerosolsize distributions and optical properties found in the marine boundary Iayer over theAtlantic Ocean. J. Geophys. Res. 95, 3659-3686.
Nyeki S., Baltensperger U., Colbeck I., Jost D.T., Weingartner E., and Gäggeler H.W.(1998) The Jungfraujoch high-alpine research station (3454 m) as a background cleancontinental site for the measurement of aerosol parameters. J. Geophys. Res. 103,6097-6107.
Weingartner E., Nyeki S., and Baltensperger U. (1999) Seasonal and diurnal variation ofaerosol size distributions (10 < D < 750 nm) at a high-alpine site (Jungfraujoch3580 m asl). J. Geophys. Res. in press.

EMEP/CCC-Report 9/2000
201
Measurements of Airborne Particle Mass, Number and SizeDistribution at Urban Sites in the United Kingdom
by
Jianxin Yin1, Roy M. Harrison1, David Mark1, Jeff Booker2,Steve Moorcroft2
1 Environmental Health (IPEH), University of Birmingham2 Stanger Science and Environment
Introduction
• Continuous measurements of airborne particulate mass, numbers and sizedistributions are being made at two sites in London, UK. Marylebone Road(LM), a kerbside site, is heavily polluted by frequently congested trafficwhereas London Bloomsbury (LB) is an urban background site situated withina central London garden, which is about 1.8 km away from Marylebone Road.
• Particle mass was measured as PM10 and PM2.5 (aerodynamic diameter equal orsmaller than 10 and 2.5 µm respectively) using TEOMs (Tapered ElementOscillating Microbalance). Particle number and number based size distributiondata were obtained from an SMPS system (a scanning mobility particleclassifier plus a condensation nucleus counter)
Aims
• Assessment of both particle mass and number concentrations at the twodifferent sites over different periods
• Investigation of the relationship between particle mass and numberconcentrations
• Determination of the size distribution of airborne particles measured at thesesites
• Comparison between an urban background and a roadside site

EMEP/CCC-Report 9/2000
202
Results (presented in the following figures)
Figure 1: Clear differences in the average concentrations of airborne particle massand numbers as well as the gaseous pollutants have been observed betweenthe Roadside (LM) and Urban Background (LB) site over the period from06/97 to 02/99 indicating that air pollution is heavily affected by roadtraffic. Particle numbers show a greater difference at the two sites.
Figure 2: Very high hourly concentrations of airborne particles were observed at bothsites. PM10 concentrations (µg m-3) were dominated mostly by fine particlesexcept on a few occasions when coarse particles contributed substantially toPM10 levels.
0
10
20
30
40
50
N o.C onc.(#/cm 3)x0.001
PM10(ug /m3)
PM2.5(ug /m3)
C oarse(ug /m3)
N Ox(ppb)x 0.1
C O(ppm ) x 10
LMLB
High hourly PM conce ntra tions on M a ryle bone Roa d
020406080
100120140160180
27/03/98
27/03/98
28/03/98
28/03/98
28/03/98
28/03/98
29/03/98
29/03/98
29/03/98
30/03/98
30/03/98
30/03/98
30/03/98
31/03/98
31/03/98
P M 2.5
P M 10
High hourly PM conce ntra tions on M a ryle bone Roa d
0
100
200
300
400
500
600
11/08/99
11/08/99
12/08/99
12/08/99
12/08/99
13/08/99
13/08/99
14/08/99
14/08/99
15/08/99
15/08/99
16/08/99
16/08/99
17/08/99
P M 2.5P M 10Coa rse
High hourly PM conce ntra tions a t London Bloom sbury
020406080
100120140160180
31/10/97
31/10/97
01/11/97
01/11/97
01/11/97
01/11/97
02/11/97
02/11/97
02/11/97
02/11/97
03/11/97
03/11/97
03/11/97
03/11/97
P M 2.5
P M 10
High hourly PM conce ntra tions a t London Bloom sbury
0
50100
150
200
250300
350
400
26/09/97
27/09/97
28/09/97
29/09/97
29/09/97
30/09/97
01/10/97
01/10/97
02/10/97
03/10/97
04/10/97
04/10/97
05/10/97
06/10/97
06/10/97
P M 2.5P M 10Coa rse

EMEP/CCC-Report 9/2000
203
Figure 3: High consistency of diurnal variation between particle mass and numberconcentrations and traffic related gaseous pollutants (NOx and CO) wasfound on Marylebone Road over the whole sampling period. The followingfigure shows the period of April and May in 1998, in which CO appeared tohave an additional peak in early evening when the others did not.
0
10000
20000
30000
40000
50000
60000
70000
80000
1 3 5 7 9 11 13 15 17 19 21 23
GMT (hour-ending)
Par
ticle
co
un
t / c
m3
0
50
100
150
200
250
300
350
400
450
PM
10, C
O a
nd
NO
x
No. conc. CO x 100 (ppm)NOx (ppb) PM10 x 10 (ug m-3)
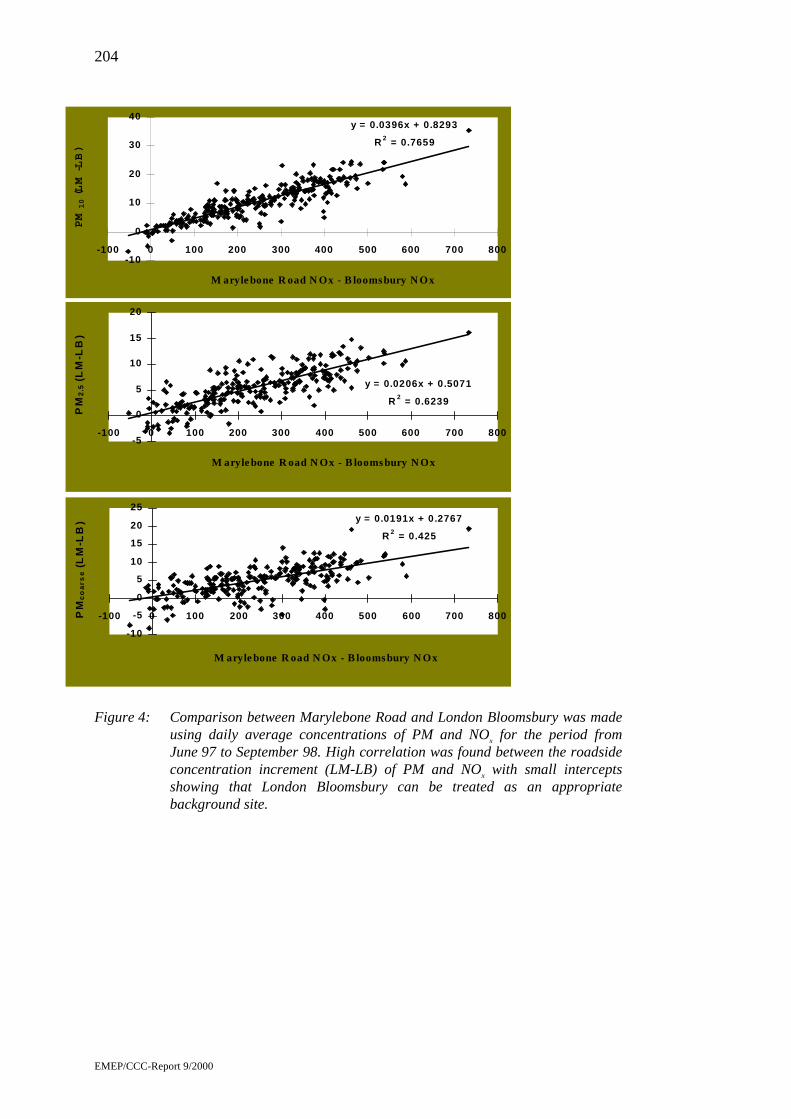
EMEP/CCC-Report 9/2000
204
Figure 4: Comparison between Marylebone Road and London Bloomsbury was madeusing daily average concentrations of PM and NOx for the period fromJune 97 to September 98. High correlation was found between the roadsideconcentration increment (LM-LB) of PM and NOx with small interceptsshowing that London Bloomsbury can be treated as an appropriatebackground site.
y = 0.0396x + 0.8293
R 2 = 0.7659
-10
0
10
20
30
40
-100 0 100 200 300 400 500 600 700 800
M aryle bone R oad N Ox - B loomsbury N Ox
PM
10 (LM-LB)
y = 0.0206x + 0.5071
R 2 = 0.6239
-5
0
5
10
15
20
-100 0 100 200 300 400 500 600 700 800
M aryle bone R oad N Ox - B loomsbury N Ox
PM
2.5
(L
M-L
B)
y = 0.0191x + 0.2767
R 2 = 0.425
-10
-5
0
5
10
15
20
25
-100 0 100 200 300 400 500 600 700 800
M aryle bone R oad N Ox - B loomsbury N Ox
PM
co
ars
e (
LM
-LB
)

EMEP/CCC-Report 9/2000
205
Figure 5: Strong correlation was also found between the incremental concentration ofparticle numbers and NOx over a summer period in 1998 demonstrating theimpact of vehicle exhaust emissions on particle number concentrations.
Figure 6: Comparison was made between the roadside enhancement of particlenumbers and PM10 mass for spring 1998.
y = 2.3691x + 25.795R2 = 0.5076
-10
30
70
110
150
190
-10 0 10 20 30 40 50
PM 10 / µg m 3 (LM - LB)
1000
s pa
rticl
es /
cm3
(LM
- LB
)
y = 0.1902x + 16.489R2 = 0.6886
-10
15
40
65
90
115
140
-100 0 100 200 300 400 500
N Ox (ppb) (LM - LB )
1000
s pa
rtic
les
/ cm
3 (LM
- LB
)

EMEP/CCC-Report 9/2000
206
Figure 7: The number size distribution of particles generated from road traffic hasbeen investigated and the average size mode is within the range from 20 to30 nm. The figure here shows a peak at about 30 nm, which is significantlysmaller than the typical particle size distribution mode around 100 nmreported from the engine test bed measurements.
Figure 8: The plot below illustrates the diurnal behaviour of particle size andnumbers on Marylebone Road. A morning peak appeared from 7 to 9 hourswhen the particle numbers reached up to 105 cm-3 with a size mode around25 nm. As in figure 3, an evening peak is not discernible.
Particle Number Size Distribution of Traffic Increment (March & April 99)
0
10000
20000
30000
40000
50000
60000
1 10 100 1000
Particle diameter (nm)
Nu
mb
er C
on
c. #
cm
-3 [d
N/d
log
(Dp
)]
(LM
- L
B)
1 2 3 4 5 6 7 8 9 1 0 1 1 1 2 1 3 1 4 1 5 1 6 1 7 1 8 1 9 2 0 2 1 2 2 2 3 2 4
G M T - h o u r en d in g
1 0 1
1 0 2
1 0 3
2
3
4
5
6789
2
3
4
5
6789
Pa
rtic
le D
iam
ete
r (n
m)
1 0 0 0 - 1 1 4 0 01 1 4 0 0 - 2 1 8 0 02 1 8 0 0 - 3 2 2 0 03 2 2 0 0 - 4 2 6 0 04 2 6 0 0 - 5 3 0 0 05 3 0 0 0 - 6 3 4 0 06 3 4 0 0 - 7 3 8 0 07 3 8 0 0 - 8 4 2 0 08 4 2 0 0 - 9 4 6 0 09 4 6 0 0 - 1 0 5 0 0 0
P art ic le Conc . (dN/ dlogDp)D iu rn al P lo t o f Part icle Siz e/N u m b er D ataM aryleb o n e R o ad , L o n d o n ; Ap ril an d M ay 1998

EMEP/CCC-Report 9/2000
207
Figure 9: Similar diurnal variation was observed in London Bloomsbury except alater and shorter morning rush-hour peak with lower particle numbers andbigger size mode around about 30 nm.
Conclusions
• Substantial differences in average concentrations of particles expressed asmass and numbers were found between a roadside and a background site incentral London.
• PM10 episodes were dominated mainly by fine particles. On a few occasionscoarse particles were the major contributor.
• Good correlation was found between particle mass and numbers at both sites,but particle numbers appear to give a better indication of vehicle exhaustemissions.
• High correlation of the roadside enhancement of particle mass and numberswith NOx was observed confirming the impact of road traffic on airborneparticles.
• Particles generated from vehicle exhaust are very small showing a number sizedistribution mode smaller than 30 nm, which is considerably smaller than themode of about 100 nm reported from some engine test bed studies.
1 2 3 4 5 6 7 8 9 10 11 12 13 14 15 16 17 18 19 20 21 22 23 24
GM T - hour ending
10 1
10 2
10 3
2
3
4
5
6789
2
3
4
5
6789
Par
ticl
e D
iam
eter
(n
m)
D iurnal Plot of Particle Size/Number DataLondon B loomsbury; April and M ay 1998
Part icle Conc. (dN/dlogDp)
500 - 27502750 - 50005000 - 72507250 - 95009500 -1175011750-1400014000-1625016250-1850018500-2075020750-23000