embracing water - a study on how cities have planned for ... · a study on how cities have planned...
TRANSCRIPT
EMBRACING WATER
A STUDY ON HOW CITIES HAVE PLANNED FOR FLOODS IN
THE PAST
SIRIPORN JULIE SOPHONPANICH SUBMITTED IN PARTIAL FULFILLMENT OF THE REQUIREMENTS FOR THE DEGREE MASTERS OF SCIENCE IN URBAN PLANNING GRADUATE SCHOOL OF ARCHITECTURE, PLANNING, AND PRESERVATION COLUMBIA UNIVERSITY MAY 2014

ABSTRACT
Every year, over one hundred million people are affected by floods. Flooding can come
in many different shapes and forms, such as storm surges, heavy rainfall, high tidal levels, and
river floods. There are numerous scientific researches on flooding and the different ways that
cities and city agencies have approached flooding. However, very little literature ties together
accounts of floods and urban planning. This thesis investigates the different ways cities have
planned for flood-prone disasters in the past.
In order to further analyze past planning efforts, three case studies were chosen to
represent vulnerable flood-prone cities. Rotterdam, New York City, and Bangkok were chosen
as case studies for this thesis for their long history of dealing with flood-related issues and their
current flood planning initiatives. Although the case studies chosen do not represent all types of
floods in every city around the world, they gave an example of how cities vulnerable to flood
have planned for disasters in the past. The analysis of the three case studies was structured to
provide context, conceptual framework, and discussion in relation to each other. The lessons
learned from these three case studies provided takeaways of good planning processes that can be
studied and implemented in a different country that is also facing flood-prone disasters.
Key words
Flood planning, disaster planning cycle, prevention, mitigation, adaptation, structural measures,
non-structural measures, resiliency

TABLE OF CONTENTS
1. ABSTRACT P.2
2. INTRODUCTION P.4
3. LETERATURE REVIEW P.6
4. METHODOLOGY P.14
5. CASE STUDY I: ROTTERDAM P.16
6. CASE STUDY II: NEW YORK CITY P.21
7. CASE STUDY III: BANGKOK P.27
8. CONCLUSION P.33
9. BIBLIOGRAPHY P.35
10. APPENDIX A: INTERVIEWS P.38
11. APPENDIX B: MAPS & IMAGES P.39

Julie Sophonpanich | 4
INTRODUCTION
Climate change, which has resulted in sea levels rising, more frequent storms, and
increasing precipitation, has recently caused more severe and frequent flood events. For
instance, in 2011, Bangkok and surrounding areas experienced flooding from rainwater
accumulation in the north that flowed down towards Bangkok (Figure 1). The following year,
New York City was devastated by Superstorm Sandy that swept the coast and caused storm
surges that damaged buildings and affected many lives. For these cities, flood planning has
resurfaced as an important issue that requires further examination. It is therefore important to
first learn what kinds of flood planning have been examined in the past in order and understand
how the cities were shaped to handle future floods.
Flood planning often takes place after a significant event has occurred. The planning
process aims to respond to the event and plan for other future events of the same or larger in
scale. The Netherlands has been a pioneer in flood planning and mitigation not only because a
vast portion of the country is below sea level, but also because it experienced a horrific flood
event in 1953. Since then, the country has undergone numerous research and development
projects, including the construction of sand dunes, dikes, dams, and stormwater drainage system.
The City of Rotterdam has been continuously working and improving on their flood prevention
plans for many decades as the majority of the city lies below sea level. The storm surge barrier
and the dunes, dikes, and pumps help to keep the city dry. At the most recent H209 event in
New York City, the Dutch expressed their concerns for the future of planning for the city as they
face global warming and rising sea levels. Although there exist flood resilient infrastructure, the
Dutch still continues to reinvent their strategies.
The purpose of this study is to investigate the ways that cities have planned for disasters
in the past. How have cities planned for flood-related disasters in the past? What kinds of
planning theories and models did flood-prone cities use to prevent, mitigate, and/or adapt floods?
How did planning strategies change over time? Because flooding is becoming a larger aspect in
climate change, it is essential to study past planning efforts in order to guide future flood-related
planning efforts.

Julie Sophonpanich | 5
This thesis will examine how cities around the world have planned for disasters in the
past through studying three case studies of flood-prone disasters. Because of the scope and
timeframe of this thesis, only three case studies were chosen to represent flood-prone cities. The
focus of this thesis will be on vulnerable cities located at or below current sea level, coastal
cities, and delta regions since these cities will have to start planning for the imminent sea level
change and the more frequent occurrences of flooding. Rotterdam, New York City, and
Bangkok were chosen as case studies for this thesis for their long history of dealing with flood-
related issues, their current flood planning initiatives, and their future flood prevention and flood
risk management plans.
The case studies will be examined in three stages: historical research through secondary
sources, site visits and fieldwork, and interviews with planning professionals and experts in the
area. The purpose of the interviews is meant to support and provide additional information to the
secondary sources research. The lessons learned from these three case studies will provide
takeaways of good planning processes that can be studied and implemented in different countries
that are also facing disasters related to flooding.

Julie Sophonpanich | 6
LITERATURE REVIEW
Defining terms
Climate change is an inevitable factor that affects flood prevention, mitigation, and
planning. In recent years, climate change has instigated more severe and unpredictable weather
patterns, which in turn caused large-scale urban disasters (Pizarro et al 2006). According to the
United Nations, more than 226 million people are affected by disasters each year. Of those
affected by disasters, 102 million people are affected every year by floods. There are numerous
accounts documenting scientific research on flooding and the different ways that cities and city
agencies have approached flooding. However, there has been very little literature that ties
together urban planning, disaster mitigation strategies, and climate change relating to flooding
(Pizarro et al 2006). Of the existing literature on planning for climate change and disasters, few
discuss the specificities in planning for flooding.
Before analyzing flood planning, it is important to understand the terminology used in
this field of study. Disaster refers to an event that occurs suddenly and causes catastrophic
results, bringing damage, loss, or destruction (Merriam Webster). There are many types of
disasters, both natural and manmade. Natural disasters include extreme weather, hurricanes,
fires, earthquakes, and floods. Natural disasters can be somewhat predicted before the actual
occurrence of the event, such as landfall projections, conditions that spawn hurricanes, drought
conditions, and extreme heat (Herzog 2007). Manmade disasters are often directly caused by
humans, and sometimes caused by the product of human invention and intervention. Such
disasters include explosions, cyber attacks, power service disruptions, and hazardous materials
leakage.
The purpose of planning for disasters, according to Richard Herzog, “is preparation to
curtail or diminish the effects of a future event” (Herzog 2007). Vulnerable groups are more
susceptible to and affected by disasters. Vulnerability to disasters means the degree of
incapability to which the subject can cope with the consequences of disasters. Vulnerability can
be measured by the sum of susceptibility, resilience, and resistance (Figure 2). In the case of
natural disasters, the term means the natural systems’ potential to be affected by climate change
(susceptibility), the ability to avoid perturbation (resistance), and the natural capacity to cope

Julie Sophonpanich | 7
with and respond to the effects of climate change (resilience) (Klein et al 1998). Resiliency can
also refer to the outcome of the adaptation; the power to return to its original form; or, the ability
to bounce back from a disaster (UNGRHS 2011).
There are different ways to approach disaster planning, whether it is from preventative
measures or mitigation measures. Preventative measures are steps taken to prevent disasters
from occurring or affecting altogether. These types of preventative measures are often
associated with the construction of structural barriers, such as, building dams to prevent water
from flowing through. Preventative measures are often taken before a disaster occurs. However,
many have argued that natural phenomenon “cannot be prevented, only mitigated against”
(Flemming 2002). It is therefore also important to plan mitigation strategies.
Mitigation refers to “measures, which can be taken [at any time] to minimize the
destructive and disruptive effects of hazards and thus lessen the magnitude of a disaster” (Loh
2005). Additionally, mitigation can be approached from two different ways: structural and non-
structural measures. Structural or physical measures are flood defenses or safe building designs;
while non-structural measures range from legislation to raising public awareness (Loh 2005).
Others believe that planning for disasters should incorporate both approaches, i.e. planning
responses should deal with mitigation and also contain factors of prevention (Pizarro et al 2006).
A third measure, adaptation, assumes that a disaster is inevitable or has already occurred.
The goal of adaptation is to “reduce the vulnerability of a system, group, or individual to the
adverse impacts of climate change” (UNGRHS 2011). While prevention deals with disaster
planning at its beginning stages and mitigation deals with all stages of planning, adaptation
measures deals with the aftermath of the disaster. These different disaster planning approaches
all point to the fact that there are many stages to disaster planning, which often occur in cycles.
The Cycle of Disaster Planning
Many disaster-planning theories follow the idea that disasters occur in a cyclical manner;
therefore, there is a continuous cycle or sequence to planning. In his book Planning for
Disaster: How Natural and Manmade Disasters Shape the Built Environment, William G.
Ramroth listed ten steps of disaster planning. In the first step, people build, even if experts have
previously warned about unsafe conditions. People then do not heed their advice, but continue to

Julie Sophonpanich | 8
build regardless. Then, disaster strikes and destroys lives and property. People affected by the
disaster have to either rebuild or move on. Then experts would go back to study the disaster,
learn lessons, and make recommendations for how to better plan and design for future disasters.
Unfortunately, only some of the most practical and politically palatable of the recommendations
become implemented. People then build according to new requirements. As a result, buildings,
cities, and structures are better built. Finally, the next disaster will test the effectiveness of the
plan.
Similarly, Richard Herzog believed that there is a sequence to dealing with disasters,
beginning with mitigation, planning, management, response, and finally, recovery (Herzog
2007). In his article, “A Model of Natural Disaster Administration: Naming and Framing Theory
and Reality,” Richard Herzog developed a model for natural disaster administration that bridges
the gap between planning theory and the reality of disasters themselves. His three main
categories for the process of natural disaster administration were: disaster planning/mitigation,
projected/actual reality, and disaster management/response.
During the planning stages of disaster administration, there are more opportunities for
theoretical impact in decision-making, where bottom-up participation is possible. For instance,
the potential victims’ needs can be assessed and planned for prior to the occurrence of the natural
disaster (Herzog 2007). Although many of the theories laid out are sound, they still face
challenges in real world situations. Some theories do not apply because they have little
relevance to disaster planning/mitigation or because the work of disaster planning/mitigation
does not match with the theory that should be guiding it (Herzog 2007). Furthermore, political
reality, such as budgeting and project funding, may restrict the plans from becoming a reality
(Herzog 2007).
In the second stage, it is possible to discern the types natural disaster realities into three
groups: worst, best, and probably case scenarios. These cases were categorized by comparing
the projected scenario to the actual reality of the situation. Theories can provide the framework
for planning in this phase, but they may not always go according to plan. Federal governments
have been criticized for being too slow and lacking communication. Capital interests also differ
between groups. For instance, the government goals to instigate flood protection regulations are
met with opposition by businesses that do not want to abide by these laws.

Julie Sophonpanich | 9
The final stage is the disaster management and response. In reality, when disaster strikes,
“management and response hierarchies become less malleable and more bureaucratic with top-
down approaches [because] during disaster response there is not time for the hierarchy to
fluctuate; it will have to be prescribed in the top-down fashion” (p.591, Herzog 2007). In other
words, it will be difficult to manage and respond to a disaster if the plans set by administrators
are not followed. For instance, people often behave and act differently when presented by
hyperreality through the media; thus making disaster management more difficult (Herzog 2007).
Herzog presented these three stages in a linear manner with a feedback loop that connects the
processes back to theory.
The disaster planning process can take place at any time. Similarly to Herzog, other
scholars (Loh 2005 / Kahan 2006 / Klijn 2013) have also broken down disaster planning process
into three main phases. These three categories can be simply organized and reworded as: pre-
disaster planning, planning during the disaster, and post-disaster planning. All three phases are
in a continuous cycle referred to as the cycle of disaster planning (Figure 3).
Pre-Disaster Planning
Planning for floods can also be treated in a similar cyclical manner, from pre-flood
planning to post-flood planning. The first phase of disaster planning occurs before a disaster
strikes. During this time, city officials and urban professionals must make plans before an event
threatens. This plan not only includes the preparation work about what to do when the next event
occurs, but also how to detect and defend when it does. Detection system should be
implemented as an ongoing information gathering system that provides warning of when and
where an event will take place (Kahan 2006). According to Klijn et al, this process includes
spatial planning, contingency plans, flood defense measures, insurance, and preparedness (Klijn
2013).
In the first phase, prevention and mitigation measures are often used to prepare for the
next event. According to Nassau County’s emergency plans, mitigation planning identifies
“community policies, action, and tools that can be implemented in the long-term to result in a
reduction of risk and potential for future losses before a disaster strikes” (Herzog 2007).
Julie Sophonpanich | 10
Planning During the Disaster
Once the event occurs, previous planning strategies and prompt responses can minimize
the effect of the floods. Planning for this phase includes weather forecasting and warning,
reservoir control, evacuation, and rescue (Klijn 2013). These steps must take place immediately
once the disaster has been detected.
Post-Disaster Planning
The final phase of the disaster planning cycle is post-disaster planning. According to
Klijn, once the disaster has passed, actions such as relief, clean up, reconstruction, and
regeneration must take place in order to return the city back to its original state (Klijn 2013).
During this phase, emergency response must be planned for “to minimize the impacts of a
disaster after it has occurred and entails the development of things such as evacuation plans,
hazardous material response and containment plans, and plans for the provision of basic
services" (Herzog 2007). Finally, the lessons learned from the disaster will be studied, analyzed,
and incorporated into plans for future disasters.
The post-disaster planning phase and the pre-disaster phase, however, often overlap. In
some instances, scholars treated these stages as a linear timeline with a feedback loop. However,
they are mainly represented as a continuous cycle. The time between consecutive disasters also
determine how people react to the next event. For instance, “when there is a long time between
the previous flood and the imminent one, memories fade, training and readiness can become lax,
and complacency among residents and public officials can set in” (Kahan 2006).
Scholars such as Ramroth treat disaster planning as a large category to describe different
types of disasters. Other scholars also argue that disaster planning, whether natural,
technological, or created by humans, should be treated with equal weight in order to be efficient,
reduce redundancy, and involve as many parties as possible (Quarantelli 1999). E.L. Quarantelli
believes that disaster policies for any type of disaster can reduce or weaken the negative effects
of disasters. Although many authors agreed that disaster planning occurs in a cyclical manner,
all disasters are different and should be treated differently. This questions the validity and reality
of the disaster planning cycles. Can the disaster planning cycle model be applied to all the case
studies? If not, what other models, theories, or strategies are best suited for different cities?

Julie Sophonpanich | 11
The previous studies on disaster planning give general theories on how to plan for
disasters, but have not been tested under real world circumstances. For instance, Pizzaro et al.
discusses climate change and gives a framework to ways in which planners should proceed to
plan for different types of disasters, including flooding. However, the theories were not proven
with follow up work. Additionally, there is a gap between the theories and specific case studies
on flood risk mitigation. Previous case studies on flood planning discuss mainly infrastructure or
the history of the infrastructure implemented for each city. These studies do not link planning
theory and process to the history of infrastructure and how these two subjects are closely
intertwined with one another.
Flooding as a Disaster
The types of flood depend on many elements, such as the location, topography, climate,
and season. Similarly to disasters, there are floods that naturally occur in nature and those that
were caused by obstruction of mankind. Naturally occurring floods can be caused by several
factors, including slow-rising rivers where the floodwater is generated by snowmelt during
warmer seasons, excessive rainfall, thunderstorms, flashfloods, storm surges, and high tidal
levels. Floods caused by mankind include dam failures and poor sewer systems that cause water
to back up and flood the surrounding areas (Messner 2007).
Many cities, especially coastal and low-lying cities have to look toward new ways to
incorporate flood planning in order to protect the social and physical aspects of the city. All
urban floods can be attributed to human interventions (Figure 4). For instance, when humans
begin to develop in urban areas, the surface area to absorb excess water has been reduced,
causing more water run-offs that cannot be discharged into the natural rivers and streams. Thus,
water remains static at the surface level. Additionally, flood-protection systems that prevent the
natural processes, such as dams and pumping systems, can change the pattern of water flow
dramatically.
The change in climate can also be attributed to global warming, a phenomenon in the
twenty-first century that has exceeded the natural variability from the past century (Pizarro et al
2006). The Intergovernmental Panel on Climate Change (IPCC) forecasted 1.8 degrees Celsius
to 4.0 degrees Celsius warming by 2100 (UNGRHS 2011). Warmer temperatures have been

Julie Sophonpanich | 12
thawing land, especially land made of ice sheets, and depositing fresh water in the ocean, causing
the sea level to rise (Pizarro et al 2006). Sea level rising is one of the many factors contributing
to flooding.
According to Frans Klijn et al, the risk of flooding is caused by the combination of flood
hazard and vulnerability or the flood probability and flood damage (Figure 5). Flood risk was
described as “an evaluation of the combination of the probability of flooding and the adverse
consequences that ensues” (Klijn et al 2004).
Conceptual Framework
There are many planning framework associated with flood-related disaster planning, such
as the prevention/mitigation/adaptation models, structural and non-structural measures, and the
disaster planning cycle. The types of planning that have been associated with these concepts are
rational planning, trial and error planning, and top-down and bottom-up planning. Ramroth
describes trial and error planning as a way of planning where the theory is researched and
implemented, then it is tested under real world situations, and finally the plan will be adjusted
according to its effectiveness (Ramroth 2007). In the case of flood related disaster planning, it
means that a plan or physical infrastructure can be researched and implemented, such as a levy or
a sand dune, and tested for its effectiveness. In this case, the effectiveness of the plan depends
on whether the plan accomplished its goals (Ramroth 2007).
In "Urban Planning and Policy Faces Climate Change," Pizzaro et al. centers the paper on
examining the planning knowledge in climate change and urban settlements with an aim to assist
planners in responding to climate change. They have categorized different types of climate
change related disasters and types of urban infrastructure into a matrix to illustrate current
approaches and planning policy guidelines. The current approaches to planning and climate
change for flood-related disasters, as described by Pizzaro et al, comprise of four categories:
residential, commercial, institutional, and open space.
For residential infrastructure, current plans include researching land use and tidal basin.
In commercial areas, building size and building footprints should be examined to understand
how the amount of surface contributes to runoff, which in turn leads to an increasing probability
of flooding. Open spaces have been treated with water sensitive design, incorporating studies of

Julie Sophonpanich | 13
old streambeds and basins for flood mitigation. This paper suggests that for flood and rising sea
level policy and research, planners should begin by studying land use and tidal basins
reclamation and for coastal communities, to study beach erosion and tidal changes. The goals
are to lessen flood damage via runoff by reducing building footprints and building size. Some
approaches include levee reconstruction, restoration of marsh areas, and community building
systems based on flood impacts.
Many scholars have studied disaster-planning theories and models over time. However,
there has been a gap between the theories presented and real world practices. Flood-planning
literature have been presented as theories and they do not translate into the real world. These
theoretical models lead to questioning whether the different types of disaster-planning
frameworks are appropriate for all cities around the world? If the frameworks do not fit, what
other models should they use? How do the topography, economic, politics of each city play a
role in the types of model? These questions will provide a basis of study for how cities have
planned for flood-related disasters in the past.

Julie Sophonpanich | 14
METHODOLOGY
This thesis focused on three types of flood-prone disasters that have been categorized by
Messner in the Flood Site's January 2007 report. According to this report, there are six types of
flood, four are caused by natural processes and two occur due to human interferences. The case
studies represent cities affected by naturally occurring floods because of their location in low-
lying and coastal areas. Because of global warming and the rise in sea levels, the focus of this
thesis was on the cities that are located at about or below current sea level since these cities will
have to start planning for the imminent sea level change and the more frequent occurrences of
flooding. Bangkok, New York City and Rotterdam were chosen as case studies for this thesis for
their long history of dealing with flood issues and their future flood prevention plans and flood
risk management plans.
The goal of this thesis was to study how cities across the world have planned for disasters
in the past. However, only three case studies were chosen to represent vulnerable flood-prone
cities because of the time frame for this study. Only three case studies were chosen in order to
further analyze the flood planning process. These cities are vulnerable to floods not only
because of their climate and topography, but also because of their recent flood planning issues
and initiatives. The three case studies presented do not represent all the different types of floods
nor do they represent how every single city in the world planned for flood-related disasters.
There are also other cities that are vulnerable to floods for other reasons, such as, cities located
on islands that are vulnerable to tidal levels, but were not included in this work. Additionally,
the scope of the work does not include every past planning effort for flood planning.
Although the case studies chosen do not represent all types of floods or the ideal
typologies as classified by Messner, they gave an example of how cities vulnerable to flood have
planned for disasters in the past. The analysis of the three case studies was structured to provide
context, conceptual framework, and discussion in relation to each other. The context will
include population, topography, economics, and politics. Then, the causes for flooding in
different regions was examined, followed by the history of floods in different cities and the
planning process related to the event. The past planning efforts were discussed through the lens
of conceptual framework as discussed in the literature review. The case studies was viewed
through the lens of the disaster planning cycles: pre-disaster planning, planning during a disaster,
Julie Sophonpanich | 15
and post-disaster planning. Finally, the case studies were compared to each other in discussing
how different cities dealt with floods in the past. The lessons learned from these three case
studies provided takeaways of good planning processes that can be studied and implemented in a
different country that is also facing flood-prone disasters.
The three case studies was researched in three different stages:
Historical Research
The history of major floods was examined in the three case studies. Planning process was
synthesized and analyzed through readings of past flood prevention plans, such as planning
documents, urban design projects, and implementation reports. Other sources of information
included secondary data from books, journal articles, and news articles.
Site Visits
There were three site visits conducted for each of the three case study cities. Photographic
inventory was taken of flood prevention planning efforts and other urban design strategies
implemented.
Interviews
The last part of this thesis was to conduct interviews with planning professionals and experts on
this subject, such as professors, researchers, city government personnel, and/or engineers. The
sample size was six, roughly two interviews for each city. The purpose of these interviews was
to support and provide additional information to the secondary source research. Interview
questions helped to further understand how cities planned for flood-prone disasters.

Julie Sophonpanich | 16
CASE STUDY I: ROTTERDAM
Rotterdam is a port city in the southwestern region of the Netherlands in the Dutch
province of South-Holland. Rotterdam has approximately 617,000 inhabitants residing in 320
square kilometers (123 square miles). The city is located within a Delta region, along both sides
of New Maas, a distributary stream that branches off from the Rhine River and opens up into the
North Sea (Figure 6). At the mouth of the river is Nieuwe Waterweg (New Water Way), a canal
that connects New Maas to the sea, which was made possible by digging out vast dunes to create
an opening to the North Sea. The canal was constructed to allow larger ships to pass through to
the Port of Rotterdam (Deltawerken 2004). The Port of Rotterdam was considered to be the
world’s busiest port from 1962 to 1986; and today, it is the third busiest port with an annual 400
million tons of cargo and 70,000 people employed (Deltawerken 2004). Rotterdam’s
advantageous central location in Europe, near the North Sea, bodes well for trading and the city’s
overall economy, but it also makes the city vulnerable to floods.
Since approximately one third of the country is below sea level, the Netherlands has had
a long history of dealing with water. The name “Netherlands” stems from the term “Nether”
which means “low,” thereby, the Netherlands literally means “the Low Countries” (Deltawerken
2004). The coastal region of the Netherlands can become flooded from northwestern storms that
cause strong wind stirring up waves, storm surges, and high water levels (Deltawerken 2004).
Regional floods can occur due to high water levels that burst the banks of streams, lakes, and
waterways (Rijkswaterstaat 2011).
From the first to fifth century, inhabitants within the region began managing water
through the cultivation of waterlogged peat areas by draining and soil improvements (Borger
1998). This meant that in order to people to live and work on that land, they had to drain it
themselves by digging a ditch, building a dam, or constructing a dike (Rijkswaterstaat 2011).
From the sixth century to the tenth century, people began to reclaim land, which meant more
draining of water and soil improvement, as well as lowered the soil surface (Borger 1998).
During the eleventh century, a natural physical change occurred where sand was redistributed
along the western coast (van Koningsveld et al 2008). In the early thirteenth century, inhabitants
began building homes along these natural levees and other natural high grounds (Klijn 2004).

Julie Sophonpanich | 17
The City of Rotterdam emerged from a small fishing settlement that grew up around a dam built
across from River Rotter in 1270 (Rotterdam.info).
In the thirteenth century, people began building small clay dikes in order to protect their
dwellings from inundation (Colijn 1998). The construction of the dikes and later, the dike-rings
and drainage systems, were initiated by the local people and managed by landowners (van
Koningsveld et al 2008). Following this initiative, local water boards were born. The water
boards began as local governmental bodies that regulate water management, including the
inspection and maintenance of hydraulic works, (van Koningsveld et al 2008). Originally, water
management was folded into the local government, but the tasks associated with water
management proved to be too technical and specialized within the existing government’s
framework (Borger 1998). By the fourteenth century, the water boards developed into larger,
regional organizations (Borger 1998). In 1850, there were approximately 3,500 water boards.
Today, water boards still exist as a specialized political organization that is separated from but
equal to the municipalities (Borger 1998). Water boards are responsible for local and regional
water management in the Netherlands, including flood control, water quality, and urban
wastewater quality and treatment (Waterschap Groot Salland). Additionally, water boards attend
to the managements of dikes and local and regional water systems (Borger 1998). By 2011,
there were 26 water boards (Rijkswaterstaat 2011).
The Netherlands has two water authorities: the water boards and the State as authority for
the main waterways (Rijkswaterstaat 2011). The parliament established a central organization
for water management on a national on March 27, 1798. The “Agency for Public Works and
Water Management,” or Rijkswaterstaat, is the implementing agency for the Ministry of
Infrastructure and Environment with responsibilities over the national road network, the national
waterways network, and the water system (Rijkswaterstaat 2011).
The polder system was introduced in the Netherlands during the fifteenth century. The
system consisted of a closed pattern of dikes (dike-rings) that encompasses an area in order to
separate the water body within the surrounded area from water outside, using windmills to pump
out water from within the polder system (Borger 1998). From this point onward, many
communities began adopting the polder system as a protective measure for floods. The desire to
increase productive agricultural land area also drove people to build larger scale dike-rings, with
Julie Sophonpanich | 18
bigger wind mills, better pump systems, and better integration of drainage (van Koningsveld et al
2008). Technological innovations began to take place in the process of building bigger and
better systems.
New technologies and economic development also led to more developments and human
interventions to control water for their own purposes. The nineteenth and twentieth centuries
document the period of large-scale projects for flood prevention because of the increasing urban
developments and climate change. In 1929, the Rijkswaterstaat studied the “service of rivers,
sea arms and coasts” with the notion to encourage shipping traffic and water turning capacities of
the dikes (Deltawerken 2004). In 1934, another research study pointed the dangers and
consequences of low dikes along the rivers. By 1935, 120 kilometers (approximately 75 miles)
of dikes were raised by building a few centimeters of concrete walls. Rotterdam relies very
heavily on structural measures and technology to prevent and mitigate floods.
Present day Rotterdam is considered a relatively new city (Figure 7). During the Second
World War, on May 14th, 1940, the city was bombarded by an attack that destroyed the entire
city. After the war ended in 1945, the city started the reconstruction program (Rotterdam.info).
A few years after the city began reconstruction, another catastrophic event occurred: the 1953
flood. During the middle of the night on January 31st 1953, a North Sea storm overwhelmed the
southwestern region of the Netherlands (Kahan 2006). The combination of strong winds that
whipped water up to 3.1 meters (approximately 10 feet) and high spring tide, caused the water
level to reach its record high at 4.55 meters (approximately 15 feet) above the Normal
Amsterdam Water Level (Deltawerken 2011).
The storm surge of 1953 was catastrophic; it took the lives of 1835 persons, it drowned
livestock, and it destroyed 165,000 hectares of land (van Koningsveld et al 2008). Agricultural
land was also flooded with salt water, which not only destroyed the crops, but also left long-term
damage on the land for future agricultural purposes. The damage accounted for up to 20% of the
Dutch Gross National Product (Colijn 1998). Thus, the Deltacommission was founded in 1953
with two main goals: (1) to train the areas that frequently flood during high water levels and
protect them from the water and (2) protect the land from getting brackish (Deltaworken 2004).
The purpose of the Delta Project as described in the 1958 Delta Act was to reinforce the
protection against new floods (Colijn 1998). The first phase of the project began with extensive
Julie Sophonpanich | 19
research on the feasibility of the plans. Since the Deltaworks had to be completed in several
stages, the Rijkswaterstaat chose a logical order: “from small to large and from simple to
complicated” (Deltawerken 2004).
The Delta Works is a preventative structural measure with an aim to prevent storm surges
and floods from affecting the nation. The aim of preventing floods almost eliminates the disaster
planning cycle framework. However, because many areas of the Netherlands and some parts of
Rotterdam are below sea level, flooding is an inevitable issue. Before a disaster strikes, the city
continues to monitor the weather patterns, test the effectiveness of the storm surge barrier, and
keeping the inhabitants informed on flood related issues. During the flood event, storm centers
continuously inform the public on its development. Finally, once the event has passed, the
engineers, professionals, and researchers will study the storm and the effectiveness of the plans.
The Delta Works project was significant because of its large-scale structural measures. Some
improvements include the agricultural freshwater improved, the water balance of the Delta area
was improved, and traffic between the many islands and peninsulas was established
(Deltewerken 2004).
Up until 1942, the Port of Rotterdam was the largest port in the world (interview 4);
today, the port is the third largest after Shanghai and Singapore (Deltawerken 2004).
Constructing a dam at the mouth the Nieuwe Waterweg and cutting the Port of Rotterdam off
from the North Sea was not an option for urban professionals at the time because it was the city’s
largest business. In order to preserve the economy of the Port of Rotterdam, the Nieuwe
Waterweg cannot be closed off to ships and vessels. Additionally, it was also not feasible to
continue to build up the dikes along the river because many residents had established homes
along the river and building and reinforcing dikes meant that these people had to be displaced
(Interview 4). Finally, price and time to construct the dam were also factors that the water
boards had to keep in mind. In the end, the city proposed a design competition for a storm surge
barrier that would allow for the ships to enter in and out of the port as well as protect the city
from future northeastern storms that threatens the city. The storm surge barrier was the final
rational way of coming to a solution that preserved the economy of the city, maintained the
livelihood of the residents, and conserved time and money. The storm surge barrier competition

Julie Sophonpanich | 20
had six design submissions. The design of the Building Combination Maeslant Barrier was
chosen for its innovative design that does not change the existing landscape.
The Maeslant Storm Surge Barrier, also known as Maeslantkering, was completed in
1997 as the last portion of the Delta Works (Figure 8). The Barrier protects about one million
people in the South-Holland province from storm surges. The entire six-year project cost 635
million Euros, 150 million Euros and 10 years less than reinforcing and raising dikes within the
area (Deltawerken 2004). Because of Rotterdam’s inventive storm surge barrier design, many
visitors, professionals, and students alike have travelled to the Dutch coast to study the
Deltaworks projects. The Dutch also shared their studies with other flood-prone countries, such
as the United States. An example of this information exchange is during the H2O9 conference in
New York City.
The Netherlands’ and Rotterdam’s highly structured political systems and the emphasis
on water management have helped the city deal with floods in an organized fashion.
Additionally, the unique Rijkswaterstaat and water boards system spans both regional and local
authority, allowing them full control of water management in the Delta region. Having total
control means more specialized work and attention to the most important aspect of water
management and flood planning. Rotterdam’s expertise in planning can influence other cities.
The water boards system, though effective in Rotterdam, may not be applicable in other cities
because of the different political structure.
The Netherlands has been learning how to live with water and the notion that sea-level is
on the constant rise for many years. Today, the city is equipped with newer technologies and
innovations that can detect natural disasters, such as storms, high sea levels, and potential floods,
prior to its occurrence. It can be said that “after a thousand years of adaptation and another
thousand years of protection strategies, the Netherlands would now adopt a more integrated
approach” p. 374 (van Koningsveld et al 2008). In other words, the policy cycles can be seen
shifting from large-scale planning interventions to adopting integrated planning theory.
Julie Sophonpanich | 21
CASE STUDY II: NEW YORK CITY
New York City, with population of 8.18 million in 2010 and land area of 305 square
miles (NYC DCP), is sixth densest city in the United States (US Census 2010). The city is
located on the northeastern coast of the United States. The city is made up of five counties also
known by their borough names: Bronx county (Bronx), Kings county (Staten Island), New York
county (Manhattan), Queens county (Queens), and Richmond county (Brooklyn) (Figure 9). The
city is located at the mouth of the Hudson River that flows out towards the New York / New
Jersey Bight, which opens out into the Atlantic Ocean. Other rivers in the region are the Bronx
River, East River, and Harlem River. With 520 miles of waterfront, different areas within the
city face its own problems with flood risk (OEM 2014).
There are four types of floods that occur in the city according to the “New York City
Hazard Mitigation Plan 2014,” a publication by the Department of City Planning and the Office
of Emergency Management. The first type, coastal floods, occurs in areas along the ocean,
rivers, and estuaries of tidal influence. This type of floods is commonly caused by low-pressure
storms with high wind speed that pushes water level up and causes a storm surge. The second
type of flood is tidal flooding, which brought on by fluctuating sea levels. During a high tide,
low-lying neighborhoods of New York City are extremely vulnerable to flooding. The third type
is riverine flooding, which occurs when water freshwater rivers and streams overflow.
Prolonged raining within the region often causes this type of flooding. Lastly, inland flooding,
also commonly known as “flash floods,” is caused by short-term heavy rainfall, often associated
with thunderstorms, hurricanes, or other large-scale storms.
New York City has dealt with many flood events in the past. In 1821, Lower Manhattan
experienced a storm surge of 13 feet with high winds at 75 miles per hour (SIRR 2013). In 1938,
the Long Island Express storm, named for its speed and path over Long Island, hit without a
warning, claimed over 600 lives (10 in New York City), and took out electricity north of 59th
Street in Manhattan (SIRR 2013). In 1960, Hurricane Donna’s 90 miles per hour wind speed and
10-foot storm surge above the mean lower low water extensively damaged New York City’s
piers. For two decades, from the August 1993 to June 2013, 90 flood occurrences were
documented; of which 80% were inland floods. Inland floods often “strike with little or no
warming and are unrelated to the 100-year floodplain designation” (OEM 2014).
Julie Sophonpanich | 22
Disaster planning in New York City occurs in a cyclical manner. According to the
Hazard Mitigation Plan, there are four phases of emergency management: mitigation,
preparedness, response, and recovery (OEM 2014). In this case, preparedness refers to the
preparation work before a disaster occurs, or pre-disaster planning. Response is the plan set
forth during the disaster. Recovery is the carried out action of post-disaster planning. As
discussed in the literature review, mitigation can occur at any stage of disaster planning: before a
disaster occurs; during an emergency; or after disaster, during recovery or reconstruction (Loh
2005). The most effective plan is “based on an inclusive, comprehensive, long-term plan that is
developed before a disaster actually occurs, [since] careful planning and collaboration among
public agencies, stakeholders, and citizens can minimize losses” (OEM 2014).
Planning for disasters in the United States has been a relatively recent field of study. The
government system is set up in a way to promote pre-disaster planning as “a condition of
receiving financial assistance under the Robert T. Stafford Act (OEM 2014). The federal
government enacted Disaster Mitigation Act 2000, a legislation encouraging, promoting, and
emphasizing the importance of planning for disasters before they occur. For New York City, the
Federal Emergency Management Agency released the Flood Insurance Rate Maps (FIRMs) in
1983, providing information on flood zones.
The World Trade Center terrorist attack on September 11, 2001, was a catalyst for the
city agencies to look at emergency planning from a different perspective (Interview 6).
Although this event was a man-made disaster, it still speaks to the lack of a large-scale
emergency plans for the city. Prior to this event, New York City did not have this type of
comprehensive disaster planning. The City’s plans for disasters did not come into fruition until
after the Bloomberg administration (Interview 6). In 2007, five years after Michael Bloomberg
became New York City’s Mayor, the “PlaNYC: A Greener, Greater New York” was developed
and launched by the New York City’s Mayor’s Office of Long-Term Planning and
Sustainability. The implementation guidelines hold the different agencies accountable for their
share of adapting to climate change. Although the public and the different community
stakeholders did not have a voice in the document, the plan was created for the benefit of the
city’s current and future inhabitants. According to the plan, “growing New York is, in itself, a
climate change strategy” (PlaNYC 2007).

Julie Sophonpanich | 23
PlaNYC deals with the city’s three main challenges: population growth, aging
infrastructure, and the increasingly precarious environment. The plan aimed to prepare the city
for an additional one million inhabitants, strengthen the economy, fight climate change, and
enhance the quality of life for all New Yorkers (PlaNYC 2007). PlaNYC’s goal to incorporate
climate change in the plan is to “increase the resilience of our communities, natural systems, and
infrastructure to climate risks” (PlaNYC 2007). Climate change became the theme throughout
PlaNYC, with climate change adaptation measures and implementation strategies embedded into
other chapters of the plan. For instance, the open space chapter in the Land section of the plan
proposes to plant more trees, enhance existing open spaces, and develop new spaces so that all
New Yorkers will be able to live within a 10-minute walk from a park. This strategy not only
provides more green space for New Yorkers, but it also speaks to the climate change issues
within the city. New York City produces 58.3 million metric tons of greenhouse gases (PlaNYC
2007). Planting more trees in the city will help to absorb additional greenhouse gases and excess
surface water. This plan promotes sustainability and resiliency for all communities.
PlaNYC, however, only provided plans for adaptation, which assumes that climate
change is inevitable and the city will only deal with the effects of climate change. Within a
disaster planning cycle framework, adaptation speaks to the planning process to ensure New
York City becomes a resilient city; that is, to have the ability to withstand disasters and recover
quickly (FEMA). Although PlaNYC only provided adaptation measures for disaster planning,
mitigation measures were also taken. For instance, planting more trees will help to reduce
greenhouse gas emissions and thus overall reducing the impacts of global warming.
Recent storm event brings back the conversation of disaster planning in New York City.
In 2011, Hurricane Irene made landfall as a local tropical storm in New York City, resulting in
both coastal and tidal flooding. Most recently, Superstorm Sandy made landfall along the
eastern coast of the United States on October 26, 2012 and caused high winds, wave action, and
storm surges that took 44 lives, countless injuries, and inflicted an estimate of $19 billion in
damages (OEM 2014). A total of 51 square miles, or 17% of New York City’s land mass, were
flooded (OEM 2014).
Superstorm Sandy was a unique storm because it was a combination of two storms that
changed its trajectory and landed on the coast of New Jersey and New York (Figure 10). Some
Julie Sophonpanich | 24
sources, such as the Federal Emergency Management Agency (FEMA) refer to Superstorm
Sandy as Hurricane Sandy because for most of its life, Sandy was a category 3 storm. This
meant that it had wind speed ranging from 111 to 130 that can cause significant damage to
property, humans, and animals (Coastal Living). In addition to high wind speed, the storm can
also cause inland flooding and utility disruptions. As the storm was tracked, the government
agencies have been making and implementing plans, including preparing those living in
evacuation zone A to be ready to move.
After the storm, different government agencies deployed their efforts to deal with the
aftermath of the storm. In the United States, there are four levels of emergency and disaster
management. On the federal level, there is the Federal Emergency Management Agency
(FEMA), a fraction of the U.S. Department of Homeland Security (DHS), which started the
Hazard Mitigation Grant Program (HMGP). On the state level, New York Rising was introduced
to provide information and support for those affected by the storm. Finally, on the city or local
level is the Office of Emergency Management. Another local level program is the Community
Development Block Grant Disaster Recovery Program (CDBG-DR) or otherwise known as the
“Build it Back” program. At the same time, President Obama’s Hurrican Sandy Rebuilding Task
Force and the United States Department of Housing and Urban Development (HUD) initiated
“Rebuild by Design,” a design competition that “aims to identify the unique structural and
environmental vulnerabilities Hurricane Sandy exposed in communities throughout the region,
and to develop fundable solutions to protect residents against future climate-related events”
(MAS 2014).
In addition to post-disaster programs, many research reports were published in response
to Superstorm Sandy. The City released “A Stronger, More Resilient New York” plan in 2013, a
comprehensive plan that was developed as part of the Special Initiative for Rebuilding and
Resiliency (SIRR). This plan includes actionable recommendations for rebuilding communities
affected by Superstorm Sandy and increasing resiliency of the physical city. The report, also
known as the SIRR report, outlined a coastal protection strategy, ways in which infrastructure
and buildings citywide can become more resilient. The plan also includes recommendations and
action plans for communities impacted by Superstorm Sandy. This strategy includes increasing
Julie Sophonpanich | 25
coastal edge elevations, minimizing upland wave zones, protecting against storm surge, and
improving coastal design and governance.
Disaster planning in New York City can be viewed through the parks and open space
initiatives. Recently, more and more projects have new requirements to deal with flood. For
instance, the Department of City Planning introduced a new zoning requirement. Battery Park
and Brooklyn Bridge are two examples of the lasting benefits of flood proof infrastructure.
Battery Park is located at the southern most tip of Manhattan. Super Storm destroyed Battery
Park while Brooklyn Bridge Park faired well after the storm. Brooklyn Bridge Park is located on
the Western coast of Brooklyn along the East River. The reason being that the Brooklyn Bridge
Park was planned to be flooded (Interview 6). The park designs were sustainable, rustic, and
incorporated many storm water basins. It was essentially designed as a sponge to absorb water.
Other new developments, such as Battery Park City, faired well during the storm. The
neighborhood was built on land fill amalgamated by rubble from the World Trade Center.
Although many landfill areas proved to be very vulnerable during the Superstorm Sandy, Battery
Park City was an exception to this rule, “escaped the storm with almost no building damage”
(SIRR 2013). Although Battery Park City was developed before FEMA’s 1983 Flood Insurance
Rate Maps, the developments based the design on the then-existing flood hazard information
(SIRR 2013). The design extended the existing Manhattan street grid toward the waterfront that
also gently slopes downwards. Because Battery Park City was designed for residential and
commercial buildings, the waterfront edge did not have to be lowered to accommodate for
maritime activities; the current edge is approximately three feet higher than other bulkheads in
Lower Manhattan (SIRR 2013). The result of Battery Park City after Superstorm Sandy shows
that an integrative mitigation approach to flood planning can be successful.
Flood planning in New York City has many different levels of government involvement,
from the national level to the local level. Distinctive from Rotterdam, New York City has many
local level organizations, such as New York City’s Office of Emergency Management to plan for
disasters. New York City’s effective local level planning can be adopted in other cities where
there may be a need for local level flood planning. Although the Dutch water boards system
appears to be on a smaller scale, the political power span many different provinces. However,
both cities are similar in that there are multiple levels of government to provide resources before,

Julie Sophonpanich | 26
during, and after a disaster. New York City is currently in its early development stages for a
comprehensive flood planning and it is looking towards the future to protect the city.

Julie Sophonpanich | 27
CASE STUDY III: BANGKOK
Bangkok is a city 5.67 million people by 2011 with landmass of approximately 1570
square kilometers (or 606 square miles). The city is situated in Central Thailand’s Chao Phraya
River delta region, 25 kilometers (15.5 miles) from the Gulf of Thailand (Dolan 1986) (Figure
11). The topography of Thailand slopes down southward towards the Gulf; however, Bangkok
itself is relatively flat, with an elevation of only 1 to 1.5 meters (3 to 5 feet) above sea level. The
average natural ground level is 1 meter (3.28 feet) above mean sea level (Lawler et al 1972).
Because of Bangkok’s flatness, many existing infrastructures, such as the network of drains and
sewage systems, do not function adequately. They are often overwhelmed during a flood event.
Water often flows through three different paths into the Gulf of Thailand: the Jeen River, Bang
Pakong River, and Chao Phraya River. The Chao Phraya River basin can be categorized into
three smaller basins: the upper basin, the middle basin, and the lower basin (Molle 2007). The
Chao Phraya River originates from four rivers in Northern Thailand’s upper basin: Ping, Wang,
Yom, and Naan Rivers. The four larger rivers merge into a single river north of Bangkok and
drains out into the Gulf of Thailand.
Flooding in Bangkok has three different root causes: water from the north, high tidal
levels, and heavy rainfall within the region. First, continuous and heavy rainfall in the northern
region of Thailand results in an increased amount of rainwater that overwhelms the natural
system. Excess water, overflowed from the natural rivers, tries to drain out through Bangkok
into the Gulf of Thailand, causing floodwater to accumulate in Bangkok before flowing out.
Second, during high tides, water level rises and causes water in the rivers and canals to overflow.
Finally, Bangkok floods due to heavy rainfall within the region. Because Bangkok is constantly
becoming more developed, there is an increasing amount of water runoffs that is not absorbed
into the ground, and this causes surface level flooding. It is important for urban professionals to
take into account the history behind flooding in Bangkok and measures taken to mitigate
flooding when developing Bangkok’s Land Use Plans.
Bangkok was established in 1782 as a small quaint fishing village on the western bank of
the Chao Phraya River (Lawler and Cullivan 1972). According to Joseph Lawler and Donald
Cullivan, “throughout history, Bangkok has suffered flooding during every rainy season.” The
rainy season referred to represent the months of July through October. In flood-prone regions

Julie Sophonpanich | 28
such as Bangkok, “the question is not whether flooding will happen, but when it will happen
again” (Kahan 2006). In the past, floodwater that overflowed natural water paths would flow
through Thailand’s forests and agricultural lands, which helped to absorb and delay the flow of
the water (Roo Su Flood). In the beginning of the 1950’s, many of the canals in Bangkok were
filled in to make roads (Gray 2007). In more recent years, many new developments and man-
made infrastructure caused more runoffs and less water to be absorbed into the ground, leading
to an increased amount of water remaining on the surface level. This excess water has to be
managed by urban professionals through different types of measures.
Increased developments and human activity in Bangkok have increased flood risk with a
high probability of flooding. Bangkok’s land has been sinking up to 4 inches annually as water
has been pumped out of land for development (Gray 2007). As Bangkok is built on clay, and not
bedrock, this activity causes layers of clay to compact and the land to sink (Gray 2007). The
sinking land and sea level rising “threaten to submerge Thailand’s sprawling capital of more than
10 million people within this century” (Gray 2007). According to the Intergovernmental Panel
on Climate Change, Bangkok is one of thirteen world’s largest twenty cities at risk of being
swamped as sea levels rise.
In the past, many master plans were proposed to change the waterways in Bangkok to
help facilitate the downstream flow, such as widening the river, cutting through the river to
provide a straight path, and introducing a large-scale comprehensive polder system that
surrounds Bangkok Metropolitan Area. The Greater Bangkok Plan by Litchfield, Whiting,
Bowne & Ass. Adams, Howard and Greeley in 1960 (BMA 1986). This plan proposed two
diversion channels along the perimeter of the Chao Phraya River to alleviate excess water
flowing through the existing river. In 1968, Camp, Dresser & McKee proposed ten local polder
systems in Bangkok. In Thai, the polder system is called “a closed circuit,” as it separates water
control within the circuit from water outside. However, due to financial restraints and
fluctuating political power, city officials were not able to implement these plans. Instead,
smaller steps were taken to ensure that the most vulnerable parts of the city are protected.
Bangkok is governed by the local government entity the Bangkok Metropolitan
Administration (BMA), an organization established on December 14th, 1972 (BMA Department
of City Planning). At the time, the City Planning Division was transferred to be part of the

Julie Sophonpanich | 29
Permanent Secretary Office for the BMA. Finally in 1997, the BMA Board Decree finalized the
six divisions of Department of City Planning to be: 1. Office of Secretary, 2. Technical and
Planning Division, 3. Survey and Mapping Division, 4. Urban Development Planning Division,
5. City Planning Control Division, and 6. Land Readjustment And Urban Renewal Planning
Division. The land use planning subdivision and the infrastructure planning subdivision, the two
sections of the Planning Division managing flood control, are under the Urban Development
Division. The BMA therefore have the power to determine the growth of the city, designate
types of land uses, and finally control how flood planning is programmed.
In recent years, the political situation in Bangkok has been unstable. In 2006, a military
coup d’etat ousted then Prime Minister Taksin Shinawatra. Ever since, there have been frequent
changes in leadership and political unrest both from peaceful and non-peaceful protests. In many
ways, the political situation in Bangkok diverted policy makers’ attention away from the threat
of flooding in the city.
In late 2011, Bangkok experienced a severe and long flood event that damaged the
northern region of the city (Figure 12). According to news sources at the time, this event “has
affected more than a third of the country's provinces and killed almost 450 people
nationwide…[it is considered] the country's worst flooding in half a century” (Huffington Post).
In September, the beginning of the rainy season, heavy and frequent rainfall accumulated in the
northern region of Thailand. Excess rainwater overflowed the rivers; it also flooded regions
around the rivers with over 100 billion cubic meters (or 181 cubic yards) of water on land (Roo
Su Flood). Due to Thailand’s geographic slope southward, rivers all drain out into the Gulf of
Thailand, oftentimes passing through central Bangkok. In order to protect the country’s capital
from the northern floodwaters, city officials built 3.7 miles of floodwall with sandbags
(Huffington Post). However, this action prolonged the flood situation even longer since water
pooled in the northern areas of the city without a way to flow out. This proved to be problematic
for many residents of Bangkok as they had to endure the flood-water for many months.
Although flood planning in Bangkok has been an ongoing process with many success stories,
this recent flood event shows that further measures need to be taken in order to prevent and
mitigate the inevitable flooding in the city.

Julie Sophonpanich | 30
Flood planning, mitigation, and management are based on two measures: structural
measures and non-structural measures. Structural measures represent the construction
infrastructure, such as building dams, raising dikes, and expanding waterways. The majority of
flood planning in Bangkok has its roots in structural measures. For instance, the BMA has
constructed 77 kilometers (approximately 48 miles) of dike along the Chao Phraya River
(Bangkok Post). Polder systems, another example of structural measures, are implemented
throughout Bangkok. Polder is a low-lying land with a system of structural enclosure such as
dikes around a low-lying area through the usage of dikes to form an independent and artificial
hydrology entity (Princeton). A water pump system is generally installed in order to transfer
water from within the enclosed area to the outside. These systems are generally used for flood
plains and marshlands where water has to be manually drained out. In the case of Bangkok,
polder systems are used to manage pockets of low-lying areas affected by floodwater. The water
is pumped out into canals and rivers when the water level within the system threatens the
population and infrastructure in the area. Although building structures to prevent floods is fast
with very highly effective results, it is at the same time costly, requires space, and requires high
maintenance.
On the other hand, non-structural measures refer to implemented systems, such as flood
warning systems, land use and zoning measures, and emergency management. Non-structural
measures are less expensive to implement, but require management and time to test out the
systems. For example, land use and zoning code requires that new developments include a
certain percentage of green open space in order to help absorb excess water and minimize the
effect of flooding. However, it requires time to determine whether the amount of land allocated
to open space is enough to become effective. Other land use plans include designated land uses
to function as flood relief areas. Such examples are large open spaces, flood plains, protected
natural areas, wetland buffers, and agricultural land designated for floodwater. During the
raining months, floodwater should be directed to these areas in order to protect the built
infrastructure of the city. In Thailand, many open fields, lakes, and rice plantations are used as
areas to retain floodwater. It is therefore important for urban professionals to designate a
proportionate amount of land for floods.
Julie Sophonpanich | 31
The best plan would be to combine both structural and non-structural measures (Team).
Although Bangkok mainly uses structural measures for flood prevention and protection, non-
structural measures such as land use have also been incorporated in planning documents. For
instance, a set percentage of open space, green space, and buffer zones are required for new
developments. Sathorn Road, a main road running through Bangkok’s Central Business District,
demonstrates the uses of both structural and non-structural measures for flood prevention. The
road has a canal running through the center of the road. This canal is part of Bangkok’s naturally
occurring waterways, but concrete dikes were built along the sides of the canal to prevent water
from overflowing onto the streets. Additionally, the canal is connected to polder systems that
drain out water into the canal. Non-structural measures such as zoning requirements are also
implemented in this area. Office buildings have set back laws, open space regulations, and
rainfall retention area requirements in order to provide additional flood protections (BMA).
Other measures such as incorporating additional plantings along main roads and preservation of
parks and water retention areas have been added to Bangkok Metropolitan Administration’s
latest Comprehensive Land Use Plans.
Bangkok loosely follows a disaster planning cycle. During the pre-disaster phase, the
city prepares for the next flood by clearing sewage lines, draining storm water basins, and
closely monitoring weather patterns and potential for floods. Bangkok’s pre-disaster planning
phase is not very robust, as the city is expected to flood to a certain degree every rainy season. If
this phase were to developing a master plan for Bangkok Metropolitan Administration area,
Bangkok may experience less annual floodwater disruptions. When flood occurs, the city helps
the residents by providing temporary basic resources, such as food, water, and shelter. If funding
is sufficient, the city will install a water pumping system to drain out the stalled water. After
these flood events, depending on the severity of each flood, the city will implement a small
polder system around the affected area to prevent future floods. However, this system often
fails. The reason is that by fortifying a specific localized area the floodwater will flow into an
adjacent area, flooding a different neighborhood during the next raining season. Bangkok’s
incremental planning process may in fact be more detrimental to the city rather than mitigating
floods for all neighborhoods.

Julie Sophonpanich | 32
In light of the recent flood event, Bangkok urban professionals should take into
consideration additional land uses for flood control and management. The revision of the
Comprehensive Plan already included additional land for agricultural conservation land that can
be used as sponges to absorb excess water during flood events, but it may not be enough to
handle larger scale flood events. The 2011 flood brought on 181 cubic yards of water on land,
which equals to 50 days of water draining out through the three river paths into the Gulf of
Thailand (Roo Su Flood). However, if water was allowed to flood the city up to one meter (or
3.3 feet), then the time it takes to drain out will be reduced by approximately one week. Not
only should there be better systems to transfer water through the city into the Gulf of Thailand,
but also a better non-structural measure that will incorporate designation of land for flood
purposes.
Bangkok can benefit from the lessons learned in the previous case studies on Rotterdam
and New York City. Bangkok may benefit from a local level flood-planning scheme, similar to
that of New York City. However, having a decentralized, specialized political entity to oversee
water management may be better suited for Bangkok because of the city’s current unstable
political situation.

Julie Sophonpanich | 33
CONCLUSION
Over time, many planning models have been adopted in disaster planning, including the
disaster planning cycle, prevention/mitigation/adaptation model, flood risk analysis, and
structural and non-structural solutions. The disaster planning cycle has been woven into every
disaster-planning scheme; some cities base their flood planning strategies more heavily on this
cycle. Within the disaster-planning framework, some cities take on the prevention, mitigation, or
adaptation approach. The solution can either be a structural measure, such as a physical barrier;
or non-structural, such as a policy.
Rotterdam’s highly structured system allows for an organized disaster planning cycle
where plans have been clearly laid out for each aspect of the cycle. Rotterdam practices both
preventative and mitigation approaches. The Netherlands’ Delta Works program began after the
1953 Flood with a preventative approach, attempting to close all water inlets to prevent flooding
inland. Delta Works project was a structural preventative measure taken to prevent storm surges
and high tides that often affect the Netherlands. At its beginning stages, the plan was to prevent
flooding altogether. However, because of Port of Rotterdam’s significance, there needed to be a
new way to deal with potential floods. The storm surge barrier adopted the mitigation approach,
dealing with both structural and non-structural measures. The barrier does not prevent floods
altogether, but minimizes the effects of a storm surge during a storm.
Similarly, New York City follows a structured disaster planning cycle. New York City’s
Department of City Planning along with the Office of Emergency Management developed a
four-stage disaster cycle (preparedness, response, recovery, and mitigation). This model is
similar to the three-stage planning model initially presented in the literature review (pre-disaster,
during disaster, and post disaster planning). Mitigation can be applied throughout all three
planning stages. This model shows that New York City takes on a mitigation approach to flood
planning. Additionally, New York City also uses adaption measures to approach to flood
planning, tempering with the impacts of a disaster. (UNGRHS 2011)
On the other hand, Bangkok’s chaotic political situation resulted in an unorganized
disaster-planning manner. During the pre-disaster phase, the city prepares for the next flood by
clearing sewage lines, draining storm water basins, and closely monitoring weather patterns and

Julie Sophonpanich | 34
potential for floods. Bangkok’s pre-disaster planning phase is not very robust, as the city is
expected to flood to a certain degree every rainy season. If this phase were to developing a
master plan for Bangkok Metropolitan Administration area, Bangkok may experience less annual
floodwater disruptions. When flood occurs, the city helps the residents by providing temporary
basic resources, such as food, water, and shelter. If funding is sufficient, the city will install a
water pumping system to drain out the stalled water. After these flood events, depending on the
severity of each flood, the city will implement a small polder system around the affected area to
prevent future floods. However, this system often fails. The reason is that by fortifying a
specific localized area the floodwater will flow into an adjacent area, flooding a different
neighborhood during the next raining season.
Looking toward future planning for flood, city agencies and urban professionals need to
take into account the history of cities; topography, in particular flood-prone areas; economics;
politics; and past planning efforts in order to plan for a more flood resilient future. Sometimes,
there needs to be a large-scale disaster that truly affects the city and inflict fear upon the city’s
inhabitants before a comprehensive flood plan can be researched and implemented. The research
undergone for this thesis aimed to bridge the gap between existing literature on disaster planning
theories and the flood planning practice implemented in reality. With the knowledge that these
cities have on their current situation and the imminent problems with flooding, it is important to
start planning for floods.
Julie Sophonpanich | 35
BIBLIOGRAPHY
1. Bangkok City Planning Department. “Divisions.” Web, March 2014. <http://cpd.bangkok.go.th/eng-division.html>
2. Bangkok Metropolitan Administration. “Bangkok Land Use Plan: Comprehensive Plan.”
3. Borger, Guus J. and Willem A. Ligtendag. “The Role of Water in the Development of the Netherlands: A Historical Perspective.” Journal of Coastal Conservation, Vol. 4, No. 2 (1998), pp. 109-114
4. Colijn, C.J. and A.C. Binnendijk. “Physical Planning in the Coastal Region of Zeeland, the Netherlands.” Journal of Coastal Conservation, Vol.4, No.2 (1998), pp. 135-142
5. Delta Works Online. “Deltawerken.” Delta Works Online Foundation (2004). < http://www.deltawerken.com/>
6. Dolan, Robert and H. Grant Goodell. “Sinking Cities: A combination of human activities and geological process that endangers many of the world’s largest cities.” Journal of Coastal Research, Vol. 2, No. 3, (1986).
7. Federal Emergency Management Agency. Web. April 2014. < http://www.fema.gov/>
8. Flemming, George. “How Can We Learn to Live with Rivers? The Findings of the Institution of Civil Engineers Presidential Commission on Flood-Risk Management.” Philosophical Transactions: Mathematical, Physical and Engineering Sciences, Vol, 360, No. 1796, Flood Risk in a Changing Climate (Jul 2002): pp. 1527-1530
9. Gray, Dennis D. “Thailand Floods 2011: Water Closes in on Bangkok.” Huffington Post (May 2011). Web, December 2013.
10. Gray, Dennis. “Rising Seas Add to Bangkok’s Sinking Feelings.” NBC News (October 2007). Web. May 2014.
11. Hazard Mitigation Unit. “The City of New York: Hazard Mitigation Plan 2014.” New York City Office of Emergency Management (2014)
12. Herzog, Richard J. “A Model for Natural Disaster Administration: Naming and Framing Theory and Reality.” Administrative Theory & Praxis, Vol. 29, No. 4 (2007): 586-604.
13. Kahan, James P. “From Flood Control to Integrated Water Resource Management: Lessons Learned from the Gulf Coast from Flooding in Other Places in the Last Sixty Years.” RAND Corporation (2006)
14. Klein, Richard J.T., Marion J. Smit, Hasse Goosen, and Cornelis H Hulsbergen. “Resilience and Vulnerability: Coastal Dynamics or Dutch Dikes?” The Geographical Journal, Vol. 164, No. 3 (Nov., 1998): 259-268
15. Klijn and Schweckendick (eds). “Comprehensive Flood Risk Management.” London: Taylor & Francis Group, 2013.
Julie Sophonpanich | 36
16. Klijn, Frans, Michael van Buuren and Sabine A.M. van Rooij. “Flood-Risk Management Strategies for an Uncertain Future: Living with Rhine River Floodsin the Netherlands?” Ambio, Vol. 33, No. 3 (May, 2004), pp. 141-147
17. Kongrut, Anchalee. “A Matter of Credibility.” Bangkok Post. Web. November 22, 2011 <http://www.bangkokpost.com/learning/learning-from-news/267364/the-flood-expert>
18. Lawler, Joseph C. and Donald E. Cullivan. “Sewerage, Drainage, Flood Protection: Bangkok, Thailand.” Journal of Water Pollution Control Federation, Vol. 44, No. 5, (May 1972), pp.840-846.
19. Loh, Benjamin. “Disaster Risk Management in Southeast Asia: A Developmental Approach.” ASEAN Economic Bulletin, Vol. 22, No. 2 (August 2005), pp. 229-239
20. M. Van Koningsveld, J. P. M. Mulder, M. J. F. Stive, L. Van Der Valk and A. W.Van Der Weck. “Living with Sea-Level Rise and Climate Change: A Case Study of the Netherlands.” Journal of Coastal Research, Vol. 24, No. 2 (Mar., 2008), pp. 367-379, 444-445
21. Merriam-Webster. “Disaster.” Merriam-Webster. Web. March 2014.
22. Messner, F., Penning-Rowsell, E., Green, C., Meyer, V., Tunstall, S., & Van der Veen, A. “Evaluating Flood Damages: Guidance and Recommendations on Principles and Methods.” FLOODsite-Report T09-06-01 (2007).
23. Miller, Caitlin. “What Does Category 1, 2, 3...Really Mean? Learn the difference between the categories, and how it affects preparedness.” Coastal Living. Web. April 2014. <http://www.coastalliving.com/lifestyle/whats-the-difference-hurricane-categories-00414000072120/>
24. Molle, Francois. “Scales and Power in River Basin Management: The Chao Phraya River in Thailand.” The Geographical Journal, Vol. 173, No. 4, Critical Perspectives on Integrated Water Management (Dec., 2007), pp. 358-373.
25. Municipal Arts Society of New York City. “Rebuild by Design.” Municipal Arts Society of New York City, (August 2013). Web. April 2014. <http://www.mas.org/rebuild-by-design/>
26. New York City Department of City Planning. The City of New York, 2014 <http://www.nyc.gov/html/dcp/>
27. New York City’s Mayor’s Office of Long-Term Planning and Sustainability. “A Stronger, More Resilient New York.” The City of New York (2013)
28. New York City’s Mayor’s Office of Long-Term Planning and Sustainability. “PlaNYC: A Greener, Greater New York.” The City of New York (2007)
29. Pizarro, Rafael E., Edward Blakely, and John Dee. “Urban Planning and Policy Faces Climate Change.” Built Environment, Vol. 32, No.4 (2006): 400-412.

Julie Sophonpanich | 37
30. Princeton, “Polder.” Web. March 2014. <http://www.princeton.edu/~achaney/tmve/wiki100k/docs/Polder.html>
31. Quarantelli, E. L. “Imlications for Programmes and Policies from Future Disaster Trends.” Risk Management, Vol. 1, No. 1 (1999): 9-19
32. Ramroth, William G. Planning for Disaster: How Natural and Manmade Disasters Shape the Built Environment. New York: Kaplan, 2007.
33. Rijkswaterstaat (Ministry of Infrastructure and the Environment), Directorate-General Water and Rijkswaterstaat, and Center for Water Management. “Water Management in the Netherlands.” Rijkswaterstaat, February 2011.
34. Roo Su Flood, “Understanding the Flood.” October 25, 2011 <http://www.youtube.com/watch?v=b8zAAEDGQPM&list=UUEpI9nmlU-0rS7eAbu_GhVw>
35. Rotterdam.info. “About Rotterdam: History.” Rotterdam.info. Web. February 2014. <http://en.rotterdam.info/visitors/about-rotterdam/history/>
36. UN Global Report on Human Settlements. “Cities and Climate Change: Policy Directions.” United Nations (2011)
37. United States Census Bureau. “Population.” 2010

Julie Sophonpanich | 38
APPENDIX A: INTERVIEWS
Interview topics and questions:
1. History of major flood events in respective cities a. What were some of the major floods in the past? b. How do you think these floods have shaped the city?
2. Planning process a. How has your city dealt with floods in the past? b. What kind of planning model has been used to address flood prevention plans? c. What planning theories were used to plan for floods?
3. Flood events a. How much time before each flood did you have to anticipate and prepare for it? b. What kinds of preventative measures have been taken prior to the flood? c. During the flood, how did people cope? d. During the flood, how was water dealt with? Where did it go? e. After the flood, what steps were taken to study and make recommendations for
the future to prevent such incidents from repeating? 4. Success and failures
a. In your opinion, which planning initiatives were successful, which ones failed? b. Do you think the successful plans can be implemented in other cities?
5. Future of flood planning a. What do you think the future of flood planning and risk management plan for
your city will be? b. Will you change or improve upon any existing planning initiatives?
The table below shows interview subjects’ basic profiles; their names and personal information
that can be associated with them have been hidden in order to maintain their privacy.
Interviewee Affiliation Location 1 History Professor Bangkok 2 Consulting Company Bangkok 3 Consulting Company Bangkok 4 Local Deltaworks expert Rotterdam 5 Local Deltaworks guide Rotterdam 6 7
Planning professional Local community planning expert
New York City New York City

Julie Sophonpanich | 39
APPENDIX B: MAPS & IMAGES
Figure 1: Flooding in Bangkok 2011 (Source: Huffington Post)
Figure 2: The vulnerability equation (Source: Klein et al 1998)
Vulnerability
Suscep?bility
Resistance
Resilience

Julie Sophonpanich | 40
Figure 3: The cycle of disaster planning
Figure 4: Bangkok, Concrete barriers on Rangsit Road (Source: Bangkok Post)
Pre-‐Disaster Planning
Planning During the Disaster
Post-‐Disaster Planning

Julie Sophonpanich | 41
Figure 5: Flood risk diagram (Source: Klijn et al 2004)
Figure 6: Map of Rotterdam (Map by Julie Sophonpanich)
Vulnerability Flood Hazard Flood Risk
Flood Damage
Flood Probability Flood Risk

Julie Sophonpanich | 42
Figure 7: View of Rotterdam from the Euromast, showing the city surrounded by water
(Julie Sophonpanich)
Figure 8: The Maeslant Storm Surge Barrier (Julie Sophonpanich)

Julie Sophonpanich | 43
Figure 9: Map of New York City (Map by Julie Sophonpanich || Source: NYC DCP)

Julie Sophonpanich | 44
Figure 10: Aftermath of Superstorm Sandy (Source: GettyImages)
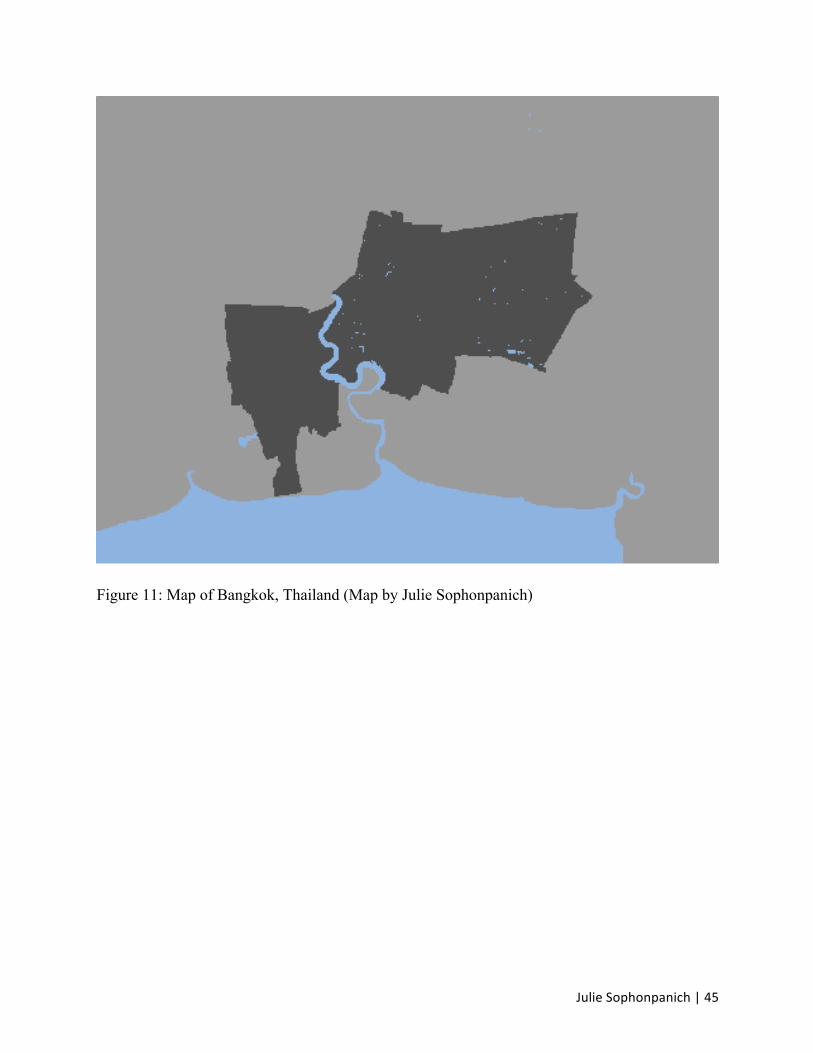
Julie Sophonpanich | 45
Figure 11: Map of Bangkok, Thailand (Map by Julie Sophonpanich)
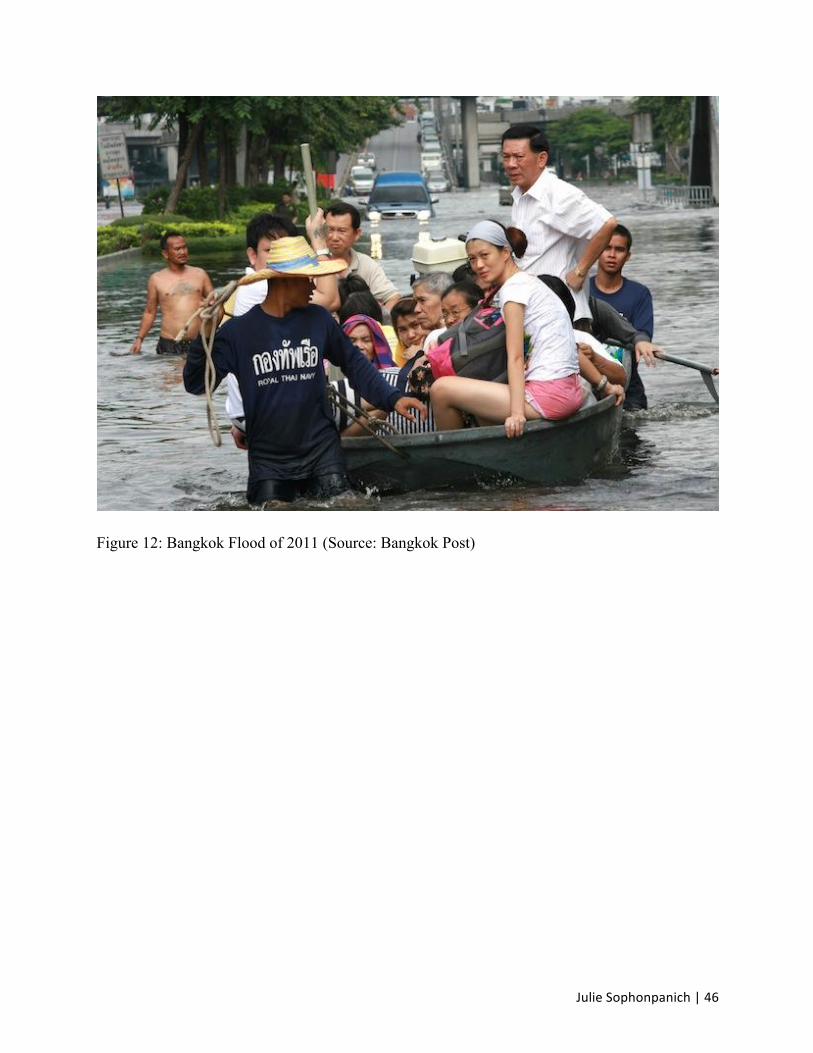
Julie Sophonpanich | 46
Figure 12: Bangkok Flood of 2011 (Source: Bangkok Post)