embargoed for release: wednesday, january 18 at...
TRANSCRIPT

Interviews with 1,000 adult Americans conducted by telephone by ORC International on January 12-15, 2017. The margin of sampling error for results based on the total sample is plus or minus 3 percentage points.
This sample includes 500 interviews among landline respondents and 500 interviews among cell phone respondents.
EMBARGOED FOR RELEASE: Wednesday, January 18 at 6:00 a.m.
POLL 1 -2- January 12-15, 2017
3
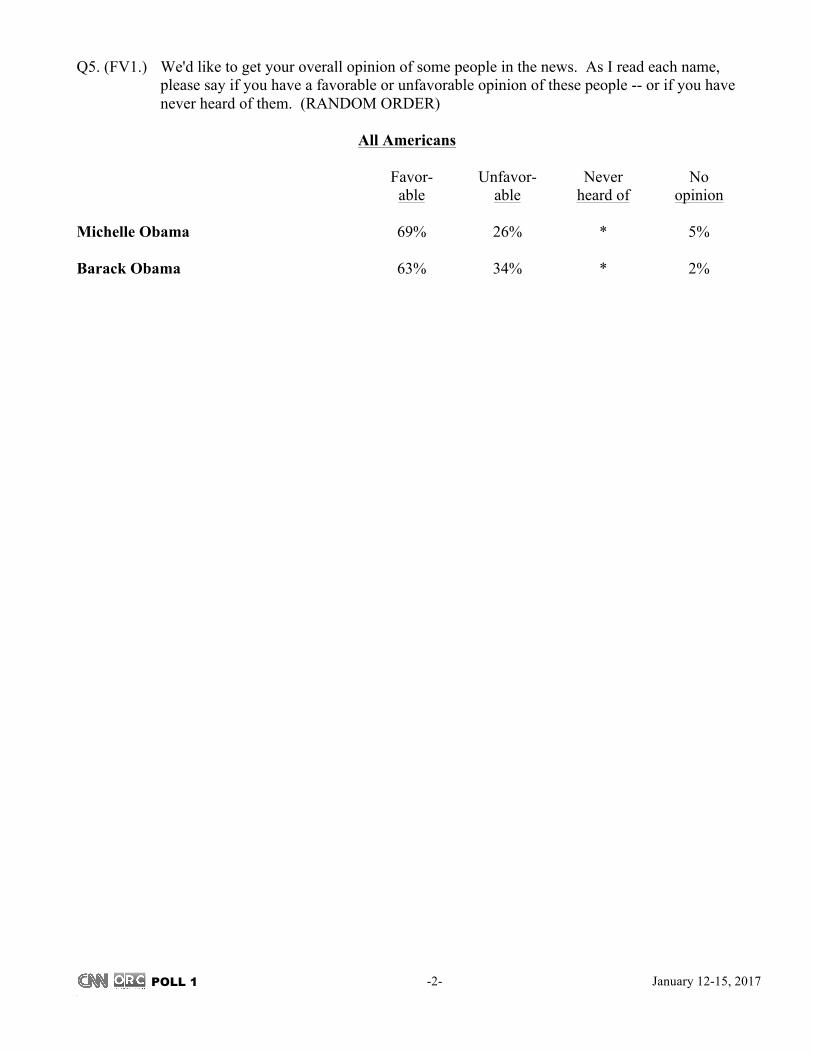
Q5. (FV1.) We'd like to get your overall opinion of some people in the news. As I read each name, please say if you have a favorable or unfavorable opinion of these people -- or if you have never heard of them. (RANDOM ORDER)
All Americans
Favor- Unfavor- Never No able able heard of opinion Michelle Obama 69% 26% * 5% Barack Obama 63% 34% * 2%

POLL 1 -3- January 12-15, 2017
3
Q5. (FV1.) We'd like to get your overall opinion of some people in the news. As I read each name, please say if you have a favorable or unfavorable opinion of these people -- or if you have never heard of them. (RANDOM ORDER)
Favor- Unfavor- Never No able able heard of opinion Barack Obama
January 12-15, 2017 63% 34% * 2% November 17-20, 2016 59% 38% 1% 2% June 16-19, 2016 53% 46% * 1% December 17-21, 2015 48% 50% * 1% September 4-8, 2015 49% 49% * 1% May 29-31, 2015 49% 49% * 2% March 13-15, 2015 52% 46% * 1% November 21-23, 2014 48% 51% * 1% May 29-June 1, 2014 47% 51% * 2% March 7-9, 2014 49% 49% * 1%
Nov. 16-18, 2012 56% 41% * 2% Nov. 2-4, 2012 (RV) 55% 44% * 1% Sept. 28-30, 2012 (RV) 53% 47% * * Sept. 7-9, 2012 (RV) 57% 41% * 1% Aug. 31-Sept. 3, 2012 (RV) 54% 44% * 2% August 22-23, 2012 (RV) 54% 44% * 2% August 7-8, 2012 56% 42% * 2% June 28-July 1, 2012 55% 44% * 1% May 29-31, 2012 56% 42% * 2% April 13-15, 2012 56% 42% * 2% March 24-25, 2012 56% 42% * 2% February 10-13, 2012 53% 45% * 1% January 11-12, 2012 49% 49% * 2% September 23-25, 2011 53% 45% * 2% January 14-16, 2011 56% 42% * 2% October 27-30, 2010 48% 48% * 3% September 1-2, 2010 53% 45% * 1% April 9-11, 2010 57% 41% * 2% December 16-20, 2009 58% 40% * 3% October 16-18, 2009 60% 39% * 1% July 31-Aug. 3, 2009 64% 34% * 2% April 23-26, 2009 69% 29% * 2% January 12-15, 2009 78% 17% 1% 4% December 1-2, 2008 76% 21% * 3% November 6-9, 2008 75% 22% * 3% October 17-19, 2008 (RV) 63% 33% * 3% October 3-5, 2008 (RV) 62% 36% * 2% Sept. 19-21, 2008 (RV) 63% 34% * 3% Sept. 5-7, 2008 (RV) 60% 34% * 6% Aug. 29-31, 2008 (RV) 64% 33% * 2% Aug. 23-24, 2008 (RV) 60% 36% * 3% July 27-29, 2008 (RV) 63% 33% * 4% June 26-29, 2008 (RV) 63% 32% * 4% April 28-30, 2008 56% 38% * 5% February 1-3, 2008 58% 31% 2% 8% January 9-10, 2008 55% 28% 6% 11% September 7-9, 2007 49% 27% 10% 13% June 23-24, 2007 47% 24% 14% 15% March 9-11, 2007 44% 21% 19% 16% November 3-5, 2006 36% 11% 37% 16%

POLL 1 -4- January 12-15, 2017
3
Q5. (FV1.) We'd like to get your overall opinion of some people in the news. As I read each name, please say if you have a favorable or unfavorable opinion of these people -- or if you have never heard of them. (RANDOM ORDER)
Favor- Unfavor- Never No able able heard of opinion Michelle Obama
January 12-15, 2017 69% 26% * 5% May 29-June 1, 2014 61% 34% * 5% March 7-9, 2014 63% 34% * 3% Sept. 7-9, 2012 (RV) 69% 27% * 4%
May 29-31, 2012 65% 27% 1% 7% April 13-15, 2012 71% 22% * 7% September 23-25, 2011 65% 28% * 6% September 1-2, 2010 62% 25% 1% 11% December 16-20, 2009 68% 19% * 13% October 16-18, 2009 64% 26% * 9% July 31-Aug. 3, 2009 67% 22% 1% 9% April 23-26, 2009 73% 18% 1% 8% January 12-15, 2009 69% 16% 3% 12% December 1-2, 2008 67% 21% 1% 10% October 17-19, 2008 56% 30% 2% 12% Aug. 23-24, 2008 50% 32% 2% 15% June 26-29, 2008 51% 28% 4% 17%

POLL 1 -5- January 12-15, 2017
3
Q8. (A1.) Do you approve or disapprove of the way Barack Obama is handling his job as president? App- Disapp- No rove rove opinion Jan. 12-15, 2017 60% 39% 1% Nov. 17-20, 2016 57% 41% 1% October 20-23, 2016 55% 43% 1% Sept. 28-Oct. 2, 2016 55% 44% 1% Sept. 1-4, 2016 51% 48% 1% July 29-31, 2016 54% 45% 1% July 22-24, 2016 50% 47% 4% June 16-19, 2016 52% 45% 2% Apr. 28-May 1, 2016 51% 46% 3% March 17-20, 2016 51% 46% 3% Feb. 24-27, 2016 50% 46% 4% Jan. 21-24, 2016 47% 49% 4% Dec. 17-21, 2015 47% 52% 1% Nov. 27-Dec. 1, 2015 45% 53% 3% Oct. 14-17, 2015 46% 51% 2% Sept. 17-19, 2015 44% 50% 6% Sept. 4-8, 2015 45% 52% 3% Aug. 13-16, 2015 47% 51% 2% July 22-25, 2015 49% 47% 4% June 26-28, 2015 50% 47% 3% May 29-31, 2015 45% 52% 2% April 16-19, 2015 48% 47% 5% Mar. 13-15, 2015 46% 51% 3% Feb. 12-15, 2015 47% 51% 2% Dec. 18-21, 2014 48% 50% 2% Nov. 21-23, 2014 44% 53% 3% Oct. 24-26, 2014 45% 53% 3% Sept. 25-28, 2014 44% 52% 4% Sept. 5-7, 2014 43% 55% 2% July 18-20, 2014 42% 55% 3% May 29-June 1, 2014 43% 55% 2% May 2-4, 2014 43% 55% 2% March 7-9, 2014 43% 53% 4% Jan. 31-Feb 2, 2014 45% 50% 5% Dec. 16-19, 2013 41% 56% 3% Nov. 18-20, 2013 41% 56% 3% Oct. 18-20, 2013 44% 52% 4%
App- Disapp- No rove rove opinion Sept. 27-29, 2013 44% 53% 4% Sept. 6-8, 2013 45% 52% 3% June 11-13, 2013 45% 54% 1% May 17-18, 2013 53% 45% 2% April 5-7, 2013 51% 47% 3% March 15-17, 2013 47% 50% 3% Jan. 14-15, 2013 55% 43% 2% Dec. 17-18, 2012 52% 43% 4% Nov. 16-18, 2012 52% 43% 5% Nov. 2-4, 2012 51% 45% 4% Sept. 28-30, 2012 49% 48% 3% Sept. 7-9, 2012 51% 44% 5% Aug. 31-Sept. 3, 2012 48% 45% 7% Aug. 22-23, 2012 50% 44% 6% Aug. 7-8, 2012 50% 47% 3% June 28-July 1, 2012 51% 47% 2% May 29-31, 2012 52% 47% 1% Apr. 13-15, 2012 49% 48% 3% March 24-25, 2012 51% 45% 4% Feb. 10-13, 2012 50% 48% 2% Jan. 11-12, 2012 47% 51% 3% Dec. 16-18, 2011 49% 48% 3% Nov. 18-20, 2011 44% 54% 3% Nov. 11-13, 2011 46% 52% 2% Oct.14-16, 2011 46% 50% 3% Sept. 23-25, 2011 45% 52% 3% Sept. 9-11, 2011 43% 55% 2% Aug. 24-25, 2011 45% 54% 1% Aug. 5-7, 2011 44% 54% 2% Aug. 1, 2011 45% 52% 2% June 3-7, 2011 48% 48% 5% May 24-26, 2011 54% 45% 2% May 2, 2011 52% 43% 5% Apr. 29-May 1, 2011 51% 46% 3% Apr. 9-10, 2011 48% 50% 2% March 18-20, 2011 51% 47% 2% March 11-13, 2011 50% 47% 3% Jan. 21-23, 2011 55% 44% 1%
(TRENDS CONTINUED ON THE NEXT PAGE)

POLL 1 -6- January 12-15, 2017
3
Q8. (A1.) Do you approve or disapprove of the way Barack Obama is handling his job as president? App- Disapp- No rove rove opinion Jan. 14-16, 2011 53% 45% 2% Dec. 17-19, 2010 48% 48% 4% Nov. 11-14, 2010 48% 50% 3% Oct. 27-30, 2010 46% 51% 4% Oct. 5-7, 2010 45% 52% 3% Sept. 21-23, 2010 42% 54% 4% Sept. 1-2, 2010 50% 49% 1% Aug. 6-10, 2010 47% 51% 2% July 16-21, 2010 47% 50% 2% June 16, 2010 50% 48% 2% May 21-23, 2010 51% 46% 3% Apr. 9-11, 2010 51% 47% 2% March 25-28, 2010 51% 48% 1% March 19-21, 2010 46% 51% 3% Feb. 12-15, 2010 49% 50% 1% Jan. 22-24, 2010 49% 50% *
App- Disapp- No rove rove opinion Jan. 8-10, 2010 51% 48% 1% Dec. 16-20, 2009 54% 44% 2% Dec. 2-3, 2009 48% 50% 2% Nov. 13-15, 2009 55% 42% 3% Oct. 30-Nov. 1, 2009 54% 45% 1% Oct. 16-18, 2009 55% 43% 2% Sept. 11-13, 2009 58% 40% 2% Aug. 28-31, 2009 53% 45% 2% July 31-Aug. 3, 2009 56% 40% 4% June 26-28, 2009 61% 37% 3% May 14-17, 2009 62% 35% 3% Apr. 23-26, 2009 63% 33% 5% Apr. 3-5, 2009 66% 30% 3% March 12-15, 2009 64% 34% 2% Feb. 18-19, 2009 67% 29% 4% Feb. 7-8, 2009 76% 23% 1%

POLL 1 -7- January 12-15, 2017
3
Q9. (A2.) Do you approve or disapprove of the way Barack Obama has handled: (RANDOM ORDER)
Approve Disapprove No opinion
The economy January 12-15, 2017 58% 41% 1% Sept. 1-4, 2016 50% 48% 3% June 16-19, 2016 51% 47% 1% December 17-21, 2015 52% 47% 1% Nov. 27 – Dec. 1, 2015 45% 53% 1% September 4-8, 2015 46% 53% 1% August 13-16, 2015 47% 52% 1% June 26-28, 2015* 52% 47% 1% May 29-31, 2015 46% 53% 2% Feb. 12-15, 2015* 45% 54% * Nov. 21-23, 2014 45% 53% 2% Sept. 25-28, 2014 42% 56% 3% Sept. 5-7, 2014 43% 56% 1% May 29-June 1, 2014 38% 61% 1% September 6-8, 2013 43% 56% 2% June 11-13, 2013 42% 57% 1% April 5-7, 2013 44% 54% 2% January 14-15, 2013 48% 51% 1% November 11-13, 2011 35% 63% 2% September 9-11, 2011 36% 61% 3% August 24-25, 2011 34% 65% 1% August 5-7, 2011 34% 64% 2% May 24-26, 2011 41% 58% 1% May 2, 2011 42% 56% 2% March 18-20, 2011 39% 60% 1% January 21-23, 2011 45% 54% * November 11-14, 2010 40% 58% 2% September 1-2, 2010 40% 59% 2% July 16-21, 2010 42% 57% * March 25-28, 2010 44% 55% 1% March 19-21, 2010 43% 54% 2% January 8-10, 2010 44% 54% 2% Oct. 30 - Nov. 1, 2009 46% 54% 1% September 11-13, 2009 54% 45% 1% August 28-31, 2009* 49% 51% * March 12-15, 2009 59% 40% 2% QUESTION WORDING PRIOR TO JANUARY, 2017: “Do you approve or disapprove of the way Barack Obama is handling:” *Asked of half sample

POLL 1 -8- January 12-15, 2017
3
Q9. (A2.) Do you approve or disapprove of the way Barack Obama has handled:
(RANDOM ORDER)
Approve Disapprove No opinion
ISIS, the Islamic militant group that controls some areas of Iraq and Syria (ASKED OF HALF SAMPLE. RESULTS BASED ON 499 INTERVIEWS IN VERSION A. SAMPLING ERROR: +/- 4.5 PERCENTAGE POINTS.)
January 12-15, 2017 42% 55% 2% Sept. 1-4, 2016 37% 58% 5% June 16-19, 2016 36% 60% 4% December 17-21, 2015 33% 64% 3% Nov. 27 – Dec. 1, 2015 33% 64% 4% August 13-16, 2015 33% 62% 5% May 29-31, 2015 32% 63% 5% Feb. 12-15, 2015 40% 57% 4% Sept. 25-28, 2014 45% 49% 6% Sept. 5-7, 2014 37% 59% 4% Terrorism
(ASKED OF HALF SAMPLE. RESULTS BASED ON 501 INTERVIEWS IN VERSION B. SAMPLING ERROR: +/- 4.5 PERCENTAGE POINTS.)
January 12-15, 2017 48% 49% 2% Sept. 1-4, 2016 44% 54% 3% June 16-19, 2016 42% 56% 2% December 17-21, 2015 38% 60% 1% Nov. 27 – Dec. 1, 2015 38% 60% 2% May 29-31, 2015* 45% 51% 4% Health care policy January 12-15, 2017 50% 49% 1% Nov. 27 – Dec. 1, 2015 41% 57% 1% May 29-31, 2015* 44% 54% 1% QUESTION WORDING PRIOR TO JANUARY, 2017: “Do you approve or disapprove of the way Barack Obama is handling:” *Asked of half sample

POLL 1 -9- January 12-15, 2017
3
Q9. (A2.) Do you approve or disapprove of the way Barack Obama has handled: (RANDOM ORDER)
Approve Disapprove No opinion Cybersecurity, which is the security ofthe nation’s electronic information
(ASKED OF HALF SAMPLE. RESULTS BASED ON 499 INTERVIEWS IN VERSION A. SAMPLING ERROR: +/- 4.5 PERCENTAGE POINTS.)
January 12-15, 2017 45% 48% 7% June 26-28, 2015* 37% 56% 8% Feb. 12-15, 2015* 35% 60% 5% QUESTION WORDING PRIOR TO JUNE, 2015: The security of the nation’s electronic information. Climate change
(ASKED OF HALF SAMPLE. RESULTS BASED ON 499 INTERVIEWS IN VERSION A. SAMPLING ERROR: +/- 4.5 PERCENTAGE POINTS.)
January 12-15, 2017 63% 32% 5% December 17-21, 2015 49% 44% 8% Nov. 27 – Dec. 1, 2015 45% 47% 8% September 4-8, 2015 47% 44% 9% August 13-16, 2015 47% 48% 5% May 29-31, 2015* 41% 49% 10% Environmental policy
(ASKED OF HALF SAMPLE. RESULTS BASED ON 501 INTERVIEWS IN VERSION B. SAMPLING ERROR: +/- 4.5 PERCENTAGE POINTS.)
January 12-15, 2017 66% 30% 4% Nov. 21-23, 2014 48% 45% 7% May 29-June 1, 2014 49% 45% 7% January 14-15, 2013* 60% 36% 4% March 19-21, 2010 55% 37% 8% Oct. 30 - Nov. 1, 2009 62% 33% 5% QUESTION WORDING PRIOR TO JANUARY, 2017: “Do you approve or disapprove of the way Barack Obama is handling:” *Asked of half sample

POLL 1 -10- January 12-15, 2017
3
Q9. (A2.) Do you approve or disapprove of the way Barack Obama has handled: (RANDOM ORDER)
Approve Disapprove No opinion Illegal immigration January 12-15, 2017 50% 48% 2% May 29-31, 2015* 36% 60% 4% Feb. 12-15, 2015* 40% 59% 1% Nov. 21-23, 2014 44% 53% 3% Sept. 5-7, 2014 34% 62% 4% May 29-June 1, 2014 35% 61% 5% June 11-13, 2013 40% 56% 4% April 5-7, 2013* 44% 50% 6% January 21-23, 2011 38% 57% 4% July 16-21, 2010 38% 59% 3% March 19-21, 2010 37% 56% 7% Oct. 30 - Nov. 1, 2009 36% 58% 6% Foreign affairs January 12-15, 2017 56% 42% 2% Nov. 27 – Dec. 1, 2015 40% 57% 3% September 4-8, 2015* 42% 55% 3% August 13-16, 2015 43% 56% 1% May 29-31, 2015* 43% 55% 2% Feb. 12-15, 2015* 41% 57% 1% Nov. 21-23, 2014 42% 54% 3% Sept. 25-28, 2014 42% 54% 4% Sept. 5-7, 2014 40% 57% 3% May 29-June 1, 2014 40% 57% 3% September 6-8, 2013 40% 57% 3% June 11-13, 2013 44% 54% 2% April 5-7, 2013 49% 48% 4% January 14-15, 2013 54% 42% 4% September 9-11, 2011 47% 50% 3% August 24-25, 2011 50% 47% 3% August 5-7, 2011 47% 50% 3% March 18-20, 2011 54% 43% 3% January 21-23, 2011 57% 40% 3% November 11-14, 2010 49% 46% 5% March 25-28, 2010 51% 44% 4% January 8-10, 2010 51% 46% 3% Oct. 30 - Nov. 1, 2009 51% 47% 2% September 11-13, 2009 58% 38% 4% August 28-31, 2009* 54% 42% 3% March 12-15, 2009 66% 28% 6% QUESTION WORDING PRIOR TO JANUARY, 2017: “Do you approve or disapprove of the way Barack Obama is handling:” *Asked of half sample

POLL 1 -11- January 12-15, 2017
3
Q9. (A2.) Do you approve or disapprove of the way Barack Obama has handled: (RANDOM ORDER)
Approve Disapprove No opinion
Education (ASKED OF HALF SAMPLE. RESULTS BASED ON 499 INTERVIEWS IN VERSION A. SAMPLING ERROR: +/- 4.5 PERCENTAGE POINTS.)
January 12-15, 2017 65% 30% 5% January 14-15, 2013 60% 34% 5% March 19-21, 2010 56% 41% 3% March 12-15, 2009* 65% 30% 5% Policies toward gays and lesbians
(ASKED OF HALF SAMPLE. RESULTS BASED ON 501 INTERVIEWS IN VERSION B. SAMPLING ERROR: +/- 4.5 PERCENTAGE POINTS.)
January 12-15, 2017 70% 25% 5% April 5-7, 2013 52% 42% 7% January 14-15, 2013* 59% 33% 8% Gun policy
(ASKED OF HALF SAMPLE. RESULTS BASED ON 501 INTERVIEWS IN VERSION B. SAMPLING ERROR: +/- 4.5 PERCENTAGE POINTS.)
January 12-15, 2017 44% 52% 4% June 16-19, 2016 36% 58% 5% January 5-6, 2016 43% 53% 4% December 17-21, 2015 35% 62% 3% September 4-8, 2015 35% 59% 5% June 26-28, 2015 42% 53% 5% May 29-June 1, 2014 33% 64% 4% April 5-7, 2013 45% 52% 3% January 14-15, 2013 46% 49% 6% QUESTION WORDING PRIOR TO JANUARY, 2017: “Do you approve or disapprove of the way Barack Obama is handling:” *Asked of half sample

POLL 1 -12- January 12-15, 2017
3
Q9. (A2.) Do you approve or disapprove of the way Barack Obama has handled: (RANDOM ORDER)
Approve Disapprove No opinion Race relations January 12-15, 2017 57% 42% 2% June 26-28, 2015 55% 42% 4% May 29-31, 2015 50% 47% 3% July 16-21, 2010 60% 34% 6% BLACKS January 12-15, 2017 81% 18% 1% June 26-28, 2015 84% 14% 2% July 16-21, 2010 94% 5% 1% WHITES January 12-15, 2017 47% 51% 2% June 26-28, 2015 48% 47% 5% July 16-21, 2010 54% 39% 6% QUESTION WORDING PRIOR TO JANUARY, 2017: “Do you approve or disapprove of the way Barack Obama is handling:”

POLL 1 -13- January 12-15, 2017
3
(ASKED OF HALF SAMPLE. RESULTS BASED ON 499 INTERVIEWS IN VERSION A. SAMPLING ERROR: =/- 4.5 PERCENTAGE POINTS.) Q10. Looking back on Barack Obama's eight years in office, in general, would you say his presidency
has been: (RANDOM ORDER) Jan. 12-15 Mar. 13-15 2017 2015 A success 65% 50% A failure 34% 47%
No opinion 1% 4%
QUESTION WORDING PRIOR TO JANUARY, 2017: “Since the start of 2009 when Barack Obama became president, in general, would you say his presidency has been:”
TRENDS FOR COMPARISON:
Obama Administration: Do you consider the first [INSERT TIME] of the Obama administration to be a success or a failure?
CNN/ORC INTERNATIONAL TRENDS
Success
Failure
Too soon to tell (vol.)
No opinion
2011 Jan 14-16 45 48 5 2 2010 Jan 8-10 47 48 4 1 2009 July 31-Aug 3 51 37 11 1
QUESTION WORDING: 2011 “first two years”; 2010 “first year”; 2009 “first six months” Bush Administration: Looking back on George W. Bush’s eight years in office, in general, would you say his presidency was a success or
failure? CNN/ORC INTERNATIONAL TRENDS
Success Failure No opinion 2009 Jan. 12-15 31 68 1
Bush Administration: Since the start of 2001 when George W. Bush became president, in general, would you say his presidency has been a
success or failure? CNN/ORC INTERNATIONAL TRENDS
Success Failure No opinion 2007 Aug 6-8* 40 57 3 2007 Jan 19-21 39 55 6 *Asked of a half sample.
CNN/USA TODAY/GALLUP TRENDS
Success Failure No opinion 2006 Jan 20-22* 46 52 2 2005 Oct 28-30 42 55 3 2005 Aug 28-30* 47 51 2 *Asked of a half sample.
Bush Administration: Do you consider the first [INSERT TME] of the Bush administration to be a -- [ROTATED: success (or a) failure]?
Success
Failure
Too soon to tell (vol.)
No opinion
2002 Jan 25-27 83 11 3 3 2001 Aug 3-5* 56 32 7 5
QUESTION WORDING: 2002 “first year”; 2001 “first six months”

POLL 1 -14- January 12-15, 2017
3
Clinton Administration: Since the start of 1993 when Bill Clinton became president, in general, would you say his presidency has been a success or a failure?
Success Failure No opinion 2000 Aug 11-12 68 29 3 1999 Jan 22-24 77 20 3 1999 Jan 15-17 81 16 3 1998 Jan 24-25 70 26 4 1998 Jan 23-24 71 25 4 1997 Oct 27-29* 70 25 5 1996 Aug 30-Sep 1** 64 31 5 1996 Aug 16-18** 57 38 5 1996 Aug 5-7* 64 30 6 1994 Dec 2-5*** 44 50 6 * Asked of half sample. ** WORDING: "Looking back on Bill Clinton's first term in office, in general, would you say his presidency has been a success or a failure? *** WORDING: "Looking back on Bill Clinton's first two years in office, in general, would you say his presidency has been a success or a failure?"
George H.W. Bush Administration: Looking back on George Bush's four years in office, in general, would you say his Presidency was a success or a failure?
Success Failure Mixed (vol.) No opinion 1993 Aug 8-11 53 33 12 2
Q10. Looking back on Barack Obama's eight years in office, in general, would you say his
presidency has been: (RANDOM ORDER) Q10a. (IF SUCCESS) Which of the following was the main reason for Obama's success -- his own
personal strengths, or circumstances that were beyond his control? QUESTIONS 10 AND 10A COMBINED Jan. 12-15 2017 Success due to personal strengths 49% Success due to circumstances beyond his control 13% Success due to other reasons 2% Success not sure why 1% Failure 34% No opinion 1% Q10. Looking back on Barack Obama's eight years in office, in general, would you say his
presidency has been: (RANDOM ORDER) Q10b. (IF FAILURE) Which of the following was the main reason for Obama's failure -- his own
personal shortcomings, or circumstances that were beyond his control? QUESTIONS 10 AND 10B COMBINED Jan. 12-15 2017 Failure due to personal shortcomings 26% Failure due to circumstances beyond his control 5% Failure due to other reasons 2% Failure not sure why * Success 65% No opinion 1%
POLL 1 -15- January 12-15, 2017
3
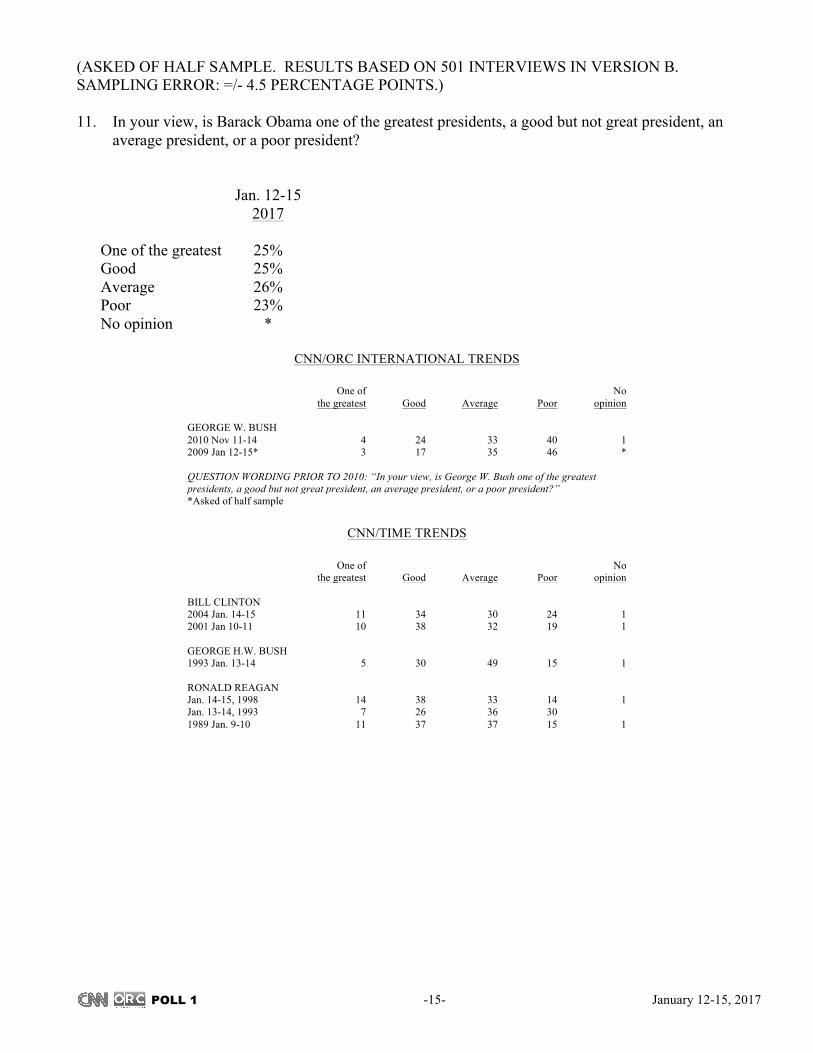
(ASKED OF HALF SAMPLE. RESULTS BASED ON 501 INTERVIEWS IN VERSION B. SAMPLING ERROR: =/- 4.5 PERCENTAGE POINTS.) 11. In your view, is Barack Obama one of the greatest presidents, a good but not great president, an
average president, or a poor president? Jan. 12-15 2017 One of the greatest 25% Good 25% Average 26% Poor 23% No opinion *
CNN/ORC INTERNATIONAL TRENDS
One of No the greatest Good Average Poor opinion
GEORGE W. BUSH 2010 Nov 11-14 4 24 33 40 1 2009 Jan 12-15* 3 17 35 46 * QUESTION WORDING PRIOR TO 2010: “In your view, is George W. Bush one of the greatest presidents, a good but not great president, an average president, or a poor president?” *Asked of half sample
CNN/TIME TRENDS
One of No
the greatest Good Average Poor opinion BILL CLINTON 2004 Jan. 14-15 11 34 30 24 1 2001 Jan 10-11 10 38 32 19 1 GEORGE H.W. BUSH 1993 Jan. 13-14 5 30 49 15 1 RONALD REAGAN Jan. 14-15, 1998 14 38 33 14 1 Jan. 13-14, 1993 7 26 36 30 1989 Jan. 9-10 11 37 37 15 1

POLL 1 -16- January 12-15, 2017
3
12. Which comes closer to your view of Barack Obama as he prepares to leave the White House? (RANDOM ORDER)
Jan. 12-15 2017 I’m glad he is leaving 41% I’ll miss him when he is gone 58% No opinion 1%
FOR COMPARISON:
CNN/USA TODAY/GALLUP POLL
Which comes closer to your view of Bill Clinton as he prepares to leave the White House -- I’m glad he is leaving, or I’ll miss him when he is gone?
I’m glad
he is leaving I’ll miss him
when he is gone No
opinion 2001 Jan 5-7 51 45 4

POLL 1 -17- January 12-15, 2017
3
Q14. (C1.) How well are things going in the country today -- very well, fairly well, pretty badly or very badly?
Very+ Pretty+ Very Fairly Pretty Very No fairly very well well badly badly opinion well badly January 12-15, 2017 5% 45% 35% 15% 1% 50% 50% November 17-20, 2016 5% 42% 34% 19% * 47% 53% October 20-23, 2016 11% 43% 25% 21% * 54% 46% July 29-31, 2016 8% 38% 28% 26% * 46% 54% June 16-19, 2016 6% 38% 36% 20% 1% 44% 56% Apr. 28-May 1, 2016 9% 40% 28% 23% * 49% 51% Jan. 21-24, 2016 6% 36% 35% 22% 1% 42% 57% Nov. 27 – Dec. 1, 2015 5% 44% 30% 20% * 49% 50% August 13-16, 2015 7% 41% 33% 19% * 48% 52% May 29-31, 2015 4% 43% 35% 17% * 47% 52% Mar. 13-15, 2015 7% 46% 32% 14% * 53% 46% Nov. 21-23, 2014 8% 44% 33% 15% * 52% 48% Sept. 25-28, 2014 3% 47% 30% 19% 1% 50% 49% Sept. 5-7, 2014 4% 40% 31% 24% * 44% 55% May 29-June 1, 2014 3% 44% 35% 18% * 47% 53% March 7-9, 2014 4% 41% 36% 19% * 45% 55% Nov. 18-20, 2013 6% 35% 37% 22% * 41% 59% Sept. 6-8, 2013 4% 42% 34% 19% * 46% 53% April 5-7, 2013 7% 43% 26% 24% * 50% 50% Jan. 14-15, 2013 3% 46% 36% 15% * 49% 51% Nov. 16-18, 2012 5% 38% 33% 24% * 43% 57% Nov. 2-4, 2012* 4% 42% 35% 18% 1% 46% 53% Aug. 7-8, 2012 2% 34% 38% 25% 1% 36% 63% April 13-15, 2012 2% 41% 34% 23% * 43% 57% Feb. 10-13, 2012 3% 37% 42% 18% * 40% 60% Dec. 16-18, 2011 2% 28% 49% 21% * 30% 70% Nov. 11-13, 2011 2% 23% 46% 28% 1% 25% 74% Aug. 24-25, 2011 2% 26% 46% 27% * 28% 73% Aug. 5-7, 2011 1% 23% 47% 28% * 24% 75% May 24-26, 2011 3% 36% 39% 21% * 39% 60% Mar. 18-20, 2011 2% 34% 42% 21% * 36% 63% Jan. 21-23, 2011 5% 38% 39% 17% * 43% 56% Dec. 17-19, 2010 1% 28% 45% 26% * 29% 71% Oct. 27-30, 2010 3% 22% 48% 27% * 25% 75% Sept. 21-23, 2010 2% 27% 44% 26% * 29% 70% Aug. 6-10, 2010 3% 28% 43% 26% * 31% 69% June 16, 2010 2% 25% 45% 28% * 27% 73% Mar. 19-21, 2010 3% 29% 41% 26% * 32% 67% Jan. 22-24, 2010 4% 28% 45% 22% * 32% 67% Dec. 2-3, 2009 3% 31% 42% 24% * 34% 66% Oct. 30-Nov. 1, 2009 3% 34% 41% 22% * 37% 63% August 28-31, 2009 2% 28% 46% 23% 1% 30% 69% May 14-17, 2009 3% 25% 45% 26% * 28% 71% April 3-5, 2009 3% 20% 51% 26% * 23% 77% February 18-19, 2009 3% 18% 47% 32% * 21% 79% December 1-2, 2008 2% 18% 39% 40% * 20% 79% November 6-9, 2008 2% 14% 45% 38% * 16% 83% October 17-19, 2008 3% 22% 42% 33% * 25% 75% October 3-5, 2008 3% 17% 45% 35% * 20% 80% Aug 23-24, 2008 3% 28% 35% 34% * 31% 69% July 27-29, 2008 3% 21% 47% 29% * 24% 76% Apr. 28-30, 2008 4% 26% 35% 35% 1% 30% 70% Nov. 2-4, 2007 8% 34% 35% 23% * 42% 58% April 10-12, 2007 8% 40% 34% 17% 1% 48% 51% January 11, 2007 8% 49% 30% 12% 1% 57% 42% November 3-5, 2006 9% 42% 30% 18% 1% 51% 48% October 6-8, 2006 12% 37% 30% 19% 2% 49% 49% Sept. 29-October 2, 2006 8% 43% 26% 23% * 51% 49% August 30-Sept. 2, 2006 9% 37% 29% 25% * 46% 54% August 2-3, 2006 8% 47% 29% 15% 1% 55% 44% May 5-7, 2006 8% 38% 33% 20% 1% 46% 53% *Asked of a half sample.
(CNN/TIME AND CNN/USA TODAY/GALLUP TRENDS ON NEXT PAGE)

POLL 1 -18- January 12-15, 2017
3
Trends from 1974 to May, 2004: CNN/Time or Time magazine polls;
Trends from October, 2004 to Feb, 2006: CNN/USA Today/Gallup polls
Very/ fairly well
Very/ pretty badly
Very/ fairly well
Very/ pretty badly
Very/ fairly well
Very/ pretty badly
Very/ fairly well
Very/ pretty badly
2006 Feb 9-12 52 47 1998 Jun 30-Jul 1 67 31 1993 Oct 39 58 1987 Feb 61 40 2005 Nov 11-13 49 50 1998 Jun 26-Jul 5 55 44 1993 Oct 41 59 1987 Jan 61 39 2005 Sep 8-11 50 50 1998 May 18-19 66 30 1993 Sep 47 52 1986 Sep 63 37 2005 July 23-24 58 41 1998 Apr 8-9 70 30 1993 Sep 42 57 1986 Jul 69 31 2005 April 1-2 61 38 1998 Mar 18-19 76 25 1993 Aug 39 58 1986 May 65 34 2005 Jan 7-9 58 41 1998 Feb 4-5 74 25 1993 Aug 41 57 1986 Apr 67 32 2004 Oct 29-31 55 44 1998 Jan 28-29 79 19 1993 Jun 41 56 1985 Nov 70 31 2004 Oct 9-10 54 46 1998 Jan 22 68 31 1993 May 40 58 1985 Sep 67 33 2004 May 12-13 60 39 1998 Jan 14-15 65 32 1993 May 43 56 1985 Jul 70 31 2004 Apr 8 63 36 1997 Oct 30 67 31 1993 Apr 45 53 1985 Apr 69 32 2004 Feb 5-6 52 47 1997 Sep 10-11 63 34 1993 Mar 48 50 1984 Dec 74 26 2004 Jan 14-15 53 46 1997 Jul 30-31 69 29 1993 Feb 48 49 1984 Oct 74 26 2003 Dec 30-Jan 1 49 49 1997 Jun 4-5 64 34 1993 Feb 48 49 1984 Sep 71 30 2003 Nov 18-19 52 46 1997 May 7-8 63 35 1993 Jan 53 45 1984 Aug 68 32 2003 Sep 3-4 49 49 1997 Apr 16-17 62 37 1993 Jan 47 52 1984 Jan 67 32 2003 Jul 16-17 57 42 1997 Mar 11-12 57 41 1992 Oct 35 65 1983 Dec 60 40 2003 May 21-22 60 39 1997 Feb 26-27 64 35 1992 Sep 32 68 1983 Sep 56 45 2003 Mar 27 63 36 1997 Feb 5-6 67 33 1992 Aug 35 63 1983 Jun 58 41 2003 Feb 19-20 52 47 1997 Jan 8-9 63 35 1992 Jul 31 67 1983 Mar 46 55 2003 Feb 6 53 46 1996 Oct 67 32 1992 Jun 35 62 1982 Dec 35 65 2003 Jan 15-16 49 49 1996 Jun 61 37 1992 Jun 33 65 1982 Oct 40 60 2002 Dec 17-18 54 45 1996 Jun 62 37 1992 May 30 68 1982 Jun 40 60 2002 Nov 13-14 56 42 1996 Feb 53 44 1992 Apr 33 65 1982 Mar 39 62 2002 Oct 23-24 49 49 1996 Jan 48 50 1992 Mar 33 66 1981 Dec 43 58 2002 Aug 28-29 57 41 1996 Jan 48 50 1992 Feb 35 62 1981 Sep 53 47 2002 Jul 10-11 59 39 1995 Dec 54 44 1992 Jan 29 71 1981 May 51 50 2002 Jun 19-20 57 41 1995 Oct 46 52 1992 Jan 35 64 1981 Jan 26 74 2002 May 22-23 64 35 1995 Oct 47 51 1992 Jan 36 64 1980 Oct 32 68 2002 Apr 10-11 61 38 1995 Sep 50 49 1991 Dec 29 71 1980 Aug 30 70 2002 Mar 13-14 69 29 1995 Sep 50 49 1991 Nov 36 64 1980 May 21 79 2002 Jan 23-24 66 34 1995 Aug 47 52 1991 Oct 42 56 1980 Mar 24 76 2001 Dec 19-20 64 34 1995 Jul 51 47 1991 Oct 42 58 1980 Jan 34 65 2001 Nov 7-8 63 35 1995 Jun 53 47 1991 Sep 49 49 1979 Dec 36 64 2001 Oct 12 65 33 1995 Jun 45 51 1991 Aug 53 47 1979 Oct 36 68 2001 Sep 27 59 38 1995 May 50 49 1991 Jun 53 47 1979 Aug 31 70 2001 Sep 13 45 53 1995 Apr 46 52 1991 May 53 47 1979 Apr 36 65 2001 Jul 17-18 70 29 1995 Mar 52 46 1991 Apr 56 42 1978 Oct 56 44 2001 May 23-24 65 33 1995 Mar 49 48 1991 Apr 59 41 1978 May 49 51 2001 Feb 7-8 71 28 1995 Feb 54 44 1991 Mar 74 26 1978 Mar 53 47 2001 Jan 10-11 73 24 1995 Jan 58 41 1991 Feb 58 42 1977 Nov 64 35 2000 Nov 10 74 25 1995 Jan 56 43 1991 Jan 39 61 1977 Jul 69 31 2000 Oct 25-26 79 19 1995 Jan 54 44 1990 Dec 45 55 1977 May 65 35 2000 Oct 12-13 76 22 1994 Dec 55 44 1990 Nov 42 58 1977 Mar 69 31 2000 Oct 4-5 77 22 1994 Nov 49 48 1990 Oct 38 62 1976 Oct 56 44 2000 Sep 6-7 79 19 1994 Oct 50 49 1990 Oct 41 59 1976 Sep 57 44 2000 Aug 9-10 77 21 1994 Oct 51 47 1990 Oct 42 58 1976 Aug 60 40 2000 Jul 26-27 74 24 1994 Sep 45 53 1990 Sep 52 48 1976 Jun 50 50 2000 Jun 14-15 72 27 1994 Sep 46 53 1990 Aug 55 45 1976 Apr 52 48 2000 Mar 8-9 76 22 1994 Sep 42 57 1990 Jul 55 45 1976 Jan 46 55 2000 Feb 2-3 78 17 1994 Aug 42 58 1990 May 61 37 1975 May 40 61 2000 Jan 12-13 81 19 1994 Aug 45 52 1990 Apr 62 38 1975 Jan 23 78 2000 Jan 5-6 80 19 1994 Aug 49 50 1990 Mar 62 38 1974 Sep 30 70 1999 Nov 10-11 68 30 1994 Jul 51 48 1990 Feb 70 30 1974 Mar 29 71 1999 Jul 14-15 70 28 1994 Jun 49 49 1990 Jan 67 33 1999 Jun 9-10 69 31 1994 Jun 56 41 1989 Oct 62 38 1999 May 26-27 61 37 1994 May 48 51 1989 Jun 61 39 1999 Mar 25 70 29 1994 May 49 50 1989 Jan 69 31 1999 Mar 4 73 26 1994 Apr 47 52 1988 Oct 70 31 1999 Jan 20-21 77 22 1994 Apr 53 44 1988 Sep 73 27 1999 Jan 7 74 25 1994 Mar 48 49 1988 Apr 64 40 1998 Dec 17-18 60 38 1994 Mar 49 50 1988 Mar 65 33 1998 Oct 14-15 78 21 1994 Feb 47 51 1988 Feb 60 37 1998 Sep 23-24 72 26 1994 Jan 52 47 1988 Jan 62 38 1998 Sep 16-17 72 25 1993 Dec 48 50 1987 Oct 58 42 1998 Aug 18 77 21 1993 Nov 45 54 1987 Aug 61 39 1998 Jul 30 68 31 1993 Oct 40 58 1987 May 64 37

POLL 1 -19- January 12-15, 2017
3
Q15. Do you think the country will be better off or worse off four years from now? Jan. 12-15 Nov. 17-20 Nov. 16-18 Nov. 6-8 2017 2016 2012 2008 Better off 47% 49% 56% 76% Worse off 48% 46% 40% 19% Same (vol.) 3% 3% 2% 4% No opinion 2% 2% 2% 1%
CNN/USA TODAY/GALLUP TRENDS
Better off Worse off Same (vol.) No opinion 2005 Jan 14-16 53 42 3 2 2001 Jan 15-16 46 42 5 7 2000 Nov 13-15 50 28 7 15 1992 Nov 10-11 51 31 6 12

POLL 1 -20- January 12-15, 2017
3
Q16. (E1.) How would you rate the economic conditions in the country today -- as very good, somewhat good, somewhat poor, or very poor?
Very Somewhat Somewhat Very No Total Total good good poor poor opinion good poor Jan. 12-15, 2017 8% 49% 30% 13% * 57% 43% Nov. 17-20, 2016 5% 43% 34% 17% * 48% 51% Sept. 1-4, 2016 9% 44% 29% 18% * 53% 47% June 16-19, 2016 5% 40% 35% 19% * 45% 54% Apr. 28-May 1, 2016 4% 44% 31% 22% 1% 48% 52% Feb. 24-27, 2016 4% 42% 28% 25% * 46% 53% Dec. 17-21, 2015 6% 43% 31% 20% * 49% 51% Sept. 4-8, 2015 6% 42% 30% 21% * 48% 51% July 22-25, 2015 5% 36% 36% 23% * 41% 59% Apr. 16-19, 2015 5% 47% 31% 17% * 52% 48% Feb. 12-15, 2015 4% 44% 34% 18% * 48% 52% Dec. 18-21, 2014 5% 46% 30% 19% * 51% 49% Oct. 24-26, 2014 5% 33% 37% 25% * 38% 62% Sept. 25-28, 2014 2% 40% 36% 21% 1% 42% 57% July 18-20, 2014 4% 37% 33% 25% * 41% 58% May 2-4, 2014 2% 36% 33% 29% * 38% 62% Jan. 31-Feb. 2, 2014 1% 35% 36% 28% * 36% 64% Dec. 16-19, 2013 2% 30% 36% 32% * 32% 68% Oct. 18-20, 2013 1% 28% 35% 36% * 29% 71% Sept. 27-29, 2013 1% 32% 31% 36% * 33% 67% June 11-13, 2013 1% 34% 40% 25% * 35% 65% May 17-18, 2013 3% 30% 38% 29% * 33% 67% March 15-17, 2013 3% 28% 37% 32% * 31% 69% Dec. 17-18, 2012 1% 25% 37% 37% * 26% 74% Nov. 2-4, 2012* 3% 25% 35% 36% 1% 28% 71% Sept. 28-30, 2012(RV) 1% 26% 39% 34% * 27% 73% Sept. 7-9, 2012(RV) 1% 31% 35% 33% * 32% 68% June 28-July 1, 2012 2% 25% 39% 34% * 27% 73% May 29-31, 2012 2% 29% 39% 30% * 31% 69% March 24-25, 2012 * 31% 42% 27% * 31% 69% Jan. 11-12, 2012 1% 17% 42% 38% * 18% 80% Nov. 18-20, 2011 1% 14% 34% 51% * 15% 85% Oct. 14-16, 2011 * 13% 39% 47% 1% 13% 86% Sept. 23-25, 2011 1% 9% 40% 50% * 10% 90% Sept. 9-11, 2011 1% 13% 41% 44% * 14% 85% July 18-20, 2011 * 16% 38% 46% * 16% 84% June 3-7, 2011 1% 18% 40% 41% * 19% 81% Apr. 29-May 1, 2011 1% 17% 44% 38% * 18% 82% March 11-13, 2011 1% 15% 42% 42% * 16% 84% Jan. 14-16, 2011 1% 23% 40% 35% 1% 24% 75% Nov. 11-14, 2010 1% 17% 37% 44% 1% 18% 81% Sept. 1-2, 2010 1% 17% 37% 44% * 18% 81% July 16-21, 2010 1% 21% 41% 37% * 22% 78%
(TRENDS CONTINUE ON NEXT PAGE)

POLL 1 -21- January 12-15, 2017
3
Q16. (E1.) How would you rate the economic conditions in the country today -- as very good, somewhat good, somewhat poor, or very poor?
Very Somewhat Somewhat Very No Total Total good good poor poor opinion good poor May 21-23, 2010 1% 21% 41% 37% * 22% 78% March 25-28, 2010 1% 20% 39% 39% * 21% 78% Feb. 12-15, 2010 2% 15% 39% 44% * 17% 83% Jan. 8-10, 2010 2% 18% 42% 38% * 20% 80% Dec. 16-20, 2009 1% 19% 38% 42% * 20% 80% Nov. 13-15, 2009 1% 17% 39% 43% * 18% 82% Oct. 16-18, 2009 2% 14% 42% 42% * 16% 84% July 31-Aug. 3, 2009 2% 19% 44% 35% * 21% 79% June 26-28, 2009 2% 18% 39% 41% * 20% 80% Apr. 23-26, 2009 1% 16% 46% 37% * 17% 83% March 12-15, 2009 1% 10% 41% 48% * 11% 89% Jan. 12-15, 2009 2% 11% 36% 50% * 13% 86% Dec. 19-21, 2008 2% 6% 27% 66% * 8% 93% Oct. 30-Nov. 1, 2008 3% 13% 29% 54% 2% 16% 83% Oct. 3-5, 2008 2% 14% 31% 53% * 16% 84% Sept. 19-21, 2008 1% 18% 34% 47% * 19% 81% Aug. 23-24, 2008 4% 21% 32% 43% * 25% 75% June 4-5, 2008 3% 19% 39% 39% * 22% 78% March 14-16, 2008 4% 22% 35% 40% * 26% 75% Jan. 14-17, 2008 4% 36% 40% 19% * 40% 59% Dec. 6-9, 2007 6% 40% 33% 21% 1% 46% 54% Sept. 7-9, 2007 9% 45% 28% 17% * 54% 45% Aug. 6-8, 2007 11% 45% 26% 17% 1% 56% 43% May 4-6, 2007 18% 43% 25% 14% 1% 61% 39% March 9-11, 2007 10% 42% 31% 15% 1% 52% 46% Jan. 19-21, 2007 15% 48% 23% 13% 1% 63% 36% Nov. 3-5, 2006 8% 41% 32% 18% 1% 49% 50% Oct. 27-29, 2006 13% 49% 24% 13% 1% 62% 37% Sept. 23-24, 2006 12% 47% 26% 15% * 59% 41% Aug. 30-Sept. 2, 2006 9% 35% 34% 22% * 44% 56% June 14-15, 2006 9% 42% 31% 16% 2% 51% 47% May 7-9, 2006 10% 42% 26% 21% 1% 52% 47% *Asked of a half sample
CNN/USA TODAY/GALLUP TRENDS
Very good
Some- what good
Some- what poor
Very poor
Total good
Total poor
Very good
Some- what good
Some- what poor
Very poor
Total good
Total poor
2006 Mar 10-12 13 46 26 15 59 41 2001 Dec 14-16 5 45 37 12 50 49 2005 Sep 8-11* 7 46 34 13 53 47 2001 Sep 21-22 7 50 34 8 57 42 2005 Apr 29-May 1 5 45 33 16 50 49 2001 Apr 20-22 10 57 25 7 67 32 2004 Dec 17-19 8 45 28 19 53 47 2001 Feb 9-11 16 64 16 3 80 19 2004 Jan 29-Feb 1 5 47 28 19 52 47 2001 Jan 15-16 24 58 14 4 82 18 2003 Dec 5-7 7 50 30 12 57 42 2000 Jun 6-7 39 46 9 5 85 14 2003 Oct 10-12 4 40 37 19 44 56 2000 Mar 10-12 42 44 10 3 86 13 2003 Mar 14-15 2 33 39 25 35 64 1999 Jun 25-27 34 50 10 6 84 16 2003 Feb 24-26 3 31 43 22 34 65 1999 Jan 8-10 41 48 8 3 89 11 2002 Dec 9-10 3 41 41 14 44 55 1998 July 7-8 29 50 15 5 79 20 2002 Oct 21-22 3 38 42 16 41 58 1998 Jan 25-26 24 57 14 4 81 18 2002 Sep 20-22 5 49 35 11 54 46 1998 Jan 24-25 24 57 13 5 81 19 2002 July 26-28 5 46 37 12 51 49 1998 Jan 23-24 24 57 15 4 81 19 2002 Jun 28-30 5 53 33 9 58 42 1997 Oct 27-29 24 55 15 4 79 19 2002 Apr 5-7 6 55 30 9 61 39 1997 Aug 22-25 17 52 21 9 69 30 2002 Jan 11-14 7 50 32 10 57 42
*Asked of a half sample

POLL 1 -22- January 12-15, 2017
3
(ASKED OF HALF SAMPLE. RESULTS BASED ON 499 INTERVIEWS IN VERSION A. SAMPLING ERROR: =/- 4.5 PERCENTAGE POINTS.) Q17. Now thinking about a year from now, do you expect economic conditions in this country will
be -- very good, somewhat good, somewhat poor, or very poor? Very Somewhat Somewhat Very No Total Total good good poor poor opinion good poor Jan. 12-15, 2017 10% 52% 27% 10% 1% 62% 37% Nov. 17-20, 2016 11% 52% 25% 12% 1% 63% 37% Sept. 4-8, 2015 8% 46% 27% 18% 2% 54% 45% Apr. 16-19, 2015 10% 50% 24% 14% 2% 60% 38% Feb. 12-15, 2015 9% 47% 27% 15% 1% 56% 42% Oct. 24-26, 2014 7% 45% 29% 17% 2% 52% 46% Dec. 16-19, 2013 5% 39% 29% 27% 1% 44% 56% Oct. 18-20, 2013 4% 36% 26% 33% 2% 40% 59% June 11-13, 2013 7% 43% 24% 25% * 50% 49% Sept. 7-9, 2012 (RV) 10% 57% 22% 9% 3% 67% 31% June 28–July 1, 2012 9% 51% 26% 13% 2% 60% 39% Oct. 14-16, 2011 5% 34% 34% 26% 1% 39% 60% July 18-20, 2011 4% 36% 30% 29% 1% 40% 59% Nov. 11-14, 2010 4% 48% 30% 16% 2% 52% 46% Dec. 16-20, 2009 5% 53% 25% 18% * 58% 43% July 31-Aug. 3, 2009 8% 50% 26% 14% 1% 58% 40% Apr. 23-26, 2009 7% 54% 27% 12% 1% 61% 39% Dec. 19-21, 2008 6% 49% 29% 16% 1% 55% 45% Oct. 30-Nov. 1, 2008 4% 58% 29% 7% 3% 62% 36% Sept. 19-21, 2008 6% 58% 25% 11% 1% 64% 36% June 4-5, 2008 6% 46% 28% 18% 2% 52% 46% Mar. 14-16, 2008 10% 50% 24% 14% 1% 60% 38% Dec. 6-9, 2007 7% 43% 30% 19% 1% 50% 49% Sept. 7-9, 2007 11% 51% 23% 13% 2% 62% 36% Aug. 6-8, 2007 12% 48% 25% 13% 2% 60% 38% Mar. 9-11, 2007 10% 43% 28% 14% 5% 53% 42% Oct. 27-29, 2006 13% 48% 26% 10% 4% 61% 36% Sept. 22-24, 2006 12% 50% 26% 9% 3% 62% 35% Aug. 30-Sept. 2, 2006 11% 45% 25% 17% 2% 56% 42%
(TRENDS CONTINUE ON NEXT PAGE)

POLL 1 -23- January 12-15, 2017
3
Q17. Now thinking about a year from now, do you expect economic conditions in this country will be -- very good, somewhat good, somewhat poor, or very poor?
CNN/USA TODAY/GALLUP TRENDS
Very good
Some-what good
Some-what poor
Very poor
No
opinion
Total good
Total poor
2006 Mar 10-12 15 45 25 12 3 60 37 2005 Sep 8-11* 8 41 32 18 1 49 50 2005 Apr 29-May 1 8 43 29 19 1 51 48 2004 Dec 17-19 17 43 24 15 1 60 39 2004 Jan 29-Feb 1 18 49 18 11 4 67 29 2003 Dec 5-7 22 51 19 7 1 73 26 2003 Oct 10-12 12 52 22 12 2 64 34 2003 Mar 14-15 9 49 25 15 2 58 40 2003 Feb 24-26 9 46 26 16 3 55 42 2002 Dec 9-10 12 53 21 11 3 65 32 2002 Oct 21-22 7 58 21 9 5 65 30 2002 Sep 20-22 14 57 20 7 2 71 27 2002 Jun 28-30 13 58 21 6 2 71 27 2002 Apr 5-7 17 60 15 5 3 77 20 2002 Jan 11-14 15 63 16 5 1 78 21 2001 Dec 14-16 17 59 14 7 3 76 21 2001 Sep 21-22 21 56 15 5 3 77 20 2001 Apr 20-24 16 54 18 9 3 70 27 2001 Feb 9-11 18 53 21 6 2 71 27 2001 Jan 15-16 13 55 22 8 2 68 30 2000 Jun 6-7 24 56 10 5 5 80 15 2000 Mar 10-12 24 55 13 4 4 79 17 1999 Jun 25-27 21 55 15 7 2 76 22 1999 Jan 8-10 25 56 12 4 3 81 16 1998 July 7-8 19 54 14 7 6 73 21 1997 Oct 27-29 20 55 18 4 3 75 22 * Asked of a half sample.
(ASKED OF HALF SAMPLE. RESULTS BASED ON 501 INTERVIEWS IN VERSION B. SAMPLING ERROR: =/- 4.5 PERCENTAGE POINTS.) Q18. Thinking about your personal financial situation, about a year from now, do you expect your
financial situation to be better than it is today, worse than it is today or about the same as it is today?
Jan. 12-15 2017 Better off 40% Worse off 11% Same (vol.) 48% No opinion 1%

POLL 1 -24- January 12-15, 2017
3
METHODOLOGY
A total of 1,000 adults were interviewed by telephone nationwide by live interviewers calling both landline and cell phones. Among the entire sample, 32% described themselves as Democrats, 24% described themselves as Republicans, and 44% described themselves as independents or members of another party. All respondents were asked questions concerning basic demographics, and the entire sample was weighted to reflect national Census figures for gender, race, age, education, region of country, and telephone usage. Crosstabs on the following pages only include results for subgroups with enough unweighted cases to produce a sampling error of +/- 8.5 percentage points or less. Some subgroups represent too small a share of the national population to produce crosstabs with an acceptable sampling error. Interviews were conducted among these subgroups, but results for groups with a sampling error larger than +/-8.5 percentage points are not displayed and instead are denoted with "NA".
POLL 1 -25- January 12-15, 2017
3
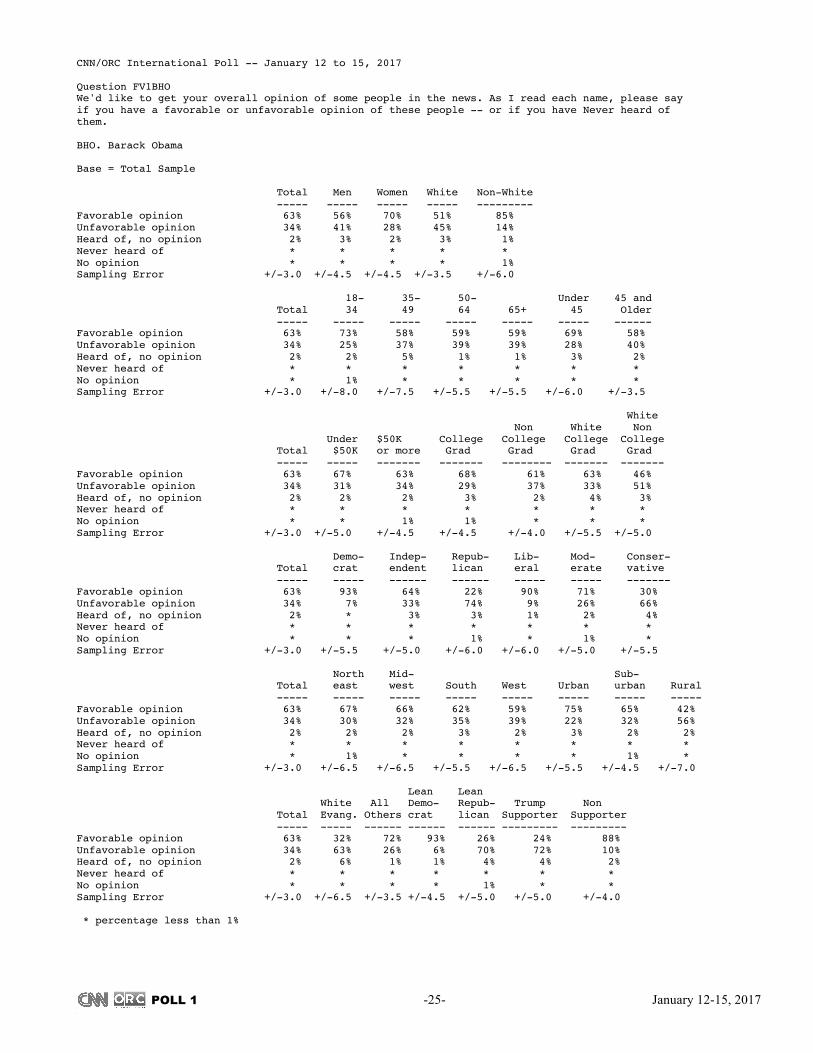
CNN/ORC International Poll -- January 12 to 15, 2017 Question FV1BHO We'd like to get your overall opinion of some people in the news. As I read each name, please say if you have a favorable or unfavorable opinion of these people -- or if you have Never heard of them. BHO. Barack Obama Base = Total Sample Total Men Women White Non-White ----- ----- ----- ----- --------- Favorable opinion 63% 56% 70% 51% 85% Unfavorable opinion 34% 41% 28% 45% 14% Heard of, no opinion 2% 3% 2% 3% 1% Never heard of * * * * * No opinion * * * * 1% Sampling Error +/-3.0 +/-4.5 +/-4.5 +/-3.5 +/-6.0 18- 35- 50- Under 45 and Total 34 49 64 65+ 45 Older ----- ----- ----- ----- ----- ----- ------ Favorable opinion 63% 73% 58% 59% 59% 69% 58% Unfavorable opinion 34% 25% 37% 39% 39% 28% 40% Heard of, no opinion 2% 2% 5% 1% 1% 3% 2% Never heard of * * * * * * * No opinion * 1% * * * * * Sampling Error +/-3.0 +/-8.0 +/-7.5 +/-5.5 +/-5.5 +/-6.0 +/-3.5 White Non White Non Under $50K College College College College Total $50K or more Grad Grad Grad Grad ----- ----- ------- ------- -------- ------- ------- Favorable opinion 63% 67% 63% 68% 61% 63% 46% Unfavorable opinion 34% 31% 34% 29% 37% 33% 51% Heard of, no opinion 2% 2% 2% 3% 2% 4% 3% Never heard of * * * * * * * No opinion * * 1% 1% * * * Sampling Error +/-3.0 +/-5.0 +/-4.5 +/-4.5 +/-4.0 +/-5.5 +/-5.0 Demo- Indep- Repub- Lib- Mod- Conser- Total crat endent lican eral erate vative ----- ----- ------ ------ ----- ----- ------- Favorable opinion 63% 93% 64% 22% 90% 71% 30% Unfavorable opinion 34% 7% 33% 74% 9% 26% 66% Heard of, no opinion 2% * 3% 3% 1% 2% 4% Never heard of * * * * * * * No opinion * * * 1% * 1% * Sampling Error +/-3.0 +/-5.5 +/-5.0 +/-6.0 +/-6.0 +/-5.0 +/-5.5 North Mid- Sub- Total east west South West Urban urban Rural ----- ----- ----- ----- ----- ----- ----- ----- Favorable opinion 63% 67% 66% 62% 59% 75% 65% 42% Unfavorable opinion 34% 30% 32% 35% 39% 22% 32% 56% Heard of, no opinion 2% 2% 2% 3% 2% 3% 2% 2% Never heard of * * * * * * * * No opinion * 1% * * * * 1% * Sampling Error +/-3.0 +/-6.5 +/-6.5 +/-5.5 +/-6.5 +/-5.5 +/-4.5 +/-7.0 Lean Lean White All Demo- Repub- Trump Non Total Evang. Others crat lican Supporter Supporter ----- ----- ------ ------ ------ --------- --------- Favorable opinion 63% 32% 72% 93% 26% 24% 88% Unfavorable opinion 34% 63% 26% 6% 70% 72% 10% Heard of, no opinion 2% 6% 1% 1% 4% 4% 2% Never heard of * * * * * * * No opinion * * * * 1% * * Sampling Error +/-3.0 +/-6.5 +/-3.5 +/-4.5 +/-5.0 +/-5.0 +/-4.0 * percentage less than 1%

POLL 1 -26- January 12-15, 2017
3
CNN/ORC International Poll -- January 12 to 15, 2017 Question FV1MO We'd like to get your overall opinion of some people in the news. As I read each name, please say if you have a favorable or unfavorable opinion of these people -- or if you have Never heard of them. MO. Michelle Obama Base = Total Sample Total Men Women White Non-White ----- ----- ----- ----- --------- Favorable opinion 69% 63% 76% 60% 87% Unfavorable opinion 26% 31% 20% 34% 10% Heard of, no opinion 5% 5% 4% 6% 3% Never heard of * * * * * No opinion * * * * * Sampling Error +/-3.0 +/-4.5 +/-4.5 +/-3.5 +/-6.0 18- 35- 50- Under 45 and Total 34 49 64 65+ 45 Older ----- ----- ----- ----- ----- ----- ------ Favorable opinion 69% 79% 63% 68% 65% 74% 65% Unfavorable opinion 26% 18% 30% 28% 30% 21% 30% Heard of, no opinion 5% 3% 8% 5% 4% 5% 5% Never heard of * * * * 1% * * No opinion * * * * * * * Sampling Error +/-3.0 +/-8.0 +/-7.5 +/-5.5 +/-5.5 +/-6.0 +/-3.5 White Non White Non Under $50K College College College College Total $50K or more Grad Grad Grad Grad ----- ----- ------- ------- -------- ------- ------- Favorable opinion 69% 71% 70% 77% 66% 74% 53% Unfavorable opinion 26% 25% 24% 18% 29% 21% 41% Heard of, no opinion 5% 4% 6% 5% 5% 5% 6% Never heard of * * * * * * * No opinion * * * * * * * Sampling Error +/-3.0 +/-5.0 +/-4.5 +/-4.5 +/-4.0 +/-5.5 +/-5.0 Demo- Indep- Repub- Lib- Mod- Conser- Total crat endent lican eral erate vative ----- ----- ------ ------ ----- ----- ------- Favorable opinion 69% 94% 69% 39% 94% 76% 40% Unfavorable opinion 26% 6% 24% 55% 5% 19% 53% Heard of, no opinion 5% * 7% 6% 1% 5% 7% Never heard of * * * * * * * No opinion * * * * * * * Sampling Error +/-3.0 +/-5.5 +/-5.0 +/-6.0 +/-6.0 +/-5.0 +/-5.5 North Mid- Sub- Total east west South West Urban urban Rural ----- ----- ----- ----- ----- ----- ----- ----- Favorable opinion 69% 74% 73% 71% 61% 79% 73% 50% Unfavorable opinion 26% 22% 24% 25% 32% 17% 22% 45% Heard of, no opinion 5% 3% 4% 4% 6% 4% 5% 4% Never heard of * * * * * * * * No opinion * * * * * * * * Sampling Error +/-3.0 +/-6.5 +/-6.5 +/-5.5 +/-6.5 +/-5.5 +/-4.5 +/-7.0 Lean Lean White All Demo- Repub- Trump Non Total Evang. Others crat lican Supporter Supporter ----- ----- ------ ------ ------ --------- --------- Favorable opinion 69% 44% 77% 95% 41% 37% 90% Unfavorable opinion 26% 49% 19% 4% 51% 54% 8% Heard of, no opinion 5% 7% 4% 1% 8% 9% 2% Never heard of * * * * * * * No opinion * * * * * * * Sampling Error +/-3.0 +/-6.5 +/-3.5 +/-4.5 +/-5.0 +/-5.0 +/-4.0 * percentage less than 1%

POLL 1 -27- January 12-15, 2017
3
CNN/ORC International Poll -- January 12 to 15, 2017 Question A1 Do you approve or disapprove of the way Barack Obama is handling his job as president? Base = Total Sample Total Men Women White Non-White ----- ----- ----- ----- --------- Approve 60% 52% 68% 49% 82% Disapprove 39% 48% 31% 50% 18% No opinion 1% * 1% 1% 1% Sampling Error +/-3.0 +/-4.5 +/-4.5 +/-3.5 +/-6.0 18- 35- 50- Under 45 and Total 34 49 64 65+ 45 Older ----- ----- ----- ----- ----- ----- ------ Approve 60% 73% 52% 58% 57% 66% 55% Disapprove 39% 26% 47% 42% 42% 33% 44% No opinion 1% 1% 1% * * 1% * Sampling Error +/-3.0 +/-8.0 +/-7.5 +/-5.5 +/-5.5 +/-6.0 +/-3.5 White Non White Non Under $50K College College College College Total $50K or more Grad Grad Grad Grad ----- ----- ------- ------- -------- ------- ------- Approve 60% 65% 59% 64% 59% 58% 45% Disapprove 39% 34% 41% 34% 41% 41% 55% No opinion 1% * 1% 2% * 2% * Sampling Error +/-3.0 +/-5.0 +/-4.5 +/-4.5 +/-4.0 +/-5.5 +/-5.0 Demo- Indep- Repub- Lib- Mod- Conser- Total crat endent lican eral erate vative ----- ----- ------ ------ ----- ----- ------- Approve 60% 95% 59% 18% 91% 66% 27% Disapprove 39% 5% 40% 81% 9% 32% 72% No opinion 1% * 1% 1% * 1% * Sampling Error +/-3.0 +/-5.5 +/-5.0 +/-6.0 +/-6.0 +/-5.0 +/-5.5 North Mid- Sub- Total east west South West Urban urban Rural ----- ----- ----- ----- ----- ----- ----- ----- Approve 60% 63% 62% 59% 58% 74% 61% 40% Disapprove 39% 35% 38% 40% 41% 26% 38% 60% No opinion 1% 1% * * 1% * 1% * Sampling Error +/-3.0 +/-6.5 +/-6.5 +/-5.5 +/-6.5 +/-5.5 +/-4.5 +/-7.0 Lean Lean White All Demo- Repub- Trump Non Total Evang. Others crat lican Supporter Supporter ----- ----- ------ ------ ------ --------- --------- Approve 60% 28% 70% 93% 23% 23% 84% Disapprove 39% 72% 29% 7% 76% 77% 15% No opinion 1% * 1% 1% 1% * 1% Sampling Error +/-3.0 +/-6.5 +/-3.5 +/-4.5 +/-5.0 +/-5.0 +/-4.0 * percentage less than 1%

POLL 1 -28- January 12-15, 2017
3
CNN/ORC International Poll -- January 12 to 15, 2017 Question A2A Do you approve or disapprove of the way Barack Obama has handled: A. The economy Base = Total Sample Total Men Women White Non-White ----- ----- ----- ----- --------- Approve 58% 51% 64% 48% 76% Disapprove 41% 48% 34% 51% 23% No opinion 1% 1% 1% 2% 1% Sampling Error +/-3.0 +/-4.5 +/-4.5 +/-3.5 +/-6.0 18- 35- 50- Under 45 and Total 34 49 64 65+ 45 Older ----- ----- ----- ----- ----- ----- ------ Approve 58% 66% 56% 53% 54% 65% 52% Disapprove 41% 33% 43% 46% 45% 34% 47% No opinion 1% 1% 1% 1% 1% 1% 1% Sampling Error +/-3.0 +/-8.0 +/-7.5 +/-5.5 +/-5.5 +/-6.0 +/-3.5 White Non White Non Under $50K College College College College Total $50K or more Grad Grad Grad Grad ----- ----- ------- ------- -------- ------- ------- Approve 58% 59% 58% 64% 55% 58% 43% Disapprove 41% 40% 41% 35% 44% 41% 55% No opinion 1% 1% 1% 1% 1% 1% 2% Sampling Error +/-3.0 +/-5.0 +/-4.5 +/-4.5 +/-4.0 +/-5.5 +/-5.0 Demo- Indep- Repub- Lib- Mod- Conser- Total crat endent lican eral erate vative ----- ----- ------ ------ ----- ----- ------- Approve 58% 89% 56% 19% 84% 64% 29% Disapprove 41% 10% 43% 80% 15% 35% 71% No opinion 1% 2% 1% 1% 1% 1% 1% Sampling Error +/-3.0 +/-5.5 +/-5.0 +/-6.0 +/-6.0 +/-5.0 +/-5.5 North Mid- Sub- Total east west South West Urban urban Rural ----- ----- ----- ----- ----- ----- ----- ----- Approve 58% 65% 61% 55% 52% 66% 60% 39% Disapprove 41% 35% 38% 44% 46% 32% 39% 60% No opinion 1% 1% 1% 1% 2% 1% 1% 1% Sampling Error +/-3.0 +/-6.5 +/-6.5 +/-5.5 +/-6.5 +/-5.5 +/-4.5 +/-7.0 Lean Lean White All Demo- Repub- Trump Non Total Evang. Others crat lican Supporter Supporter ----- ----- ------ ------ ------ --------- --------- Approve 58% 29% 66% 89% 23% 22% 81% Disapprove 41% 70% 33% 10% 76% 77% 18% No opinion 1% 1% 1% 1% 1% 1% 1% Sampling Error +/-3.0 +/-6.5 +/-3.5 +/-4.5 +/-5.0 +/-5.0 +/-4.0 * percentage less than 1%

POLL 1 -29- January 12-15, 2017
3
CNN/ORC International Poll -- January 12 to 15, 2017 Question A2B Do you approve or disapprove of the way Barack Obama has handled: B. ISIS, the Islamic State group that controls some areas of Iraq and Syria Base = Half Sample Total Men Women White Non-White ----- ----- ----- ----- --------- Approve 42% 35% 49% 35% 57% Disapprove 55% 64% 47% 63% 38% No opinion 2% 1% 4% 1% 5% Sampling Error +/-4.5 +/-6.0 +/-6.0 +/-5.5 +/-8.5 18- 35- 50- Under 45 and Total 34 49 64 65+ 45 Older ----- ----- ----- ----- ----- ----- ------ Approve 42% N/A N/A 39% 45% 47% 39% Disapprove 55% N/A N/A 59% 54% 51% 58% No opinion 2% N/A N/A 2% 1% 2% 3% Sampling Error +/-4.5 +/-7.5 +/-7.5 +/-8.5 +/-5.0 White Non White Non Under $50K College College College College Total $50K or more Grad Grad Grad Grad ----- ----- ------- ------- -------- ------- ------- Approve 42% 45% 42% 51% 39% 49% 29% Disapprove 55% 51% 57% 48% 58% 50% 69% No opinion 2% 4% 1% 1% 3% 1% 2% Sampling Error +/-4.5 +/-7.5 +/-6.0 +/-6.5 +/-6.0 +/-7.5 +/-7.0 Demo- Indep- Repub- Lib- Mod- Conser- Total crat endent lican eral erate vative ----- ----- ------ ------ ----- ----- ------- Approve 42% 79% 31% N/A N/A 52% 16% Disapprove 55% 19% 65% N/A N/A 46% 84% No opinion 2% 2% 4% N/A N/A 2% * Sampling Error +/-4.5 +/-7.5 +/-6.5 +/-7.0 +/-8.0 North Mid- Sub- Total east west South West Urban urban Rural ----- ----- ----- ----- ----- ----- ----- ----- Approve 42% N/A N/A 40% N/A 52% 48% N/A Disapprove 55% N/A N/A 58% N/A 47% 48% N/A No opinion 2% N/A N/A 2% N/A 1% 3% N/A Sampling Error +/-4.5 +/-8.0 +/-8.0 +/-6.5 Lean Lean White All Demo- Repub- Trump Non Total Evang. Others crat lican Supporter Supporter ----- ----- ------ ------ ------ --------- --------- Approve 42% N/A 48% 70% 13% 7% 65% Disapprove 55% N/A 49% 27% 87% 93% 31% No opinion 2% N/A 3% 3% * * 4% Sampling Error +/-4.5 +/-5.0 +/-6.5 +/-7.0 +/-7.0 +/-5.5 * percentage less than 1%

POLL 1 -30- January 12-15, 2017
3
CNN/ORC International Poll -- January 12 to 15, 2017 Question A2C Do you approve or disapprove of the way Barack Obama has handled: C. Terrorism Base = Half Sample Total Men Women White Non-White ----- ----- ----- ----- --------- Approve 48% 43% 54% 38% 65% Disapprove 49% 56% 43% 60% 32% No opinion 2% 2% 3% 2% 3% Sampling Error +/-4.5 +/-6.0 +/-6.0 +/-5.0 +/-8.5 18- 35- 50- Under 45 and Total 34 49 64 65+ 45 Older ----- ----- ----- ----- ----- ----- ------ Approve 48% N/A N/A 48% 48% 51% 45% Disapprove 49% N/A N/A 52% 48% 46% 53% No opinion 2% N/A N/A * 4% 3% 2% Sampling Error +/-4.5 +/-8.0 +/-7.5 +/-8.5 +/-5.0 White Non White Non Under $50K College College College College Total $50K or more Grad Grad Grad Grad ----- ----- ------- ------- -------- ------- ------- Approve 48% 54% 45% 52% 47% 46% 34% Disapprove 49% 42% 54% 46% 51% 54% 63% No opinion 2% 4% 1% 2% 2% * 3% Sampling Error +/-4.5 +/-7.0 +/-6.5 +/-6.5 +/-6.0 +/-7.5 +/-7.5 Demo- Indep- Repub- Lib- Mod- Conser- Total crat endent lican eral erate vative ----- ----- ------ ------ ----- ----- ------- Approve 48% 75% 45% 21% 72% 48% 28% Disapprove 49% 22% 53% 77% 24% 52% 70% No opinion 2% 3% 2% 2% 4% 1% 2% Sampling Error +/-4.5 +/-7.5 +/-7.0 +/-8.5 +/-8.5 +/-7.5 +/-7.5 North Mid- Sub- Total east west South West Urban urban Rural ----- ----- ----- ----- ----- ----- ----- ----- Approve 48% N/A N/A 48% N/A 62% 43% N/A Disapprove 49% N/A N/A 50% N/A 35% 56% N/A No opinion 2% N/A N/A 1% N/A 3% 1% N/A Sampling Error +/-4.5 +/-7.5 +/-8.0 +/-6.5 Lean Lean White All Demo- Repub- Trump Non Total Evang. Others crat lican Supporter Supporter ----- ----- ------ ------ ------ --------- --------- Approve 48% 26% 55% 73% 21% 18% 67% Disapprove 49% 72% 42% 24% 77% 81% 30% No opinion 2% 2% 2% 3% 1% 1% 3% Sampling Error +/-4.5 +/-8.5 +/-5.0 +/-6.5 +/-7.0 +/-7.0 +/-5.5 * percentage less than 1%

POLL 1 -31- January 12-15, 2017
3
CNN/ORC International Poll -- January 12 to 15, 2017 Question A2D Do you approve or disapprove of the way Barack Obama has handled: D. Health care policy Base = Total Sample Total Men Women White Non-White ----- ----- ----- ----- --------- Approve 50% 40% 59% 41% 68% Disapprove 49% 59% 40% 58% 30% No opinion 1% 1% 2% 1% 2% Sampling Error +/-3.0 +/-4.5 +/-4.5 +/-3.5 +/-6.0 18- 35- 50- Under 45 and Total 34 49 64 65+ 45 Older ----- ----- ----- ----- ----- ----- ------ Approve 50% 54% 43% 51% 51% 52% 48% Disapprove 49% 44% 57% 48% 47% 47% 50% No opinion 1% 1% * 1% 2% 1% 1% Sampling Error +/-3.0 +/-8.0 +/-7.5 +/-5.5 +/-5.5 +/-6.0 +/-3.5 White Non White Non Under $50K College College College College Total $50K or more Grad Grad Grad Grad ----- ----- ------- ------- -------- ------- ------- Approve 50% 51% 51% 58% 46% 51% 36% Disapprove 49% 47% 48% 41% 52% 48% 63% No opinion 1% 2% 1% 1% 2% 1% 1% Sampling Error +/-3.0 +/-5.0 +/-4.5 +/-4.5 +/-4.0 +/-5.5 +/-5.0 Demo- Indep- Repub- Lib- Mod- Conser- Total crat endent lican eral erate vative ----- ----- ------ ------ ----- ----- ------- Approve 50% 87% 44% 11% 80% 54% 20% Disapprove 49% 11% 55% 88% 20% 43% 79% No opinion 1% 2% 1% 1% * 2% 1% Sampling Error +/-3.0 +/-5.5 +/-5.0 +/-6.0 +/-6.0 +/-5.0 +/-5.5 North Mid- Sub- Total east west South West Urban urban Rural ----- ----- ----- ----- ----- ----- ----- ----- Approve 50% 54% 52% 46% 50% 59% 51% 34% Disapprove 49% 45% 46% 53% 50% 38% 48% 66% No opinion 1% 1% 3% 1% 1% 3% 1% * Sampling Error +/-3.0 +/-6.5 +/-6.5 +/-5.5 +/-6.5 +/-5.5 +/-4.5 +/-7.0 Lean Lean White All Demo- Repub- Trump Non Total Evang. Others crat lican Supporter Supporter ----- ----- ------ ------ ------ --------- --------- Approve 50% 25% 57% 84% 12% 12% 74% Disapprove 49% 75% 41% 14% 88% 87% 24% No opinion 1% * 2% 2% * * 2% Sampling Error +/-3.0 +/-6.5 +/-3.5 +/-4.5 +/-5.0 +/-5.0 +/-4.0 * percentage less than 1%

POLL 1 -32- January 12-15, 2017
3
CNN/ORC International Poll -- January 12 to 15, 2017 Question A2E Do you approve or disapprove of the way Barack Obama has handled: E. Cybersecurity, which is the security of the nations electronic information Base = Half Sample Total Men Women White Non-White ----- ----- ----- ----- --------- Approve 45% 37% 52% 38% 60% Disapprove 48% 59% 38% 57% 29% No opinion 7% 4% 10% 5% 11% Sampling Error +/-4.5 +/-6.0 +/-6.0 +/-5.5 +/-8.5 18- 35- 50- Under 45 and Total 34 49 64 65+ 45 Older ----- ----- ----- ----- ----- ----- ------ Approve 45% N/A N/A 40% 37% 53% 39% Disapprove 48% N/A N/A 56% 57% 38% 57% No opinion 7% N/A N/A 4% 6% 10% 4% Sampling Error +/-4.5 +/-7.5 +/-7.5 +/-8.5 +/-5.0 White Non White Non Under $50K College College College College Total $50K or more Grad Grad Grad Grad ----- ----- ------- ------- -------- ------- ------- Approve 45% 52% 42% 43% 46% 37% 38% Disapprove 48% 42% 50% 49% 47% 55% 57% No opinion 7% 6% 8% 8% 7% 7% 4% Sampling Error +/-4.5 +/-7.5 +/-6.0 +/-6.5 +/-6.0 +/-7.5 +/-7.0 Demo- Indep- Repub- Lib- Mod- Conser- Total crat endent lican eral erate vative ----- ----- ------ ------ ----- ----- ------- Approve 45% 70% 37% N/A N/A 47% 26% Disapprove 48% 22% 54% N/A N/A 42% 73% No opinion 7% 8% 9% N/A N/A 11% 1% Sampling Error +/-4.5 +/-7.5 +/-6.5 +/-7.0 +/-8.0 North Mid- Sub- Total east west South West Urban urban Rural ----- ----- ----- ----- ----- ----- ----- ----- Approve 45% N/A N/A 43% N/A 43% 49% N/A Disapprove 48% N/A N/A 48% N/A 46% 44% N/A No opinion 7% N/A N/A 9% N/A 11% 8% N/A Sampling Error +/-4.5 +/-8.0 +/-8.0 +/-6.5 Lean Lean White All Demo- Repub- Trump Non Total Evang. Others crat lican Supporter Supporter ----- ----- ------ ------ ------ --------- --------- Approve 45% N/A 48% 66% 26% 18% 62% Disapprove 48% N/A 43% 26% 72% 78% 29% No opinion 7% N/A 9% 9% 2% 4% 9% Sampling Error +/-4.5 +/-5.0 +/-6.5 +/-7.0 +/-7.0 +/-5.5 * percentage less than 1%
POLL 1 -33- January 12-15, 2017
3
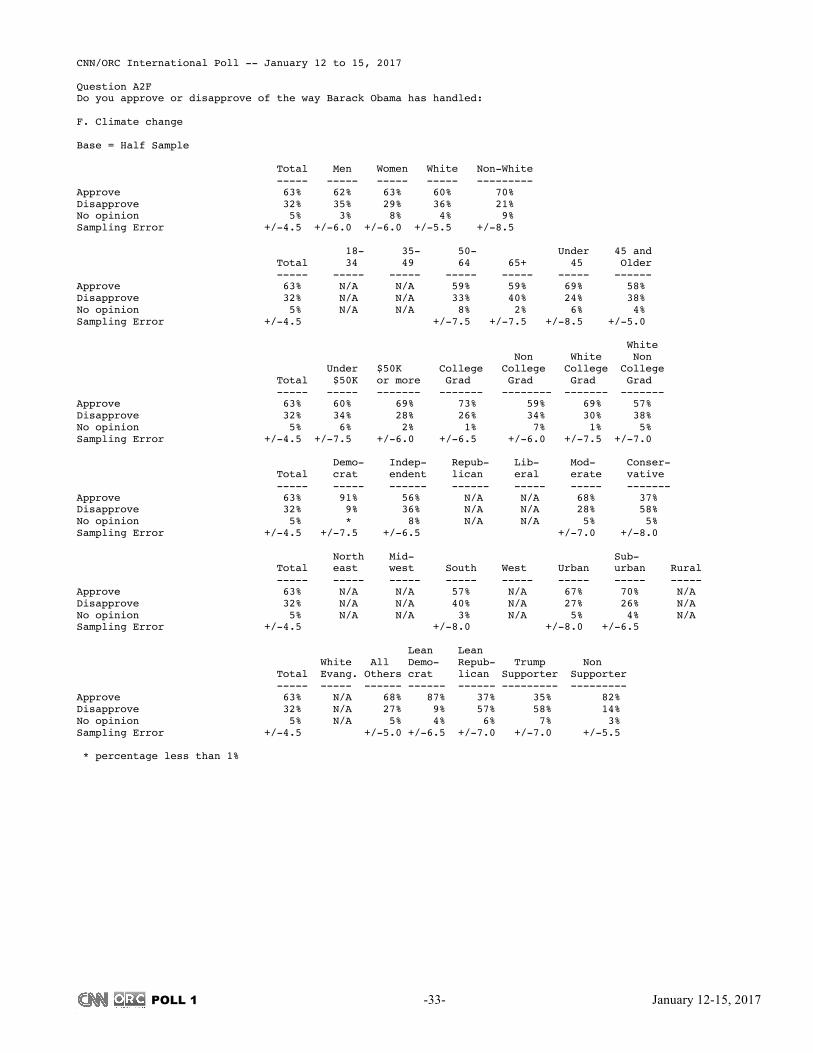
CNN/ORC International Poll -- January 12 to 15, 2017 Question A2F Do you approve or disapprove of the way Barack Obama has handled: F. Climate change Base = Half Sample Total Men Women White Non-White ----- ----- ----- ----- --------- Approve 63% 62% 63% 60% 70% Disapprove 32% 35% 29% 36% 21% No opinion 5% 3% 8% 4% 9% Sampling Error +/-4.5 +/-6.0 +/-6.0 +/-5.5 +/-8.5 18- 35- 50- Under 45 and Total 34 49 64 65+ 45 Older ----- ----- ----- ----- ----- ----- ------ Approve 63% N/A N/A 59% 59% 69% 58% Disapprove 32% N/A N/A 33% 40% 24% 38% No opinion 5% N/A N/A 8% 2% 6% 4% Sampling Error +/-4.5 +/-7.5 +/-7.5 +/-8.5 +/-5.0 White Non White Non Under $50K College College College College Total $50K or more Grad Grad Grad Grad ----- ----- ------- ------- -------- ------- ------- Approve 63% 60% 69% 73% 59% 69% 57% Disapprove 32% 34% 28% 26% 34% 30% 38% No opinion 5% 6% 2% 1% 7% 1% 5% Sampling Error +/-4.5 +/-7.5 +/-6.0 +/-6.5 +/-6.0 +/-7.5 +/-7.0 Demo- Indep- Repub- Lib- Mod- Conser- Total crat endent lican eral erate vative ----- ----- ------ ------ ----- ----- ------- Approve 63% 91% 56% N/A N/A 68% 37% Disapprove 32% 9% 36% N/A N/A 28% 58% No opinion 5% * 8% N/A N/A 5% 5% Sampling Error +/-4.5 +/-7.5 +/-6.5 +/-7.0 +/-8.0 North Mid- Sub- Total east west South West Urban urban Rural ----- ----- ----- ----- ----- ----- ----- ----- Approve 63% N/A N/A 57% N/A 67% 70% N/A Disapprove 32% N/A N/A 40% N/A 27% 26% N/A No opinion 5% N/A N/A 3% N/A 5% 4% N/A Sampling Error +/-4.5 +/-8.0 +/-8.0 +/-6.5 Lean Lean White All Demo- Repub- Trump Non Total Evang. Others crat lican Supporter Supporter ----- ----- ------ ------ ------ --------- --------- Approve 63% N/A 68% 87% 37% 35% 82% Disapprove 32% N/A 27% 9% 57% 58% 14% No opinion 5% N/A 5% 4% 6% 7% 3% Sampling Error +/-4.5 +/-5.0 +/-6.5 +/-7.0 +/-7.0 +/-5.5 * percentage less than 1%

POLL 1 -34- January 12-15, 2017
3
CNN/ORC International Poll -- January 12 to 15, 2017 Question A2G Do you approve or disapprove of the way Barack Obama has handled: G. Environmental policy Base = Half Sample Total Men Women White Non-White ----- ----- ----- ----- --------- Approve 66% 60% 72% 57% 82% Disapprove 30% 37% 23% 37% 17% No opinion 4% 3% 5% 6% 1% Sampling Error +/-4.5 +/-6.0 +/-6.0 +/-5.0 +/-8.5 18- 35- 50- Under 45 and Total 34 49 64 65+ 45 Older ----- ----- ----- ----- ----- ----- ------ Approve 66% N/A N/A 58% 53% 77% 57% Disapprove 30% N/A N/A 38% 41% 19% 39% No opinion 4% N/A N/A 3% 7% 4% 4% Sampling Error +/-4.5 +/-8.0 +/-7.5 +/-8.5 +/-5.0 White Non White Non Under $50K College College College College Total $50K or more Grad Grad Grad Grad ----- ----- ------- ------- -------- ------- ------- Approve 66% 73% 63% 70% 65% 66% 53% Disapprove 30% 22% 35% 28% 30% 33% 39% No opinion 4% 5% 2% 2% 5% 2% 8% Sampling Error +/-4.5 +/-7.0 +/-6.5 +/-6.5 +/-6.0 +/-7.5 +/-7.5 Demo- Indep- Repub- Lib- Mod- Conser- Total crat endent lican eral erate vative ----- ----- ------ ------ ----- ----- ------- Approve 66% 86% 69% 35% 89% 72% 42% Disapprove 30% 13% 27% 56% 10% 24% 51% No opinion 4% 1% 3% 9% 1% 4% 7% Sampling Error +/-4.5 +/-7.5 +/-7.0 +/-8.5 +/-8.5 +/-7.5 +/-7.5 North Mid- Sub- Total east west South West Urban urban Rural ----- ----- ----- ----- ----- ----- ----- ----- Approve 66% N/A N/A 64% N/A 75% 67% N/A Disapprove 30% N/A N/A 31% N/A 20% 30% N/A No opinion 4% N/A N/A 6% N/A 5% 3% N/A Sampling Error +/-4.5 +/-7.5 +/-8.0 +/-6.5 Lean Lean White All Demo- Repub- Trump Non Total Evang. Others crat lican Supporter Supporter ----- ----- ------ ------ ------ --------- --------- Approve 66% 40% 74% 88% 43% 38% 84% Disapprove 30% 49% 24% 11% 51% 55% 14% No opinion 4% 11% 2% 1% 7% 7% 2% Sampling Error +/-4.5 +/-8.5 +/-5.0 +/-6.5 +/-7.0 +/-7.0 +/-5.5 * percentage less than 1%

POLL 1 -35- January 12-15, 2017
3
CNN/ORC International Poll -- January 12 to 15, 2017 Question A2H Do you approve or disapprove of the way Barack Obama has handled: H. Illegal immigration Base = Total Sample Total Men Women White Non-White ----- ----- ----- ----- --------- Approve 50% 41% 59% 41% 68% Disapprove 48% 57% 39% 56% 31% No opinion 2% 2% 2% 2% 2% Sampling Error +/-3.0 +/-4.5 +/-4.5 +/-3.5 +/-6.0 18- 35- 50- Under 45 and Total 34 49 64 65+ 45 Older ----- ----- ----- ----- ----- ----- ------ Approve 50% 60% 49% 44% 45% 58% 44% Disapprove 48% 38% 49% 54% 51% 40% 54% No opinion 2% 2% 2% 1% 4% 1% 3% Sampling Error +/-3.0 +/-8.0 +/-7.5 +/-5.5 +/-5.5 +/-6.0 +/-3.5 White Non White Non Under $50K College College College College Total $50K or more Grad Grad Grad Grad ----- ----- ------- ------- -------- ------- ------- Approve 50% 54% 49% 57% 48% 55% 35% Disapprove 48% 45% 49% 40% 51% 43% 63% No opinion 2% 1% 2% 2% 2% 3% 2% Sampling Error +/-3.0 +/-5.0 +/-4.5 +/-4.5 +/-4.0 +/-5.5 +/-5.0 Demo- Indep- Repub- Lib- Mod- Conser- Total crat endent lican eral erate vative ----- ----- ------ ------ ----- ----- ------- Approve 50% 81% 48% 14% 79% 53% 23% Disapprove 48% 17% 50% 85% 18% 44% 76% No opinion 2% 2% 2% 1% 2% 3% 1% Sampling Error +/-3.0 +/-5.5 +/-5.0 +/-6.0 +/-6.0 +/-5.0 +/-5.5 North Mid- Sub- Total east west South West Urban urban Rural ----- ----- ----- ----- ----- ----- ----- ----- Approve 50% 56% 49% 46% 53% 62% 54% 30% Disapprove 48% 43% 49% 51% 45% 35% 45% 67% No opinion 2% 1% 2% 3% 2% 3% 1% 3% Sampling Error +/-3.0 +/-6.5 +/-6.5 +/-5.5 +/-6.5 +/-5.5 +/-4.5 +/-7.0 Lean Lean White All Demo- Repub- Trump Non Total Evang. Others crat lican Supporter Supporter ----- ----- ------ ------ ------ --------- --------- Approve 50% 23% 58% 79% 17% 17% 72% Disapprove 48% 77% 39% 18% 82% 82% 26% No opinion 2% * 2% 3% 1% 1% 3% Sampling Error +/-3.0 +/-6.5 +/-3.5 +/-4.5 +/-5.0 +/-5.0 +/-4.0 * percentage less than 1%

POLL 1 -36- January 12-15, 2017
3
CNN/ORC International Poll -- January 12 to 15, 2017 Question A2I Do you approve or disapprove of the way Barack Obama has handled: I. Foreign affairs Base = Total Sample Total Men Women White Non-White ----- ----- ----- ----- --------- Approve 56% 47% 63% 47% 74% Disapprove 42% 50% 34% 51% 24% No opinion 2% 2% 3% 3% 2% Sampling Error +/-3.0 +/-4.5 +/-4.5 +/-3.5 +/-6.0 18- 35- 50- Under 45 and Total 34 49 64 65+ 45 Older ----- ----- ----- ----- ----- ----- ------ Approve 56% 65% 55% 51% 51% 63% 50% Disapprove 42% 33% 44% 47% 46% 35% 48% No opinion 2% 2% 1% 2% 2% 2% 2% Sampling Error +/-3.0 +/-8.0 +/-7.5 +/-5.5 +/-5.5 +/-6.0 +/-3.5 White Non White Non Under $50K College College College College Total $50K or more Grad Grad Grad Grad ----- ----- ------- ------- -------- ------- ------- Approve 56% 63% 53% 60% 54% 54% 43% Disapprove 42% 35% 45% 38% 43% 44% 54% No opinion 2% 2% 2% 2% 3% 2% 3% Sampling Error +/-3.0 +/-5.0 +/-4.5 +/-4.5 +/-4.0 +/-5.5 +/-5.0 Demo- Indep- Repub- Lib- Mod- Conser- Total crat endent lican eral erate vative ----- ----- ------ ------ ----- ----- ------- Approve 56% 86% 52% 22% 85% 58% 30% Disapprove 42% 11% 45% 77% 14% 39% 68% No opinion 2% 3% 2% 1% 2% 3% 2% Sampling Error +/-3.0 +/-5.5 +/-5.0 +/-6.0 +/-6.0 +/-5.0 +/-5.5 North Mid- Sub- Total east west South West Urban urban Rural ----- ----- ----- ----- ----- ----- ----- ----- Approve 56% 60% 55% 54% 54% 65% 58% 42% Disapprove 42% 37% 43% 44% 43% 33% 40% 56% No opinion 2% 3% 3% 2% 3% 2% 3% 2% Sampling Error +/-3.0 +/-6.5 +/-6.5 +/-5.5 +/-6.5 +/-5.5 +/-4.5 +/-7.0 Lean Lean White All Demo- Repub- Trump Non Total Evang. Others crat lican Supporter Supporter ----- ----- ------ ------ ------ --------- --------- Approve 56% 32% 62% 85% 25% 21% 78% Disapprove 42% 68% 35% 12% 74% 77% 19% No opinion 2% * 3% 2% 1% 2% 2% Sampling Error +/-3.0 +/-6.5 +/-3.5 +/-4.5 +/-5.0 +/-5.0 +/-4.0 * percentage less than 1%

POLL 1 -37- January 12-15, 2017
3
CNN/ORC International Poll -- January 12 to 15, 2017 Question A2J Do you approve or disapprove of the way Barack Obama has handled: J. Education Base = Half Sample Total Men Women White Non-White ----- ----- ----- ----- --------- Approve 65% 56% 73% 57% 82% Disapprove 30% 37% 24% 37% 16% No opinion 5% 7% 3% 7% 1% Sampling Error +/-4.5 +/-6.0 +/-6.0 +/-5.5 +/-8.5 18- 35- 50- Under 45 and Total 34 49 64 65+ 45 Older ----- ----- ----- ----- ----- ----- ------ Approve 65% N/A N/A 57% 61% 70% 60% Disapprove 30% N/A N/A 40% 37% 23% 37% No opinion 5% N/A N/A 3% 2% 8% 3% Sampling Error +/-4.5 +/-7.5 +/-7.5 +/-8.5 +/-5.0 White Non White Non Under $50K College College College College Total $50K or more Grad Grad Grad Grad ----- ----- ------- ------- -------- ------- ------- Approve 65% 68% 65% 63% 66% 59% 56% Disapprove 30% 28% 28% 28% 31% 31% 40% No opinion 5% 4% 6% 8% 3% 10% 5% Sampling Error +/-4.5 +/-7.5 +/-6.0 +/-6.5 +/-6.0 +/-7.5 +/-7.0 Demo- Indep- Repub- Lib- Mod- Conser- Total crat endent lican eral erate vative ----- ----- ------ ------ ----- ----- ------- Approve 65% 93% 61% N/A N/A 71% 37% Disapprove 30% 7% 33% N/A N/A 22% 59% No opinion 5% 1% 7% N/A N/A 7% 4% Sampling Error +/-4.5 +/-7.5 +/-6.5 +/-7.0 +/-8.0 North Mid- Sub- Total east west South West Urban urban Rural ----- ----- ----- ----- ----- ----- ----- ----- Approve 65% N/A N/A 62% N/A 71% 70% N/A Disapprove 30% N/A N/A 32% N/A 24% 24% N/A No opinion 5% N/A N/A 6% N/A 5% 6% N/A Sampling Error +/-4.5 +/-8.0 +/-8.0 +/-6.5 Lean Lean White All Demo- Repub- Trump Non Total Evang. Others crat lican Supporter Supporter ----- ----- ------ ------ ------ --------- --------- Approve 65% N/A 69% 90% 40% 34% 85% Disapprove 30% N/A 25% 9% 53% 59% 11% No opinion 5% N/A 5% 1% 7% 7% 4% Sampling Error +/-4.5 +/-5.0 +/-6.5 +/-7.0 +/-7.0 +/-5.5 * percentage less than 1%

POLL 1 -38- January 12-15, 2017
3
CNN/ORC International Poll -- January 12 to 15, 2017 Question A2K Do you approve or disapprove of the way Barack Obama has handled: K. Policies toward gays and lesbians Base = Half Sample Total Men Women White Non-White ----- ----- ----- ----- --------- Approve 70% 65% 75% 65% 80% Disapprove 25% 30% 21% 29% 16% No opinion 5% 6% 4% 6% 4% Sampling Error +/-4.5 +/-6.0 +/-6.0 +/-5.0 +/-8.5 18- 35- 50- Under 45 and Total 34 49 64 65+ 45 Older ----- ----- ----- ----- ----- ----- ------ Approve 70% N/A N/A 63% 62% 79% 62% Disapprove 25% N/A N/A 27% 31% 19% 31% No opinion 5% N/A N/A 9% 6% 2% 7% Sampling Error +/-4.5 +/-8.0 +/-7.5 +/-8.5 +/-5.0 White Non White Non Under $50K College College College College Total $50K or more Grad Grad Grad Grad ----- ----- ------- ------- -------- ------- ------- Approve 70% 73% 70% 81% 66% 80% 57% Disapprove 25% 21% 26% 14% 29% 16% 36% No opinion 5% 6% 4% 5% 5% 4% 7% Sampling Error +/-4.5 +/-7.0 +/-6.5 +/-6.5 +/-6.0 +/-7.5 +/-7.5 Demo- Indep- Repub- Lib- Mod- Conser- Total crat endent lican eral erate vative ----- ----- ------ ------ ----- ----- ------- Approve 70% 88% 72% 43% 92% 77% 46% Disapprove 25% 8% 25% 48% 5% 17% 48% No opinion 5% 5% 3% 9% 2% 6% 6% Sampling Error +/-4.5 +/-7.5 +/-7.0 +/-8.5 +/-8.5 +/-7.5 +/-7.5 North Mid- Sub- Total east west South West Urban urban Rural ----- ----- ----- ----- ----- ----- ----- ----- Approve 70% N/A N/A 71% N/A 77% 76% N/A Disapprove 25% N/A N/A 26% N/A 19% 20% N/A No opinion 5% N/A N/A 3% N/A 4% 3% N/A Sampling Error +/-4.5 +/-7.5 +/-8.0 +/-6.5 Lean Lean White All Demo- Repub- Trump Non Total Evang. Others crat lican Supporter Supporter ----- ----- ------ ------ ------ --------- --------- Approve 70% 40% 79% 90% 46% 47% 85% Disapprove 25% 57% 15% 7% 46% 46% 11% No opinion 5% 3% 5% 4% 7% 7% 4% Sampling Error +/-4.5 +/-8.5 +/-5.0 +/-6.5 +/-7.0 +/-7.0 +/-5.5 * percentage less than 1%

POLL 1 -39- January 12-15, 2017
3
CNN/ORC International Poll -- January 12 to 15, 2017 Question A2L Do you approve or disapprove of the way Barack Obama has handled: L. Gun policy Base = Half Sample Total Men Women White Non-White ----- ----- ----- ----- --------- Approve 44% 39% 48% 36% 56% Disapprove 52% 60% 45% 59% 41% No opinion 4% 1% 7% 5% 3% Sampling Error +/-4.5 +/-6.0 +/-6.0 +/-5.0 +/-8.5 18- 35- 50- Under 45 and Total 34 49 64 65+ 45 Older ----- ----- ----- ----- ----- ----- ------ Approve 44% N/A N/A 40% 42% 47% 40% Disapprove 52% N/A N/A 54% 52% 51% 53% No opinion 4% N/A N/A 6% 6% 2% 6% Sampling Error +/-4.5 +/-8.0 +/-7.5 +/-8.5 +/-5.0 White Non White Non Under $50K College College College College Total $50K or more Grad Grad Grad Grad ----- ----- ------- ------- -------- ------- ------- Approve 44% 46% 45% 49% 41% 42% 33% Disapprove 52% 48% 52% 50% 53% 57% 60% No opinion 4% 6% 3% 1% 6% 1% 7% Sampling Error +/-4.5 +/-7.0 +/-6.5 +/-6.5 +/-6.0 +/-7.5 +/-7.5 Demo- Indep- Repub- Lib- Mod- Conser- Total crat endent lican eral erate vative ----- ----- ------ ------ ----- ----- ------- Approve 44% 72% 38% 18% 68% 42% 24% Disapprove 52% 21% 59% 79% 28% 53% 73% No opinion 4% 7% 4% 3% 3% 5% 3% Sampling Error +/-4.5 +/-7.5 +/-7.0 +/-8.5 +/-8.5 +/-7.5 +/-7.5 North Mid- Sub- Total east west South West Urban urban Rural ----- ----- ----- ----- ----- ----- ----- ----- Approve 44% N/A N/A 41% N/A 53% 47% N/A Disapprove 52% N/A N/A 55% N/A 43% 50% N/A No opinion 4% N/A N/A 4% N/A 4% 3% N/A Sampling Error +/-4.5 +/-7.5 +/-8.0 +/-6.5 Lean Lean White All Demo- Repub- Trump Non Total Evang. Others crat lican Supporter Supporter ----- ----- ------ ------ ------ --------- --------- Approve 44% 20% 51% 68% 17% 19% 58% Disapprove 52% 79% 44% 26% 79% 76% 38% No opinion 4% 1% 6% 5% 3% 4% 4% Sampling Error +/-4.5 +/-8.5 +/-5.0 +/-6.5 +/-7.0 +/-7.0 +/-5.5 * percentage less than 1%

POLL 1 -40- January 12-15, 2017
3
CNN/ORC International Poll -- January 12 to 15, 2017 Question A2M Do you approve or disapprove of the way Barack Obama has handled: M. Race relations Base = Total Sample Total Men Women White Non-White ----- ----- ----- ----- --------- Approve 57% 50% 63% 47% 75% Disapprove 42% 49% 35% 51% 24% No opinion 2% 1% 2% 2% 1% Sampling Error +/-3.0 +/-4.5 +/-4.5 +/-3.5 +/-6.0 18- 35- 50- Under 45 and Total 34 49 64 65+ 45 Older ----- ----- ----- ----- ----- ----- ------ Approve 57% 63% 57% 51% 56% 62% 53% Disapprove 42% 35% 43% 48% 41% 37% 46% No opinion 2% 2% * 1% 3% 1% 1% Sampling Error +/-3.0 +/-8.0 +/-7.5 +/-5.5 +/-5.5 +/-6.0 +/-3.5 White Non White Non Under $50K College College College College Total $50K or more Grad Grad Grad Grad ----- ----- ------- ------- -------- ------- ------- Approve 57% 60% 56% 59% 56% 54% 44% Disapprove 42% 38% 44% 39% 43% 44% 54% No opinion 2% 2% 1% 2% 1% 2% 2% Sampling Error +/-3.0 +/-5.0 +/-4.5 +/-4.5 +/-4.0 +/-5.5 +/-5.0 Demo- Indep- Repub- Lib- Mod- Conser- Total crat endent lican eral erate vative ----- ----- ------ ------ ----- ----- ------- Approve 57% 82% 56% 25% 82% 60% 32% Disapprove 42% 16% 43% 74% 15% 39% 67% No opinion 2% 3% 1% 1% 2% 1% 1% Sampling Error +/-3.0 +/-5.5 +/-5.0 +/-6.0 +/-6.0 +/-5.0 +/-5.5 North Mid- Sub- Total east west South West Urban urban Rural ----- ----- ----- ----- ----- ----- ----- ----- Approve 57% 65% 51% 53% 59% 72% 57% 35% Disapprove 42% 34% 48% 44% 40% 26% 42% 64% No opinion 2% * 1% 3% 1% 2% 1% 1% Sampling Error +/-3.0 +/-6.5 +/-6.5 +/-5.5 +/-6.5 +/-5.5 +/-4.5 +/-7.0 Lean Lean White All Demo- Repub- Trump Non Total Evang. Others crat lican Supporter Supporter ----- ----- ------ ------ ------ --------- --------- Approve 57% 33% 63% 83% 28% 22% 79% Disapprove 42% 65% 35% 15% 71% 77% 19% No opinion 2% 1% 2% 2% 1% 1% 2% Sampling Error +/-3.0 +/-6.5 +/-3.5 +/-4.5 +/-5.0 +/-5.0 +/-4.0 * percentage less than 1%

POLL 1 -41- January 12-15, 2017
3
CNN/ORC International Poll -- January 12 to 15, 2017 Question 10 Looking back on Barack Obama's eight years in office, in general, would you say his presidency has been: Base = Half Sample Total Men Women White Non-White ----- ----- ----- ----- --------- A success 65% 58% 71% 55% 87% A failure 34% 40% 28% 44% 12% No opinion 1% 1% 1% 1% * Sampling Error +/-4.5 +/-6.0 +/-6.0 +/-5.5 +/-8.5 18- 35- 50- Under 45 and Total 34 49 64 65+ 45 Older ----- ----- ----- ----- ----- ----- ------ A success 65% N/A N/A 53% 62% 74% 57% A failure 34% N/A N/A 45% 38% 25% 42% No opinion 1% N/A N/A 2% * 1% 1% Sampling Error +/-4.5 +/-7.5 +/-7.5 +/-8.5 +/-5.0 White Non White Non Under $50K College College College College Total $50K or more Grad Grad Grad Grad ----- ----- ------- ------- -------- ------- ------- A success 65% 70% 62% 69% 63% 63% 51% A failure 34% 30% 36% 28% 37% 35% 49% No opinion 1% * 2% 2% * 2% 1% Sampling Error +/-4.5 +/-7.5 +/-6.0 +/-6.5 +/-6.0 +/-7.5 +/-7.0 Demo- Indep- Repub- Lib- Mod- Conser- Total crat endent lican eral erate vative ----- ----- ------ ------ ----- ----- ------- A success 65% 97% 63% N/A N/A 73% 33% A failure 34% 3% 34% N/A N/A 26% 66% No opinion 1% * 2% N/A N/A 1% 1% Sampling Error +/-4.5 +/-7.5 +/-6.5 +/-7.0 +/-8.0 North Mid- Sub- Total east west South West Urban urban Rural ----- ----- ----- ----- ----- ----- ----- ----- A success 65% N/A N/A 62% N/A 78% 67% N/A A failure 34% N/A N/A 37% N/A 21% 32% N/A No opinion 1% N/A N/A 1% N/A 1% 1% N/A Sampling Error +/-4.5 +/-8.0 +/-8.0 +/-6.5 Lean Lean White All Demo- Repub- Trump Non Total Evang. Others crat lican Supporter Supporter ----- ----- ------ ------ ------ --------- --------- A success 65% N/A 72% 97% 30% 22% 92% A failure 34% N/A 27% 3% 70% 77% 7% No opinion 1% N/A 1% * * * 1% Sampling Error +/-4.5 +/-5.0 +/-6.5 +/-7.0 +/-7.0 +/-5.5 * percentage less than 1%

POLL 1 -42- January 12-15, 2017
3
CNN/ORC International Poll -- January 12 to 15, 2017 Question 10/10A Q10. Looking back on Barack Obama's eight years in office, in general, would you say his presidency has been: Q10A. Which of the following was the main reason for Obama's success -- his own personal strengths, or circumstances that were beyond his control? Base = Half Sample Total Men Women White Non-White ----- ----- ----- ----- --------- Success personal strengths 49% 44% 54% 41% 65% Success beyond his control 13% 12% 14% 11% 18% Success due to other reasons 2% 1% 2% * 5% Success not sure why 1% 1% 1% 1% * Failure 34% 40% 28% 44% 12% No opinion 1% 1% 1% 1% * Sampling Error +/-4.5 +/-6.0 +/-6.0 +/-5.5 +/-8.5 18- 35- 50- Under 45 and Total 34 49 64 65+ 45 Older ----- ----- ----- ----- ----- ----- ------ Success personal strengths 49% N/A N/A 42% 42% 58% 41% Success beyond his control 13% N/A N/A 10% 17% 14% 13% Success due to other reasons 2% N/A N/A 1% 2% 2% 1% Success not sure why 1% N/A N/A 1% 1% 1% 1% Failure 34% N/A N/A 45% 38% 25% 42% No opinion 1% N/A N/A 2% * 1% 1% Sampling Error +/-4.5 +/-7.5 +/-7.5 +/-8.5 +/-5.0 White Non White Non Under $50K College College College College Total $50K or more Grad Grad Grad Grad ----- ----- ------- ------- -------- ------- ------- Success personal strengths 49% 51% 50% 57% 46% 53% 36% Success beyond his control 13% 17% 10% 9% 15% 8% 13% Success due to other reasons 2% * 2% 3% 1% 1% * Success not sure why 1% 2% * 1% 1% 1% 1% Failure 34% 30% 36% 28% 37% 35% 49% No opinion 1% * 2% 2% * 2% 1% Sampling Error +/-4.5 +/-7.5 +/-6.0 +/-6.5 +/-6.0 +/-7.5 +/-7.0 Demo- Indep- Repub- Lib- Mod- Conser- Total crat endent lican eral erate vative ----- ----- ------ ------ ----- ----- ------- Success personal strengths 49% 81% 47% N/A N/A 55% 24% Success beyond his control 13% 13% 12% N/A N/A 15% 9% Success due to other reasons 2% 2% 2% N/A N/A 2% * Success not sure why 1% * 2% N/A N/A 1% 1% Failure 34% 3% 34% N/A N/A 26% 66% No opinion 1% * 2% N/A N/A 1% 1% Sampling Error +/-4.5 +/-7.5 +/-6.5 +/-7.0 +/-8.0 North Mid- Sub- Total east west South West Urban urban Rural ----- ----- ----- ----- ----- ----- ----- ----- Success personal strengths 49% N/A N/A 44% N/A 54% 57% N/A Success beyond his control 13% N/A N/A 13% N/A 20% 9% N/A Success due to other reasons 2% N/A N/A 4% N/A 3% 1% N/A Success not sure why 1% N/A N/A * N/A 1% * N/A Failure 34% N/A N/A 37% N/A 21% 32% N/A No opinion 1% N/A N/A 1% N/A 1% 1% N/A Sampling Error +/-4.5 +/-8.0 +/-8.0 +/-6.5 Lean Lean White All Demo- Repub- Trump Non Total Evang. Others crat lican Supporter Supporter ----- ----- ------ ------ ------ --------- --------- Success personal strengths 49% N/A 56% 82% 15% 10% 76% Success beyond his control 13% N/A 14% 12% 13% 12% 14% Success due to other reasons 2% N/A 2% 3% 1% 1% 2% Success not sure why 1% N/A 1% * * * 1% Failure 34% N/A 27% 3% 70% 77% 7% No opinion 1% N/A 1% * * * 1% Sampling Error +/-4.5 +/-5.0 +/-6.5 +/-7.0 +/-7.0 +/-5.5 * percentage less than 1% CNN/ORC International Poll -- January 12 to 15, 2017

POLL 1 -43- January 12-15, 2017
3
Question 10/10B Q10. Looking back on Barack Obama's eight years in office, in general, would you say his presidency has been: Q10B. Which of the following was the main reason for Obama's failure -- his own personal shortcomings, or circumstances that were beyond his control? Base = Half Sample Total Men Women White Non-White ----- ----- ----- ----- --------- Failure personal shortcomings 26% 31% 22% 35% 8% Failure beyond his control 5% 6% 5% 6% 4% Failure due to other reasons 2% 3% 1% 3% * Failure not sure why * * * * * Success 65% 58% 71% 55% 87% No opinion 1% 1% 1% 1% * Sampling Error +/-4.5 +/-6.0 +/-6.0 +/-5.5 +/-8.5 18- 35- 50- Under 45 and Total 34 49 64 65+ 45 Older ----- ----- ----- ----- ----- ----- ------ Failure personal shortcomings 26% N/A N/A 35% 32% 17% 34% Failure beyond his control 5% N/A N/A 5% 5% 5% 5% Failure due to other reasons 2% N/A N/A 4% 1% 2% 2% Failure not sure why * N/A N/A 1% * * * Success 65% N/A N/A 53% 62% 74% 57% No opinion 1% N/A N/A 2% * 1% 1% Sampling Error +/-4.5 +/-7.5 +/-7.5 +/-8.5 +/-5.0 White Non White Non Under $50K College College College College Total $50K or more Grad Grad Grad Grad ----- ----- ------- ------- -------- ------- ------- Failure personal shortcomings 26% 23% 26% 23% 28% 28% 39% Failure beyond his control 5% 4% 8% 4% 6% 5% 6% Failure due to other reasons 2% 3% 1% 1% 2% 1% 3% Failure not sure why * * 1% * * 1% * Success 65% 70% 62% 69% 63% 63% 51% No opinion 1% * 2% 2% * 2% 1% Sampling Error +/-4.5 +/-7.5 +/-6.0 +/-6.5 +/-6.0 +/-7.5 +/-7.0 Demo- Indep- Repub- Lib- Mod- Conser- Total crat endent lican eral erate vative ----- ----- ------ ------ ----- ----- ------- Failure personal shortcomings 26% 2% 26% N/A N/A 19% 56% Failure beyond his control 5% 1% 5% N/A N/A 4% 8% Failure due to other reasons 2% * 3% N/A N/A 3% 2% Failure not sure why * * * N/A N/A * * Success 65% 97% 63% N/A N/A 73% 33% No opinion 1% * 2% N/A N/A 1% 1% Sampling Error +/-4.5 +/-7.5 +/-6.5 +/-7.0 +/-8.0 North Mid- Sub- Total east west South West Urban urban Rural ----- ----- ----- ----- ----- ----- ----- ----- Failure personal shortcomings 26% N/A N/A 27% N/A 16% 20% N/A Failure beyond his control 5% N/A N/A 7% N/A 3% 9% N/A Failure due to other reasons 2% N/A N/A 3% N/A 2% 3% N/A Failure not sure why * N/A N/A * N/A * * N/A Success 65% N/A N/A 62% N/A 78% 67% N/A No opinion 1% N/A N/A 1% N/A 1% 1% N/A Sampling Error +/-4.5 +/-8.0 +/-8.0 +/-6.5 Lean Lean White All Demo- Repub- Trump Non Total Evang. Others crat lican Supporter Supporter ----- ----- ------ ------ ------ --------- --------- Failure personal shortcomings 26% N/A 20% 1% 54% 59% 5% Failure beyond his control 5% N/A 4% 1% 11% 13% 1% Failure due to other reasons 2% N/A 2% * 4% 5% * Failure not sure why * N/A * * * 1% * Success 65% N/A 72% 97% 30% 22% 92% No opinion 1% N/A 1% * * * 1% Sampling Error +/-4.5 +/-5.0 +/-6.5 +/-7.0 +/-7.0 +/-5.5 * percentage less than 1% CNN/ORC International Poll -- January 12 to 15, 2017 Question 11 In your view, is Barack Obama one of the greatest presidents, a good but not great president, an

POLL 1 -44- January 12-15, 2017
3
average president, or a poor president? Base = Half Sample Total Men Women White Non-White ----- ----- ----- ----- --------- One of the greatest 25% 15% 33% 19% 37% Good 25% 25% 25% 18% 32% Average 26% 32% 21% 28% 25% Poor 23% 27% 20% 34% 6% No opinion * * * * * Sampling Error +/-4.5 +/-6.0 +/-6.0 +/-5.0 +/-8.5 18- 35- 50- Under 45 and Total 34 49 64 65+ 45 Older ----- ----- ----- ----- ----- ----- ------ One of the greatest 25% N/A N/A 25% 20% 30% 22% Good 25% N/A N/A 25% 26% 25% 24% Average 26% N/A N/A 20% 21% 29% 24% Poor 23% N/A N/A 30% 33% 17% 29% No opinion * N/A N/A * 1% * * Sampling Error +/-4.5 +/-8.0 +/-7.5 +/-8.5 +/-5.0 White Non White Non Under $50K College College College College Total $50K or more Grad Grad Grad Grad ----- ----- ------- ------- -------- ------- ------- One of the greatest 25% 25% 29% 36% 20% 29% 14% Good 25% 31% 19% 19% 26% 20% 18% Average 26% 26% 29% 22% 29% 27% 29% Poor 23% 17% 24% 23% 24% 25% 38% No opinion * * * * * * * Sampling Error +/-4.5 +/-7.0 +/-6.5 +/-6.5 +/-6.0 +/-7.5 +/-7.5 Demo- Indep- Repub- Lib- Mod- Conser- Total crat endent lican eral erate vative ----- ----- ------ ------ ----- ----- ------- One of the greatest 25% 54% 17% 2% 48% 23% 9% Good 25% 30% 31% 6% 35% 23% 15% Average 26% 12% 31% 37% 13% 35% 30% Poor 23% 3% 21% 54% 4% 19% 46% No opinion * * * 1% * * * Sampling Error +/-4.5 +/-7.5 +/-7.0 +/-8.5 +/-8.5 +/-7.5 +/-7.5 North Mid- Sub- Total east west South West Urban urban Rural ----- ----- ----- ----- ----- ----- ----- ----- One of the greatest 25% N/A N/A 19% N/A 38% 20% N/A Good 25% N/A N/A 30% N/A 29% 29% N/A Average 26% N/A N/A 27% N/A 19% 28% N/A Poor 23% N/A N/A 24% N/A 14% 23% N/A No opinion * N/A N/A * N/A * * N/A Sampling Error +/-4.5 +/-7.5 +/-8.0 +/-6.5 Lean Lean White All Demo- Repub- Trump Non Total Evang. Others crat lican Supporter Supporter ----- ----- ------ ------ ------ --------- --------- One of the greatest 25% 6% 31% 48% 1% 5% 38% Good 25% 11% 29% 37% 10% 8% 34% Average 26% 31% 25% 12% 40% 38% 20% Poor 23% 52% 15% 4% 49% 49% 7% No opinion * 1% * * * * * Sampling Error +/-4.5 +/-8.5 +/-5.0 +/-6.5 +/-7.0 +/-7.0 +/-5.5 * percentage less than 1%

POLL 1 -45- January 12-15, 2017
3
CNN/ORC International Poll -- January 12 to 15, 2017 Question 12 Which comes closer to your view of Barack Obama as he prepares to leave the White House? Base = Total Sample Total Men Women White Non-White ----- ----- ----- ----- --------- I'm glad he is leaving, 41% 50% 32% 54% 16% I'll miss him when gone 58% 49% 67% 46% 81% No opinion 1% 1% 1% 1% 2% Sampling Error +/-3.0 +/-4.5 +/-4.5 +/-3.5 +/-6.0 18- 35- 50- Under 45 and Total 34 49 64 65+ 45 Older ----- ----- ----- ----- ----- ----- ------ I'm glad he is leaving, 41% 28% 47% 45% 45% 32% 48% I'll miss him when gone 58% 71% 51% 53% 55% 66% 52% No opinion 1% 1% 2% 1% * 2% 1% Sampling Error +/-3.0 +/-8.0 +/-7.5 +/-5.5 +/-5.5 +/-6.0 +/-3.5 White Non White Non Under $50K College College College College Total $50K or more Grad Grad Grad Grad ----- ----- ------- ------- -------- ------- ------- I'm glad he is leaving, 41% 36% 42% 36% 43% 43% 59% I'll miss him when gone 58% 63% 57% 63% 56% 56% 40% No opinion 1% 1% 1% 1% 1% 1% 1% Sampling Error +/-3.0 +/-5.0 +/-4.5 +/-4.5 +/-4.0 +/-5.5 +/-5.0 Demo- Indep- Repub- Lib- Mod- Conser- Total crat endent lican eral erate vative ----- ----- ------ ------ ----- ----- ------- I'm glad he is leaving, 41% 6% 42% 85% 7% 36% 75% I'll miss him when gone 58% 94% 56% 15% 93% 61% 24% No opinion 1% * 2% * * 3% 1% Sampling Error +/-3.0 +/-5.5 +/-5.0 +/-6.0 +/-6.0 +/-5.0 +/-5.5 North Mid- Sub- Total east west South West Urban urban Rural ----- ----- ----- ----- ----- ----- ----- ----- I'm glad he is leaving, 41% 35% 38% 43% 45% 27% 41% 61% I'll miss him when gone 58% 65% 61% 55% 53% 72% 58% 38% No opinion 1% * 1% 1% 3% 1% 1% 1% Sampling Error +/-3.0 +/-6.5 +/-6.5 +/-5.5 +/-6.5 +/-5.5 +/-4.5 +/-7.0 Lean Lean White All Demo- Repub- Trump Non Total Evang. Others crat lican Supporter Supporter ----- ----- ------ ------ ------ --------- --------- I'm glad he is leaving, 41% 75% 31% 6% 81% 83% 14% I'll miss him when gone 58% 24% 68% 94% 18% 16% 85% No opinion 1% * 2% * * 1% 1% Sampling Error +/-3.0 +/-6.5 +/-3.5 +/-4.5 +/-5.0 +/-5.0 +/-4.0 * percentage less than 1%

POLL 1 -46- January 12-15, 2017
3
CNN/ORC International Poll -- January 12 to 15, 2017 Question C1 How well are things going in the country today - very well, fairly well, pretty badly or very badly? Base = Total Sample Total Men Women White Non-White ----- ----- ----- ----- --------- Very well 5% 6% 4% 3% 9% Fairly well 45% 43% 47% 44% 49% Pretty badly 35% 37% 33% 37% 31% Very badly 15% 15% 15% 16% 10% No opinion 1% * 1% * 1% Sampling Error +/-3.0 +/-4.5 +/-4.5 +/-3.5 +/-6.0 18- 35- 50- Under 45 and Total 34 49 64 65+ 45 Older ----- ----- ----- ----- ----- ----- ------ Very well 5% 2% 5% 6% 7% 3% 6% Fairly well 45% 51% 38% 46% 46% 47% 44% Pretty badly 35% 39% 37% 31% 32% 36% 34% Very badly 15% 9% 19% 16% 15% 14% 15% No opinion 1% * * 1% 1% * 1% Sampling Error +/-3.0 +/-8.0 +/-7.5 +/-5.5 +/-5.5 +/-6.0 +/-3.5 White Non White Non Under $50K College College College College Total $50K or more Grad Grad Grad Grad ----- ----- ------- ------- -------- ------- ------- Very well 5% 3% 7% 6% 4% 4% 2% Fairly well 45% 41% 49% 47% 44% 47% 42% Pretty badly 35% 38% 33% 33% 36% 33% 40% Very badly 15% 18% 9% 14% 15% 15% 16% No opinion 1% * 1% 1% * 1% * Sampling Error +/-3.0 +/-5.0 +/-4.5 +/-4.5 +/-4.0 +/-5.5 +/-5.0 Demo- Indep- Repub- Lib- Mod- Conser- Total crat endent lican eral erate vative ----- ----- ------ ------ ----- ----- ------- Very well 5% 10% 2% 3% 7% 2% 6% Fairly well 45% 51% 43% 41% 55% 45% 36% Pretty badly 35% 23% 39% 44% 20% 43% 39% Very badly 15% 15% 16% 12% 16% 10% 18% No opinion 1% 1% 1% * 1% * * Sampling Error +/-3.0 +/-5.5 +/-5.0 +/-6.0 +/-6.0 +/-5.0 +/-5.5 North Mid- Sub- Total east west South West Urban urban Rural ----- ----- ----- ----- ----- ----- ----- ----- Very well 5% 4% 5% 4% 6% 6% 4% 5% Fairly well 45% 42% 44% 49% 44% 51% 43% 41% Pretty badly 35% 36% 35% 32% 38% 31% 38% 36% Very badly 15% 17% 16% 14% 12% 13% 14% 18% No opinion 1% * * 1% * * 1% * Sampling Error +/-3.0 +/-6.5 +/-6.5 +/-5.5 +/-6.5 +/-5.5 +/-4.5 +/-7.0 Lean Lean White All Demo- Repub- Trump Non Total Evang. Others crat lican Supporter Supporter ----- ----- ------ ------ ------ --------- --------- Very well 5% 4% 5% 8% 2% 3% 6% Fairly well 45% 38% 47% 52% 39% 32% 53% Pretty badly 35% 41% 33% 25% 45% 46% 28% Very badly 15% 17% 14% 14% 14% 19% 12% No opinion 1% * 1% * * * 1% Sampling Error +/-3.0 +/-6.5 +/-3.5 +/-4.5 +/-5.0 +/-5.0 +/-4.0 * percentage less than 1%

POLL 1 -47- January 12-15, 2017
3
CNN/ORC International Poll -- January 12 to 15, 2017 Question 15 Do you think the country will be better off or worse off four years from now? Base = Total Sample Total Men Women White Non-White ----- ----- ----- ----- --------- Better off 47% 58% 36% 55% 30% Worse off 48% 38% 58% 41% 61% Same 3% 2% 4% 3% 5% No opinion 2% 2% 2% 1% 4% Sampling Error +/-3.0 +/-4.5 +/-4.5 +/-3.5 +/-6.0 18- 35- 50- Under 45 and Total 34 49 64 65+ 45 Older ----- ----- ----- ----- ----- ----- ------ Better off 47% 38% 50% 50% 51% 41% 51% Worse off 48% 56% 47% 44% 43% 54% 43% Same 3% 4% 1% 4% 5% 3% 4% No opinion 2% 1% 3% 2% 2% 2% 2% Sampling Error +/-3.0 +/-8.0 +/-7.5 +/-5.5 +/-5.5 +/-6.0 +/-3.5 White Non White Non Under $50K College College College College Total $50K or more Grad Grad Grad Grad ----- ----- ------- ------- -------- ------- ------- Better off 47% 42% 47% 38% 50% 43% 61% Worse off 48% 53% 48% 57% 44% 53% 35% Same 3% 4% 3% 3% 3% 2% 3% No opinion 2% 2% 2% 2% 2% 2% * Sampling Error +/-3.0 +/-5.0 +/-4.5 +/-4.5 +/-4.0 +/-5.5 +/-5.0 Demo- Indep- Repub- Lib- Mod- Conser- Total crat endent lican eral erate vative ----- ----- ------ ------ ----- ----- ------- Better off 47% 11% 49% 90% 14% 42% 79% Worse off 48% 84% 45% 7% 81% 51% 18% Same 3% 4% 4% 1% 5% 3% 2% No opinion 2% 1% 3% 2% 1% 4% 1% Sampling Error +/-3.0 +/-5.5 +/-5.0 +/-6.0 +/-6.0 +/-5.0 +/-5.5 North Mid- Sub- Total east west South West Urban urban Rural ----- ----- ----- ----- ----- ----- ----- ----- Better off 47% 43% 46% 49% 47% 37% 44% 65% Worse off 48% 53% 50% 43% 49% 59% 48% 32% Same 3% 3% 3% 5% 1% 2% 6% 1% No opinion 2% 1% 1% 3% 2% 1% 2% 2% Sampling Error +/-3.0 +/-6.5 +/-6.5 +/-5.5 +/-6.5 +/-5.5 +/-4.5 +/-7.0 Lean Lean White All Demo- Repub- Trump Non Total Evang. Others crat lican Supporter Supporter ----- ----- ------ ------ ------ --------- --------- Better off 47% 79% 37% 12% 87% 90% 19% Worse off 48% 19% 57% 82% 11% 5% 76% Same 3% 2% 4% 4% 1% 3% 3% No opinion 2% 1% 2% 1% 1% 2% 2% Sampling Error +/-3.0 +/-6.5 +/-3.5 +/-4.5 +/-5.0 +/-5.0 +/-4.0 * percentage less than 1%

POLL 1 -48- January 12-15, 2017
3
CNN/ORC International Poll -- January 12 to 15, 2017 Question E1 How would you rate the economic conditions in the country today -- as very good, somewhat good, somewhat poor or very poor? Base = Total Sample Total Men Women White Non-White ----- ----- ----- ----- --------- Very good 8% 9% 7% 6% 12% Somewhat good 49% 46% 52% 47% 56% Somewhat poor 30% 31% 28% 34% 22% Very poor 13% 13% 13% 13% 10% No opinion * * * * * Sampling Error +/-3.0 +/-4.5 +/-4.5 +/-3.5 +/-6.0 18- 35- 50- Under 45 and Total 34 49 64 65+ 45 Older ----- ----- ----- ----- ----- ----- ------ Very good 8% 8% 8% 7% 10% 8% 8% Somewhat good 49% 45% 51% 51% 52% 46% 52% Somewhat poor 30% 37% 27% 29% 23% 33% 27% Very poor 13% 10% 14% 12% 15% 12% 13% No opinion * * * * * * * Sampling Error +/-3.0 +/-8.0 +/-7.5 +/-5.5 +/-5.5 +/-6.0 +/-3.5 White Non White Non Under $50K College College College College Total $50K or more Grad Grad Grad Grad ----- ----- ------- ------- -------- ------- ------- Very good 8% 5% 11% 11% 6% 9% 4% Somewhat good 49% 50% 51% 54% 48% 52% 45% Somewhat poor 30% 30% 26% 26% 31% 29% 36% Very poor 13% 14% 10% 9% 14% 9% 15% No opinion * * * 1% * 1% * Sampling Error +/-3.0 +/-5.0 +/-4.5 +/-4.5 +/-4.0 +/-5.5 +/-5.0 Demo- Indep- Repub- Lib- Mod- Conser- Total crat endent lican eral erate vative ----- ----- ------ ------ ----- ----- ------- Very good 8% 16% 4% 4% 13% 7% 5% Somewhat good 49% 57% 49% 38% 61% 50% 39% Somewhat poor 30% 19% 32% 41% 19% 33% 37% Very poor 13% 8% 15% 17% 8% 10% 19% No opinion * * * * * * * Sampling Error +/-3.0 +/-5.5 +/-5.0 +/-6.0 +/-6.0 +/-5.0 +/-5.5 North Mid- Sub- Total east west South West Urban urban Rural ----- ----- ----- ----- ----- ----- ----- ----- Very good 8% 8% 7% 7% 10% 7% 11% 3% Somewhat good 49% 50% 51% 51% 43% 51% 51% 42% Somewhat poor 30% 30% 25% 31% 32% 28% 28% 36% Very poor 13% 13% 16% 10% 15% 13% 9% 19% No opinion * * * * 1% * * * Sampling Error +/-3.0 +/-6.5 +/-6.5 +/-5.5 +/-6.5 +/-5.5 +/-4.5 +/-7.0 Lean Lean White All Demo- Repub- Trump Non Total Evang. Others crat lican Supporter Supporter ----- ----- ------ ------ ------ --------- --------- Very good 8% 5% 9% 13% 3% 2% 11% Somewhat good 49% 42% 51% 59% 38% 35% 59% Somewhat poor 30% 40% 27% 20% 43% 42% 22% Very poor 13% 13% 13% 8% 16% 20% 8% No opinion * * * * * * * Sampling Error +/-3.0 +/-6.5 +/-3.5 +/-4.5 +/-5.0 +/-5.0 +/-4.0 * percentage less than 1%

POLL 1 -49- January 12-15, 2017
3
CNN/ORC International Poll -- January 12 to 15, 2017 Question 17 Now thinking about a year from now, do you expect economic conditions in this country will be very good, somewhat good, somewhat poor or very poor? Base = Half Sample Total Men Women White Non-White ----- ----- ----- ----- --------- Very good 10% 9% 11% 9% 10% Somewhat good 52% 60% 44% 56% 42% Somewhat poor 27% 23% 32% 24% 37% Very poor 10% 8% 13% 10% 10% No opinion 1% * 1% * 1% Sampling Error +/-4.5 +/-6.0 +/-6.0 +/-5.5 +/-8.5 18- 35- 50- Under 45 and Total 34 49 64 65+ 45 Older ----- ----- ----- ----- ----- ----- ------ Very good 10% N/A N/A 11% 8% 9% 10% Somewhat good 52% N/A N/A 55% 54% 49% 55% Somewhat poor 27% N/A N/A 21% 29% 32% 24% Very poor 10% N/A N/A 11% 10% 10% 11% No opinion 1% N/A N/A 2% * * 1% Sampling Error +/-4.5 +/-7.5 +/-7.5 +/-8.5 +/-5.0 White Non White Non Under $50K College College College College Total $50K or more Grad Grad Grad Grad ----- ----- ------- ------- -------- ------- ------- Very good 10% 8% 10% 11% 9% 7% 10% Somewhat good 52% 49% 51% 45% 55% 50% 59% Somewhat poor 27% 32% 26% 35% 25% 34% 19% Very poor 10% 10% 13% 10% 11% 9% 11% No opinion 1% 1% * * 1% * * Sampling Error +/-4.5 +/-7.5 +/-6.0 +/-6.5 +/-6.0 +/-7.5 +/-7.0 Demo- Indep- Repub- Lib- Mod- Conser- Total crat endent lican eral erate vative ----- ----- ------ ------ ----- ----- ------- Very good 10% 6% 6% N/A N/A 6% 16% Somewhat good 52% 29% 58% N/A N/A 54% 67% Somewhat poor 27% 50% 24% N/A N/A 32% 9% Very poor 10% 15% 10% N/A N/A 9% 7% No opinion 1% * 1% N/A N/A * * Sampling Error +/-4.5 +/-7.5 +/-6.5 +/-7.0 +/-8.0 North Mid- Sub- Total east west South West Urban urban Rural ----- ----- ----- ----- ----- ----- ----- ----- Very good 10% N/A N/A 15% N/A 9% 8% N/A Somewhat good 52% N/A N/A 53% N/A 49% 52% N/A Somewhat poor 27% N/A N/A 26% N/A 31% 28% N/A Very poor 10% N/A N/A 5% N/A 12% 11% N/A No opinion 1% N/A N/A 1% N/A * 1% N/A Sampling Error +/-4.5 +/-8.0 +/-8.0 +/-6.5 Lean Lean White All Demo- Repub- Trump Non Total Evang. Others crat lican Supporter Supporter ----- ----- ------ ------ ------ --------- --------- Very good 10% N/A 7% 5% 16% 18% 3% Somewhat good 52% N/A 47% 33% 72% 72% 39% Somewhat poor 27% N/A 32% 49% 5% 4% 44% Very poor 10% N/A 12% 14% 7% 6% 13% No opinion 1% N/A 1% * * * 1% Sampling Error +/-4.5 +/-5.0 +/-6.5 +/-7.0 +/-7.0 +/-5.5 * percentage less than 1%

POLL 1 -50- January 12-15, 2017
3
CNN/ORC International Poll -- January 12 to 15, 2017 Question 18 Thinking about your personal financial situation, about a year from now, do you expect your financial situation to be better than it is today, worse than it is today or about the same as it is today? Base = Half Sample Total Men Women White Non-White ----- ----- ----- ----- --------- Better 40% 46% 35% 35% 49% Worse 11% 7% 16% 10% 16% About the Same 48% 47% 49% 54% 36% No opinion 1% 1% 1% 1% * Sampling Error +/-4.5 +/-6.0 +/-6.0 +/-5.0 +/-8.5 18- 35- 50- Under 45 and Total 34 49 64 65+ 45 Older ----- ----- ----- ----- ----- ----- ------ Better 40% N/A N/A 30% 18% 54% 28% Worse 11% N/A N/A 16% 16% 9% 14% About the Same 48% N/A N/A 54% 62% 37% 56% No opinion 1% N/A N/A * 4% * 1% Sampling Error +/-4.5 +/-8.0 +/-7.5 +/-8.5 +/-5.0 White Non White Non Under $50K College College College College Total $50K or more Grad Grad Grad Grad ----- ----- ------- ------- -------- ------- ------- Better 40% 38% 43% 40% 40% 38% 33% Worse 11% 16% 9% 11% 12% 7% 11% About the Same 48% 44% 48% 48% 47% 53% 55% No opinion 1% 1% * 1% 1% 1% 1% Sampling Error +/-4.5 +/-7.0 +/-6.5 +/-6.5 +/-6.0 +/-7.5 +/-7.5 Demo- Indep- Repub- Lib- Mod- Conser- Total crat endent lican eral erate vative ----- ----- ------ ------ ----- ----- ------- Better 40% 28% 45% 47% 36% 41% 44% Worse 11% 17% 10% 6% 15% 9% 10% About the Same 48% 54% 44% 45% 48% 50% 44% No opinion 1% 1% * 2% 1% 1% 1% Sampling Error +/-4.5 +/-7.5 +/-7.0 +/-8.5 +/-8.5 +/-7.5 +/-7.5 North Mid- Sub- Total east west South West Urban urban Rural ----- ----- ----- ----- ----- ----- ----- ----- Better 40% N/A N/A 38% N/A 39% 44% N/A Worse 11% N/A N/A 13% N/A 9% 11% N/A About the Same 48% N/A N/A 49% N/A 51% 44% N/A No opinion 1% N/A N/A * N/A 1% 1% N/A Sampling Error +/-4.5 +/-7.5 +/-8.0 +/-6.5 Lean Lean White All Demo- Repub- Trump Non Total Evang. Others crat lican Supporter Supporter ----- ----- ------ ------ ------ --------- --------- Better 40% 41% 40% 30% 51% 56% 30% Worse 11% 7% 13% 15% 7% 6% 15% About the Same 48% 52% 46% 54% 41% 37% 54% No opinion 1% * 1% 1% 1% 1% 1% Sampling Error +/-4.5 +/-8.5 +/-5.0 +/-6.5 +/-7.0 +/-7.0 +/-5.5 * percentage less than 1%