embargoed for release: monday, march 18 at 4:00...
TRANSCRIPT

1 Braxton Way Suite 125 Glen Mills, PA 19342
484-840-4300 www.ssrs.com
POLL4 @ssrs_research | 484.840.4300 | www.ssrs.com | 1
The study was conducted for CNN via telephone by SSRS, an independent research company. Interviews were conducted from March 14 to March 17, 2019 among a sample of 1,003 respondents. The landline total
respondents were 348 and there were 655 cell phone respondents. The margin of sampling error for total respondents is +/- 3.8 at the 95% confidence level. The design effect is 1.48. More information about SSRS can be
obtained by visiting www.ssrs.com. Unless otherwise noted, results beginning with the March 31-April 2, 2006 survey and ending with the April 22-25, 2017 survey are from surveys conducted by ORC International. Results
before March 31, 2006 are from surveys conducted by Gallup.
EMBARGOED FOR RELEASE: Monday, March 18 at 4:00 p.m.
Q1. (A1) Do you approve or disapprove of the way Donald Trump is handling his job as president?
Approve Disapprove No opinion
March 14-17, 2019 42% 51% 8%
Jan. 30-Feb. 02, 2019 40% 55% 5%
January 10-11, 2019 37% 57% 7%
December 06-09, 2018 39% 52% 9%
November 01-03, 2018 39% 55% 6% October 04-07, 2018 41% 52% 7%
September 06-09, 2018 36% 58% 6%
August 09-12, 2018 42% 53% 5%
June 14-17, 2018 39% 54% 7%
May 02-05, 2018 41% 53% 6%
March 22-25, 2018 42% 54% 5%
February 20-23, 2018 35% 58% 7%
January 14-18, 2018 40% 55% 5%
December 14-17, 2017 35% 59% 6%
November 02-05, 2017 36% 58% 6%
October 12-15, 2017 37% 57% 6%
September 26-28, 2017 37% 56% 7%
September 17-20, 2017 40% 55% 5%
August 03-06, 2017 38% 56% 5%
April 22-25, 2017 44% 54% 2%
March 01-04, 2017 45% 52% 3%
Jan. 31-Feb. 02, 2017 44% 53% 3%

1 Braxton Way Suite 125 Glen Mills, PA 19342
484-840-4300 www.ssrs.com
POLL4 @ssrs_research | 484.840.4300 | www.ssrs.com | 2
Q2. (A2) Do you approve or disapprove of the way Donald Trump is handling (INSERT ITEM)?
The economy Approve Disapprove No opinion
March 14-17, 2019 51% 42% 6%
Jan. 30-Feb. 02, 2019 48% 45% 7%
December 06-09, 2018 49% 41% 10%
November 01-03, 2018 53% 42% 5%
October 04-07, 2018 51% 42% 7% September 06-09, 2018 49% 44% 7%
August 09-12, 2018* 49% 47% 4%
June 14-17, 2018 49% 43% 9%
May 02-05, 2018 52% 42% 6%
March 22-25, 2018 48% 45% 7%
February 20-23, 2018 46% 47% 7% January 14-18, 2018 49% 43% 8%
December 14-17, 2017 44% 49% 6%
November 02-05, 2017 45% 46% 9%
September 17-20, 2017 45% 47% 8%
August 03-06, 2017 45% 47% 8%
April 22-25, 2017 49% 47% 4% March 01-04, 2017* 55% 41% 4%
Jan. 31-Feb. 02, 2017 49% 43% 9%
* Asked of half sample
Immigration Approve Disapprove No opinion
March 14-17, 2019 39% 58% 3% Jan. 30-Feb. 02, 2019 41% 54% 5%
December 06-09, 2018 39% 54% 7%
November 01-03, 2018 37% 59% 4%
October 04-07, 2018 39% 56% 5%
September 06-09, 2018 35% 59% 6%
August 09-12, 2018 37% 58% 4% June 14-17, 2018 35% 59% 6%
May 02-05, 2018 40% 55% 5%
February 20-23, 2018 36% 60% 5%
January 14-18, 2018 38% 57% 5%
November 02-05, 2017 37% 57% 6% October 12-15, 2017 37% 59% 5%
September 17-20, 2017 36% 60% 4%
August 03-06, 2017* 40% 55% 5%
April 22-25, 2017 41% 57% 2%
March 01-04, 2017 44% 55% 1%
Jan. 31-Feb. 02, 2017 42% 56% 2% * Asked of half sample

1 Braxton Way Suite 125 Glen Mills, PA 19342
484-840-4300 www.ssrs.com
POLL4 @ssrs_research | 484.840.4300 | www.ssrs.com | 3
Q2. (A2) Do you approve or disapprove of the way Donald Trump is handling (INSERT ITEM)? (CONTINUED)
Foreign affairs Approve Disapprove No opinion
March 14-17, 2019 40% 54% 7%
Jan. 30-Feb. 02, 2019 40% 54% 6%
December 06-09, 2018* 36% 54% 10%
November 01-03, 2018 39% 56% 5%
October 04-07, 2018 41% 52% 7% September 06-09, 2018 36% 56% 8%
August 09-12, 2018 40% 55% 5%
June 14-17, 2018 39% 53% 9%
May 02-05, 2018 42% 51% 7%
March 22-25, 2018 39% 53% 8%
January 14-18, 2018 35% 56% 9% November 02-05, 2017 34% 59% 7%
September 17-20, 2017* 36% 58% 7%
August 03-06, 2017* 35% 61% 4%
April 22-25, 2017 43% 56% 1%
March 01-04, 2017* 41% 54% 5%
Jan. 31-Feb. 02, 2017 40% 55% 4% * Asked of half sample
The federal budget Approve Disapprove No opinion
March 14-17, 2019 34% 56% 10%
September 17-20, 2017* 33% 50% 17%
March 1-4, 2017* 47% 46% 8% * Asked of half sample
Taxes Approve Disapprove No opinion
March 14-17, 2019 42% 49% 9%
November 01-03, 2018 43% 49% 8%
August 09-12, 2018 45% 46% 9% January 14-18, 2018 42% 46% 12%
December 14-17, 2017 34% 57% 9%
November 2-5, 2017 35% 51% 14%
October 12-15, 2017 36% 50% 14%
September 17-20, 2017 34% 47% 19% August 03-06, 2017* 34% 48% 18%
March 1-4, 2017* 43% 48% 9%
* Asked of half sample

1 Braxton Way Suite 125 Glen Mills, PA 19342
484-840-4300 www.ssrs.com
POLL4 @ssrs_research | 484.840.4300 | www.ssrs.com | 4
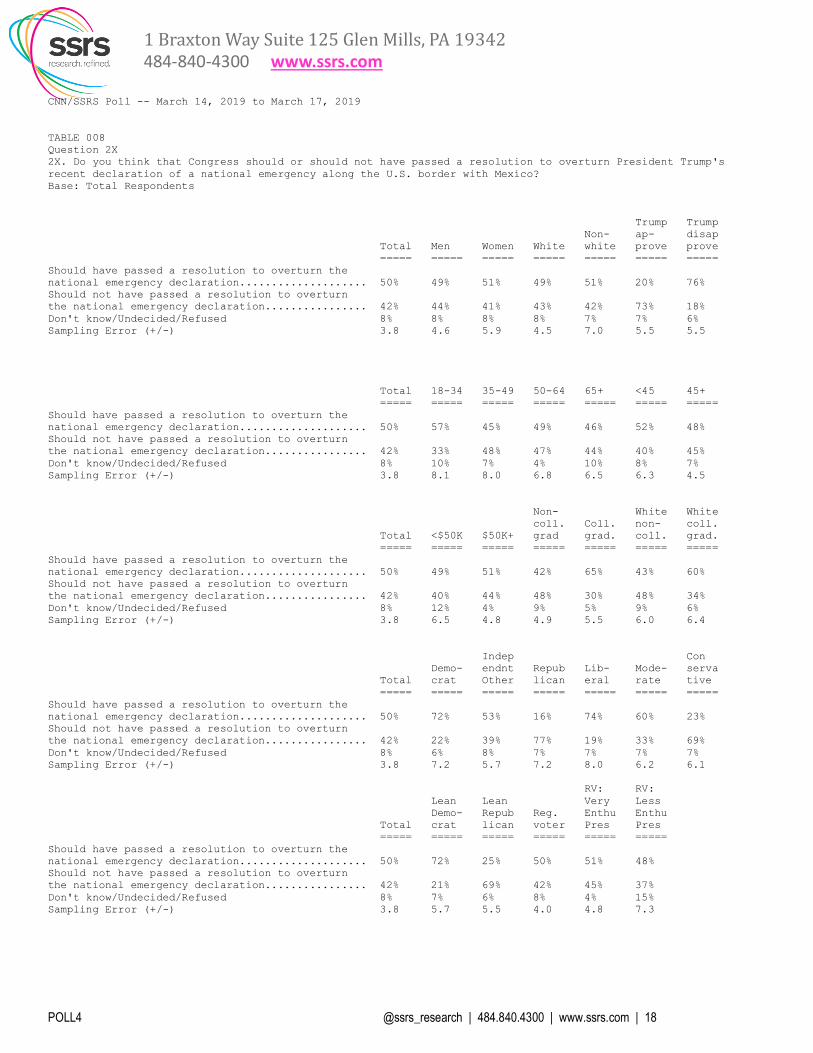
Q2x. Do you think that Congress should or should not have passed a resolution to overturn President Trump’s recent declaration of a national emergency along the U.S. border with Mexico?
Should have passed a resolution to overturn
Trump’s national emergency declaration
Should not have passed a resolution to overturn
Trump’s national emergency declaration
No opinion
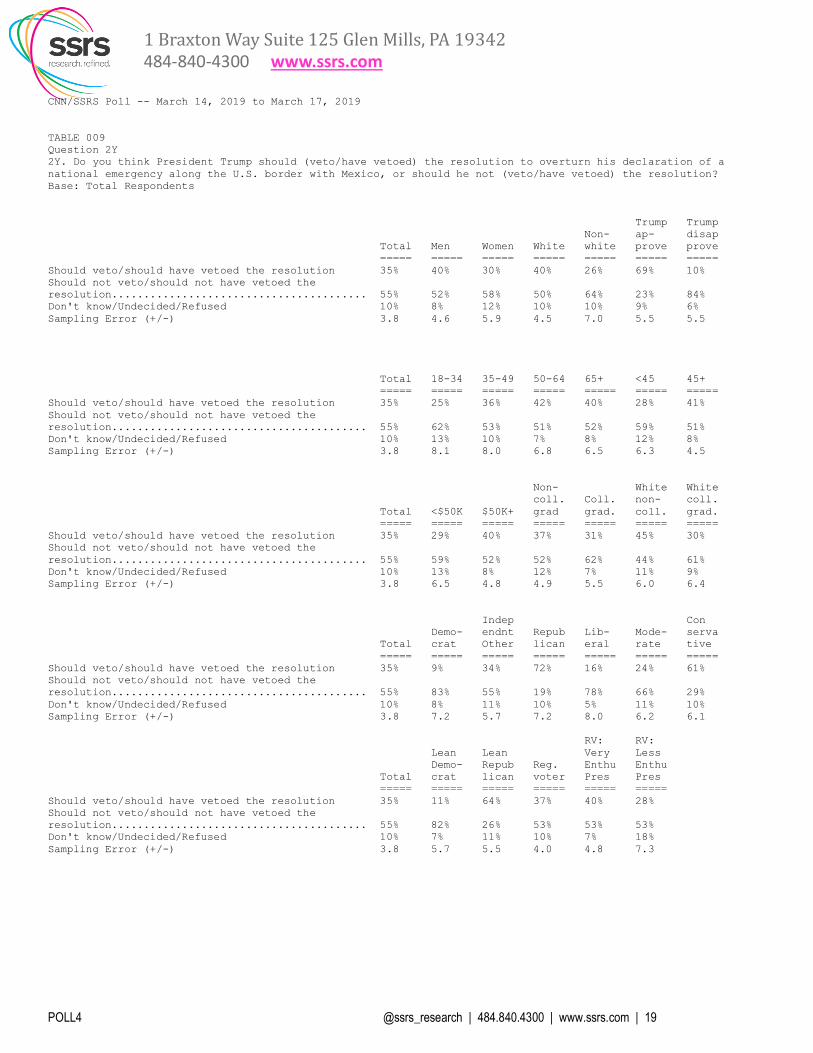
March 14-17, 2019 50% 42% 8% Q2y. Do you think President Trump should have vetoed the resolution to overturn his declaration of a national emergency along the U.S. border with Mexico, or should he not have vetoed the resolution?
Should have vetoed the resolution
Should not have vetoed the resolution
No opinion
March 14-17, 2019 35% 55% 10%
* QUESTION WORDING for interviews conducted prior to the veto: Do you think President Trump should veto the resolution to overturn his declaration of a national emergency along the U.S. border with Mexico, or should he not veto the resolution?

1 Braxton Way Suite 125 Glen Mills, PA 19342
484-840-4300 www.ssrs.com
POLL4 @ssrs_research | 484.840.4300 | www.ssrs.com | 5
Q6. (E1) How would you rate the economic conditions in the country today -- as very good, somewhat good, somewhat poor, or very poor?
NET
Good Very good
Somewhat good
NET Poor
Somewhat poor
Very poor
No opinion
March 14-17, 2019 71% 26% 45% 27% 19% 8% 3%
December 06-09, 2018 67% 17% 50% 31% 21% 10% 2%
September 06-09, 2018 69% 26% 44% 28% 17% 11% 3% June 14-17, 2018 66% 22% 44% 32% 21% 11% 2%
January 14-18, 2018 69% 20% 49% 29% 21% 9% 1%
November 02-05, 2017 68% 17% 51% 30% 20% 10% 2%
September 17-20, 2017 63% 10% 53% 35% 24% 11% 2%
April 22-25, 2017* 59% 8% 51% 41% 27% 14% *
January 12-15, 2017 57% 8% 49% 43% 30% 13% * November 17-20, 2016 48% 5% 43% 51% 34% 17% *
September 01-04, 2016 53% 9% 44% 47% 29% 18% *
June 16-19, 2016 45% 5% 40% 54% 35% 19% *
Apr. 28-May 1, 2016 48% 4% 44% 52% 31% 22% 1%
February 24-27, 2016 46% 4% 42% 53% 28% 25% *
December 17-21, 2015 49% 6% 43% 51% 31% 20% * September 04-08, 2015 48% 6% 42% 51% 30% 21% *
July 22-25, 2015 41% 5% 36% 59% 36% 23% *
April 16-19, 2015 52% 5% 47% 48% 31% 17% *
February 12-15, 2015 48% 4% 44% 52% 34% 18% *
December 18-21, 2014 51% 5% 46% 49% 30% 19% *
October 24-26, 2014 38% 5% 33% 62% 37% 25% * September 25-28, 2014 42% 2% 40% 57% 36% 21% 1%
July 18-20, 2014 41% 4% 37% 58% 33% 25% *
May 2-4, 2014 38% 2% 36% 62% 33% 29% *
Jan. 31-Feb. 02, 2014 36% 1% 35% 64% 36% 28% *
December 16-19, 2013 32% 2% 30% 68% 36% 32% *
October 18-20, 2013 29% 1% 28% 71% 35% 36% * September 27-29, 2013 33% 1% 32% 67% 31% 36% *
June 11-13, 2013 35% 1% 34% 65% 40% 25% *
May 17-18, 2013 33% 3% 30% 67% 38% 29% *
March 15-17, 2013 31% 3% 28% 69% 37% 32% *
December 17-18, 2012 26% 1% 25% 74% 37% 37% * November 02-04, 2012* 28% 3% 25% 71% 35% 36% 1%
September 28-30, 2012 (RV) 27% 1% 26% 73% 39% 34% *
September 7-9, 2012 (RV) 32% 1% 31% 68% 35% 33% *
June 28-July 1, 2012 27% 2% 25% 73% 39% 34% *
May 29-31, 2012 31% 2% 29% 69% 39% 30% *
March 24-25, 2012 31% * 31% 69% 42% 27% * January 11-12, 2012 18% 1% 17% 80% 42% 38% *
November 18-20, 2011 15% 1% 14% 85% 34% 51% *
October 14-16, 2011 13% * 13% 86% 39% 47% 1%
September 23-25, 2011 10% 1% 9% 90% 40% 50% *
September 09-11, 2011 14% 1% 13% 85% 41% 44% *
*Asked of a half sample (FURTHER TRENDS ON NEXT PAGE)

1 Braxton Way Suite 125 Glen Mills, PA 19342
484-840-4300 www.ssrs.com
POLL4 @ssrs_research | 484.840.4300 | www.ssrs.com | 6
Q6. (E1) How would you rate the economic conditions in the country today -- as very good, somewhat good, somewhat poor, or very poor? (CONTINUED)
NET
Good Very good
Somewhat good
NET Poor
Somewhat poor
Very poor
No opinion
July 18-20, 2011 16% * 16% 84% 38% 46% *
June 3-7, 2011 19% 1% 18% 81% 40% 41% *
Apr. 29-May 1, 2011 18% 1% 17% 82% 44% 38% * March 11-13, 2011 16% 1% 15% 84% 42% 42% *
January 14-16, 2011 24% 1% 23% 75% 40% 35% 1%
November 11-14, 2010 18% 1% 17% 81% 37% 44% 1%
September 1-2, 2010 18% 1% 17% 81% 37% 44% *
July 16-21, 2010 22% 1% 21% 78% 41% 37% *
May 21-23, 2010 22% 1% 21% 78% 41% 37% * March 25-28, 2010 21% 1% 20% 78% 39% 39% *
February 12-15, 2010 17% 2% 15% 83% 39% 44% *
January 08-10, 2010 20% 2% 18% 80% 42% 38% *
December 16-20, 2009 20% 1% 19% 80% 38% 42% *
November 13-15, 2009 18% 1% 17% 82% 39% 43% *
October 16-18, 2009 16% 2% 14% 84% 42% 42% * July 31-Aug. 3, 2009 21% 2% 19% 79% 44% 35% *
June 26-28, 2009 20% 2% 18% 80% 39% 41% *
April 23-26, 2009 17% 1% 16% 83% 46% 37% *
March 12-15, 2009 11% 1% 10% 89% 41% 48% *
January 12-15, 2009 13% 2% 11% 86% 36% 50% *
December 19-21, 2008 8% 2% 6% 93% 27% 66% * Oct. 30-Nov. 1, 2008 16% 3% 13% 83% 29% 54% 2%
October 03-05, 2008 16% 2% 14% 84% 31% 53% *
September 19-21, 2008 19% 1% 18% 81% 34% 47% *
August 23-24, 2008 25% 4% 21% 75% 32% 43% *
June 4-5, 2008 22% 3% 19% 78% 39% 39% *
March 14-16, 2008 26% 4% 22% 75% 35% 40% * January 14-17, 2008 40% 4% 36% 59% 40% 19% *
December 6-9, 2007 46% 6% 40% 54% 33% 21% 1%
September 7-9, 2007 54% 9% 45% 45% 28% 17% *
August 6-8, 2007 56% 11% 45% 43% 26% 17% 1%
May 4-6, 2007 61% 18% 43% 39% 25% 14% 1% March 9-11, 2007 52% 10% 42% 46% 31% 15% 1%
January 19-21, 2007 63% 15% 48% 36% 23% 13% 1%
November 3-5, 2006 49% 8% 41% 50% 32% 18% 1%
October 27-29, 2006 62% 13% 49% 37% 24% 13% 1%
September 23-24, 2006 59% 12% 47% 41% 26% 15% *
August 30-Sep. 2, 2006 44% 9% 35% 56% 34% 22% * June 14-15, 2006 51% 9% 42% 47% 31% 16% 2%
May 7-9, 2006 52% 10% 42% 47% 26% 21% 1%
(FURTHER TRENDS ON NEXT PAGE)

1 Braxton Way Suite 125 Glen Mills, PA 19342
484-840-4300 www.ssrs.com
POLL4 @ssrs_research | 484.840.4300 | www.ssrs.com | 7
Q6. (E1) How would you rate the economic conditions in the country today -- as very good, somewhat good, somewhat poor, or very poor? (CONTINUED)
NET
Good Very good
Somewhat good
NET Poor
Somewhat poor
Very poor
No opinion
March 10-12, 2006 59% 13% 46% 41% 26% 15% *
September 8-11, 2005* 53% 7% 46% 47% 34% 13% *
Apr. 29-May 1, 2005 50% 5% 45% 49% 33% 16% 1% December 17-19, 2004 53% 8% 45% 47% 28% 19% *
Jan. 29-Feb. 1, 2004 52% 5% 47% 47% 28% 19% 1%
December 5-7, 2003 57% 7% 50% 42% 30% 12% 1%
October 10-12, 2003 44% 4% 40% 56% 37% 19% *
March 14-15, 2003 35% 2% 33% 64% 39% 25% 1%
February 24-26, 2003 34% 3% 31% 65% 43% 22% 1% December 9-10, 2002 44% 3% 41% 55% 41% 14% 1%
October 21-22, 2002 41% 3% 38% 58% 42% 16% 1%
September 20-22, 2002 54% 5% 49% 46% 35% 11% *
July 26-28, 2002 51% 5% 46% 49% 37% 12% *
June 28-30, 2002 58% 5% 53% 42% 33% 9% *
April 5-7, 2002 61% 6% 55% 39% 30% 9% * January 11-14, 2002 57% 7% 50% 42% 32% 10% 1%
December 14-16, 2001 50% 5% 45% 49% 37% 12% 1%
September 21-22, 2001 57% 7% 50% 42% 34% 8% 1%
April 20-22, 2001 67% 10% 57% 32% 25% 7% 1%
February 9-11, 2001 80% 16% 64% 19% 16% 3% 1%
January 15-16, 2001 82% 24% 58% 18% 14% 4% * June 6-7, 2000 85% 39% 46% 14% 9% 5% 1%
March 10-12, 2000 86% 42% 44% 13% 10% 3% 1%
June 25-27, 1999 84% 34% 50% 16% 10% 6% *
Jane 8-10, 1999 89% 41% 48% 11% 8% 3% *
July 7-8, 1998 79% 29% 50% 20% 15% 5% 1%
January 25-26, 1998 81% 24% 57% 18% 14% 4% 1% January 24-25, 1998 81% 24% 57% 19% 13% 5% 1%
January 23-24, 1998 81% 24% 57% 19% 15% 4% *
October 27-29, 1997 79% 24% 55% 19% 15% 4% 2%
August 22-25, 1997 69% 17% 52% 30% 21% 9% 1%
*Asked of a half sample

1 Braxton Way Suite 125 Glen Mills, PA 19342
484-840-4300 www.ssrs.com
POLL4 @ssrs_research | 484.840.4300 | www.ssrs.com | 8
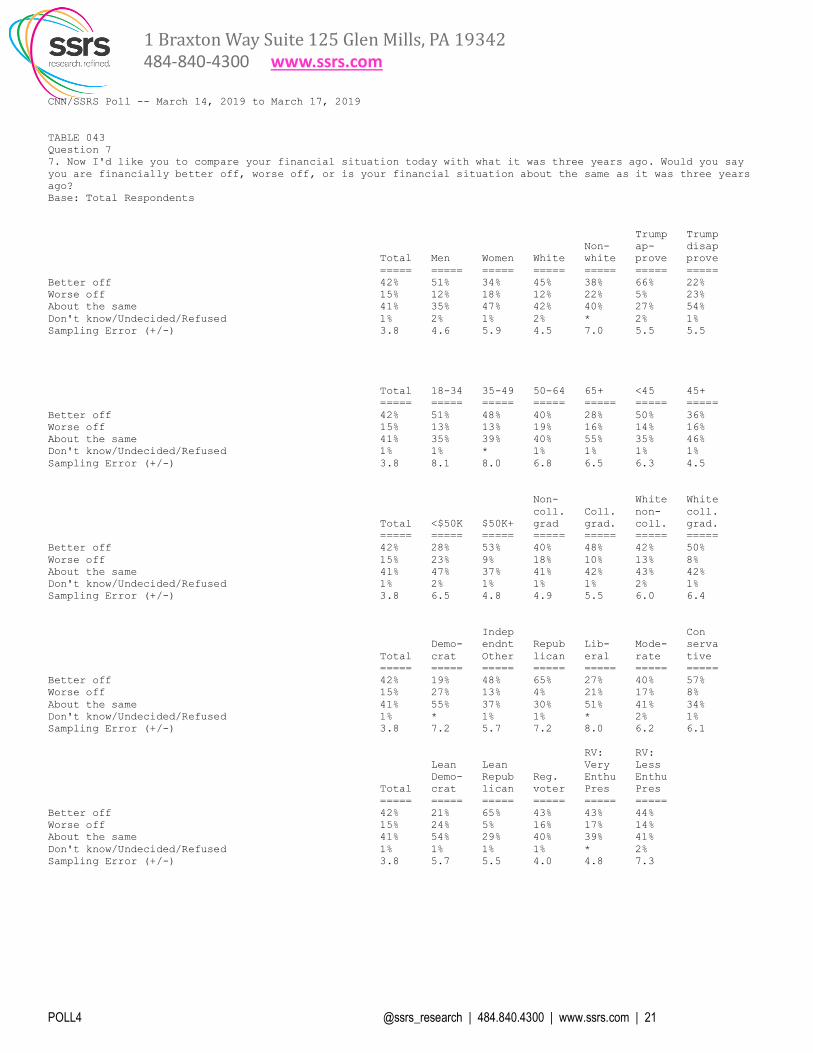
Q7. Now I'd like you to compare your financial situation today with what it was three years ago. Would you say you are financially better off, worse off, or is your financial situation about the same as it was three years ago?
Better off Worse off About the same No opinion
March 14-17, 2019 42% 15% 41% 1%

1 Braxton Way Suite 125 Glen Mills, PA 19342
484-840-4300 www.ssrs.com
POLL4 @ssrs_research | 484.840.4300 | www.ssrs.com | 9
Q8. Which of the following statements comes closest to your views about the relationship between government and businesses?
You think the
free market can be trusted to do what is best for the country and no government
regulation of business is necessary
You trust the free market
more than the government but there should be
some government regulation of
business
You trust the government
more than the free market but the government
should not interfere in
every decision that businesses
make
You think there should not be a free market and
all economic decisions should be made by the
government
No opinion
March 14-17, 2019 10% 62% 23% 2% 4% September 9-11, 2011 10% 56% 28% 5% 1%
Q9a. Overall, how much do you trust big technology companies such as Google, Facebook or Amazon to do what is best for the economy -- a great deal, somewhat, a little, or not at all?
A great deal Somewhat A little Not at all No opinion March 14-17, 2019 8% 33% 28% 29% 2%
A great
deal
Somewhat
A little
Not at all No opinion Wall Street bankers and brokers 2011 Oct 14-16* 3% 20% 22% 54% 1%
*QUESTION WORDING: Overall, how much do you trust Wall Street bankers and brokers to do what is best for the economy -- a great deal, somewhat, a little, or not at all?
COMPARE TO: CNN/TIME/YANKELOVICH
A great
deal
Somewhat
A little
Not at all No opinion Wall Street bankers and brokers 1994 Mar 9-10* 5% 28% 32% 30% 5% 1990 Feb 14* 4% 30% 33% 30% 3%
*QUESTION WORDING: Overall, how much do you trust Wall Street bankers and brokers to do what is best for the economy -- a great deal, somewhat, a little, or not at all?
Q9b. Overall, how much do you trust big technology companies such as Google, Facebook or Amazon to do what is best for their users -- a great deal, somewhat, a little, or not at all?
A great deal Somewhat A little Not at all No opinion
March 14-17, 2019 8% 33% 29% 29% 2%

1 Braxton Way Suite 125 Glen Mills, PA 19342
484-840-4300 www.ssrs.com
POLL4 @ssrs_research | 484.840.4300 | www.ssrs.com | 10
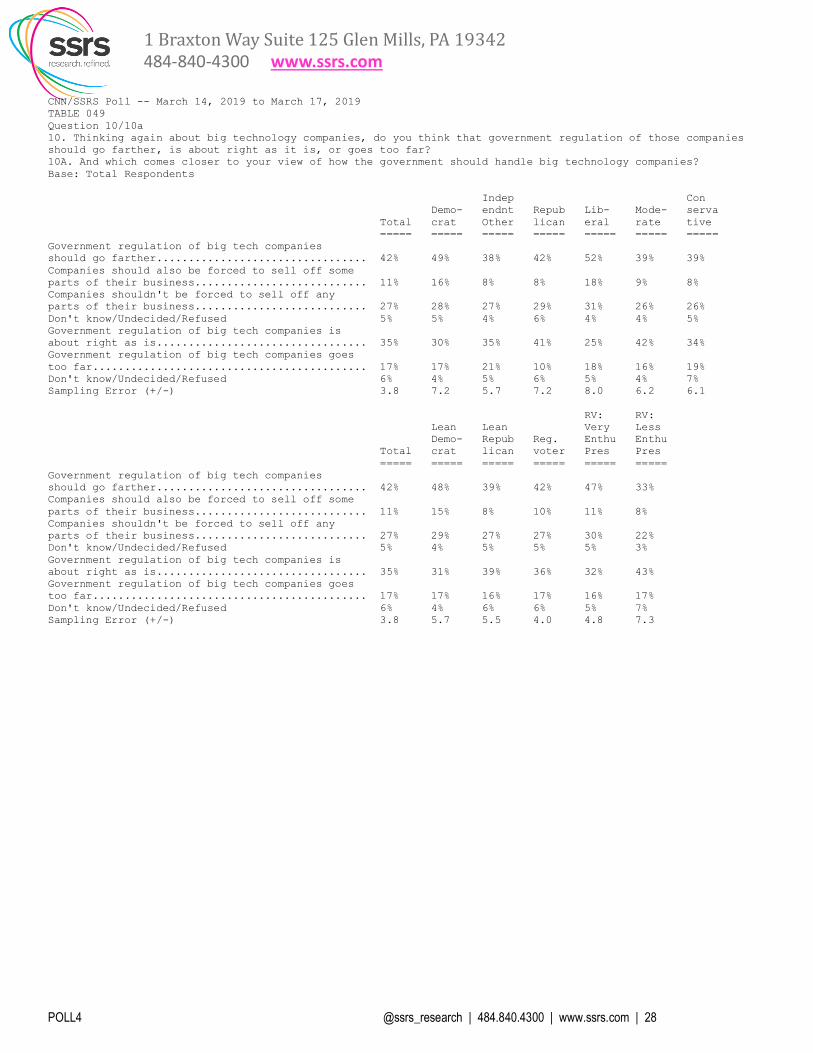
Q10. Thinking again about big technology companies, do you think that government regulation of those companies should go farther, is about right as it is, or goes too far?
Should go farther Is about right as it is Goes too far No opinion
March 14-17, 2019 42% 35% 17% 6%
(Respondents who think that government regulation of big technology companies should go farther, N=450) Q10a. And which comes closer to your view of how the government should handle big technology companies?
In addition to increased regulation, those
companies should also be forced to sell off some
parts of their businesses
There should be increased regulation, but those
companies should not be forced to sell off any parts
of their businesses
No opinion
March 14-17, 2019 25% 64% 11%
Q10. Thinking again about big technology companies, do you think that government regulation of those companies should go farther, is about right as it is, or goes too far? Q10a. And which comes closer to your view of how the government should handle big technology companies? Q10/Q10a COMBO TABLE
NET Should go farther
In addition to
increased regulation,
those companies should also be forced to sell off
some parts of their
businesses
There should be increased
regulation, but those
companies should not be forced to sell off any parts of their
businesses
No opinion Is about
right as it is Goes too
far No opinion
March 14-17, 2019 42% 11% 27% 5% 35% 17% 6%

1 Braxton Way Suite 125 Glen Mills, PA 19342
484-840-4300 www.ssrs.com
POLL4 @ssrs_research | 484.840.4300 | www.ssrs.com | 11
MORE ON METHODOLOGY A total of 1,003 adults were interviewed by telephone nationwide by live interviewers calling both landline and cell phones. Interviews were conducted in English and Spanish. Among the entire sample, 32% described themselves as Democrats, 25% described themselves as Republicans, and 44% described themselves as independents or members of another party. All respondents were asked questions concerning basic demographics, and the entire sample was weighted to reflect national Census figures for gender, race, age, education, region of country, and telephone usage. Results for the full sample have a margin of sampling error of +/- 3.8 percentage points. For the sample of 914 registered voters it is +/- 4.0 percentage points. For the subset of 456 Democrats and Democratic-leaning independents, it is +/-5.7 percentage points, and for the 448 Republicans and Republican-leaning independents, it is +/-5.5 percentage points. Crosstabs on the following pages only include results for subgroups with a minimum n=125 unweighted cases. While interviews were conducted among a representative sample of the adult population of the United States, results for subgroups with fewer than n=125 unweighted cases are not displayed and instead are denoted with "N/A" because they are too small to be projectable to their true values in the population.

1 Braxton Way Suite 125 Glen Mills, PA 19342
484-840-4300 www.ssrs.com
POLL4 @ssrs_research | 484.840.4300 | www.ssrs.com | 12
CNN/SSRS Poll -- March 14, 2019 to March 17, 2019
TABLE 001
Question A1
A1. Do you approve or disapprove of the way Donald Trump is handling his job as president?
Base: Total Respondents
Trump Trump
Non- ap- disap
Total Men Women White white prove prove
===== ===== ===== ===== ===== ===== =====
Approve 42% 51% 33% 49% 30% 100% 0%
Disapprove 51% 40% 60% 45% 62% 0% 100%
Don't know/Undecided/Refused 8% 8% 7% 7% 9% 0% 0%
Sampling Error (+/-) 3.8 4.6 5.9 4.5 7.0 5.5 5.5
Total 18-34 35-49 50-64 65+ <45 45+
===== ===== ===== ===== ===== ===== =====
Approve 42% 37% 43% 45% 45% 38% 45%
Disapprove 51% 52% 49% 49% 53% 51% 50%
Don't know/Undecided/Refused 8% 11% 8% 6% 2% 11% 5%
Sampling Error (+/-) 3.8 8.1 8.0 6.8 6.5 6.3 4.5
Non- White White
coll. Coll. non- coll.
Total <$50K $50K+ grad grad. coll. grad.
===== ===== ===== ===== ===== ===== =====
Approve 42% 34% 46% 44% 36% 54% 40%
Disapprove 51% 57% 48% 47% 59% 39% 55%
Don't know/Undecided/Refused 8% 9% 6% 9% 5% 7% 5%
Sampling Error (+/-) 3.8 6.5 4.8 4.9 5.5 6.0 6.4
Indep Con
Demo- endnt Repub Lib- Mode- serva
Total crat Other lican eral rate tive
===== ===== ===== ===== ===== ===== =====
Approve 42% 8% 41% 89% 11% 33% 74%
Disapprove 51% 88% 47% 7% 82% 58% 21%
Don't know/Undecided/Refused 8% 3% 12% 4% 7% 9% 5%
Sampling Error (+/-) 3.8 7.2 5.7 7.2 8.0 6.2 6.1
RV: RV:
Lean Lean Very Less
Demo- Repub Reg. Enthu Enthu
Total crat lican voter Pres Pres
===== ===== ===== ===== ===== =====
Approve 42% 8% 83% 43% 45% 39%
Disapprove 51% 88% 10% 51% 53% 45%
Don't know/Undecided/Refused 8% 4% 7% 7% 3% 16%
Sampling Error (+/-) 3.8 5.7 5.5 4.0 4.8 7.3

1 Braxton Way Suite 125 Glen Mills, PA 19342
484-840-4300 www.ssrs.com
POLL4 @ssrs_research | 484.840.4300 | www.ssrs.com | 13
CNN/SSRS Poll -- March 14, 2019 to March 17, 2019
TABLE 002
Question A2A
A2A. Do you approve or disapprove of the way Donald Trump is handling The economy?
Base: Total Respondents
Trump Trump
Non- ap- disap
Total Men Women White white prove prove
===== ===== ===== ===== ===== ===== =====
Approve 51% 64% 39% 59% 38% 95% 16%
Disapprove 42% 31% 53% 37% 53% 4% 77%
Don't know/Undecided/Refused 6% 5% 8% 5% 9% 1% 7%
Sampling Error (+/-) 3.8 4.6 5.9 4.5 7.0 5.5 5.5
Total 18-34 35-49 50-64 65+ <45 45+
===== ===== ===== ===== ===== ===== =====
Approve 51% 46% 55% 53% 52% 49% 53%
Disapprove 42% 43% 41% 42% 44% 43% 42%
Don't know/Undecided/Refused 6% 11% 4% 5% 4% 9% 5%
Sampling Error (+/-) 3.8 8.1 8.0 6.8 6.5 6.3 4.5
Non- White White
coll. Coll. non- coll.
Total <$50K $50K+ grad grad. coll. grad.
===== ===== ===== ===== ===== ===== =====
Approve 51% 44% 56% 53% 48% 63% 51%
Disapprove 42% 48% 39% 40% 47% 32% 44%
Don't know/Undecided/Refused 6% 8% 6% 7% 5% 5% 5%
Sampling Error (+/-) 3.8 6.5 4.8 4.9 5.5 6.0 6.4
Indep Con
Demo- endnt Repub Lib- Mode- serva
Total crat Other lican eral rate tive
===== ===== ===== ===== ===== ===== =====
Approve 51% 17% 53% 92% 18% 49% 78%
Disapprove 42% 74% 40% 7% 73% 45% 20%
Don't know/Undecided/Refused 6% 8% 7% 1% 10% 6% 2%
Sampling Error (+/-) 3.8 7.2 5.7 7.2 8.0 6.2 6.1
RV: RV:
Lean Lean Very Less
Demo- Repub Reg. Enthu Enthu
Total crat lican voter Pres Pres
===== ===== ===== ===== ===== =====
Approve 51% 19% 88% 52% 52% 52%
Disapprove 42% 73% 10% 42% 43% 39%
Don't know/Undecided/Refused 6% 8% 2% 6% 5% 9%
Sampling Error (+/-) 3.8 5.7 5.5 4.0 4.8 7.3

1 Braxton Way Suite 125 Glen Mills, PA 19342
484-840-4300 www.ssrs.com
POLL4 @ssrs_research | 484.840.4300 | www.ssrs.com | 14
CNN/SSRS Poll -- March 14, 2019 to March 17, 2019
TABLE 003
Question A2E
A2E. Do you approve or disapprove of the way Donald Trump is handling Immigration?
Base: Total Respondents
Trump Trump
Non- ap- disap
Total Men Women White white prove prove
===== ===== ===== ===== ===== ===== =====
Approve 39% 47% 32% 47% 26% 86% 2%
Disapprove 58% 49% 66% 50% 72% 12% 96%
Don't know/Undecided/Refused 3% 4% 2% 2% 3% 2% 2%
Sampling Error (+/-) 3.8 4.6 5.9 4.5 7.0 5.5 5.5
Total 18-34 35-49 50-64 65+ <45 45+
===== ===== ===== ===== ===== ===== =====
Approve 39% 29% 42% 46% 43% 33% 45%
Disapprove 58% 67% 55% 51% 54% 64% 52%
Don't know/Undecided/Refused 3% 4% 3% 3% 2% 3% 3%
Sampling Error (+/-) 3.8 8.1 8.0 6.8 6.5 6.3 4.5
Non- White White
coll. Coll. non- coll.
Total <$50K $50K+ grad grad. coll. grad.
===== ===== ===== ===== ===== ===== =====
Approve 39% 31% 45% 41% 35% 53% 38%
Disapprove 58% 65% 53% 55% 64% 44% 60%
Don't know/Undecided/Refused 3% 5% 2% 4% 1% 3% 1%
Sampling Error (+/-) 3.8 6.5 4.8 4.9 5.5 6.0 6.4
Indep Con
Demo- endnt Repub Lib- Mode- serva
Total crat Other lican eral rate tive
===== ===== ===== ===== ===== ===== =====
Approve 39% 7% 37% 87% 7% 33% 71%
Disapprove 58% 91% 59% 12% 92% 65% 26%
Don't know/Undecided/Refused 3% 2% 4% 1% 1% 2% 3%
Sampling Error (+/-) 3.8 7.2 5.7 7.2 8.0 6.2 6.1
RV: RV:
Lean Lean Very Less
Demo- Repub Reg. Enthu Enthu
Total crat lican voter Pres Pres
===== ===== ===== ===== ===== =====
Approve 39% 6% 80% 42% 45% 35%
Disapprove 58% 91% 18% 55% 54% 59%
Don't know/Undecided/Refused 3% 2% 3% 3% 1% 6%
Sampling Error (+/-) 3.8 5.7 5.5 4.0 4.8 7.3

1 Braxton Way Suite 125 Glen Mills, PA 19342
484-840-4300 www.ssrs.com
POLL4 @ssrs_research | 484.840.4300 | www.ssrs.com | 15
CNN/SSRS Poll -- March 14, 2019 to March 17, 2019
TABLE 004
Question A2F
A2F. Do you approve or disapprove of the way Donald Trump is handling Foreign affairs?
Base: Total Respondents
Trump Trump
Non- ap- disap
Total Men Women White white prove prove
===== ===== ===== ===== ===== ===== =====
Approve 40% 47% 33% 46% 28% 86% 4%
Disapprove 54% 46% 61% 46% 67% 9% 93%
Don't know/Undecided/Refused 7% 7% 6% 7% 5% 5% 4%
Sampling Error (+/-) 3.8 4.6 5.9 4.5 7.0 5.5 5.5
Total 18-34 35-49 50-64 65+ <45 45+
===== ===== ===== ===== ===== ===== =====
Approve 40% 35% 40% 45% 40% 37% 43%
Disapprove 54% 55% 53% 52% 54% 54% 53%
Don't know/Undecided/Refused 7% 10% 7% 3% 6% 9% 5%
Sampling Error (+/-) 3.8 8.1 8.0 6.8 6.5 6.3 4.5
Non- White White
coll. Coll. non- coll.
Total <$50K $50K+ grad grad. coll. grad.
===== ===== ===== ===== ===== ===== =====
Approve 40% 34% 44% 42% 35% 52% 37%
Disapprove 54% 57% 52% 50% 61% 39% 58%
Don't know/Undecided/Refused 7% 9% 4% 8% 4% 9% 5%
Sampling Error (+/-) 3.8 6.5 4.8 4.9 5.5 6.0 6.4
Indep Con
Demo- endnt Repub Lib- Mode- serva
Total crat Other lican eral rate tive
===== ===== ===== ===== ===== ===== =====
Approve 40% 8% 39% 84% 9% 33% 70%
Disapprove 54% 87% 54% 10% 84% 62% 24%
Don't know/Undecided/Refused 7% 5% 7% 6% 6% 4% 6%
Sampling Error (+/-) 3.8 7.2 5.7 7.2 8.0 6.2 6.1
RV: RV:
Lean Lean Very Less
Demo- Repub Reg. Enthu Enthu
Total crat lican voter Pres Pres
===== ===== ===== ===== ===== =====
Approve 40% 8% 78% 41% 44% 35%
Disapprove 54% 88% 16% 53% 52% 54%
Don't know/Undecided/Refused 7% 4% 6% 6% 4% 11%
Sampling Error (+/-) 3.8 5.7 5.5 4.0 4.8 7.3

1 Braxton Way Suite 125 Glen Mills, PA 19342
484-840-4300 www.ssrs.com
POLL4 @ssrs_research | 484.840.4300 | www.ssrs.com | 16
CNN/SSRS Poll -- March 14, 2019 to March 17, 2019
TABLE 005
Question A2G
A2G. Do you approve or disapprove of the way Donald Trump is handling The federal budget?
Base: Total Respondents
Trump Trump
Non- ap- disap
Total Men Women White white prove prove
===== ===== ===== ===== ===== ===== =====
Approve 34% 38% 30% 39% 25% 73% 4%
Disapprove 56% 49% 62% 51% 65% 16% 89%
Don't know/Undecided/Refused 10% 12% 8% 10% 10% 11% 7%
Sampling Error (+/-) 3.8 4.6 5.9 4.5 7.0 5.5 5.5
Total 18-34 35-49 50-64 65+ <45 45+
===== ===== ===== ===== ===== ===== =====
Approve 34% 29% 38% 38% 33% 33% 35%
Disapprove 56% 59% 55% 53% 55% 57% 54%
Don't know/Undecided/Refused 10% 12% 8% 9% 13% 10% 10%
Sampling Error (+/-) 3.8 8.1 8.0 6.8 6.5 6.3 4.5
Non- White White
coll. Coll. non- coll.
Total <$50K $50K+ grad grad. coll. grad.
===== ===== ===== ===== ===== ===== =====
Approve 34% 28% 38% 35% 30% 42% 32%
Disapprove 56% 57% 56% 52% 63% 46% 59%
Don't know/Undecided/Refused 10% 15% 6% 12% 7% 11% 9%
Sampling Error (+/-) 3.8 6.5 4.8 4.9 5.5 6.0 6.4
Indep Con
Demo- endnt Repub Lib- Mode- serva
Total crat Other lican eral rate tive
===== ===== ===== ===== ===== ===== =====
Approve 34% 6% 31% 78% 9% 26% 62%
Disapprove 56% 87% 57% 13% 83% 65% 29%
Don't know/Undecided/Refused 10% 7% 12% 9% 8% 9% 9%
Sampling Error (+/-) 3.8 7.2 5.7 7.2 8.0 6.2 6.1
RV: RV:
Lean Lean Very Less
Demo- Repub Reg. Enthu Enthu
Total crat lican voter Pres Pres
===== ===== ===== ===== ===== =====
Approve 34% 5% 69% 35% 38% 31%
Disapprove 56% 88% 21% 55% 56% 52%
Don't know/Undecided/Refused 10% 8% 10% 10% 6% 17%
Sampling Error (+/-) 3.8 5.7 5.5 4.0 4.8 7.3

1 Braxton Way Suite 125 Glen Mills, PA 19342
484-840-4300 www.ssrs.com
POLL4 @ssrs_research | 484.840.4300 | www.ssrs.com | 17
CNN/SSRS Poll -- March 14, 2019 to March 17, 2019
TABLE 006
Question A2I
A2I. Do you approve or disapprove of the way Donald Trump is handling Taxes?
Base: Total Respondents
Trump Trump
Non- ap- disap
Total Men Women White white prove prove
===== ===== ===== ===== ===== ===== =====
Approve 42% 52% 33% 49% 30% 84% 8%
Disapprove 49% 41% 57% 43% 61% 10% 85%
Don't know/Undecided/Refused 9% 7% 10% 9% 8% 5% 7%
Sampling Error (+/-) 3.8 4.6 5.9 4.5 7.0 5.5 5.5
Total 18-34 35-49 50-64 65+ <45 45+
===== ===== ===== ===== ===== ===== =====
Approve 42% 41% 44% 45% 40% 41% 43%
Disapprove 49% 48% 50% 48% 52% 49% 49%
Don't know/Undecided/Refused 9% 12% 6% 7% 8% 10% 8%
Sampling Error (+/-) 3.8 8.1 8.0 6.8 6.5 6.3 4.5
Non- White White
coll. Coll. non- coll.
Total <$50K $50K+ grad grad. coll. grad.
===== ===== ===== ===== ===== ===== =====
Approve 42% 35% 47% 44% 38% 53% 42%
Disapprove 49% 53% 47% 45% 57% 37% 52%
Don't know/Undecided/Refused 9% 12% 6% 10% 5% 10% 6%
Sampling Error (+/-) 3.8 6.5 4.8 4.9 5.5 6.0 6.4
Indep Con
Demo- endnt Repub Lib- Mode- serva
Total crat Other lican eral rate tive
===== ===== ===== ===== ===== ===== =====
Approve 42% 10% 42% 86% 10% 36% 72%
Disapprove 49% 85% 45% 10% 83% 53% 22%
Don't know/Undecided/Refused 9% 4% 13% 4% 7% 11% 5%
Sampling Error (+/-) 3.8 7.2 5.7 7.2 8.0 6.2 6.1
RV: RV:
Lean Lean Very Less
Demo- Repub Reg. Enthu Enthu
Total crat lican voter Pres Pres
===== ===== ===== ===== ===== =====
Approve 42% 10% 81% 43% 45% 41%
Disapprove 49% 84% 13% 49% 51% 45%
Don't know/Undecided/Refused 9% 6% 6% 7% 4% 14%
Sampling Error (+/-) 3.8 5.7 5.5 4.0 4.8 7.3
1 Braxton Way Suite 125 Glen Mills, PA 19342
484-840-4300 www.ssrs.com
POLL4 @ssrs_research | 484.840.4300 | www.ssrs.com | 18
CNN/SSRS Poll -- March 14, 2019 to March 17, 2019
TABLE 008
Question 2X
2X. Do you think that Congress should or should not have passed a resolution to overturn President Trump's
recent declaration of a national emergency along the U.S. border with Mexico?
Base: Total Respondents
Trump Trump
Non- ap- disap
Total Men Women White white prove prove
===== ===== ===== ===== ===== ===== =====
Should have passed a resolution to overturn the
national emergency declaration.................... 50% 49% 51% 49% 51% 20% 76%
Should not have passed a resolution to overturn
the national emergency declaration................ 42% 44% 41% 43% 42% 73% 18%
Don't know/Undecided/Refused 8% 8% 8% 8% 7% 7% 6%
Sampling Error (+/-) 3.8 4.6 5.9 4.5 7.0 5.5 5.5
Total 18-34 35-49 50-64 65+ <45 45+
===== ===== ===== ===== ===== ===== =====
Should have passed a resolution to overturn the
national emergency declaration.................... 50% 57% 45% 49% 46% 52% 48%
Should not have passed a resolution to overturn
the national emergency declaration................ 42% 33% 48% 47% 44% 40% 45%
Don't know/Undecided/Refused 8% 10% 7% 4% 10% 8% 7%
Sampling Error (+/-) 3.8 8.1 8.0 6.8 6.5 6.3 4.5
Non- White White
coll. Coll. non- coll.
Total <$50K $50K+ grad grad. coll. grad.
===== ===== ===== ===== ===== ===== =====
Should have passed a resolution to overturn the
national emergency declaration.................... 50% 49% 51% 42% 65% 43% 60%
Should not have passed a resolution to overturn
the national emergency declaration................ 42% 40% 44% 48% 30% 48% 34%
Don't know/Undecided/Refused 8% 12% 4% 9% 5% 9% 6%
Sampling Error (+/-) 3.8 6.5 4.8 4.9 5.5 6.0 6.4
Indep Con
Demo- endnt Repub Lib- Mode- serva
Total crat Other lican eral rate tive
===== ===== ===== ===== ===== ===== =====
Should have passed a resolution to overturn the
national emergency declaration.................... 50% 72% 53% 16% 74% 60% 23%
Should not have passed a resolution to overturn
the national emergency declaration................ 42% 22% 39% 77% 19% 33% 69%
Don't know/Undecided/Refused 8% 6% 8% 7% 7% 7% 7%
Sampling Error (+/-) 3.8 7.2 5.7 7.2 8.0 6.2 6.1
RV: RV:
Lean Lean Very Less
Demo- Repub Reg. Enthu Enthu
Total crat lican voter Pres Pres
===== ===== ===== ===== ===== =====
Should have passed a resolution to overturn the
national emergency declaration.................... 50% 72% 25% 50% 51% 48%
Should not have passed a resolution to overturn
the national emergency declaration................ 42% 21% 69% 42% 45% 37%
Don't know/Undecided/Refused 8% 7% 6% 8% 4% 15%
Sampling Error (+/-) 3.8 5.7 5.5 4.0 4.8 7.3
1 Braxton Way Suite 125 Glen Mills, PA 19342
484-840-4300 www.ssrs.com
POLL4 @ssrs_research | 484.840.4300 | www.ssrs.com | 19
CNN/SSRS Poll -- March 14, 2019 to March 17, 2019
TABLE 009
Question 2Y
2Y. Do you think President Trump should (veto/have vetoed) the resolution to overturn his declaration of a
national emergency along the U.S. border with Mexico, or should he not (veto/have vetoed) the resolution?
Base: Total Respondents
Trump Trump
Non- ap- disap
Total Men Women White white prove prove
===== ===== ===== ===== ===== ===== =====
Should veto/should have vetoed the resolution 35% 40% 30% 40% 26% 69% 10%
Should not veto/should not have vetoed the
resolution........................................ 55% 52% 58% 50% 64% 23% 84%
Don't know/Undecided/Refused 10% 8% 12% 10% 10% 9% 6%
Sampling Error (+/-) 3.8 4.6 5.9 4.5 7.0 5.5 5.5
Total 18-34 35-49 50-64 65+ <45 45+
===== ===== ===== ===== ===== ===== =====
Should veto/should have vetoed the resolution 35% 25% 36% 42% 40% 28% 41%
Should not veto/should not have vetoed the
resolution........................................ 55% 62% 53% 51% 52% 59% 51%
Don't know/Undecided/Refused 10% 13% 10% 7% 8% 12% 8%
Sampling Error (+/-) 3.8 8.1 8.0 6.8 6.5 6.3 4.5
Non- White White
coll. Coll. non- coll.
Total <$50K $50K+ grad grad. coll. grad.
===== ===== ===== ===== ===== ===== =====
Should veto/should have vetoed the resolution 35% 29% 40% 37% 31% 45% 30%
Should not veto/should not have vetoed the
resolution........................................ 55% 59% 52% 52% 62% 44% 61%
Don't know/Undecided/Refused 10% 13% 8% 12% 7% 11% 9%
Sampling Error (+/-) 3.8 6.5 4.8 4.9 5.5 6.0 6.4
Indep Con
Demo- endnt Repub Lib- Mode- serva
Total crat Other lican eral rate tive
===== ===== ===== ===== ===== ===== =====
Should veto/should have vetoed the resolution 35% 9% 34% 72% 16% 24% 61%
Should not veto/should not have vetoed the
resolution........................................ 55% 83% 55% 19% 78% 66% 29%
Don't know/Undecided/Refused 10% 8% 11% 10% 5% 11% 10%
Sampling Error (+/-) 3.8 7.2 5.7 7.2 8.0 6.2 6.1
RV: RV:
Lean Lean Very Less
Demo- Repub Reg. Enthu Enthu
Total crat lican voter Pres Pres
===== ===== ===== ===== ===== =====
Should veto/should have vetoed the resolution 35% 11% 64% 37% 40% 28%
Should not veto/should not have vetoed the
resolution........................................ 55% 82% 26% 53% 53% 53%
Don't know/Undecided/Refused 10% 7% 11% 10% 7% 18%
Sampling Error (+/-) 3.8 5.7 5.5 4.0 4.8 7.3

1 Braxton Way Suite 125 Glen Mills, PA 19342
484-840-4300 www.ssrs.com
POLL4 @ssrs_research | 484.840.4300 | www.ssrs.com | 20
CNN/SSRS Poll -- March 14, 2019 to March 17, 2019
TABLE 042
Question 6
6. How would you rate the economic conditions in the country today -- as very good, somewhat good, somewhat
poor, or very poor?
Base: Total Respondents
Trump Trump
Non- ap- disap
Total Men Women White white prove prove
===== ===== ===== ===== ===== ===== =====
Good (Net) 71% 78% 64% 76% 62% 91% 54%
Very good 26% 33% 19% 30% 19% 52% 5%
Somewhat good 45% 44% 45% 46% 43% 39% 49%
Poor (Net) 27% 20% 33% 22% 35% 8% 42%
Somewhat poor 19% 13% 25% 17% 23% 4% 31%
Very poor 8% 7% 8% 5% 12% 4% 11%
Don't know/Undecided/Refused 3% 2% 3% 2% 3% 1% 4%
Sampling Error (+/-) 3.8 4.6 5.9 4.5 7.0 5.5 5.5
Total 18-34 35-49 50-64 65+ <45 45+
===== ===== ===== ===== ===== ===== =====
Good (Net) 71% 67% 70% 73% 74% 69% 72%
Very good 26% 17% 30% 31% 27% 22% 29%
Somewhat good 45% 49% 40% 42% 47% 47% 43%
Poor (Net) 27% 30% 27% 26% 22% 28% 25%
Somewhat poor 19% 23% 21% 19% 12% 21% 17%
Very poor 8% 7% 7% 6% 10% 7% 8%
Don't know/Undecided/Refused 3% 4% 2% 1% 4% 3% 3%
Sampling Error (+/-) 3.8 8.1 8.0 6.8 6.5 6.3 4.5
Non- White White
coll. Coll. non- coll.
Total <$50K $50K+ grad grad. coll. grad.
===== ===== ===== ===== ===== ===== =====
Good (Net) 71% 60% 78% 68% 77% 74% 80%
Very good 26% 17% 32% 25% 27% 30% 30%
Somewhat good 45% 43% 46% 42% 50% 43% 50%
Poor (Net) 27% 35% 20% 29% 22% 23% 19%
Somewhat poor 19% 23% 17% 20% 17% 18% 17%
Very poor 8% 12% 4% 9% 5% 5% 2%
Don't know/Undecided/Refused 3% 4% 1% 4% 1% 3% 1%
Sampling Error (+/-) 3.8 6.5 4.8 4.9 5.5 6.0 6.4
Indep Con
Demo- endnt Repub Lib- Mode- serva
Total crat Other lican eral rate tive
===== ===== ===== ===== ===== ===== =====
Good (Net) 71% 53% 74% 90% 54% 74% 81%
Very good 26% 4% 26% 57% 6% 22% 46%
Somewhat good 45% 50% 48% 33% 49% 52% 35%
Poor (Net) 27% 44% 24% 10% 43% 25% 17%
Somewhat poor 19% 32% 17% 6% 32% 18% 11%
Very poor 8% 11% 7% 3% 11% 7% 6%
Don't know/Undecided/Refused 3% 3% 2% * 2% 1% 2%
Sampling Error (+/-) 3.8 7.2 5.7 7.2 8.0 6.2 6.1
RV: RV:
Lean Lean Very Less
Demo- Repub Reg. Enthu Enthu
Total crat lican voter Pres Pres
===== ===== ===== ===== ===== =====
Good (Net) 71% 56% 90% 71% 72% 70%
Very good 26% 5% 52% 28% 32% 19%
Somewhat good 45% 51% 38% 43% 40% 51%
Poor (Net) 27% 42% 9% 26% 26% 28%
Somewhat poor 19% 31% 6% 20% 20% 18%
Very poor 8% 11% 3% 7% 5% 10%
Don't know/Undecided/Refused 3% 2% 1% 2% 2% 2%
Sampling Error (+/-) 3.8 5.7 5.5 4.0 4.8 7.3
1 Braxton Way Suite 125 Glen Mills, PA 19342
484-840-4300 www.ssrs.com
POLL4 @ssrs_research | 484.840.4300 | www.ssrs.com | 21
CNN/SSRS Poll -- March 14, 2019 to March 17, 2019
TABLE 043
Question 7
7. Now I'd like you to compare your financial situation today with what it was three years ago. Would you say
you are financially better off, worse off, or is your financial situation about the same as it was three years
ago?
Base: Total Respondents
Trump Trump
Non- ap- disap
Total Men Women White white prove prove
===== ===== ===== ===== ===== ===== =====
Better off 42% 51% 34% 45% 38% 66% 22%
Worse off 15% 12% 18% 12% 22% 5% 23%
About the same 41% 35% 47% 42% 40% 27% 54%
Don't know/Undecided/Refused 1% 2% 1% 2% * 2% 1%
Sampling Error (+/-) 3.8 4.6 5.9 4.5 7.0 5.5 5.5
Total 18-34 35-49 50-64 65+ <45 45+
===== ===== ===== ===== ===== ===== =====
Better off 42% 51% 48% 40% 28% 50% 36%
Worse off 15% 13% 13% 19% 16% 14% 16%
About the same 41% 35% 39% 40% 55% 35% 46%
Don't know/Undecided/Refused 1% 1% * 1% 1% 1% 1%
Sampling Error (+/-) 3.8 8.1 8.0 6.8 6.5 6.3 4.5
Non- White White
coll. Coll. non- coll.
Total <$50K $50K+ grad grad. coll. grad.
===== ===== ===== ===== ===== ===== =====
Better off 42% 28% 53% 40% 48% 42% 50%
Worse off 15% 23% 9% 18% 10% 13% 8%
About the same 41% 47% 37% 41% 42% 43% 42%
Don't know/Undecided/Refused 1% 2% 1% 1% 1% 2% 1%
Sampling Error (+/-) 3.8 6.5 4.8 4.9 5.5 6.0 6.4
Indep Con
Demo- endnt Repub Lib- Mode- serva
Total crat Other lican eral rate tive
===== ===== ===== ===== ===== ===== =====
Better off 42% 19% 48% 65% 27% 40% 57%
Worse off 15% 27% 13% 4% 21% 17% 8%
About the same 41% 55% 37% 30% 51% 41% 34%
Don't know/Undecided/Refused 1% * 1% 1% * 2% 1%
Sampling Error (+/-) 3.8 7.2 5.7 7.2 8.0 6.2 6.1
RV: RV:
Lean Lean Very Less
Demo- Repub Reg. Enthu Enthu
Total crat lican voter Pres Pres
===== ===== ===== ===== ===== =====
Better off 42% 21% 65% 43% 43% 44%
Worse off 15% 24% 5% 16% 17% 14%
About the same 41% 54% 29% 40% 39% 41%
Don't know/Undecided/Refused 1% 1% 1% 1% * 2%
Sampling Error (+/-) 3.8 5.7 5.5 4.0 4.8 7.3

1 Braxton Way Suite 125 Glen Mills, PA 19342
484-840-4300 www.ssrs.com
POLL4 @ssrs_research | 484.840.4300 | www.ssrs.com | 22
CNN/SSRS Poll -- March 14, 2019 to March 17, 2019
TABLE 044
Question 8
8. Which of the following statements comes closest to your views about the relationship between government and
businesses?
Base: Total Respondents
Trump Trump
Non- ap- disap
Total Men Women White white prove prove
===== ===== ===== ===== ===== ===== =====
You think the free market can be trusted to do
what is best for the country and no government
regulation of business is necessary............... 10% 12% 7% 9% 11% 17% 5%
You trust the free market more than the
government but there should be some government
regulation of business............................ 62% 62% 61% 65% 56% 64% 59%
You trust the government more than the free
market but the government should not interfere in
every decision that businesses make............... 23% 19% 27% 21% 25% 15% 30%
You think there should not be a free market and
all economic decisions should be made by the
government........................................ 2% 3% 1% 1% 4% 1% 3%
Don't know/Undecided/Refused 4% 3% 5% 4% 3% 4% 4%
Sampling Error (+/-) 3.8 4.6 5.9 4.5 7.0 5.5 5.5
Total 18-34 35-49 50-64 65+ <45 45+
===== ===== ===== ===== ===== ===== =====
You think the free market can be trusted to do
what is best for the country and no government
regulation of business is necessary............... 10% 9% 9% 9% 12% 9% 10%
You trust the free market more than the
government but there should be some government
regulation of business............................ 62% 60% 64% 67% 54% 61% 62%
You trust the government more than the free
market but the government should not interfere in
every decision that businesses make............... 23% 28% 20% 18% 24% 26% 20%
You think there should not be a free market and
all economic decisions should be made by the
government........................................ 2% 1% 2% 3% 2% 1% 2%
Don't know/Undecided/Refused 4% 1% 5% 3% 8% 2% 6%
Sampling Error (+/-) 3.8 8.1 8.0 6.8 6.5 6.3 4.5
Non- White White
coll. Coll. non- coll.
Total <$50K $50K+ grad grad. coll. grad.
===== ===== ===== ===== ===== ===== =====
You think the free market can be trusted to do
what is best for the country and no government
regulation of business is necessary............... 10% 10% 9% 11% 8% 10% 7%
You trust the free market more than the
government but there should be some government
regulation of business............................ 62% 53% 68% 60% 66% 66% 66%
You trust the government more than the free
market but the government should not interfere in
every decision that businesses make............... 23% 28% 19% 22% 25% 20% 24%
You think there should not be a free market and
all economic decisions should be made by the
government........................................ 2% 3% 1% 2% 1% * 1%
Don't know/Undecided/Refused 4% 6% 2% 5% 1% 4% 2%
Sampling Error (+/-) 3.8 6.5 4.8 4.9 5.5 6.0 6.4

1 Braxton Way Suite 125 Glen Mills, PA 19342
484-840-4300 www.ssrs.com
POLL4 @ssrs_research | 484.840.4300 | www.ssrs.com | 23
CNN/SSRS Poll -- March 14, 2019 to March 17, 2019
TABLE 044
Question 8
8. Which of the following statements comes closest to your views about the relationship between government and
businesses?
Base: Total Respondents
Indep Con
Demo- endnt Repub Lib- Mode- serva
Total crat Other lican eral rate tive
===== ===== ===== ===== ===== ===== =====
You think the free market can be trusted to do
what is best for the country and no government
regulation of business is necessary............... 10% 3% 12% 13% 8% 6% 15%
You trust the free market more than the
government but there should be some government
regulation of business............................ 62% 58% 66% 64% 55% 69% 61%
You trust the government more than the free
market but the government should not interfere in
every decision that businesses make............... 23% 33% 18% 17% 33% 19% 20%
You think there should not be a free market and
all economic decisions should be made by the
government........................................ 2% 2% 2% 2% 2% 2% 2%
Don't know/Undecided/Refused 4% 4% 2% 3% 2% 4% 3%
Sampling Error (+/-) 3.8 7.2 5.7 7.2 8.0 6.2 6.1
RV: RV:
Lean Lean Very Less
Demo- Repub Reg. Enthu Enthu
Total crat lican voter Pres Pres
===== ===== ===== ===== ===== =====
You think the free market can be trusted to do
what is best for the country and no government
regulation of business is necessary............... 10% 6% 12% 9% 9% 9%
You trust the free market more than the
government but there should be some government
regulation of business............................ 62% 59% 68% 62% 61% 64%
You trust the government more than the free
market but the government should not interfere in
every decision that businesses make............... 23% 29% 15% 24% 25% 20%
You think there should not be a free market and
all economic decisions should be made by the
government........................................ 2% 2% 2% 2% 2% 2%
Don't know/Undecided/Refused 4% 3% 2% 4% 2% 6%
Sampling Error (+/-) 3.8 5.7 5.5 4.0 4.8 7.3

1 Braxton Way Suite 125 Glen Mills, PA 19342
484-840-4300 www.ssrs.com
POLL4 @ssrs_research | 484.840.4300 | www.ssrs.com | 24
CNN/SSRS Poll -- March 14, 2019 to March 17, 2019
TABLE 045
Question 9a
9A. Overall, how much do you trust big technology companies such as Google, Facebook or Amazon to do what is
best for the economy -- a great deal, somewhat, a little, or not at all?
Base: Total Respondents
Trump Trump
Non- ap- disap
Total Men Women White white prove prove
===== ===== ===== ===== ===== ===== =====
A great deal/Somewhat (Net) 41% 39% 43% 41% 41% 38% 43%
A great deal 8% 9% 7% 6% 11% 10% 5%
Somewhat 33% 30% 36% 35% 30% 28% 37%
A little/Not at all (Net) 57% 59% 54% 57% 56% 61% 55%
A little 28% 27% 28% 28% 27% 25% 30%
Not at all 29% 33% 26% 29% 30% 36% 24%
Don't know/Undecided/Refused 2% 2% 3% 2% 3% 2% 3%
Sampling Error (+/-) 3.8 4.6 5.9 4.5 7.0 5.5 5.5
Total 18-34 35-49 50-64 65+ <45 45+
===== ===== ===== ===== ===== ===== =====
A great deal/Somewhat (Net) 41% 44% 44% 37% 37% 46% 37%
A great deal 8% 14% 6% 3% 7% 11% 5%
Somewhat 33% 30% 38% 34% 31% 34% 32%
A little/Not at all (Net) 57% 53% 53% 62% 59% 52% 61%
A little 28% 28% 24% 26% 32% 27% 28%
Not at all 29% 25% 28% 36% 27% 25% 33%
Don't know/Undecided/Refused 2% 3% 3% 1% 3% 3% 2%
Sampling Error (+/-) 3.8 8.1 8.0 6.8 6.5 6.3 4.5
Non- White White
coll. Coll. non- coll.
Total <$50K $50K+ grad grad. coll. grad.
===== ===== ===== ===== ===== ===== =====
A great deal/Somewhat (Net) 41% 41% 42% 40% 43% 40% 44%
A great deal 8% 11% 6% 10% 5% 7% 5%
Somewhat 33% 30% 36% 30% 38% 33% 39%
A little/Not at all (Net) 57% 55% 57% 58% 55% 57% 55%
A little 28% 26% 28% 27% 29% 27% 31%
Not at all 29% 29% 28% 31% 26% 31% 24%
Don't know/Undecided/Refused 2% 4% 1% 3% 2% 3% 1%
Sampling Error (+/-) 3.8 6.5 4.8 4.9 5.5 6.0 6.4
Indep Con
Demo- endnt Repub Lib- Mode- serva
Total crat Other lican eral rate tive
===== ===== ===== ===== ===== ===== =====
A great deal/Somewhat (Net) 41% 45% 39% 40% 40% 45% 38%
A great deal 8% 6% 11% 7% 7% 8% 8%
Somewhat 33% 39% 28% 33% 33% 37% 29%
A little/Not at all (Net) 57% 54% 58% 59% 59% 53% 59%
A little 28% 31% 26% 26% 29% 27% 28%
Not at all 29% 23% 32% 33% 30% 26% 32%
Don't know/Undecided/Refused 2% 1% 2% 2% 1% 2% 3%
Sampling Error (+/-) 3.8 7.2 5.7 7.2 8.0 6.2 6.1
RV: RV:
Lean Lean Very Less
Demo- Repub Reg. Enthu Enthu
Total crat lican voter Pres Pres
===== ===== ===== ===== ===== =====
A great deal/Somewhat (Net) 41% 46% 37% 39% 39% 38%
A great deal 8% 7% 8% 6% 4% 10%
Somewhat 33% 39% 29% 33% 35% 29%
A little/Not at all (Net) 57% 53% 61% 59% 59% 58%
A little 28% 29% 27% 28% 26% 32%
Not at all 29% 24% 33% 30% 33% 26%
Don't know/Undecided/Refused 2% 1% 2% 2% 2% 3%
Sampling Error (+/-) 3.8 5.7 5.5 4.0 4.8 7.3

1 Braxton Way Suite 125 Glen Mills, PA 19342
484-840-4300 www.ssrs.com
POLL4 @ssrs_research | 484.840.4300 | www.ssrs.com | 25
CNN/SSRS Poll -- March 14, 2019 to March 17, 2019
TABLE 046
Question 9b
9B. Overall, how much do you trust big technology companies such as Google, Facebook or Amazon to do what is
best for their users -- a great deal, somewhat, a little, or not at all?
Base: Total Respondents
Trump Trump
Non- ap- disap
Total Men Women White white prove prove
===== ===== ===== ===== ===== ===== =====
A great deal/Somewhat (Net) 40% 39% 42% 40% 43% 36% 44%
A great deal 8% 8% 8% 5% 13% 8% 7%
Somewhat 33% 31% 34% 35% 30% 28% 36%
A little/Not at all (Net) 58% 60% 56% 59% 54% 63% 54%
A little 29% 28% 30% 32% 26% 28% 30%
Not at all 29% 32% 25% 28% 28% 35% 24%
Don't know/Undecided/Refused 2% 1% 2% 1% 2% 1% 2%
Sampling Error (+/-) 3.8 4.6 5.9 4.5 7.0 5.5 5.5
Total 18-34 35-49 50-64 65+ <45 45+
===== ===== ===== ===== ===== ===== =====
A great deal/Somewhat (Net) 40% 48% 39% 34% 41% 46% 36%
A great deal 8% 13% 5% 5% 9% 10% 6%
Somewhat 33% 35% 34% 29% 32% 36% 30%
A little/Not at all (Net) 58% 51% 60% 65% 54% 53% 61%
A little 29% 26% 28% 35% 28% 27% 31%
Not at all 29% 25% 32% 31% 26% 26% 30%
Don't know/Undecided/Refused 2% 1% 2% 1% 5% 1% 3%
Sampling Error (+/-) 3.8 8.1 8.0 6.8 6.5 6.3 4.5
Non- White White
coll. Coll. non- coll.
Total <$50K $50K+ grad grad. coll. grad.
===== ===== ===== ===== ===== ===== =====
A great deal/Somewhat (Net) 40% 43% 39% 43% 37% 41% 37%
A great deal 8% 11% 4% 11% 3% 6% 2%
Somewhat 33% 32% 34% 32% 34% 35% 35%
A little/Not at all (Net) 58% 53% 61% 55% 62% 57% 62%
A little 29% 26% 32% 25% 37% 27% 40%
Not at all 29% 27% 29% 30% 25% 30% 22%
Don't know/Undecided/Refused 2% 3% 1% 2% 1% 1% 1%
Sampling Error (+/-) 3.8 6.5 4.8 4.9 5.5 6.0 6.4
Indep Con
Demo- endnt Repub Lib- Mode- serva
Total crat Other lican eral rate tive
===== ===== ===== ===== ===== ===== =====
A great deal/Somewhat (Net) 40% 44% 39% 40% 44% 41% 37%
A great deal 8% 10% 9% 5% 9% 7% 7%
Somewhat 33% 34% 31% 35% 34% 34% 30%
A little/Not at all (Net) 58% 55% 59% 59% 56% 58% 59%
A little 29% 29% 29% 30% 28% 32% 28%
Not at all 29% 26% 30% 30% 27% 26% 32%
Don't know/Undecided/Refused 2% 2% 1% 1% 1% 1% 3%
Sampling Error (+/-) 3.8 7.2 5.7 7.2 8.0 6.2 6.1
RV: RV:
Lean Lean Very Less
Demo- Repub Reg. Enthu Enthu
Total crat lican voter Pres Pres
===== ===== ===== ===== ===== =====
A great deal/Somewhat (Net) 40% 46% 35% 38% 35% 46%
A great deal 8% 9% 6% 6% 3% 11%
Somewhat 33% 36% 30% 33% 32% 35%
A little/Not at all (Net) 58% 53% 63% 60% 63% 52%
A little 29% 30% 29% 30% 31% 28%
Not at all 29% 23% 34% 29% 32% 25%
Don't know/Undecided/Refused 2% 1% 1% 2% 1% 1%
Sampling Error (+/-) 3.8 5.7 5.5 4.0 4.8 7.3

1 Braxton Way Suite 125 Glen Mills, PA 19342
484-840-4300 www.ssrs.com
POLL4 @ssrs_research | 484.840.4300 | www.ssrs.com | 26
CNN/SSRS Poll -- March 14, 2019 to March 17, 2019
TABLE 047
Question 10
10. Thinking again about big technology companies, do you think that government regulation of those companies
should go farther, is about right as it is, or goes too far?
Base: Total Respondents
Trump Trump
Non- ap- disap
Total Men Women White white prove prove
===== ===== ===== ===== ===== ===== =====
Should go farther 42% 43% 40% 43% 40% 40% 46%
Is about right as it is 35% 34% 36% 39% 29% 38% 31%
Goes too far 17% 18% 16% 12% 25% 17% 18%
Don't know/Undecided/Refused 6% 5% 7% 6% 5% 6% 5%
Sampling Error (+/-) 3.8 4.6 5.9 4.5 7.0 5.5 5.5
Total 18-34 35-49 50-64 65+ <45 45+
===== ===== ===== ===== ===== ===== =====
Should go farther 42% 35% 46% 45% 44% 39% 44%
Is about right as it is 35% 40% 31% 34% 32% 37% 33%
Goes too far 17% 22% 17% 15% 15% 20% 15%
Don't know/Undecided/Refused 6% 3% 6% 6% 9% 4% 8%
Sampling Error (+/-) 3.8 8.1 8.0 6.8 6.5 6.3 4.5
Non- White White
coll. Coll. non- coll.
Total <$50K $50K+ grad grad. coll. grad.
===== ===== ===== ===== ===== ===== =====
Should go farther 42% 37% 46% 38% 50% 40% 48%
Is about right as it is 35% 36% 35% 36% 34% 39% 39%
Goes too far 17% 21% 15% 21% 10% 15% 7%
Don't know/Undecided/Refused 6% 6% 5% 6% 6% 6% 6%
Sampling Error (+/-) 3.8 6.5 4.8 4.9 5.5 6.0 6.4
Indep Con
Demo- endnt Repub Lib- Mode- serva
Total crat Other lican eral rate tive
===== ===== ===== ===== ===== ===== =====
Should go farther 42% 49% 38% 42% 52% 39% 39%
Is about right as it is 35% 30% 35% 41% 25% 42% 34%
Goes too far 17% 17% 21% 10% 18% 16% 19%
Don't know/Undecided/Refused 6% 4% 5% 6% 5% 4% 7%
Sampling Error (+/-) 3.8 7.2 5.7 7.2 8.0 6.2 6.1
RV: RV:
Lean Lean Very Less
Demo- Repub Reg. Enthu Enthu
Total crat lican voter Pres Pres
===== ===== ===== ===== ===== =====
Should go farther 42% 48% 39% 42% 47% 33%
Is about right as it is 35% 31% 39% 36% 32% 43%
Goes too far 17% 17% 16% 17% 16% 17%
Don't know/Undecided/Refused 6% 4% 6% 6% 5% 7%
Sampling Error (+/-) 3.8 5.7 5.5 4.0 4.8 7.3

1 Braxton Way Suite 125 Glen Mills, PA 19342
484-840-4300 www.ssrs.com
POLL4 @ssrs_research | 484.840.4300 | www.ssrs.com | 27
CNN/SSRS Poll -- March 14, 2019 to March 17, 2019
TABLE 049
Question 10/10a
10. Thinking again about big technology companies, do you think that government regulation of those companies
should go farther, is about right as it is, or goes too far?
10A. And which comes closer to your view of how the government should handle big technology companies?
Base: Total Respondents
Trump Trump
Non- ap- disap
Total Men Women White white prove prove
===== ===== ===== ===== ===== ===== =====
Government regulation of big tech companies
should go farther................................. 42% 43% 40% 43% 40% 40% 46%
Companies should also be forced to sell off some
parts of their business........................... 11% 11% 10% 11% 10% 9% 13%
Companies shouldn't be forced to sell off any
parts of their business........................... 27% 27% 27% 27% 26% 26% 29%
Don't know/Undecided/Refused 5% 5% 4% 5% 4% 5% 4%
Government regulation of big tech companies is
about right as is................................. 35% 34% 36% 39% 29% 38% 31%
Government regulation of big tech companies goes
too far........................................... 17% 18% 16% 12% 25% 17% 18%
Don't know/Undecided/Refused 6% 5% 7% 6% 5% 6% 5%
Sampling Error (+/-) 3.8 4.6 5.9 4.5 7.0 5.5 5.5
Total 18-34 35-49 50-64 65+ <45 45+
===== ===== ===== ===== ===== ===== =====
Government regulation of big tech companies
should go farther................................. 42% 35% 46% 45% 44% 39% 44%
Companies should also be forced to sell off some
parts of their business........................... 11% 11% 6% 14% 11% 9% 12%
Companies shouldn't be forced to sell off any
parts of their business........................... 27% 21% 36% 25% 28% 26% 27%
Don't know/Undecided/Refused 5% 3% 4% 6% 5% 4% 5%
Government regulation of big tech companies is
about right as is................................. 35% 40% 31% 34% 32% 37% 33%
Government regulation of big tech companies goes
too far........................................... 17% 22% 17% 15% 15% 20% 15%
Don't know/Undecided/Refused 6% 3% 6% 6% 9% 4% 8%
Sampling Error (+/-) 3.8 8.1 8.0 6.8 6.5 6.3 4.5
Non- White White
coll. Coll. non- coll.
Total <$50K $50K+ grad grad. coll. grad.
===== ===== ===== ===== ===== ===== =====
Government regulation of big tech companies
should go farther................................. 42% 37% 46% 38% 50% 40% 48%
Companies should also be forced to sell off some
parts of their business........................... 11% 12% 10% 10% 12% 10% 13%
Companies shouldn't be forced to sell off any
parts of their business........................... 27% 21% 31% 24% 33% 26% 31%
Don't know/Undecided/Refused 5% 4% 4% 4% 4% 5% 4%
Government regulation of big tech companies is
about right as is................................. 35% 36% 35% 36% 34% 39% 39%
Government regulation of big tech companies goes
too far........................................... 17% 21% 15% 21% 10% 15% 7%
Don't know/Undecided/Refused 6% 6% 5% 6% 6% 6% 6%
Sampling Error (+/-) 3.8 6.5 4.8 4.9 5.5 6.0 6.4
1 Braxton Way Suite 125 Glen Mills, PA 19342
484-840-4300 www.ssrs.com
POLL4 @ssrs_research | 484.840.4300 | www.ssrs.com | 28
CNN/SSRS Poll -- March 14, 2019 to March 17, 2019
TABLE 049
Question 10/10a
10. Thinking again about big technology companies, do you think that government regulation of those companies
should go farther, is about right as it is, or goes too far?
10A. And which comes closer to your view of how the government should handle big technology companies?
Base: Total Respondents
Indep Con
Demo- endnt Repub Lib- Mode- serva
Total crat Other lican eral rate tive
===== ===== ===== ===== ===== ===== =====
Government regulation of big tech companies
should go farther................................. 42% 49% 38% 42% 52% 39% 39%
Companies should also be forced to sell off some
parts of their business........................... 11% 16% 8% 8% 18% 9% 8%
Companies shouldn't be forced to sell off any
parts of their business........................... 27% 28% 27% 29% 31% 26% 26%
Don't know/Undecided/Refused 5% 5% 4% 6% 4% 4% 5%
Government regulation of big tech companies is
about right as is................................. 35% 30% 35% 41% 25% 42% 34%
Government regulation of big tech companies goes
too far........................................... 17% 17% 21% 10% 18% 16% 19%
Don't know/Undecided/Refused 6% 4% 5% 6% 5% 4% 7%
Sampling Error (+/-) 3.8 7.2 5.7 7.2 8.0 6.2 6.1
RV: RV:
Lean Lean Very Less
Demo- Repub Reg. Enthu Enthu
Total crat lican voter Pres Pres
===== ===== ===== ===== ===== =====
Government regulation of big tech companies
should go farther................................. 42% 48% 39% 42% 47% 33%
Companies should also be forced to sell off some
parts of their business........................... 11% 15% 8% 10% 11% 8%
Companies shouldn't be forced to sell off any
parts of their business........................... 27% 29% 27% 27% 30% 22%
Don't know/Undecided/Refused 5% 4% 5% 5% 5% 3%
Government regulation of big tech companies is
about right as is................................. 35% 31% 39% 36% 32% 43%
Government regulation of big tech companies goes
too far........................................... 17% 17% 16% 17% 16% 17%
Don't know/Undecided/Refused 6% 4% 6% 6% 5% 7%
Sampling Error (+/-) 3.8 5.7 5.5 4.0 4.8 7.3