emak & japan’s energy - ipeec.org filesince 2009, emak has organised 8 workshops and 2...
TRANSCRIPT

EMAK & Japan’s Energy Efficiency Policy
21st November 2018, CNI São Paulo Office, São Paulo, Brazil
MASAOMI KOYAMADirector, International Affairs
Energy Efficiency and Renewable Energy DepartmentMinistry of Economy, Trade and Industry

1. EMAK (Energy Management Action Network)
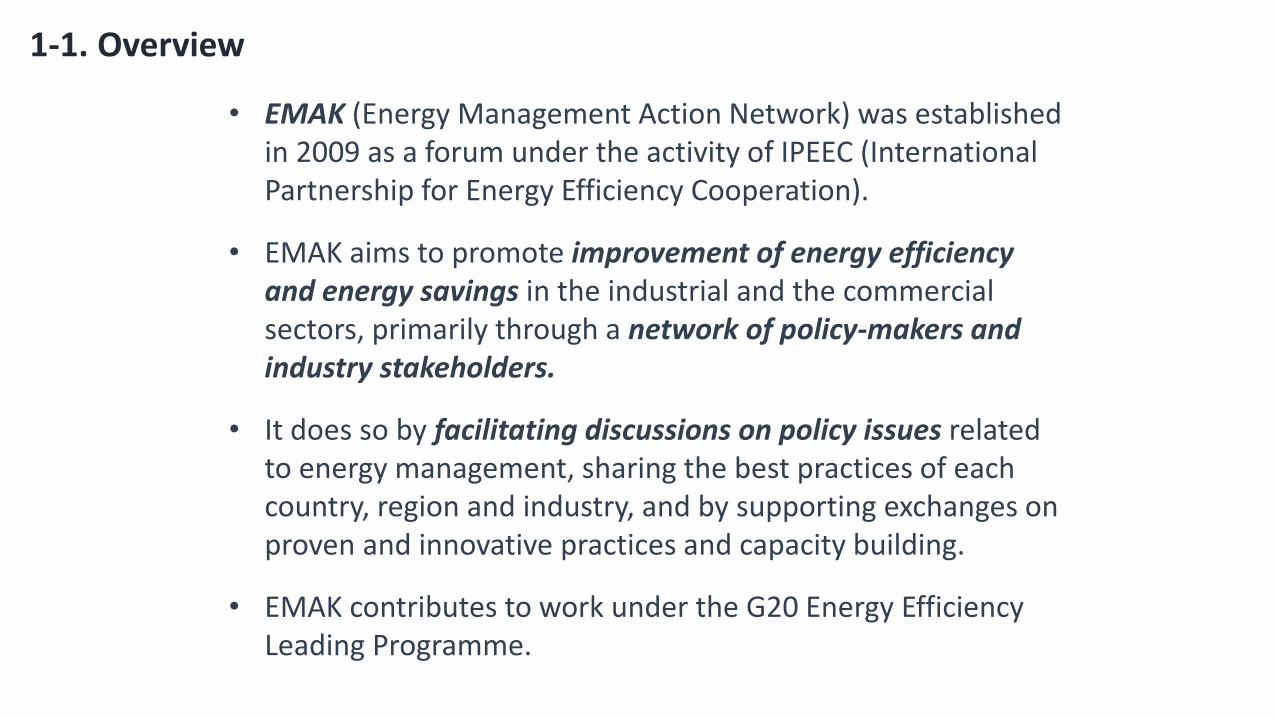
• EMAK (Energy Management Action Network) was established in 2009 as a forum under the activity of IPEEC (International Partnership for Energy Efficiency Cooperation).
• EMAK aims to promote improvement of energy efficiency and energy savings in the industrial and the commercial sectors, primarily through a network of policy-makers and industry stakeholders.
• It does so by facilitating discussions on policy issues related to energy management, sharing the best practices of each country, region and industry, and by supporting exchanges on proven and innovative practices and capacity building.
• EMAK contributes to work under the G20 Energy Efficiency Leading Programme.
1-1. Overview
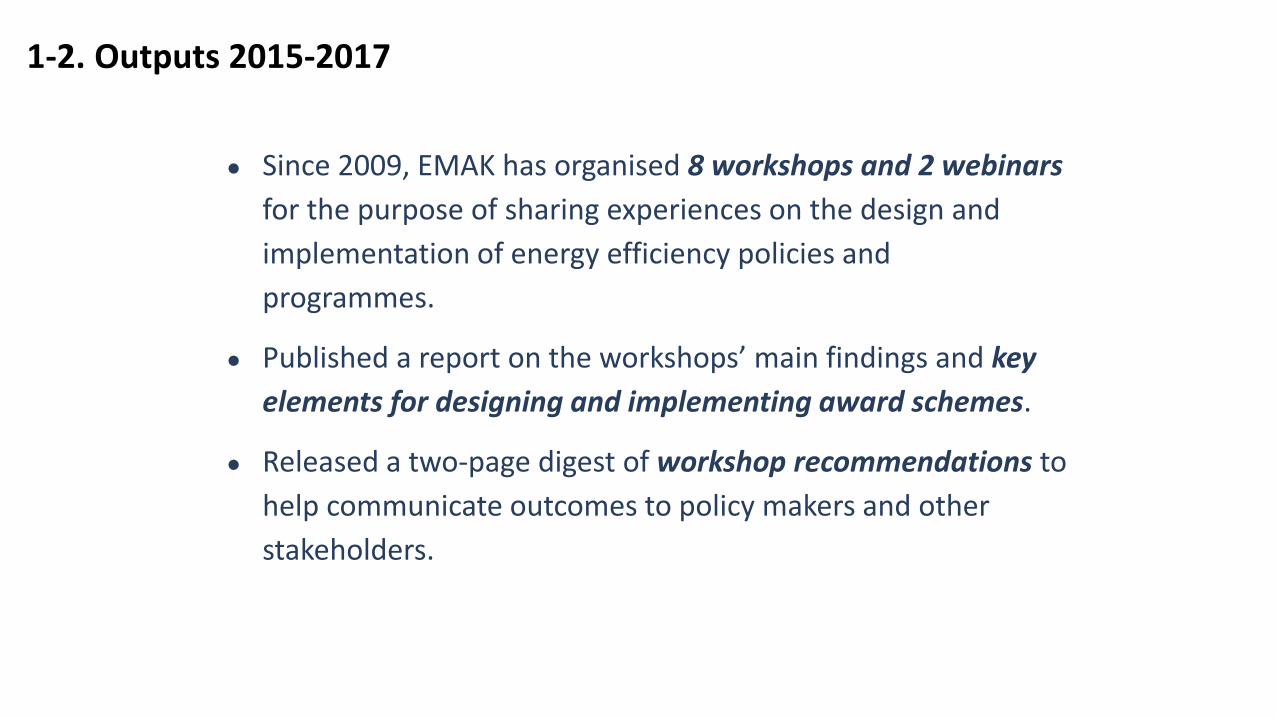
● Since 2009, EMAK has organised 8 workshops and 2 webinars
for the purpose of sharing experiences on the design and
implementation of energy efficiency policies and
programmes.
● Published a report on the workshops’ main findings and key
elements for designing and implementing award schemes.
● Released a two-page digest of workshop recommendations to
help communicate outcomes to policy makers and other
stakeholders.
1-2. Outputs 2015-2017

● EMAK’s report on “Recognised Energy Management Best
Practices and Award Programs for Best Practices” provides
insights on how governments can design and implement
impactful energy management award programmes.
● By considering these practical elements, policy makers can
accelerate the development of their own award programmes
and ensure that these successfully support their government’s
energy management goals in an impactful manner.
1-3. Recent example of EMAK’s impact

● Holding further workshops to facilitate best practice
exchange on energy management systems (e.g. 9th EMAK
workshop in the Brazil)
● Possibly enhancing cooperation and partnerships with other
IPEEC Task Groups and international organisations.
● Identifying options (tools and best practices) to overcome
energy efficiency barriers, both at workshops and by sharing
workshop outcomes and reports.
● Posting reports and presentation papers from workshops on
the IPEEC portal.
1-4. Programme of work / Outlook
2. Japan’s Energy Efficiency Policy

0
100
200
300
400
500
600
0
50
100
150
200
250
300
350
400
450
1973 75 80 85 90 95 2000 05 10 15
(Millions KL, Crude Oil
Equivalent)
(year)
産業部門
運輸部門
(JPY trillion)
Industry
Commercial
Transport
Residential
【Source】 Energy Statistics and Annual Report on National Accounts
Real GDP1973→2015
2.6 times
Final Energy Consumption
Total
1973→2015
1.2times
Transport
1973→2015
1.7times
Residential
1973→2015
1.9times
Commercial
1973→2015
2.3times
Industry
1973→2015
0.8times
Trend of Final Energy Consumption

1.0
1.1
1.2
1.3
1.4
1.5
1.6
1.7
1.8
1.9
2.0
1973
1974
1975
1976
1977
1978
1979
1980
1981
1982
1983
1984
1985
1986
1987
1988
1989
1990
1991
1992
1993
1994
1995
1996
1997
1998
1999
2000
2001
2002
2003
2004
2005
2006
2007
2008
2009
2010
2011
2012
2013
2014
2015
Source: ANRE/METI
(Oil equivalent Million ton /1 trillion yen)
Approx. 40% improvement
Final Energy Consumption per Real DGP

Basic Framework of Energy Efficiency Policy

Act on the Rational Use of Energy (1979)

History of the Act on the Rational Use of Energy

Energy Management SystemEE&C improvement efforts by the in-house experienced energy managers being supported by government’s stable provision of economic incentives and know-how sharing platform
Benchmark SystemAssist EE&C efforts by the factories/business entities with the intra-industry comparison
Voluntary Action PlanFacilitate intra-industry sharing and deployment of best practices
Top Runner ProgramR&D efforts by the manufacturing industries and consumers’ choice toward EE technologies –supported by labeling and economic incentives
Factors Affecting the Successful Implementation
of Key EE Policies

Final Energy Consumption
2030(With development of Energy Efficiency measures)
2013(Actual)
361 million KLOE
Econ growth (estimate)1.7%/year
326 million KLOE
376 million KLOE
Final energy consumption(Long-term energy demand & supply outlook)
Energy Efficiency Improvement
50.3 million KLOEEnergy Saving
Industry45%
Commercial
18%
Transport
23%
Residential
14%
Industry52%
Commercial
17%
Transport
19%
Residential
12%
60
70
80
90
100
110
0 5 10 15 20
1970-1990
1990-2010
2012-2030
Energy efficiency rate = Final energy consumption /real GDP
35% Improvement
year
Energy Efficiency improvement towards 2030

Energy Supply/Demand Structure toward CO2 Emissions
Reduction Target in 2030
○ While energy demand growth is projected in line with economic growth (an average 1.7%), energy efficiency is expected to improve as much as after the oil crises thorough energy conservation (35% in 20 years).
○ Energy supply/demand structure improvement (energy self-sufficiency rate: 6% in 2014⇒24.3% in 2030)
○ Japan’s CO2 emissions reduction target (26% CO2 emissions reduction in 2030 compared with 2013 level)
(Source) METI “Long-term Energy Supply/Demand Outlook” p.5 (July 16, 2015)
FY2030(After Energy
Savings)
FY2013(Actual)
Final Energy Demand
HeatGasolineCity gas75%
Electricity
25%
361million kl
Sweeping Energy Savings
50 mllion kl(▲13% w.r.t.
reference case)
Electricity
28%
HeatGasoline City gas72%
GDP1.7%/year
326million kl
Primary Energy Supply
Self-sufficiency 24.3%
FY 2030
Coal 25%
Natural Gas 18%
Oil 30%
Renewables13~14%
Nuclear11~10%
489 million kl
LPG3%
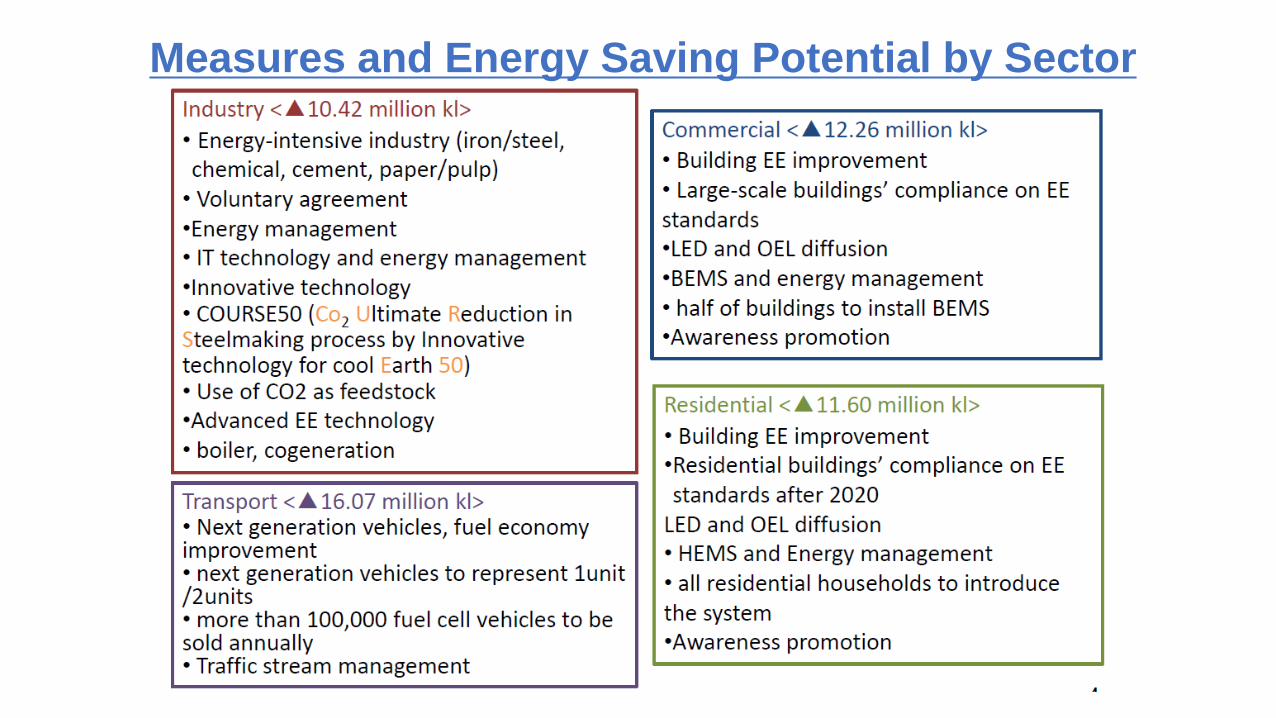
Measures and Energy Saving Potential by Sector

Commercial Sector <approx. -12.26 million kL>
Transportation Sector <approx. -16.07 million kL>
Industrial Sector <approx. -10.42 million kL>
Residential Sector <approx. -11.60 million kL>
-1.19 million kl(Progress rate:11.5%)as of 2015 -1.26 million kl(Progress rate:10.3%)as of 2015
-2.41 million kl(Progress rate:15.0%)as of 2015-1.11 million kl(Progress rate:9.5%)as of 2015
Main measures
• Promotion of efficient lights including LED[49.0 / 228.8
million kl (21.4%) ]
• Improve energy-saving performance of equipment by equipment top runner program[25.0 / 278.4 million kl (9.0%) ]
• Implementation of energy management through BEMS
[29.5 / 235.3 million kl (12.5%) ]
Main measures
• Promotion of efficient lights including LED[60.0 / 201.1
million kl (29.8%) ]
• Improve energy-saving performance of equipment by equipment top runner program
[10.8 / 133.5 million kl (8.1%) ]
• Implementation of energy management through HEMS[0.7 / 178.3 million kl (0.4%) ]
Main measures• Diffusion of next-generation automobiles[59.1 / 938.9
million kl(6.3%) ]
• Other measures in transportation sector[181.5 / 668.2million kl (27.2%) ]
(Breakdown)Freight transport[74.4 / 337.6 million kl(22.0%) ]
Passenger transport[107.1 / 330.5 million kl(32.4%) ]
Main measures
• Promotion of efficient lights including LED[0.33 / 1.08
million kl (30.6%) ]
• Introduction of industrial heat pump[0.03 / 0.88 million kl (3.5%) ]
• Introduction of industrial motors[0.04 / 1.66 million kl (2.4%) ]
• Implementation of energy management through FEMS[0.06 / 0.67 million kl (9.2%) ]
Total <approx. -50.30 million kl> -6.00 million kl(Progress rate:11.8%)as of 2015
Progress for the Target 2030
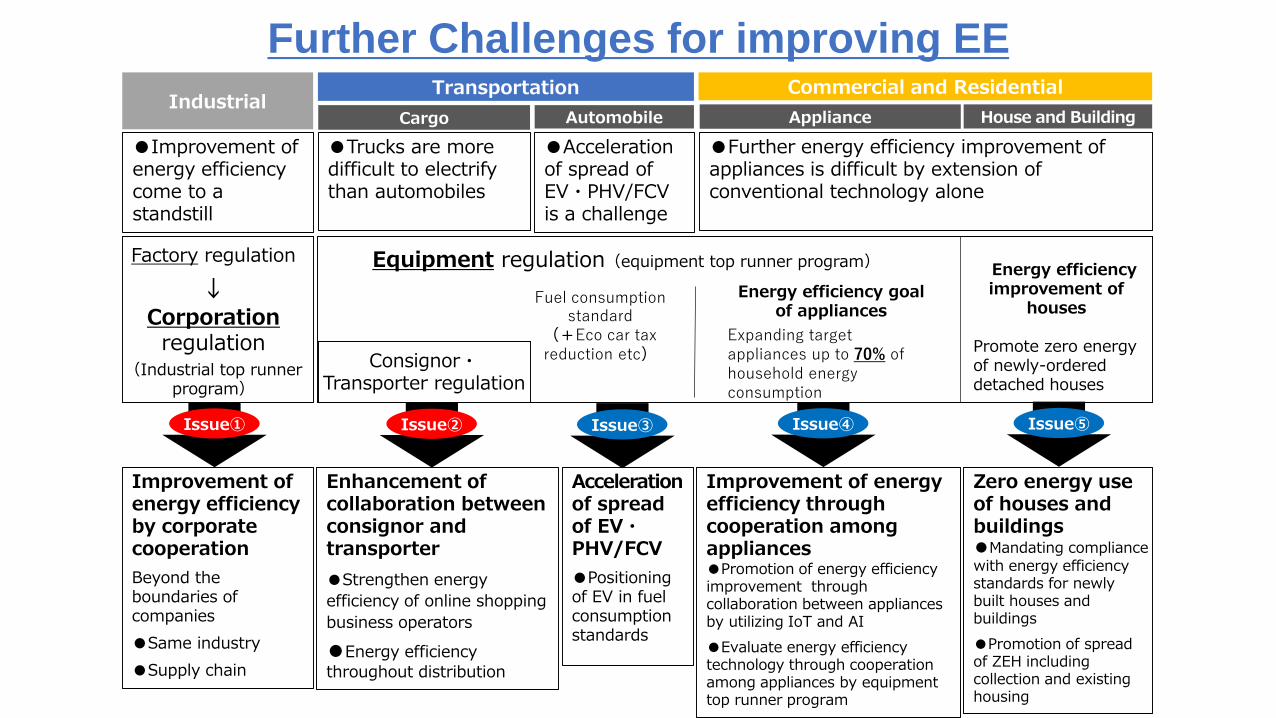
Transportation
Automobile
Improvement of energy efficiency by corporate cooperation
Beyond the boundaries of companies
●Same industry
●Supply chain
Equipment regulation(equipment top runner program)
Improvement of energy efficiency through cooperation among appliances●Promotion of energy efficiency improvement through collaboration between appliances by utilizing IoT and AI
●Evaluate energy efficiency technology through cooperation among appliances by equipment top runner program
IndustrialCommercial and Residential
Cargo
Enhancement of collaboration between consignor and transporter
●Strengthen energy
efficiency of online shopping
business operators
●Energy efficiency
throughout distribution
Fuel consumption standard
(+Eco car tax reduction etc)
Energy efficiency goal of appliances
Expanding target appliances up to 70% of household energy consumption
Factory regulation
↓
Corporationregulation
(Industrial top runner program)
Consignor・Transporter regulation
Accelerationof spread of EV・PHV/FCV
●Positioning of EV in fuel consumption standards
Issue①
●Improvement of energy efficiency come to a standstill
●Trucks are more difficult to electrify than automobiles
●Acceleration of spread of EV・PHV/FCV is a challenge
●Further energy efficiency improvement of appliances is difficult by extension of conventional technology alone
House and BuildingAppliance
Energy efficiencyimprovement of
houses
Promote zero energy of newly-ordered detached houses
Zero energy use of houses and buildings●Mandating compliance with energy efficiency standards for newly built houses and buildings
●Promotion of spread of ZEH including collection and existing housing
Issue② Issue③ Issue④ Issue⑤
Further Challenges for improving EE

(Example) Production facility integration
Companies integrating
production process can share
the result of energy savings
from such effort. Company B
Upstream
Process
Integration
Downstream
ProcessCompany A Products
ProductsUpstream
Process
Energy Savings
Energy Increases
Total Savings
Regulation for each single business entity Allows joint efforts from plural business entities
【Current】 【Amendment】
Downstream
Process
【Current】 【Amendment】
Freight Owner =Owner of
transporting goods
Freight Owner=Those entities
determining the transport methods
Some of the internet retail business entities
were outside of this regulation.
Freight Transport
Internet retail
business A
Internet retail
business B
Cooperate
・Joint transport
・Joint use of stockyard
Cooperate・Improve utilization rate
・Load levelization
・Light/small box
・Installment of receiving box
The Law will cover wider internet retail business entities,
which will have a greater impact on energy
consumption.
Recent Amendment of the EE Act (2018)


Appendix
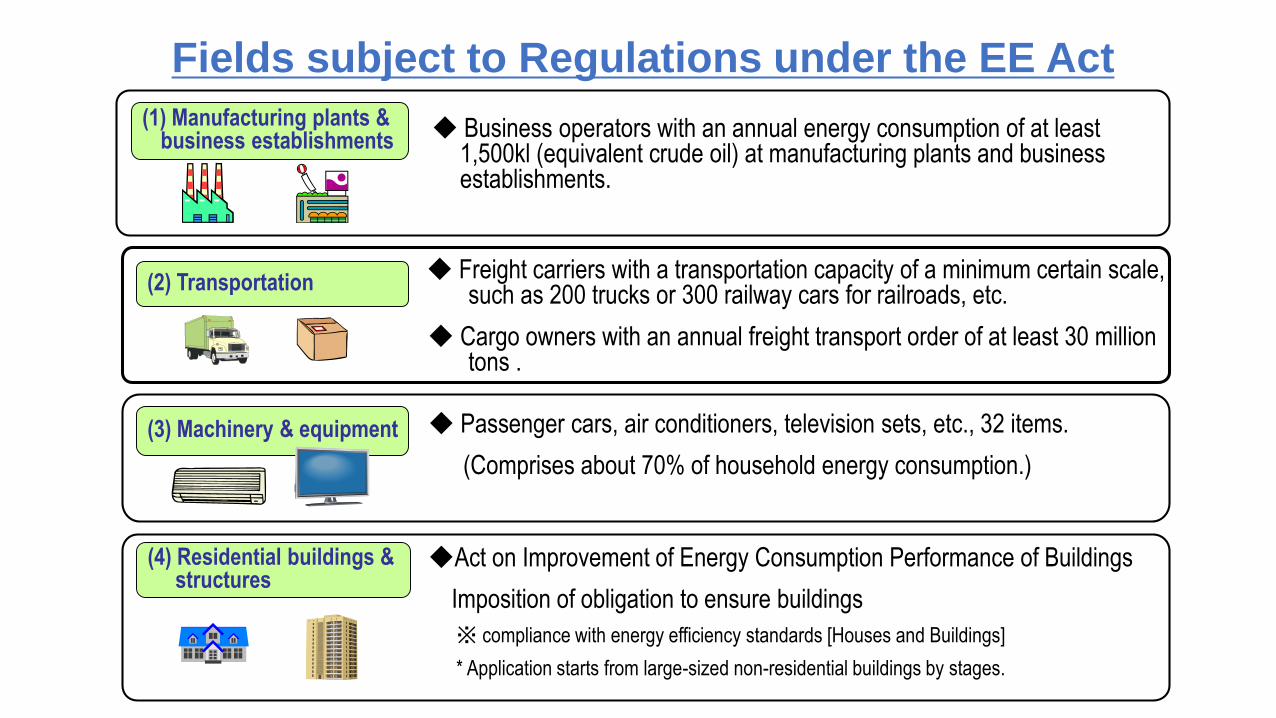
(1) Manufacturing plants & business establishments
(2) Transportation
(3) Machinery & equipment
◆ Business operators with an annual energy consumption of at least 1,500kl (equivalent crude oil) at manufacturing plants and business establishments.
◆ Freight carriers with a transportation capacity of a minimum certain scale, such as 200 trucks or 300 railway cars for railroads, etc.
◆ Cargo owners with an annual freight transport order of at least 30 million tons .
◆ Passenger cars, air conditioners, television sets, etc., 32 items.
(Comprises about 70% of household energy consumption.)
(4) Residential buildings & structures
◆Act on Improvement of Energy Consumption Performance of Buildings
Imposition of obligation to ensure buildings
※ compliance with energy efficiency standards [Houses and Buildings]
* Application starts from large-sized non-residential buildings by stages.
Fields subject to Regulations under the EE Act

< Matters to be stated in periodic reports >
Implementation status of energy efficiencymeasures
Changes in specific energy consumption
Status of the benchmark indices (for onlyapplicable types of business)
○ Judgement on standards for energy efficiencymeasures (Matters to be observed concerningbusiness operators’ management systems andmanagement methods of individual devices
○Benchmark index/target levels (for several businesssectors (e.g. manufacture of steel, power supply,manufacture of cement, manufacture of paper,petroleum refinery, and manufacture of chemicals)
○Non-binding target (Reduction by 1% or more on an annual average basis)
Busi
ness
opera
tors
Submission of periodic reports
METI
Gu
idan
ce
Evaluation of the details ofsubmitted reports,SABC evaluation
In case - businessoperator’s effortsare utterlyinsufficient
In case - a businessoperator does notfollow the directiongiven
Pu
blicati
on
an
d
issu
an
ce o
f an
ord
er
Dir
ect
the
pre
para
tion
an
d
su
bm
issio
n o
f a
str
eam
lin
ing
pla
n
In case - a businessoperator does notfollow the order
Pu
nis
hm
en
t
Implementation Flow of Reporting System under the Act

*1 Calculated based on the total number of business operators that have submitted periodic reports in FY2017 (regarding performance in FY2016) (11,403 companies)
*2 Non-binding target: Reduction of specific energy consumption by 1% or more on average for five years
*3 Benchmark target: Levels to be aimed at in the medium- and long-term in business types and fields covered by the Benchmark System
Class AGeneral business operators
3,333 companies(29.2%)
Class SBusiness operators superior in
energy efficiency efforts6,469 companies(56.7%)
Class BBusiness operators whose energy
efficiency efforts are not progressing
1,601 companies(14.0%)
Class CBusiness operators
requiring close monitoring
[Levels]
Not falling under Class S nor Class
B
[Measures]
No particular measures are taken.
[Levels]
(i) Having achieved the non-
binding target*2
or
(ii) Having achieved the benchmark
target*3
[Measures]
The name and number of years
during which the relevant business
operator has been classified into
Class S continuously are publicized
on the METI website to praise the
business operator as an excellent
one.
[Levels]
(i) Having failed to achieve the non-
binding target and increased
specific energy consumption from
the preceding year for two years in
a row
or
(ii) Having increased specific
energy consumption by 5% or more
on average for five years
[Measures]
A written notice is sent and on-site
inspections, etc. are conducted
intensively.
[Levels]
Among business operators classified
into Class B, those that are
especially bad at complying with
judgment standards
[Measures]
Guidance based on Article 6 of the
Act on the Rational Use of Energy is
provided.
*1 *1 *1
Example of Behaviour Change Measures (Industry): Evaluation system by Business Operator Classification

Benchmark System

Benchmark System

Fuel
economy
(km/L)
Energy efficiency Standards according to Top Runner Program
When standards are set Target fiscal year
19km/L
18km/L
17km/L
15km/L15km/L
14km/L
13km/L
12km/L
16
Judgment made with weighted
average for each product category.
Example of Top Runner Programme
Top Runner Programme: Basic Concept on how to set the Target Efficiency Standard

1. Passenger vehicles
2. Air conditioners
3. Lighting equipment
(Using only fluorescent lamps as main light source)
4. TV sets
5. Photocopy machines
6. Computers
7. Magnetic disk units
8. Freight Vehicles
9. Video cassette recorders
10. Electrical refrigerators
22. Routers
23. Switching unitts
24. Multifunction devices
25. Printers
26. Electric water heaters
27. AC motors
28. Self-ballasted LED lamps
29. Showcase
30. Insulation materials
31. Sashes
32. Multi-paned glazing
11. Electrical freezers
12. Space heaters
13. Gas cooking appliances
14. Gas water heaters
15. Oil water heaters
16. Electric toilet seats
17. Vending machines
18. Transformers
19. Electric rice cookers
20. Microwave ovens
21. DVD recorders
*1.-9.:Apr. 1999, 10.-11.: Dec. 1999, 12.-18.: Dec. 2002, 19.-21.: Apr. 2006, 22.-23.: Jul. 2009, 24.-26.: Mar. 2012, 27.-28.: Nov. 2013, 29.: Feb.2016, 31.-32.: Nov. 2014
Top Runner Programme: 32 Equipment and Materials

Labelling Programme supports Top Runner Programme

*1. Estimated by the Institute of Energy Economics, Japan (IEEJ), based on the Agency for Natural Resources and Energy's FY2009 Residential and Commercial Sector Energy Data Survey (10,040 valid responses) and Supplementary Survey concerning Appliance Use(?) (1448 valid responses)
*2. This survey is based on tabulation and analysis of each energy source, with values unified and converted on megajoule (MJ) basis. Electric power in secondary conversion value.
70% is coveredby the program
Top Runner Programme covers 70% of appliances and equipment in Household

1174
1220
1241
1212
1157
1048 1028
1028 997
966
924
884
860
896 872
862
700
800
900
1000
1100
1200
1300
1998 2000 2002 2004 2006 2008 2010 2012 2014
12.3
12.1
12.4 12.9
13.2 13.5
14.0 14.6
14.7 15.0
15.1 15.5
15.7
16.5 17.8
18.3 19.5
21.1
22.5
23.8
8
10
12
14
16
18
20
22
24
26
1994 1996 1998 2000 2002 2004 2006 2008 2010 2012 2014
FY
30.7%
improvement
[Air conditioners]
Transition in fuel economy of average new carsFuel
economy
(km/L)
(Note) Fuel economy values for the 10-15 mode. (Note) Wall mounted cooling and heating units with cooling capacity of 2.8kW-
class model; simple average values for a representative model of energy
conserving-type products.
FY
Electric power consumption for period Electric power
consumption for
period (kWh)
31
96.7%
improvement
[Passenger vehicles]
EE improvement with Top Runner Programme