email regarding test and analysis plan for west lake
TRANSCRIPT

Page 1
Test and Analysis Plan for West Lake Smolder Event Samples
A. Discussion of Isotope Selection and Natural Occurring Radioisotope Decay Chains
The best starting point for verification of radioisotope selection is the inspection of a decay chain for
each of the three main natural occurring radioisotopes, Uranium 238, Uranium 235 and Thorium 232.
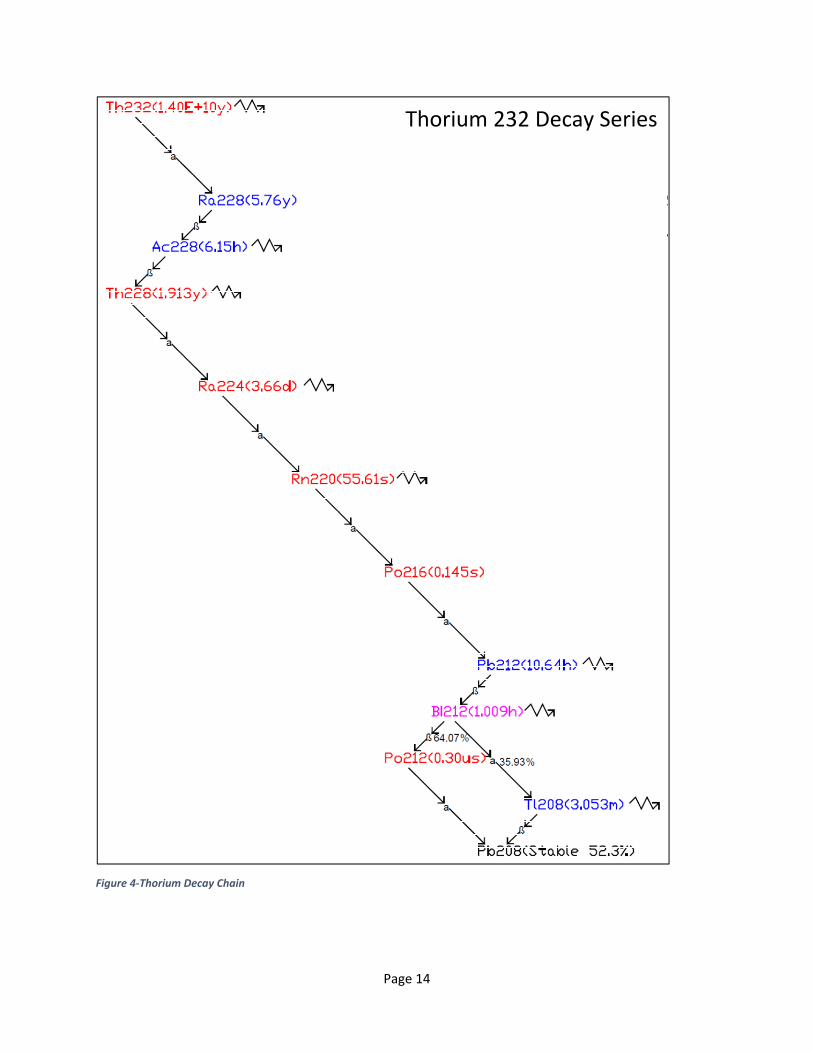
Copies of the decay chains are included as figures 2, 3 and 4 at the end of this this report. A brief
discussion of interpretation of the chains is a follows: Isotopes are color coded based on their primary
decay mechanism, Red for Alpha decay and Blue for beta decay. The half‐life for each isotope is given in
parenthesis. The branching percentage (the percentage of the time that an isotope decays by that
mechanism) is given next to the alpha or beta symbol. Finally, a squiggle arrow next an isotope symbol
indicates that an isotope has a useful gamma ray that can be used for analysis. An important property
of radiation decay is secular equilibrium. Secular equilibrium occurs when a long lived parent isotope
produces a much shorter lived daughter isotope and the daughter isotopes in‐grows until its activity is
the same as the parent. The most appropriate example of this is Radium 226, decaying into Radon 222.
After 10 Radon 222 half‐lives (38.2 days), the activity of Radon is the same as that of its parent Radium.
This means that one can measure the radon activity and know the radium activity and visa‐versa. This
effect can continue down the chain, such that (see figure 2) Lead 214 and Bismuth 214 will also be in
equilibrium, and can be used to measure the activity of radium and all of her daughters. Secular
equilibrium means one only has to analyze either the parent or a single daughter to determine the
activity of all daughters and the parent isotope, allowing the use of the most sensitive and selective
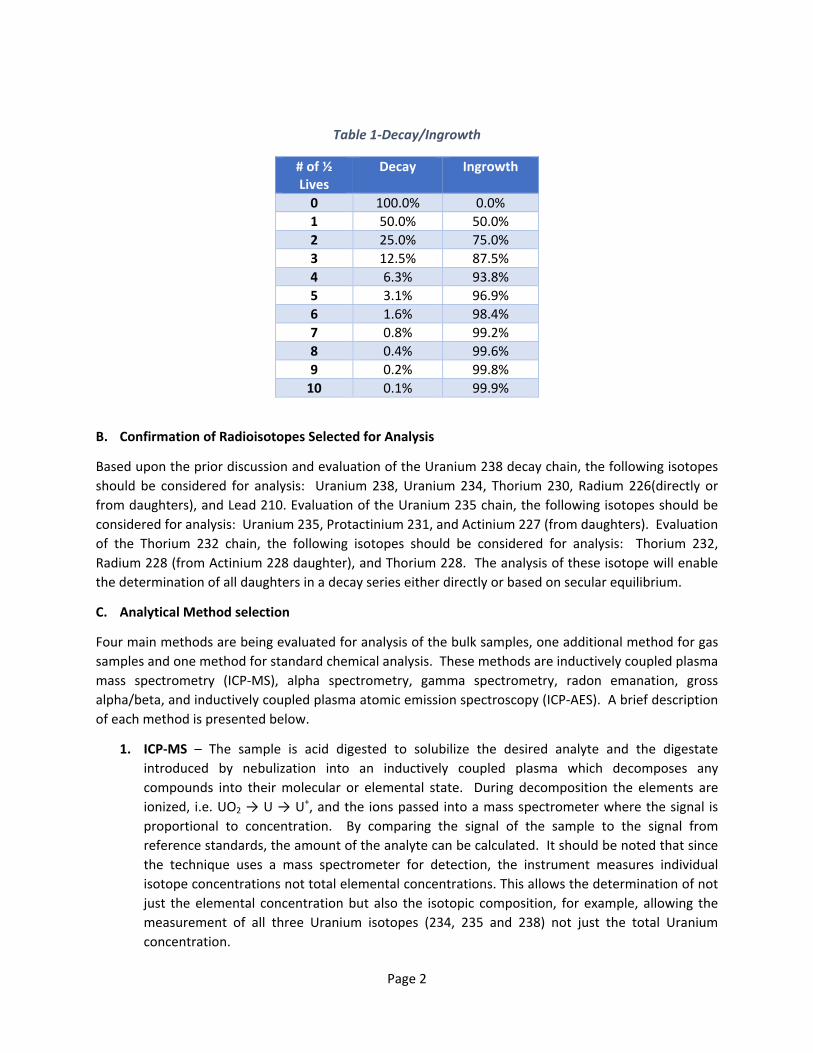
method. Table1 shows the ingrowth and decay of any isotope based on the number of half‐lives that
have elapsed. Secular equilibrium does NOT work when the parent and daughter have similar half‐lives
such as Uranium 234 and Thorium 230. In this case, by the time the Thorium would reach equilibrium,
the Uranium will have significantly decayed, although they would eventually reach equilibrium, there is
a great deal of time (hundreds of thousands of years) when they would not be in equilibrium. In this
case, no inference of the activity between parent and daughter can be done, necessitating the analysis
of both parent and daughter. This is also true when a short lived parent decays into a long lived
daughter such as Protactinium 234 decaying into Uranium 234. Equilibrium can also be upset by
breaking the decay chain by physically removing a parent or daughter. In the example of Radium and
Radon, since Radon is a gas, if the sample is purged, removing the radon before it has time to decay,
then the chain will be broken and none of the daughters will be present in the sample. The same
number of daughters and total activity will be produced, it is just that they will be physical removed
from the original sample location. This can also occur if water flows through a sample and the chemistry
is such that for example, Uranium is dissolved but Radium is left behind. This is the exact issue with
Uranium mill tailings, the Uranium was removed to be used but all the associated Radium was left
behind.
Page 2
Table 1‐Decay/Ingrowth
B. Confirmation of Radioisotopes Selected for Analysis
Based upon the prior discussion and evaluation of the Uranium 238 decay chain, the following isotopes
should be considered for analysis: Uranium 238, Uranium 234, Thorium 230, Radium 226(directly or
from daughters), and Lead 210. Evaluation of the Uranium 235 chain, the following isotopes should be
considered for analysis: Uranium 235, Protactinium 231, and Actinium 227 (from daughters). Evaluation
of the Thorium 232 chain, the following isotopes should be considered for analysis: Thorium 232,
Radium 228 (from Actinium 228 daughter), and Thorium 228. The analysis of these isotope will enable
the determination of all daughters in a decay series either directly or based on secular equilibrium.
C. Analytical Method selection
Four main methods are being evaluated for analysis of the bulk samples, one additional method for gas
samples and one method for standard chemical analysis. These methods are inductively coupled plasma
mass spectrometry (ICP‐MS), alpha spectrometry, gamma spectrometry, radon emanation, gross
alpha/beta, and inductively coupled plasma atomic emission spectroscopy (ICP‐AES). A brief description
of each method is presented below.
1. ICP‐MS – The sample is acid digested to solubilize the desired analyte and the digestate
introduced by nebulization into an inductively coupled plasma which decomposes any
compounds into their molecular or elemental state. During decomposition the elements are
ionized, i.e. UO2 → U → U+, and the ions passed into a mass spectrometer where the signal is
proportional to concentration. By comparing the signal of the sample to the signal from
reference standards, the amount of the analyte can be calculated. It should be noted that since
the technique uses a mass spectrometer for detection, the instrument measures individual
isotope concentrations not total elemental concentrations. This allows the determination of not
just the elemental concentration but also the isotopic composition, for example, allowing the
measurement of all three Uranium isotopes (234, 235 and 238) not just the total Uranium
concentration.
# of ½ Lives
Decay Ingrowth
0 100.0% 0.0%
1 50.0% 50.0%
2 25.0% 75.0%
3 12.5% 87.5%
4 6.3% 93.8%
5 3.1% 96.9%
6 1.6% 98.4%
7 0.8% 99.2%
8 0.4% 99.6%
9 0.2% 99.8%
10 0.1% 99.9%

Page 3
2. Alpha Spectrometry – The sample is acid digested to solubilize the desired analyte and the
target analyte chemically separated and purified via ion exchange. The purified analyte is
prepared for counting via process called mounting, where the analyte is put in a preferred
geometry designed to allow the alpha particles to quantitatively escape, to be vacuum stable
and in a size optimized for the equipment being used. The mounted sample is placed in close
proximity to the alpha detector and both the sample and detector are usually in a vacuum
chamber, which is evacuated during counting. The close proximity to the detector, vacuum and
special mounting procedures are necessary due to the nature of alpha particles being very easy
to shield, even by a small amount of air. The alpha particles interact with the detector and
generate a distribution based on kinetic energy of the alpha particle and number of alpha at that
energy. Since the energy of an alpha particle is diagnostic of the isotope from which it came,
measuring the number of detections from a given energy allows the determination of the
activity of that isotope in the sample.
3. Gamma Spectrometry – This technique allows sample analysis with little or no sample
preparation. The sample is counted in bulk. Samples are placed in a bulk container and place
directly in close proximity to the gamma detector. Solid samples are placed in gas tight
containers to prevent radon gas from escaping, allowing the in‐growth radon daughters. The
gamma photons interact with the detector and generate a distribution based on the energy of
the photon and number of photons at that energy. Since the energy of a gamma photon is
diagnostic of the isotope from which it came, measuring the number of detections from a given
energy allows the determination of the activity of that isotope in the sample.
4. Radon Emanation – An aliquot of soil, or a column of soil if measuring radon diffusion, is sealed
in a container and purged of radon using gas (air, N2, etc.), that has been stored long enough to
allow any radon in the gas to decay (see table 1, 7 half‐lives, 28 days, for 99% reduction). The
sample container is sealed, and stored long enough for radon to in‐grow (See table 1). If the
sample is not held long enough for full in‐growth, the activity is corrected based on the in‐
growth factor. The gas headspace is mixed well and the headspace gas, including any radon,
purged into an evacuated Lucas cell. A Lucas cell is a vacuum chamber with an optical window
and all other surfaces coated with a special substance that glows when hit by alpha radiation.
The flashes of light are counted by a photomultiplier tube and are proportional to the amount of
radon in the gas sample. The data are corrected for Radon in‐growth in the sample, Radon
decay during sampling and counting and the in‐growth of Alpha emitting Radon daughters.
5. Gross Alpha/Beta – This technique involves the direct measurement of samples for alpha and
beta particle emissions with little or no preparation. For air filters, the samples are dried to
reduce attenuation from water and the filter placed in close proximity to a gas proportional
detector. The detector generates a voltage pulse when an ionizing alpha or beta particle enters
it. The size of the pulse allows the differentiation of alpha and beta particle.
6. ICP‐AES – The sample is acid digested to solubilize the desired analyte and the digestate
introduced by nebulization into an inductively coupled plasma, which decomposes any
compounds into their molecular or elemental state. During decomposition the elements are
Page 4
ionized, and the ions give off their characteristic wavelength of light. The intensity of this light is
proportional to the concentration of the element in the sample. By comparing the signal of the
sample to the signal from reference standards, the amount of the analyte can be calculated.
D. Bulk Analysis
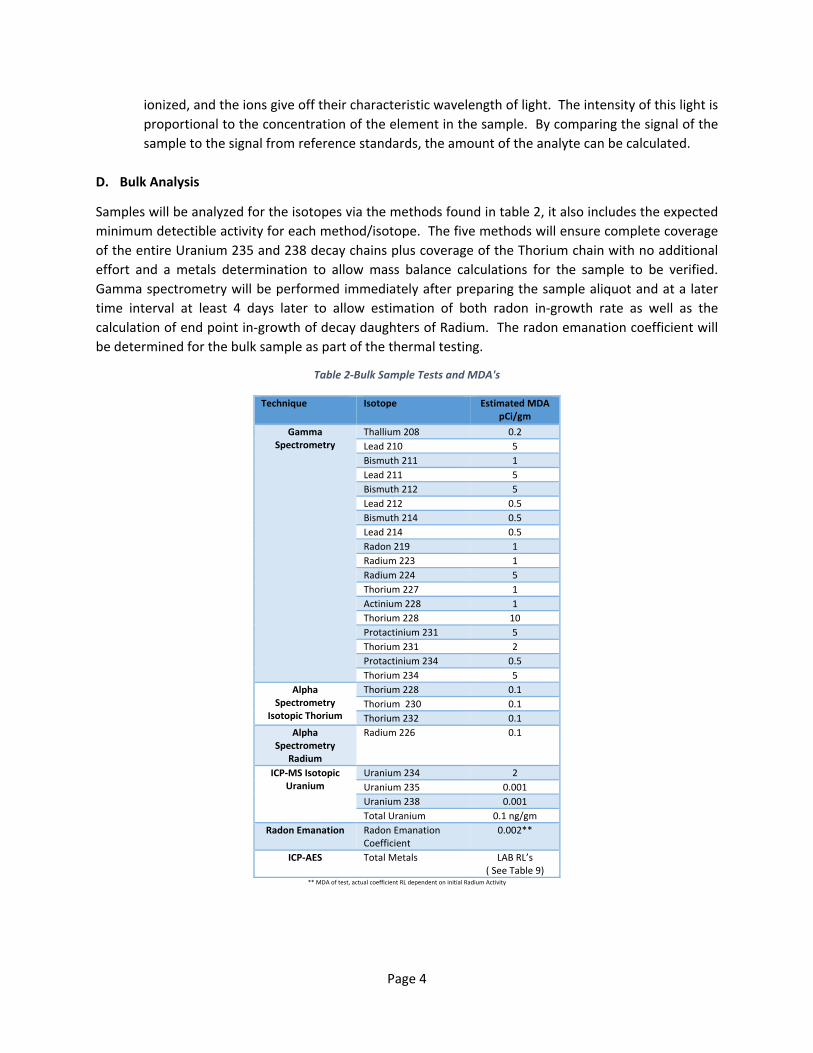
Samples will be analyzed for the isotopes via the methods found in table 2, it also includes the expected
minimum detectible activity for each method/isotope. The five methods will ensure complete coverage
of the entire Uranium 235 and 238 decay chains plus coverage of the Thorium chain with no additional
effort and a metals determination to allow mass balance calculations for the sample to be verified.
Gamma spectrometry will be performed immediately after preparing the sample aliquot and at a later
time interval at least 4 days later to allow estimation of both radon in‐growth rate as well as the
calculation of end point in‐growth of decay daughters of Radium. The radon emanation coefficient will
be determined for the bulk sample as part of the thermal testing.
Table 2‐Bulk Sample Tests and MDA's
** MDA of test, actual coefficient RL dependent on initial Radium Activity
Technique
Isotope
Estimated MDApCi/gm
Gamma Spectrometry
Thallium 208 0.2
Lead 210 5
Bismuth 211 1
Lead 211 5
Bismuth 212 5
Lead 212 0.5
Bismuth 214 0.5
Lead 214 0.5
Radon 219 1
Radium 223 1
Radium 224 5
Thorium 227 1
Actinium 228 1
Thorium 228 10
Protactinium 231 5
Thorium 231 2
Protactinium 234 0.5
Thorium 234 5
Alpha Spectrometry
Isotopic Thorium
Thorium 228 0.1
Thorium 230 0.1
Thorium 232 0.1
Alpha Spectrometry
Radium
Radium 226 0.1
ICP‐MS Isotopic Uranium
Uranium 234 2
Uranium 235 0.001
Uranium 238 0.001
Total Uranium 0.1 ng/gm
Radon Emanation Radon Emanation Coefficient
0.002**
ICP‐AES Total Metals LAB RL’s( See Table 9)

Page 5
E. Radon Emanation and Radioactive Material Release During Thermal Treatment
The radon emanation coefficient and radioactive material release tests will be done on the same sample
aliquot to allow best case correlation of the data and efficiency. A minimum 50 gram aliquot of the bulk
sample will be weighed into the emanation chamber (a 500ml round bottom flask, see figure 1). The
radon emanation rate will be determined on the sample as received, at room temperature, and after the
sample has been heated and held at the target temperatures given in table 3. The chamber(s) will be
heated in a lab oven. During each purging period prior to in‐growth, the purged gas will be passed
through a pre‐weighed membrane filter. After the ramp and hold time, the filter is removed for
analysis, the chamber sealed and left in the oven to in‐grow at least 20 days (95% in‐growth, see table 1)
at temperature. After the in‐growth period, the gas is well mixed and a gas aliquot introduced into a
Lucas cell. The Lucas cell is held a few hours for radon daughter in‐growth and counted to determine
radon activity. The sample will then be heated to the next temperature and the process repeated. The
filters collected during purging will contain any volatilized nuclides or other metals. The filters will be
weighted after humidity stabilization and the mass of any volatilized material calculated. The filter will
be analyzed for the parameters in table 4, starting with the non‐destructive techniques, gross
alpha/beta and gamma spectrometry. The filter and residue will then be acid digested, the digestate
divided 5 ways, and analyzed for the remaining analytes. The results will be reported as found on each
filter as well as a percentage of the bulk analysis (% released). Metals can be analyzed from the ICP‐MS
aliquot if needed or desired and the final residue soil can be held for future analysis if needed due to
non‐ agreement with bulk determinations.
Table 3‐Thermal Test Conditions
Test Temperatures Ramp Time Hold Time for Filter Sampling
Room Temp. (~20°C) ‐‐ 2 hrs
105°C 2 hrs 2 hrs
250°C 4 hrs 2 hrs
Figure 1‐Emmanation Apparatus

Page 6
Table 4‐Volitililized Isotope Filter Analysis and MDA's
** Results will be also calculated as a percentage of original bulk activity
F. Radioactive Material Release During Water Percolation
The effect of thermal treatment on the leachability of the contaminants by water will be measured by
leaching the sample at the conditions defined in table 3. An aliquot of sample will be placed in an air
tight container and leaching fluid (actual site pour water or DI water if not available) will be added at a
ratio of 20:1. The samples will be leached at each of the conditions in table 3 for at least 24 hours with
mixing. After the elapsed time, the sample will be filtered and the filtered leachate analyzed for the
parameters in table 5. A separate aliquot will be used for each condition, starting at room temperature
and ending at the target temperature. The results from each analysis will be reported as well as the
percent increase due from the elevated temperatures. If actual pour water is used, any decrease in
analytes will also be noted, since equilibrium can go both directions. The testing can be modified if
desired to determine the distribution coefficient (kd) by adding a time element to the sampling by taking
a sub sample at 1, 2, 5, 10, and 24 hours. Additional time may be needed to reach equilibrium so
additional samples at 48 and 96 hours may be needed.
Technique
Isotope
Estimated MDApCi/Filter**
Gross Alpha/Beta Not Specific 0.1 Alpha/1 Beta
Gamma Spectrometry
Thallium 208 40
Lead 210 1000
Bismuth 211 200
Lead 211 1000
Bismuth 212 1000
Lead 212 100
Bismuth 214 100
Lead 214 100
Radon 219 200
Radium 223 200
Radium 224 1000
Thorium 227 200
Actinium 228 200
Thorium 228 2000
Protactinium 231 1000
Thorium 231 400
Protactinium 234 100
Thorium 234 1000
Alpha Spectrometry
Isotopic Thorium
Thorium 228 0.5
Thorium 230 0.5
Thorium 232 0.5
Alpha Spectrometry
Radium
Radium 226 0.5
ICP‐MS Isotopic Uranium
Uranium 234 10
Uranium 235 0.005
Uranium 238 0.005
Total Uranium 0.5 ng/gm

Page 7
Table 5‐Bulk Sample Tests and MDA's
G. Quality Assurance
The samples will be analyzed on an as received basis. Each sample will be carefully homogenized
thoroughly before aliquots taken for analysis. A duplicate sample will be analyzed for each
method/preparation technique/matrix. Matrix spikes will not be available for air samples since there is
no way to generate them. Tables 6‐8 contain the basic quality control data to be run for each method
type, i.e. Gamma Spectrometry, Alpha spectrometry ICP‐MS etc.
Technique
Isotope
Estimated MDApCi/l
Gamma Spectrometry
Thallium 208 100
Lead 210 2000
Bismuth 211 500
Lead 211 2000
Bismuth 212 2000
Lead 212 200
Bismuth 214 200
Lead 214 200
Radon 219 500
Radium 223 500
Radium 224 2000
Thorium 227 500
Actinium 228 500
Thorium 228 5000
Protactinium 231 2000
Thorium 231 1000
Protactinium 234 200
Thorium 234 2000
Alpha Spectrometry
Isotopic Thorium
Thorium 228 0.2
Thorium 230 0.2
Thorium 232 0.2
Alpha Spectrometry
Radium
Radium 226 0.2
ICP‐MS Isotopic Uranium
Uranium 234 100
Uranium 235 0.05
Uranium 238 0.05
Total Uranium 0.1 ug/l
Ion Chromatography
Fluoride, Chloride, Bromide, Nitrate, Nitrite, Phosphate, Sulfate
0.1 mg/l
ICP‐AES Total Metals LAB RL’s(See Table 9)
Page 8
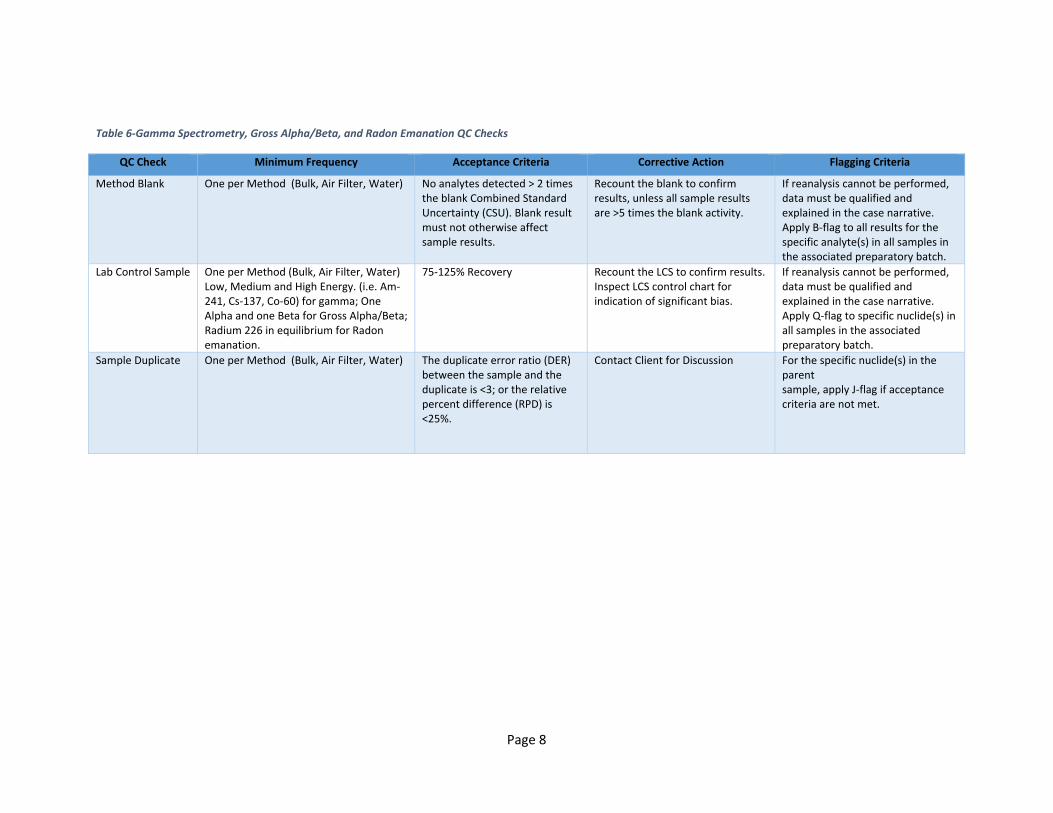
Table 6‐Gamma Spectrometry, Gross Alpha/Beta, and Radon Emanation QC Checks
QC Check Minimum Frequency Acceptance Criteria Corrective Action Flagging Criteria
Method Blank One per Method (Bulk, Air Filter, Water) No analytes detected > 2 times the blank Combined Standard Uncertainty (CSU). Blank result must not otherwise affect sample results.
Recount the blank to confirm results, unless all sample results are >5 times the blank activity.
If reanalysis cannot be performed, data must be qualified and explained in the case narrative. Apply B‐flag to all results for the specific analyte(s) in all samples in the associated preparatory batch.
Lab Control Sample One per Method (Bulk, Air Filter, Water) Low, Medium and High Energy. (i.e. Am‐241, Cs‐137, Co‐60) for gamma; One Alpha and one Beta for Gross Alpha/Beta; Radium 226 in equilibrium for Radon emanation.
75‐125% Recovery Recount the LCS to confirm results. Inspect LCS control chart for indication of significant bias.
If reanalysis cannot be performed, data must be qualified and explained in the case narrative. Apply Q‐flag to specific nuclide(s) in all samples in the associated preparatory batch.
Sample Duplicate One per Method (Bulk, Air Filter, Water) The duplicate error ratio (DER) between the sample and the duplicate is <3; or the relative percent difference (RPD) is <25%.
Contact Client for Discussion For the specific nuclide(s) in the parent sample, apply J‐flag if acceptance criteria are not met.

Page 9
Table 7‐Alpha Spectrometry QC Checks
QC Check Minimum Frequency Acceptance Criteria Corrective Action Flagging Criteria
Method Blank One per Method (Bulk, Air Filter, Water)
No analytes detected > 2 times the blank Combined Standard Uncertainty (CSU). Blank result must not otherwise affect sample results.
Recount the blank to confirm results, unless all sample results are >5 times the blank activity.
If reanalysis cannot be performed, data must be qualified and explained in the case narrative. Apply B‐flag to all results for the specific analyte(s) in all samples in the associated preparatory batch.
Lab Control Sample One per Method (Bulk, Air Filter, Water) At least one isotope of the group (i.e. Th‐232 for isotopic Thorium)
75‐125% Recovery Recount the LCS to confirm results. Inspect LCS control chart for indication of significant bias.
If reanalysis cannot be performed, data must be qualified and explained in the case narrative. Apply Q‐flag to specific nuclide(s) in all samples in the associated preparatory batch.
Sample Duplicate One per Method (Bulk, Air Filter, Water)
The duplicate error ratio (DER) between the sample and the duplicate is <3; or the relative percent difference (RPD) is <25%.
Contact Client for Discussion For the specific nuclide(s) in the parent sample, apply J‐flag if acceptance criteria are not met.
Matrix Spikes One per preparatory batch. (MS not required when chemical yield tracers or carriers are employed).
If activity of the MS > 5 times the unspiked sample, Within 60‐140% recovery.
Contact the client as to additional measures to be taken.
For the specific nuclide(s) in the parent sample, apply J‐flag if acceptance criteria are not met.
Tracers (if used) Added to each sample as isotopic yield monitor.
Isotopic yield within 30‐110%. FWHM <100 keV and peak energy within ±40 keV of known peak energy.
Reanalysis of sample, including sample preparation.
For the specific nuclide(s) in the parent sample, apply J‐flag if acceptance criteria are not met.
Carriers (if used) Added to each sample as chemical yield monitor.
Chemical yield within 30‐110%.
Reanalysis of sample, including sample preparation.
For the specific nuclide(s) in the parent sample, apply J‐flag if acceptance criteria are not met.

Page 10
Table 8‐ICP. ICP‐MS and IC QC Checks
QC Check Minimum Frequency Acceptance Criteria Corrective Action Flagging Criteria
Method Blank One per Method (Bulk, Air Filter, Water)
No analytes detected > Reporting Limit. Blank result must not otherwise affect sample results.
Reanalyze samples, unless all sample results are >10 times the blank results.
If reanalysis cannot be performed, data must be qualified and explained in the case narrative. Apply B‐flag to all results for the specific analyte(s) in all samples in the associated preparatory batch.
Lab Control Sample One per Method (Bulk, Air Filter, Water) At least one isotope of a isotopic group (i.e. U‐238 for isotopic Uranium)
80‐120% Recovery Reanalyze the LCS to confirm results. Re‐prepare the samples.
If reanalysis cannot be performed, data must be qualified and explained in the case narrative. Apply Q‐flag to specific analyte(s) in all samples in the associated preparatory batch.
Sample Duplicate One per Method (Bulk, Air Filter, Water)
Relative percent difference (RPD) is <20%.
Contact Client for Discussion For the specific analytes in the parent sample, apply J‐flag if acceptance criteria are not met.
Matrix Spikes One per preparatory batch. If concentration of the MS > 5 times the unspiked sample, Within 75‐125% recovery.
Contact the client as to additional measures to be taken.
For the specific analytes in the parent sample, apply J‐flag if acceptance criteria are not met.
Post Digestion Spike One per preparatory batch if MS fails or if unable to generate a MS due to limited sample.
If concentration of the MS > 5 times the unspiked sample, Within 80‐120% recovery.
Contact the client as to additional measures to be taken.
For the specific analytes in the parent sample, apply J‐flag if acceptance criteria are not met.

Page 11
Table 9‐ICP Laboratory Reporting Limits
Analyte Water RL mg/L
Soil RL mg/kg
Filter RL ug/filter**
Ag 0.01 1 2.5
Al 0.1 10 25
As 0.01 1 2.5
B 0.04 4 10
Ba 0.005 0.5 1.25
Be 0.005 0.5 1.25
Bi 0.02 2 5
Ca 0.1 10 25
Cd 0.005 0.5 1.25
Co 0.005 0.5 1.25
Cr 0.005 0.5 1.25
Cu 0.005 0.5 1.25
Fe 0.1 10 25
K 0.25 25 62.5
La 0.01 1 2.5
Li 0.01 1 2.5
Mg 0.05 5 12.5
Mn 0.005 0.5 1.25
Mo 0.005 0.5 1.25
Na 0.25 25 62.5
Ni 0.005 0.5 1.25
P 0.05 5 12.5
Pb 0.005 0.5 1.25
Pd 0.02 2 5
S 0.05 5 12.5
Sb 0.02 2 5
Se 0.01 1 2.5
Si 0.1 10 25
Sn 0.01 1 2.5
Sr 0.005 0.5 1.25
Ti 0.005 0.5 1.25
Tl 0.02 2 5
V 0.005 0.5 1.25
W 0.02 2 5
Y 0.005 0.5 1.25
Zn 0.005 0.5 1.25
Zr 0.005 0.5 1.25 ** Assumes 1/5 of filter taken for analysis

Page 12
Figure 2‐Uranium 238 Decay Chain
Uranium 238 Decay Series

Page 13
Figure 3‐Uranium 235 Decay Chain
Uranium 235 Decay SeriesU235<7.04E+8yYV\?I
~ ).231(1,063d>'\I',,,
/ Po.231(32800y) /\/vt
~ '\c227(21,77y)
Th2~8~,.,V,.,
~ )r223(21,8rri)
~~-~ Ro.223(11.4d) ~1% /\/vt
~ )t219<50s)
~ fa~~ Rn2f9<3.96s) ~/\/vt
~ )1215<7rri)
)o2t.78Ms)
.fioo~ At2f5(0,10Ms) ~"
~ Pb211(36.1rri) /\/vt
~121"4M) A.Iv,
Jf(2~~ Po2l1<o-.516s) ~3%
~ i'l207(4,77M)
~2tstdble 22,6¾)
Page 14
Figure 4‐Thorium Decay Chain
Thorium 232 Decay SeriesTh232(1,40E+l0y)"½
~ Ro.228(5, 76y)
/ Ac228(6,15h) "½
/ Th228(1.913y) "½
~o.224(3,66d) ¾
~ Rn220(55,61s)"½
~ Po216(0.145s)
~ ~212(10,64h) ¾
/ Bl212(1,009h)"½
~~-0~ Po212(0,30us)i~3,.
~ )1208(3,053r1) ¾
~2tsto.ble 52,3¾)