ema and fda approaches to process validation - · pdf fileema and fda approaches to process...
TRANSCRIPT
EMA and FDA Approaches to Process Validation
Presented by Ashley Isbel and Marc Fini
4 July, 2016

Slide 2 © PharmOut 2015
Agenda
• Where do the EMA and FDA disagree?• Where do they ask for different requirements?
• How you can develop a single approach to be compliant across both regulators
What are the key differences between the EMA and FDA approaches for process validation?
How you can navigate the two approaches to present an integrated, compliant strategy.
• What are the main changes from the previous approaches?• Are you going to require significant change and investment to comply?
A quick overview of the new FDA and EMA process validation approaches

Part 1: Overview of the New Process Validation Requirements

Slide 4 © PharmOut 2015
FDA Approach to Process Validation
Emphasised in the FDA’s 2011 guidance document – Process Validation: General Principles and Practices.
Process Validation is “the collection and evaluation of data,
from the process design stage through commercial
production which establishes scientific evidence that a process is capable of consistently delivering quality product.”

Slide 5 © PharmOut 2015
FDA Approach to Process Validation
Objective
To understand and control input variability impact and manufacturing process to assure consistent product quality and reliable supply.
• Science and Risk based PV / PPQ – product and process understanding, good science, statistical confidence.
− Statistically based sampling plans and acceptance criteria for PPQ / PV and release.
• Understanding the impact of variability and demonstrating control strategy is robust beyond the variability
– Variability in raw materials / excipients, parameter control, operators, shifts, equipment sets, etc.
Slide 6 © PharmOut 2015
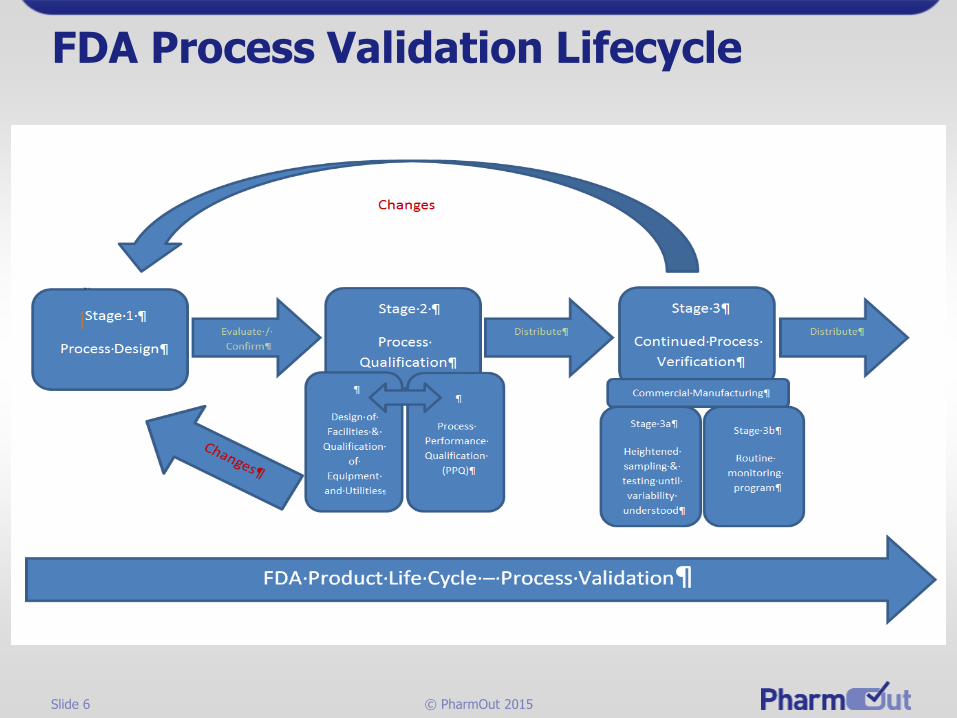
FDA Process Validation Lifecycle

Slide 7 © PharmOut 2015
FDA Approach to Process Validation
PV Stage 3a (Establishing initial process variability)
• “We recommend continued monitoring and sampling of process parameters and quality attributes at the level established during the process qualification stage until sufficient data are available to generate significant variability estimates.”
PV Stage 3b (After variability established)
• “Monitoring can then be adjusted to a statistically appropriate and representative level.”
Slide 8 © PharmOut 2015
EMA Approach to Process Validation
• “A quality risk management approach should be applied throughout the lifecycle of a medicinal product. As part of a quality risk management system, decisions on the scope and extent of qualification and validation should be based on a justified and documented risk assessment of the facilities, equipment, utilities and processes.”
• A robust product development process is required to enable successful process validation.
• Before product is released to the market, the process must be shown to be robust and ensure consistent product quality irrespective of the approach used.
Slide 9 © PharmOut 2015
EMA Approach to Process Validation
• Retrospective validation no longer acceptable.
• Concurrent validation only acceptable where there is a strong benefit-risk ration for the patient.
• Appropriate quality oversight over the whole validation life cycle is essential.

Slide 10 © PharmOut 2015
EMA Approach to Process Validation
• The V-model concept is still appropriate.
• Testing completed during FAT / SAT can be leveraged provided that:
• The strategy is defined up front.
• Good documentation practice and data integrity practices are followed throughout the testing.
• Appropriate quality oversight is applied to the testing.

Part 2: Key differences between the EMA and FDA approaches for process validation

Slide 12 © PharmOut 2015
EMA vs. FDA – Differences
• The differences in the guidance documents are not significant. Properly developed processes / products should meet the expectations of both EMA & FDA.
• The core expectations of both EMA & FDA with respect to process validation overall are nearly identical and likely to be more closely aligned in the future.
• FDA – Currently effective
• EMA – Final version released 30th March 2015
Effective 1st October 2015

Slide 13 © PharmOut 2015
EMA vs. FDA – The Focus
• FDA focuses on understanding and controlling variability.
• EMA focuses on science based, quality risk management.
• EMA tends to be more apprehensive with respect to novelty and identifies specific products / processes where additional products / processes where additional concerns are present.
• There is substantially less mention in the EMA guidance with respect to the use of statistics.

Slide 14 © PharmOut 2015
EMA vs. FDA – Process Validation Life Cycle
• FDA uses the term “Process Validation” to refer to the life cycle of validation, from process design to routine manufacture.
• EMA uses the term “Process Validation” to represent the life cycle of the product. “Qualification and Validation” is used to define processes applicable to facilities, services and equipment. Process
Design
Process Qualification
ContinuedProcess
Verification
Continuous Improvement
Slide 15 © PharmOut 2015
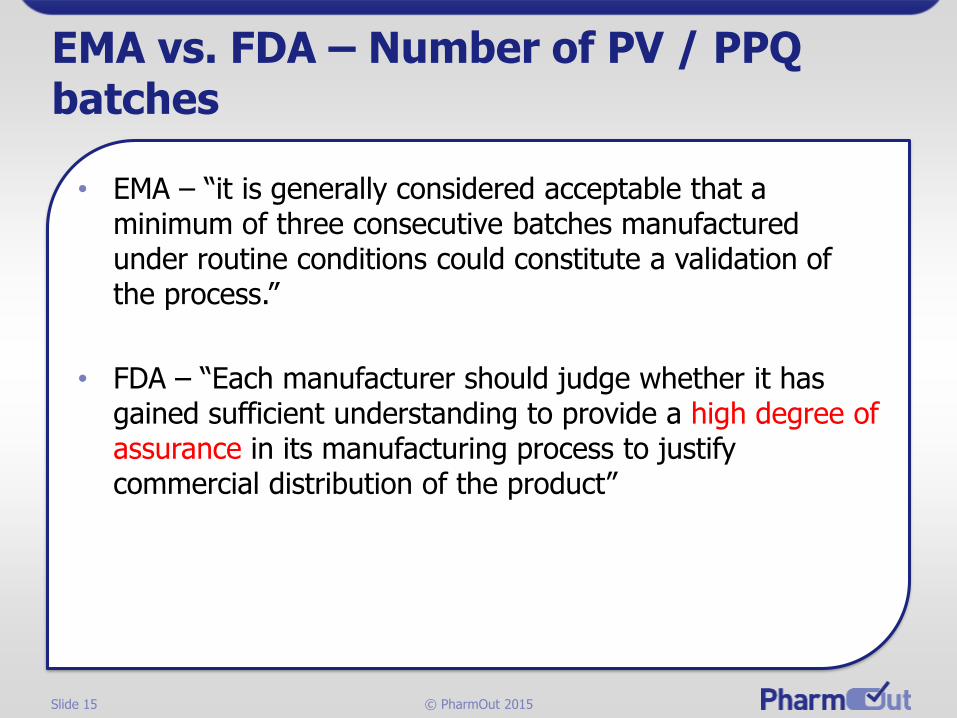
EMA vs. FDA – Number of PV / PPQ batches
• EMA – “it is generally considered acceptable that a minimum of three consecutive batches manufactured under routine conditions could constitute a validation of the process.”
• FDA – “Each manufacturer should judge whether it has gained sufficient understanding to provide a high degree of assurance in its manufacturing process to justify commercial distribution of the product”
Slide 16 © PharmOut 2015
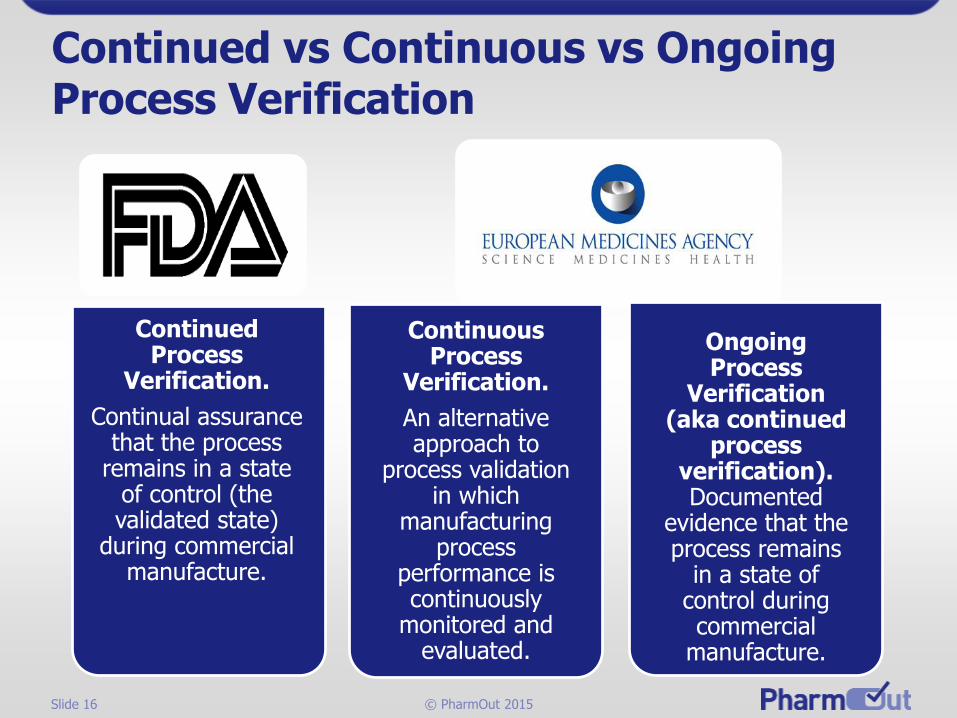
Continued vs Continuous vs Ongoing Process Verification
Continuous Process
Verification.
An alternative approach to
process validation in which
manufacturing process
performance is continuously
monitored and evaluated.
Ongoing Process
Verification (aka continued
process verification). Documented
evidence that the process remains
in a state of control during commercial
manufacture.
Continued Process
Verification.
Continual assurance that the process
remains in a state of control (the validated state)
during commercial manufacture.

Slide 17 © PharmOut 2015
Continued vs Continuous vs Ongoing Process Verification
• Continuous Process Verification is usually done by some form of Process Analytical Technology (PAT).
• FDA requires that data from Continuous Process Verification is assessed after every batch.
• EMA states that “there should be a regular evaluation of the control strategy”.

Part 3: Navigating the two approaches to present an integrated, compliant strategy

Slide 19 © PharmOut 2015
A paradigm shift
A new direction towards a:
• Science-Based
• Risk-Based
• Cost Effective approach
to ensuring patient safety & product quality during pharmaceutical development and manufacturing

Slide 20 © PharmOut 2015
International Conference on Harmonization (ICH)
In Brussels, 2008 the International Conference on Harmonization established the following goal:
“Develop a harmonised pharmaceutical quality system applicable across the lifecycle of the product emphasizing an integrated approach to quality risk management and science.”
Slide 21 © PharmOut 2015
ICH Q8 Pharmaceutical Development
Quality by Design (QbD):
“A systematic approach to development that begins with predefined objectives and emphasizes product and process understanding and process control, based on sound science and quality risk management”.

Slide 22 © PharmOut 2015
ICH Q9 Quality Risk Management
“The level of effort, formality and documentation of the QRM process should be commensurate with the level of risk.”

Slide 23 © PharmOut 2015
ICH Q11 Development & Manufacture of Drug Substances
“A company can choose to follow different approaches in developing a drug substance. For the purpose of this guideline, the terms “traditional” and “enhanced” are used to differentiate two possible approaches.”
Traditional approach:
Set points and operating ranges for process parameters are defined and the drug substance control strategy is typically based on demonstration of process reproducibility and testing to meet established acceptance criteria.

Slide 24 © PharmOut 2015
ICH Q11 Development & Manufacture of Drug Substances
Enhanced approach:
Risk management and scientific knowledge are used more extensively to identify and understand process parameters and unit operations that impact critical quality attributes (CQAs) and develop appropriate control strategies applicable over the lifecycle of the drug substance which may include the establishment of design space(s).

Slide 25 © PharmOut 2015
FDA (& EU) Process Validation Stages
Stage 1 – Process Design: The process is defined during this stage based on knowledge gained through development and scale-
up activities.
Stage 2 – Process Qualification: During this stage, the process design is evaluated to determine if the process is capable of reproducible commercial manufacturing.
Stage 3 – Continued Process Verification: Ongoing assurance is gained during routine production that the process remains in a state of control.
Identify sources of Variability
Control of Variability
Monitoring Variability-remains “in control”
Slide 26 © PharmOut 2015
Stage 1 – Process Design: The process is defined during this stage based on knowledge gained through development and scale-up activities.
Identify sources of Variability
Slide 27 © PharmOut 2015
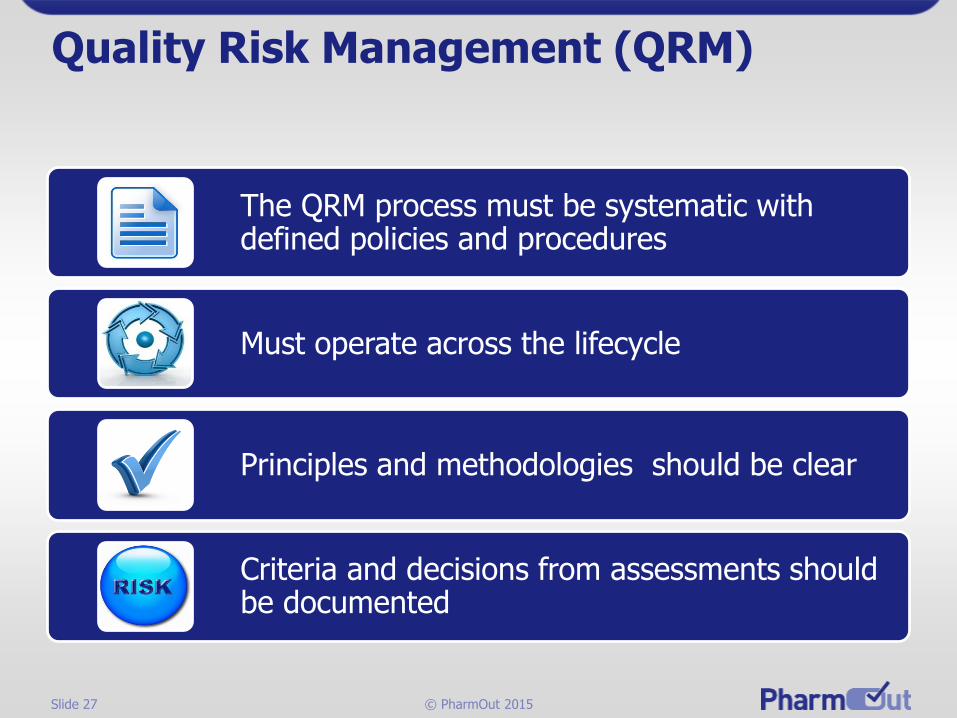
Quality Risk Management (QRM)
The QRM process must be systematic with defined policies and procedures
Must operate across the lifecycle
Principles and methodologies should be clear
Criteria and decisions from assessments should be documented
Slide 28 © PharmOut 2015
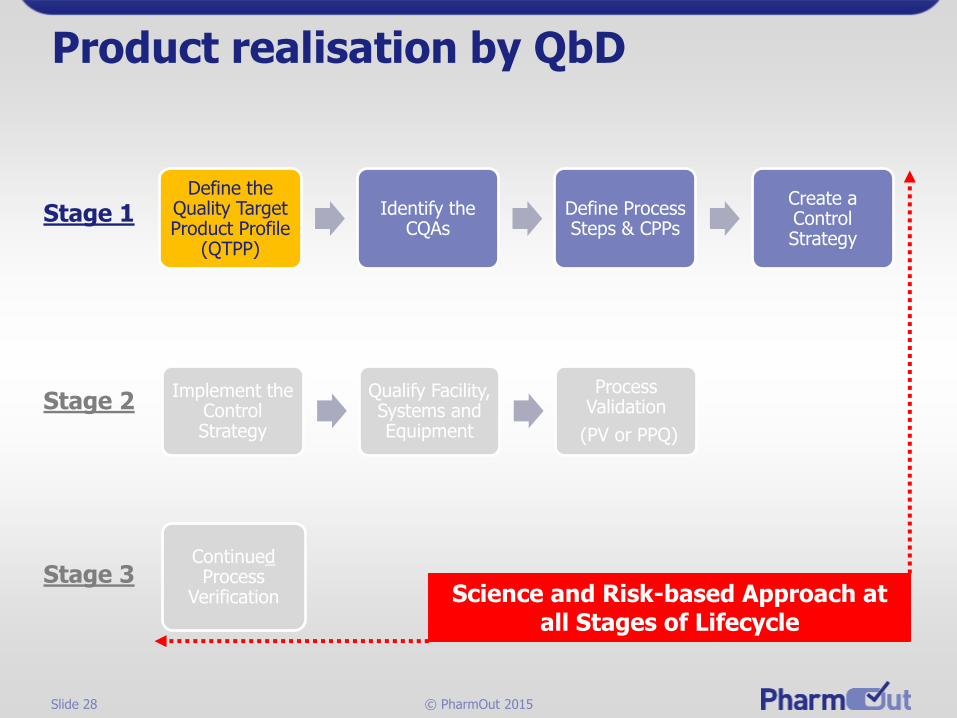
Product realisation by QbD
Define the Quality Target Product Profile
(QTPP)
Identify the CQAs
Define Process Steps & CPPs
Create a Control Strategy
Stage 1
Implement the Control Strategy
Qualify Facility, Systems and Equipment
Process Validation
(PV or PPQ)
ContinuedProcess
Verification
Stage 2
Stage 3Science and Risk-based Approach at
all Stages of Lifecycle

Slide 29 © PharmOut 2015
Stage 1- Process & Product Knowledge
• Process & Product Knowledge gathered to develop a Control Strategy.
• Robust process with low variability.
• Effort focussed using Risk Assessment.
• Efficient Planning ensures success through the entire Lifecycle.
Define the Quality Target Product Profile
(QTPP)
Slide 30 © PharmOut 2015
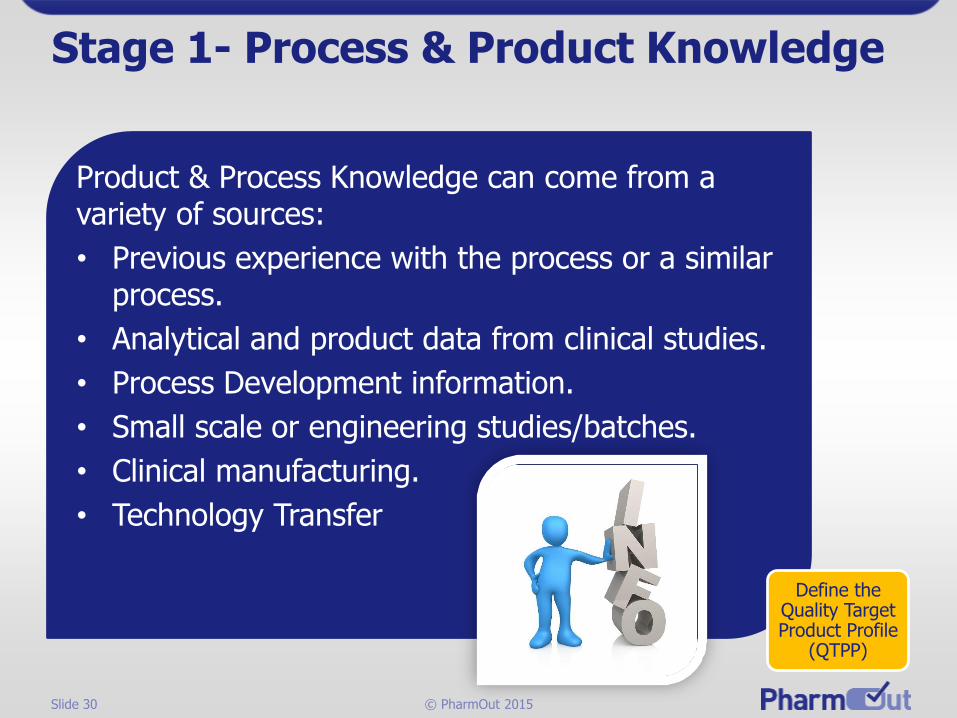
Stage 1- Process & Product Knowledge
Product & Process Knowledge can come from a variety of sources:
• Previous experience with the process or a similar process.
• Analytical and product data from clinical studies.
• Process Development information.
• Small scale or engineering studies/batches.
• Clinical manufacturing.
• Technology Transfer
Define the Quality Target Product Profile
(QTPP)

Slide 31 © PharmOut 2015
Quality Target Product Profile (QTPP)
“A prospective summary of the quality characteristics of a drug product that ideally will be achieved to ensure the
desired quality, taking into account safety and efficacy of the drug product”.
(ICH Q8)
Define the Quality Target Product Profile
(QTPP)

Slide 32 © PharmOut 2015
Quality Target Product Profile (QTPP)
Pharmaceutical Development goals are to design a quality product.
Establish pre-defined objectives and document the summary as a QTPP:
• Summarise the quality attributes that ensures safety and efficacy.
• Starting point for understanding and assessing criticality of product quality attributes.
Define the Quality Target Product Profile
(QTPP)
Slide 33 © PharmOut 2015
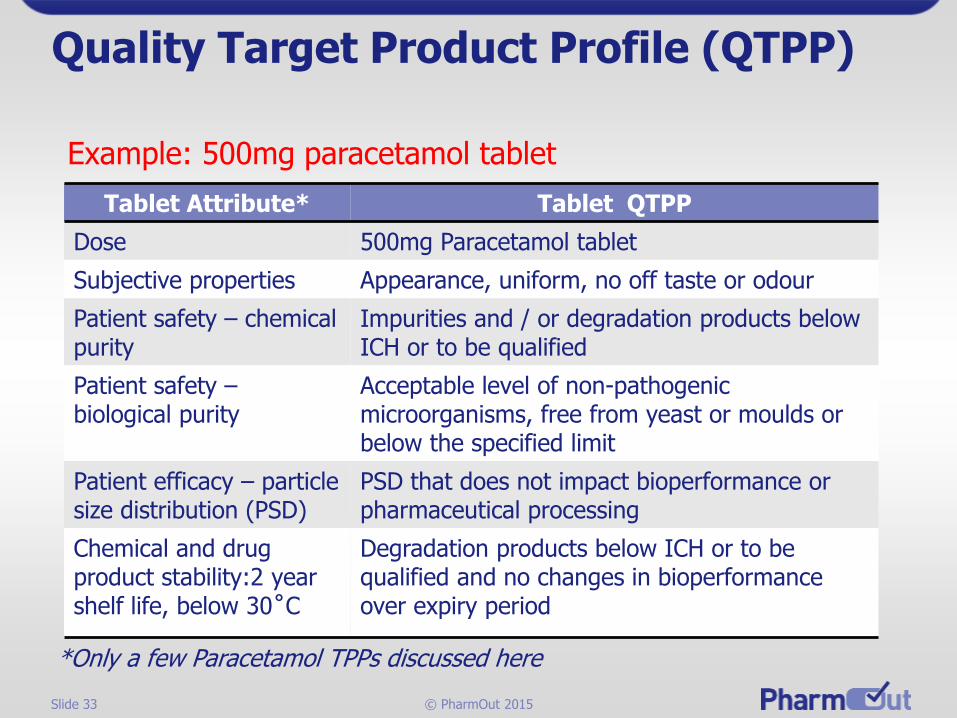
Quality Target Product Profile (QTPP)
Tablet Attribute* Tablet QTPP
Dose 500mg Paracetamol tablet
Subjective properties Appearance, uniform, no off taste or odour
Patient safety – chemical purity
Impurities and / or degradation products below ICH or to be qualified
Patient safety –biological purity
Acceptable level of non-pathogenic microorganisms, free from yeast or moulds or below the specified limit
Patient efficacy – particle size distribution (PSD)
PSD that does not impact bioperformance or pharmaceutical processing
Chemical and drug product stability:2 year shelf life, below 30˚C
Degradation products below ICH or to be qualified and no changes in bioperformance over expiry period
*Only a few Paracetamol TPPs discussed here
Example: 500mg paracetamol tablet
Slide 34 © PharmOut 2015
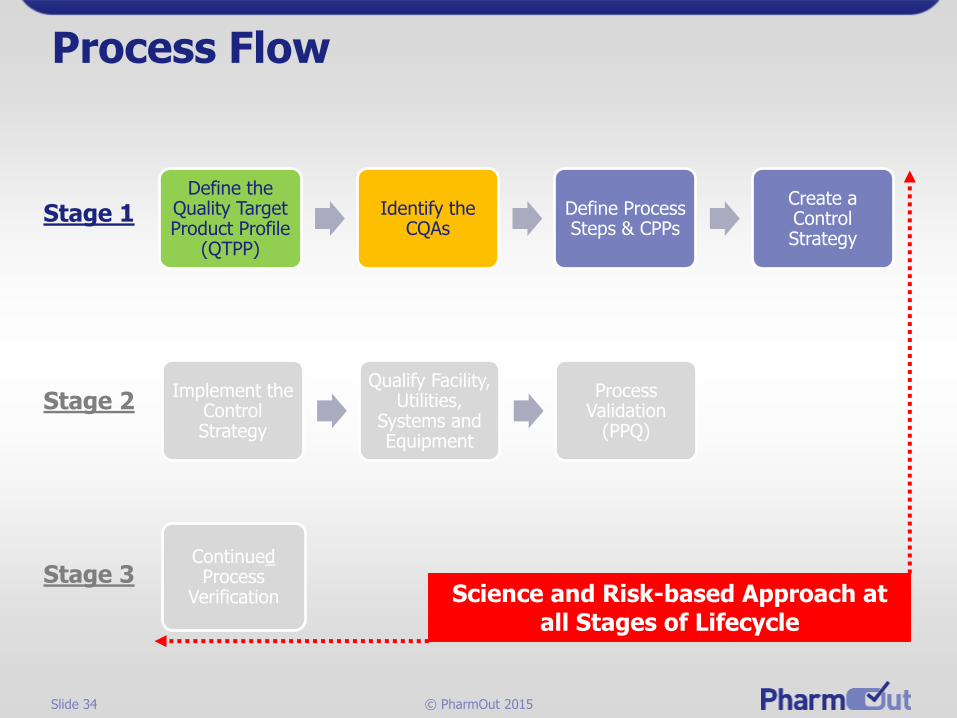
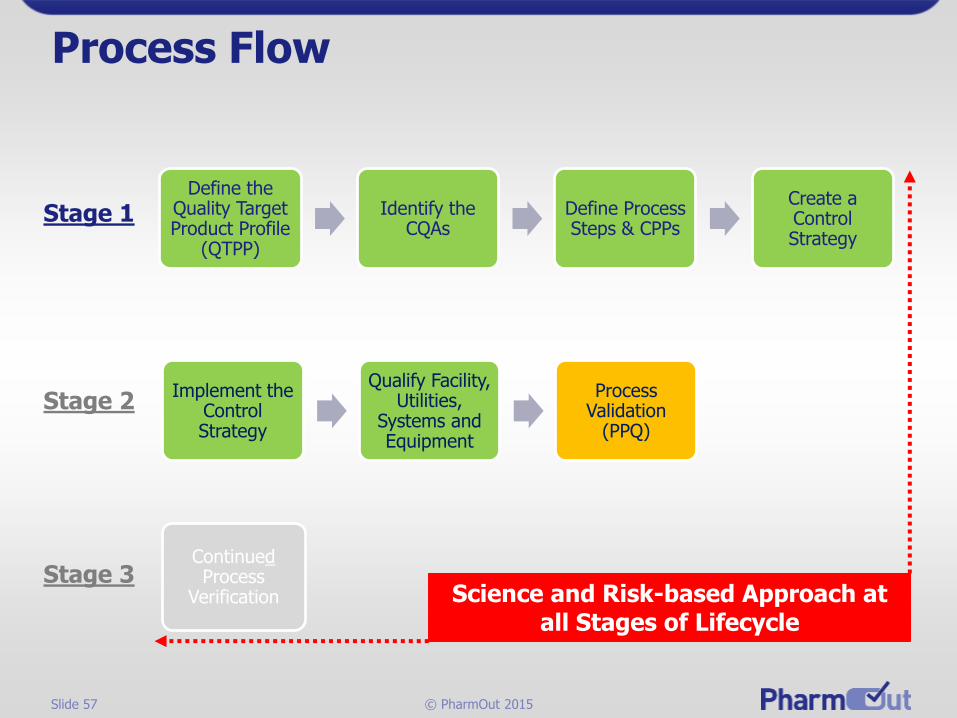
Process Flow
Define the Quality Target Product Profile
(QTPP)
Identify the CQAs
Define Process Steps & CPPs
Create a Control Strategy
Stage 1
Implement the Control Strategy
Qualify Facility, Utilities,
Systems and Equipment
Process Validation
(PPQ)
ContinuedProcess
Verification
Stage 2
Stage 3Science and Risk-based Approach at
all Stages of Lifecycle
Slide 35 © PharmOut 2015
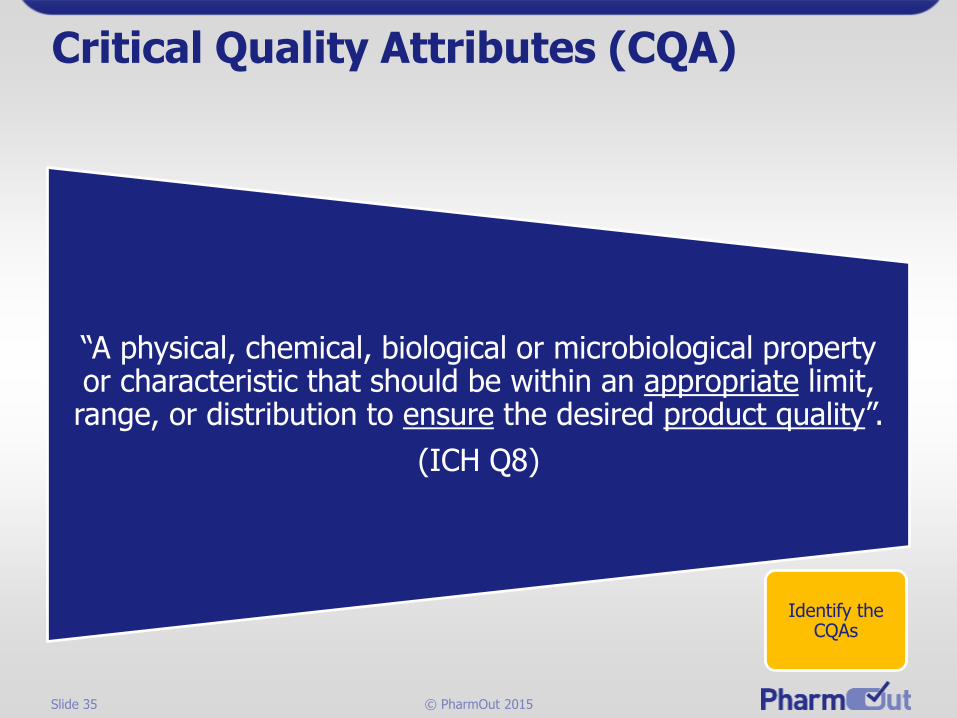
Critical Quality Attributes (CQA)
“A physical, chemical, biological or microbiological property or characteristic that should be within an appropriate limit, range, or distribution to ensure the desired product quality”.
(ICH Q8)
Identify the CQAs
Slide 36 © PharmOut 2015
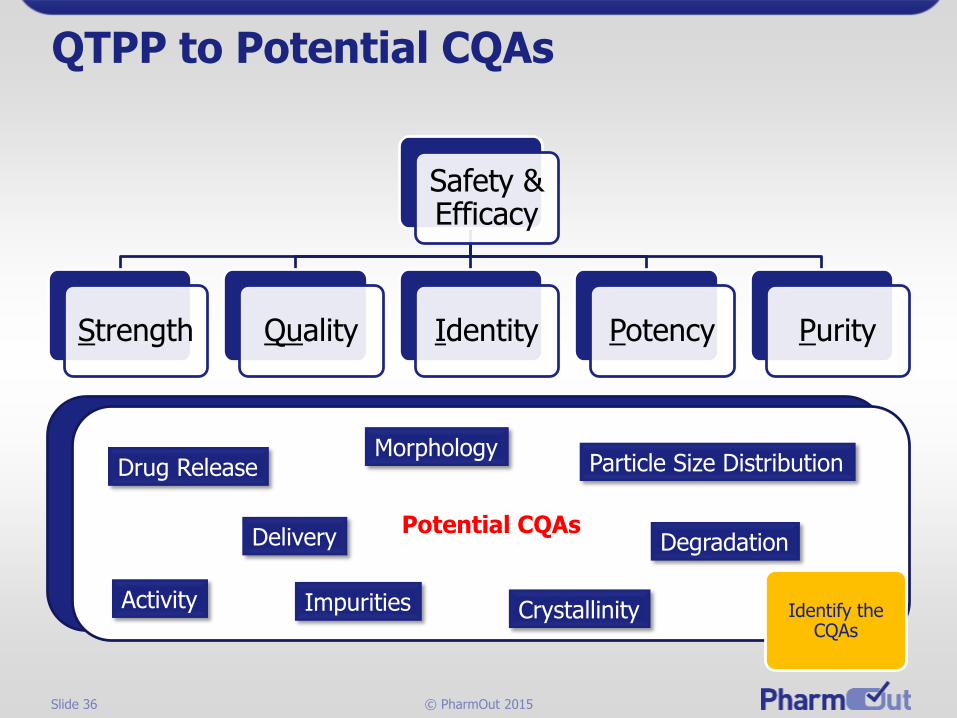
QTPP to Potential CQAs
Safety & Efficacy
Strength Quality Identity Potency Purity
Potential CQAs
Drug Release
Activity
Delivery
Impurities
Morphology
Crystallinity
Particle Size Distribution
Degradation
Identify the CQAs

Slide 37 © PharmOut 2015
From QTPP to CQAs
Paracetamol Product
Paracetamol QTPP* Translation to CQA
Dose 500mg tablet Identity, Assay, Uniformity of Dosage Units
Subjective properties
Appearance, uniform, no off taste or odour
All blisters filled, correct number of strips in pack, unit Integrity and other characteristics
Patient safety – chemical purity
Impurities and/or degradation products below ICH
Appearance and other characteristics Absence of defects
Patient safety – biological purity
Acceptable level of non-pathogenic microorganisms, free from yeast or moulds or below the limit
Acceptable degradation product levels at release, appropriate manufacturing environment controls, input raw material quality. Degradation controlled by packaging.
*Only a few Paracetamol QTPPs included here
Example: 500mg paracetamol tablet
Slide 38 © PharmOut 2015
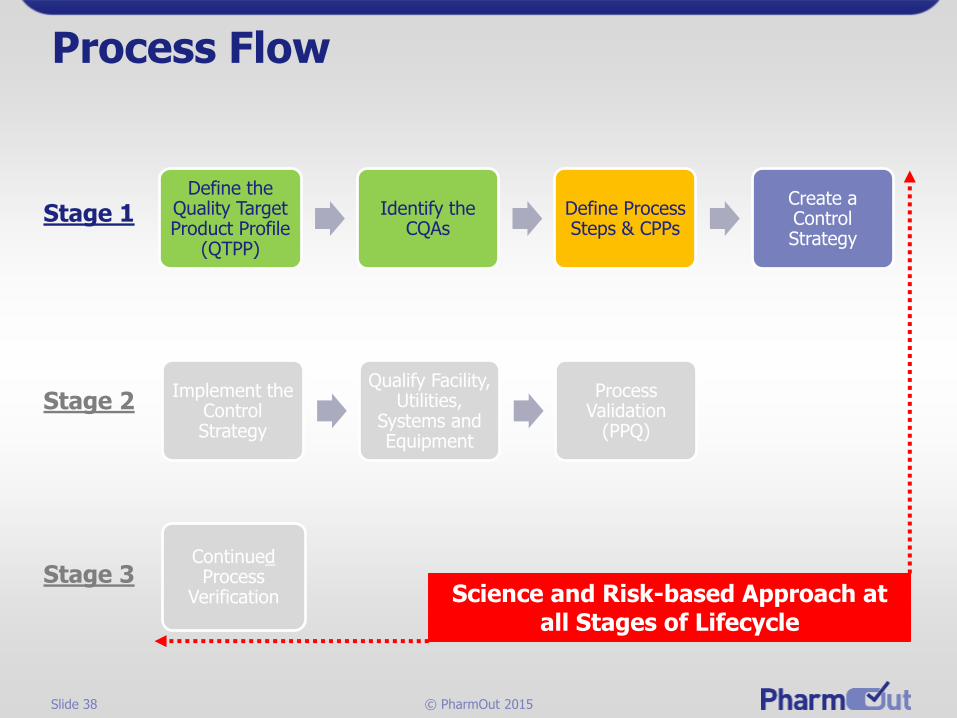
Process Flow
Define the Quality Target Product Profile
(QTPP)
Identify the CQAs
Define Process Steps & CPPs
Create a Control Strategy
Stage 1
Implement the Control Strategy
Qualify Facility, Utilities,
Systems and Equipment
Process Validation
(PPQ)
ContinuedProcess
Verification
Stage 2
Stage 3Science and Risk-based Approach at
all Stages of Lifecycle

Slide 39 © PharmOut 2015
Process for manufacture of 500mg Paracetamol
Dispensing Blending Granulation Drying Milling Lubrication Compression Packing
• Process must be fully defined and understood• Design Space for certain steps?• Process Analytical Technology (PAT)?• Real-time Release Testing (RTRT)?
Define Process Steps & CPPs

Slide 40 © PharmOut 2015
Process Description
Inputs
• Raw Materials
• Excipients
• Intermediates
• Utilities
Processes
• Steps/scale
• FSE*
• Set-points
• Ranges
• Sampling
• Testing
Outputs
• Product
• Intermediate
• Waste
• Data
*FSE = Facilities, Systems (& Utilities) & Equipment
Each step of the process should have the following information available:
Define Process Steps & CPPs

Slide 41 © PharmOut 2015
Overall Process Assessment
CQA
Dis
pe
nsin
g
Ble
nd
ing
Gra
nu
lati
on
Dry
ing
Mil
lin
g
Lu
bri
ca
tio
n
Co
mp
ressio
n
Pa
ck
ing
Identity
Appearance
Assay
Content Uniformity
Purity
Hardness
Friability
Dissolution
Known or Potential impact to CQA
Potential impact to CQA
No impact to CQA
Define the highest risk parameters and identify the CPPs

Slide 42 © PharmOut 2015
Critical Process Parameters (CPPs)
“A process parameter whose variability has an impact on a critical quality attribute and therefore should be monitored or
controlled to ensure the process produces the desired quality”.
(ICH Q8)
Define Process Steps & CPPs

Slide 43 © PharmOut 2015
Defining CPPs
Process Variable
Can variable be
controlled?
NO
Process Performance
Attribute
Product Quality Attribute
OR
Process Input
YES
Potential Impact to
CQAs?
NOYESPotentially
a CPPPotentially NOT a CPP
Risk Assessment.
CPP?
YESCritical Process Parameter
NO
Key Process Parameter
Non-Key Process Parameter
OR
Define Process Steps & CPPs

Slide 44 © PharmOut 2015
Process Flow
Define the Quality Target Product Profile
(QTPP)
Identify the CQAs
Define Process Steps & CPPs
Create a Control Strategy
Stage 1
Implement the Control Strategy
Qualify Facility, Utilities,
Systems and Equipment
Process Validation
(PPQ)
ContinuedProcess
Verification
Stage 2
Stage 3Science and Risk-based Approach at
all Stages of Lifecycle

Slide 45 © PharmOut 2015
Control Strategy
“A planned set of controls, derived from current product and process understanding that ensures process performance
and product quality.”
(ICH Q10)
(definition continued on next slide)
Create a Control Strategy

Slide 46 © PharmOut 2015
Control Strategy
“The controls can include parameters and attributes related to drug substance and drug product materials and
components, facility and equipment operating conditions, in-process controls, finished product specifications, and the
associated methods and frequency of monitoring and control”.
(ICH Q10)
Create a Control Strategy
Slide 47 © PharmOut 2015
Control Strategy
• Important output of Stage 1
• Will ensure that the process remains in control
• Created based on process knowledge gained and the application of science and risk-based approaches and techniques
• Encompasses all elements of each unit operation of the manufacturing process
• All product attributes and process parameters should be in a complete Process Control Strategy
Create a Control Strategy

Slide 48 © PharmOut 2015
Control Strategy for Blending
CQA Process Step Parameter Specification Control
Uniformity of Dosage Units
Blending Time (min) 4-16 mins 5-8 mins
Uniformity of Dosage Units
Blending Speed (rpm) 10-15 rpm 12-14rpm
Uniformity of Dosage Units
Blending Load (Kg) 900-1200 Kg 1000-1100 Kg
*Only one Paracetamol Control Strategy included here
Create a Control Strategy

Slide 49 © PharmOut 2015
Control Strategy
Control Strategy Elements Rationale
Raw Materials Control of input variability
Test Specifications Related to product safety/efficacy
In-Process Controls Monitor the process
Performance Parameters Cannot be controlled but are indicators
Set Points & Ranges Known acceptable variability
Process Monitoring Data collection for all Stages
Processing & Hold Times Time limits impact product quality
Process Analytical Technology (PAT) Real-time monitoring/release
Other Control Strategies and their rationale might include:
Create a Control Strategy
Slide 50 © PharmOut 2015
Process Design Completion
Stage 1 output should be a Report that justifies the Control Strategy:
• Defined CQAs
• Risk Assessments
• Process Information (Inputs & Outputs)
• Parameters and Ranges
• Design Space Information (if applicable)
Create a Control Strategy
Slide 51 © PharmOut 2015
Stage 2 – Process Qualification: During this stage, the process design is evaluated to determine if the process is capable of reproducible commercial manufacturing.
Control of Variability

Slide 52 © PharmOut 2015
Process Flow
Define the Quality Target Product Profile
(QTPP)
Identify the CQAs
Define Process Steps & CPPs
Create a Control Strategy
Stage 1
Implement the Control Strategy
Qualify Facility, Utilities,
Systems and Equipment
Process Validation
(PPQ)
ContinuedProcess
Verification
Stage 2
Stage 3Science and Risk-based Approach at
all Stages of Lifecycle

Slide 53 © PharmOut 2015
Stage 2 Process Qualification
• Demonstrate that the process is capable of reproducible commercial manufacture
• It should be completed before product is released commercially.
• Two parts to this Stage:
Design & Qualification
of FSE
Process Performance Qualification
Product that meets predetermined quality
attributes
Implement the Control Strategy

Slide 54 © PharmOut 2015
Process Flow
Define the Quality Target Product Profile
(QTPP)
Identify the CQAs
Define Process Steps & CPPs
Create a Control Strategy
Stage 1
Implement the Control Strategy
Qualify Facility, Utilities,
Systems and Equipment
Process Validation
(PPQ)
ContinuedProcess
Verification
Stage 2
Stage 3Science and Risk-based Approach at
all Stages of Lifecycle

Slide 55 © PharmOut 2015
Design & Qualification of FSE
•CPPs
•Process Information
•Tech. Transfer
Stage 1 Process Design
•Specifications
•Risk/Impact Assessments
•Design Reviews
FSE Design•Qual Plan
•FAT
•SAT
•Review RAs
Build
•Engineering studies
•GEP
•Safety
Commissioning
Qualify Facility, Utilities,
Systems and Equipment
Slide 56 © PharmOut 2015
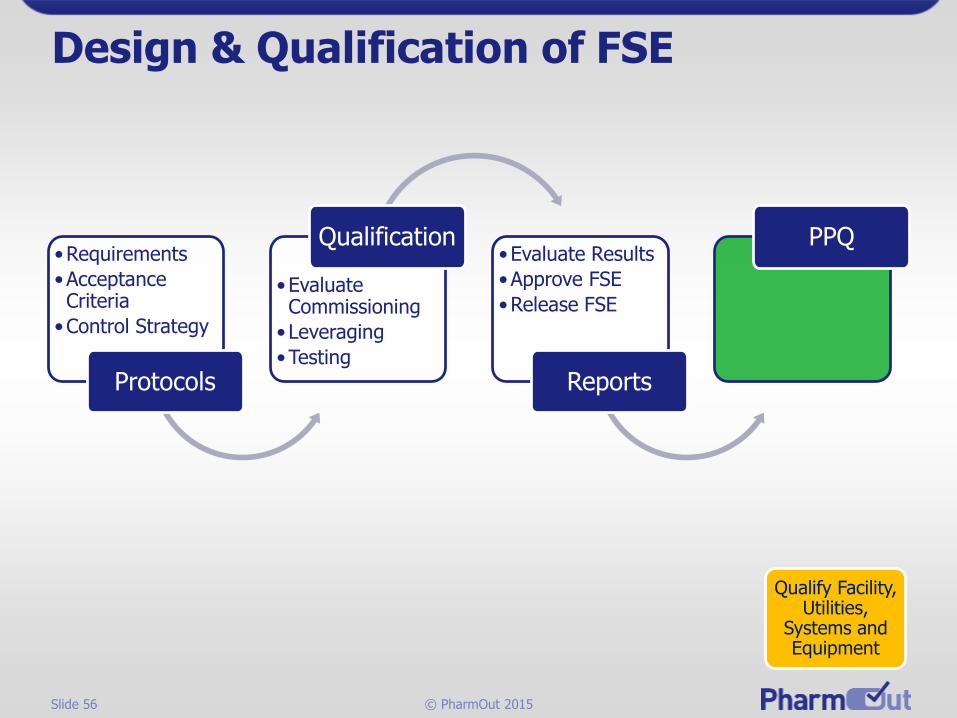
Design & Qualification of FSE
•Requirements
•Acceptance Criteria
•Control Strategy
Protocols
•Evaluate Commissioning
•Leveraging
•Testing
Qualification•Evaluate Results
•Approve FSE
•Release FSE
Reports
PPQ
Qualify Facility, Utilities,
Systems and Equipment
Slide 57 © PharmOut 2015
Process Flow
Define the Quality Target Product Profile
(QTPP)
Identify the CQAs
Define Process Steps & CPPs
Create a Control Strategy
Stage 1
Implement the Control Strategy
Qualify Facility, Utilities,
Systems and Equipment
Process Validation
(PPQ)
ContinuedProcess
Verification
Stage 2
Stage 3Science and Risk-based Approach at
all Stages of Lifecycle

Slide 58 © PharmOut 2015
Process Validation
• Demonstrates the validity of the process design and the suitability of the process control strategy
• At full-scale (commercial manufacture)
• Provides confidence (documented evidence) that systems of monitoring, control and SOPs in production are capable of detecting and compensating for potential sources of process variability over the product lifecycle
• The number of PV batches to be produced should be justified
Process Validation
(PPQ)
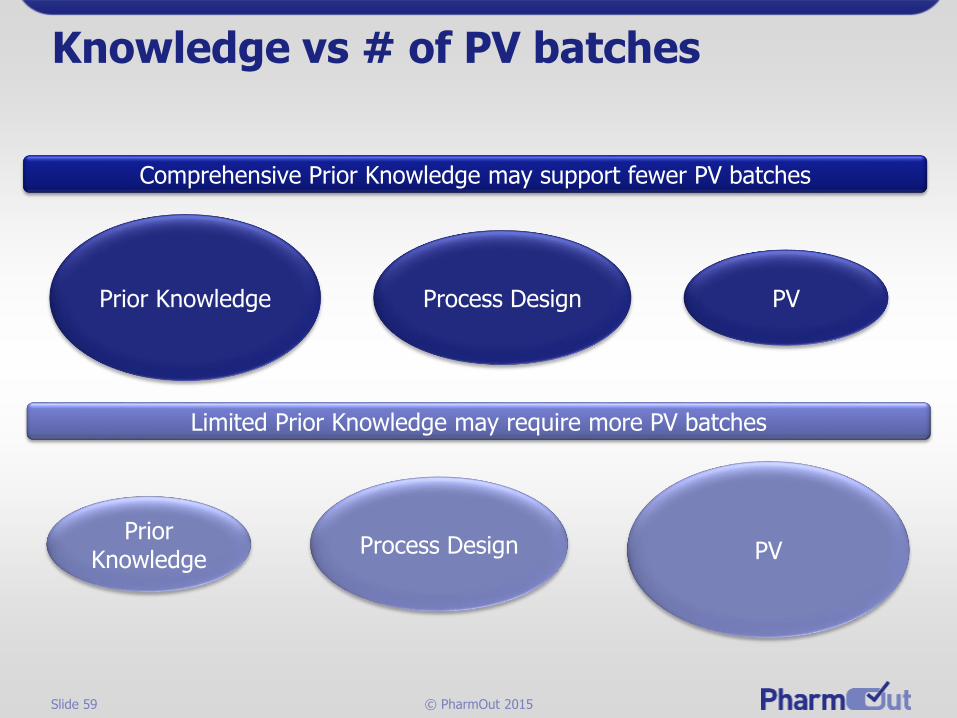
Slide 59 © PharmOut 2015
Knowledge vs # of PV batches
Prior Knowledge Process Design
Prior Knowledge
PV
Process Design PV
Comprehensive Prior Knowledge may support fewer PV batches
Limited Prior Knowledge may require more PV batches

Slide 60 © PharmOut 2015
How many PPQ batches?
“The approach to PPQ should be based on sound science and the manufacturers overall level of product and process understanding and demonstrable control”
Process design is evaluated to determine if the process is capable of reproducible commercial manufacturing
Process Validation
(PPQ)
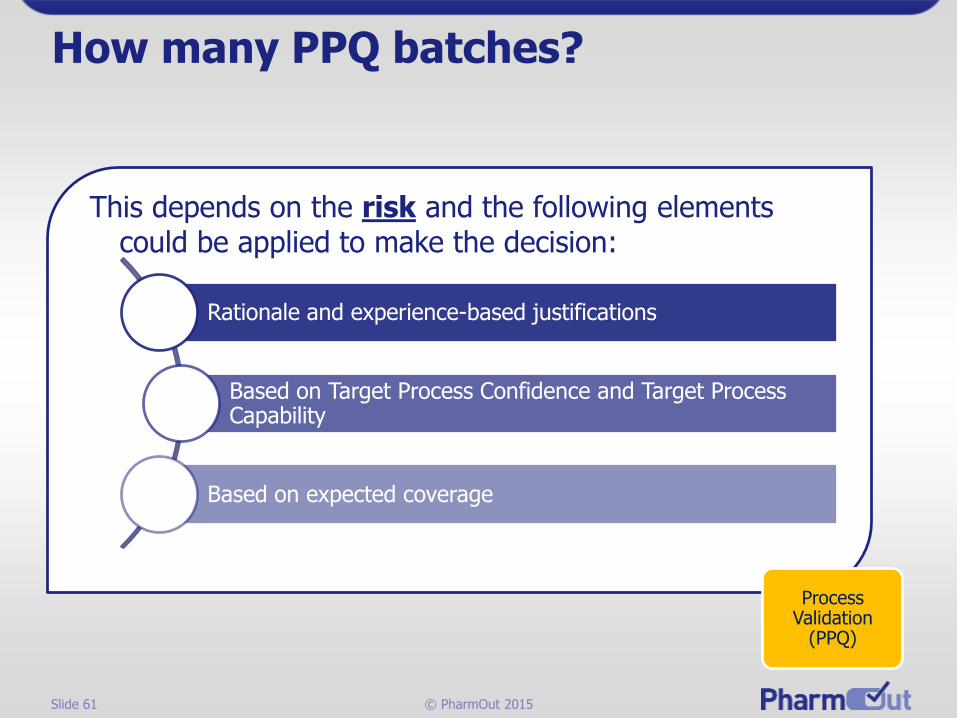
Slide 61 © PharmOut 2015
How many PPQ batches?
This depends on the risk and the following elements could be applied to make the decision:
Rationale and experience-based justifications
Based on Target Process Confidence and Target Process Capability
Based on expected coverage
Process Validation
(PPQ)

Slide 62 © PharmOut 2015
Statistical Acceptance Criteria for Validation
• Requirements: process performance to consistently meet attributes related to SQuIPP (Strength, Quality, Identity, Purity, Potency).
• Level of statistical confidence required may be based on…• Risk• Criticality of the attribute• Scientific and engineering knowledge• A priori (beforehand) historical knowledge (Stage 1, similar
processes, revalidation…)
• Document your strategy!!!
Provide X% confidence that each specified requirement has been met
Process Validation
(PPQ)
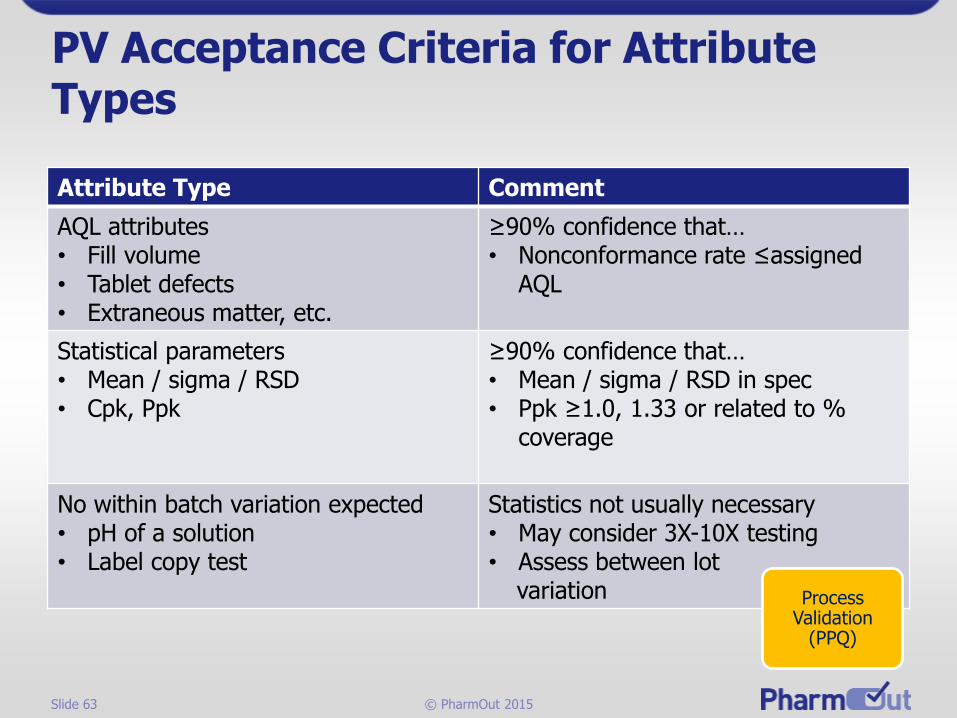
Slide 63 © PharmOut 2015
PV Acceptance Criteria for Attribute Types
Attribute Type Comment
AQL attributes• Fill volume• Tablet defects• Extraneous matter, etc.
≥90% confidence that…• Nonconformance rate ≤assigned
AQL
Statistical parameters• Mean / sigma / RSD• Cpk, Ppk
≥90% confidence that…• Mean / sigma / RSD in spec• Ppk ≥1.0, 1.33 or related to %
coverage
No within batch variation expected• pH of a solution• Label copy test
Statistics not usually necessary• May consider 3X-10X testing• Assess between lot
variation Process Validation
(PPQ)

Slide 64 © PharmOut 2015
What is confidence? Type I and Type II Error
• For validation:
• For validation more interested in Type II Error• Need to prove that the process is good – detect problem processes in validation• “Guilty until proven guilty”• Type II error usually = 0.2, 0.1, or 0.05• = 0.1 90% confidence an out of spec process will fail the process validation
acceptance criteria
Test results…
Pass Fail
Process is really…
In spec Correct(1-)
Type I Error
Manufacturer’s Risk
Out of spec Type II error
Consumer’s Risk
Correct (1-)
Process Validation
(PPQ)

Slide 65 © PharmOut 2015
Impacts to Validation Sampling
• Ideally, all process variables would perform similarly across all runs of a product. However, products will often be impacted due to differences in:
• Raw materials
• Different plants of manufacture
• Different process equipment for use with same processes
• Different process operators
• Different lab facilities and analyst capabilitiesProcess
Validation (PPQ)

Slide 66 © PharmOut 2015
Sampling
1. Simple Random Sampling – Selecting samples so that each unit has an equal chance of being selected
2. Stratified Random Sampling – Selecting samples deliberately from each time period or location in a batch
3. Nested Sampling – Selecting units from locations within a batch and obtaining multiple samples from each location
4. Systematic Sampling – Selecting units
periodically over time Process Validation
(PPQ)

Slide 67 © PharmOut 2015
Stratified Sampling
• What does stratified sampling do?• Assures you get units from each subgroup
• When would this be important?• To check identifiable (or potential) subgroups within the
batch / process: top / middle / bottom; every hour; every fill nozzle, etc.
• To prove we do NOT have uniformity problems, by sampling from higher risk physical locations or time points (worst case)
• How is this done?• Divide the population into “strata” or subpopulations• Take samples randomly from each stratum in
the population Process Validation
(PPQ)

Slide 68 © PharmOut 2015
Stage 3 – Continued Process Verification: Ongoing assurance is gained during routine production that the process remains in a state of control.
Monitoring Variability-remains “in control”

Slide 69 © PharmOut 2015
Process Flow
Define the Quality Target Product Profile
(QTPP)
Identify the CQAs
Define Process Steps & CPPs
Create a Control Strategy
Stage 1
Implement the Control Strategy
Qualify Facility, Utilities,
Systems and Equipment
Process Validation
(PPQ)
ContinuedProcess
Verification
Stage 2
Stage 3Science and Risk-based Approach at
all Stages of Lifecycle

Slide 70 © PharmOut 2015
Maintenance of the Validated State
• “Continued Process Verification”
• Change in the validated state of the process could impact product
• Monitored via:
• Change Control
• Periodic Monitoring
• Data Trending Review
• Calibration and PM
• Knowledge of operational parameters (Control Strategy) and Design Space (if applicable)
ContinuedProcess
Verification

Slide 71 © PharmOut 2015
CPP’s and Process Alarms
• Control range of Critical Parameters
• Control Strategy around critical process parameters
• Within the Design Space (if applicable)
• Easy to implement and control.
• Demonstrates proper performance of the process
• Measurement and control of parameters using PAT (if applicable)
ContinuedProcess
Verification
Slide 72 © PharmOut 2015
Change Control
• Maintain validated state via review and approval of changes made
• Review by cross-functional SME’s
• Pre-approval by Quality
• All changes tracked & trended
• Planned & unplanned
ContinuedProcess
Verification

Slide 73 © PharmOut 2015
Routine Monitoring
• Demonstrates consistency of initial results
• Statistical Process Control
• Data from automation
• Risk-based Routing Monitoring Program
ContinuedProcess
Verification
Slide 74 © PharmOut 2015
Data Trending & Review
• Action & Alert levels
• Analytical Data from Routine Monitoring
• Process Parameters
• Process Alarms
• Helps identify potential issues
• CAPA system
ContinuedProcess
Verification
Slide 75 © PharmOut 2015
Training
• Training on revised procedures & forms
• New staff
• Re-training of operators based on operator errors
• Re-training for processes
• All departments as applicable
ContinuedProcess
Verification

Slide 76 © PharmOut 2015
Periodic Review
• Overall Periodic Review of the Validated State
• Frequency of the review may be based on a risk assessment
• Review of regulations/CGMP
• Documented with Conclusions
• Recommend planned improvements
ContinuedProcess
Verification
Slide 77 © PharmOut 2015
Thank you for your time.Questions?
Ashley Isbel
Lead Consultant
www.pharmout.net
Marc Fini
Lead Consultant
www.pharmout.net