elliott school of international affairs | the george washington
TRANSCRIPT
The Industrial Organization of Rebellion: The Logic of Forced Labor and Child Soldiering*
Bernd Beber Christopher Blattman
NYU & Nuffield College Yale University†
January 2010
Abstract: We investigate one of the world’s most pernicious forms of exploitation: child soldiering. Most
theories can be captured by a principal-agent model that incorporates punishments, indoctrination, and
age-varying productivity. For rebel leaders, we show it is almost always optimal to coerce rather than re-
ward children, and that leaders will tend to forcibly recruit children when punishment and supervision are
cheap, when children’s outside options are poor, and when rebel leaders are resource-constrained. To see
which mechanisms dominate in practice, we interview and survey former members of Uganda’s Lord’s
Resistance Army, who provide a cruel natural experiment that reveals how children and adults respond to
coercive incentives. The evidence suggests that children are more easily indoctrinated and disoriented
than adults, but are less effective guerrillas; hence the optimal targets of coercion are young adolescents.
We confirm predications of the model on a new “cross-rebel” dataset and suggest policy solutions.
* Acknowledgements: We thank Jeannie Annan, Jim Fearon, Macartan Humphreys, Stathis Kalyvas, Da-
vid Leonard, Edward Miguel, Gérard Roland, Jake Shapiro, Jeremy Weinstein, Justin Wolfers, Elizabeth
Wood, and seminar participants at Yale OCV, Stanford CISAC, NYU Economics and 2010 ASSA semi-
nars for comments on this and prior drafts. The data derive from the Survey of War Affected Youth, col-
lected by the authors with Jeannie Annan, Khristopher Carlson, Dyan Mazurana, and AVSI.
† Beber: NYU, Department of Political Science, 19 W. 4th Street, New York, NY 10012, (347) 374-0732,
[email protected]; Blattman: Yale University, Departments of Political Science & Economics, 77
Prospect Street, New Haven, CT 06511, (203) 432-3347, [email protected].
1
Civil war research comes in three main flavors. The first seeks the causes of conflict empirically, often
through cross-country regressions; a second models the interaction of competing parties, identifying the
conditions in which order breaks down. These literatures have a common ingredient: both take the exis-
tence and organization of groups as given (Blattman and Miguel forthcoming). A third literature, originat-
ing with studies of agrarian revolutions, uses history and case studies to understand individual motives for
violent collective action and the strategic use of rewards, ideology and identity (e.g. Lichbach 1994; Cla-
pham 1998; Paige 1975; Wood 2003; Scott 1976). These studies focus, however, on the motives to partic-
ipate, and tend to ignore agency problems: the incentives to perform and obey.
We argue that theories of industrial organization can add to our understanding of rebellious groups,
especially systems of recruitment, command and control. To illustrate, we use formal theory, a case study,
and new data to explain two unsettling patterns in guerrilla organization: coercion and child soldiering.
Ours is part of a growing literature on the micro-foundations of rebel participation and organization, in-
cluding the strategic use of violence (Kalyvas 2006; Wood 2006; Azam 2006), the use of social identity in
national militaries (Akerlof and Kranton 2005), the formation of cohesive groups (Garfinkel 2004), and
the role of resources and information asymmetry in rebel organization (e.g. Weinstein 2007; Gates 2002).
Soldiers under age 18 were reported in 21 armed conflicts in 2002-07 alone (HRW 2008). Yet while
child soldiers are commonplace, age of recruitment varies widely across groups. New data in this paper
show that the age profiles of armed groups vary both within and between countries, with the proportion of
child recruits ranging from zero to 70%. These data beg the question: why do age profiles vary so much
across armed groups? The extent of forced recruitment is less well known, but abduction is a common
guerrilla tactic, especially in Africa. Our data suggest that rates of forced recruitment range from zero to
99%. This pattern begs another question: why do we see wide variation in coercion?
Coercion and child recruitment are not limited to soldiering; they are echoed in other pernicious forms
of child labor. Worldwide, more than 10 million children are employed in drug-trafficking, sex work, and
other hazardous labor (ILO 2003a). The eradication of these exploitative practices is informed by little
research. Economists have focused on the use of children in agriculture and industry, modeling child la-
bor as a product of intra-household labor allocation rather than a firm decision (Basu 1999; Fares and Ra-
ju 2007; Edmonds and Pavcnik 2005; Udry 2004). Otherwise, models of child labor usually take the form
of “classic” industrial organization, focusing on the dynamics of firm competition rather than agency

2
problems (Rogers and Swinnerton 2008). Similarly, the literature on unfree labor tends to focus on inden-
tured labor, and explores these relationships in general equilibrium models of agrarian economies, where
forced labor arises from labor scarcity (e.g. Conning and Kevane 2007; Domar 1970; Engerman 1973).
Our analysis of coercion is closer to the pre-contract theory analysis of pain as an incentive in the eco-
nomics of slavery (e.g. Findlay 1975; Fenoaltea 1984).
We review the main explanations for child recruitment and show that each corresponds to a facet of
organizational theory, and can be formalized in a principal-agent model with a rebel leader and a civilian.
A formal model systematizes the wide array of explanations, clarifies the conditions where child recruit-
ment is optimal, and yields several insights. First, it is never optimal to coerce high-ability individuals;
their incentives to escape are too great. Rather, leaders will only coerce agents with low ability and reser-
vation utility—in our setup, children. It is seldom optimal for adults to be forcibly recruited. The model
also predicts that child recruitment is most likely when punishment is ‘cheap’ in the sense that civilian,
patron, or ally support is not weakened by the use of punishment and coercion.
Child coercion, however, is consistent with many mechanisms. To see which dominate in practice, we
draw upon interviews, micro-level data, and a tragic natural experiment in Uganda. There a rebel group
has abducted tens of thousands of young men and women. The evidence suggests that guerrilla ability,
ease of escape, ease of indoctrination, and the value of outside options all rise in age. Rebels found coer-
cive child recruitment attractive because children’s reservation utilities were lower than adults, and were
manipulated to be perceived as lower still. As expected, punishment is most common among children.
We develop a new database of African rebel groups and show that these predictions are borne out in
practice. The findings suggest new strategies to counter insurgency and discourage child recruitment.
1. Explanations for child soldiering
Why would a rebel leader recruit 13-year olds to fight a war? Answers are nearly as numerous as the
journalists, human rights workers, and academics that produce them, but six main explanations stand out.
First, some point to the high proportion of young people in poor countries, due to a demographic shift
exacerbated by war and AIDS deaths (Singer 2005; Rosen 2005; Cohn and Goodwin-Gill 1994). If child-
ren are as productive as adults, we should find a disproportionate number in armed groups.

3
Second, analysts have located the use of child soldiers in the supposedly “new” and “criminalized”
wars of recent decades (Kaldor 1999; Honwana 2005; Reno 1999; Kaplan 1994). One reason is the ero-
sion of taboos and other costs of employing coercion and children in war.
A third explanation emphasizes the functional value of children, especially for menial tasks. Scholars
disagree, however, on their military effectiveness. Some say that children lack fortitude (Gutiérrez 2006;
Wessells 2006). Others, including some rebel officers, attest to children’s stamina and stealth (ILO
2003b; Boyden and de Berry 2004; Cohn and Goodwin-Gill 1994). Lighter, cheaper firearms may also
increase the combat effectiveness of children (Machel 1996; Singer 2005).
A fourth, related explanation could be that child soldiers may be valuable for signaling purposes. A
rebel leader may wish to indicate seriousness, commitment or fear through child abduction.
Fifth, some argue that children require lower wages. Children’s employment and educational oppor-
tunities may be low in either absolute or relative terms (Brett and Specht 2004; ILO 2003b; Honwana
2005; Machel 1996). It is also argued that children are more willing to fight for non-pecuniary rewards
such as honor and duty, revenge, a sense of purpose, or protection (e.g. Brett and Specht 2004; Rosenblatt
1984). The vast majority of the evidence to support these claims, however, is largely anecdotal, although
lab-based psychological evidence from the US bolsters some of these claims (Andvig and Gates 2006).
Finally, some argue the young are more malleable, adaptable, and obedient, as well as more easily in-
doctrinated and deceived. Hence they are easier to control and retain (Gutiérrez 2006; Peters et al. 2003;
Cohn and Goodwin-Gill 1994; Boyden 2003). Testimony from rebel officers is one source of such claims
(e.g. ILO 2003b). Developmental psychology also provides some support; lab experiments suggest that
adolescent social and brain development may lead them to be more conformist and influenced by peers
(Harris 1998) and more prone to risk-taking (O’Donoghue and Rabin 2000). Gutiérrez (2006) and Peters
(2004) also argue that children’s moral development is incomplete and malleable. This evidence, howev-
er, is incomplete and largely US- and lab-based.
2. Formalizing the logic of child soldiering
Underlying each explanation for child soldiering is the idea that a rebel leader optimally seeks to max-
imize gains and minimize costs. Here we show that several mechanisms can be represented in a principal-
agent game with two actors, a rebel leader L and an agent A. The value of a model is threefold. First, it
reveals the necessary and sufficient conditions for child recruitment to be optimal. Second, it suggests
4
novel solutions to child soldiering as a policy problem. Finally, the model broadens our understanding of
labor contracts that include the use of coercion, and yields general lessons on child and forced labor.
We introduce coercion into the standard principal-agent framework by allowing for a rebel leader to
punish as well as reward recruits, and introduce children by allowing productivity and reservation utility
to vary by agent type (age). The closest relations to this setup are Chwe (1990), Gates (2004, 2002), and
Acemoglu and Wolitzky (2009). Chwe models why child workers in the Industrial Revolution were more
likely to be whipped. He argues the optimal contract will provide money rather than pain when the work-
er’s reservation utility is sufficiently high. Children, who have poor outside options, thus suffer punish-
ment. Likewise, Gates argues that children have fewer outside options and hence it is easier to incent
them to meet the participation and incentive compatibility constraints. Acemoglu and Wolitzky also find
that coercion declines as outside options improve. Our approach models a broader range of explanations
for child recruitment. In particular, we allow reservation utilities to vary in age, consider the costliness of
punishment, disaggregate the psychological mechanisms, and model the implications of uncertainty. We
also model the leader’s choice of both agent and incentive, treating it as a simultaneous decision.
A. Structure and equilibrium in a basic model
Each agent in our setup has an age-dependent productivity factor θ, and he chooses how much effort a
he will contribute to rebel activities. The rebel leader observes the agent’s productivity type and faces two
(simultaneous) choices: first, the optimal reward or punishment ρ to give to the recruit; and second, the
optimal type θ to recruit. While θ is continuous, we can think of high types as adults and low types as
children. The leader observes agent type and output (π), but agent effort (a) and the random shock in pro-
duction (ε) are hidden to her. In general terms, utilities are given by
),(),( acru AA and
),( LL cu with ),,( a .
Superscripts denote actors and subscripts denote partial derivatives.
The leader’s utility is production less her cost of rewards and punishments. (Both the guerilla effec-
tiveness and any signaling value of child soldiers are captured in this production function.) The agent,
meanwhile, derives utility from output priced at ρ R and disutility given by a cost function cA of effort
and (possibly) type. Incentives ρ can be negative or positive. For simplicity, incentives in our model are
solely performance-based. (In African rebel groups, base pay typically consists of no more than the bare
5
minimum necessary for survival.) Results will not change substantially if leaders provide base pay; the
participation constraint relaxes and higher types are selected.
We consider a simple model with explicit functional forms (a general model is presented in Appendix
A). In particular, we assume a stochastic linear production function π = θaε, where ε has a Gamma distri-
bution with mean 1 and standard deviation s. Productivity θ [0,1], and utilities are given by:
,
0)1(
0
2
2
2
L
A
u
forae
foraeu
We assume that the agent’s utility is exponential, so that the recruit’s utility is increasing and concave
in output, with diminishing returns to effort. Its sign is just the sign of incentive ρ. We also require that a
participation constraint is met; that an agent’s utility exceeds some reservation point u(θ) determined by
the values placed on successful versus unsuccessful escape:
u(θ) = p(θ) v + (1 – p(θ)) d,
where p(θ) [0,1] is the probability with which a recruit will successfully escape; v > 0 is the value of the
recruit’s outside option (which for the moment we treat as fixed); and d ≤ – 1 is the punishment asso-
ciated with an unsuccessful escape (torture and death). We assume this particular upper bound for d, be-
cause it captures that d is worse from the recruit’s perspective than any punishment the rebel leader might
ordinarily impose in order to induce effort on the part of the agent (since any incentive ρ ≤ – 1 is weakly
dominated for the leader). We assume the probability of escape is an increasing, linear function of prod-
uctivity (pθ > 0). These functions are illustrated in panels (a) to (c) of Figure 1. For simplicity we assume
v = .25, d = – 1, p(0) = 0, pθ = 1, and s = .5 for all graphs, unless noted otherwise.
The leader’s problem is to jointly choose the optimal agent θ and incentive ρ that maximizes her ob-
jective function uL. In doing so, she must satisfy the incentive compatibility constraint (IC) and the partic-
ipation constraint (PC) to ensure that the agent is motivated to stay and perform:
ra = caA , and (IC)
r – cA ≥ u. (PC)
We solve the model in Appendix A, along with formal proofs. In a typical principal-agent setup, the par-
ticipation constraint is satisfied trivially and meeting the incentive compatibility constraint is the object of
theoretical interest. Our model of forced recruitment, however, hinges on the participation constraint, be-

6
cause the recruit’s reservation value is endogenous to his type and the leader’s optimal choice for type
therefore crucially depends on the participation constraint: whether the agent runs away.
Figure 1 illustrates the relationships, in equilibrium, between agent utility and productivity, output,
and incentives. First, note that above some threshold level of productivity it is always optimal to reward
(Figure 1a). Otherwise high productivity agents—who have a higher expectation of evading capture—will
run away when threatened. It is also always optimal to punish recruits with productivity below the thre-
shold, because if the leader was to expend rewards, he would choose a recruit with a higher value for θ
and positive reservation value. Nevertheless, where punishments are as costly as rewards, low-types are
never targeted in equilibrium since rewards-based recruitment of high types is a global maximum.
Second, both punishment and rewards stimulate effort among high and low types, respectively. Panel
d of Figure 1 indicates the equilibrium levels of agent effort by type. Note that high types exert more ef-
fort than low types. The reason has nothing to do with the responsiveness to punishments versus rewards;
rewards buy the same amount of effort as pain. Rather, high types are responding to the fact that they are
more effective at generating output as a consequence of their greater ability.
The consequence of this setup is that it is never optimal to recruit low types (i.e. children); the leader
always abducts high-productivity types and provides rewards, almost regardless of the value for v, d or s.
Figure 2 illustrates the rebel leader’s payoff uL for individuals of different productivity types θ. The high-
est utility comes from abducting relatively high-productivity individuals (in our age analogy, adults).
These have to be treated relatively well or else they will desert.
B. When is child soldiering optimal?
When are punishment and child recruitment equilibrium strategies? An obvious response is that it will
be optimal to recruit children if they are more productive as guerrillas (or at least at specific tasks). For
instance, the relative effectiveness of child soldiers has arguably increased with the advent of lighter wea-
ponry with less recoil, and children may also be less likely to arouse suspicion when deployed as spies.
We explore the formal logic of this claim in Appendix A, but as we see in the empirical analysis be-
low, the evidence points in the opposite direction: except for a few minor and specialized tasks, children
appear to be less productive in warfare than adults. That is, π is generally increasing in age. If true, then in
our simple model, forcibly recruiting low θ types (children) is only optimal in extreme circumstances. We
7
therefore draw several extensions to the model from the child soldiering literature to illustrate more com-
mon, plausible mechanisms that lead to low-type recruitment.
Extension 1: Cheap punishment
One of the most crucial parameters is the costliness of punishment versus rewards, assumed equal in
the base model. In practice, punishment may be cheap; the effort to make or carry out threats may be low-
er than the effort required to build wealth. Material rewards may also have a higher opportunity cost, as
leaders can purchase another factor of production (e.g. artillery) or consume resources directly.
Punishment can also be costly. Rebel groups are often funded by sympathetic foreign powers or dias-
poras, and some donors will condition their support on the observance of human rights. The good will of
local populations can also yield items of value (food, supplies, informants, hideouts). Popular support
could also lower the price of recruits if it yields social pressure on people to join, or if recruits gain utility
from the act of participation itself (Weinstein 2007; Wood 2003; Gates 2002).Indeed, military strategists
generally consider popular support essential to successful insurgency and counter-insurgency (Galula
1964; Mao 1961/2000; Guevara 1961/1998; Petraeus 2006). These ‘social resources’ may be depleted if
civilians are abused or coerced into fighting.
A simple generalization of the model allows for rewards and punishments to diverge in cost by adding
a relative cost parameter, k R, to the leader’s utility function: uL = π – kρ2π. In the base model, k impli-
citly equals one. When punishment is cheap, then k = 1 for rewards and 0 < k < 1 for punishments.
We recalculate equilibrium values and find that punishment is an equilibrium strategy for sufficiently
small k. Panel b of Figure 2 shows the leader’s optimal target productivity θ as a function of the cost mul-
tiplier k (for d = – 3). As the relative cost of punishment declines, the utility the rebel leader receives from
recruiting low types increases. Below some threshold of k the optimal recruit switches to the low-
productivity type. Indeed, the optimal choice θ is never decreasing in k. Moreover, if productivity is in-
creasing in ability, cheap punishment is a necessary condition for the low-type equilibrium to be uniquely
optimal. This will prove to be one of the most important predictions of the model.
Extension 2: Productivity and the probability of escape
Ability may also impact the ability to escape, a dynamic we represented in the base model by endoge-
nizing p to be increasing in θ (for simplicity assuming that p(θ) = θ). The endogenous reservation utility
function is an essential part of the model; it drives the lower reservation prices for low types, and aug-

8
ments the incentive for leaders to abduct low productivity individuals. This result can be generalized; an
increase in pθ always leads to a decrease in the optimal θ (Appendix A contains a proof). That is, the more
sensitive a recruit’s chance of escape is to his age, the younger are the individuals targeted for abduction.
Extension 3: Misinformation and the perceived value of outside options
A recruit’s participation constraint depends on his beliefs about the value of outside opportunities ra-
ther than the opportunities themselves. Rebel groups routinely seek to manipulate beliefs by restricting
information and through disinformation, and a recruit’s susceptibility to disinformation is potentially a
function of his age or ability. We can model this possibility by introducing a "misinformation" factor,
m(θ), into the agent’s reservation utility: u(θ) = p(θ) m(θ) v + (1 – p(θ)) d, where m(θ) [0,1] with con-
stant mθ ≥ 0. This simple form is useful primarily for understanding the implication of ability-dependent
misinformation for the rebel leader’s decision. The greater the leader’s ability to mislead low type recruits
(the higher the mθ), the lower the productivity type targeted by the leader under rewards and punishments.
Reservation utilities that increase in ability are not sufficient for coercive low-type recruitment to be
optimal; cheap punishment is still required. However, the more steeply reservation utilities rise in ability
(i.e. the more that children have trouble with escape, or the more easily they are misled) the less cheap
punishment will need to be before a leader finds it optimal to switch from the high- to low-types. Age-
sensitive reservation utilities thus facilitate child recruitment in a wider range of scenarios.
Extension 4: Indoctrination
Propaganda and information are also used by rebel leaders to indoctrinate—in essence to provide in-
trinsic motivations to fight. Like misinformation, ease of indoctrination could also vary in age and ability,
as suggested by the adolescent psychology literature discussed in section 2. One way to introduce indoc-
trination in our model is for low type agents to incur differential costs for exerting an equivalent amount
of effort. Again, our goal is not to provide a model of agent indoctrination, but rather to look at the impli-
cations for the rebel leader’s choice of incentive and type. We incorporate this type of indoctrination by
allowing the agent's cost of effort to be a function of his θ, where cAθ > 0. Specifically, we assume
0)()1(
0)(2
2
forane
foraneu A

9
where n(θ) [0,1] with constant and non-negative nθ. We prove in Appendix A that the optimal θ is de-
creasing in nθ; that is, the fact that low types (children) are more easily indoctrinated can compensate for a
relative lack of skill and make them appealing targets.
Extension 5: Ability and the value of outside options
Economic development is a two-edged sword as far as child soldiering is concerned. On the one hand,
pro-poor development will slow rebel recruitment. As the returns to civilian life increase—a rise in v—
reservation values increase as well. If the returns to the rebel leader’s production do not rise at the same
(i.e. if the returns from development are not easily captured), then growth will eventually make recruit-
ment of any form untenable. On the other hand, this same growth could exacerbate child soldiering; if
incomes rise only moderately, rebel leaders will reevaluate the types they can afford to retain, and so will
take to conscripting lower types. Eventually pro-poor development will spell the end of recruitment (and
rebel activities), but in the medium term rebel leaders may take to child soldiering as their only economi-
cal alternative while they increasingly run out of options. Figure 3 provides a graphical depiction of this
dynamic; in panel a, θ* is generally decreasing in v as the curve shifts down and to the left.
Like guerrilla productivity, outside options are unlikely to be invariant in age and ability. We can also
consider the case where v depends on θ, so that u(θ) = p(θ) v(θ) + (1 – p(θ))d. The slope of v in θ now
depends on the nature of the economy; in principle, children could face a higher opportunity cost of re-
cruitment if it pulls them out of school and reduces lifetime educational attainment and wages. There is
some evidence of such a tradeoff from northern Uganda (Blattman and Annan forthcoming). On the other
hand, immediate opportunities for children could be very poor, and if people in war zones have short ho-
rizons (i.e. high discount rates), then development opportunities are skewed towards older individuals (i.e.
the higher is vθ). This case is illustrated in panel b of Figure 3. The optimal θ appears to be much more
sensitive to the level of v, however, than its slope in θ.
Extension 6: Uncertainty about errors in production
We have modeled the leader-agent interaction as one with hidden action; there is some error in the
translation of effort and ability into services that are observed by the rebel commander, and the rebel
leader does not observe this error. What happens if this error increases in size, as might happen if the
rebel group becomes spread over a wide territory, or if a particular group’s monitoring technology is
poor? The recruit optimally adjusts his effort downward, because the link between effort and output has
10
weakened. But this means that the recruit’s expected payoff falls, which hampers retention as it becomes
more difficult to meet the recruit’s participation constraint. This distance dynamic is modeled by Gates
(2002). In our model, the leader responds by lowering his productivity target in recruitment and pursuing
those who are easier to retain: low productivity (younger) individuals.
Further possible extensions
While not included in the model, resource constraints could also affect a leader’s decision on agent
type. Both punishments and rewards are costly, and an active budget constraint will force the leader to
move closer to not taking either action (which corresponds to the point at which the solid and the dashed
lines meet in Figure 2). If age is a useful proxy of productivity, then a punishment-oriented rebel leader
would respond to budget pressures by targeting fewer children while a rewards-oriented leader would re-
spond by targeting more children. When punishment is less costly than rewards, however, a rewarding
leader may find it optimal at some point to switch to the most optimal punishing equilibrium available.
Balcells et al. (2008) also suggest that a minimum force size may be necessary to wage war. If the
minimum requirement is large (for instance, because of a strong government response, or a large territory)
then for a fixed amount of resources even a wealthy rebel leader may find it optimal to recruit low prod-
uctivity individuals to reach some critical mass. We have not considered the contest element of warfare in
this paper, but it is a productive avenue for future research.
‘Social resources’ may also be available to a rebel leader. Where popular support exists, punishment
may not for two reasons. First, as noted above, punishment could actually reduce a rebel force’s reputa-
tion and public support, making the marginal cost of punishment very high. Second, social resources may
be non-rival, and hence the marginal cost of rewarding an additional high-productivity recruit might be
quite low. In both cases, only rebel groups with few initial social resources (like the LRA, described be-
low) may find it optimal to recruit children.
Further extensions of the model could help us understand other elements of guerrilla organization and
child soldiering, such as the incentive for rebel leaders to destroy the outside options of recruits (e.g.
through the destruction of schools and farms, or the murder of parents), and the role of supervision and
investments in monitoring technology. We also consider the impacts of risk aversion in Appendix A. Oth-
er extensions could help understand other facets of guerrilla organization: team production, promotion,
11
and the creation of organizational identity. Agency and contract theory will remain a powerful tool of
rebel analysis for some time to come.
C. Empirical implications
Whether child soldiering is optimal depends crucially on the relative productivity of children and the
relative cost of punishment. If children are more productive than adults, then child recruitment will almost
always be optimal, and the nature of recruitment will depend principally on the slope of the reservation
utilities in age. If children are less productive than adults, then cheap punishment is essential to maintain-
ing the low-type equilibrium. It is unclear which circumstances dominate in practice. Our empirical anal-
ysis proceeds in two parts. First, we use interviews, survey data, and a natural experiment from Uganda to
substantiate our model’s assumptions and argue that the facts fit the second case above: productivity fall-
ing in age, reservation utilities rising in age, and coercion when punishment is cheap. If these relation-
ships hold generally, our model has several cross-country (and cross-rebel) predictions. We outline these
predictions in a final section and describe some preliminary tests using a new database on rebel groups.
3. The case of northern Uganda
Between 1994 and 2004 the Lord’s Resistance Army forcibly recruited tens of thousands of young
men and women, with a particular focus on adolescent boys. Interviews and survey data bolster several
assumptions in our model: LRA leaders recruit for ability and longevity; they face imperfect information
over effort but use age as a proxy for ability; and punishment is cheap when public support is already low.
LRA recruitment also provides a cruel natural experiment that reveals how recruits of different ages re-
spond to coercive incentives. Abduction is nearly indistinguishable from random, and all recruits were
offered the same terrible coercion and indoctrination. The manner in which the LRA employ these youth
reveals how leaders value older versus younger recruits, and the manner in which abductees respond re-
veals how ease of escape, indoctrination and misinformation vary in age.
A. Background
The LRA has fought a low-scale guerrilla war against the Government of Uganda since 1988. The
rebels are led by Joseph Kony, a spirit medium of the Acholi tribe. He and the LRA seek a spiritual clean-
sing of the nation and a return to the political dominance that northern tribes enjoyed for the two decades
following Independence (Behrend 1999; Omara-Otunnu 1994).

12
Civilian support for the LRA was meager from the start. Initially, Kony pulled together a few hundred
hardened fighters, the remnants of other disbanded and defeated rebels groups (Behrend 1999; Allen
2005). Unpopular and poorly equipped, these fighters began raiding the homesteads of their Acholi breth-
ren for food, medicine, and recruits. Small roving bands conducted night raids on rural homes. From 1988
to 1994 the LRA stole several thousand youth from their homes.
With few natural resources, and increasingly few ‘social resources’, the LRA struggled to maintain
this small force of forced recruits. The rebellion might have died out were it not for the Government of
Sudan, who in 1994 began providing the LRA with arms and territory for bases. Khartoum’s aim was to
destabilize northern Uganda in retaliation for Museveni’s support for southern Sudanese rebels (the
SPLA). Their support invigorated the LRA, and attacks and abductions escalated. Tens of thousands of
Ugandan youth, primarily adolescent males, were abducted after 1994. Young women were also taken in
lesser numbers to become fighters, servants, and wives (Annan et al. 2009). The vast majority of abduc-
tees, roughly 82%, eventually escaped and survived. Less than 800 youth are thought to remain in the
bush—roughly 1% of the estimated 60,000 to 80,000 abductees (Annan et al. 2006; Pham et al. 2007).
The rest, tragically, are presumed perished.
LRA activity peaked in 2002 when the Ugandan army drove the LRA from Sudan into Uganda, and
intense fighting continued through 2004. Defeat suffered since that time has kept the LRA small and on
the move, principally in eastern DRC and southern Sudan. They ceased abduction in Uganda by 2005.
In newspapers and human rights reports, the LRA is the archetypal irrational, barbaric, apolitical rebel
force of Africa’s so-called “new wars”. Mass child abduction, the use of spirit practices, and brutal civi-
lian violence are treated as evidence of Kony’s lunacy. Yet just as claims of increasingly irrational rebel-
lion have been refuted by scholars of civil war, virtually every scholar of the LRA finds method in Ko-
ny’s madness (e.g. Allen and Vlassenroot 2008). LRA tactics were undoubtedly distorted by spiritual be-
liefs and ideology. Our interviews and survey data, however, testify to the rational thread that runs
through abduction, spirit practices, coercion, and violence.
B. Data
We conducted qualitative interviews with more than 100 former abductees, 20 community and clan
leaders, and 25 commanders from the Ugandan armed forces and the LRA over ten months of field work
over 2005-07. Among the LRA, our main interviews subjects were foot soldiers and mid-ranking officers,

13
including junior commanders, abduction party leaders, catechists, spies, ‘wives’, bodyguards, and even
accountants. Interview subjects were contacted through key informants, such as village leaders, and so are
not necessarily representative of all rebels. Returned senior commanders were not targeted for interview
as they had been extensively interviewed by others, had developed a well-honed narrative, and were un-
likely to be forthcoming given recent indictments of the rebel leadership.
We also conducted representative surveys in concert with an NGO, a psychologist, and two human
rights scholars (Annan et al. 2008). A first survey, in 2005, targeted males born in the Districts of Kitgum
and Pader between 1975 and 1991, and a second round in 2007 interviewed the same cohort of females.
To minimize attrition from migration and mortality, we selected respondents from a sample frame of
youth living in the region before escalation of the war. We randomly sampled 1,162 households in eight
clusters, using the earliest sample frame available: UN World Food Programme lists compiled in 2002.
88% of sampled households were found and interviewed. Enumerators worked with household heads to
develop a roster of all youth living in the household in 1996—a year easily recalled as the date of the first
election since 1980. Using these rosters, 881 surviving males were randomly selected an interview in
2005-06 and 857 females were selected in 2007. Former abductees were oversampled in both cases.
More than a third of target respondents had moved since 1996, and enumerators tracked them to their
current locale. 741 males and 619 females were found, including 688 abductees. Thus there are two
sources of attrition. A first is mortality (including not returning from abduction, which in 95% of cases
implies death): 20% of male abductees and 5% of female ones were lost in this way. The second is failure
to locate 9.5% of males and 17.5% of females. Female absenteeism is higher because of migration for
marriage; the return from displacement that began in 2006, and the time elapsed since the 2005 rosters.
C. Descriptive analysis: LRA recruitment, command, and control
Forced recruitment by the LRA was large-scale and indiscriminate. Roughly two in five males and one
in five females aged 14 to 30 report they abducted for at least a day. The survey collected self-reported,
retrospective information on their war and abduction experiences, listed in Table 1. Lengths of abduction
ranged from a day to ten years, averaging 7.2 months. Youth who failed to escape were trained as fighters
and, after a few months, received a gun.
The LRA was exceptionally young. Figure 4 illustrates the distribution of age at the time of recruit-
ment. Three times as many youth aged 14 were abducted as those aged 9 or 23. The preference for ado-
14
lescent boys holds true even after adjusting for the disproportionate number of young people in the popu-
lation; a 14-year old youth in the study population had a 5% average chance of abduction—twice the risk
faced by ages 9 or 23. Some factor beyond the relative supply of children must account for this pattern.
The focus on adolescents is more pronounced once we account for release. 14% of survey respondents
were released in the first month of abduction (ignoring those left due to injury). LRA raiding parties
commonly abducted all able-bodied members of a household to carry looted goods, but were often under
explicit instructions from Kony to release children under 11 and adults older than their mid-20s, once loot
was delivered safely. Figure 5 displays a running mean, by age of abduction, of the deviation from the
average probability of release (adjusted for location and abduction year). Release is highest for children
under 10, dips sharply for adolescents, and is rising in age thereafter.
The impoverished LRA seldom provided material incentives. Just 5% report material rewards, princi-
pally food. Money or loot was rarely given, even to officers. Such rewards were promised upon victory,
however. “They used to tell us,” said one abductee, “that if we fight and overthrow the government then
we would get wealth, and even the young soldiers would get high ranks in the army.”
Violence and the threat of punishment was the main instrument of control in the LRA. 55% of abduc-
tees were severely beaten (versus 12% of non-abductees) and 24% report being attacked with a weapon
(versus 2% of non-abductees). Beatings or death were the punishment for attempted escape, a sentence
other abductees were often forced to carry out with clubs and knives.
Initiation sometimes involved the forced commission of violence; 25% of abductees were forced to
harm or kill a civilian, and 23% to desecrate dead bodies—a deeply held taboo. 12% of abductees report
being forced to kill a family member or close friend. Such violence served to break down a youth’s psy-
chological defenses and desensitize her to violence. More importantly, it bound her to the group, by rais-
ing the specter of community rejection if she were to flee.
Other forms of misinformation were used to promote fear and loyalty. Abductees were told that rebels
would kill escapees and their families. Abductees who caught word of the universal amnesty were told it
was a ruse, and any who escaped would be killed by the government, and the LRA banned radios after the
government began to announce messages of peace on air.
15
The LRA also limited escape opportunities by moving the abductee as far as possible from home. Half
of abductees were tied, and the first day’s march would deliberately backtrack, move in circles, and dis-
orient. Abductees were taken to the bases in Sudan as quickly as possible.
Spiritual practices were also central to motivating recruits—an explicit attempt to create new social
bonds and loyalty based on a shared cosmology (as well as fear). Kony created a cult of mystery and spi-
ritual power which few Acholi question even now. Those with whom we spoke disagreed not on whether
Kony possesses spiritual power, but rather whether these spirits are good or bad. These purported powers
were used to instill fear, awe, and loyalty. A spiritual initiation ceremony, typically featuring prayers and
anointment with oil, was reported by the majority of those taken two weeks or longer. The LRA is highly
structured, with detailed spiritual restrictions on personal conduct (e.g. eating, drinking, and bathing) and
on military practices. Kony is also feared and respected as a prophet. Three former bodyguards described
a catalog of fulfilled prophesies. They also described displays of power, such as the ability to vanish.
Through the power of the spirits Kony was also said to be omnipresent and able to track down escapees
by the smell of the oil with which they were anointed.
While spiritual messages and initiation were common, so were political propaganda and the promise
of material rewards. The importance of overthrowing the government is most commonly reported in our
data, followed by incitement over crimes committed by Museveni and promises of government positions.
Together, this spiritual, political and material propaganda were often effective. 30% say they once felt
allegiance to Kony, 11% admitted there was a time they felt like staying with the LRA, and 6% admitted
that they aspired to become a commander. Of those abducted more than 2 months, those figures rise to 60,
28, and 16%. According to a two-year abductee, “for a time I forgot survival and became a part of them; I
was abducting and stealing just like them.” Such “forgetting” and shift in identity was commonly re-
ported. In some cases this was associated with Kony’s spiritual powers. According to one informant, “In
the bush, there is something that confused people. There is a certain type of holy oil which they put on
you. It confused you and you could never think of home.”
Accounts of allegiance and forgetting suggest that LRA discipline, religion and propaganda did not
simply change individual incentives, but fundamentally altered the beliefs and values of recruits. Such
indoctrination and identity manipulation has been widely remarked upon in social psychology and mili-
tary sociology. More recently, economists Akerlof and Kranton (2005) have articulated how such prefe-

16
rence shifts can be formally modeled in the framework of incentive theory, arguing such preference shifts
are the most plausible explanation for observed behavior. For those who remain with the LRA for long
periods of time, the decision to escape is usually associated by a moment of “awakening”. “When I grew
up,” explained one young man, “I saw that everything Kony said was false. If it were really true then the
government could have been overthrown. And here the people he abducted before me had all escaped.”
Some of these stories reflect a realization that the promised benefits would not be received: “We would
ambush and carry things,” said another young man, “but then I wouldn’t benefit. It was the leaders who
benefited. Then I thought I should escape because I had not gone on my own but had been abducted.”
D. The incentives to recruit children in Uganda
The focus on abducting young adolescent, so evident in Figure 4, is striking. The evidence suggests
that northern Uganda is a clear example of case 2 of our theoretical model. Children appear to have been
less effective fighters than adults. In this case, the key to child soldiering is the relative cheapness of pu-
nishment to the LRA. The forced commission of violence, threats of beatings, and spiritual intimidation
were nearly costless in time and material resources. More importantly, with few initial social resources,
and material backing coming from one of the least human-rights-sensitive regimes on the planet (Khar-
toum) the LRA faced little social penalty to child abduction and coercion.
We attempt to test this proposition in the following section, in a cross-rebel analysis. We can also use
the unusual nature of LRA recruitment tactic—a uniform, coercive strategy offered nearly at random to a
sample of different ages—to investigate the additional mechanisms that facilitated child soldiering. Our
evidence suggests that adolescent recruits were indeed more easily manipulated, and had lower expected
probabilities of escape, than adults.
Empirical strategy
LRA abduction was large-scale and virtually indiscriminate. Rural Acholi households live in scattered
rural homesteads at some distance from their neighbors. Typically, abduction parties of 10 to 15 guerrillas
would swing down from their Sudanese bases to conduct military missions several weeks in length, raid-
ing homesteads in their path for loot and recruits. Abduction party leaders reported that the only criterion
for abduction was the demand to release young children and adults. Indeed, abduction by the LRA is in-
distinguishable from random after accounting for year and location of birth. No other pre-abduction
household trait is associated with a higher risk of abduction, whether household wealth, education levels,
17
or orphaning. In logit regressions of abduction on pre-war household traits (not shown) the coefficients on
wealth, education, occupation and orphaning are small and not statistically significant. Only household
size predicts abduction: large households were slightly less likely to be raided, in part because they were
harder to control by a small band of fighters (Blattman and Annan forthcoming).These same characteris-
tics, however, predict participation in a government militia.
In this context, cross-age comparisons of the self-reported actions, attitudes, and experiences of former
abductees will estimate the differential response of children and adults to threats and violence. We em-
ploy the following specification for comparisons of an abductees’ response, y, over age of abduction, A:
yi = αAi + YiΠ + LiΠ + HiΠ + εi .
To account for changes in rebel practice over time, space and gender, we include vectors of abduction
year indicators, Y, and gender-specific indicators for location of birth, L. To account for any residual se-
lection into abduction and reduce standard errors, we include a pre-abduction variables, H (including
household assets and parents’ occupation, education, and death).
Note that selective mortality may create attrition bias. The potential bias is unknown, but the most
plausible forms of selection (e.g. children are less skilled fighters, and the less skilled are more likely to
die) understate cross-age differences. Finally, war experiences are measured with error. We are especially
concerned about under-reporting of measures such as loyalty or violence committed. So long as any sys-
tematic error is uncorrelated with abduction age, however, that measurement error will be cancelled out in
cross-age comparisons. Only measurement error that varies with age of abduction will cause bias.
Results
First, an analysis of roles in the armed group suggest that children were no better than adults as figh-
ters; young children in particular were likely to be worse. The LRA waited longest to give abductees
younger than 12 a gun: youth aged 8–9 took 10.5 months to receive a gun, compared to 3.7 months for
youth aged 12–13 and just 2 months for those 18–19 (Figure 6a). A large number of young abductees
never even received a gun; young children were nearly half as likely to have received one as adolescents
aged 15 to17 (Figure 6b). Receipt of a firearm was also lower among young adults, however. Interviews
with former abductees and mid-ranking officers suggest that this was because not all adults could be
trusted (a theme we return to below, with evidence). When they were trusted, however, we see that they

18
received a gun more quickly than children and adolescents. Adolescent males, however, were most likely
to report that they were considered ‘dependable fighters’ by their superiors. Regressions using an age qu-
adratic suggest that these non-linear relationships are highly statistically significant (see Table 2).
If children were less able fighters, why focus on abducting adolescents? Figure 7 provides the clearest
answer; abduction lengths fall steeply in abduction age: from 9 months at age 12–13 to 4.5 months by age
24–25. According to the regression results, length falls by 0.5 months for every year of age (Table 3).
One reason that younger abductees stay longer is that younger recruits are less likely to plan and ex-
ecute an escape. Escape took three forms (excluding release): rescue by the Ugandan army (6%); escape
in the heat of battle (28%); and running away at night or when scavenging (56%). Involuntary escape,
such as rescue, is highest among the young and falls by 0.6 percentage points for every year of age (see
Table 3). Voluntary and premeditated escape, on the other hand, is least common among the young, rising
by 0.8 percentage points with each year of age—from 54% at age 12–13 to 64% at 24–25.
LRA officers and abductees explained that young abductees were most fearful of escape because their
surroundings were more unfamiliar and because they were insufficiently cunning. According to a 7-year
servant to Kony, “Old people are able to escape, but for the children it is difficult because they do not
know how.” The survey asked abductees if they knew their whereabouts when they escaped (Table 3).
Familiarity with one’s location at the time of escape is increasing in age—0.8 percentage points for each
additional year (significant at the 10% level), rising from 48% at age 12–13 to 55% at age 24–25.
Younger abductees also appear to have been more easily indoctrinated and misled. According to one,
“it is easy to convince a child of 12 years of anything. He will believe any promises made and does not
know the difference between good and bad. But if you are mature, you know they will not overthrow the
government.” The data, reported in Table 4, support these accounts, especially among male recruits. First,
older abductees were less likely to report that they ever felt safer in the LRA, falling 0.5 percentage points
with each year of age, from 7.5% at age 12–13 to none at age 24–25. The effect is driven by males.
Older males were also least likely to report feeling allegiance to Kony. Allegiance fell by 0.7 percen-
tage points with each year of age (significant at the 10% level), from 32% at age 12–13 to 23% at 24–25.
Older males were also less likely to say they believed in Kony’s spiritual powers, such as the claim that
his magic provided protection from bullets. This belief fell 0.6 percentage points with each year of age
(significant at the 10% level), from 13% among those abducted at age 12–13 to 8% of those 24–25.

19
Other relationships are quadratic in nature: highest among adolescents and lowest among children and
adults. Aspiration to become a commander is 7% in the teenage years, falling below 5% among children
and adults. Roughly 13% of adolescent abductees report there was a time they felt like staying with the
LRA, with these rates falling steeply towards zero among young children and adults.
Finally, children were more likely than adults to receive threats and punishments. Threats of death and
punishment, which were only measured among those abducted more than two weeks, declined by 0.6 per-
centage points with each year of age (Table 5). Adults were also less likely to be forced to commit vi-
olence. Being forced to kill a family member fell from 16% at ages 12–13 to 9% at 24–25, while being
forced to abuse dead bodies fell from 28% to 18%. This impact diminishes, however, when accounting
for length, suggesting the abuse of dead bodies is partly a function of length and partly of age.
The LRA did not follow a dual strategy of rewards for adults and punishments for children. The like-
lihood of receiving a material reward (mainly extra food) has almost no correlation with age, even when
accounting for length of abduction (Table 5). Material rewards are rare at all ages, moreover, for lack of
resources. Nevertheless, political propaganda, primarily regarding the re-establishment of an Acholi-led
government, was more commonly reported by older recruits. After accounting for length, propaganda re-
ports rose 1.5 percentage points for each year of age (from 43% of those abducted at 12–13 to 79% at age
24–25). Adults are also less likely to report threats and no propaganda: 55% of abductees age 12–13 re-
port threats and no propaganda, versus 21% of those 24–25.
4. Cross-rebel predictions and analysis
A single case helps to refine our theory and validate some basic assumptions, but cannot test it. This
paper is primarily a theory-building exercise; testing of the model requires in-depth comparative analysis,
qualitative and quantitative, for future research to pursue. We finish, however, with preliminary tests of
key predictions using new cross-rebel data.
A. Predictions of the model
Our model describes labor demand in partial equilibrium. To generalize our predictions, we must as-
sume that the supply of potential recruits does not vary substantially across countries and rebel groups,
because the model from which our predictions derive is build on the premise that rebel leaders are not

20
constrained by labor supply conditions in selecting a target type for recruitment. Our predictions are ap-
propriate insofar as variation in labor demand drives variation in recruitment practices.
First, when guerrilla productivity is increasing in age, cheap punishment is a necessary condition for
the low-type equilibrium. Thus we should not observe groups that recruit large numbers of young adoles-
cents via rewards, nor should we observe armed groups that recruit large numbers of adults via coercion.
In particular, there should be a negative correlation between age of recruitment and the use of coercion.
Deviations from this relationship should take a predictable form. Even when high-type recruitment is
optimal, some circumstances, especially as an increase in the value of outside options, will lower the op-
timal rewards-based recruitment (i.e. a leftward shift of the curve in Figure 3). Hence rewards-based re-
cruitment of adolescents may be observed in some middle income countries.
Second, we should not observe child recruitment where punishment is expensive, as when groups start
with high initial levels of social resources or external support from a rights-conscious donor; similarly,
rebel groups with low levels of initial civilian support and resource bases that are unresponsive to human
rights abuses should be less likely to recruit and reward large numbers of high-ability adults.
Third, a decrease in the cost of punishment should be associated with an increase in the use of children
and coercion. For instance, coercive recruitment should increase the further a rebel group strays from its
social base of support, and the average age of recruitment should fall alongside it.
Note, however, that age is not a perfect proxy for productivity. If there is a distribution of productivity
within each age group, then we would expect some children to exhibit high ability and some adults to ex-
hibit low ability. If rebel leaders can observe this ability, initially or after some time, then they may target
high-ability children with rewards. Alternatively, they may choose to abduct and coerce both children and
adults, screening out high ability types (who escape), leaving only low ability types that are predominant-
ly children but include low-type adults. Hence the above predictions are approximate relationships only.
B. Data and measurement
No systematic data on rebel groups exist, and so to test our predictions we created an original dataset.
Information on rebel recruitment and resources is scarce, scattered and inconsistent. To maximize data
quality and depth, we gathered data on a random sample of African rebel groups. We sampled at the civil
conflict level (allowing for multiple conflicts per country) using all civil conflicts in sub-Saharan Africa
in the period 1980-2004 reported in the UCDP/PRIO Armed Conflict dataset (Harbom et al. 2008). 14 of

21
42 conflicts were randomly selected; within a conflict, we sought information on all non-state armed ac-
tors listed in the dataset: 43 groups from a total of 124 across all conflicts. To ensure a random sample
across the maximum number of countries, we stratified the sample by the number of conflicts reported in
a country. The sample includes groups from Burkina Faso, Cote d'Ivoire, D.R. Congo, Ethiopia, Gambia,
Guinea-Bissau, Mali, Nigeria, Senegal, Somalia, South Africa, and Uganda. Single-incident coups were
dropped, leaving 40 armed groups in the sample.
A team of eight student researchers used reports, academic literature, news archives, and related
sources to develop detailed, sourced, group-specific narratives on key variables: method and age of re-
cruitment, remuneration type, and resource base (material and social, internal and external). Academic
experts were contacted for each group to complete and validate the results. Appendix B provides a de-
tailed description of the dataset and coding process and narratives are available from the authors.
Based on these narratives and expert interviews, the authors and research team coded several va-
riables: Percentage of recruits under 18; an indicator for evidence of 5 percent or more of Recruits under
15; an indicator for evidence of 20 percent or more Forced recruitment; an indicator for Forced child re-
cruitment; indicators for any evidence of Monetary rewards paid; ordinal scales for the Degree of initial
civilian support and Initial material resources; and an indicator for Natural resource wealth.
Table 6 describes the coding and summary statistics for each variable. Under-18 recruitment ranges
from 0 to 70 percent, with a mean of 13 percent. More than a third of our sample recruited children under
15 in significant numbers. Likewise, a third of groups forcibly recruit. We were conservative in our
measure of forced recruitment, coding only the most overt coercion, in essence abduction. Note that, with
the exception of the LRA, there are no quantitative data on the groups in our sample, and so all coding is
subjective and approximate. Percentage of recruits under 18, for instance, could be coded no finer than
approximate quintiles. Such fine distinctions proved impossible for Recruits under 15 and Forced re-
cruitment, and so we code only a dummy variable. Approximately a third of the groups were small, short-
lived and obscure, and (as detailed in Appendix B) here the data are weakest.
C. Analysis
Cross-rebel statistical analysis is plagued by a number of challenges. One is sample selection: we only
observe groups that have been minimally successful in organizing and sustaining a movement. Another is
that data are scarce or of poor quality, as well as aggregated. Finally, group practices are endogenously

22
determined, frustrating causal claims. Thus cross-rebel regressions must be used with caution. Neverthe-
less, this group-level analysis is more novel and more insightful that the usual cross-country analysis, and
presents perhaps the only large-sample mans of testing theories about rebel organization and behavior.
Nevertheless, cross-rebel data confirm our primary prediction: child recruitment and coercion are
strongly correlated. Forced recruitment and Percentage recruits under 18 have a correlation coefficient of
0.53, and Forced recruitment and Recruits under 15 have a correlation coefficient of 0.60. Both are sig-
nificant at the 1 percent level (and are robust to exclusion of the LRA).
Figure 8 plots Forced recruitment on Percentage recruits under 18; fitting a simple regression line, we
see a clear upward slope that is robust to the exclusion of a seeming outlier, the LRA. In fact, the LRA is
not as much of an outlier as it appears; African groups outside our random sample, including several in
Liberia and Sierra Leone, more than 40 percent child recruitment (Pugel 2006; Humphreys and Weinstein
2004). What require more explanation are the groups who use forced recruitment but have small propor-
tions of child recruits (i.e. those in the lower right quadrant of Figure 8). Here we face a problem of ag-
gregation: it is possible that the 10 to 20 percent of children are the same 10 to 20 percent that are thought
to be forcibly recruited. Given the scarcity of data it is difficult to say, and an investigation of our hypo-
thesis and predictions will likely require further comparative case work or new, finer databases.
Table 7 displays the results of linear regressions of our two child soldiering measures on Forced re-
cruitment (inferences are within-sample). Agent and incentive types are jointly determined in the model,
and so the use of Forced recruitment as an independent rather than a dependent variable is arbitrary. Non-
etheless, the coefficient on forced recruitment in all cases is negative and statistically significant; the Per-
centage recruits under 18 is 14 percentage points higher in groups that recruit forcibly (column 1); and a
group that forcibly recruits is 61 percentage points more likely to Recruit under 15 (column 5). The direc-
tion, magnitude and significance of the coefficients are robust to the inclusion of country dummies and an
indicator for the LRA (although the magnitude tends to decline).
Our model also suggests that groups that forcibly recruit children should be less likely to pay monetary
wages; that groups with higher initial popular support should be less likely to forcibly recruit children;
and that groups with independent resources bases (like natural resource wealth) will be more likely to
forcibly recruit children. Each of these hypotheses is borne out weakly in the cross-rebel analysis. Indi-
vidual regressions of Recruitment under 18 and a Forced child recruitment indicator on measures of
23
Monetary wages paid, Initial civilian support, Natural resource wealth, and Initial material resources all
have the predicted sign (see Table 8). Individually, however, none are statistically significant, perhaps in
part because of the small sample size and missing data. When Forced child recruitment is regressed on all
of the independent variables at once (column 8) we see much larger and robust coefficients: Groups with
natural resource wealth are 79 percentage points more likely to forcibly recruit children, while groups
with initial civilian support for 58 percentage points less likely. Such groups are 70 percentage points less
likely to pay monetary wages, but this coefficient is not statistically significant. These results must be re-
garded with caution, due to the number of missing observations (largely Somali groups and small, short-
lived insurgencies). We regard the correlations in Table 8 as applying to larger, sustained insurgencies.
Finally, the model predicts that as outside opportunities improve, adolescents may be more likely to be
recruited voluntarily. We proxy for outside opportunities with GDP per capita. We find little support for
this prediction; groups in wealthier countries are actually less likely to forcibly recruit children (column
7) and this correlation is large and statistically significant when considered in concert with the other inde-
pendent variables (column 8). One possible explanation is that GDP per capita also proxies for state coun-
ter-insurgency capacity (Fearon and Laitin 2003); weaker or less popular groups may opt to forcibly re-
cruit children, but such groups may also be more easily defeated by stronger regimes, and hence be de-
feated, dwindle, or choose not to form in the first place. This returns us to one of the fundamental weak-
nesses of cross-rebel analysis: sample selection in terms of the rebel movements observed. While many of
our predictions are borne out by the evidence, a comparative and historical approach is likely to be a more
robust avenue of future research and testing of the theory.
5. Conclusions and policy implications
What is the implication of our argument for public policy and counter-insurgency? Rebel leaders like
Kony are not ignorant of these forces: cheap punishment, the ease of child indoctrination, and the difficul-
ty they have in escape. The same dynamics arguably apply to other forms of child labor and enslavement.
The crucial insight of the principal agent set-up, similar to that argued by Chwe (1990), is that threatening
or inflicting pain is a rational and optimal strategy for motivating people who are poor in the sense of hav-
ing bad alternatives. Hence children’s reservation utilities are crucial—it is only because they are low in
reality as well as perception and expectation that abduction and punishment are optimal.

24
Our approach yields counterintuitive policy implications. For instance, a government’s policing or
counter-insurgency effort could have serious unintended consequences. As discussed above, increases in
counter-insurgency efforts could raise the minimum force size requirement for a rebel group. If punish-
ment is cheap and resources are fixed, a rebel leader’s incentive is to increase the abduction of children.
A seemingly obvious means of discouraging recruitment of all forms is aggregate educational and
economic opportunities, an approach advocated by the International Labor Organization (ILO 2007). But
our model suggests that this relationship may not be so simple: first, intermediate levels of development
could actually push the optimal age of recruitment downwards, especially if adults share in growth more
than children; and second, outside opportunities for recruits must rise faster than that for rebel leaders,
otherwise the rebel leader’s incentives to seize the country (and hence recruit) increase proportionally.
Reducing poverty and increasing access to education are long term solutions to an urgent and imme-
diate problem. Where child abductions continue to occur, our results suggest an unconventional interven-
tion: counter-abduction training. A child’s reservation utility is lower in part because of the rebel leader
exploits a child’s lower expectations of successful escape and community acceptance. Programs of educa-
tion and counter propaganda should therefore increase a child’s valuation of his outside options and make
children less attractive as recruits. Just as Western schoolchildren perform fire drills, or learn not to speak
to strangers, so should children in war zones be drilled in escape and misinformation.
Just such a counter-propaganda effort was launched by Ugandan civil society, albeit too little and too
late. In 2000, organizations began to broadcast messages of reconciliation, welcome and amnesty. One
rebel commander reported that, by 2004, such broadcasts helped lead to orders to cease abductions: evi-
dence of amnesty and reconciliation became so widespread that a new abductee would ‘taint’ previous
ones by revealing the truth. Informal education programs also emerged. As returned youth swelled in
number, returnees began to teach young relatives and neighbors how to escape. Experienced hunters also
began to pass on methods of triangulating one’s location (and the direction of home) by the shape of vari-
ous rock formations scattered across the landscape. In retrospect, more and better education and commu-
nication earlier in the conflict could have reduced the effectiveness of abduction.
6. References
Acemoglu, Daron, and Alexander Wolitzky. 2009. "The Economics of Labor Coercion." NBER Working
Paper No. 15581.

25
Akerlof, George A., and Rachel E. Kranton. 2005. "Identity and the Economics of Organizations." Jour-
nal of Economic Perspectives 19 (1):9-32.
Allen, Tim. 2005. "War and Justice in Northern Uganda: An Assessment of the International Criminal
Court's Intervention." London: Crisis States Research Centre, Development Studies Institute,
London School of Economics.
Allen, Tim, and Koen Vlassenroot, eds. 2008. The Lord's Resistance Army: War, Peace and Reconcilia-
tion in Northern Uganda: Unpublished book manuscript.
Andvig, Jens, and Scott Gates. 2006. "Recruiting Children for Armed Conflict." In Child Soldiers Initia-
tive Working Group Session. Pittsburgh, Pennsylvania.
Annan, Jeannie, Christopher Blattman, and Roger Horton. 2006. "The State of Youth and Youth Protec-
tion in Northern Uganda: Findings from the Survey of War Affected Youth." Kampala, Uganda:
UNICEF.
Annan, Jeannie, Christopher Blattman, Khristopher Carlson, and Dyan Mazurana. 2008. "Survey of War
Affected Youth: Phase I & II Codebook." Yale University.
Annan, Jeannie, Christopher Blattman, Dyan Mazurana, and Khristopher Carlson. 2009. "Women and
Girls at War: "Wives", Mothers and Fighters in the Lord's Resistance Army." Unpublished work-
ing paper, Yale University.
Azam, Jean-Paul. 2006. "On thugs and heroes: Why warlords victimize their own civilians." Economics
of Governance 7 (1):53-73.
Balcells, Laia, Stathis N. Kalyvas, and Dominic Rohner. 2008. "International System and Technologies of
Rebellion: How the Cold War Shaped Internal Conflict." Unpublished working paper, Yale Uni-
versity.
Basu, Kaushik. 1999. "Child Labor: Cause, Consequence, and Cure, with Remarks on International Labor
Standards." Journal of Economic Literature 37 (3):1083-119.
Behrend, Heike. 1999. Alice Lakwena & Holy Spirits: War In Northern Uganda 1985-97. Columbus:
Ohio University Press.

26
Blattman, Christopher, and Jeannie Annan. forthcoming. "The Consequences of Child Soldiering." Re-
view of Economics and Statistics.
Blattman, Christopher, and Edward Miguel. forthcoming. "Civil War." Journal of Economic Literature.
Boyden, Jo. 2003. "The Moral Development of Child Soldiers: What Do Adults Have to Fear? ." Peace
and Conflict: Journal of Peace Psychology 9 (4):343-62.
Boyden, Jo, and Joanna de Berry, eds. 2004. Children and Youth on the Front Line: Ethnography, Armed
Conflict and Displacement. New York, Oxford: Berghahn Books.
Brett, Rachel, and Irma Specht. 2004. Young Soldiers: Why They Choose to Fight. Edited by ILO. Bould-
er: Lynne Reiner.
Chwe, Michael Suk-Young. 1990. "Why Were Workers Whipped? Pain in a Principal-Agent Model." The
Economic Journal 100 (403):1109-21.
Clapham, Christopher S. 1998. African Guerrillas: Indiana University Press.
Cohn, Irene, and Guy S. Goodwin-Gill. 1994. Child Soldiers: The Role of Children in Armed Conflict:
Institut Henry-Dunant, Oxford University Press.
Conning, Jonathan H., and Michael Kevane. 2007. "Freedom, Servitude and Voluntary Labor." In Buying
Freedom: The Ethics and Economics of Slave Redemption, ed. K. A. Appiah and M. Bunzl. Prin-
ceton: Princeton University Press.
Domar, Evsey D. 1970. "The Causes of Slavery or Serfdom: A Hypothesis." The Journal of Economic
History 30 (1):18-32.
Edmonds, Eric V., and Nina Pavcnik. 2005. "Child Labor in the Global Economy." Journal of Economic
Perspectives 19 (1):199-220.
Engerman, Stanley. 1973. "Some Considerations Relating to Property Rights in Man." Journal of Eco-
nomic History 33 (1):43-65.
Fares, Jean, and Dhushyanth Raju. 2007. "Child Labor Across the Developing World: Patterns and Corre-
lations." In World Bank Policy Research Working Paper 4119: World Bank.
Fearon, James D., and David D. Laitin. 2003. "Ethnicity, Insurgency and Civil War." American Political
Science Review 97 (1):75-90.

27
Fenoaltea, Stefano. 1984. "Slavery and Supervision in Comparative Perspective: A Model." Journal of
Economic History 44 (3):635-68.
Findlay, Ronald. 1975. "Slavery, Incentives, and Manumission: A Theoretical Model." The Journal of
Political Economy 83 (5):923.
Galula, David. 1964. Counterinsurgency warfare: theory and practice. New York: Praeger.
Garfinkel, Michelle R. 2004. "On the Stability of Group Formation: Managing the Conflict Within." Con-
flict Management and Peace Science 21 (1):43-68.
Gates, Scott. 2002. "Recruitment and Allegiance: The Microfoundations of Rebellion." Journal of Con-
flict Resolution 46 (1):111-30.
———. 2004. "Recruiting Child Soldiers." In CSCW workshop, “Techniques of Civil War,” organized by
the Working Group on Microfoundations of Civil War, 20-21 August 2004.
Guevara, Ernesto. 1961/1998. Guerrilla warfare. Lincoln: University of Nebraska Press and Bison
Books.
Gutiérrez, Francisco. 2006. "Organizing minors." In Ford Institute Workshop on Child Soldiers.
Harbom, Lotta, Erik Melander, and Peter Wallensteen. 2008. "Dyadic Dimensions of Armed Conflict,
1946-2007." Journal of Peace Research 45 (5):697-710.
Harris, Judith Rich. 1998. "The nurture assumption: Why children turn out the way they do." New York.
Honwana, Alcinda. 2005. Child Soldiers in Africa. Philadelphia, PA University of Pennsylvania Press.
HRW. Facts about child soldiers. Human Rights Watch 2008 [cited 7/29/2008. Available from
http://www.hrw.org/campaigns/crp/fact_sheet.html.
Humphreys, Macartan, and Jeremy Weinstein. 2004. "What the Fighters Say: A Survey of Ex-combatants
in Sierra Leone, June-August 2003." Center for Globalization and Sustainable Development
Working Paper.
ILO. 2003a. "Investing in Every Child: An Economic Study of the Costs and Benefits of Eliminating
Child Labour." Geneva: International Labour Organization.
———. 2003b. "Wounded Childhood: The Use of Child Soldiers in Armed Conflict in Central Africa."
Washington, D.C.: International Labor Organization.
28
———. 2007. "Prevention of child recruitment and reintegration of children associated with armed forces
and groups: Strategic framework for addressing the economic gap." Geneva: International Labour
Organization.
Kaldor, Mary. 1999. New and old wars. Organized violence in a global era. Cambridge, UK: Polity
Press.
Kalyvas, Stathis N. 2006. The Logic of Violence in Civil War. New York: Cambridge University Press.
Kaplan, Robert D. 1994. "The Coming Anarchy." Atlantic Monthly, February, 44–76.
Lichbach, Mark I. 1994. "What makes Rational Peasants Revolutionary?: Dilemma, Paradox, and Irony in
Peasant Collective Action." World Politics 46 (3):383-418.
Machel, Graça. 1996. "Impact of Armed Conflict on Children." New York: UNICEF.
Mao, Tse-Tung. 1961/2000. On Guerrilla Warfare. Edited by S. B. Griffith II. Champaign: University of
Illinois Press.
O’Donoghue, Ted, and Matthew Rabin. 2000. "Risky Behavior among Youths: Some Issues from Beha-
vioral Economics." UC Berkeley Department of Economics Working Paper.
Omara-Otunnu, Amii. 1994. Politics and the Military in Uganda, 1890-1985. London: Macmillan in as-
sociation with St. Antony's College, Oxford.
Paige, Jeffrey M. 1975. Agrarian Revolution: Social movements and export agriculture in the underdeve-
loped world. New York: Free Press New York.
Peters, Krijn. 2004. "Re-examining Voluntarism: Youth Combatants in Sierra Leone." Pretoria: Institute
for Security Studies.
Peters, Krijn, Paul Richards, and Koen Vlassenroot. 2003. "What Happens to Youth During and After
Wars? A Preliminary Review of Literature on Africa and an Assessment of the Debate." RA-
WOO Working Paper.
Petraeus, David. 2006. "Learning Counterinsurgency: Observations from Soldiering in Iraq." Military
Review Jan-Feb.
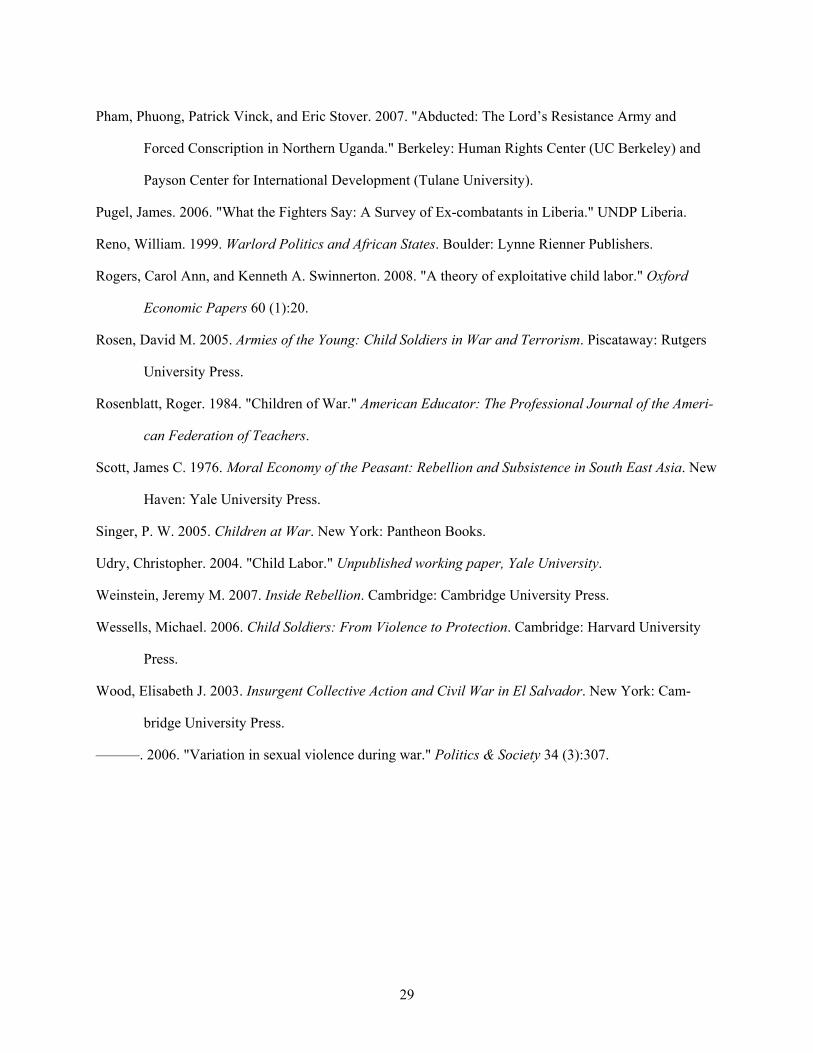
29
Pham, Phuong, Patrick Vinck, and Eric Stover. 2007. "Abducted: The Lord’s Resistance Army and
Forced Conscription in Northern Uganda." Berkeley: Human Rights Center (UC Berkeley) and
Payson Center for International Development (Tulane University).
Pugel, James. 2006. "What the Fighters Say: A Survey of Ex-combatants in Liberia." UNDP Liberia.
Reno, William. 1999. Warlord Politics and African States. Boulder: Lynne Rienner Publishers.
Rogers, Carol Ann, and Kenneth A. Swinnerton. 2008. "A theory of exploitative child labor." Oxford
Economic Papers 60 (1):20.
Rosen, David M. 2005. Armies of the Young: Child Soldiers in War and Terrorism. Piscataway: Rutgers
University Press.
Rosenblatt, Roger. 1984. "Children of War." American Educator: The Professional Journal of the Ameri-
can Federation of Teachers.
Scott, James C. 1976. Moral Economy of the Peasant: Rebellion and Subsistence in South East Asia. New
Haven: Yale University Press.
Singer, P. W. 2005. Children at War. New York: Pantheon Books.
Udry, Christopher. 2004. "Child Labor." Unpublished working paper, Yale University.
Weinstein, Jeremy M. 2007. Inside Rebellion. Cambridge: Cambridge University Press.
Wessells, Michael. 2006. Child Soldiers: From Violence to Protection. Cambridge: Harvard University
Press.
Wood, Elisabeth J. 2003. Insurgent Collective Action and Civil War in El Salvador. New York: Cam-
bridge University Press.
———. 2006. "Variation in sexual violence during war." Politics & Society 34 (3):307.
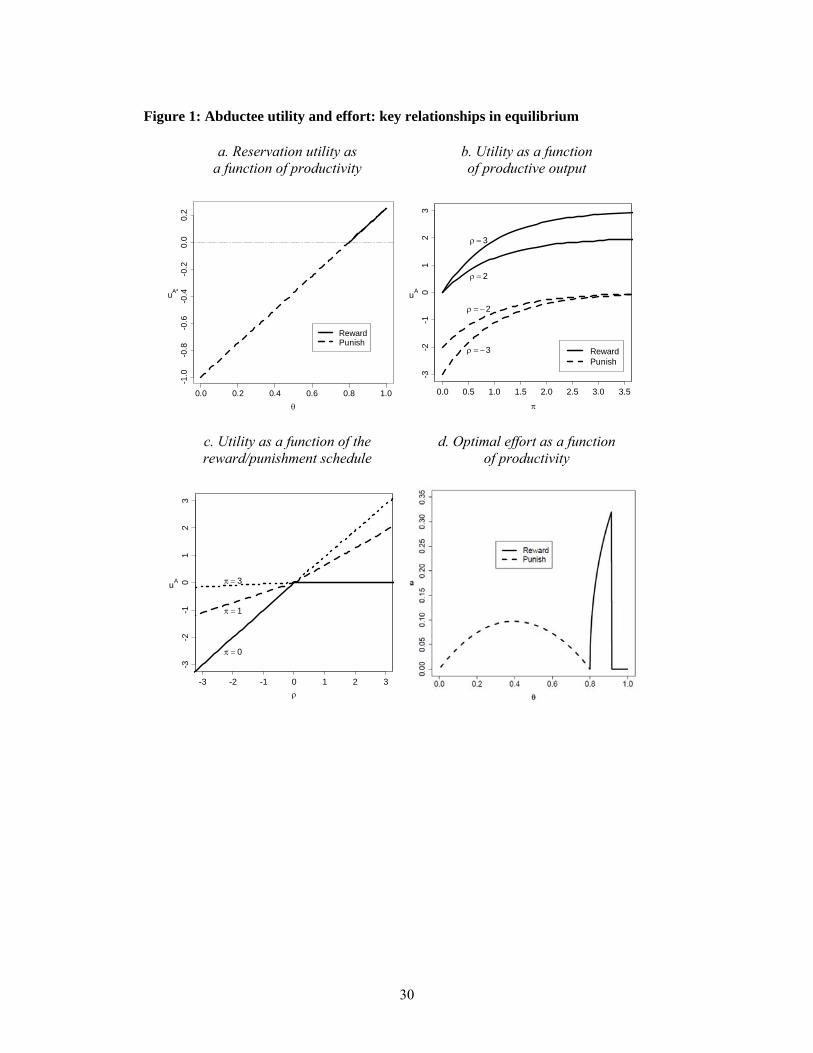
30
Figure 1: Abductee utility and effort: key relationships in equilibrium
a. Reservation utility as b. Utility as a function a function of productivity of productive output
0.0 0.2 0.4 0.6 0.8 1.0
-1.0
-0.8
-0.6
-0.4
-0.2
0.0
0.2
uA*
RewardPunish
0.0 0.5 1.0 1.5 2.0 2.5 3.0 3.5
-3-2
-10
12
3
uA
3
3
2
2
RewardPunish
c. Utility as a function of the d. Optimal effort as a function reward/punishment schedule of productivity
-3 -2 -1 0 1 2 3
-3-2
-10
12
3
uA
0
3
1

31
Figure 2: Leader's utility in terms of abductee productivity
a. Base case: Punishment and rewards are equally costly
0.0 0.2 0.4 0.6 0.8 1.0
0.00
0.05
0.10
0.15
0.20
uL
RewardPunish
b. Punishment less costly than rewards
0.0 0.2 0.4 0.6 0.8 1.0
0.00
0.05
0.10
0.15
0.20
k 0.01
uL
0.0 0.2 0.4 0.6 0.8 1.0
0.00
0.05
0.10
0.15
0.20
k 0.1
uL
0.0 0.2 0.4 0.6 0.8 1.0
0.00
0.05
0.10
0.15
0.20
k 0.5
uL
0.0 0.2 0.4 0.6 0.8 1.0
0.00
0.05
0.10
0.15
0.20
k 1
uL

32
Figure 3: Leader's utility in terms of θ, at different levels of development and returns to ability
a. for different levels of development (v)
0.0 0.2 0.4 0.6 0.8 1.0
0.00
0.05
0.10
0.15
0.20
v 0.1
uL
0.0 0.2 0.4 0.6 0.8 1.0
0.00
0.05
0.10
0.15
0.20
v 0.4
uL
0.0 0.2 0.4 0.6 0.8 1.0
0.00
0.05
0.10
0.15
0.20
v 0.7
uL
0.0 0.2 0.4 0.6 0.8 1.0
0.00
0.05
0.10
0.15
0.20
v 1
uL
b. for different returns to age and ability (vθ)
0.0 0.2 0.4 0.6 0.8 1.0
0.00
0.05
0.10
0.15
0.20
v0 0.1v 0.9
uL
0.0 0.2 0.4 0.6 0.8 1.0
0.00
0.05
0.10
0.15
0.20
v0 0.4v 0.6
uL
0.0 0.2 0.4 0.6 0.8 1.0
0.00
0.05
0.10
0.15
0.20
v0 0.7v 0.3
uL
0.0 0.2 0.4 0.6 0.8 1.0
0.00
0.05
0.10
0.15
0.20
v0 1v 0
uL
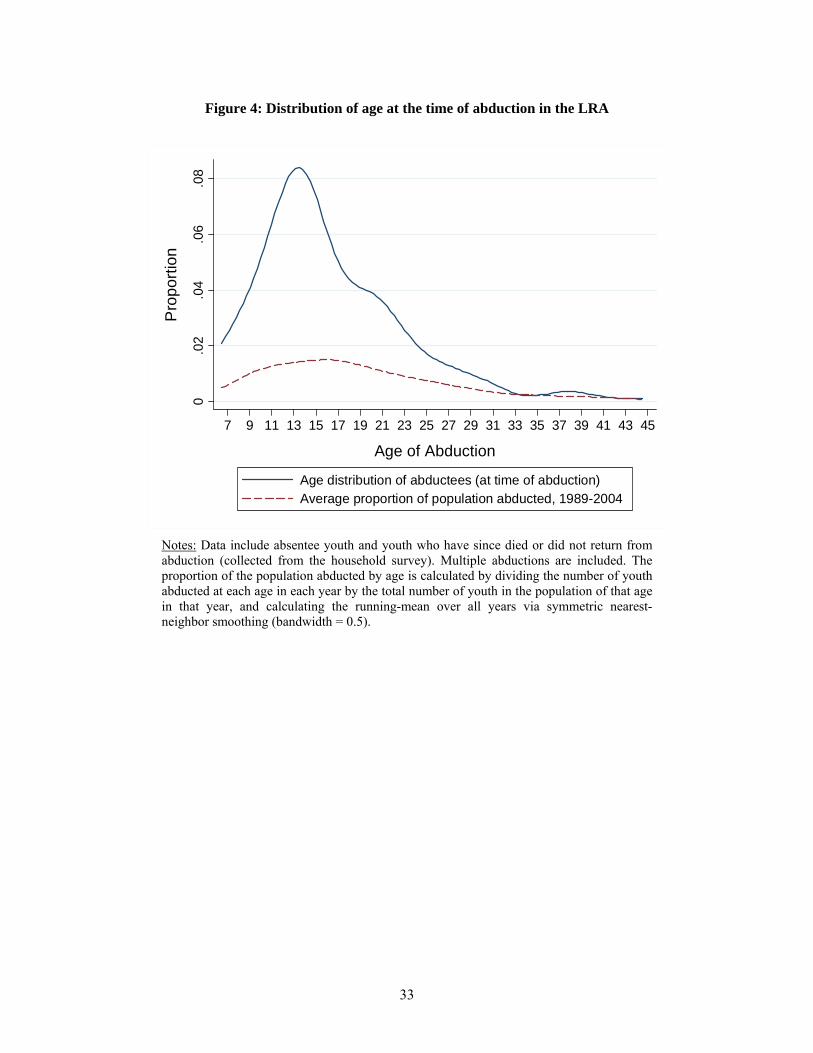
33
Figure 4: Distribution of age at the time of abduction in the LRA
0.0
2.0
4.0
6.0
8
Pro
port
ion
7 9 11 13 15 17 19 21 23 25 27 29 31 33 35 37 39 41 43 45
Age of Abduction
Age distribution of abductees (at time of abduction)Average proportion of population abducted, 1989-2004
Notes: Data include absentee youth and youth who have since died or did not return from abduction (collected from the household survey). Multiple abductions are included. The proportion of the population abducted by age is calculated by dividing the number of youth abducted at each age in each year by the total number of youth in the population of that age in that year, and calculating the running-mean over all years via symmetric nearest-neighbor smoothing (bandwidth = 0.5).
34
Figure 5: Probability of being released in the first month of abduction, by age of abduction
.1.2
.3.4
.5
Pro
babi
lity
of r
ele
ase
5 7 9 11 13 15 17 19 21 23 25 27 29
Age of abduction
Notes: The solid line is a running-mean calculated via symmetric nearest-neighbor smoothing with a bandwidth of one. The dotted lines represent the 95% confidence in-terval. Youth left behind because of injuries are not considered released. Data do not in-clude absentee or non-surviving youth. Multiple abductions enter individually.

35
Figure 6: How do rebel leaders employ abductees of different ages?
a. Average number of months before receiving a firearm, by age of abduction
05
10
15
Mo
nth
s b
efo
re r
ece
ivin
g a
gu
n
5 7 9 11 13 15 17 19 21 23 25 27 29
Age of abduction
b. Probability of being allowed to keep one’s own
firearm, by age of abduction
0.1
.2.3
.4
Allo
we
d t
o k
ee
p o
wn
gu
n
5 7 9 11 13 15 17 19 21 23 25 27 29
Age of abduction
Notes: The solid line is a running-mean calculated via symmetric nearest-neighbor smoothing with a bandwidth of one. The dotted lines represent the 95% confidence in-terval. Data do not include absentee or non-surviving youth.

36
Figure 7: Average length of abduction by age of abduction
01
02
03
04
0
Mo
nth
s A
bd
uct
ed
5 7 9 11 13 15 17 19 21 23 25 27 29
Age of abduction
Notes: The solid line is a running-mean calculated via symmetric nearest-neighbor smoothing with a bandwidth of one. The dotted lines represent the 95% confidence in-terval. Released youth are excluded from the analysis. Data also do not include absentee or non-surviving youth. Multiple abductions enter individually.

37
Figure 8: Forced recruitment and child soldiering
0.2
.4.6
.8
% r
ecr
uite
d un
der
18
0 1Forced recruitment
Notes: Each circle represents a rebel group. Circles were ‘jittered’ by a small random value in order to avoid overlap and display density. The solid line represents predicted values from a linear regression (see Table 7). N=39.
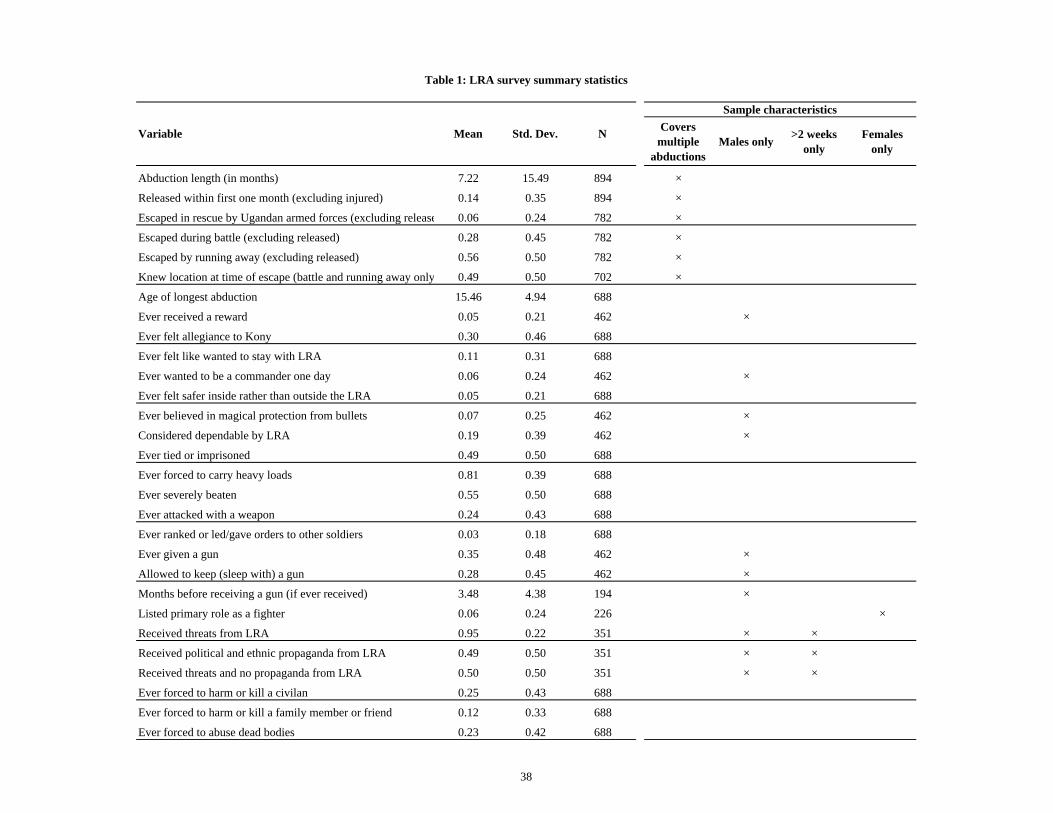
Covers multiple
abductionsMales only
>2 weeks only
Females only
Abduction length (in months) 7.22 15.49 894 ×
Released within first one month (excluding injured) 0.14 0.35 894 ×
Escaped in rescue by Ugandan armed forces (excluding release 0.06 0.24 782 ×
Escaped during battle (excluding released) 0.28 0.45 782 ×
Escaped by running away (excluding released) 0.56 0.50 782 ×
Knew location at time of escape (battle and running away only 0.49 0.50 702 ×
Age of longest abduction 15.46 4.94 688
Ever received a reward 0.05 0.21 462 ×
Ever felt allegiance to Kony 0.30 0.46 688
Ever felt like wanted to stay with LRA 0.11 0.31 688
Ever wanted to be a commander one day 0.06 0.24 462 ×
Ever felt safer inside rather than outside the LRA 0.05 0.21 688
Ever believed in magical protection from bullets 0.07 0.25 462 ×
Considered dependable by LRA 0.19 0.39 462 ×
Ever tied or imprisoned 0.49 0.50 688
Ever forced to carry heavy loads 0.81 0.39 688
Ever severely beaten 0.55 0.50 688
Ever attacked with a weapon 0.24 0.43 688
Ever ranked or led/gave orders to other soldiers 0.03 0.18 688
Ever given a gun 0.35 0.48 462 ×
Allowed to keep (sleep with) a gun 0.28 0.45 462 ×
Months before receiving a gun (if ever received) 3.48 4.38 194 ×
Listed primary role as a fighter 0.06 0.24 226 ×
Received threats from LRA 0.95 0.22 351 × ×
Received political and ethnic propaganda from LRA 0.49 0.50 351 × ×
Received threats and no propaganda from LRA 0.50 0.50 351 × ×
Ever forced to harm or kill a civilan 0.25 0.43 688
Ever forced to harm or kill a family member or friend 0.12 0.33 688
Ever forced to abuse dead bodies 0.23 0.42 688
Sample characteristics
Mean Std. Dev. NVariable
Table 1: LRA survey summary statistics
38

(1) (2) (3) (4) (5) (6)
A. Males
Abduction age 0.005 0.075 0.011 0.031 0.008 0.08[0.004] [0.028]** [0.003]*** [0.012]** [0.002]*** [0.028]***
Abduction age-squared -0.002 -0.001 -0.002[0.001]** [0.000] [0.001]**
Ln (Abduction length) 0.15 0.144 0.055 0.055 0.134 0.133[0.005]*** [0.005]*** [0.007]*** [0.008]*** [0.010]*** [0.010]***
Observations 462 462 462 462 462 462
(7) (8) (9) (10) (11) (12)
B. Females
Abduction age 0.001 0.021 0.001 0.005 0.002 0.048[0.004] [0.029] [0.002] [0.019] [0.005] [0.030]
Abduction age-squared -0.001 0 -0.001[0.001] [0.000] [0.001]
Ln (Abduction length) 0.042 0.041 0.012 0.012 0.124 0.124[0.025] [0.025] [0.017] [0.016] [0.022]*** [0.021]***
226 226 226 226 226 226
Standard errors in brackets* significant at 10%; ** significant at 5%; *** significant at 1%Controls included but not displayed: Location of birth dummies; year of abduction; parent's education, occupation and death; pre-abduction household assetsYouth with missing dependent variable (those abducted less than two weeks) coded as "0"
Table 2: Role within the rebel group, by age of abduction
Listed fighter as a primary role Ever led other soldiers
Ever led other soldiersConsidered someone leaders could
depend on
Was a forced wife
Ever allowed to keep (sleep with) own gun
39
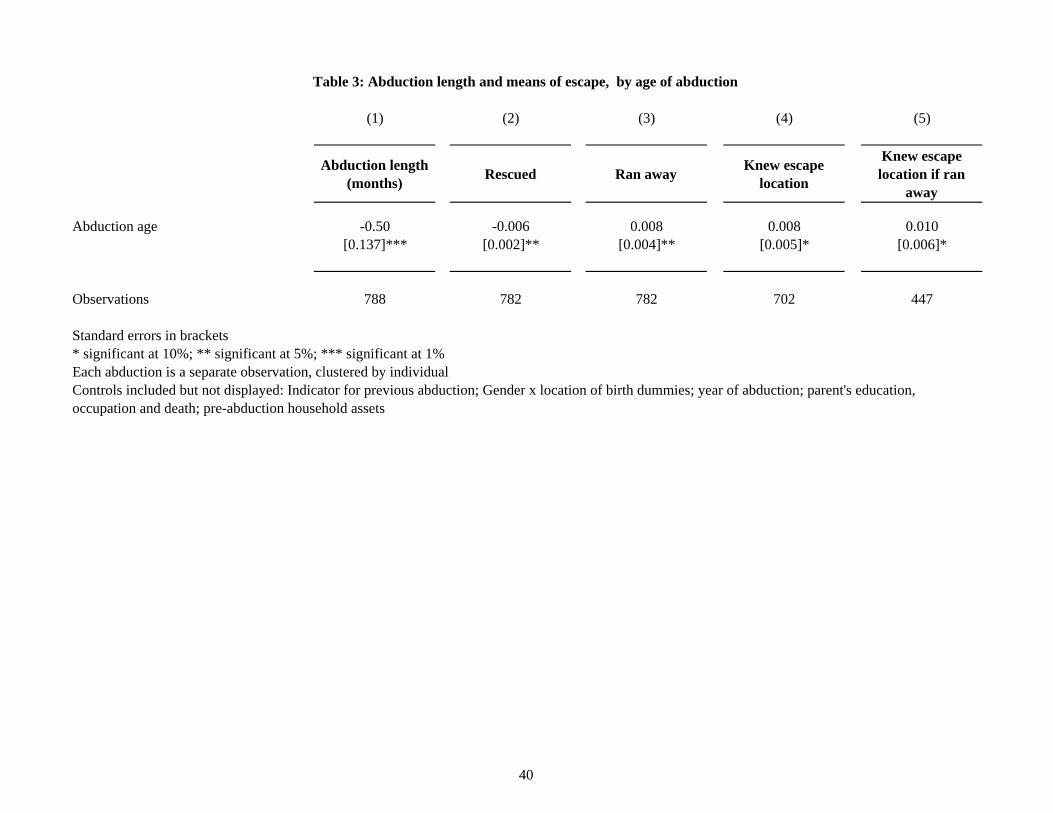
(1) (2) (3) (4) (5)
Abduction length (months)
Rescued Ran awayKnew escape
location
Knew escape location if ran
away
Abduction age -0.50 -0.006 0.008 0.008 0.010[0.137]*** [0.002]** [0.004]** [0.005]* [0.006]*
Observations 788 782 782 702 447
Standard errors in brackets* significant at 10%; ** significant at 5%; *** significant at 1%Each abduction is a separate observation, clustered by individualControls included but not displayed: Indicator for previous abduction; Gender x location of birth dummies; year of abduction; parent's education, occupation and death; pre-abduction household assets
Table 3: Abduction length and means of escape, by age of abduction
40
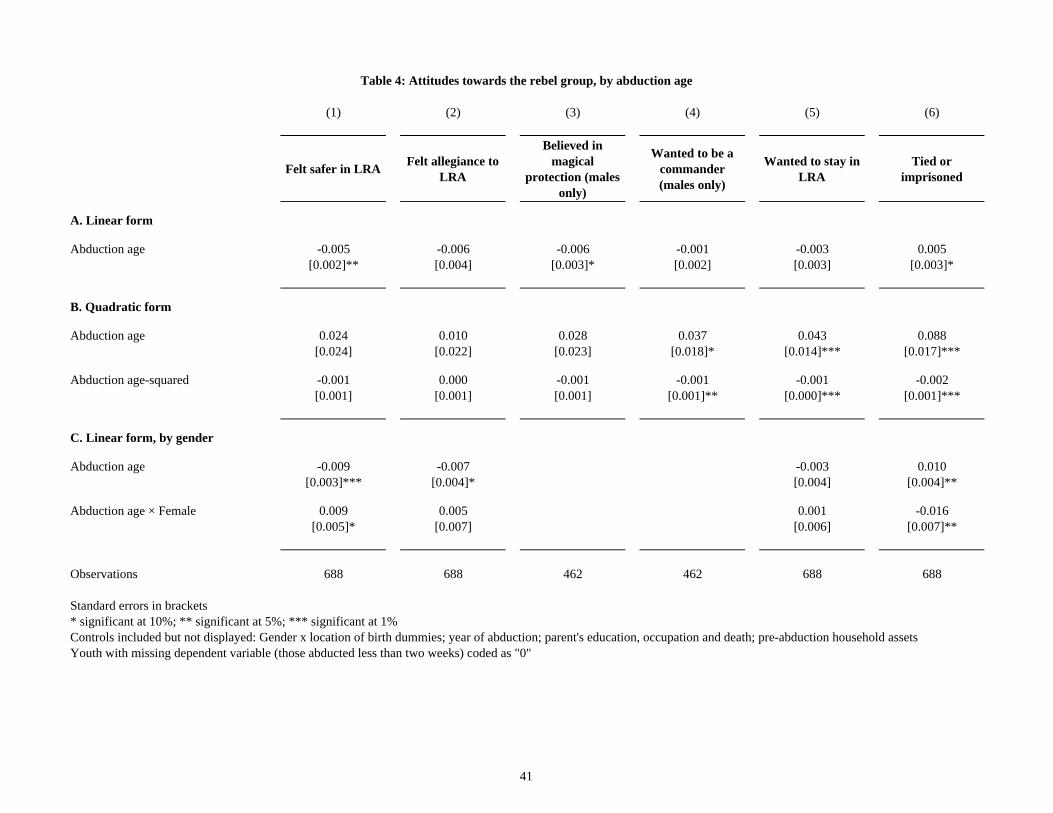
(1) (2) (3) (4) (5) (6)
Felt safer in LRAFelt allegiance to
LRA
Believed in magical
protection (males only)
Wanted to be a commander (males only)
Wanted to stay in LRA
Tied or imprisoned
A. Linear form
Abduction age -0.005 -0.006 -0.006 -0.001 -0.003 0.005[0.002]** [0.004] [0.003]* [0.002] [0.003] [0.003]*
B. Quadratic form
Abduction age 0.024 0.010 0.028 0.037 0.043 0.088[0.024] [0.022] [0.023] [0.018]* [0.014]*** [0.017]***
Abduction age-squared -0.001 0.000 -0.001 -0.001 -0.001 -0.002[0.001] [0.001] [0.001] [0.001]** [0.000]*** [0.001]***
C. Linear form, by gender
Abduction age -0.009 -0.007 -0.003 0.010[0.003]*** [0.004]* [0.004] [0.004]**
Abduction age × Female 0.009 0.005 0.001 -0.016[0.005]* [0.007] [0.006] [0.007]**
Observations 688 688 462 462 688 688
Standard errors in brackets* significant at 10%; ** significant at 5%; *** significant at 1%Controls included but not displayed: Gender x location of birth dummies; year of abduction; parent's education, occupation and death; pre-abduction household assetsYouth with missing dependent variable (those abducted less than two weeks) coded as "0"
Table 4: Attitudes towards the rebel group, by abduction age
41

(1) (2) (3) (4) (5) (6) (7) (8) (9) (10) (11) (12)
Abduction age 0.000 0.004 0.013 0.015 -0.003 -0.006 -0.015 -0.017 -0.008 -0.007 -0.007 -0.003[0.004] [0.003] [0.007]* [0.006]** [0.002] [0.003]** [0.007]* [0.006]** [0.002]*** [0.003]** [0.004]** [0.004]
Log (Abduction length) 0.063 0.043 -0.032 -0.048 0.045 0.067[0.010]*** [0.018]** [0.015]** [0.019]** [0.006]*** [0.007]***
Observations 462 462 351 351 351 351 351 351 688 688 688 688
Standard errors in brackets* significant at 10%; ** significant at 5%; *** significant at 1%Controls included but not displayed: Location of birth; year of abduction; parent's education, occupation and death; pre-abduction household assetsYouth with missing dependent variable (those abducted less than two weeks) coded as "0" unless otherwise noted
Table 5: Incentives received from the rebel group, by age of abduction
Threats no propaganda (males abd >2 weeks only)
Forced to harm family
Forced to abuse dead
Ever rewarded (males only)
Received threats (males abd >2weeks
only)
Received propaganda (males abd >2 weeks only)
42
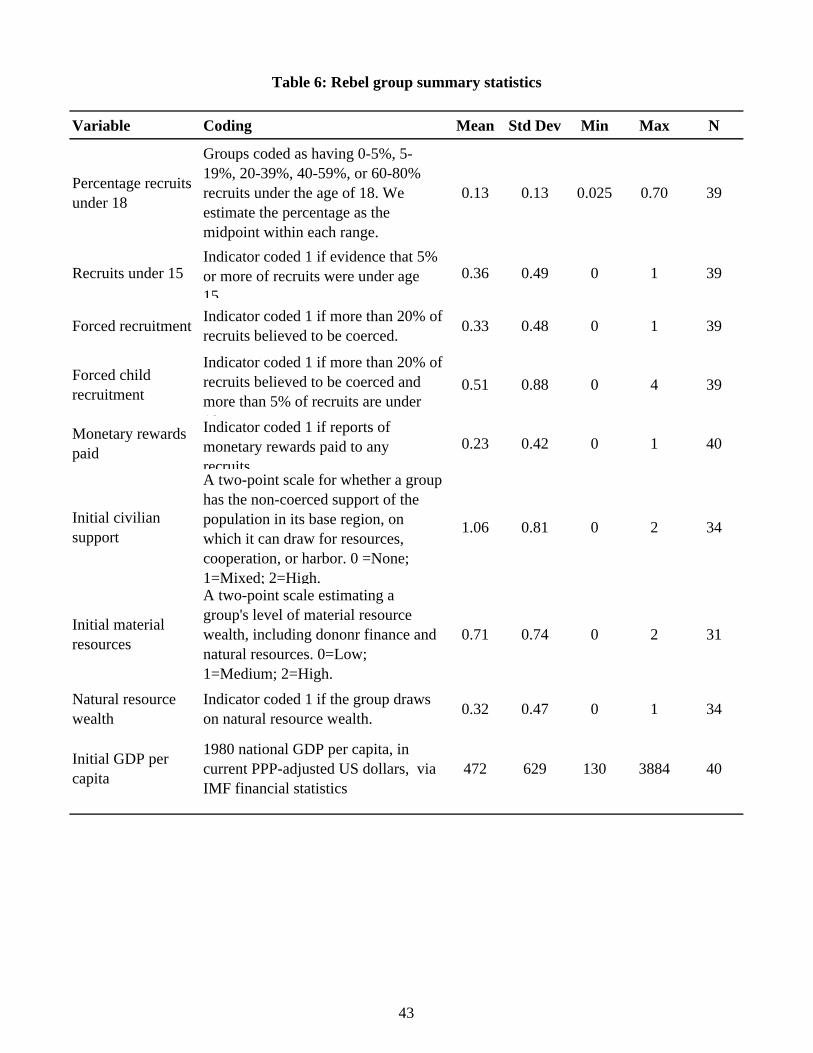
Variable Coding Mean Std Dev Min Max N
Percentage recruits under 18
Groups coded as having 0-5%, 5-19%, 20-39%, 40-59%, or 60-80% recruits under the age of 18. We estimate the percentage as the midpoint within each range.
0.13 0.13 0.025 0.70 39
Recruits under 15Indicator coded 1 if evidence that 5% or more of recruits were under age 15
0.36 0.49 0 1 39
Forced recruitment Indicator coded 1 if more than 20% of recruits believed to be coerced. 0.33 0.48 0 1 39
Forced child recruitment
Indicator coded 1 if more than 20% of recruits believed to be coerced and more than 5% of recruits are under 18
0.51 0.88 0 4 39
Monetary rewards paid
Indicator coded 1 if reports of monetary rewards paid to any recruits
0.23 0.42 0 1 40
Initial civilian support
A two-point scale for whether a group has the non-coerced support of the population in its base region, on which it can draw for resources, cooperation, or harbor. 0 =None; 1=Mixed; 2=High.
1.06 0.81 0 2 34
Initial material resources
A two-point scale estimating a group's level of material resource wealth, including dononr finance and natural resources. 0=Low; 1=Medium; 2=High.
0.71 0.74 0 2 31
Natural resource wealth
Indicator coded 1 if the group draws on natural resource wealth. 0.32 0.47 0 1 34
Initial GDP per capita
1980 national GDP per capita, in current PPP-adjusted US dollars, via IMF financial statistics
472 629 130 3884 40
Table 6: Rebel group summary statistics
43
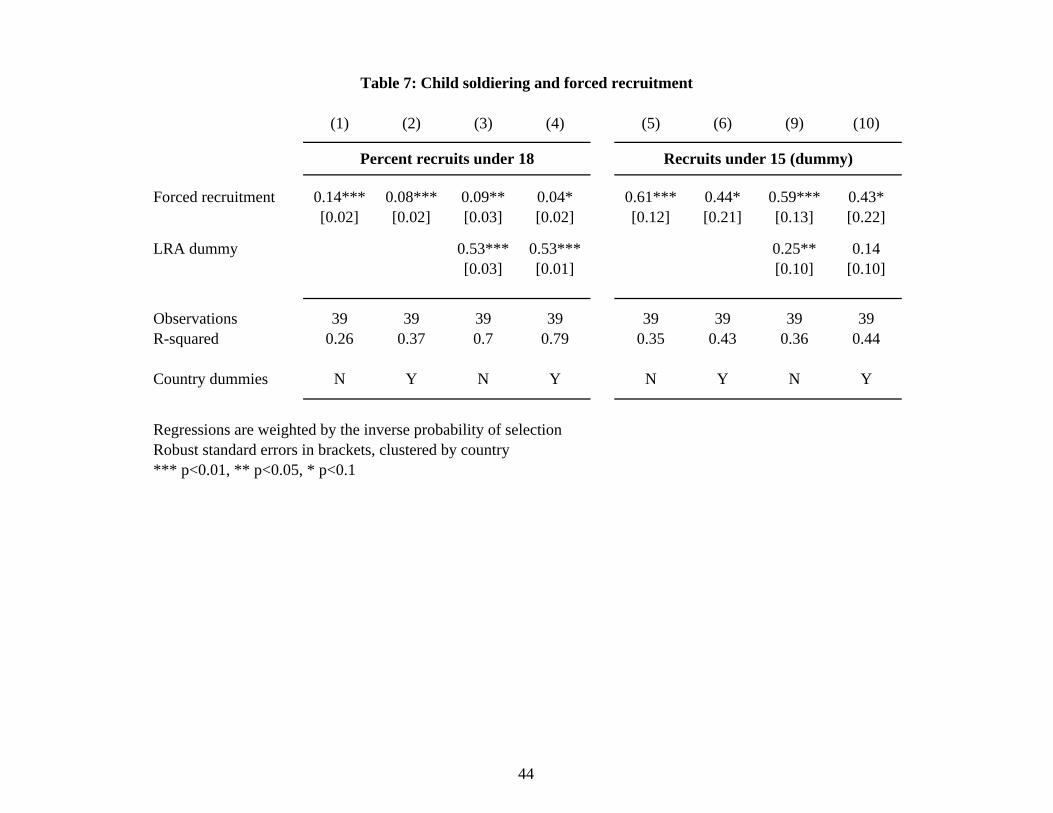
(1) (2) (3) (4) (5) (6) (9) (10)
Forced recruitment 0.14*** 0.08*** 0.09** 0.04* 0.61*** 0.44* 0.59*** 0.43*[0.02] [0.02] [0.03] [0.02] [0.12] [0.21] [0.13] [0.22]
LRA dummy 0.53*** 0.53*** 0.25** 0.14[0.03] [0.01] [0.10] [0.10]
Observations 39 39 39 39 39 39 39 39R-squared 0.26 0.37 0.7 0.79 0.35 0.43 0.36 0.44
Country dummies N Y N Y N Y N Y
Regressions are weighted by the inverse probability of selectionRobust standard errors in brackets, clustered by country*** p<0.01, ** p<0.05, * p<0.1
Percent recruits under 18 Recruits under 15 (dummy)
Table 7: Child soldiering and forced recruitment
44
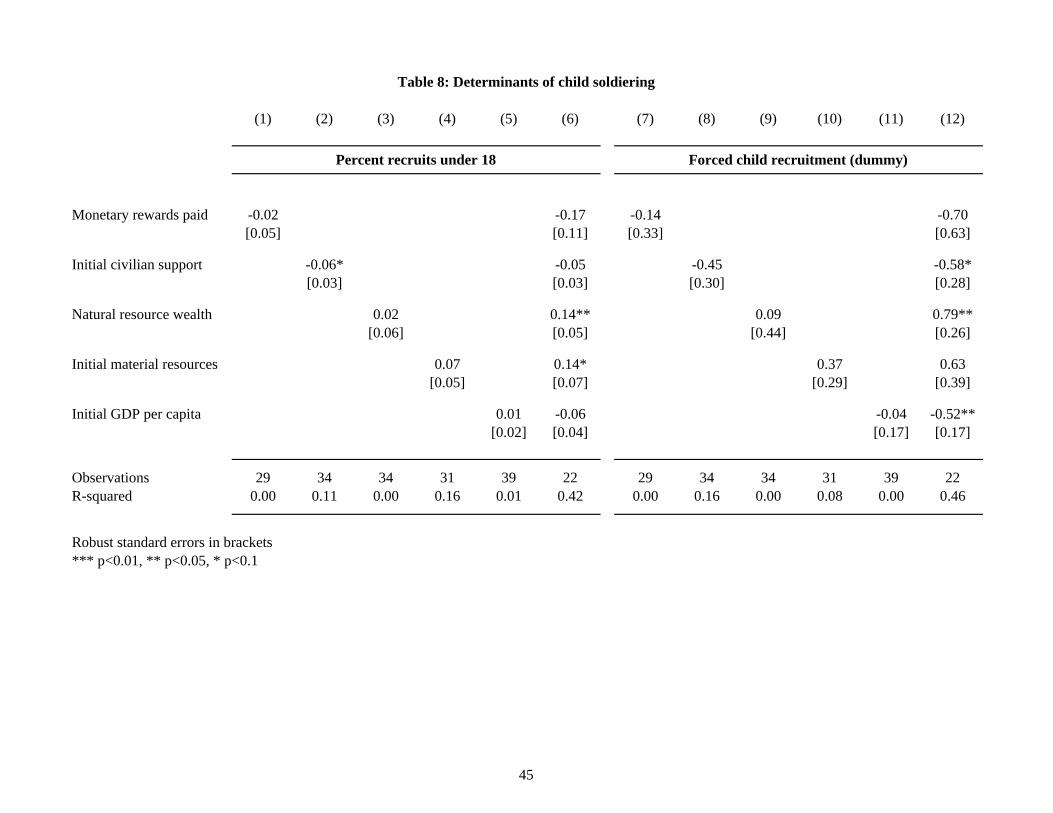
(1) (2) (3) (4) (5) (6) (7) (8) (9) (10) (11) (12)
Monetary rewards paid -0.02 -0.17 -0.14 -0.70[0.05] [0.11] [0.33] [0.63]
Initial civilian support -0.06* -0.05 -0.45 -0.58*[0.03] [0.03] [0.30] [0.28]
Natural resource wealth 0.02 0.14** 0.09 0.79**[0.06] [0.05] [0.44] [0.26]
Initial material resources 0.07 0.14* 0.37 0.63[0.05] [0.07] [0.29] [0.39]
Initial GDP per capita 0.01 -0.06 -0.04 -0.52**[0.02] [0.04] [0.17] [0.17]
Observations 29 34 34 31 39 22 29 34 34 31 39 22R-squared 0.00 0.11 0.00 0.16 0.01 0.42 0.00 0.16 0.00 0.08 0.00 0.46
Robust standard errors in brackets*** p<0.01, ** p<0.05, * p<0.1
Percent recruits under 18 Forced child recruitment (dummy)
Table 8: Determinants of child soldiering
45
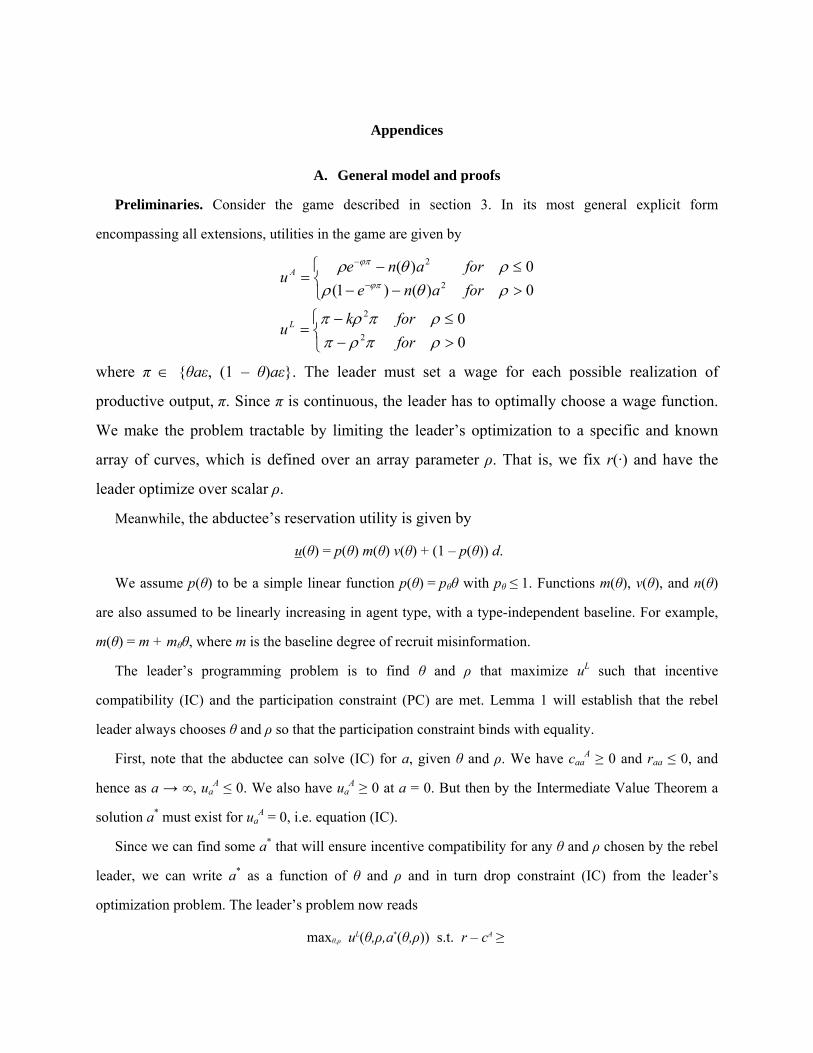
Appendices
A. General model and proofs
Preliminaries. Consider the game described in section 3. In its most general explicit form
encompassing all extensions, utilities in the game are given by
0
0
0)()1(
0)(
2
2
2
2
for
forku
forane
foraneu
L
A
where π {θaε, (1 – θ)aε}. The leader must set a wage for each possible realization of
productive output, π. Since π is continuous, the leader has to optimally choose a wage function.
We make the problem tractable by limiting the leader’s optimization to a specific and known
array of curves, which is defined over an array parameter ρ. That is, we fix r(·) and have the
leader optimize over scalar ρ.
Meanwhile, the abductee’s reservation utility is given by
u(θ) = p(θ) m(θ) v(θ) + (1 – p(θ)) d.
We assume p(θ) to be a simple linear function p(θ) = pθθ with pθ ≤ 1. Functions m(θ), v(θ), and n(θ)
are also assumed to be linearly increasing in agent type, with a type-independent baseline. For example,
m(θ) = m + mθθ, where m is the baseline degree of recruit misinformation.
The leader’s programming problem is to find θ and ρ that maximize uL such that incentive
compatibility (IC) and the participation constraint (PC) are met. Lemma 1 will establish that the rebel
leader always chooses θ and ρ so that the participation constraint binds with equality.
First, note that the abductee can solve (IC) for a, given θ and ρ. We have caaA ≥ 0 and raa ≤ 0, and
hence as a → ∞, uaA ≤ 0. We also have ua
A ≥ 0 at a = 0. But then by the Intermediate Value Theorem a
solution a* must exist for uaA = 0, i.e. equation (IC).
Since we can find some a* that will ensure incentive compatibility for any θ and ρ chosen by the rebel
leader, we can write a* as a function of θ and ρ and in turn drop constraint (IC) from the leader’s
optimization problem. The leader’s problem now reads
maxθ,ρ uL(θ,ρ,a*(θ,ρ)) s.t. r – cA ≥

u,
with Lagrangian
L = π – cL + λ(r – u – cA)
and first-order conditions
Lρ + Laaρ* = 0, and
Lθ + Laaθ* = 0.
Since a* is implicitly defined by uaA = 0, we use the Implicit Function Theorem to compute aρ
* and aθ*.
Taking derivatives, the first-order conditions become
– cρL + λrρ + (πa – caL)
Aaaaa
a
cr
r = 0, and (1)
πθ – cθL + λ(rθ – uθ) + (πa – caL)
Aaaaa
a
cr
r = 0. (2)
where the Lagrange multiplier λ ≥ 0.1
We now show that the participation constraint binds at any solution. The intuition behind the proof is
as follows. Suppose the participation constraint is not active. That means that the leader can choose the
abductee’s skill level without having to worry about picking someone so capable he would leave, and she
will set the agent’s skill level (which enters the leader’s utility through production) so as to equalize
marginal revenue and marginal cost and realize an optimal level of production. Now the leader still has to
optimize the incentive schedule offered to the agent and, by way of these incentives, the agent’s effort
level. So what effort level will the leader aim for? Note that effort only enters the leader’s utility through
production, but production is already optimal by way of the skill level that the leader selected. This means
that any effort level will satisfy the leader, who in turn minimizes costs by offering neither rewards nor
punishment. But without incentives, the abductee provides no effort and no output is generated, which is
not optimal for the leader by assumption and hence a contradiction.
Lemma 1. At any solution of the leader L’s optimization problem with non-zero, cost-inducing
production, the participation constraint binds with equality, i.e. r – cA = u.
1 La is equal to πa – ca
L + λra – λcaA, which simplifies to πa – ca
L because of incentive compatibility.

Proof. Suppose to the contrary that there is some solution at which the participation constraint does
not bind. Then λ = 0, and since caL = cπ
Lπa as well as cθL = cπ
Lπθ, we can factor equation (2) and have
(1 – cπL)
Aaaaa
aa cr
r = 0. (3)
We first show that the second factor of this equation does not vanish. We substitute derivatives of the
explicit functions, set the second factor equal to 0, and solve for | ρ |, which yields
| ρ | =
e
an
a
)(2,
a contradiction, because non-zero and cost-inducing production implies a, n(θ) > 0. Hence, cπL = 1 at
any solution. Equation (3) in turn reduces to – cρL = 0, which implies either ρ = 0, π = 0, or ρ < 0 and k =
0, and therefore cL = 0. But we assumed that production is cost-inducing, a contradiction.
Since the participation constraint binds at any solution, it follows immediately that the extent to which
the abductee’s equilibrium payoff varies with his type can be characterized by how his reservation value
depends on skill level. The fact that reservation utility is a monotonically increasing function of
productivity then implies that the abductee’s equilibrium payoff is monotonically increasing in skill.
Furthermore this implies that there is no type that experiences punishment when a lower type experiences
rewards, and we can hence expect skill level (or, in our conceptualization, age) and incentive type to be
correlated.
Lemma 2. There do not exist θ, θ’ such that θ < θ’ implies ρ*(θ) > 0, ρ*(θ’) < 0.
Proof. Suppose such θ and θ’ exist. Then reward ρ*(θ) implies that type θ receives uA*(θ) = ρ(1 – e–φπ)
– n(θ)a2, which is non-negative since A can set a = 0 to receive his maximin payoff of 0. Punishment
ρ*(θ’) implies that type θ’ receives uA*(θ’) = ρe–φπ – n(θ)a2, which is negative, and so uA*(θ) > uA*(θ’). But
since uθ ≥ 0, θ < θ’ implies u(θ) < u(θ’), so that by Lemma 1 uA*(θ) < uA*(θ’), a contradiction.
We now turn to the optimal incentive type selected by the leader.
Proposition 1. If k = 1, φ = 1, n(θ) = 1, m(θ) = 1, π = θaε, and v is a constant, then ρ* > 0 is weakly
dominant for non-zero output.
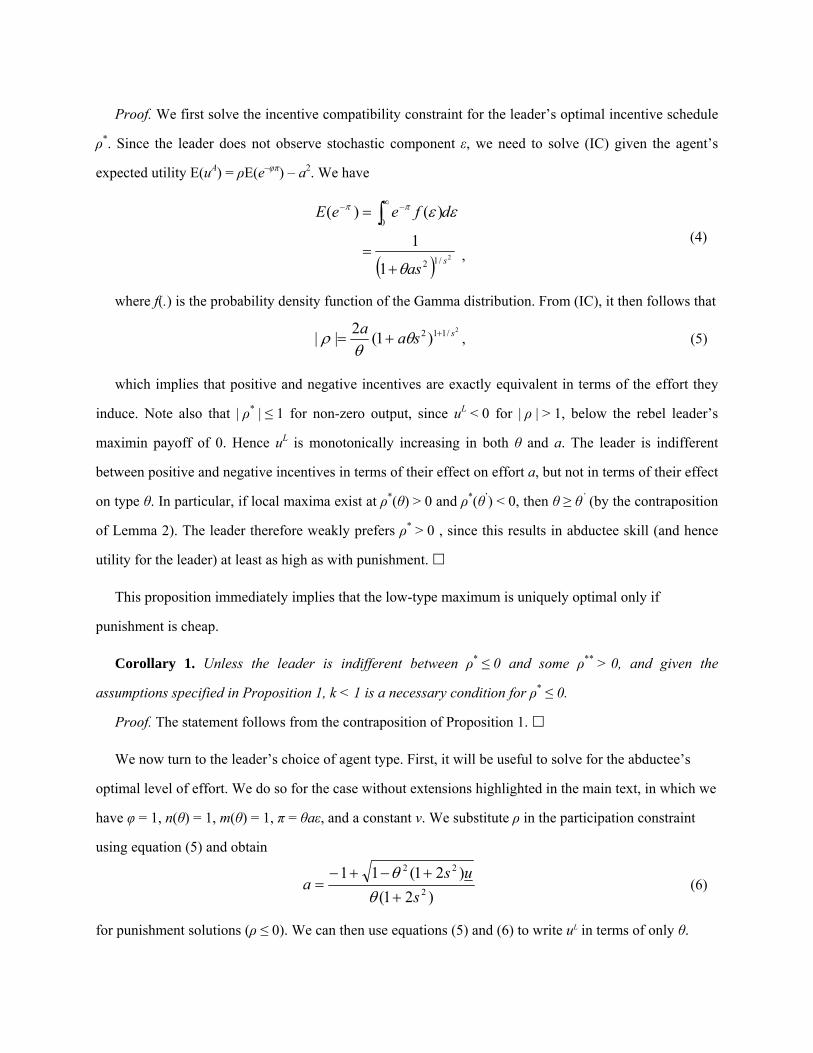
Proof. We first solve the incentive compatibility constraint for the leader’s optimal incentive schedule
ρ*. Since the leader does not observe stochastic component ε, we need to solve (IC) given the agent’s
expected utility E(uA) = ρE(e–φπ) – a2. We have
2/12
0
1
1
)()(
sas
dfeeE
, (4)
where f(.) is the probability density function of the Gamma distribution. From (IC), it then follows that
2/112 )1(2
|| ssaa
, (5)
which implies that positive and negative incentives are exactly equivalent in terms of the effort they
induce. Note also that | ρ* | ≤ 1 for non-zero output, since uL < 0 for | ρ | > 1, below the rebel leader’s
maximin payoff of 0. Hence uL is monotonically increasing in both θ and a. The leader is indifferent
between positive and negative incentives in terms of their effect on effort a, but not in terms of their effect
on type θ. In particular, if local maxima exist at ρ*(θ) > 0 and ρ*(θ’) < 0, then θ ≥ θ’ (by the contraposition
of Lemma 2). The leader therefore weakly prefers ρ* > 0 , since this results in abductee skill (and hence
utility for the leader) at least as high as with punishment.
This proposition immediately implies that the low-type maximum is uniquely optimal only if
punishment is cheap.
Corollary 1. Unless the leader is indifferent between ρ* ≤ 0 and some ρ** > 0, and given the
assumptions specified in Proposition 1, k < 1 is a necessary condition for ρ* ≤ 0.
Proof. The statement follows from the contraposition of Proposition 1.
We now turn to the leader’s choice of agent type. First, it will be useful to solve for the abductee’s
optimal level of effort. We do so for the case without extensions highlighted in the main text, in which we
have φ = 1, n(θ) = 1, m(θ) = 1, π = θaε, and a constant v. We substitute ρ in the participation constraint
using equation (5) and obtain
)21(
)21(112
22
s
usa
(6)
for punishment solutions (ρ ≤ 0). We can then use equations (5) and (6) to write uL in terms of only θ.

For reward solutions (ρ>0), we cannot solve the participation constraint algebraically for a, but can
implicitly define effort in terms of θ, which yields
0)1()1(2 22/112 2
uasasaa s
(7)
The following proposition states that agent type will either decrease or remain unchanged as
punishment becomes cheap.
Proposition 2. If φ = 1, n(θ) = 1, m(θ) = 1, π = θaε, and v is a constant, then θ* is non-decreasing in
k.
Proof. There are three parts to this proof. First, consider ρ* > 0. Since uL is not a function of k, θ* does
not vary with and is hence not decreasing in k. Second, consider ρ* ≤ 0. By the implicit function rule, we
have
*2
2
2*
L
L
uk
u
k.
Since uL is concave in θ (and reaches a maximum at θ*), the denominator is negative. For the
enumerator, we have
aaa
k
ka
k
u L
2)(1)( 22
222
.
where a and ρ are defined in equations (5) and (6). The sign of this expression hinges on the sign of
a + θaθ, which is negative when evaluated at θ*. Hence the cross-partial derivative is negative, and so
∂θ*/∂k ≥ 0 holds.
Third, consider the case in which a change in k leads to a change in the sign of ρ*. We need to show
that an increase in k never shifts ρ* from a positive to a negative value (and, equivalently, that a decrease
in k does not shift ρ* from a negative to a positive value), because this will imply by the contraposition of
Lemma 2 that an increase in k never leads to a decrease in θ as a result of a change in the sign of ρ. Note
that ∂uL/∂k = 0 for ρ > 0 and ∂uL/∂k ≤ 0 for ρ ≤ 0, so any increase in k decreases maxθ uL | ρ ≤ 0 relative to
maxθ uL | ρ > 0. But this means that if uL was globally maximized at ρ > 0 prior to the increase in k, it must
remain the global maximum thereafter, which is what needed to be shown.

The leader’s target type in recruitment is decreasing in the extent to which escape probabilities are
sensitive to θ, as the following proposition states.
Proposition 3. If φ = 1, n(θ) = 1, m(θ) = 1, π = θaε, and v is a constant, then θ* is decreasing in pθ.
Proof. This proof has two parts. First, we show that ∂θ*/∂pθ < 0 in cases where a change in pθ does not
entail a change in the sign of ρ*. Second, we consider the case where it does.
First, consider a solution (θ*, ρ*, a*) to the rebel leader’s problem given some pθ, where θ* | ρ, a solves
participation constraint (PC), a* | θ, ρ solves incentive compatibility constraint (IC), and ρ* | θ, a
maximizes the leader’s utility uL. Now suppose pθ increases to p’θ. Then given our specifications for
reservation value u and p(θ), we have u | p’θ > u | pθ for any particular θ, which means the participation
constraint is no longer met. (Note that a change in pθ directly affects u, but not uA.) In order to again meet
(PC), now given p’θ, the leader must adjust θ*, i.e. ∂θ*/∂pθ ≠ 0.
We further need to show that θ* must be adjusted downward in order to meet the participation
constraint. Since uA is concave and u is linear in θ (and both are increasing), if ∂u/∂θ > ∂uA/∂θ at θ* (i.e. uA
intersects with u from above), an upward adjustment of θ* cannot result in condition (PC) being met.
Again because uA is concave, u is linear, and both are monotonically increasing, we can show that
∂u/∂θ > ∂uA/∂θ |θ* by noting that uA(0) ≤ u(0). At θ = 0, costly effort does not induce production, so the
agent has no incentive to contribute and sets a = 0. Hence, uA(0) = 0 for ρ > 0 and uA(0) = ρ for ρ ≤ 0. The
smallest value for ρ that is not (weakly) dominated for the leader is – 1, but u(0) = d < – 1, and so uA must
indeed intersect with u from above, θ* must move downward to meet u | p’θ, and ∂θ*/∂pθ < 0.
Second, we consider the case where a change in pθ switches the sign of ρ. As shown above, an increase
from pθ to p’θ decreases the value of θ*, which implies a corresponding decrease in u(θ*). This will allow
the leader to inflict more severe punishment and hence induce greater effort if ρ ≤ 0, but it will reduce
rewards offered and hence the agent’s effort if ρ > 0. Correspondingly, ∂uL/∂pθ |ρ ≤ 0 > ∂uL/∂pθ |ρ > 0 , but
this implies that an increase in pθ will make a local maximum for ρ ≤ 0 relatively more attractive
compared to a local maximum for ρ > 0 and can therefore only change a positive ρ* to a negative one. By
the contraposition of Lemma 2, this implies that ∂θ*/∂pθ < 0 in this case. The reasoning for a decrease of
pθ to p’θ, which completes the proof, proceeds equivalently.

The leader’s target type similarly declines in the degree to which her ability to misled the recruit varies
with θ. Even though pθ and mθ enter the recruit’s reservation utility slightly differently, u is strictly
increasing in both, and so the following proposition follows directly from the proof of the previous
proposition.
Proposition 4. If φ = 1, n(θ) = 1, π = θaε, and pθ and v are constants, then θ* is decreasing in mθ.
Proof. The proof proceeds identically to the proof of Proposition 3, with mθ replacing pθ as the object
of interest.
Finally, we show that the optimal θ is decreasing in the extent to which the rebel leader’s ability to
indoctrinate the recruit varies with the recruit’s age. The proof of this proposition is again similar to the
preceding proofs.
Proposition 5. If φ = 1, m(θ) = 1, π = θaε, and pθ and v are constant, θ* is decreasing in nθ.
Proof. Consider a solution (θ*, ρ*, a*) to the rebel leader’s problem as in the preceding proofs, where θ*
| ρ, a solves the participation constraint, a* | θ, ρ solves the incentive compatibility constraint, and ρ* | θ, a
maximizes the leader’s utility, conditional on nθ. Suppose nθ increases to n’θ. We then have uA | n’
θ < uA |
nθ for all θ, which means constraint (PC) is no longer met. (A change in nθ directly affects uA, not u.) This
implies that θ* must change, so ∂θ*/∂pθ ≠ 0.
We show further that θ* must decrease in order for (PC) to be met. Note that uA(0) ≤ u(0), as shown in
the proof of Proposition 3, which implies that uA must intersect with u from above. But then θ* | n’θ < θ* |
nθ in order for (unchanged) function u to return a value at which it intersects with uA. The proof for a
decrease of nθ to n’θ proceeds similarly, and so ∂θ*/∂nθ < 0 when the sign of ρ does not change as a result
of a change in nθ.
Finally, we need to consider the case when the sign of ρ does switch as a result of a change in nθ,
which follows by the same logic as the corresponding result in the proof of Proposition 3.

B. African cross-rebel data
This appendix describes sources and the method of constructing the African cross-rebel data used in
Section 4 of the paper. As noted in the paper, we chose to gather data on a random subset of rebel groups
in order to maximize data depth and quality. We focus on African groups alone in order to limit the scope
of the data gathering exercise and maximize generalizabilty within a region.
Sampling
i. Sample Frame
In order to assess patterns in guerilla recruitment and organization, we would like to start from a full
and accurate listing of guerrilla groups. We selected a sample frame that derives from the Uppsala
Conflict Data Program (UCDP) Dyadic Dataset v.1-2009, 1946-2008, produced by the Department of
Peace and Conflict Research at Uppsala University (Harbom et al. 2008). The UCDP Dyadic Dataset
disaggregates the UCDP/PRIO Armed Conflict Dataset and focuses on dyads within each conflict, thus
the unit of analysis is the dyad-year. UCDP defines armed conflict as: “a contested incompatibility that
concerns government and/or territory where the use of armed force between two parties, of which at least
one is the government of a state, results in at least 25 battle-related deaths in a year” (Harbom 2009). The
dataset focuses on conflict dyads for the period 1946-2008, and includes 487 dyads in 236 conflicts
(Harbom et al. 2008). This dataset was chosen primarily because the dyadic conflict data allow for the
analysis of group level phenomena and for its low threshold, which allows for the inclusion of a wide
range of rebel groups.
From this dataset, the sample frame was composed of all the conflicts in mainland sub-Saharan Africa
from 1980-2008, as defined by the location and year fields in the UCDP Dyadic Dataset. In addition,
interstate conflicts were excluded, as defined by the type field in the dataset. For an opposition group to
be included in the UCDP Dyadic Dataset, it needed to satisfy the following definition: “Any non-
governmental group of people having announced a name for their group and using armed force to
influence the outcome of the stated incompatibility. The UCDP only deals with formally organized
opposition. The focus is on armed conflict involving consciously conducted and planned political
campaigns rather than spontaneous violence” (Harbom 2009).

This selection process resulted in a set of 42 conflicts in 31 countries (See Appendix Table 1), for a
total of 124 groups.
Appendix Table 1: Sample Frame Country # Conflicts #Groups
Angola 2 3 Burkina Faso 1 1 Burundi 1 5 Cameroon 1 1 Central African Republic 1 4 Chad 1 19 Congo 1 4 Cote d'Ivoire 1 4 Djibouti 1 1 Democratic Republic of Congo 2 6 Eritrea 1 1 Ethiopia 6 12 Gambia 1 1 Ghana 1 2 Guinea 1 1 Guinea-Bissau 1 1 Kenya 1 1 Lesotho 1 1 Liberia 1 5 Mali 1 3 Mozambique 1 1 Niger 3 6 Nigeria 2 2 Rwanda 1 2 Senegal 1 1 Sierra Leone 1 4 Somalia 1 9 South Africa 2 2 Sudan 1 7 Togo 1 2 Uganda 1 12
ii. Sample Selection
Rebel groups were randomly selected at the conflict level. First, countries were sorted into strata based
on the number of conflicts per country. This resulted in three strata: 1) countries with one conflict; 2)
countries with two to three conflicts; and 3) countries with more than three conflicts. Within a stratum,
each conflict is a separate observation, allowing for multiple observations per country. Countries within

each stratum were randomized by assigning a random, uniformly distributed variable in Microsoft Excel
and sort this variable from lowest to highest value within each stratum. In each stratum we targeted
approximately one third of all conflicts: In stratum 1, eight conflicts were chosen from a total of 25; in
stratum 2, four conflicts were chosen from a total of 11; in stratum 3, two conflicts were chosen from a
total of 6 in stratum 3. For each conflict selected, all rebel groups involved were included in the dataset,
resulting in a total of 43 rebel groups.
iii. Excluded and Missing Data
From the sample of 43 rebel groups, we excluded two groups on the basis of being single incident
military coups rather than guerilla groups launching insurgencies. These included the National
Revolutionary Council in Gambia and the Popular Front in Burkina Faso.
Where information is unavailable we code the data as missing. In some instances, information is
incomplete or inconclusive but we have a strong indication of the value based on the conflict context,
other clues indicated in the research narrative, or expert testimony in which the expert has strong but not
easily corroborated opinions. In such instances, we code the variable based on the best available evidence
and mark our assumption with a positive value in the binary keyvarassumption variable (allowing us to
test the robustness of any conclusions to exclusion of inferred rather than corroborated data). We reserve
the use of these assumptions for only our key variables. For more information, see section E below, and
specifically, the keyvarassumption variable.
Appendix Table 2: Selected Rebel Groups
Country Rebel Group Exclusion Notes Burkina Faso Popular Front Single Incident Coup Cote d'Ivoire Mouvement Patriotique de la
Côte d’Ivoire (MPCI)
Mouvement pour la Justice et la Paix (MJP)
Mouvement Populaire Ivoirien du Grand Ouest (MPIGO)
Forces Nouvelles (FN) Democratic Republic of the Congo
Rassemblement Congolais pour la Démocratie (RCD)
Rassemblement Congolais pour la Démocratie-Mouvement de Libération
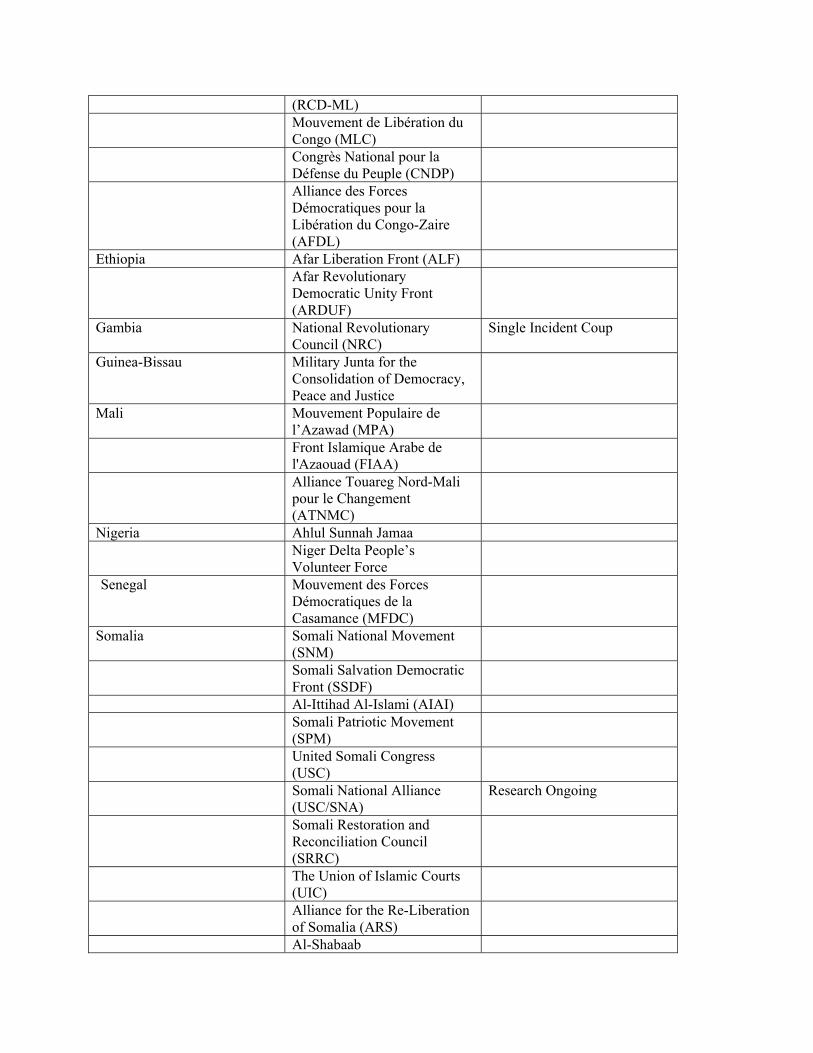
(RCD-ML) Mouvement de Libération du
Congo (MLC)
Congrès National pour la Défense du Peuple (CNDP)
Alliance des Forces Démocratiques pour la Libération du Congo-Zaire (AFDL)
Ethiopia Afar Liberation Front (ALF) Afar Revolutionary
Democratic Unity Front (ARDUF)
Gambia National Revolutionary Council (NRC)
Single Incident Coup
Guinea-Bissau Military Junta for the Consolidation of Democracy, Peace and Justice
Mali Mouvement Populaire de l’Azawad (MPA)
Front Islamique Arabe de l'Azaouad (FIAA)
Alliance Touareg Nord-Mali pour le Changement (ATNMC)
Nigeria Ahlul Sunnah Jamaa Niger Delta People’s
Volunteer Force
Senegal Mouvement des Forces Démocratiques de la Casamance (MFDC)
Somalia Somali National Movement (SNM)
Somali Salvation Democratic Front (SSDF)
Al-Ittihad Al-Islami (AIAI) Somali Patriotic Movement
(SPM)
United Somali Congress (USC)
Somali National Alliance (USC/SNA)
Research Ongoing
Somali Restoration and Reconciliation Council (SRRC)
The Union of Islamic Courts (UIC)
Alliance for the Re-Liberation of Somalia (ARS)
Al-Shabaab

Harakat Ras Kamboni South Africa South West Africa People's
Organization (SWAPO)
Uganda Uganda National Rescue Front (UNRF)
Uganda Freedom Movement (UFM)
Nation Resistance Army (NRA)
Former Uganda National Army (FUNA)
Uganda People’s Democratic Army (UPDA)
Holy Spirit Mobile Forces (HSMF)
Uganda People’s Army (UPA) Lord’s Resistance Army
(LRA)
West Nile Bank Front (WNBF)
Uganda National Rescue Front II (UNRF II)
Allied Democratic Forces (ADF)
Data gathering method and sources
A group of six Yale students was charged with conducting research on each of the selected rebel
groups under the direction of the authors. The student researchers included four graduate students
(African Studies; International Relations; French) and two undergraduate students (Political Science),
with students who had French and Portuguese language skills assigned to relevant groups. The
researchers worked for a total of eight weeks to collect information on rebel groups and were monitored
at weekly meetings to assess progress. The researchers were given guidelines on information to collect,
with the goal of constructing comprehensive ‘narratives’ of the rebel groups. Narratives were constructed
in the following broad organizational structure: 1. Overview of group history and activities; 2. General
group recruitment patterns; 3. Child recruitment; 4. Group resources; 5. Remuneration of group members.
Researchers developed these narratives for each rebel group through academic literature and news
archive searches. Sources consulted included news reports, advocacy literature and academic literature.
All sources used are cited in the narratives. Major sources are as follows: Advocacy groups:

Amnesty International Coalition to Stop the Use of Child Soldiers Human Rights Watch International Crisis Group Small Arms Survey Think tanks: Chatham House Council on Foreign Relations Institute for Security Studies Government/UN: United Nations United States Department of State Academic Literature: African Affairs Africa Confidential African Studies Quarterly Africa South of the Sahara News Sources: Associated Press BBC
As a secondary source of information, experts identified by each student researcher were contacted for
each group to verify and to expand on the narrative based on the literature review. Experts were contacted
first by e-mail and subsequently by telephone and asked to provide information specifically regarding
group recruitment, use of children, and resources, as well as to confirm the student researcher findings.
In order to encourage expansion and improvement of this database, all narratives are publicly
available, and can be obtained by contacting the authors.
Variable Coding
The student-produced narratives were reviewed by a supervisor for quality and consistency, and were
used by the supervisor and an assistant to code for the following variables (listed using two names, the
official variable name and the variable name in the accompanying Stata dataset): groupname
Rebel group name country
Rebel group country of operation

yearfounded
Yearfounded is defined as the year in which a group’s leadership or organizational structure was
formed, as indicated by each group narrative. Because there is no minimum requirement of insurgent or
battle-related activity, these dates should be treated as approximate and not always indicative of
immediate group activity. In some cases, such as the UIC of Somalia, a group may have formed its
organizational and leadership structure only to sit inactive for a period of time before engaging in
insurgency. In other cases, such as the SWAPO in South Africa, a group may form its organizational
structure, engage in an immediate and sustained period of resource mobilization, and follow this with
battle engagement2. In still other cases, such as the FIAA in Mali¸ we observe groups that form in
response to an acute event and immediately engage in armed rebellion. Finally, we observe groups that
have been born from previous rebel groups as, for example, a result of a split in leadership. One such
example is the RCD-ML in the DRC. In these cases, we define the year founded as the year in which the
former group’s leadership split and the new group’s leadership structure was formed. In all cases, the year
founded is defined as closely as possible to the year in which the group’s organizational or leadership
structure was formed. yeardefunct
Yeardefunct is defined as the year in which a group’s violent activities stop and its leadership structure
dismantled. This includes groups that have transformed from a rebel group into a political party. One
example of this is the CNDP in the DRC. Some of the groups have clear, definitive years in which they
disbanded became defunct. For others, a definitive end date is less clear. For instance, the Ahlul Sunnah
Jamaa insurgent group in Nigeria largely disbanded in 2004, yet remnant factions within the group remain
sporadically active. As such, these dates should be treated as approximate. yearsactive
Total number of years from yearfounded to yeardefunct sustainactiv2yr
2 We reference specific examples from our research narratives to elucidate coding decisions. For a copy of these
narratives, please contact authors.

This variable measures whether a group engaged in sustained and active insurgency for at least a two-
year period of time. Due in large part to the limits of available information, we avoid a quantitative
definition of “sustained and active” (e.g. a minimum number of battle deaths/month) and instead adopt an
interpretative approach based on each narrative. We therefore consider a group’s insurgent activity to be
“sustained and active” if the research narrative indicates that the group was involved in battles or battle-
related activities, such as recruitment, arms build-up, or resource procurement, for a period of at least two
consecutive years during the course of its existence. Sustainactiv2yr is coded in two categories:
0- Rebel group did not maintain sustained and active insurgency for at least 24 successive months.
1- Rebel group maintained active and sustained insurgency for at least 24 successive months sustainactiv1yr
This variable measures whether a group engaged in sustained and active insurgency for at least a one-
year period of time. Due in large part to the limits of available information, we avoid a quantitative
definition of “sustained and active” (e.g. a minimum number of battle deaths/month) and instead adopt an
interpretative approach based on each narrative. We therefore consider a group’s insurgent activity to be
“sustained and active” if the research narrative indicates the group to have been actively involved in
battles or battle-related activities, such as recruitment, arms build-up, or resource procurement, for at least
a period of one consecutive year during the course of its existence. Sustainactiv1yr is coded in two
categories:
1- Rebel group maintained active and sustained insurgency for at least 12 successive months
0- Rebel group did not maintain active and sustained insurgency for at least 12 months in succession maxgroupsize
Best estimation of a group’s maximum size during the course of its existence. recruitment [Forced Recruitment]
This variable measures how the rebel group recruited soldiers. Recruitment is defined as “forced” if
there is evidence the group used the threat of violence or overt coercion to induce individuals to join
force. Our classification aims to be tantamount to abduction. Accurate figures on the proportion of
recruits forced versus non-forced are unavailable for most groups, and we therefore use our narratives to
make an interpretive judgment of the extent to which a group strategically used forced recruitment as a
recruitment strategy. Keen to capture only cases in which forced recruitment was used systematically and

strategically, and cognizant of cases in which isolated instances are not representative of a larger trend,
we set the minimum threshold for “mixed” recruitment sufficiently high at 20% so as to capture only the
strategic and systemic use of forced recruitment. Recruitment is coded in three categories:
0- mostly voluntary, defined as less than 20% of recruits forcibly recruited
1- mixed, defined as more than 20% of recruits and less than 80% forcibly recruited
2- mostly forced, defined as more than 80% of recruits forcibly recruited intensity
This variable is an intense conflict dummy. Here, we use the PRIO-UCDP definition of intensity and
use our research narratives to estimate each group’s classification. Intensity is coded in two categories:
0- low intensity, defined as no more than 999 battle-related deaths in a given year, for any year of a
groups existence.
1- high intensity, defined as more than 1000 battle-related deaths in a given year, for any year of the
groups existence childsoldier [Percentage recruits under 18]
This variable measures the proportion of rebels that are believed to be under the age of 18. Accurate
figures on the proportion of rebel forces that are under the age of 18 are unavailable for most groups. We
therefore classify degrees of child soldiering broadly in five categories and use our research narratives to
make an interpretive judgment of which broad category best captures the degree of a group’s strategic use
of child soldiering. Reasoning that small numbers of troops under the age of 18 are likely to exist in most
armed forces, we set a 5% minimum proportion threshold to classify a group as using child soldiers.
We err on the side of caution in our estimates of child soldier proportions. Where detailed or specific
information is largely unavailable but newspaper, academic research, NGO, or testimonial reports
indicate the use of child soldiering, we code as 5-19%, even though in some cases this may be an
underestimation. To be categorized as 20% or above, we require evidence that explicitly or strongly
indicates a proportion of child soldiering greater than 19%. One such example of evidence strongly
indicating a proportion of child soldier greater than 20% would be the Amnesty International and
UNHCR reports of large-scale child-soldier involvement in the MLC of the DRC. Childsoldier is coded
in five categories:
0- less than 5%

1- 5-19%
2- 20-39%
3- 40-59%
4- 60-80% childsoldieryoung [Recruits under 15]
This variable measures the proportion of rebels that are under the age of 15. Accurate figures on the
proportion of rebel forces that are under the age of 15 are unavailable for most groups. We therefore
classify the degree of child soldiering broadly as a binary variable and use our research narratives to make
an interpretive judgment of whether the group strategically used young child soldiers amounting to
greater than 5% of recruits. Childsoldieryoung is coded in two categories:
0- Less than 5% of recruits are under the age of 15
1- More than 5% of recruits are under the age of 15 keyvarassumption
In some instances, conclusive information on or key variables childsoldier, childsoldieryoung,
broadsupport, and recruitment proved unavailable, and yet the research narrative or environment in
which the rebel group operated yielded strong clues as to the most likely values for these variables. For
example, we code child soldiers in the SRRC of Somalia as constituting 5-19% of SRRC recruits based
on a UN Security Council report’s oblique mention of the SRRC’s use of child soldiering and knowledge
of child soldiering’s widespread use among like-groups in SRRC’s region. In such circumstances where
assumptions are made, we note it in this variable. Keyvarssumption is coded in two categories:
0- No assumptions made to compensate for incomplete information in coding
childsoldier,childsoldieryoung, broadsupport, or recruitment variables.
1- Assumptions made to compensate for incomplete information in coding childsoldier,
childsoldieryoung, broadsupport, or recruitment variables. remuneration [Monetary rewards paid]
This variable measures how the rebel group remunerated soldiers. We code the variable in three broad
categories of remuneration in addition to none and other: wages, arms, and unrealized promises of future
payment. To some extent, all or many rebels may be motivated by the promise of future riches upon a
group’s victory. To avoid this broad and all-capturing classification, we require explicit, unrealized

promises of future payment made to rank-and-file rebels to code as “promise of future payments.” One
such example is the WNBF in Uganda, which promised $300 upon joining ranks yet never fulfilled these
promises. Pillage of the countryside, another spoil of insurgency, is also excluded from our
classifications, though in some instances it may have been a powerful motivator for troop involvement.
We also make the assumption that rebel soldiers receive basic life provisions from the group, such as food
and shelter, and therefore code these as "none". Remuneration is coded in 5 categories:
1- monetary wages
2- arms—when explicit reports of arms serving as payment
3- promise of future payment (un-realized)
4- none
5- other broadsupport [Degree of initial civilian support]
This variable measures whether the group had the (non-coerced) support of the population in its base
region within home country on which it could draw for resources, cooperation, or harbor. This subjective
categorization of a group’s support is based on the research narrative and aims to give a general measure
of the group's standing among the population. A group may be considered to have broad support if it
receives significant funds or in-kind assistance from local communities as in the case of the MFDC in
Senegal, or if it had consistent voluntary recruitment due to widespread support of the group's goal, as in
the case of SWAPO in South Africa. On the other hand, if a group relies on forced recruitment and there
is some indication that communities in its base region are unsupportive of the group's activities, as in the
case of the AFDL in the DRC, we consider the group lacking in broad support. Some cases demonstrate a
combination of these circumstances, or experience a shift in support over time, such as with WHO, and
therefore are coded as having "mixed" broad support. Broadsupport is coded in three categories:
2=Yes
1=Mixed
0=No resourcetype [Natural resource wealth]
This variable measures the group's resources by type and aims to measure the primary sources of each
group's financial and material resources, as can be interpreted from the narrative. Importantly, this coding

captures categories but not magnitudes. For example, the HRK of Somalia has private wealth foreign,
foreign government, and local community resources, but we make no attempt to code the relative
magnitude of these resources. Based on evidence from the research narratives we code resourcetype in
seven broad categories:
1- natural resources
2- foreign governments
3- local community
4- seizure/looting coercive taxation
5- private wealth domestic
6- private wealth foreign
7- smuggling-not natural resource resourceamt [Initial material resources]
This variable measures the group’s resources by amount. This subjective categorization of a group’s
resource endowment is based on the research narrative and aims to measure the amount of monetary
resources controlled by the group. A group may register as “resource high” if it has high degrees of
external monetary support, as in the case of Al-Shabaab in Somalia, or of territorial and natural resource
control that is convertible into monetary resources, as in the case of the MPCI in Cote d’Ivoire. A lack of
group resources, particularly of natural, foreign benefactor, or private wealth resources, or a reliance on
the raiding and pillage of civilian communities or households, such as with the UPA in Uganda, registers
as “resource low” and indicates a degree of monetary resource strain within the group. For many groups,
we rely on testimony from experts to code this variable. Resourceamt is coded in three categories:
1- resource low
2- resource medium
3- resource high nominalgdpcap1980
The nominal gross domestic product of each groups' country of origin in 1980, in current USD. GDP
represents the total value at current prices of final goods and services within a country during that year.
All figures are in current USD. This information is taken from the International Monetary Fund's World
Economic Outlook (WEO) database using the MF Data Mapper® online feature, available
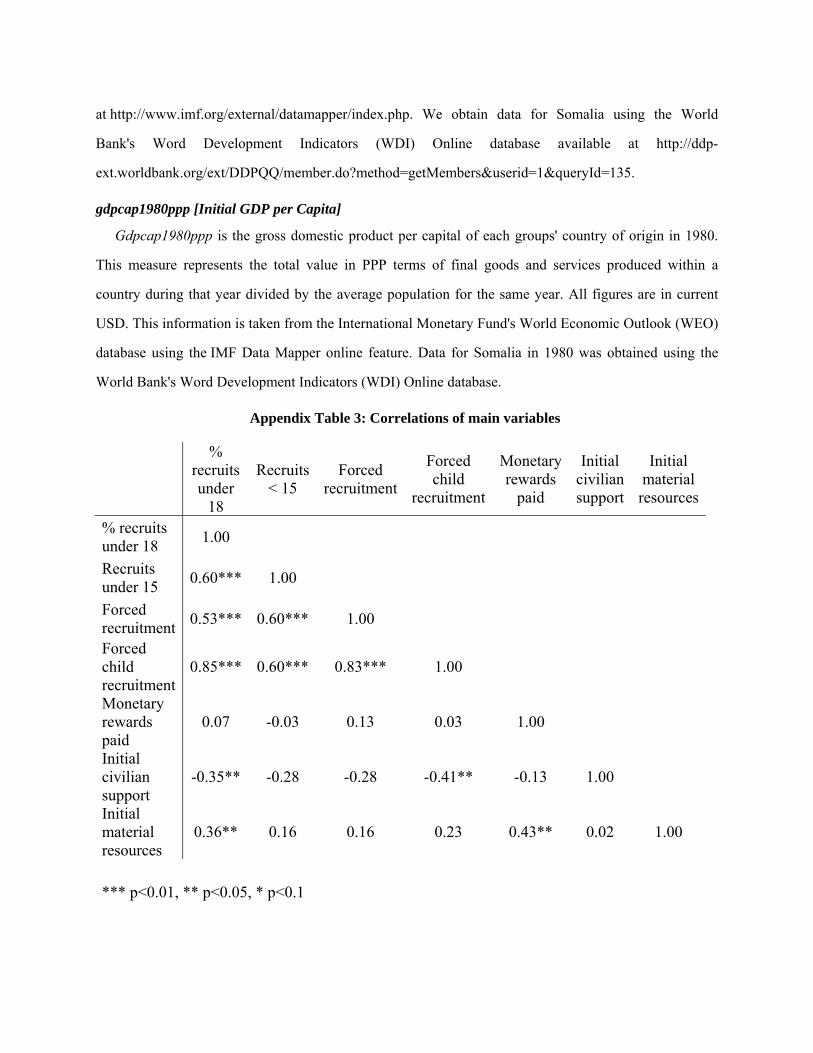
at http://www.imf.org/external/datamapper/index.php. We obtain data for Somalia using the World
Bank's Word Development Indicators (WDI) Online database available at http://ddp-
ext.worldbank.org/ext/DDPQQ/member.do?method=getMembers&userid=1&queryId=135. gdpcap1980ppp [Initial GDP per Capita]
Gdpcap1980ppp is the gross domestic product per capital of each groups' country of origin in 1980.
This measure represents the total value in PPP terms of final goods and services produced within a
country during that year divided by the average population for the same year. All figures are in current
USD. This information is taken from the International Monetary Fund's World Economic Outlook (WEO)
database using the IMF Data Mapper online feature. Data for Somalia in 1980 was obtained using the
World Bank's Word Development Indicators (WDI) Online database.
Appendix Table 3: Correlations of main variables
% recruits under
18
Recruits < 15
Forced recruitment
Forced child
recruitment
Monetary rewards
paid
Initial civilian support
Initial material resources
% recruits under 18
1.00
Recruits under 15
0.60*** 1.00
Forced recruitment
0.53*** 0.60*** 1.00
Forced child recruitment
0.85*** 0.60*** 0.83*** 1.00
Monetary rewards paid
0.07 -0.03 0.13 0.03 1.00
Initial civilian support
-0.35** -0.28 -0.28 -0.41** -0.13 1.00
Initial material resources
0.36** 0.16 0.16 0.23 0.43** 0.02 1.00
*** p<0.01, ** p<0.05, * p<0.1

References
Harbom, Lotta, Erik Melander, and Peter Wallensteen. 2008. "Dyadic Dimensions of Armed Conflict,
1946-2007." Journal of Peace Research 45 (5):697-710.
Harbom, Lotta. 2009. " UCDP Dyadic Dataset Codebook, Version 1-2009." Uppsala Conflict Data
Program (UCDP), Department of Peace and Conflict Research, Uppsala University.