elg3120 lab 1: introduction to matlab · fall, 2007 elg3120: signal and system analysis 3 strengths...
TRANSCRIPT

Fall, 2007 ELG3120: SIGNAL AND SYSTEM ANALYSIS 2
What is MATLAB?It stands for MATrix LABoratoryIt is developed by The Mathworks, Inc.
(http://www.mathworks.com)It is an interactive, integrated, environment
for numerical computationsfor symbolic computationsfor scientific visualizations
It is a high-level programming languageProgram (or script, actually) runs in interpreted, as opposed to compiled, mode
Many application-specific toolboxes (functions) available

Fall, 2007 ELG3120: SIGNAL AND SYSTEM ANALYSIS 3
Strengths of MATLABMATLAB is relatively easy to learnMATLAB code is optimized to be relatively quick when performing matrix operationsMATLAB may behave like a calculator or as a programming languageMATLAB is interpreted, errors are easier to fixAlthough primarily procedural, MATLAB does have some object-oriented elements
Fall, 2007 ELG3120: SIGNAL AND SYSTEM ANALYSIS 4
Weaknesses of MATLABMATLAB is NOT a general purpose programming languageMATLAB is an interpreted language (making it for the most part slower than a compiled language such as C++)MATLAB is designed for scientific computation and is not suitable for some things (such as parsing text)
Fall, 2007 ELG3120: SIGNAL AND SYSTEM ANALYSIS 5
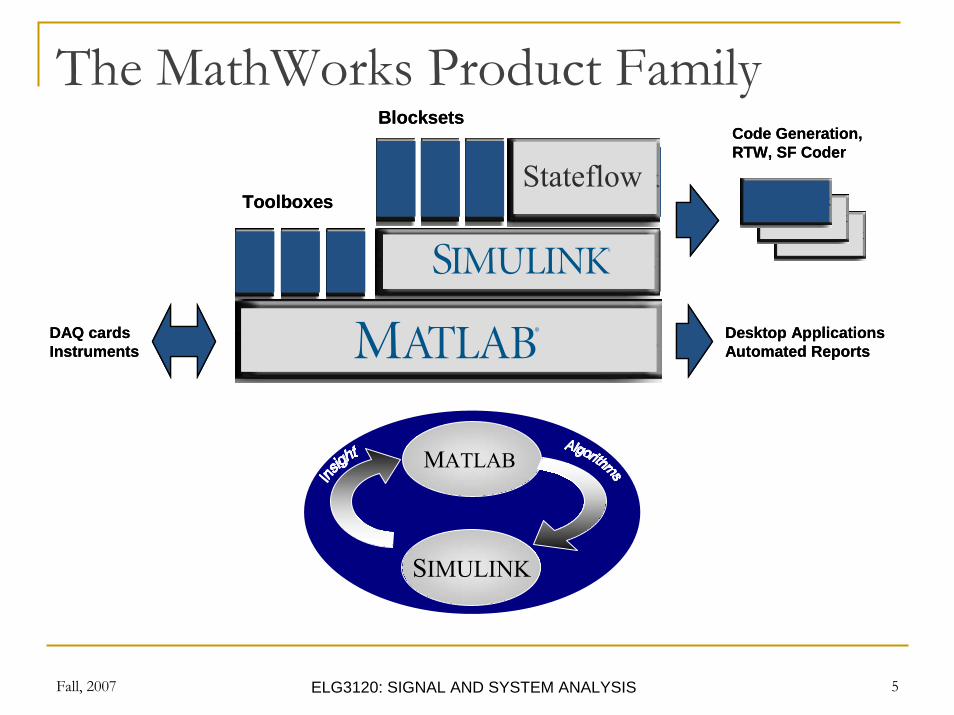
The MathWorks Product Family
StateflowStateflowStateflowStateflowStateflowStateflow
BlocksetsBlocksetsCode Generation, RTW, SF CoderCode Generation, RTW, SF Coder
ToolboxesToolboxes
Desktop ApplicationsAutomated ReportsDesktop ApplicationsAutomated Reports
DAQ cardsInstrumentsDAQ cardsInstruments
MATLAB
SIMULINK
Fall, 2007 ELG3120: SIGNAL AND SYSTEM ANALYSIS 6
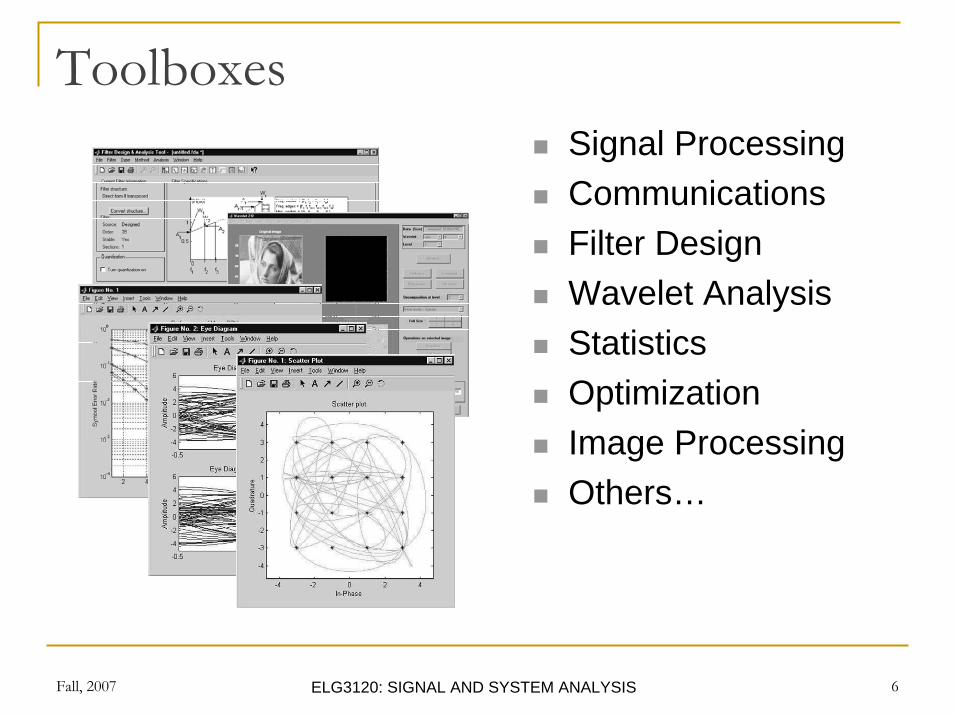
ToolboxesSignal ProcessingCommunicationsFilter DesignWavelet AnalysisStatisticsOptimizationImage ProcessingOthers…
Fall, 2007 ELG3120: SIGNAL AND SYSTEM ANALYSIS 7
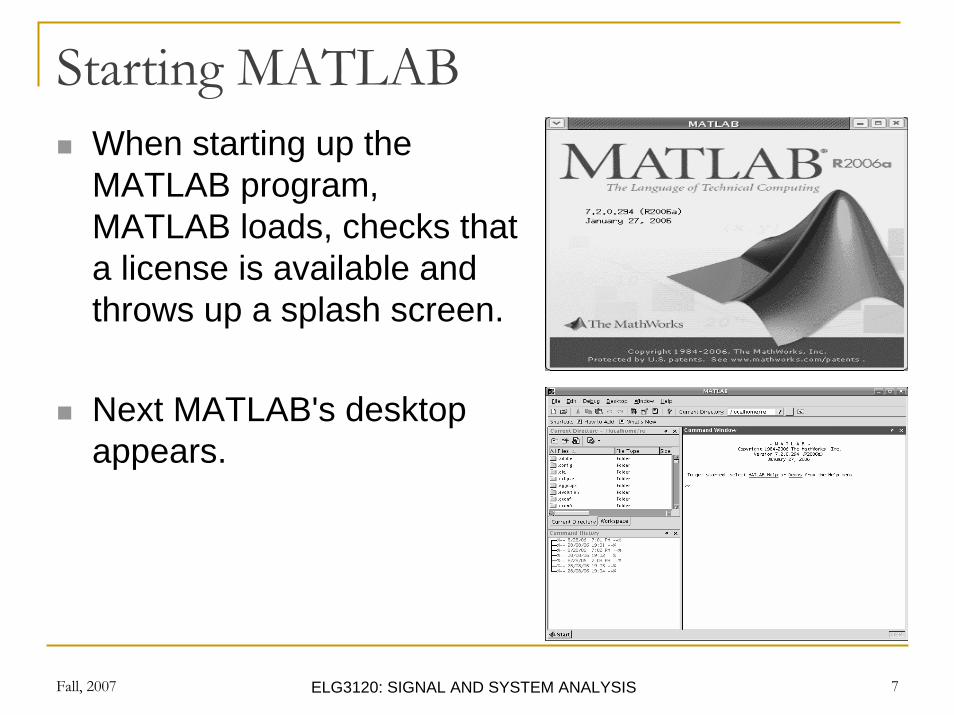
Starting MATLABWhen starting up the MATLAB program, MATLAB loads, checks that a license is available and throws up a splash screen.
Next MATLAB's desktop appears.
Fall, 2007 ELG3120: SIGNAL AND SYSTEM ANALYSIS 8
I. MATLAB Desktop
Fall, 2007 ELG3120: SIGNAL AND SYSTEM ANALYSIS 9
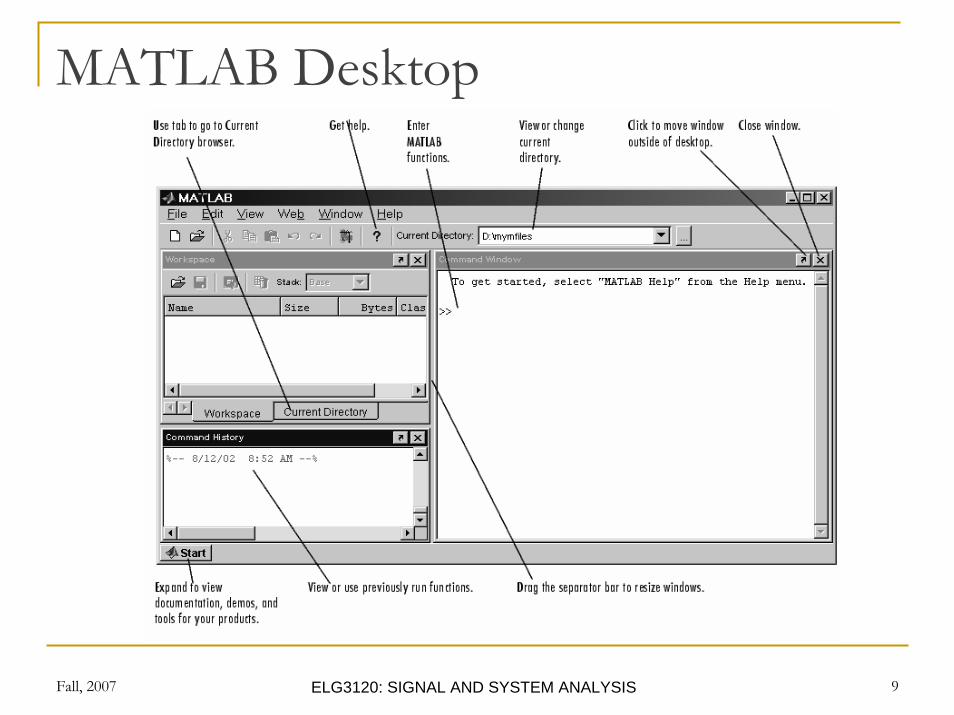
MATLAB Desktop
Fall, 2007 ELG3120: SIGNAL AND SYSTEM ANALYSIS 10
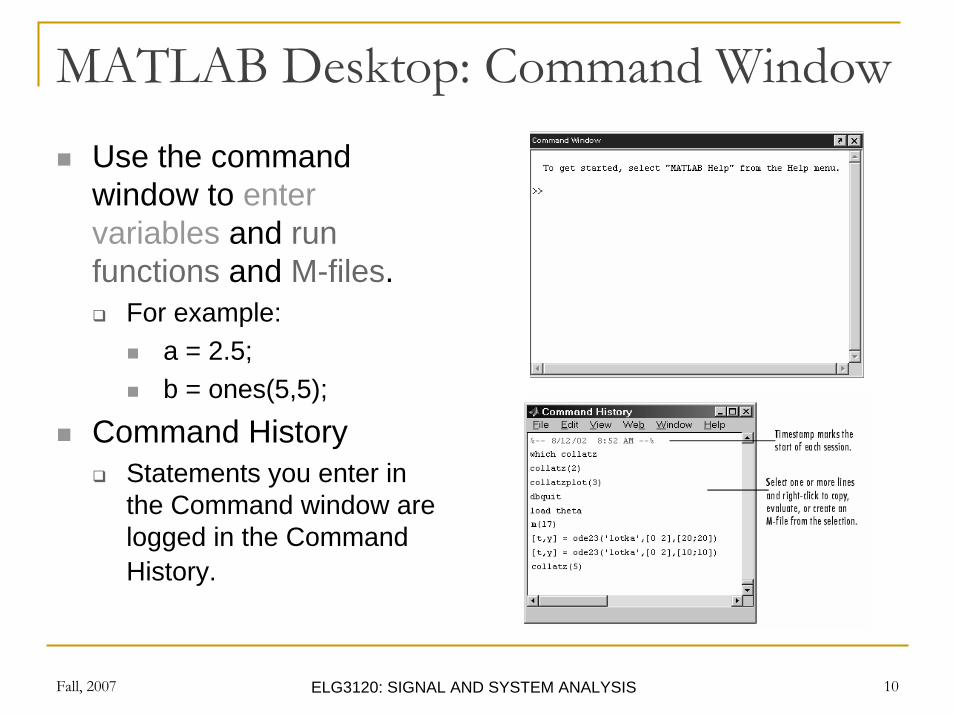
MATLAB Desktop: Command WindowUse the command window to enter variables and run functions and M-files.
For example:a = 2.5;b = ones(5,5);
Command HistoryStatements you enter in the Command window are logged in the Command History.

Fall, 2007 ELG3120: SIGNAL AND SYSTEM ANALYSIS 11
MATLAB Desktop: Workspace Browser
The MATLAB workspace consists of the set of variables (named arrays) built up during a MATLAB session and stored in memory.You add variables to the workspace by using functions, running M-files and loading saved workspaces.To delete variables from the workspace, select the variable and select Delete from the Edit menu. Alternatively, use the “clear”function.
Fall, 2007 ELG3120: SIGNAL AND SYSTEM ANALYSIS 12
Scripts and Functions: M-fileSequences of MATLAB commands can be written to files with the extension .m, appropriately called M-files. Entering the name of the file (without the extension!) causes automatic execution of all the statements. In their simplest form, such files are called script files. Script files do not take the input arguments or return the output arguments. The function files may take input arguments or return output arguments.
Fall, 2007 ELG3120: SIGNAL AND SYSTEM ANALYSIS 13
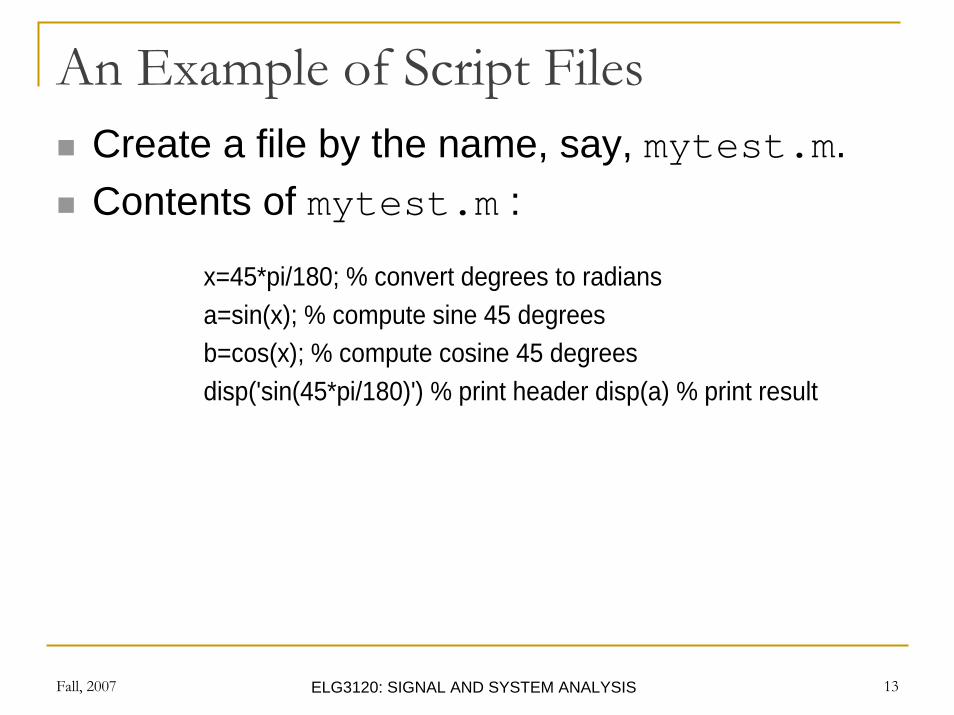
An Example of Script FilesCreate a file by the name, say, mytest.m. Contents of mytest.m :
x=45*pi/180; % convert degrees to radians a=sin(x); % compute sine 45 degrees b=cos(x); % compute cosine 45 degrees disp('sin(45*pi/180)') % print header disp(a) % print result
Fall, 2007 ELG3120: SIGNAL AND SYSTEM ANALYSIS 14
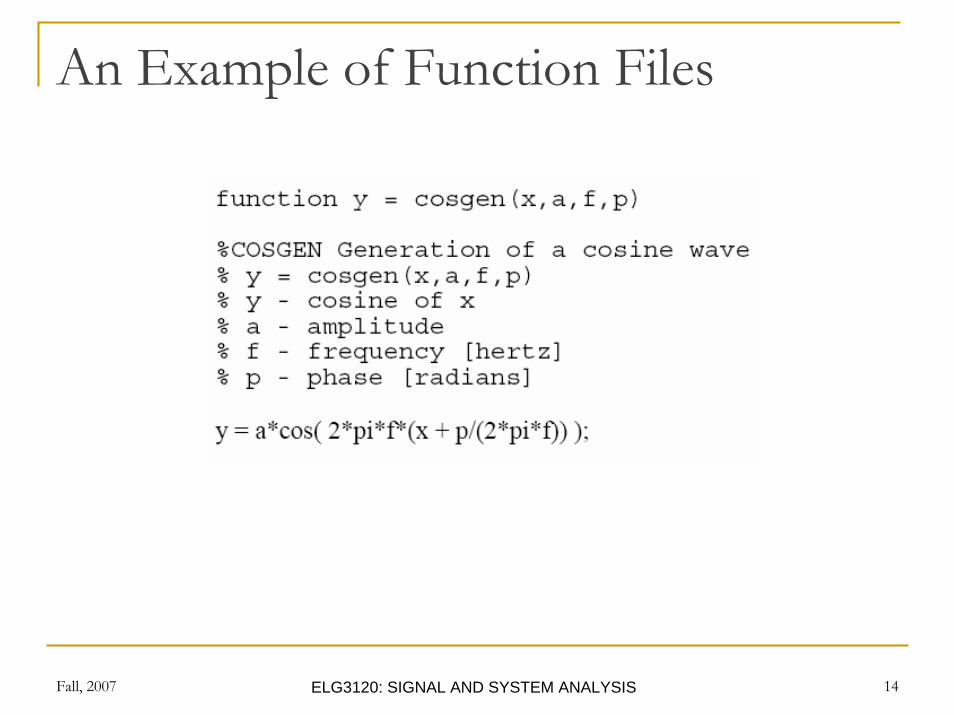
An Example of Function Files
Fall, 2007 ELG3120: SIGNAL AND SYSTEM ANALYSIS 15
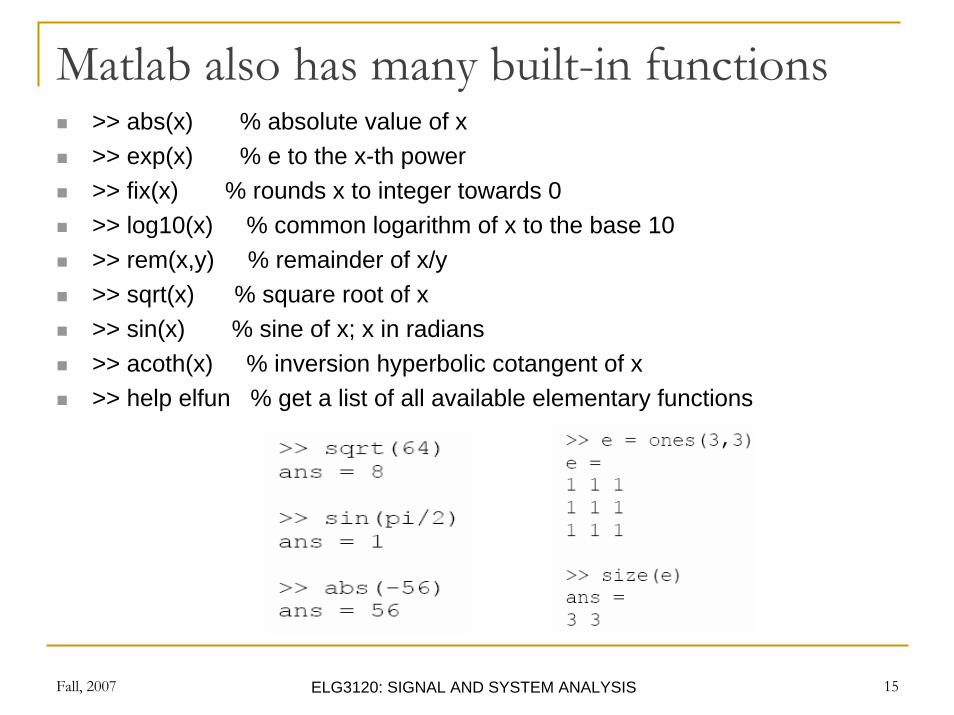
Matlab also has many built-in functions>> abs(x) % absolute value of x>> exp(x) % e to the x-th power>> fix(x) % rounds x to integer towards 0>> log10(x) % common logarithm of x to the base 10>> rem(x,y) % remainder of x/y>> sqrt(x) % square root of x>> sin(x) % sine of x; x in radians>> acoth(x) % inversion hyperbolic cotangent of x>> help elfun % get a list of all available elementary functions
Fall, 2007 ELG3120: SIGNAL AND SYSTEM ANALYSIS 16
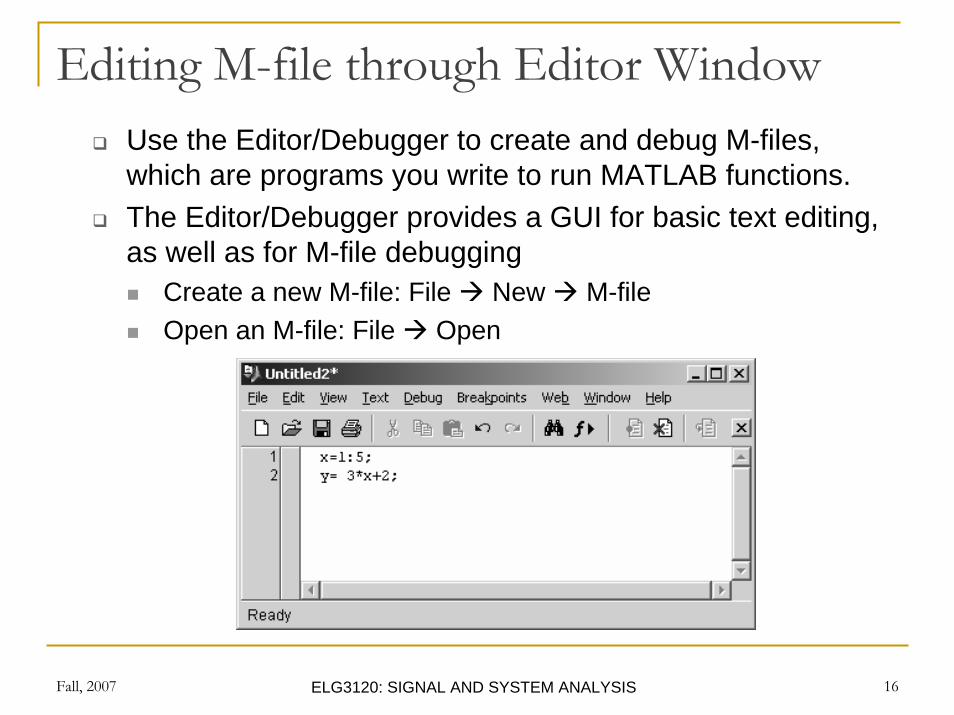
Editing M-file through Editor WindowUse the Editor/Debugger to create and debug M-files, which are programs you write to run MATLAB functions. The Editor/Debugger provides a GUI for basic text editing, as well as for M-file debugging
Create a new M-file: File New M-fileOpen an M-file: File Open
Fall, 2007 ELG3120: SIGNAL AND SYSTEM ANALYSIS 17
Rules on Variable and Function NamesVariable/Function name
begins with a LETTER, e.g., A2z.can be a mix of letters, digits, and underscores (e.g., vector_A, but not vector-A (since "-" is a reserved char).is case sensitive, e.g., NAME, Name, name are 3 distinct variables.must not be longer than 31 characters. Suggestion:
Since MATLAB distinguishes one function from the next by their file names, name files the same as function names to avoid confusion. Use only lowercase letter to be consistent with MATLAB's convention.
File nameFiles that contain MATLAB commands should be named with a suffix of ".m", e.g., something.m. These include, but not restricted to, script m-files and function m-files. Note: To use it, just refer to it by name, without the suffix, e.g.,>> something
Fall, 2007 ELG3120: SIGNAL AND SYSTEM ANALYSIS 18
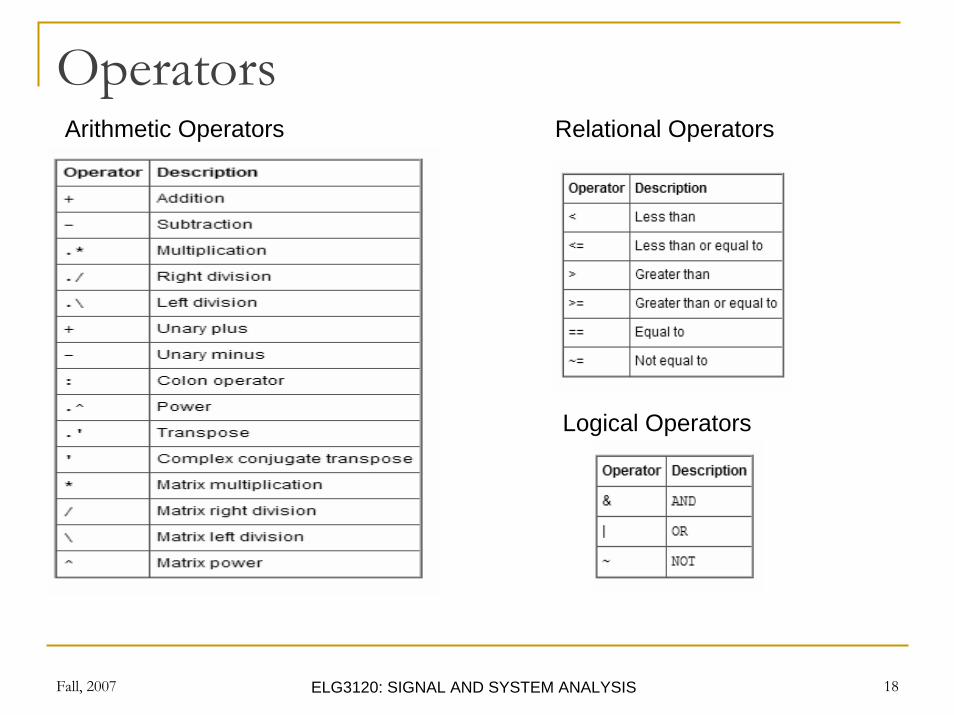
OperatorsArithmetic Operators Relational Operators
Logical Operators
Fall, 2007 ELG3120: SIGNAL AND SYSTEM ANALYSIS 19
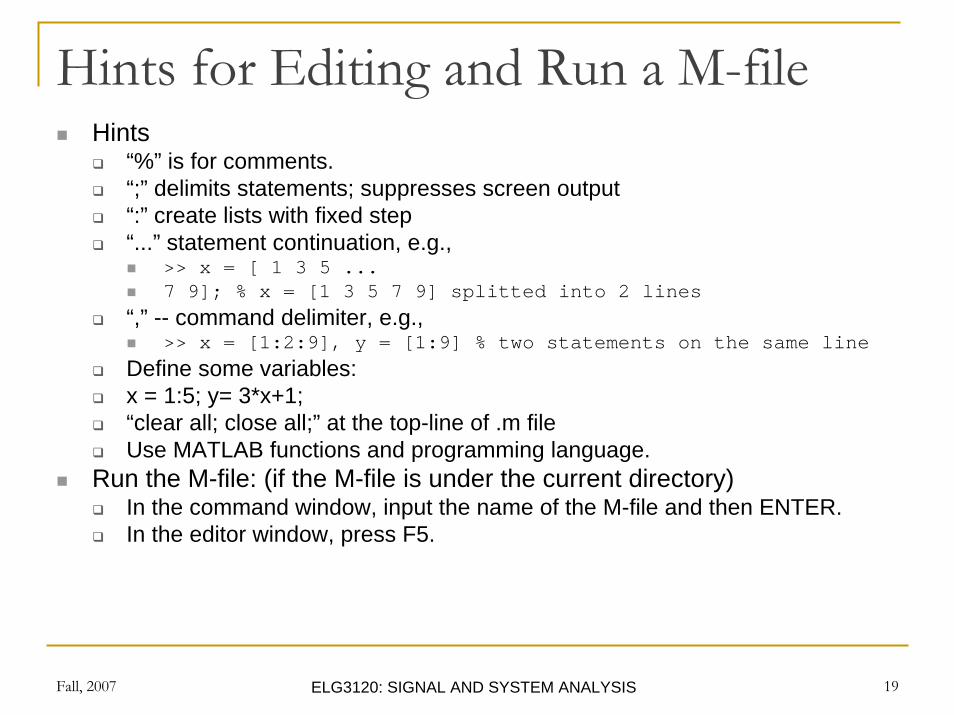
Hints for Editing and Run a M-fileHints
“%” is for comments.“;” delimits statements; suppresses screen output“:” create lists with fixed step“...” statement continuation, e.g.,
>> x = [ 1 3 5 ...7 9]; % x = [1 3 5 7 9] splitted into 2 lines
“,” -- command delimiter, e.g.,>> x = [1:2:9], y = [1:9] % two statements on the same line
Define some variables:x = 1:5; y= 3*x+1;“clear all; close all;” at the top-line of .m fileUse MATLAB functions and programming language.
Run the M-file: (if the M-file is under the current directory)In the command window, input the name of the M-file and then ENTER.In the editor window, press F5.
Fall, 2007 ELG3120: SIGNAL AND SYSTEM ANALYSIS 20
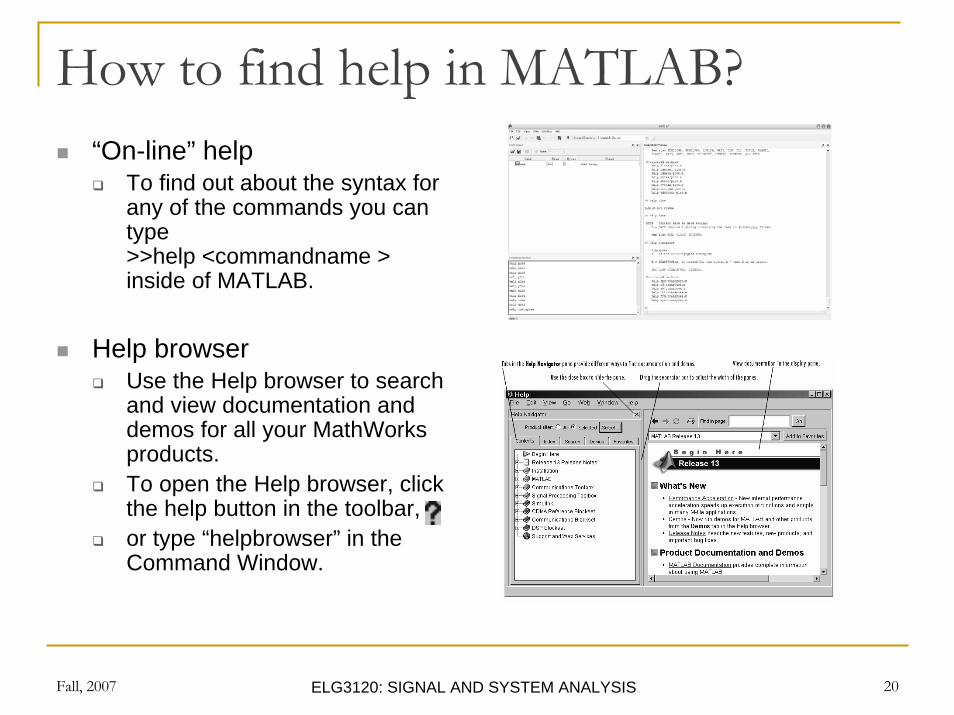
How to find help in MATLAB?“On-line” help
To find out about the syntax for any of the commands you can type >>help <commandname > inside of MATLAB.
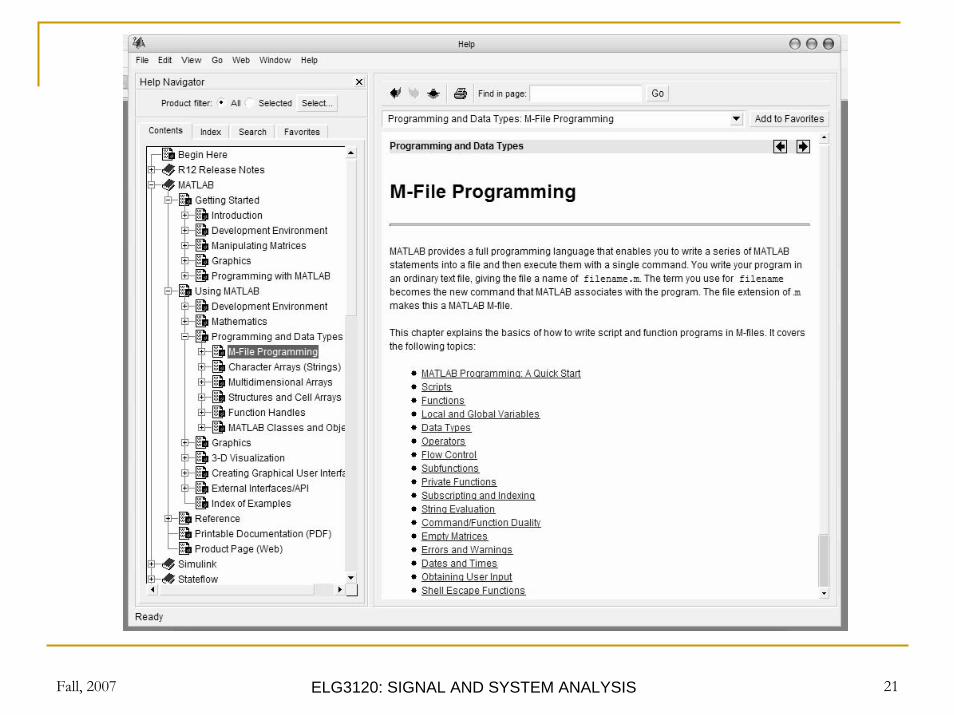
Help browserUse the Help browser to search and view documentation and demos for all your MathWorksproducts. To open the Help browser, click the help button in the toolbar, or type “helpbrowser” in the Command Window.
Fall, 2007 ELG3120: SIGNAL AND SYSTEM ANALYSIS 21
Fall, 2007 ELG3120: SIGNAL AND SYSTEM ANALYSIS 22
II. MATLAB BASICS
Fall, 2007 ELG3120: SIGNAL AND SYSTEM ANALYSIS 23
Introduction to Vectors in MatlabMATLAB is designed to work with matrices, but you can also input scalars and vectors since they can be considered as matrices with dimension 1x1 (scalars) and 1xn or nx1 (vectors).
Defining a vectorAccessing elements within a vectorBasic operations on vectorsGo to link:
http://www.cyclismo.org/tutorial/matlab/vector.htmlhttp://www.cyclismo.org/tutorial/matlab/operations.html
Fall, 2007 ELG3120: SIGNAL AND SYSTEM ANALYSIS 24
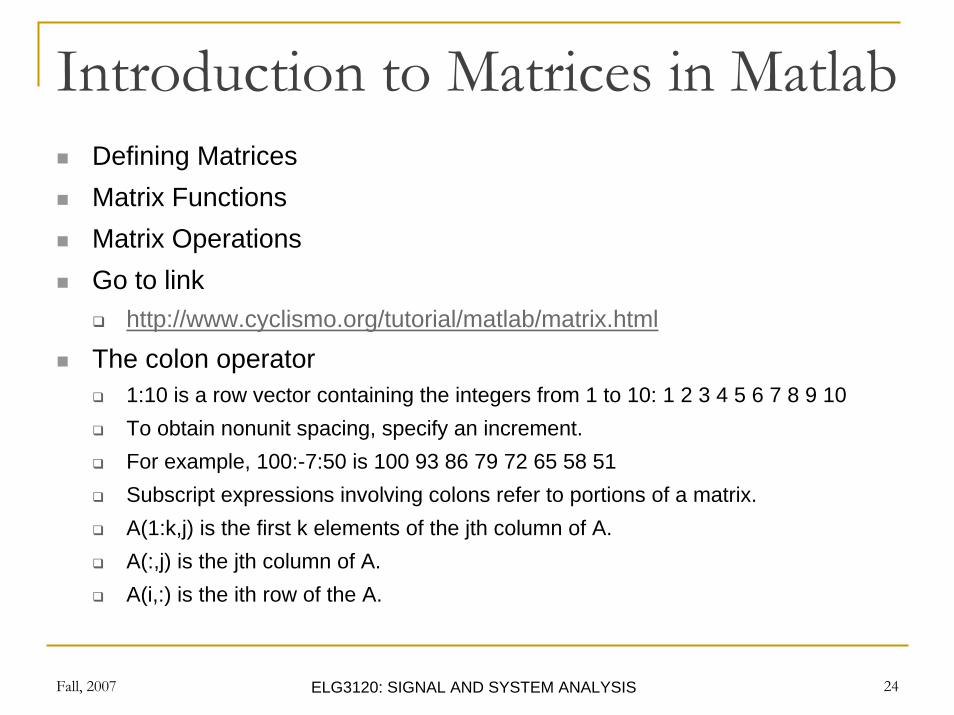
Introduction to Matrices in MatlabDefining MatricesMatrix FunctionsMatrix OperationsGo to link
http://www.cyclismo.org/tutorial/matlab/matrix.html
The colon operator1:10 is a row vector containing the integers from 1 to 10: 1 2 3 4 5 6 7 8 9 10To obtain nonunit spacing, specify an increment. For example, 100:-7:50 is 100 93 86 79 72 65 58 51 Subscript expressions involving colons refer to portions of a matrix.A(1:k,j) is the first k elements of the jth column of A. A(:,j) is the jth column of A.A(i,:) is the ith row of the A.
Fall, 2007 ELG3120: SIGNAL AND SYSTEM ANALYSIS 25
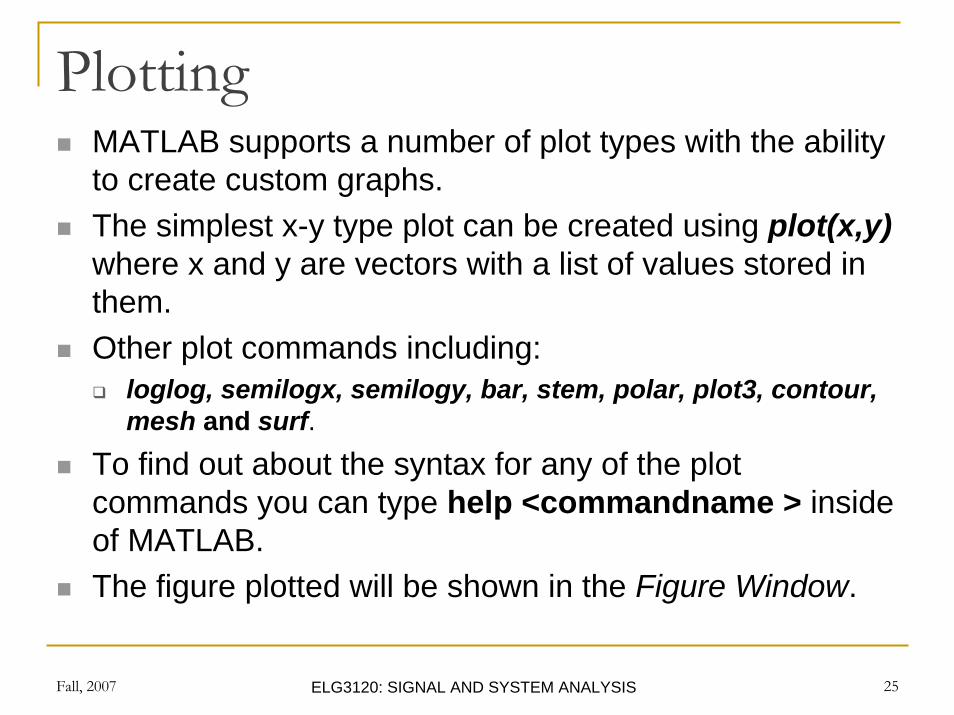
PlottingMATLAB supports a number of plot types with the ability to create custom graphs. The simplest x-y type plot can be created using plot(x,y)where x and y are vectors with a list of values stored in them. Other plot commands including:
loglog, semilogx, semilogy, bar, stem, polar, plot3, contour, mesh and surf.
To find out about the syntax for any of the plot commands you can type help <commandname > inside of MATLAB. The figure plotted will be shown in the Figure Window.
Fall, 2007 ELG3120: SIGNAL AND SYSTEM ANALYSIS 26
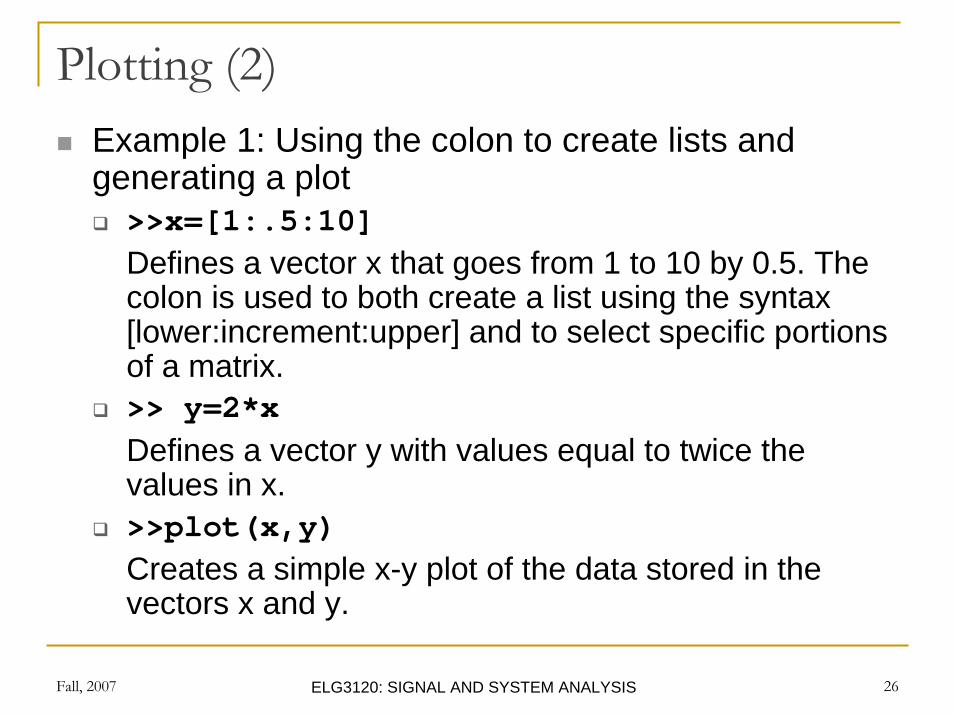
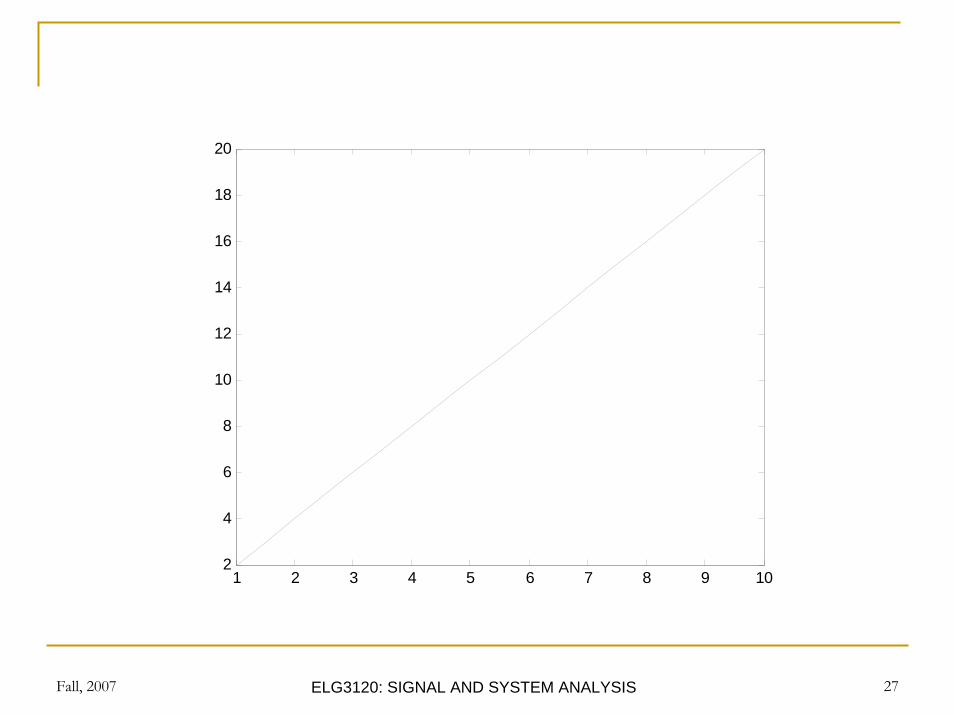
Plotting (2)Example 1: Using the colon to create lists and generating a plot>>x=[1:.5:10]Defines a vector x that goes from 1 to 10 by 0.5. The colon is used to both create a list using the syntax [lower:increment:upper] and to select specific portions of a matrix. >> y=2*x Defines a vector y with values equal to twice the values in x. >>plot(x,y)Creates a simple x-y plot of the data stored in the vectors x and y.
Fall, 2007 ELG3120: SIGNAL AND SYSTEM ANALYSIS 27
1 2 3 4 5 6 7 8 9 102
4
6
8
10
12
14
16
18
20
Fall, 2007 ELG3120: SIGNAL AND SYSTEM ANALYSIS 28
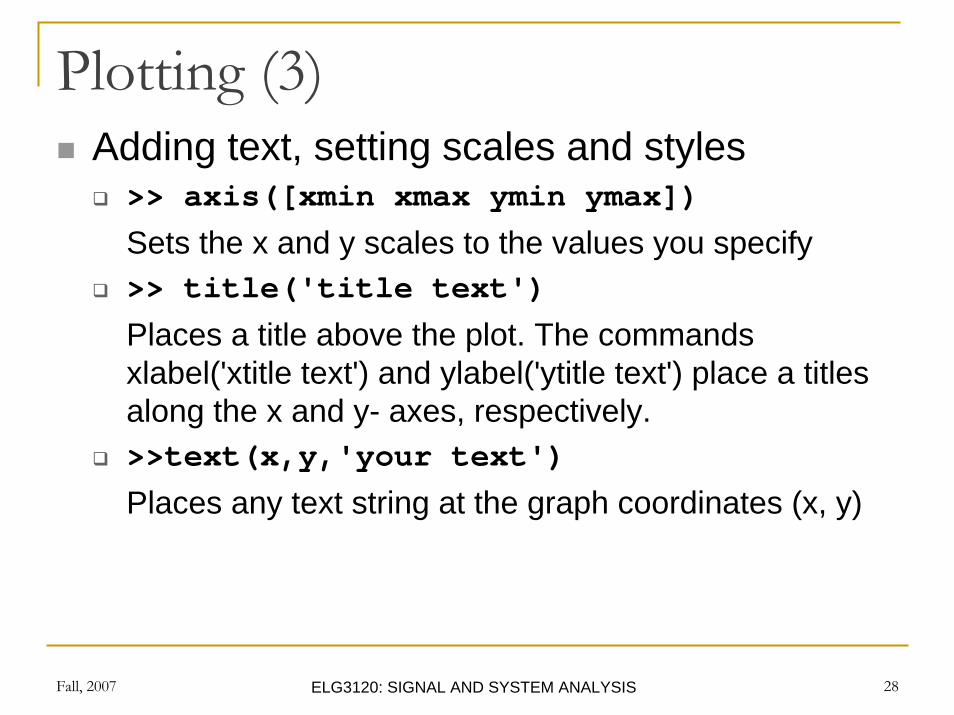
Plotting (3)Adding text, setting scales and styles>> axis([xmin xmax ymin ymax])
Sets the x and y scales to the values you specify >> title('title text')
Places a title above the plot. The commands xlabel('xtitle text') and ylabel('ytitle text') place a titles along the x and y- axes, respectively. >>text(x,y,'your text')
Places any text string at the graph coordinates (x, y)
Fall, 2007 ELG3120: SIGNAL AND SYSTEM ANALYSIS 29
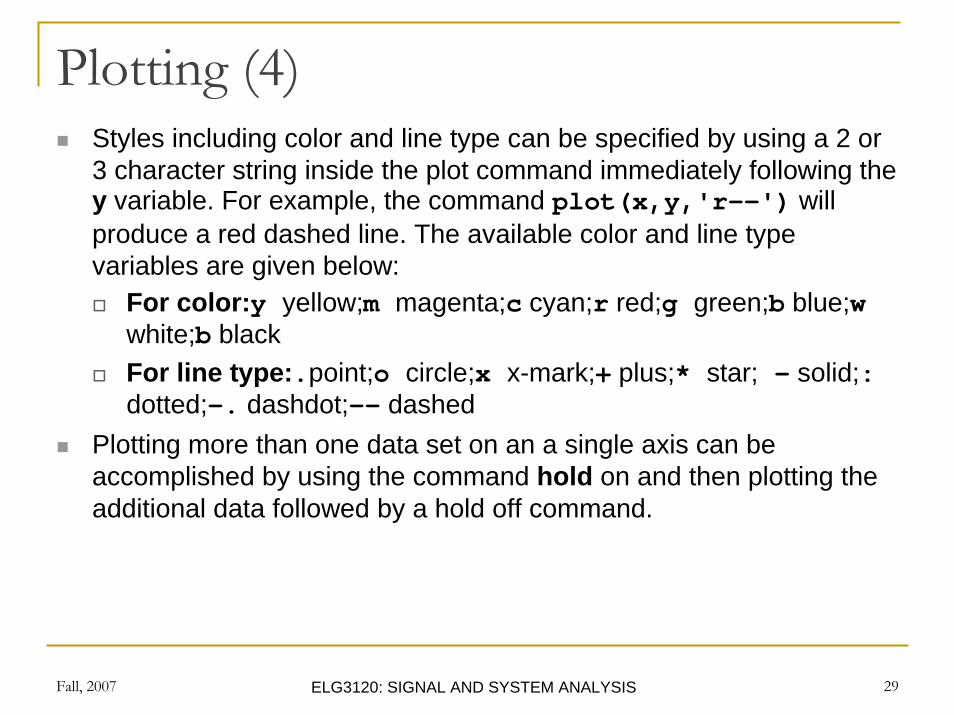
Plotting (4)Styles including color and line type can be specified by using a 2 or 3 character string inside the plot command immediately following the y variable. For example, the command plot(x,y,'r--') will produce a red dashed line. The available color and line type variables are given below:
For color:y yellow;m magenta;c cyan;r red;g green;b blue;w white;b black For line type:.point;o circle;x x-mark;+ plus;* star; - solid;: dotted;-. dashdot;-- dashed
Plotting more than one data set on an a single axis can be accomplished by using the command hold on and then plotting the additional data followed by a hold off command.
Fall, 2007 ELG3120: SIGNAL AND SYSTEM ANALYSIS 30
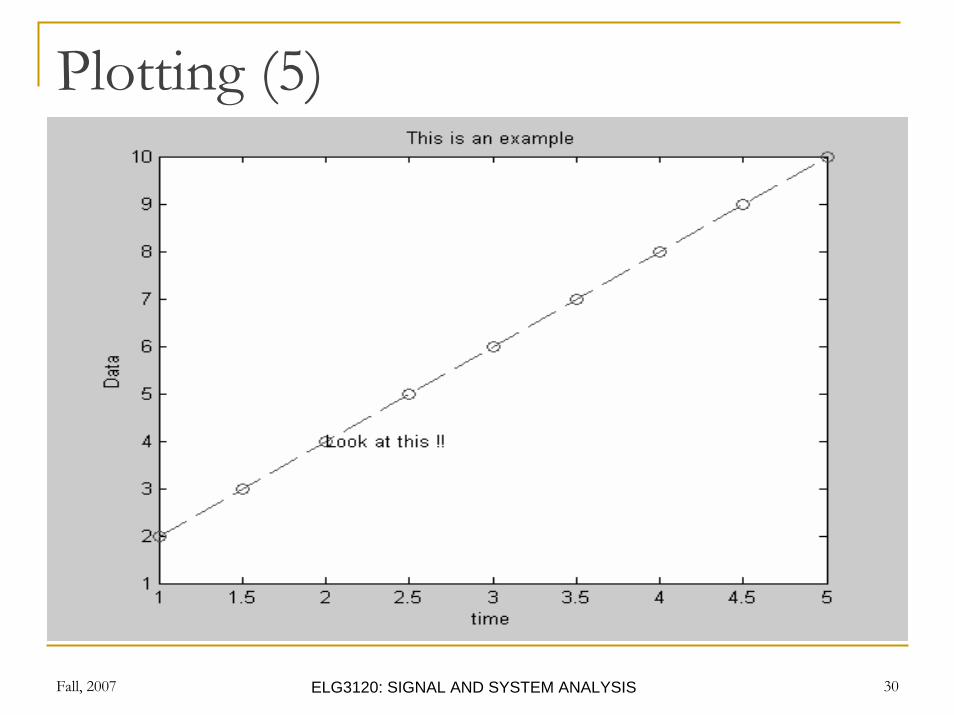
Plotting (5)

Fall, 2007 ELG3120: SIGNAL AND SYSTEM ANALYSIS 31
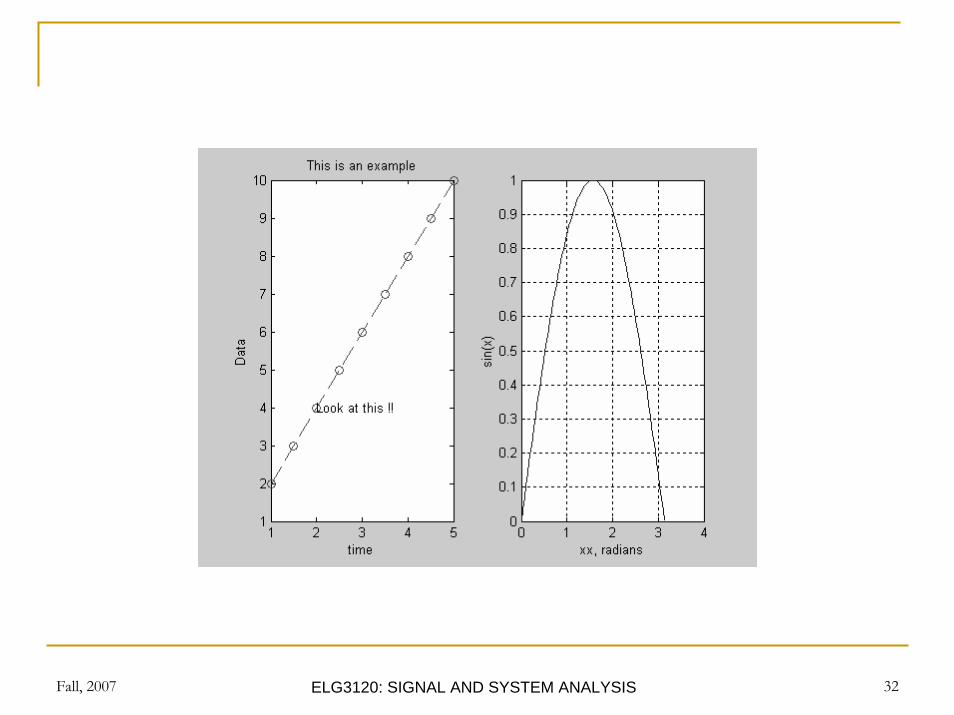
Plotting (6)Example2: simple plots
The following sequence of commands plots the graph of the sine function between 0 and π, provided that the two arrays have the same number of elements.>> xx = 0:pi/90: pi;
>> yy = sin(xx);>> plot(xx, yy)>> grid on>> xlabel(‘xx, radians’)
>> ylabel(‘sin(xx)’)
Example3: subplot
Fall, 2007 ELG3120: SIGNAL AND SYSTEM ANALYSIS 32
Fall, 2007 ELG3120: SIGNAL AND SYSTEM ANALYSIS 33
MATLAB Programming Loops
For LoopsWhile LoopsGo to link:
http://www.cyclismo.org/tutorial/matlab/control.html
IfGo to link:
http://www.cyclismo.org/tutorial/matlab/if.html
Subroutines (optional)Go to link:
http://www.cyclismo.org/tutorial/matlab/subroutine.html

Fall, 2007 ELG3120: SIGNAL AND SYSTEM ANALYSIS 34
Good Luck!!!!