elevated rates of gold mining in the amazon revealed
TRANSCRIPT

Elevated rates of gold mining in the Amazon revealedthrough high-resolution monitoringGregory P. Asnera,1, William Llactayob, Raul Tupayachia, and Ernesto Ráez Lunac
aDepartment of Global Ecology, Carnegie Institution for Science, Stanford, CA 94305; and bDirección General de Ordenamiento Territorial, and cAsesor de laAlta Dirección, Ministerio del Ambiente, San Isidro, Lima 27, Peru
Contributed by Gregory P. Asner, September 30, 2013 (sent for review September 14, 2013)
Gold mining has rapidly increased in western Amazonia, but therates and ecological impacts of mining remain poorly known andpotentially underestimated. We combined field surveys, airbornemapping, and high-resolution satellite imaging to assess road- andriver-based gold mining in the Madre de Dios region of thePeruvian Amazon from 1999 to 2012. In this period, the geographicextent of gold mining increased 400%. The average annual rate offorest loss as a result of gold mining tripled in 2008 following theglobal economic recession, closely associated with increased goldprices. Small clandestine operations now comprise more than halfof all gold mining activities throughout the region. These rates ofgold mining are far higher than previous estimates that werebased on traditional satellite mapping techniques. Our resultsprove that gold mining is growing more rapidly than previouslythought, and that high-resolution monitoring approaches arerequired to accurately quantify human impacts on tropical forests.
Carnegie Airborne Observatory | CLASlite | forest degradation |deforestation | Peru
Millions of years of Andean erosion have brought layers ofsediment into the vast western lowland Amazonian eco-
systems now covered by high-biomass and high-biodiversity tropi-cal forest. Within depositional zones, the subsoils are laced witha diffusely distributed, yet highly enriched amount of gold. Miningthe gold that underlies tropical forests poses a threat to biologicaldiversity and to the carbon currently sequestered in the plants andsoils covering gold deposits.Mining for gold has long been undertaken in low-intensity
indigenous activities in the Andean foothills and along river-banks in the Amazon lowlands (1). Gold rushes have also comeand gone in the Amazon, sometimes with major ecological andsocietal impacts (2), but the geographic footprint of these boom-and-bust cycles has never been well documented. In 2008 theworld economic recession resulted in a rapid increase in goldprices (3) and a surge of gold mining occurred in the southernPeruvian Region of Madre de Dios. This region supplies morethan 70% of the annual gold resource in Peru (4); however,mining activities mostly remain unpermitted by the government.Here we refer to these activities as informal mining operations,and most are illegal.In an effort to understand gold mining in Madre de Dios,
Swenson et al. (5) reported that the three largest mining areashad removed a then alarming 15,500 ha of primary tropical forestby 2009. Their study used free Landsat satellite data with a spa-tial resolution of 30 m to map these three large mines, one ofwhich was established in the 1980s as the Huepetuhe mine in theAndean foothills. The other two large mines, known as Guaca-mayo and Delta-1, were established much later. The Guacamayomine links the Inambari River to the recently paved InteroceanicHighway. The Delta-1 mine lies in previously forested landsbetween the Colorado and Puquiri Rivers. All three mines rest inareas of very high biological diversity (6) and all are readilyvisible in Google Earth images. Employing image interpretationtechniques widely used in remote sensing, Swenson et al. (5) alsoestimated a gold-mining–driven deforestation rate of 1,915 ha·yr−1
based on the establishment and expansion of these three largestmines. Most importantly, their study correlated an increase inmining activity with market gold prices and with the importationof toxic mercury used in the gold-extraction process.Although the area of these few large gold mines in the Madre
de Dios region has been mapped with Landsat imagery, thegeographic extent and ecological impacts of thousands of smallmines have gone unexamined because of the extremely clan-destine style of these operations and the challenge of mappingthem with satellite sensors (Fig. 1). Miners are known to moveup and down rivers at high temporal frequency, leaving oftensubtle signs of their presence in gouged clay terraces andriverbanks that have proven hard to detect or map with satel-lites. More recently, it was thought that miners are locatingtheir operations back from the main stem of regionally impor-tant rivers, such as the Madre de Dios, Colorado, Inambari,Malinowski, and Tambopata, to better conceal their presencefrom law enforcement and passers-by. However, none of thesemining operations have been quantitatively mapped, and thustheir individual and combined effects on the ecology of the re-gion remain unknown.Here we report on a study to map gold mining activities in
the Madre de Dios region of Peru using very high-resolutionsatellite and airborne mapping techniques. We used the CarnegieLandsat Analysis System-lite (CLASlite) (7) to detect and mapmining extent in both small and large operations throughout theregion. CLASlite differs from other satellite-mapping approachesbecause it uses spectral mixture analysis to detect changes inforest cover in increments as small as 1% of a Landsat pixel, orabout 10 m2 (8, 9). This process allows for the detection and
Significance
Commodity gold prices increased substantially following the2008 global financial crisis. Gold demand has fueled a massiveincrease in mining activity, some of which is centered in theAmazon basin. Western Amazonian forests of Peru have be-come an epicenter for mostly illegal gold mining, but theclandestine nature of mining activities has made monitoringand reporting of forest losses extremely challenging. Wecombined high-resolution satellite and aircraft-based imagingwith field surveys to address this issue in one of the highestbiodiversity regions on Earth: Madre de Dios, Peru. We foundthe gold mining extent and rates are far higher than pre-viously reported, with critically important implications forthe ecology and environmental policy of this unique tropicalrainforest region.
Author contributions: G.P.A., W.L., and R.T. designed research; G.P.A. and R.T. performedresearch; G.P.A. and W.L. contributed new reagents/analytic tools; G.P.A., R.T., and E.R.L.analyzed data; and G.P.A. wrote the paper.
The authors declare no conflict of interest.
Freely available online through the PNAS open access option.1To whom correspondence should be addressed. E-mail: [email protected].
This article contains supporting information online at www.pnas.org/lookup/suppl/doi:10.1073/pnas.1318271110/-/DCSupplemental.
www.pnas.org/cgi/doi/10.1073/pnas.1318271110 PNAS Early Edition | 1 of 6
SUST
AINABILITY
SCIENCE

mapping of fine-scale disturbances that go undetected usingtraditional remote-sensing methods (10, 11).We tested the satellite mapping results with two levels of
evaluation. First, we carried out an extensive ground-based sur-vey in areas where access and personnel safety risks were ac-ceptably low, to validate the accuracy of the CLASlite results forgold mining detection and classification. Second, we used theCarnegie Airborne Observatory (CAO) (12) to evaluate the ac-curacy of the CLASlite maps along edges of large mines as wellas among the small clandestine mining operations set back fromthe roads and rivers in the region, which have proven virtuallyimpossible to access on the ground.
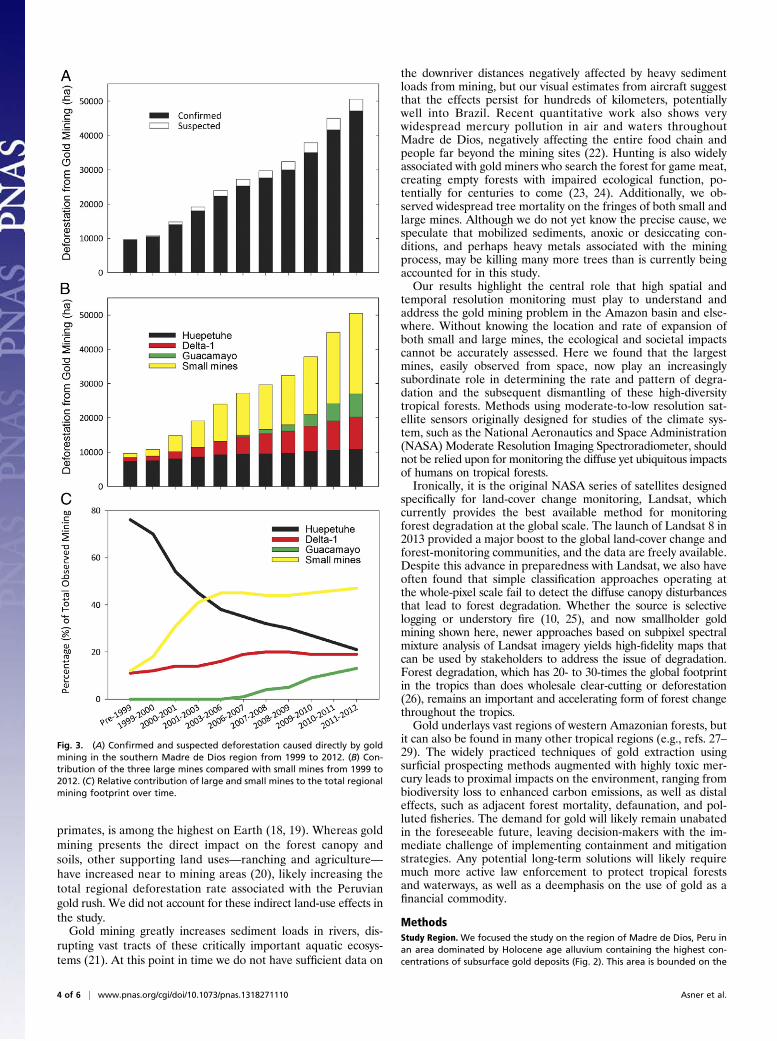
ResultsSatellite Results. CLASlite results indicated an increase in goldmine extent from less than 10,000 ha in 1999 to more than 50,000ha by September of 2012 (Fig. 2). We calculated the annual rateof mine expansion, finding that it had tripled from 2,166 ha·yr−1
before the 2008 global economic recession to 6,145 ha·yr−1 after2008 and through 2012. In this period, the average annual in-crease in gold mining area was 14%, and this rate peaked at 20%in 2011.Using field observations and CAO data, we confirmed up to
94% of the CLASlite detections for mines developed in the2009–2011 period of overlap between datasets (see Field andAirborne Validation, below), leaving only a small residual fractionof suspected but unconfirmed mining operations (Fig. 3A). Im-portantly, the relative contribution of the three largest mineareas—Huepetuhe, Delta-1, and Guacamayo—to the regionalgold mining footprint changed in the period from 1999 to 2012(Fig. 3B). The largest Huepetuhe mine represented 76% of
region-wide mining in 1999, but by 2012, regional mining activityincreased to the point in which Huepetuhe only accounted for21% of total activity (Fig. 3C). In this 13-y period, both the largeDelta-1 and the small, diffuse mining operations increasedenormously in extent and relative contribution to the region.Delta-1 increased in area by threefold from 1999 to 2012, but thesmall mines underwent nearly a 600% increase in the same pe-riod (Fig. 3). The newest large mine, Guacamayo, emerged inlate 2006, increasing to 13% of the total regional mining area by2012. Zoom image maps reveal thousands of previously un-documented small mines throughout the region (Figs. S1–S3).Through this approach, we also discovered hundreds of newsmall mines in the foothills (600- to 800-m elevation abovesea level) in the headwater region of the Colorado, Inambari,and Malinowski Rivers (Fig. 4). These “breakouts” of small,upriver mines were confirmed by air in July 2011 and again inSeptember 2013.Critically, as of 2012 small mining operations constituted 51%
of the total mining activity throughout the region (Fig. 3). Inother words, the cumulative geographic footprint of the thou-sands of small, clandestine mines matched the impact of the threewell-known, large mining landscapes of Huepetuhe, Delta-1, andGuacamayo. All mining areas, independent of whether they areoperated as large or very small extraction sites, greatly increased inoverall extent in the 2008–2012 period following the global re-cession that had led to increased gold prices (Fig. 4).
Field and Airborne Validation. Stratified, random field sampling at166 locations of small mining operations (< 5 ha) indicatedomission and commission errors of 15.7% and 18.0%, respectively(Table 1). The κ-statistic was 0.64. This result indicated high
Fig. 1. (A and B) Typical examples of the interior conditions of the large Guacamayo and Huepetuhe mines. (C) Examples of small-scale mining on and setback from the edge of the Madre de Dios River. In all cases, mines are dominated by extensive, intermixed areas of bare soil and standing pools of waterresulting from the mining process.
2 of 6 | www.pnas.org/cgi/doi/10.1073/pnas.1318271110 Asner et al.

reliability of the CLASlite maps for detection, mapping, andmonitoring of small gold mines.Because field-based validation is fraught with uncertainty be-
cause of time differences between field and remotely sensedobservations—and in our case, extremely dangerous access onthe ground—we also used CAO imagery to randomly generate1,500 points intersecting with CLASlite maps. Formally, thisapproach is not completely random because the CAO imagerydid not constitute wall-to-wall coverage; we focused flights on thelarge Guacamayo and Huepetuhe mines and along the Madre deDios and Malinowski Rivers for small mines (Figs. S4–S7). Theresults indicated omission and commission errors of 5.9% and7.1%, respectively (Table 1). The κ-statistic was 0.86, indicatingvery high reliability of CLASlite mine detections against aircraftobservations. Close inspection of the airborne data indicatedthat areas of standing dead trees, often located within 100–200 mof active mining sites, were often not classified as part of the goldmining footprint. This finding was expected given our criteriaduring CLASlite analysis requiring the presence of bare soil orstanding water (Fig. 1 and Fig. S4).
DiscussionGold mining is rapidly expanding in the western Amazon, withan explosion of activities centered in the Madre de Dios regionof Peru. Our results reveal far more forest damage than has beenreported in the past, both in terms of the current area affectedand the rate of clearing over time. The 50,000 ha of new mining
that we mapped from 1999 to 2012 far exceed previous estimatesand reports by the government and nongovernment organiza-tions operating in the region. For example, Swenson et al. (5)had estimated about 15,500 ha in total by 2009, whereas wefound more than double that amount (32,371 ha) in the sameperiod. The difference in estimates rests in the fact that previ-ous work has focused on the three large mines without ac-counting for the thousands of small clandestine mines alongroads and waterways.With high-resolution monitoring, we observed an average
6,145 ha·yr−1 of forest loss caused by gold mining after 2008.Deforestation for gold mining now exceeds all other forms offorest loss combined, including ranching, agriculture, and logging(13). Moreover, our rates of mine expansion, combining bothsmall and large mines, are about 40% higher than previousestimates for Madre de Dios. This information has not made itinto conservation, resource policy, or law enforcement circles,yet it is critical to multiple ongoing efforts to contain or combatillegal and unsustainable gold mining in the region.Although 50,000 ha of total loss in 13 y appears small on the
scale of other tropical regions undergoing deforestation or forestdegradation (e.g., refs. 14 and 15), Madre de Dios is world-renowned for its unusually high biological diversity. A singlehectare in the region undergoing gold mining harbors up to 300tree species, and many more floral and faunal inhabitants (6,16, 17). Average carbon stocks exceed 100 Mg C ha−1 (13), andthe density of top predators, like jaguars and large-bodied
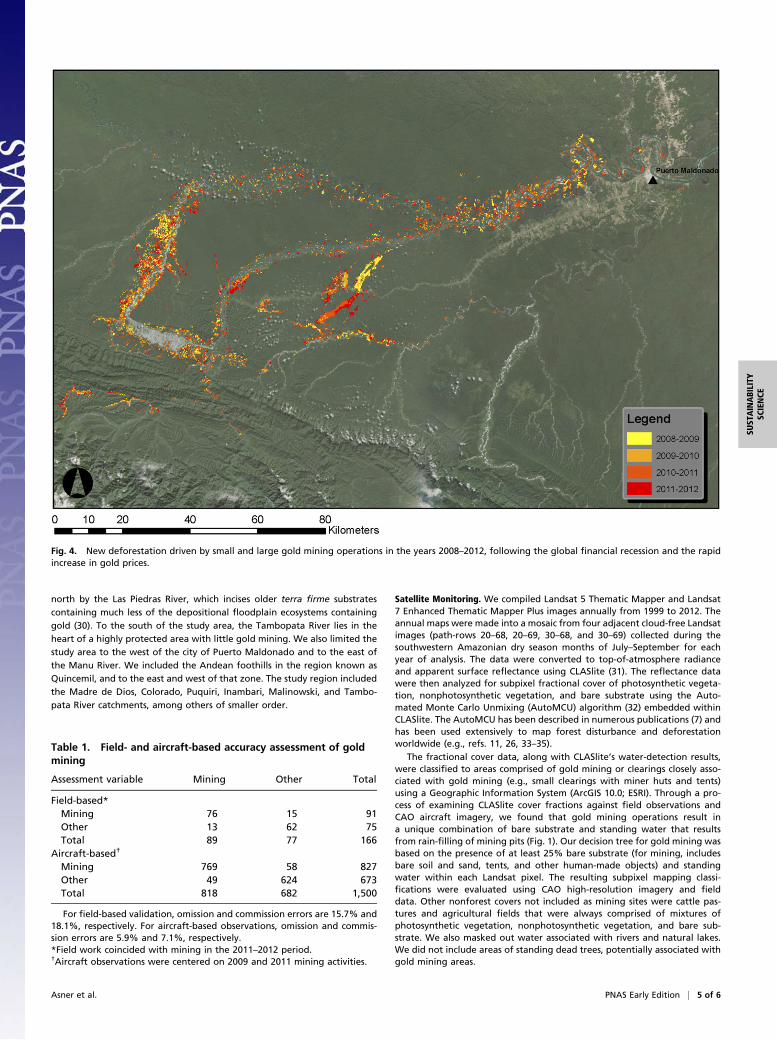
Fig. 2. The regional extent and occurrence of small and large mines throughout the southern Madre de Dios region. Note that many mines are closelysituated through time, and thus the color chart may not show the year of every mining event. See Figs. S1–S3 for detail. Location key: (i) Huepetuhe, (ii) Delta-1,(iii) Guacamayo. All other unlabeled mines are in the “small mine” category as described throughout the article.
Asner et al. PNAS Early Edition | 3 of 6
SUST
AINABILITY
SCIENCE
primates, is among the highest on Earth (18, 19). Whereas goldmining presents the direct impact on the forest canopy andsoils, other supporting land uses—ranching and agriculture—have increased near to mining areas (20), likely increasing thetotal regional deforestation rate associated with the Peruviangold rush. We did not account for these indirect land-use effects inthe study.Gold mining greatly increases sediment loads in rivers, dis-
rupting vast tracts of these critically important aquatic ecosys-tems (21). At this point in time we do not have sufficient data on
the downriver distances negatively affected by heavy sedimentloads from mining, but our visual estimates from aircraft suggestthat the effects persist for hundreds of kilometers, potentiallywell into Brazil. Recent quantitative work also shows verywidespread mercury pollution in air and waters throughoutMadre de Dios, negatively affecting the entire food chain andpeople far beyond the mining sites (22). Hunting is also widelyassociated with gold miners who search the forest for game meat,creating empty forests with impaired ecological function, po-tentially for centuries to come (23, 24). Additionally, we ob-served widespread tree mortality on the fringes of both small andlarge mines. Although we do not yet know the precise cause, wespeculate that mobilized sediments, anoxic or desiccating con-ditions, and perhaps heavy metals associated with the miningprocess, may be killing many more trees than is currently beingaccounted for in this study.Our results highlight the central role that high spatial and
temporal resolution monitoring must play to understand andaddress the gold mining problem in the Amazon basin and else-where. Without knowing the location and rate of expansion ofboth small and large mines, the ecological and societal impactscannot be accurately assessed. Here we found that the largestmines, easily observed from space, now play an increasinglysubordinate role in determining the rate and pattern of degra-dation and the subsequent dismantling of these high-diversitytropical forests. Methods using moderate-to-low resolution sat-ellite sensors originally designed for studies of the climate sys-tem, such as the National Aeronautics and Space Administration(NASA) Moderate Resolution Imaging Spectroradiometer, shouldnot be relied upon for monitoring the diffuse yet ubiquitous impactsof humans on tropical forests.Ironically, it is the original NASA series of satellites designed
specifically for land-cover change monitoring, Landsat, whichcurrently provides the best available method for monitoringforest degradation at the global scale. The launch of Landsat 8 in2013 provided a major boost to the global land-cover change andforest-monitoring communities, and the data are freely available.Despite this advance in preparedness with Landsat, we also haveoften found that simple classification approaches operating atthe whole-pixel scale fail to detect the diffuse canopy disturbancesthat lead to forest degradation. Whether the source is selectivelogging or understory fire (10, 25), and now smallholder goldmining shown here, newer approaches based on subpixel spectralmixture analysis of Landsat imagery yields high-fidelity maps thatcan be used by stakeholders to address the issue of degradation.Forest degradation, which has 20- to 30-times the global footprintin the tropics than does wholesale clear-cutting or deforestation(26), remains an important and accelerating form of forest changethroughout the tropics.Gold underlays vast regions of western Amazonian forests, but
it can also be found in many other tropical regions (e.g., refs. 27–29). The widely practiced techniques of gold extraction usingsurficial prospecting methods augmented with highly toxic mer-cury leads to proximal impacts on the environment, ranging frombiodiversity loss to enhanced carbon emissions, as well as distaleffects, such as adjacent forest mortality, defaunation, and pol-luted fisheries. The demand for gold will likely remain unabatedin the foreseeable future, leaving decision-makers with the im-mediate challenge of implementing containment and mitigationstrategies. Any potential long-term solutions will likely requiremuch more active law enforcement to protect tropical forestsand waterways, as well as a deemphasis on the use of gold as afinancial commodity.
MethodsStudy Region. We focused the study on the region of Madre de Dios, Peru inan area dominated by Holocene age alluvium containing the highest con-centrations of subsurface gold deposits (Fig. 2). This area is bounded on the
Fig. 3. (A) Confirmed and suspected deforestation caused directly by goldmining in the southern Madre de Dios region from 1999 to 2012. (B) Con-tribution of the three large mines compared with small mines from 1999 to2012. (C) Relative contribution of large and small mines to the total regionalmining footprint over time.
4 of 6 | www.pnas.org/cgi/doi/10.1073/pnas.1318271110 Asner et al.
north by the Las Piedras River, which incises older terra firme substratescontaining much less of the depositional floodplain ecosystems containinggold (30). To the south of the study area, the Tambopata River lies in theheart of a highly protected area with little gold mining. We also limited thestudy area to the west of the city of Puerto Maldonado and to the east ofthe Manu River. We included the Andean foothills in the region known asQuincemil, and to the east and west of that zone. The study region includedthe Madre de Dios, Colorado, Puquiri, Inambari, Malinowski, and Tambo-pata River catchments, among others of smaller order.
Satellite Monitoring. We compiled Landsat 5 Thematic Mapper and Landsat7 Enhanced Thematic Mapper Plus images annually from 1999 to 2012. Theannual maps were made into a mosaic from four adjacent cloud-free Landsatimages (path-rows 20–68, 20–69, 30–68, and 30–69) collected during thesouthwestern Amazonian dry season months of July–September for eachyear of analysis. The data were converted to top-of-atmosphere radianceand apparent surface reflectance using CLASlite (31). The reflectance datawere then analyzed for subpixel fractional cover of photosynthetic vegeta-tion, nonphotosynthetic vegetation, and bare substrate using the Auto-mated Monte Carlo Unmixing (AutoMCU) algorithm (32) embedded withinCLASlite. The AutoMCU has been described in numerous publications (7) andhas been used extensively to map forest disturbance and deforestationworldwide (e.g., refs. 11, 26, 33–35).
The fractional cover data, along with CLASlite’s water-detection results,were classified to areas comprised of gold mining or clearings closely asso-ciated with gold mining (e.g., small clearings with miner huts and tents)using a Geographic Information System (ArcGIS 10.0; ESRI). Through a pro-cess of examining CLASlite cover fractions against field observations andCAO aircraft imagery, we found that gold mining operations result ina unique combination of bare substrate and standing water that resultsfrom rain-filling of mining pits (Fig. 1). Our decision tree for gold mining wasbased on the presence of at least 25% bare substrate (for mining, includesbare soil and sand, tents, and other human-made objects) and standingwater within each Landsat pixel. The resulting subpixel mapping classi-fications were evaluated using CAO high-resolution imagery and fielddata. Other nonforest covers not included as mining sites were cattle pas-tures and agricultural fields that were always comprised of mixtures ofphotosynthetic vegetation, nonphotosynthetic vegetation, and bare sub-strate. We also masked out water associated with rivers and natural lakes.We did not include areas of standing dead trees, potentially associated withgold mining areas.
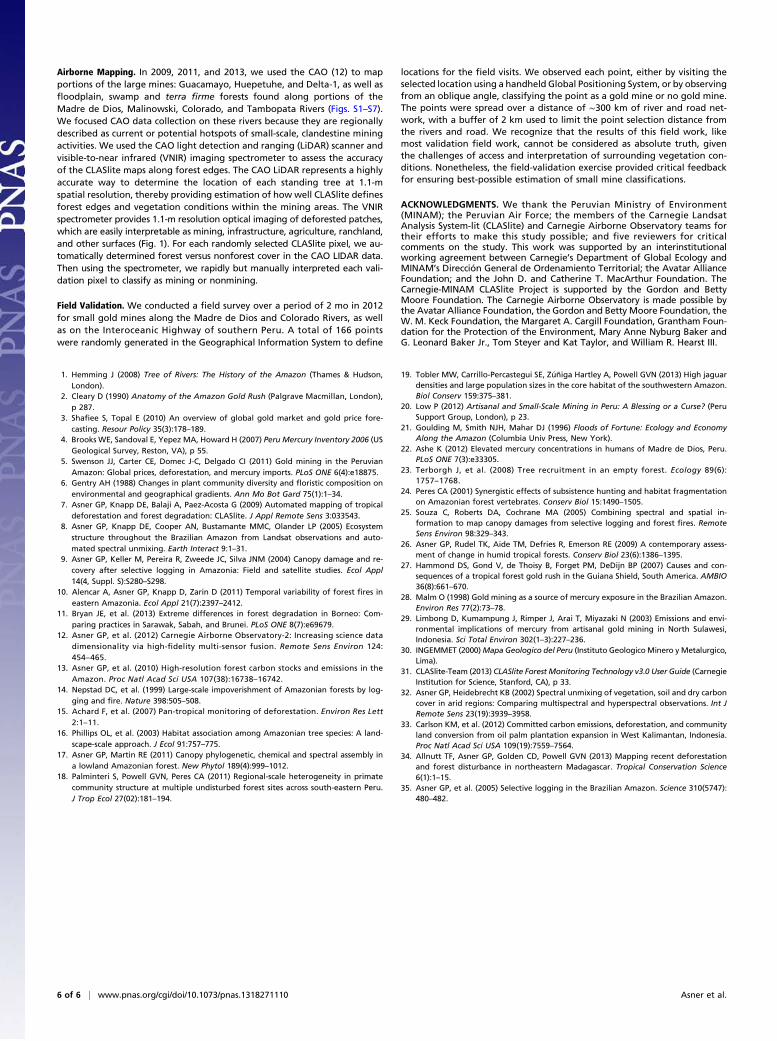
Fig. 4. New deforestation driven by small and large gold mining operations in the years 2008–2012, following the global financial recession and the rapidincrease in gold prices.
Table 1. Field- and aircraft-based accuracy assessment of goldmining
Assessment variable Mining Other Total
Field-based*Mining 76 15 91Other 13 62 75Total 89 77 166
Aircraft-based†
Mining 769 58 827Other 49 624 673Total 818 682 1,500
For field-based validation, omission and commission errors are 15.7% and18.1%, respectively. For aircraft-based observations, omission and commis-sion errors are 5.9% and 7.1%, respectively.*Field work coincided with mining in the 2011–2012 period.†Aircraft observations were centered on 2009 and 2011 mining activities.
Asner et al. PNAS Early Edition | 5 of 6
SUST
AINABILITY
SCIENCE
Airborne Mapping. In 2009, 2011, and 2013, we used the CAO (12) to mapportions of the large mines: Guacamayo, Huepetuhe, and Delta-1, as well asfloodplain, swamp and terra firme forests found along portions of theMadre de Dios, Malinowski, Colorado, and Tambopata Rivers (Figs. S1–S7).We focused CAO data collection on these rivers because they are regionallydescribed as current or potential hotspots of small-scale, clandestine miningactivities. We used the CAO light detection and ranging (LiDAR) scanner andvisible-to-near infrared (VNIR) imaging spectrometer to assess the accuracyof the CLASlite maps along forest edges. The CAO LiDAR represents a highlyaccurate way to determine the location of each standing tree at 1.1-mspatial resolution, thereby providing estimation of how well CLASlite definesforest edges and vegetation conditions within the mining areas. The VNIRspectrometer provides 1.1-m resolution optical imaging of deforested patches,which are easily interpretable as mining, infrastructure, agriculture, ranchland,and other surfaces (Fig. 1). For each randomly selected CLASlite pixel, we au-tomatically determined forest versus nonforest cover in the CAO LIDAR data.Then using the spectrometer, we rapidly but manually interpreted each vali-dation pixel to classify as mining or nonmining.
Field Validation. We conducted a field survey over a period of 2 mo in 2012for small gold mines along the Madre de Dios and Colorado Rivers, as wellas on the Interoceanic Highway of southern Peru. A total of 166 pointswere randomly generated in the Geographical Information System to define
locations for the field visits. We observed each point, either by visiting theselected location using a handheld Global Positioning System, or by observingfrom an oblique angle, classifying the point as a gold mine or no gold mine.The points were spread over a distance of ∼300 km of river and road net-work, with a buffer of 2 km used to limit the point selection distance fromthe rivers and road. We recognize that the results of this field work, likemost validation field work, cannot be considered as absolute truth, giventhe challenges of access and interpretation of surrounding vegetation con-ditions. Nonetheless, the field-validation exercise provided critical feedbackfor ensuring best-possible estimation of small mine classifications.
ACKNOWLEDGMENTS. We thank the Peruvian Ministry of Environment(MINAM); the Peruvian Air Force; the members of the Carnegie LandsatAnalysis System-lit (CLASlite) and Carnegie Airborne Observatory teams fortheir efforts to make this study possible; and five reviewers for criticalcomments on the study. This work was supported by an interinstitutionalworking agreement between Carnegie’s Department of Global Ecology andMINAM’s Dirección General de Ordenamiento Territorial; the Avatar AllianceFoundation; and the John D. and Catherine T. MacArthur Foundation. TheCarnegie-MINAM CLASlite Project is supported by the Gordon and BettyMoore Foundation. The Carnegie Airborne Observatory is made possible bythe Avatar Alliance Foundation, the Gordon and Betty Moore Foundation, theW. M. Keck Foundation, the Margaret A. Cargill Foundation, Grantham Foun-dation for the Protection of the Environment, Mary Anne Nyburg Baker andG. Leonard Baker Jr., Tom Steyer and Kat Taylor, and William R. Hearst III.
1. Hemming J (2008) Tree of Rivers: The History of the Amazon (Thames & Hudson,London).
2. Cleary D (1990) Anatomy of the Amazon Gold Rush (Palgrave Macmillan, London),p 287.
3. Shafiee S, Topal E (2010) An overview of global gold market and gold price fore-casting. Resour Policy 35(3):178–189.
4. Brooks WE, Sandoval E, Yepez MA, Howard H (2007) Peru Mercury Inventory 2006 (USGeological Survey, Reston, VA), p 55.
5. Swenson JJ, Carter CE, Domec J-C, Delgado CI (2011) Gold mining in the PeruvianAmazon: Global prices, deforestation, and mercury imports. PLoS ONE 6(4):e18875.
6. Gentry AH (1988) Changes in plant community diversity and floristic composition onenvironmental and geographical gradients. Ann Mo Bot Gard 75(1):1–34.
7. Asner GP, Knapp DE, Balaji A, Paez-Acosta G (2009) Automated mapping of tropicaldeforestation and forest degradation: CLASlite. J Appl Remote Sens 3:033543.
8. Asner GP, Knapp DE, Cooper AN, Bustamante MMC, Olander LP (2005) Ecosystemstructure throughout the Brazilian Amazon from Landsat observations and auto-mated spectral unmixing. Earth Interact 9:1–31.
9. Asner GP, Keller M, Pereira R, Zweede JC, Silva JNM (2004) Canopy damage and re-covery after selective logging in Amazonia: Field and satellite studies. Ecol Appl14(4, Suppl. S):S280–S298.
10. Alencar A, Asner GP, Knapp D, Zarin D (2011) Temporal variability of forest fires ineastern Amazonia. Ecol Appl 21(7):2397–2412.
11. Bryan JE, et al. (2013) Extreme differences in forest degradation in Borneo: Com-paring practices in Sarawak, Sabah, and Brunei. PLoS ONE 8(7):e69679.
12. Asner GP, et al. (2012) Carnegie Airborne Observatory-2: Increasing science datadimensionality via high-fidelity multi-sensor fusion. Remote Sens Environ 124:454–465.
13. Asner GP, et al. (2010) High-resolution forest carbon stocks and emissions in theAmazon. Proc Natl Acad Sci USA 107(38):16738–16742.
14. Nepstad DC, et al. (1999) Large-scale impoverishment of Amazonian forests by log-ging and fire. Nature 398:505–508.
15. Achard F, et al. (2007) Pan-tropical monitoring of deforestation. Environ Res Lett2:1–11.
16. Phillips OL, et al. (2003) Habitat association among Amazonian tree species: A land-scape-scale approach. J Ecol 91:757–775.
17. Asner GP, Martin RE (2011) Canopy phylogenetic, chemical and spectral assembly ina lowland Amazonian forest. New Phytol 189(4):999–1012.
18. Palminteri S, Powell GVN, Peres CA (2011) Regional-scale heterogeneity in primatecommunity structure at multiple undisturbed forest sites across south-eastern Peru.J Trop Ecol 27(02):181–194.
19. Tobler MW, Carrillo-Percastegui SE, Zúñiga Hartley A, Powell GVN (2013) High jaguardensities and large population sizes in the core habitat of the southwestern Amazon.Biol Conserv 159:375–381.
20. Low P (2012) Artisanal and Small-Scale Mining in Peru: A Blessing or a Curse? (PeruSupport Group, London), p 23.
21. Goulding M, Smith NJH, Mahar DJ (1996) Floods of Fortune: Ecology and EconomyAlong the Amazon (Columbia Univ Press, New York).
22. Ashe K (2012) Elevated mercury concentrations in humans of Madre de Dios, Peru.PLoS ONE 7(3):e33305.
23. Terborgh J, et al. (2008) Tree recruitment in an empty forest. Ecology 89(6):1757–1768.
24. Peres CA (2001) Synergistic effects of subsistence hunting and habitat fragmentationon Amazonian forest vertebrates. Conserv Biol 15:1490–1505.
25. Souza C, Roberts DA, Cochrane MA (2005) Combining spectral and spatial in-formation to map canopy damages from selective logging and forest fires. RemoteSens Environ 98:329–343.
26. Asner GP, Rudel TK, Aide TM, Defries R, Emerson RE (2009) A contemporary assess-ment of change in humid tropical forests. Conserv Biol 23(6):1386–1395.
27. Hammond DS, Gond V, de Thoisy B, Forget PM, DeDijn BP (2007) Causes and con-sequences of a tropical forest gold rush in the Guiana Shield, South America. AMBIO36(8):661–670.
28. Malm O (1998) Gold mining as a source of mercury exposure in the Brazilian Amazon.Environ Res 77(2):73–78.
29. Limbong D, Kumampung J, Rimper J, Arai T, Miyazaki N (2003) Emissions and envi-ronmental implications of mercury from artisanal gold mining in North Sulawesi,Indonesia. Sci Total Environ 302(1–3):227–236.
30. INGEMMET (2000)Mapa Geologico del Peru (Instituto GeologicoMinero y Metalurgico,Lima).
31. CLASlite-Team (2013) CLASlite Forest Monitoring Technology v3.0 User Guide (CarnegieInstitution for Science, Stanford, CA), p 33.
32. Asner GP, Heidebrecht KB (2002) Spectral unmixing of vegetation, soil and dry carboncover in arid regions: Comparing multispectral and hyperspectral observations. Int JRemote Sens 23(19):3939–3958.
33. Carlson KM, et al. (2012) Committed carbon emissions, deforestation, and communityland conversion from oil palm plantation expansion in West Kalimantan, Indonesia.Proc Natl Acad Sci USA 109(19):7559–7564.
34. Allnutt TF, Asner GP, Golden CD, Powell GVN (2013) Mapping recent deforestationand forest disturbance in northeastern Madagascar. Tropical Conservation Science6(1):1–15.
35. Asner GP, et al. (2005) Selective logging in the Brazilian Amazon. Science 310(5747):480–482.
6 of 6 | www.pnas.org/cgi/doi/10.1073/pnas.1318271110 Asner et al.