elevated ph values in groundwater - skb
TRANSCRIPT

SVENSK KÄRNBRÄNSLEHANTERING AB
SWEDISH NUCLEAR FUEL
AND WASTE MANAGEMENT CO
Box 250, SE-101 24 Stockholm
Phone +46 8 459 84 00
skb.se
SVENSK KÄRNBRÄNSLEHANTERING
Elevated pH values in groundwater
Observations from SKB investigations 1976–2014 and possible causes
Ann-Chatrin Nilsson
Bertil Sandberg
Report
R-16-04January 2017

Tänd ett lager: P, R eller TR.
Elevated pH values in groundwater
Observations from SKB investigations 1976–2014 and possible causes
Ann-Chatrin Nilsson, Geosigma AB
Bertil Sandberg, Swerea KIMAB
ISSN 1402-3091SKB R-16-04ID 1533841
January 2017
This report concerns a study which was conducted for Svensk Kärnbränslehantering AB (SKB). The conclusions and viewpoints presented in the report are those of the authors. SKB may draw modified conclusions, based on additional literature sources and/or expert opinions.
A pdf version of this document can be downloaded from www.skb.se.
© 2017 Svensk Kärnbränslehantering AB


SKB R-16-04 3
Abstract
Due to observations of some increased and surprisingly high pH values (> pH 10) in a number of the boreholes during the ongoing long term hydrochemical monitoring programme performed by the Swedish Nuclear Fuel and Waste Management Co (SKB) in Forsmark, a search for high pH values has been performed in the entire SKB database Sicada, independent of investigation site. A dataset including all high and moderately high pH values (≥ pH 8.7) has been extracted, resulting in 235 samples of which 51 samples originate from Forsmark and of which 25 samples measures pH values above 10. A few such values exists also from other SKB sites (17 from the Äspö Hard Rock Laboratory (HRL), 3 from the SFR repository for low and intermediate level waste and 1 from the borehole in the storage facility in the shipyard in Oskarshamn).
Seeing that pH is an important parameter which affects the entire groundwater composition, includ-ing such safety assessment issues as canister corrosion, sorption and dissolution of radionuclides it was important to investigate the occurrences of enhanced values and the possible causes. Since several of the measured pH values are outside the expected natural range (pH 6 to pH 10) this indicates artificial impacts. This range for pH is also an acceptance criterion for groundwater at a site for the repository for the spent fuel. However, the most alarming with the observed pH is the actual increases from expected natural values towards rather extreme values (> pH 10) and it was found necessary to understand also the processes that are working and their consequences.
Possible causes for these observations have therefore been investigated and the conclusion is that the increased pH of the Forsmark samples are most probably the result of stray currents causing corrosion on downhole equipment leading to pH increase close to the part of the equipment that acts as the cathodic side. Grout injection in close connection to sampling has been verified as a cause for many of the other samples, especially the ones from Äspö HRL. Furthermore, the pH of the included samples from Laxemar and the early study sites are presumably quite representative for the sampled groundwater since the general pH range is high and no extreme values have been measured.
The increase in pH in some of the Forsmark boreholes has, in turn, led to changed composition of the borehole section water. The consequences are decreased Mg2+, SiO4
4−, Mn2+ and Fe2+ ion concentrations while the alkalinity has increased. These impacts from the corrosion processes and of the protective measures taken in the affected boreholes may to some extent be compensated for by adequate purging prior to sampling to avoid significant contribution from borehole section water to the samples. However, even if sample series collected during continuous purging generally stabilises at reasonable pH values, the uncertainty in these values is rather high. It is still possible that a small and constant contribution of section water preserves a somewhat higher pH than would otherwise be the case. This is indicated by the fact that pH generally do not return to the initial lower values from the first investigations despite discharge of large volumes of water. Nevertheless, exclusion of affected boreholes from the current monitoring programme seems unwise. These boreholes needs further studies, however, special care has to be taken when purging the borehole section and when evaluating the data to facilitate the subsequent interpretations.
4 SKB R-16-04
Sammanfattning
Observationer av ökande och förvånansvärt höga pH-värden (> pH 10) i ett antal borrhål som ingår i Svensk Kärnbränslehanterings (SKB’s) långsiktiga hydrokemiska övervakningsprogram i Forsmark har förorsakat en sökning av höga pH värden i hela SKB’s databas Sicada, oberoende av undersökn-ingsplats. Ett dataset som inkluderar alla höga pH-värden (≥ pH 8.7) har sökts ut, vilket resulterade i 235 prov av vilka 51 stycken kommer från Forsmark och 25 av dessa mäter värden över pH 10. Några sådana värden förekommer också från andra undersökningsområden (17 från Äspö Hard Rock Laboratory (HRL), 3 från SFR förvaret för låg och medelaktivt avfall och ett prov från borrhålet i SKB’s instrumentförråd i hamnen i Oskarshamn).
Eftersom pH är en viktig parameter som påverkar hela grundvattensammansättningen och i sin tur säkerhetsanalysfrågor som kapselkorrosion samt sorption och upplösning av radionuklider, var det viktigt att undersöka förekomsterna av förhöjda värden och möjliga orsaker. Flera av de mätta värdena ligger utanför det förväntade naturliga pH-intervallet (pH 6 till pH 10) vilket indikerar arti-ficiell påverkan. Detta pH-intervall är också ett acceptanskriterium för grundvatten vid ett förvar för kärnbränsleavfall. Det mest alarmerande med dessa observerade pH är dock de faktiska ökningarna från förväntade naturliga värden mot ganska extrema värden. Därför bedömdes det nödvändigt att också förstå processerna som pågår och deras konsekvenser.
Möjliga orsaker till observationerna undersökts och slutsatsen är att de förhöjda pH-värdena i Forsmarksproven är ett resultat av jordströmmar som orsakar korrosion på borrhålsutrustning vilket leder till pH-förhöjning vid de delar av utrustningen som fungerar som katod. Injektering med cementbaserade injekteringsmedel i nära anslutning till provtagningen har verifierats som orsak i flera andra fall, speciellt i proven från Äspö HRL. Vidare kan det antas att förhöjda pH i Laxemarproven och de tidiga undersökningsområdena förmodligen är representativa för det provtagna grundvattnet eftersom den generella pH-nivån är hög i dessa fall och inga extremvärden har noterats.
De förhöjda pH värdena i vissa av borrhålen i Forsmark har i sin tur lett till förändringar i vatten-sammansättningen i själva borrhålssektionerna. Konsekvenserna är minskade Mg2+, SiO4
4−, Mn2+ och Fe2+ koncentrationer medan alkaliniteten ökar. Denna inverkan från korrosionsprocesser eller skyddsåtgärder för att förhindra korrosion (katodskydd) i de påverkade borrhålen kan i viss mån kompenseras för genom tillräcklig omsättning av vatten innan provtagningen och därmed minskad inblandningen av sektionsvatten i proven. Dock ökar osäkerheten i värdena trots att provserier tagna under kontinuerlig omsättning ofta stabiliserar sig på en rimlig nivå. Det är fortfarande möjligt att ett litet men konstant bidrag av sektionsvatten håller pH något högre än vad som annars skulle vara fallet. Detta indikeras av att pH oftast inte sjunker till samma värden som vid de första undersök-ningarna trots omsättning av stora volymer vatten. Trots detta, rekommenderas inte att de påverkade borrhålen utesluts från det pågående övervakningsprogrammet. Fortsatta studier är nödvändiga men det krävs noggrann dokumentation när det gäller omsatta volymer och det är viktigt att information förs vidare vid utvärdering av data för att möjliggöra vidare tolkning och modellering.

SKB R-16-04 5
Contents
1 Introduction 71.1 General 71.2 Explanation of terms and abbreviations 8
2 The dataset and the sources of information 92.1 General 92.2 pH measurement methods 92.3 Distribution of pH values 102.4 Sources of information on grouting 11
3 Observations of high pH values in Forsmark 133.1 General 133.2 Stray currents, corrosion and resulting impacts on pH 14
3.2.1 Stray current situation in Forsmark 143.2.2 Stray current effects on fixed borehole installations 163.2.3 Enhanced pH by corrosion or cathodic corrosion protection 183.2.4 Corrosion damages on instrumentation in stand pipes 193.2.5 Corrosion on down-hole equipment used during CCC 22
3.3 Observations in boreholes KFM06A and KFM06C 243.4 Observations in borehole KFM07A 303.5 Observations in borehole KFM08A 353.6 Observations in borehole KFM08D 403.7 pH development in other boreholes in Forsmark 473.8 Discussion 48
4 Observations of high pH values at other sites 514.1 The SFR Boreholes 514.2 The Laxemar boreholes (PLU and subsequent monitoring phase) 514.3 The Äspö HRL boreholes and measurement weirs 524.4 The boreholes HAV10 and KOV01 (at Ävrö and in Oskarshamn) 574.5 The SKB study site programme 1976 to 1986 57
5 Summary and conclusions 595.1 Forsmark 595.2 Other sites 60
References 61


SKB R-16-04 7
1 Introduction
1.1 GeneralHigh pH values have become an issue in Forsmark since increased and surprisingly high values (pH > 10) have been measured in the ongoing hydrochemical monitoring program. Occurrences of single or repeated high pH values in groundwater have been observed sporadically also at other sampling locations and in different hydrogeochemical investigations performed by SKB since the mid-seventies. In this context the concept “high” pH is stretched to include measurements above 8.7; the choice of this cut-off value is justified in Section 2.3. The objectives of the present report is to go through all observations of high pH values reported in SKB’s database Sicada, independent of investigation site, and check for possible causes for these observations in each special case.
Since several boreholes studied in Forsmark (“high pH boreholes”) show not only a few outstand-ingly high values but also a general increase in pH between the first hydrogeochemical investiga-tions and the later monitoring programme, a check was also made to see if this increasing trend is present also for the other core drilled boreholes in Forsmark where pH do not reach the high values (≥ 8.7).
The natural pH in groundwater is very seldom below 6 or above 9.5, see Figure 2-1, and values above 10 certainly need further investigation to find an explanation since they indicate artificial impacts. Furthermore, the criterion for the groundwater at a site for a repository for nuclear waste is that pH should be within the range pH 6 to pH 10 (Andersson et al. 2000). This criterion is mainly based on that the available sorption parameters (Kd) used in safety assessments are valid within this range and the thermodynamic database, otherwise, will need complementary additions outside this range. However, the most alarming is not the actual high values but rather the want of knowledge about the processes causing the values.
Contamination from cement products is generally the most probable cause for elevated pH values since cement is used in several contexts in connection with the drilling of – and the installations in boreholes as well as for tunnel construction. The usual measures taken to reduce groundwater flow or to stabilise borehole walls is grouting whereas shotcreting mainly is used for securing tunnel stability. The overall effect from grout injection on the groundwater composition is of interest in the long term safety assessment for the deep repository for nuclear waste. The use of cement products and where it is documented is presented in Section 2.4.
Besides cement, corrosion of equipment in boreholes may also cause elevated pH values (Rosdahl et al. 2011) since an excessive alkalinity always occurs at the cathode surface in a corrosion cell. Stray current effects and observations of corrosion in different contexts are further described in Section 3.2.

8 SKB R-16-04
1.2 Explanation of terms and abbreviations Some special terms and abbreviations that are used in the report are explained in the following list:
CCC Complete hydrochemical characterisation (sampling method) which implies use of temporary borehole equipment staying in the borehole for a few weeks.
Cement The main component of concrete, acts as paste binder.
Chemmac measurement Measurements performed on-line using the Chemmac measurement system (Bore-hole chemmac probe and/or Surface chemmac measurement cell).
Concrete Aggregate, cement and water
Fenno-Skan cable The designation of the high voltage direct transmission between Dannebo close to Forsmark in Sweden and Rauma in Finland.
Formation water Water directly from the fracture system in the bedrock formation, in contrast to section water that has been staying in the borehole section.
Gap injection In this report; grouting to seal the space between the casing and the borehole wall.
Grout Grout use finer components than standard concrete as additives and additions and is injected in open fractures or used for gap injection.
Hydrogeochemical monitoring Regular sampling programme in boreholes/borehole sections equipped with fixed packer installations staying there for several years.
masl Metre above sea level
mbl Metre borehole length measured from Top Of Casing (TOC)
PHB, PHY, Chemmac measurements of pH in situ and at the ground surface, respectively.
PHB sel., PHY sel. Selected values from long sequences (> 3 weeks) of Chemmac measurements of pH in situ and at the ground surface, respectively.
pH-F Field measurement of pH at the prevailing water temperature.
pH-L Laboratory measurement of pH at 25° C. Delay between sampling and measurement of max. 14 h.
PLU Site investigations in Forsmark and Laxemar (Platsundersökningar).
Shotcrete “sprutbetong” A mixture of cement, sand and fine aggregate concrete that is applied pneumatically. Additives are used to enhance the workability (organic polymers). Shotcrete is used for securing tunnel stability.
Sicada SKB’s Site Activity Database for storage of primary data.
Silica Sol Amorphous silica particles in water solution. Forms a gel when mixed with a salt solution. For injection in very thin fractures.
Standpipe Or water level pipe. Pipe connected to borehole section via tubing and used for water level measurement and/or pumping for groundwater sampling.
Section water Water present in the borehole section.
Stray current Current with unknown or unexpected origin, interfering with the construction, i.e. electricity flow via buildings, ground or equipment due to electrical supply system imbalances or wiring flaws. It refers to an existence of electrical potential that can be found between objects that should not be subjected to voltage.
Telescopic borehole A borehole of the so called telescopic type comprise a percussion drilled first part (approximately 100 m) with a diameter of about 200–250 mm, followed subsequently by a core drilled hole (often to around 1 000 m depth) with a diameter of approxi-mately 76–77 mm.

SKB R-16-04 9
2 The dataset and the sources of information
2.1 GeneralThe dataset to be evaluated was extracted from the SKB database Sicada (Sicada _15_048) the 17th of June, 2015. The database search included all samples with pH values (measured in the laboratory and/or in the field) exceeding 8.7 independent of SKB investigation site. The search resulted in 235 data records covering the period 1976-2014 including data from repeated complete chemical characterization (CCC) in KFM08D (September–December 2013). The totally 235 samples with pH ≥ 8.7 in the SKB database Sicada include:
• 51 samples from hydrogeochemical monitoring in Forsmark (2007–2014),
• 11 samples from CCC in KFM08D in September-December 2013,
• 36 samples from Laxemar (PLU and hydrogeochemical monitoring (2004–2011),
• 34 samples from Äspö HRL (1991–2011),
• 4 samples from the construction phase of the SFR (1986),
• 1 sample from Ävrö (2003),
• 1 sample from investigations in borehole KOV01 (the Oskarshamn harbor),
• 97 samples from the early SKB study sites (1976–1986).
Each group will be described and causes for the enhanced values will be proposed in the following Chapters 3 and 4.
2.2 pH measurement methodsGenerally, pH measurements are performed:
• in the laboratory at 25 °C (pH-L),
• online in a flow through cell (Chemmac, CCC) at the ground surface where the temperature is close to the temperature in the borehole section (PHY) and the pressure is around 2 bar,
• in situ (Chemmac, CCC) at the prevailing temperature and pressure in the borehole section (PHB), and
• in the field (pH-F) in a simple flow through cell and using a standard field pH-meter at the prevailing temperature in the groundwater at the ground surface and at atmospheric pressure.
There are 1889 samples (most of them from the monitoring programme) with values from both the field (pH-F) and the laboratory (pH-L). Disagreement between different types of pH measurements for the same water sample may be due to loss or uptake of CO2 and/or temperature effects (Gimeno et al. 2011). The pH data do not generally reveal a clear pattern between the different measurement methods but the lowest pH values most often originate from the laboratory measurements in batch samples at 25 centigrade. This may be due to the fact that the groundwaters have a P(CO2) that is close to or slightly less than atmospheric and the pH of the samples decreases due to CO2 uptake during the few hours of storage. Table 2-1 presents the different pH datasets.

10 SKB R-16-04
Table 2-1. Statistic information for pH datasets from different measurement methods (SKB, Sicada 1976–2014)
pH measured in the laboratory (pH-L)
pH measured in the field (pH-F)
Chemmac (PHB sel.)
Chemmac (PHY sel.)
No. of samples 7 320 1 889 44 41Average value 7.62 7.67 7.87 7.87Min 4.70 3.65 6.83 6.93Max 11.70 11.07 8.90 8.901 st quartile 7.39 7.44 – –Median 7.55 7.66 8.00 8.003 rd quartile 7.87 7.91 – –Percent < 8.7 97 96 – –
The Chemmac data (PHB and PHY) were not included in the search for pH values ≥ 8.7 since they are relatively few. Furthermore, this latter dataset does not include any really high values except for borehole KFM08D in 2013 and they are generally consistent with the corresponding pH-L data. Field measurements and laboratory measurements are compared in the diagrams showing the trends with time from the monitoring programme in Forsmark (Figures 3-15, 3-16, 3-21, 3-26 and 3-31). The field measurements are much scarcer than the laboratory ones, especially for samples collected before 2006.
2.3 Distribution of pH values Figure 2-1 displays the distribution of pH values (pH-L) stored in the database Sicada at the 6th of July 2014. The pH range < 8.7 covers 97 % of the totally 7 320 recorded pH-L measurements. The present report treats samples with a pH of 8.7 or higher. This limit was found reasonable mainly because it gives a suitable number of data to treat and possibly enhanced values around the extreme values will be included. As many as 46 samples show values also over pH 10.
Figure 2-1. Distribution of pH values (laboratory measurements).
0
200
400
600
800
1000
1200
4.0 5.0 6.0 7.0 8.0 9.0 10.0 11.0 12.0
No.
of o
bser
vatio
ns
pH
SKB R-16-04 11
As can be seen from the diagram, there are also pH values below pH 6 (8 values). Some of these values may be due to erroneous measurements but it is also possible that they are caused by contamination from meteoric water (melt-water, precipitation) or acid fume (from sample bottles prepared with acid). Also effects from too long time delay between sampling and measurements have been suggested in the comments to the data in Sicada for many of the low pH samples. The reason would then be oxygen diffusion through the bottle material, resulting in oxidation of dissolved Fe2+ and precipitation of Fe(OH)3(s), giving an acidifying effect.
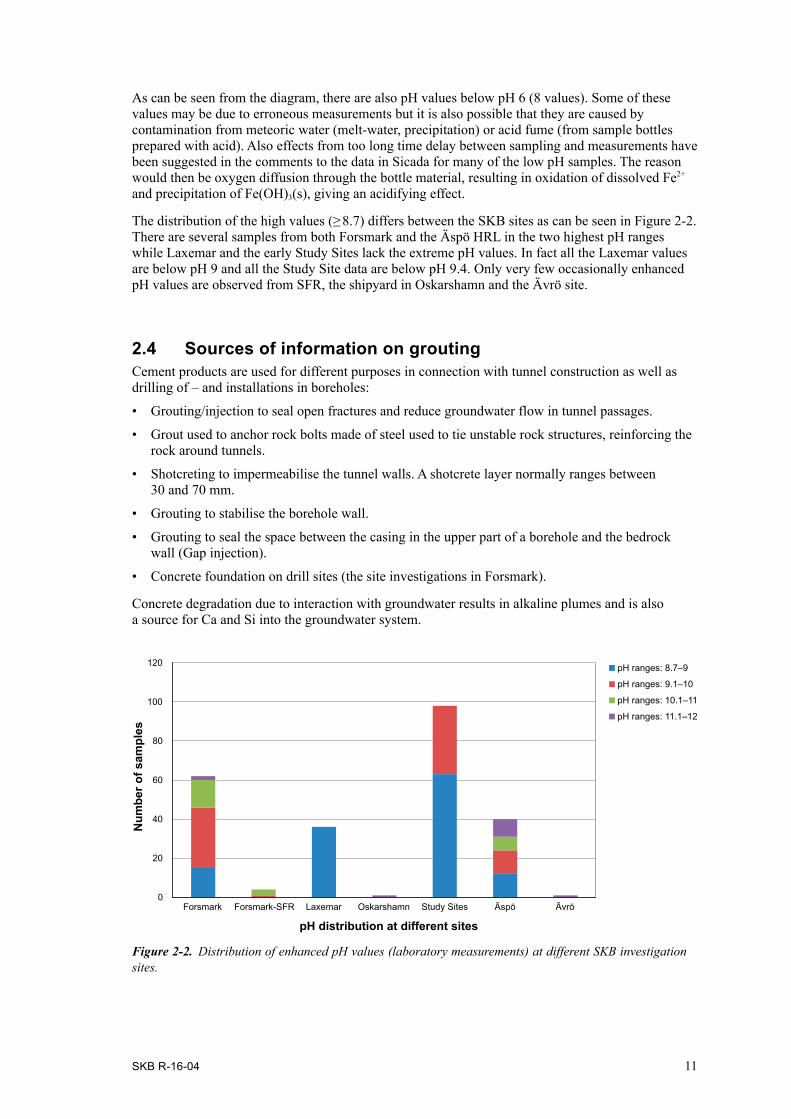
The distribution of the high values (≥ 8.7) differs between the SKB sites as can be seen in Figure 2-2. There are several samples from both Forsmark and the Äspö HRL in the two highest pH ranges while Laxemar and the early Study Sites lack the extreme pH values. In fact all the Laxemar values are below pH 9 and all the Study Site data are below pH 9.4. Only very few occasionally enhanced pH values are observed from SFR, the shipyard in Oskarshamn and the Ävrö site.
2.4 Sources of information on groutingCement products are used for different purposes in connection with tunnel construction as well as drilling of – and installations in boreholes:
• Grouting/injection to seal open fractures and reduce groundwater flow in tunnel passages.
• Grout used to anchor rock bolts made of steel used to tie unstable rock structures, reinforcing the rock around tunnels.
• Shotcreting to impermeabilise the tunnel walls. A shotcrete layer normally ranges between 30 and 70 mm.
• Grouting to stabilise the borehole wall.
• Grouting to seal the space between the casing in the upper part of a borehole and the bedrock wall (Gap injection).
• Concrete foundation on drill sites (the site investigations in Forsmark).
Concrete degradation due to interaction with groundwater results in alkaline plumes and is also a source for Ca and Si into the groundwater system.
Figure 2-2. Distribution of enhanced pH values (laboratory measurements) at different SKB investigation sites.
0
20
40
60
80
100
120
Forsmark Forsmark-SFR Laxemar Oskarshamn Study Sites Äspö Ävrö
Num
ber o
f sam
ples
pH distribution at different sites
pH ranges: 8.7–9
pH ranges: 9.1–10
pH ranges: 10.1–11
pH ranges: 11.1–12

12 SKB R-16-04
Grouting to seal the space between the casing and the borehole wall was conducted in all telescopic boreholes i.e. the standard type of core drilled boreholes within the site investigations (PLU), Laxemar, Äspö, Forsmark, etc. In most boreholes the normal length of the casing was around 12 m. However, longer casings were used in boreholes with large inflow or an unstable borehole wall like the boreholes KFM07A (100 m), KFM08A (100 m) and KFM08D (59 m) in Forsmark.
Since there are several boreholes at each drill site, the total amount of cement used in a limited rock volume may be quite large. A list of the amount of cement used at each drill site in Forsmark is given below as an example (from drilling field notes 2012).
Drill site Cement (kg)
Drill site Cement (kg)
DS1 8 886 DS7 7 443DS2 6 433 DS8 5 190DS3 765 DS9 3 038DS4 6 089 DS10 3 024DS5 5 819 DS11 1 152DS6 13 895 DS12 1 394
The sources of information on the use of cement products that could have affected the pH in each separate case/sample were:
• Activity comments to sampling activities in the database Sicada.
• The different kinds of grouting activities recorded in Sicada for the boreholes in question or for different tunnel sections (Äspö HRL).
• P-reports treating drilling of the boreholes and differential flow logging.
• P-reports from CCC investigations and from subsequent hydrogeochemical monitoring.
• Internal SKB progress reports (PR 25-92-18, PR 25-92-18c) from the construction of the Äspö HRL (not public).
• Internal SKB information from the ongoing Äspö extension project.

SKB R-16-04 13
3 Observations of high pH values in Forsmark
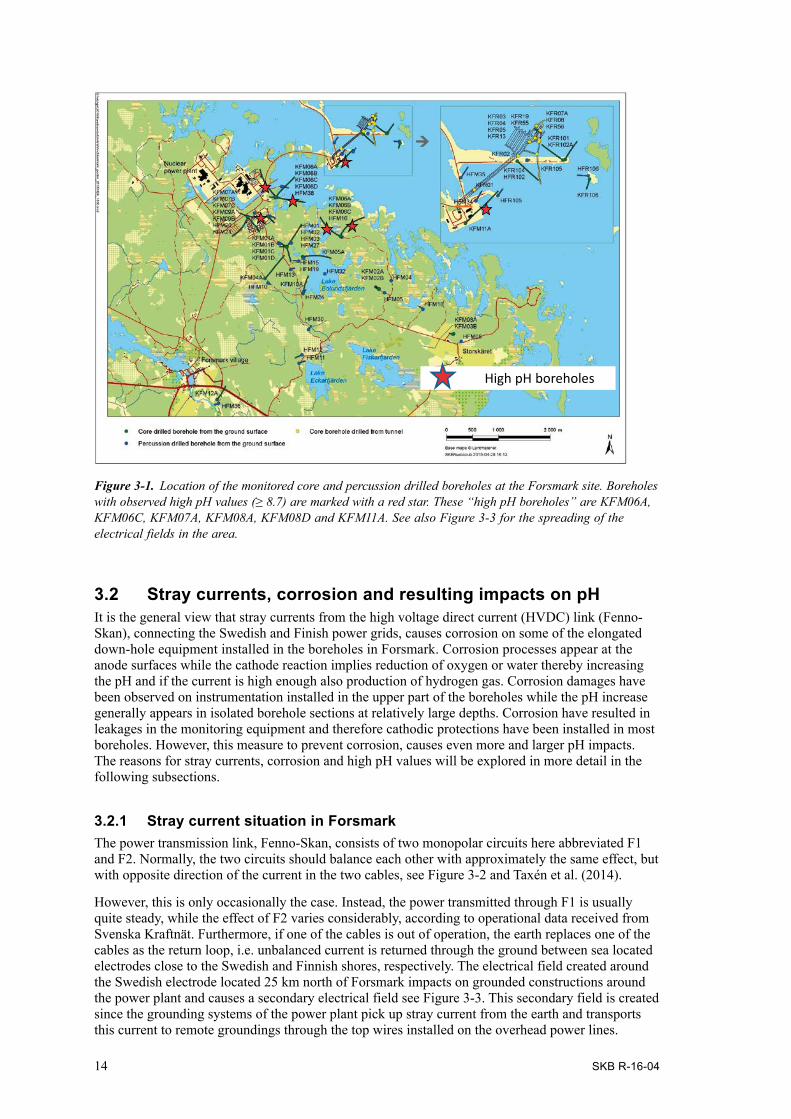
3.1 GeneralThe number of monitored boreholes/borehole sections in Forsmark with observed high pH values (pH ≥ 8.7) has gradually increased since the first observation in KFM07A year 2007. The latest borehole to show this behavior is KFM11A. The boreholes and the affected borehole sections in question are listed and commented on in Table 3-1 and the borehole locations are marked on the map in Figure 3-1. All the observations have been made in boreholes situated in the north-eastern part of the site close to the nuclear power plants and at relatively large depths (elevation −527 to −796 masl).
In most of the “high pH boreholes”, more detailed hydrochemical investigations (CCC) have been conducted earlier prior to the monitoring period, without any high pH observations. Furthermore, the high pH observations are typically accompanied by pumping problems during sampling due to released gas in the pump. This indicates hydrogen gas development caused by corrosion processes. Since corrosion damages have been observed on the upper parts of the borehole equipment in the impacted boreholes it is obvious that the pH effect might be an attendant question. Impacts from the Fenno-Skan current link between Sweden and Finland as well as related corrosion and high pH effects are discussed in Section 3.2. Besides the “high pH boreholes” only one of the other boreholes from the ground surface at the Forsmark site (KFM01A) shows a slightly increasing pH trend cf. Section 3.7.
In borehole KFM08D (marked on the map) repeated CCC investigations have been conducted during October–December 2013, after a six year period of monitoring and some observations of high pH values as well as corrosion on the equipment. In the same way as during the monitoring period and in contrast to the first CCC occasion, high pH values were observed also this time. Furthermore, corrosion appeared on the CCC equipment and high hydrogen gas contents were verified by gas analyses, see Section 3.6.
Generally, there are samples with complete sets of data (CCC) from practically the same borehole sections before the monitoring and the observations of the enhanced pH values. This offers possibili-ties to explore the changes with time as well as comparing measurements with and without installed monitoring equipment. The detailed chemistry at different pH values is compared and the trend with time are displayed for the different boreholes in the figures of Sections 3.3 to 3.7. As can be seen, the increases in pH, in turn, has led to attendant reactions, i.e. precipitation of Ca, Mg, Si, Mn and Fe as Calcite, Mg(OH)2, amorphous silica as well as Mn and Fe bearing phases. The special situations causing the enhanced pH values in each borehole are discussed in Section 3.8.
Table 3-1. Borehole sections with observations of high pH values in Forsmark.
IDCODE SECUP mbl
SECLOW mbl
Elev.-secmid** masl
Initial pH range
Date of first high value*
Max. observed value
Comment
KFM06A 738.00 748.00 −622.8 7.5 2012-05-09 9.28
KFM06C 647.00 666.00 −527.0 7.6 2013-05-29 8.80 Two high values (Figure 3-3)
KFM07A 963.00 972.00 −795.6 7.4–8.1 2007-10-26 10.70
KFM08A 684.00 694.00 −550.6 6.8–8.0 2008-01-22 10.53
KFM08D 660.00 680.00 −538.1 8.4 2009-04-28 8.82 One single high value
KFM08D 669.70 676.84 −540.6 7.2–8.4 2013-09-24 11.30 CCC
KFM08D 825.00 835.00 −662.6 8.1 2009-04-30 10.7 Section omitted 2010–2011
KFM08D 829.13 834.80 −664.1 6.8–7.2 2013-09-25 10.2 CCC
KFM11A 690.00 710.00 −593.8 7.1–7.8 2012-05-21 8.84 Higher values in 2015
* First value ≥ 8.7, ** Elev.-secmid = Elevation (masl) at the mid-point of the borehole section
14 SKB R-16-04
3.2 Stray currents, corrosion and resulting impacts on pHIt is the general view that stray currents from the high voltage direct current (HVDC) link (Fenno-Skan), connecting the Swedish and Finish power grids, causes corrosion on some of the elongated down-hole equipment installed in the boreholes in Forsmark. Corrosion processes appear at the anode surfaces while the cathode reaction implies reduction of oxygen or water thereby increasing the pH and if the current is high enough also production of hydrogen gas. Corrosion damages have been observed on instrumentation installed in the upper part of the boreholes while the pH increase generally appears in isolated borehole sections at relatively large depths. Corrosion have resulted in leakages in the monitoring equipment and therefore cathodic protections have been installed in most boreholes. However, this measure to prevent corrosion, causes even more and larger pH impacts. The reasons for stray currents, corrosion and high pH values will be explored in more detail in the following subsections.
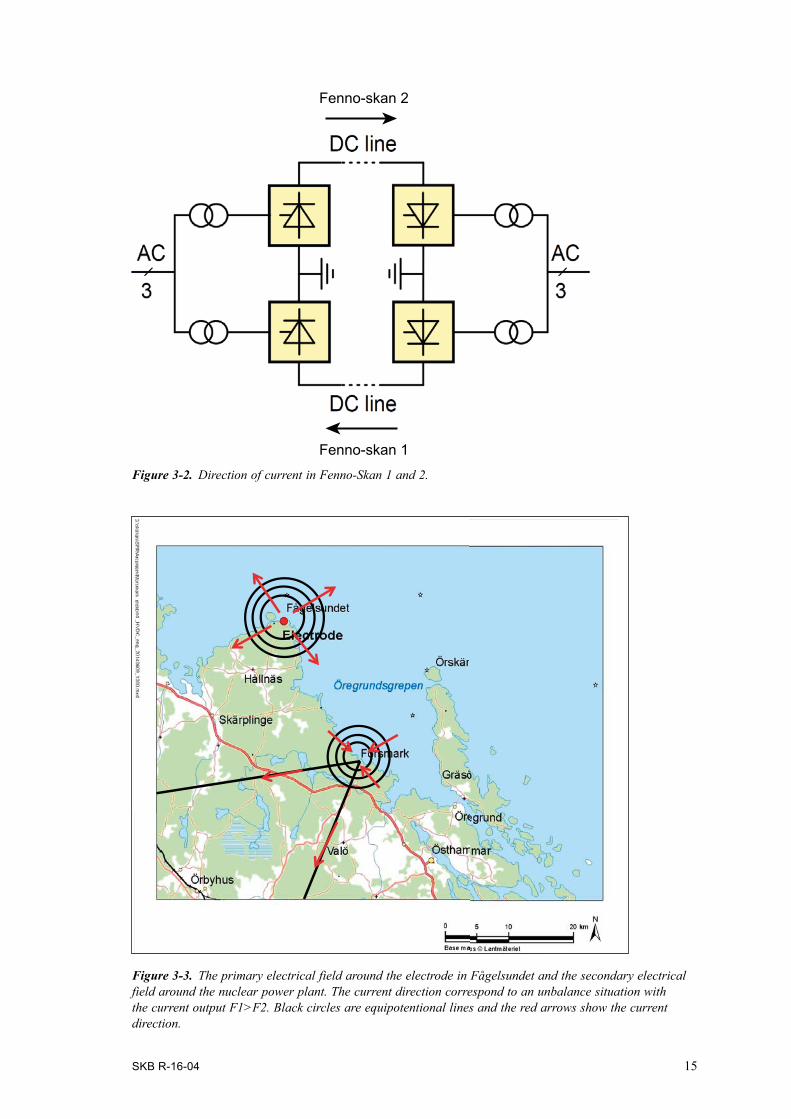
3.2.1 Stray current situation in ForsmarkThe power transmission link, Fenno-Skan, consists of two monopolar circuits here abbreviated F1 and F2. Normally, the two circuits should balance each other with approximately the same effect, but with opposite direction of the current in the two cables, see Figure 3-2 and Taxén et al. (2014).
However, this is only occasionally the case. Instead, the power transmitted through F1 is usually quite steady, while the effect of F2 varies considerably, according to operational data received from Svenska Kraftnät. Furthermore, if one of the cables is out of operation, the earth replaces one of the cables as the return loop, i.e. unbalanced current is returned through the ground between sea located electrodes close to the Swedish and Finnish shores, respectively. The electrical field created around the Swedish electrode located 25 km north of Forsmark impacts on grounded constructions around the power plant and causes a secondary electrical field see Figure 3-3. This secondary field is created since the grounding systems of the power plant pick up stray current from the earth and transports this current to remote groundings through the top wires installed on the overhead power lines.
Figure 3-1. Location of the monitored core and percussion drilled boreholes at the Forsmark site. Boreholes with observed high pH values (≥ 8.7) are marked with a red star. These “high pH boreholes” are KFM06A, KFM06C, KFM07A, KFM08A, KFM08D and KFM11A. See also Figure 3-3 for the spreading of the electrical fields in the area.
High pH boreholes
SKB R-16-04 15
Fenno-skan 1
Fenno-skan 2
Figure 3-2. Direction of current in Fenno-Skan 1 and 2.
Figure 3-3. The primary electrical field around the electrode in Fågelsundet and the secondary electrical field around the nuclear power plant. The current direction correspond to an unbalance situation with the current output F1>F2. Black circles are equipotentional lines and the red arrows show the current direction.
16 SKB R-16-04
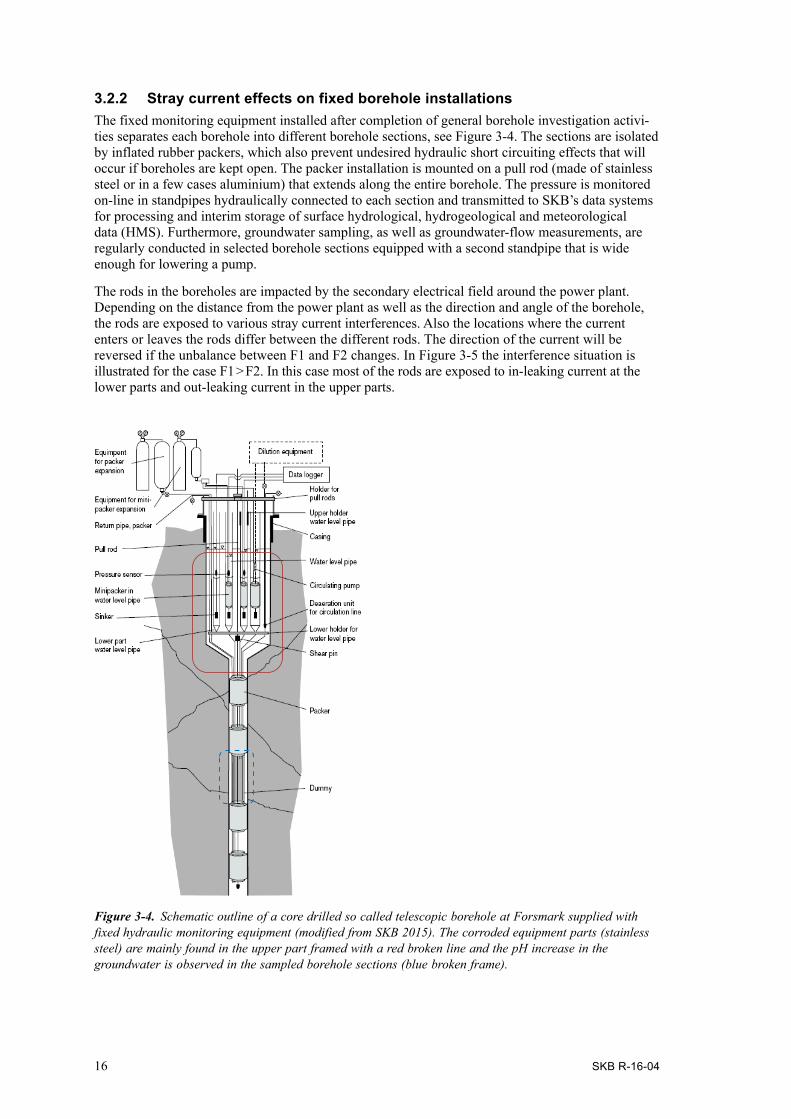
3.2.2 Stray current effects on fixed borehole installations The fixed monitoring equipment installed after completion of general borehole investigation activi-ties separates each borehole into different borehole sections, see Figure 3-4. The sections are isolated by inflated rubber packers, which also prevent undesired hydraulic short circuiting effects that will occur if boreholes are kept open. The packer installation is mounted on a pull rod (made of stainless steel or in a few cases aluminium) that extends along the entire borehole. The pressure is monitored on-line in standpipes hydraulically connected to each section and transmitted to SKB’s data systems for processing and interim storage of surface hydrological, hydrogeological and meteorological data (HMS). Furthermore, groundwater sampling, as well as groundwater-flow measurements, are regularly conducted in selected borehole sections equipped with a second standpipe that is wide enough for lowering a pump.
The rods in the boreholes are impacted by the secondary electrical field around the power plant. Depending on the distance from the power plant as well as the direction and angle of the borehole, the rods are exposed to various stray current interferences. Also the locations where the current enters or leaves the rods differ between the different rods. The direction of the current will be reversed if the unbalance between F1 and F2 changes. In Figure 3-5 the interference situation is illustrated for the case F1 > F2. In this case most of the rods are exposed to in-leaking current at the lower parts and out-leaking current in the upper parts.
Figure 3-4. Schematic outline of a core drilled so called telescopic borehole at Forsmark supplied with fixed hydraulic monitoring equipment (modified from SKB 2015). The corroded equipment parts (stainless steel) are mainly found in the upper part framed with a red broken line and the pH increase in the groundwater is observed in the sampled borehole sections (blue broken frame).
SKB R-16-04 17
Cathodic protection systems were installed in most boreholes 2010 when F2 was not yet in opera-tion. The protection currents were adjusted to counteract the out-leaking current in the upper part of the rods. In December 2011, F2 was taken into operation. This offered also the possibility of F2 > F1. Such a situation implies that the direction of the stray current will be the opposite, with in-leaking current into the upper part. The protective currents were however not changed to counteract the out-leaking current in the lower parts of the rod. Control of the effect of the protection is done by potential measurements and these can only be performed at the surface, therefore the level of protec-tion at depth can only be estimated. After 2012 it has been more common that F2 dominates over F1 than the opposite. This implies that the upper parts of the rods have been over-protected more often than having the desired level of protection.
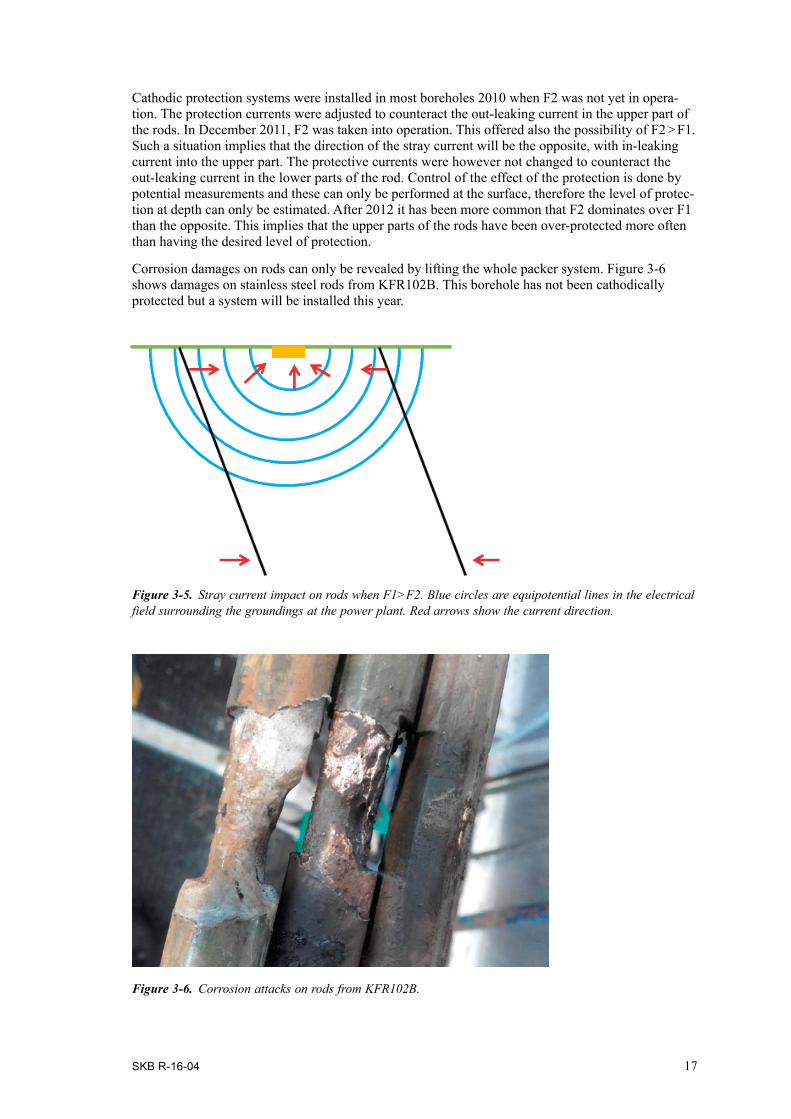
Corrosion damages on rods can only be revealed by lifting the whole packer system. Figure 3-6 shows damages on stainless steel rods from KFR102B. This borehole has not been cathodically protected but a system will be installed this year.
Figure 3-6. Corrosion attacks on rods from KFR102B.
Figure 3-5. Stray current impact on rods when F1>F2. Blue circles are equipotential lines in the electrical field surrounding the groundings at the power plant. Red arrows show the current direction.
18 SKB R-16-04
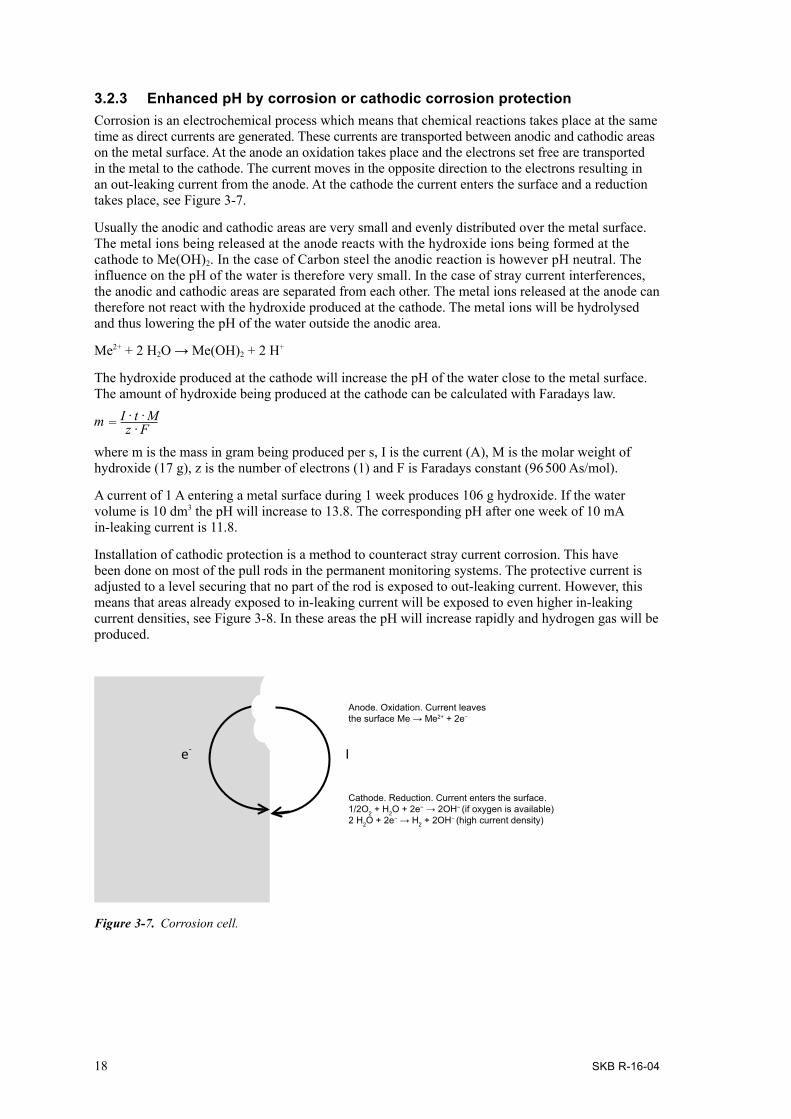
3.2.3 Enhanced pH by corrosion or cathodic corrosion protectionCorrosion is an electrochemical process which means that chemical reactions takes place at the same time as direct currents are generated. These currents are transported between anodic and cathodic areas on the metal surface. At the anode an oxidation takes place and the electrons set free are transported in the metal to the cathode. The current moves in the opposite direction to the electrons resulting in an out-leaking current from the anode. At the cathode the current enters the surface and a reduction takes place, see Figure 3-7.
Usually the anodic and cathodic areas are very small and evenly distributed over the metal surface. The metal ions being released at the anode reacts with the hydroxide ions being formed at the cathode to Me(OH)2. In the case of Carbon steel the anodic reaction is however pH neutral. The influence on the pH of the water is therefore very small. In the case of stray current interferences, the anodic and cathodic areas are separated from each other. The metal ions released at the anode can therefore not react with the hydroxide produced at the cathode. The metal ions will be hydrolysed and thus lowering the pH of the water outside the anodic area.
Me2+ + 2 H2O → Me(OH)2 + 2 H+
The hydroxide produced at the cathode will increase the pH of the water close to the metal surface. The amount of hydroxide being produced at the cathode can be calculated with Faradays law.
where m is the mass in gram being produced per s, I is the current (A), M is the molar weight of hydroxide (17 g), z is the number of electrons (1) and F is Faradays constant (96 500 As/mol).
A current of 1 A entering a metal surface during 1 week produces 106 g hydroxide. If the water volume is 10 dm3 the pH will increase to 13.8. The corresponding pH after one week of 10 mA in-leaking current is 11.8.
Installation of cathodic protection is a method to counteract stray current corrosion. This have been done on most of the pull rods in the permanent monitoring systems. The protective current is adjusted to a level securing that no part of the rod is exposed to out-leaking current. However, this means that areas already exposed to in-leaking current will be exposed to even higher in-leaking current densities, see Figure 3-8. In these areas the pH will increase rapidly and hydrogen gas will be produced.
e- I
Anode. Oxidation. Current leaves the surface Me → Me2+ + 2e−
Cathode. Reduction. Current enters the surface.1/2O2 + H2O + 2e− → 2OH− (if oxygen is available) 2 H2O + 2e− → H2 + 2OH− (high current density)
Figure 3-7. Corrosion cell.

SKB R-16-04 19
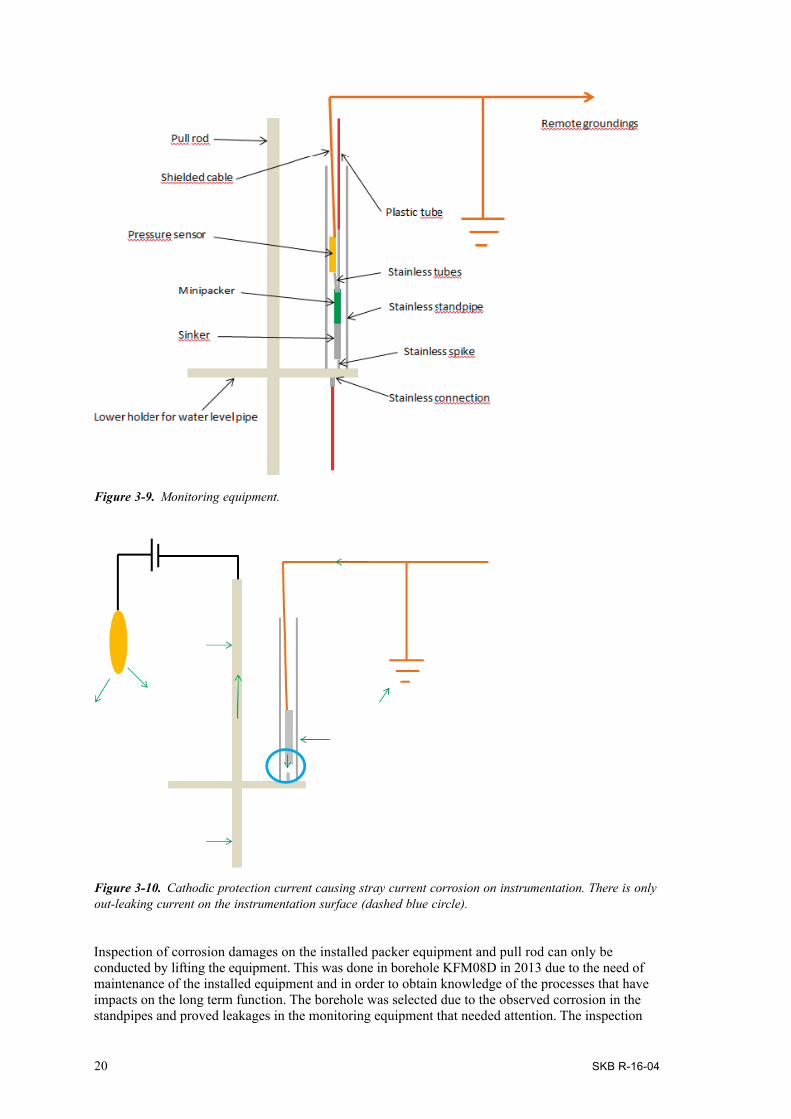
3.2.4 Corrosion damages on instrumentation in stand pipesCorrosion damages were observed on the installations in two of the standpipes in the cased upper part of borehole KFM04A in 2010 and the equipment has been exchanged several times after that due to corrosion. In 2011 similar damages were discovered in KFM08B and in the autumn 2012 in KFM07A, 7B, 7C and KFM08D. In 2013 damages occurred in KFM09A and KFM10A and the boreholes KFM01D, KFM08C and KFM11A were affected in 2014. The reason for the effects on the instrumentation has been a mystery for a long time. It should be impossible for stray currents to reach the instrumentation since the stainless lower part of the stand pipe (approx. 2 m) constitute a Faradays cage. The cables connected to the pressure sensors are shielded and the shield is grounded in the container, see Figure 3-9.
Furthermore, the instrumentation inside the standpipe is in contact with the standpipe via the stainless spike in the bottom of the standpipe. In this way a metallic contact is established between the pull rod and the local ground beside the borehole. Any currents picked up by the local ground are transported to the pull rod via the instrumentation or vice versa. From this follows that since no current is transmitted between the instrumentation and the water, no corrosion can take place on the instrumentation.
However, the local ground is connected to the other drill sites. Large potential differences can exist between drill sites close to the power plant and drill sites at more remote locations. The corrosion damages on the rods could have been much more severe if the resistance in the shielding had been lower. Typical resistances measured are in the range of 20 Ω.
The damages on the instrumentation inside the standpipes started after the installation of the cathodic protection systems. A probable explanation is that the installation lack good contact between the sinker and the spike in the bottom of the standpipe. Then the cathodic protection together with in-leaking stray current results in over-protection of the upper part of the pull rod. The externally in-leaking current lowers the potential of the standpipe relative to the surrounding electrolyte. In fact the standpipe tries to suck current from the electrolyte. Since the instrumentation is isolated from the standpipe and at the same time grounded, it can in this case deliver current to the water and further on to the internal side of the standpipe. The current is then picked up by the local ground, see Figure 3-10. The highest current density and therefore corrosion rate is achieved at the tip of the sinker since this part is closest to the internal surface of the standpipe (the spike), see example in Figure 3-11.
Figure 3-8. Effect of cathodic protection on pull rods influenced by stray current.
Corrosion
pH increase
Rapid pH increaseand hydrogen evolution
20 SKB R-16-04
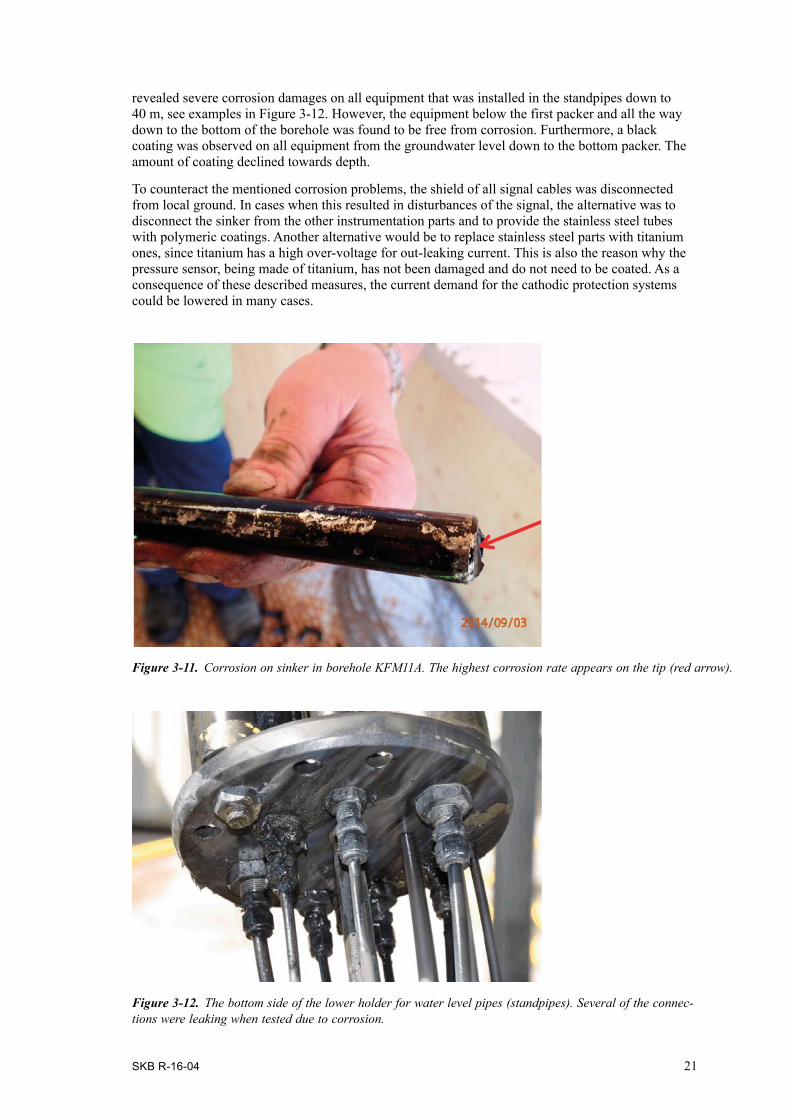
Inspection of corrosion damages on the installed packer equipment and pull rod can only be conducted by lifting the equipment. This was done in borehole KFM08D in 2013 due to the need of maintenance of the installed equipment and in order to obtain knowledge of the processes that have impacts on the long term function. The borehole was selected due to the observed corrosion in the standpipes and proved leakages in the monitoring equipment that needed attention. The inspection
Figure 3-10. Cathodic protection current causing stray current corrosion on instrumentation. There is only out-leaking current on the instrumentation surface (dashed blue circle).
Figure 3-9. Monitoring equipment.
SKB R-16-04 21
revealed severe corrosion damages on all equipment that was installed in the standpipes down to 40 m, see examples in Figure 3-12. However, the equipment below the first packer and all the way down to the bottom of the borehole was found to be free from corrosion. Furthermore, a black coating was observed on all equipment from the groundwater level down to the bottom packer. The amount of coating declined towards depth.
To counteract the mentioned corrosion problems, the shield of all signal cables was disconnected from local ground. In cases when this resulted in disturbances of the signal, the alternative was to disconnect the sinker from the other instrumentation parts and to provide the stainless steel tubes with polymeric coatings. Another alternative would be to replace stainless steel parts with titanium ones, since titanium has a high over-voltage for out-leaking current. This is also the reason why the pressure sensor, being made of titanium, has not been damaged and do not need to be coated. As a consequence of these described measures, the current demand for the cathodic protection systems could be lowered in many cases.
Figure 3-11. Corrosion on sinker in borehole KFM11A. The highest corrosion rate appears on the tip (red arrow).
Figure 3-12. The bottom side of the lower holder for water level pipes (standpipes). Several of the connec-tions were leaking when tested due to corrosion.
22 SKB R-16-04
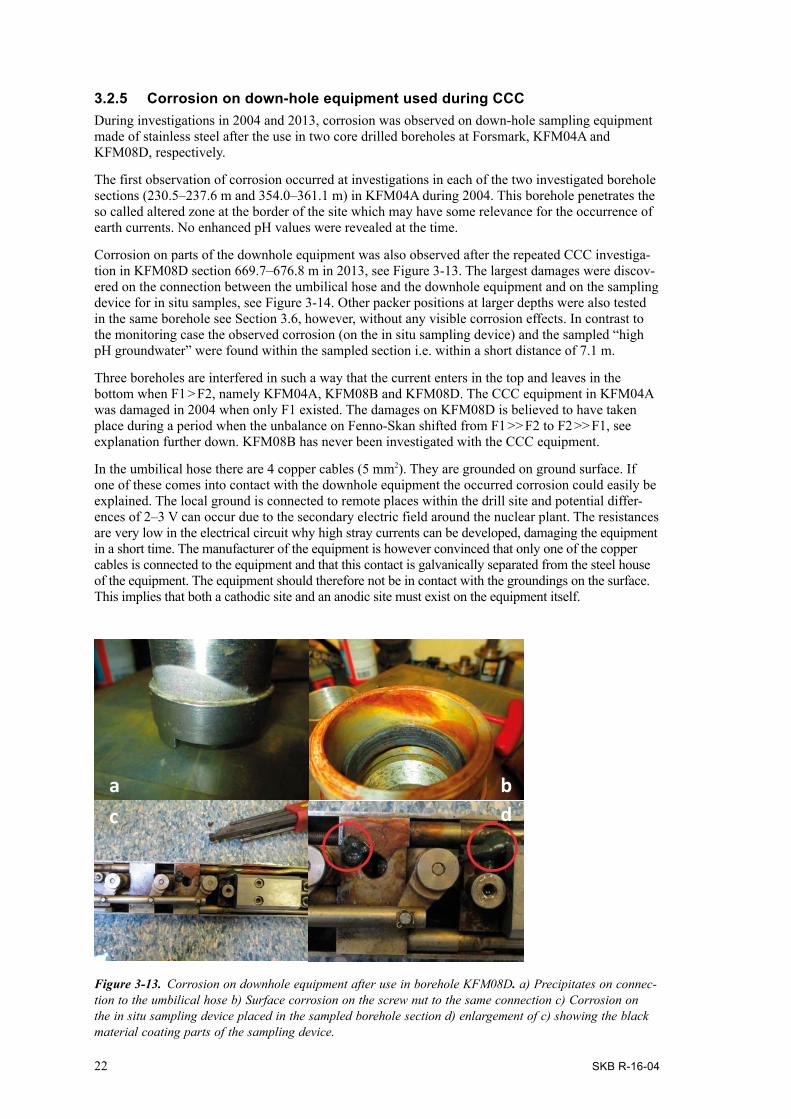
3.2.5 Corrosion on down-hole equipment used during CCCDuring investigations in 2004 and 2013, corrosion was observed on down-hole sampling equipment made of stainless steel after the use in two core drilled boreholes at Forsmark, KFM04A and KFM08D, respectively.
The first observation of corrosion occurred at investigations in each of the two investigated borehole sections (230.5–237.6 m and 354.0–361.1 m) in KFM04A during 2004. This borehole penetrates the so called altered zone at the border of the site which may have some relevance for the occurrence of earth currents. No enhanced pH values were revealed at the time.
Corrosion on parts of the downhole equipment was also observed after the repeated CCC investiga-tion in KFM08D section 669.7–676.8 m in 2013, see Figure 3-13. The largest damages were discov-ered on the connection between the umbilical hose and the downhole equipment and on the sampling device for in situ samples, see Figure 3-14. Other packer positions at larger depths were also tested in the same borehole see Section 3.6, however, without any visible corrosion effects. In contrast to the monitoring case the observed corrosion (on the in situ sampling device) and the sampled “high pH groundwater” were found within the sampled section i.e. within a short distance of 7.1 m.
Three boreholes are interfered in such a way that the current enters in the top and leaves in the bottom when F1 > F2, namely KFM04A, KFM08B and KFM08D. The CCC equipment in KFM04A was damaged in 2004 when only F1 existed. The damages on KFM08D is believed to have taken place during a period when the unbalance on Fenno-Skan shifted from F1 >> F2 to F2 >> F1, see explanation further down. KFM08B has never been investigated with the CCC equipment.
In the umbilical hose there are 4 copper cables (5 mm2). They are grounded on ground surface. If one of these comes into contact with the downhole equipment the occurred corrosion could easily be explained. The local ground is connected to remote places within the drill site and potential differ-ences of 2–3 V can occur due to the secondary electric field around the nuclear plant. The resistances are very low in the electrical circuit why high stray currents can be developed, damaging the equipment in a short time. The manufacturer of the equipment is however convinced that only one of the copper cables is connected to the equipment and that this contact is galvanically separated from the steel house of the equipment. The equipment should therefore not be in contact with the groundings on the surface. This implies that both a cathodic site and an anodic site must exist on the equipment itself.
Figure 3-13. Corrosion on downhole equipment after use in borehole KFM08D. a) Precipitates on connec-tion to the umbilical hose b) Surface corrosion on the screw nut to the same connection c) Corrosion on the in situ sampling device placed in the sampled borehole section d) enlargement of c) showing the black material coating parts of the sampling device.
a bc d

SKB R-16-04 23
The anodic reaction (oxidation), can only take place if the electrons can be consumed by a reduction taking place at the cathode. If the cathode is situated at ground level then the reduction can be oxygen consumption. The environment at depth is close to anaerobic and the reduction reaction has to be hydrogen evolution. To start this reaction an over-voltage is needed that corresponds to a potential difference of approximately 800 mV between the anode and the cathode. At maximum unbalance of Fenno-Skan, the potential difference between the ground surface and the bottom of the borehole (−900 m) in KFM04A is approximately 400 mV. The CCC equipment has a length of 10 m why the potential difference from one end to the other is less than 5 mV, i.e. not enough to initiate corrosion.
If however a strong generator of current is present in the vicinity of the CCC equipment it could generate a tertiary electric field making it possible to initiate corrosion on the equipment. Let us presume that the 109 m long casing in the top of borehole KFM04A by accident is in contact with the local ground and therefore also with the remote ground. Stray currents transferred to the casing could be transported down in the borehole. However, a simple calculation shows that the resistance in the water filled borehole is too high (> 350 Ω).
This implies that the component transmitting stray currents to the isolated equipment must be located even closer. The only conductors in the umbilical hose are the copper cables. If one of these come into contact with the connector in the very end of the umbilical hose the two situations could be explained:
1) The connector could be in direct contact with a connector on top of the equipment. In this case the stray currents are directly transferred down to the lower part of the equipment. This can have been the case in 2004 for KFM04A. Currents picked up by remote groundings were directly transferred to the equipment and returned to ground in the low resistivity area close to the altered zone.
2) In KFM08D the equipment was attacked close to the connector and also further down. This indicates that the metallic contact in the connector was poor. Out-leaking current from the umbili-
Figure 3-14. Outline of hose unit and temporary downhole equipment (modified from SKB 2015). The location of corroded parts after the use in borehole KFM08D are marked with red circles.
Lengthmark indicator
Inflatablepacker
Boreholechemmac
Pump
Sampling unitfor in situ samples
Umbilicalhose:-Samplewaterchannel-Electric supply-Signal cables-Packerexpansion
Inflatablepacker
Computer systemSurface chemmac
24 SKB R-16-04
cal connector was picked up as in-leaking current on the connector on the equipment resulting in out-leaking and corrosion further down. This happened during a period with F1 > F2. When the unbalance was reversed the current left the equipment at the connector leading to corrosion. This is probably the situation presented in Figure 3-14.
A close-up of the impacts on the equipment is shown in Figure 3-13 where out-leaking current from the equipment connector gives corrosion (b) and the in-leaking current on the umbilical hose connec-tor results in increased pH causing precipitations of CaCO3 and Mg(OH)2 on the surface (a).
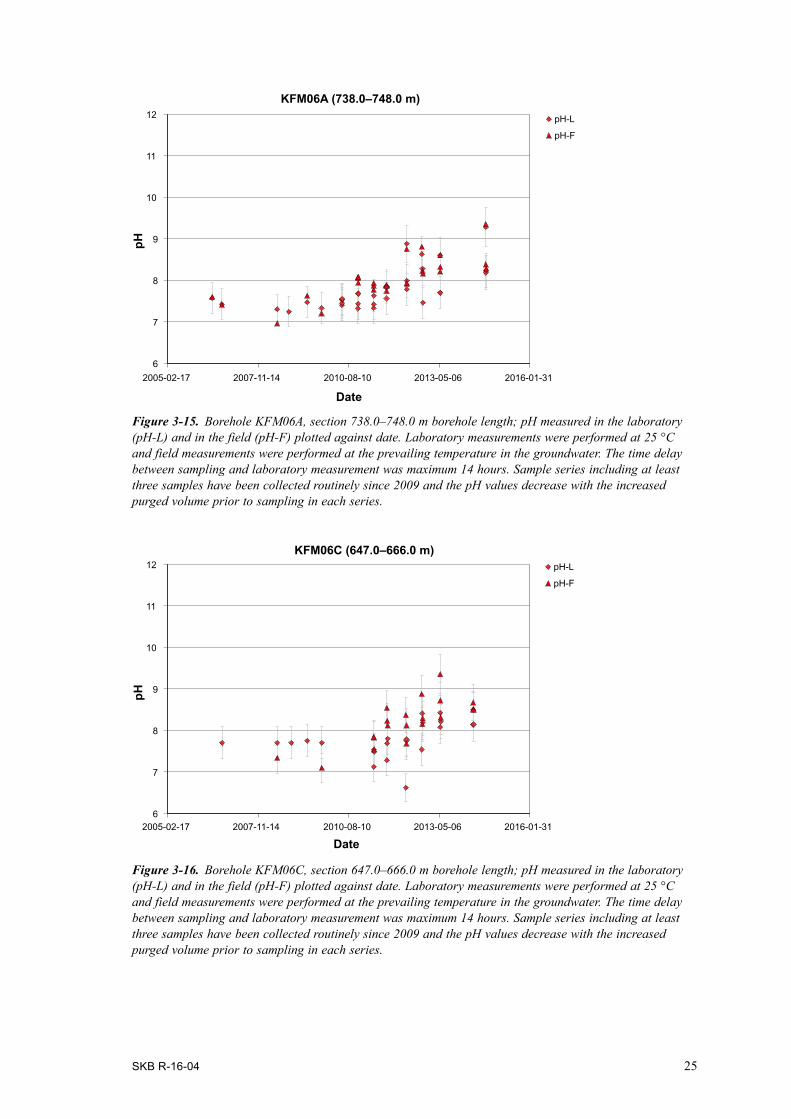
3.3 Observations in boreholes KFM06A and KFM06CThe tendencies for enhanced pH values in the deeper section in borehole KFM06A (738.0–748.0 m) and in KFM06C (647.0–666.0 m) were observed as late as year 2012 and the observations were accompanied by pumping problems due to gas accumulation in the pump. The trends are not as striking as in the other “high pH boreholes” in Forsmark. Furthermore, the CCC-investigations in KFM06A comprised a different and deeper section and cannot be compared with the monitored section in question and no CCC investigation was conducted in borehole KFM06C. Therefore, in contrast to the other “high pH cases”, there are no comparable pH values from before the monitoring period and the treatment in this text will be less detailed, especially for borehole KFM06C. The monitored borehole section in KFM06A includes one significant flow anomaly at 743.3 m borehole length, while the section in KFM06C contains at least two water yielding fractures at approximately 651 and 665 m (determined by single hole injection tests). The transmissivities were approx. 1 × 10⁻⁷ m2/s and 5×10⁻⁸ m2/s.
The measured pH values in the laboratory and in the field during the monitoring period 2007–2014 are plotted versus time in Figures 3-15 and 3-16. Collection of sample series including minimum three samples was introduced as a routine in the autumn 2009. The sample series show higher initial pH values (laboratory measurements) which decreases with pumped volume. This trend, although less clear than in the boreholes KFM07A and KFM08A, suggests that the initial water in the borehole section has a high pH. When the contribution of stagnant section water decreases with the pumped volume and the contribution of groundwater from the formation increases, the pH also decreases. This decreasing trend is typical when the section water in the borehole shows enhanced values compared to the formation groundwater in the bedrock and in fact it has been observed previ-ously for the hydrogen sulphide concentrations (Nilsson et al. 2010, Tullborg et al. 2010).
Figures 3-17 to 3-20 displays data for different constituents/components plotted against pH and date for borehole KFM06A. No such diagrams are presented for KFM06C since the really high pH values are missing, giving a quite compressed pH scale.
The somewhat increasing chloride trend with time (within the error) in the borehole section in KFM06A as well as the minor decrease of δ18O may depend solely on decreasing flushing water content, however, a gradual variation in the groundwater composition is more likely. In addition, the concentrations of some other components change due to contribution from other processes and reactions (for example microbially mediated sulphide production and associated reactions) going on in the borehole section, the tubing and/or the standpipe after some time and possibly after the installation of fixed monitoring equipment.
Among the major components, magnesium shows the most clear decreasing trend with pH and with date. The alkalinity is influenced both by the pH and the gradual withdrawal of water with another composition giving a first decreasing and then increasing shape of the plot versus pH and a generally decreasing trend with date. The minor components, Si, Fe and Mn decreases with increasing pH and high pH-, DOC- and sulphide values coincide in the same samples (the initial samples in each sample series) due to the altered pH and due to a larger contribution of section water in the samples, respectively.
SKB R-16-04 25
Figure 3-16. Borehole KFM06C, section 647.0–666.0 m borehole length; pH measured in the laboratory (pH-L) and in the field (pH-F) plotted against date. Laboratory measurements were performed at 25 °C and field measurements were performed at the prevailing temperature in the groundwater. The time delay between sampling and laboratory measurement was maximum 14 hours. Sample series including at least three samples have been collected routinely since 2009 and the pH values decrease with the increased purged volume prior to sampling in each series.
Figure 3-15. Borehole KFM06A, section 738.0–748.0 m borehole length; pH measured in the laboratory (pH-L) and in the field (pH-F) plotted against date. Laboratory measurements were performed at 25 °C and field measurements were performed at the prevailing temperature in the groundwater. The time delay between sampling and laboratory measurement was maximum 14 hours. Sample series including at least three samples have been collected routinely since 2009 and the pH values decrease with the increased purged volume prior to sampling in each series.
6
7
8
9
10
11
12
2005-02-17 2007-11-14 2010-08-10 2013-05-06 2016-01-31
pH
Date
KFM06C (647.0–666.0 m)pH-L
pH-F
6
7
8
9
10
11
12
2005-02-17 2007-11-14 2010-08-10 2013-05-06 2016-01-31
pH
Date
KFM06A (738.0–748.0 m)pH-L
pH-F

26 SKB R-16-04
Figure 3-17. Variation with pH (pH-L) and date of chloride, sodium and calcium in borehole KFM06A at 738.0 to 748.0 m borehole length.
5 800
6 000
6 200
6 400
6 600
6 800
7 000
7 200
2005-02-17 2007-11-14 2010-08-10 2013-05-06 2016-01-31
Date
5 800
6 000
6 200
6 400
6 600
6 800
7 000
7 200
7.0 8.0 9.0 10.0 11.0
Cl (
mg/
L)
pH
0
500
1 000
1 500
2 000
2 500
2005-02-17 2007-11-14 2010-08-10 2013-05-06 2016-01-31
Date
0
500
1 000
1 500
2 000
2 500
7.0 8.0 9.0 10.0 11.0
Na
(mg/
L)
pH
0
500
1 000
1 500
2 000
2 500
3 000
2005-02-17 2007-11-14 2010-08-10 2013-05-06 2016-01-31
Date
0
500
1 000
1 500
2 000
2 500
3 000
7.0 8.0 9.0 10.0 11.0
Ca
(mg/
L)
pH

SKB R-16-04 27
0
10
20
30
40
2005-02-17 2007-11-14 2010-08-10 2013-05-06 2016-01-31
Date
0
10
20
30
40
50
2005-02-17 2007-11-14 2010-08-10 2013-05-06 2016-01-31
Date
0
25
50
75
100
125
150
2005-02-17 2007-11-14 2010-08-10 2013-05-06 2016-01-31
Date
0
10
20
30
40
7.0 8.0 9.0 10.0 11.0
Mg
(mg/
L)
pH
0
10
20
30
40
50
7.0 8.0 9.0 10.0 11.0
Alk
alin
ity (m
g/L)
pH
0
25
50
75
100
125
150
7.0 8.0 9.0 10.0 11.0
pH
SO4(m
g/L)
Figure 3-18. Variation with pH (pH-L) and date of magnesium, alkalinity and sulphate in borehole KFM06A at 738.0 to 748.0 m borehole length.

28 SKB R-16-04
0
2
4
6
8
10
7.0 8.0 9.0 10.0 11.0
Si (m
g/L)
pH
0.0
0.2
0.4
0.6
0.8
1.0
1.2
7.0 8.0 9.0 10.0 11.0
Fe (m
g/L)
pH
0.00
0.10
0.20
0.30
0.40
0.50
0.60
7.0 8.0 9.0 10.0 11.0
Mn
(mg/
L)
pH
0
2
4
6
8
10
2005-02-17 2007-11-14 2010-08-10 2013-05-06 2016-01-31
Date
0.0
0.2
0.4
0.6
0.8
1.0
1.2
2005-02-17 2007-11-14 2010-08-10 2013-05-06 2016-01-31
Date
0.0
0.1
0.2
0.3
0.4
0.5
0.6
2005-02-17 2007-11-14 2010-08-10 2013-05-06 2016-01-31
Date
Figure 3-19. Variation with pH (pH-L) and date of silicon, iron and manganese in borehole KFM06A at 738.0 to 748.0 m borehole length.

SKB R-16-04 29
0
1
2
3
4
5
6
2005-02-17 2007-11-14 2010-08-10 2013-05-06 2016-01-31
Date
0.0
0.5
1.0
1.5
2.0
2.5
3.0
3.5
2005-02-17 2007-11-14 2010-08-10 2013-05-06 2016-01-31
Date
0
1
2
3
4
5
6
7.0 8.0 9.0 10.0 11.0
DO
C (m
g/L)
pH
0.0
0.5
1.0
1.5
2.0
2.5
3.0
3.5
7.0 8.0 9.0 10.0 11.0
pH
−12.5
−12.0
−11.5
−11.0
−10.5
7.0 8.0 9.0 10.0 11.0
pH
−12.5
−12.0
−11.5
−11.0
−10.5
2005-02-17 2007-11-14 2010-08-10 2013-05-06 2016-01-31
Date
HS− (m
g/L)
δ18O
(‰V
SMO
W)
Figure 3-20. Variation with pH (pH-L) and date of DOC, hydrogen sulphide and δ18O in borehole KFM06A at 738.0 to 748.0 m borehole length.

30 SKB R-16-04
3.4 Observations in borehole KFM07AUnrealistically high pH values (pH ≥ 10.7) were observed first in borehole KFM07A already in 2008. This was accompanied by pumping problems due to gas accumulation in the pump. However, at the time, there was no thought of a possible connection between these two different observations.
The monitored borehole section 962–972 m as well as the previous CCC-section 848.0–1001.6 m includes a single detectable flow anomaly at approximately 970 m borehole length (Rouhiainen and Sokolnicki 2005a). However, there are indications of minor flow anomalies also at 916 and 917 m borehole length which are then included in the CCC section but not in the monitored section. Gap injection was performed down to about 100 m borehole length to seal the space between the casing and the rock wall of the percussion drilled borehole part (Claesson and Nilsson 2005a).
The measured pH values in the laboratory and in the field from the CCC investigation as well as the monitoring period 2007–2013 are plotted versus time in Figure 3-21. No sampling was performed in this borehole during 2014 due to corrosion and leakage. Sample series of five and three samples, respectively, have been collected within the monitoring programme with the start in the autumn 2009.
The sample series generally show anomalously high initial pH values (laboratory measurements) which decrease with pumped volume similarly to KFM06A and KFM08A. The pH decreases when the contribution of stagnant section water decreases and the contribution of groundwater from the formation increases. This decreasing trend has also been observed for the hydrogen sulphide concentrations (Nilsson et al. 2010, Tullborg et al. 2010).
Figures 3-22 to 3-25 present data for different constituents/components plotted against pH and date for the sampled borehole sections in KFM07A at 848.0–1 001.8 m and 962.0–972.0 m borehole length in the CCC campaign (Berg et al. 2005) and the monitoring programme (Nilsson et al. 2010), respectively. It should be remembered that the CCC samples are collected during a short period of a few weeks while the monitoring samples consist of sample series collected once or twice a year during a period of several years. This may cause larger variations in the concentrations of the monitoring samples due to either minor changes in the water composition or differences in the sampling – or analytical performance.
Figure 3-21. Borehole KFM07A, sections 962–972 m and 848–1 002 m borehole length; pH measured in the laboratory (pH-L) and in the field (pH-F) plotted against date. Laboratory measurements were per-formed at 25 °C and field measurements were performed at the prevailing temperature in the groundwater. The time delay between sampling and laboratory measurement was maximum 14 hours. Sample series including at least three samples have been collected routinely since 2009 and the pH values decrease with the increased purged volume prior to sampling in each series.
6
7
8
9
10
11
12
2004-08-01 2007-04-28 2010-01-22 2012-10-18 2015-07-15
pH
Date
KFM07A
pH-L (848.0-1001.6 mbl)
pH-F (848.0-1001.6 mbl)
pH-L (962.0-972.0 mbl)
pH-F (962.0-972.0 mbl)

SKB R-16-04 31
Figure 3-22. Variation with pH (pH-L) and date of chloride, sodium and calcium in borehole KFM07A. Data from the initial CCC investigations in the section at 848.0–1 001.8 m borehole length in blue are compared to data from the monitored sections at 962.0–972 m borehole length (red). The contained significant flow anomaly is at approx. 970 m borehole length in both cases, although there are indications of minor water bearing fractures at 916 and 917 m borehole length that are included in the longer section but not in the monitored section.
12 000
12 500
13 000
13 500
14 000
14 500
15 000
15 500
16 000
2004-08-01 2007-04-28 2010-01-22 2012-10-18 2015-07-15
Date
1 000
1 500
2 000
2 500
3 000
3 500
4 000
2004-08-01 2007-04-28 2010-01-22 2012-10-18 2015-07-15
Date
4 000
4 500
5 000
5 500
6 000
6 500
7 000
2004-08-01 2007-04-28 2010-01-22 2012-10-18 2015-07-15
Date
4 000
4 500
5 000
5 500
6 000
6 500
7 000
7.0 8.0 9.0 10.0 11.0
Ca
(mg/
L)
pH
12 000
12 500
13 000
13 500
14 000
14 500
15 000
15 500
16 000
7.0 8.0 9.0 10.0 11.0
Cl (
mg/
L)
pH
Cl (848.0-1001.8 mbl)
Cl (962.0-972.0 mbl)
1 000
1 500
2 000
2 500
3 000
3 500
4 000
7.0 8.0 9.0 10.0 11.0
Na
(mg/
L)
pH
32 SKB R-16-04
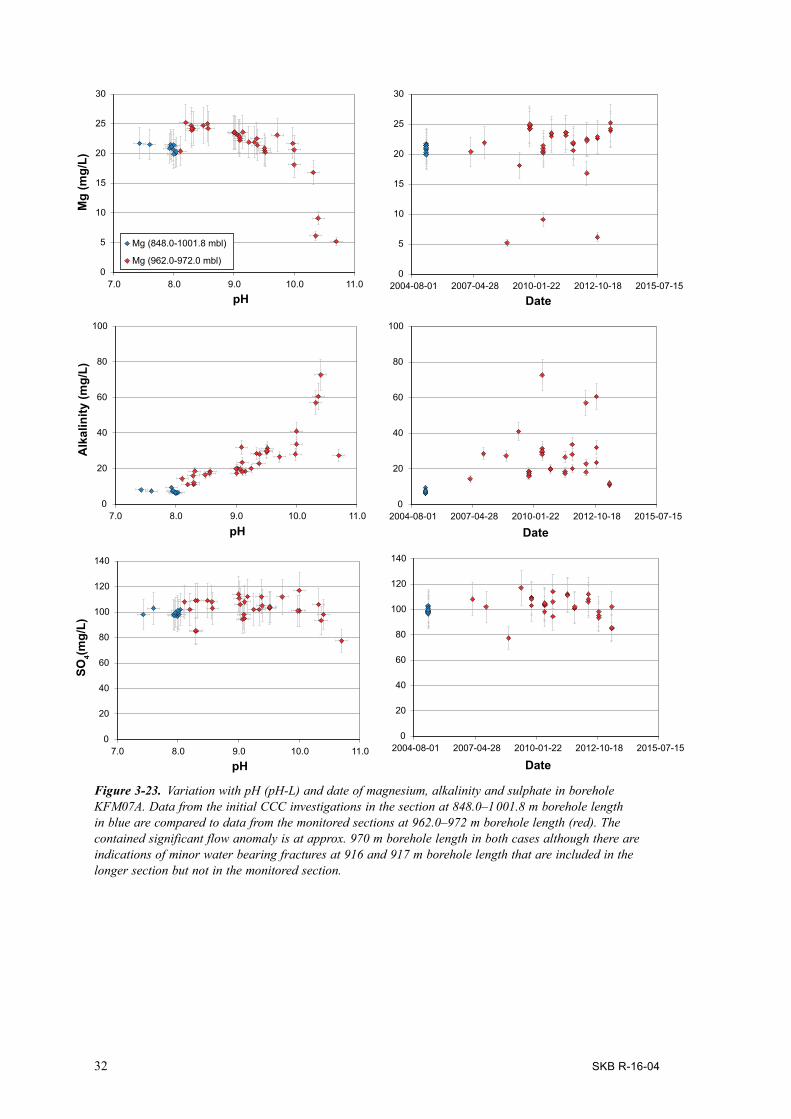
Figure 3-23. Variation with pH (pH-L) and date of magnesium, alkalinity and sulphate in borehole KFM07A. Data from the initial CCC investigations in the section at 848.0–1 001.8 m borehole length in blue are compared to data from the monitored sections at 962.0–972 m borehole length (red). The contained significant flow anomaly is at approx. 970 m borehole length in both cases although there are indications of minor water bearing fractures at 916 and 917 m borehole length that are included in the longer section but not in the monitored section.
0
5
10
15
20
25
30
2004-08-01 2007-04-28 2010-01-22 2012-10-18 2015-07-15
Date
0
20
40
60
80
100
2004-08-01 2007-04-28 2010-01-22 2012-10-18 2015-07-15
Date
0
20
40
60
80
100
120
140
2004-08-01 2007-04-28 2010-01-22 2012-10-18 2015-07-15
Date
0
5
10
15
20
25
30
7.0 8.0 9.0 10.0 11.0
Mg
(mg/
L)
pH
Mg (848.0-1001.8 mbl)
Mg (962.0-972.0 mbl)
0
20
40
60
80
100
7.0 8.0 9.0 10.0 11.0
Alk
alin
ity (m
g/L)
pH
0
20
40
60
80
100
120
140
7.0 8.0 9.0 10.0 11.0
pH
SO4(m
g/L)

SKB R-16-04 33
0
1
2
3
4
5
6
7.0 8.0 9.0 10.0 11.0
Si (m
g/L)
pH
Si (848.0-1001.8 mbl)Si (962.0-972.0 mbl)
0.0
0.1
0.2
0.3
0.4
0.5
0.6
7.0 8.0 9.0 10.0 11.0
Fe (m
g/L)
pH
0.00
0.05
0.10
0.15
0.20
0.25
7.0 8.0 9.0 10.0 11.0
Mn
(mg/
L)
pH
0
1
2
3
4
5
6
2004-08-01 2007-04-28 2010-01-22 2012-10-18 2015-07-15
Date
0.0
0.1
0.2
0.3
0.4
0.5
0.6
2004-08-01 2007-04-28 2010-01-22 2012-10-18 2015-07-15
Date
0.00
0.05
0.10
0.15
0.20
0.25
2004-08-01 2007-04-28 2010-01-22 2012-10-18 2015-07-15
Date
Figure 3-24. Variation with pH (pH-L) and date of silicon, iron and manganese in borehole KFM07A. Data from the initial CCC investigations in the section at 848.0–1 001.8 m borehole length in blue are compared to data from the monitored sections at 962.0–972 m borehole length (red). The contained significant flow anomaly is at approx. 970 m borehole length in both cases, although there are indications of minor water bearing fractures at 916 and 917 m borehole length that are included in the longer section but not in the monitored section.

34 SKB R-16-04
Figure 3-25. Variation with pH (pH-L) and date of DOC, hydrogen sulphide and δ18O in borehole KFM07A. Data from the initial CCC investigations in the section at 848.0–1 001.8 m borehole length in blue are compared to data from the monitored sections at 962.0–972 m borehole length (red). The contained significant flow anomaly is at approx. 970 m borehole length in both cases, although there are indications of minor water bearing fractures at 916 and 917 m borehole length that are included in the longer section but not in the monitored section.
0
10
20
30
40
50
60
2004-08-01 2007-04-28 2010-01-22 2012-10-18 2015-07-15
Date
0.0
0.2
0.4
0.6
0.8
1.0
1.2
1.4
2004-08-01 2007-04-28 2010-01-22 2012-10-18 2015-07-15
Date
−14.5
−14.0
−13.5
−13.0
−12.5
2004-08-01 2007-04-28 2010-01-22 2012-10-18 2015-07-15
Date
0
10
20
30
40
50
60
7.0 8.0 9.0 10.0 11.0
DO
C (m
g/L)
pH
DOC (848.0-1001.8 mbl)DOC (962.0-972.0 mbl)
0.0
0.2
0.4
0.6
0.8
1.0
1.2
1.4
7.0 8.0 9.0 10.0 11.0
pH
−14.5
−14.0
−13.5
−13.0
−12.5
7.0 8.0 9.0 10.0 11.0
pH
HS− (m
g/L)
δ18O
(‰V
SMO
W)

SKB R-16-04 35
The pH is always lower in the samples collected as CCC than in the subsequent monitoring samples. The stable chloride and sodium concentrations (within the error) as well as the δ18O range indicate that the sample water is basically originating from the same type of groundwater independent of the section limit range. Furthermore, the concentrations of some components have changed due to processes and reactions going on in the borehole section, the tubing and/or the standpipe after the CCC and possibly after the installation of fixed monitoring equipment.
Among the major components, magnesium and alkalinity show the most clear decreasing and increas-ing trends with pH, respectively. It is possible that the calcium concentration is generally somewhat lower in the monitoring samples and sulphate shows a decreasing tendency at very high pH.
The minor components, Si, Fe and Mn decreases with increasing pH and extreme pH-, DOC- and sulphide values coincide in the same samples (the initial samples in each sample series). It should be noted that this section of KFM07A is one of the few borehole sections in Forsmark that does not show a general increase in sulphide concentration in the samples collected in the monitoring programme compared to the CCC samples. On the other hand, the initial sulphide concentrations in the CCC samples are somewhat higher than in most investigated borehole sections in Forsmark.
3.5 Observations in borehole KFM08AThe monitoring in KFM08A at 684–694 m borehole length started in 2008 and one single sample showed a high pH-L value at this very first occasion, the other samples were all below the pH 8.7 limit. However, several of the initial samples in the sample series collected the following years show clearly enhanced values.
Both the monitored borehole section at 684–694 m and the CCC section at 683.5–690.6 m borehole length includes only the single detectable flow anomaly at between 685.5–690.5 m borehole lengths (T = 1.9 × 10⁻⁶ m2/s) (Rouhiainen and Sokolnicki 2005b). Gap injection was performed down to about 100 m borehole length to seal the space between the casing and the rock wall of the percussion drilled borehole. Furthermore, due to a deformation of the stainless steel casing at about 97 m, a new borehole bottom was created by filling the borehole with cement grout to just above the damaged part of the casing (Claesson and Nilsson 2005b). A special cement type reinforced with ballast was applied and a new borehole bottom was created at 97.14 m. The applied cement raised 2.3 m in the percussion drilled part of the borehole and had to be drilled through to complete the installation of casing and transition cone. The core drilling was then conducted from this position.
The measured pH values in the laboratory and in the field from the CCC investigation as well as during the monitoring period 2007–2014 are plotted versus time in Figure 3-26. Sample series of five and three samples, respectively, were collected once or twice a year 2008 as well as in the autumn 2009 and forward.
Also the sample series from KFM08A show anomalously high initial pH values (laboratory measure-ments) which decreases with pumped volume. This suggests that the initial water in the borehole section has a high pH, similarly to KFM06A and KFM07A. The pumping decreases the contribution of the contaminated section water to the samples and the formation water part increases causing a lowered pH i.e. the same behaviour as has previously been observed for the hydrogen sulphide concentrations (Nilsson et al. 2010, Tullborg et al. 2010).
Figures 3-27 to 3-30 presents the variation of different constituents/components with pH and date in the sampled sections 683.5–690.6 m and 684–694 m borehole length in the CCC campaign (Berg et al. 2006) and the monitoring programme, respectively (Nilsson et al. 2010). The pH is always lower in the samples collected at CCC than in the subsequent monitoring samples. The stable chlo-ride, sodium and calcium concentrations (within the error) as well as the δ18O range show that the samples contain basically the same type of initial groundwater from the bedrock formation. It should be remembered that the CCC samples are collected during a short period of a few weeks while the monitoring samples represent sample series collected twice a year during a period of several years.

36 SKB R-16-04
The sometimes larger variations in the concentrations of the monitoring samples could be due to either minor changes in the water composition or differences in the sampling – or analytical per-formance. The concentrations of several other components changes due to processes and reactions going on in the borehole section, the tubing and/or the standpipe after the CCC and possibly after the installation of fixed monitoring equipment.
Among the major components, magnesium and alkalinity show the most clear decreasing and increasing trends with pH, respectively. The sulphate concentration shows a hardly significant decreasing tendency at very high pH. The minor components, Si, Fe and Mn decreases with increas-ing pH. DOC and sulphide show a general increase in the monitoring samples compared to the CCC samples which is more related to microbial activity than to pH. Outstandingly high pH-, DOC- and sulphide values coincide in the same samples (initial samples in each sample series).
Figure 3-26. Borehole KFM08A, section 684–694 m borehole length; pH measured in the laboratory and in the field plotted against date. Laboratory measurements (pH_L) were performed at 25 °C and field measurements (pH_F) were performed at the prevailing temperature in the groundwater. The time delay between sampling and laboratory measurement was maximum 14 hours. Sample series including at least three samples have been collected routinely since 2009 and the pH values decrease with the increased purged volume prior to sampling in each series.
6
7
8
9
10
11
12
2004-08-01 2007-04-28 2010-01-22 2012-10-18 2015-07-15
pH
Date
KFM08A pH-L (683.5-690.6 mbl)
pH-F (683.5-690.6 mbl)
pH-L (684.0-694.0 mbl)
pH-F (684.0-694.0 mbl)

SKB R-16-04 37
Figure 3-27. Variation with pH and date of chloride, sodium and calcium in borehole KFM08A. Data from the initial CCC investigations in the section at 683.5–690.6 m borehole length in blue are compared to data from the monitored sections at 684.0–694.0 m borehole length (red). The same flow anomaly is isolated in both cases.
0
500
1 000
1 500
2 000
2 500
2005-02-17 2007-11-14 2010-08-10 2013-05-06 2016-01-31
Date
0
600
1 200
1 800
2 400
3 000
2005-02-17 2007-11-14 2010-08-10 2013-05-06 2016-01-31
Date
0
500
1 000
1 500
2 000
2 500
7.0 8.0 9.0 10.0 11.0
Na
(mg/
L)
pH
0
500
1 000
1 500
2 000
2 500
3 000
7.0 8.0 9.0 10.0 11.0
Ca
(mg/
L)
pH
5 600
5 800
6 000
6 200
6 400
6 600
6 800
2005-02-17 2007-11-14 2010-08-10 2013-05-06 2016-01-31
Date
5 600
5 800
6 000
6 200
6 400
6 600
6 800
7.0 8.0 9.0 10.0 11.0
Cl (
mg/
L)
pH
Cl (683.50-690.64 mbl)Cl (684.0-694.0 mbl)

38 SKB R-16-04
Figure 3-28. Variation with pH and date of magnesium, alkalinity and sulphate in borehole KFM08A. Data from the initial CCC investigations in the section at 683.5–690.6 m borehole length in blue are compared to data from the monitored sections at 684.0–694.0 m borehole length (red). The same flow anomaly is isolated in both cases.
0
5
10
15
20
25
7.0 8.0 9.0 10.0 11.0
Mg
(mg/
L)
pH
0
20
40
60
80
7.0 8.0 9.0 10.0 11.0
Alk
alin
ity (m
g/L)
pH
0
20
40
60
80
100
120
7.0 8.0 9.0 10.0 11.0
pH
0
5
10
15
20
25
2005-02-17 2007-11-14 2010-08-10 2013-05-06 2016-01-31
Date
0
20
40
60
80
2005-02-17 2007-11-14 2010-08-10 2013-05-06 2016-01-31
Date
0
20
40
60
80
100
120
2005-02-17 2007-11-14 2010-08-10 2013-05-06 2016-01-31
Date
SO4(m
g/L)

SKB R-16-04 39
Figure 3-29. Variation with pH and date of silicon, iron and manganese in borehole KFM08A. Data from the initial CCC investigations in the section at 683.5–690.6 m borehole length in blue are compared to data from the monitored sections at 684.0–694.0 m borehole length (red). The same flow anomaly is isolated in both cases.
0
1
2
3
4
5
6
7
8
2005-02-17 2007-11-14 2010-08-10 2013-05-06 2016-01-31
Date
0.0
0.2
0.4
0.6
0.8
1.0
2005-02-17 2007-11-14 2010-08-10 2013-05-06 2016-01-31
Date
0
1
2
3
4
5
6
7
8
7.0 8.0 9.0 10.0 11.0
Si (m
g/L)
pH
0.0
0.2
0.4
0.6
0.8
1.0
7.0 8.0 9.0 10.0 11.0
Fe (m
g/L)
pH
0.00
0.05
0.10
0.15
0.20
0.25
0.30
7.0 8.0 9.0 10.0 11.0
Mn
(mg/
L)
pH
0.00
0.05
0.10
0.15
0.20
0.25
0.30
2005-02-17 2007-11-14 2010-08-10 2013-05-06 2016-01-31
Date

40 SKB R-16-04
0
2
4
6
8
10
2005-02-17 2007-11-14 2010-08-10 2013-05-06 2016-01-31
Date
0.0
0.2
0.4
0.6
0.8
1.0
1.2
1.4
2005-02-17 2007-11-14 2010-08-10 2013-05-06 2016-01-31
Date
−14.0
−13.5
−13.0
−12.5
−12.0
2005-02-17 2007-11-14 2010-08-10 2013-05-06 2016-01-31
Date
−14.0
−13.5
−13.0
−12.5
−12.0
7.0 8.0 9.0 10.0 11.0
pH
0
2
4
6
8
10
7.0 8.0 9.0 10.0 11.0
DO
C (m
g/L)
pH
0.0
0.2
0.4
0.6
0.8
1.0
1.2
7.0 8.0 9.0 10.0 11.0
pH
HS− (m
g/L)
δ18O
(‰V
SMO
W)
Figure 3-30. Variation with pH and date of DOC, hydrogen sulphide and δ18O in borehole KFM08A. Data from the initial CCC investigations in the section at 683.5–690.6 m borehole length in blue are compared to data from the monitored sections at 684.0–694.0 m borehole length (red). The same flow anomaly is isolated in both cases.
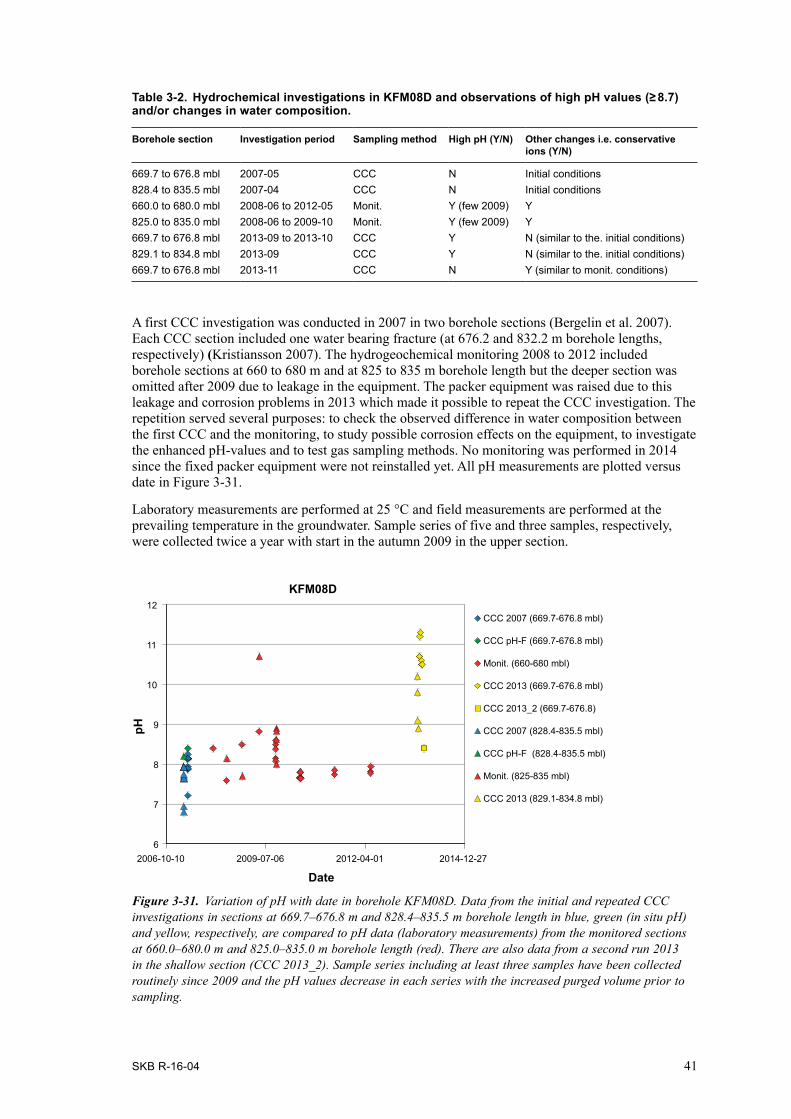
3.6 Observations in borehole KFM08DThe observed pH increase in borehole KFM08D after the CCC campaign 2007 is not as clear as those in boreholes KFM07A and KFM08A. Only a few of the monitoring samples showed pH values exceeding pH 8.7, all of them from 2009. However, pH values measured later on at the repeated CCC investigations in 2013 were consistently very high. Furthermore, the general water composition was changed between the first CCC campaign and the monitoring and then back again when repeat-ing the CCC in 2013 and the reason is not fully understood. The different hydrochemical investiga-tions in KFM08D and related observations of high pH and changes in the water composition other than those depending on the increase in pH are presented in Table 3-2 below.
SKB R-16-04 41
Table 3-2. Hydrochemical investigations in KFM08D and observations of high pH values (≥ 8.7) and/or changes in water composition.
Borehole section Investigation period Sampling method High pH (Y/N) Other changes i.e. conservative ions (Y/N)
669.7 to 676.8 mbl 2007-05 CCC N Initial conditions828.4 to 835.5 mbl 2007-04 CCC N Initial conditions660.0 to 680.0 mbl 2008-06 to 2012-05 Monit. Y (few 2009) Y825.0 to 835.0 mbl 2008-06 to 2009-10 Monit. Y (few 2009) Y669.7 to 676.8 mbl 2013-09 to 2013-10 CCC Y N (similar to the. initial conditions)829.1 to 834.8 mbl 2013-09 CCC Y N (similar to the. initial conditions)669.7 to 676.8 mbl 2013-11 CCC N Y (similar to monit. conditions)
A first CCC investigation was conducted in 2007 in two borehole sections (Bergelin et al. 2007). Each CCC section included one water bearing fracture (at 676.2 and 832.2 m borehole lengths, respectively) (Kristiansson 2007). The hydrogeochemical monitoring 2008 to 2012 included borehole sections at 660 to 680 m and at 825 to 835 m borehole length but the deeper section was omitted after 2009 due to leakage in the equipment. The packer equipment was raised due to this leakage and corrosion problems in 2013 which made it possible to repeat the CCC investigation. The repetition served several purposes: to check the observed difference in water composition between the first CCC and the monitoring, to study possible corrosion effects on the equipment, to investigate the enhanced pH-values and to test gas sampling methods. No monitoring was performed in 2014 since the fixed packer equipment were not reinstalled yet. All pH measurements are plotted versus date in Figure 3-31.
Laboratory measurements are performed at 25 °C and field measurements are performed at the prevailing temperature in the groundwater. Sample series of five and three samples, respectively, were collected twice a year with start in the autumn 2009 in the upper section.
6
7
8
9
10
11
12
2006-10-10 2009-07-06 2012-04-01 2014-12-27
pH
Date
KFM08D
CCC 2007 (669.7-676.8 mbl)
CCC pH-F (669.7-676.8 mbl)
Monit. (660-680 mbl)
CCC 2013 (669.7-676.8 mbl)
CCC 2013_2 (669.7-676.8)
CCC 2007 (828.4-835.5 mbl)
CCC pH-F (828.4-835.5 mbl)
Monit. (825-835 mbl)
CCC 2013 (829.1-834.8 mbl)
Figure 3-31. Variation of pH with date in borehole KFM08D. Data from the initial and repeated CCC investigations in sections at 669.7–676.8 m and 828.4–835.5 m borehole length in blue, green (in situ pH) and yellow, respectively, are compared to pH data (laboratory measurements) from the monitored sections at 660.0–680.0 m and 825.0–835.0 m borehole length (red). There are also data from a second run 2013 in the shallow section (CCC 2013_2). Sample series including at least three samples have been collected routinely since 2009 and the pH values decrease in each series with the increased purged volume prior to sampling.

42 SKB R-16-04
An evaluation of pressure responses, sampling flow rates and results from flow estimations when circulating a tracer verified that there were two leakage points on the tubing system. The size of the pressure responses between the two circulation sections (660–680 m and 825–835 m borehole length) indicated leakage in one of the tubings from the deep section where it goes through the shallow section. Furthermore, when circulating the groundwater in the upper section a pressure decrease was observed in both sections. This indicates that water was lost via another leakage on the return-tubing in the circulation system to the shallower section. This leakage was probably located above the uppermost packer since there was no pressure increase somewhere else and the most upper section was the only one with high enough hydraulic transmissivity to cover such an increase. The repeated CCC investigation in 2013 was performed in almost the same two shorter borehole sections as in 2007, however two samples from the shallow section were collected later after moving the packers and lowering of the equipment to the deeper section and back.
Figures 3-32 to 3-35 presents the variation of different constituents/components with pH and date at the different sampling occasions. Observations and conclusions from the comparisons are listed below:
• The water composition is different in section 660 to 680 mbl compared to both CCC investiga-tions in section 669.7 to 676.8 mbl most probably due to contribution from another groundwater in the former section. The two last samples from the CCC sampling in 2013 in the shallow section reflects the conditions during monitoring while the earlier samples resembles the CCC conditions 2007 although the difference in packer position must be very small. The obtained pumping flow rates were also different at the two occasions due to the different water yields.
• The groundwater composition in the CCC-sections 669.7 to 676.8 mbl and 829.1 to 834.8 mbl is very similar. The same is true for the monitored sections 660 to 680 mbl and 825 to 835 mbl. The largest differences are found between CCC-samples and monitoring samples.
• The Cl, Na and Ca concentrations indicate the presence of more dilute water in the monitored section 660 to 680 mbl compared to the CCC-section 669.7 to 676.8 mbl but the two last CCC-samples, after moving the packers there and back, repeat the results from the monitored section. This difference is independent of the enhanced pH. In summary, the water composition differs for two reasons; due to admixture of groundwater with another composition possibly as an impact from some changed pumping conditions and due to the increase in pH (mainly magnesium, alkalinity and silicon).
• The decreasing tendency for the sulphate concentration in the CCC-section 669.7 to 676.8 mbl in 2013 may indicate ongoing microbial sulphate reduction processes. Furthermore, the gas analyses revealed very high content of hydrogen gas which suggests that a corrosion process is also ongoing. Observation of corrosion on the equipment when it was raised verified that this was the case.
• The upper CCC-section showed persistent high pH values and enhanced pH values were measured also in the deep section. However, the two last samples from the upper section showed values just below the defined high pH limit.
• Chemical changes affected by pH or concurring reactions are: increases in alkalinity, and pos-sibly in DOC as well as decreases in Mg, Si, Fe, Mn, HS- and possibly in SO4.
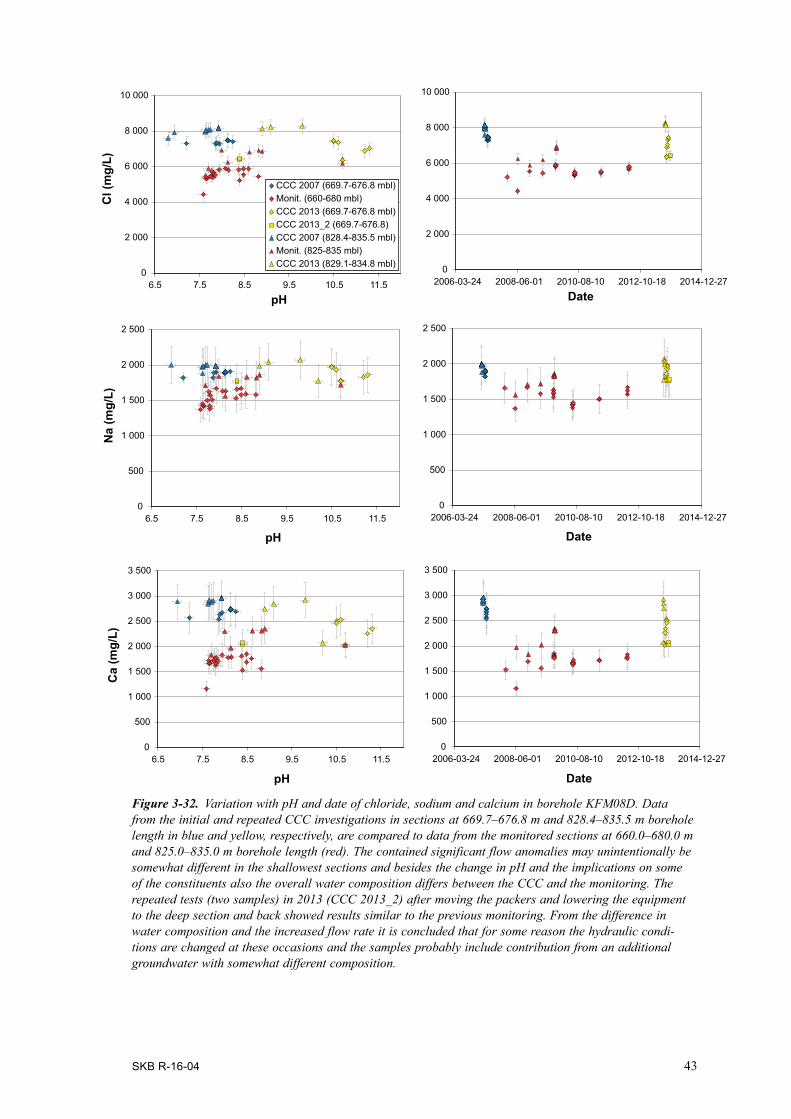
SKB R-16-04 43
Figure 3-32. Variation with pH and date of chloride, sodium and calcium in borehole KFM08D. Data from the initial and repeated CCC investigations in sections at 669.7–676.8 m and 828.4–835.5 m borehole length in blue and yellow, respectively, are compared to data from the monitored sections at 660.0–680.0 m and 825.0–835.0 m borehole length (red). The contained significant flow anomalies may unintentionally be somewhat different in the shallowest sections and besides the change in pH and the implications on some of the constituents also the overall water composition differs between the CCC and the monitoring. The repeated tests (two samples) in 2013 (CCC 2013_2) after moving the packers and lowering the equipment to the deep section and back showed results similar to the previous monitoring. From the difference in water composition and the increased flow rate it is concluded that for some reason the hydraulic condi-tions are changed at these occasions and the samples probably include contribution from an additional groundwater with somewhat different composition.
0
500
1 000
1 500
2 000
2 500
6.5 7.5 8.5 9.5 10.5 11.5
Na
(mg/
L)
pH
0
500
1 000
1 500
2 000
2 500
3 000
3 500
2006-03-24 2008-06-01 2010-08-10 2012-10-18 2014-12-27
Date
0
2 000
4 000
6 000
8 000
10 000
2006-03-24 2008-06-01 2010-08-10 2012-10-18 2014-12-27
Date
0
500
1 000
1 500
2 000
2 500
2006-03-24 2008-06-01 2010-08-10 2012-10-18 2014-12-27
Date
0
500
1 000
1 500
2 000
2 500
3 000
3 500
6.5 7.5 8.5 9.5 10.5 11.5
Ca
(mg/
L)
pH
0
2 000
4 000
6 000
8 000
10 000
6.5 7.5 8.5 9.5 10.5 11.5
Cl (
mg/
L)
pH
CCC 2007 (669.7-676.8 mbl)Monit. (660-680 mbl)CCC 2013 (669.7-676.8 mbl)CCC 2013_2 (669.7-676.8)CCC 2007 (828.4-835.5 mbl)Monit. (825-835 mbl)CCC 2013 (829.1-834.8 mbl)
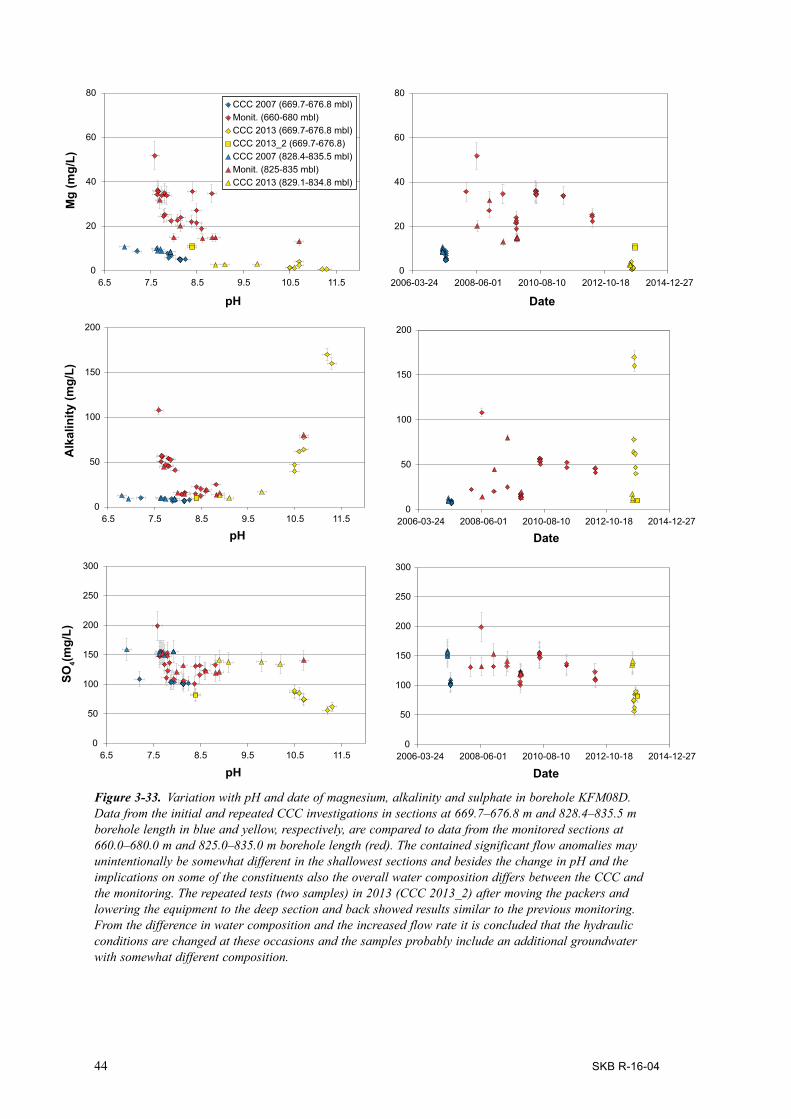
44 SKB R-16-04
Figure 3-33. Variation with pH and date of magnesium, alkalinity and sulphate in borehole KFM08D. Data from the initial and repeated CCC investigations in sections at 669.7–676.8 m and 828.4–835.5 m borehole length in blue and yellow, respectively, are compared to data from the monitored sections at 660.0–680.0 m and 825.0–835.0 m borehole length (red). The contained significant flow anomalies may unintentionally be somewhat different in the shallowest sections and besides the change in pH and the implications on some of the constituents also the overall water composition differs between the CCC and the monitoring. The repeated tests (two samples) in 2013 (CCC 2013_2) after moving the packers and lowering the equipment to the deep section and back showed results similar to the previous monitoring. From the difference in water composition and the increased flow rate it is concluded that the hydraulic conditions are changed at these occasions and the samples probably include an additional groundwater with somewhat different composition.
0
50
100
150
200
250
300
6.5 7.5 8.5 9.5 10.5 11.5
pH
0
50
100
150
200
6.5 7.5 8.5 9.5 10.5 11.5
Alk
alin
ity (m
g/L)
pH
0
20
40
60
80
2006-03-24 2008-06-01 2010-08-10 2012-10-18 2014-12-27
Date
0
50
100
150
200
250
300
2006-03-24 2008-06-01 2010-08-10 2012-10-18 2014-12-27
Date
0
50
100
150
200
2006-03-24 2008-06-01 2010-08-10 2012-10-18 2014-12-27
Date
0
20
40
60
80
6.5 7.5 8.5 9.5 10.5 11.5
Mg
(mg/
L)
pH
CCC 2007 (669.7-676.8 mbl)Monit. (660-680 mbl)CCC 2013 (669.7-676.8 mbl)CCC 2013_2 (669.7-676.8)CCC 2007 (828.4-835.5 mbl)Monit. (825-835 mbl)CCC 2013 (829.1-834.8 mbl)
SO4(m
g/L)

SKB R-16-04 45
Figure 3-34. Variation with pH and date of silicon, iron and manganese in borehole KFM08D. Data from the initial and repeated CCC investigations in sections at 669.7–676.8 m and 828.4–835.5 m borehole length in blue and yellow, respectively, are compared to data from the monitored sections at 660.0–680.0 m and 825.0–835.0 m borehole length (red). The contained significant flow anomalies may unintentionally be somewhat different in the shallowest sections and besides the change in pH and the implications on some of the constituents also the overall water composition differs between the CCC and the monitoring. The repeated tests (two samples) in 2013 (CCC 2013_2) after moving the packers and lowering the equipment to the deep section and back showed results similar to the previous monitoring. From the difference in water composition and the increased flow rate it is concluded that the hydraulic conditions are changed at these occasions and the samples probably include an additional groundwater with somewhat different composition. Concentrations below the detection limits are plotted on the x-axes (zero).
0.0
0.2
0.4
0.6
0.8
1.0
6.5 7.5 8.5 9.5 10.5 11.5
Fe (m
g/L)
pH
0.0
0.1
0.2
0.3
0.4
6.5 7.5 8.5 9.5 10.5 11.5
Mn
(mg/
L)
pH
0
2
4
6
8
10
2006-03-24 2008-06-01 2010-08-10 2012-10-18 2014-12-27
Date
0.0
0.2
0.4
0.6
0.8
1.0
2006-03-24 2008-06-01 2010-08-10 2012-10-18 2014-12-27
Date
0.0
0.1
0.2
0.3
0.4
2006-03-24 2008-06-01 2010-08-10 2012-10-18 2014-12-27
Date
0
2
4
6
8
10
6.5 7.5 8.5 9.5 10.5 11.5
Si (m
g/L)
pH
CCC 2007 (669.7-676.8 mbl)Monit. (660-680 mbl)CCC 2013 (669.7-676.8 mbl)CCC 2013_2 (669.7-676.8)CCC 2007 (828.4-835.5 mbl)Monit. (825-835 mbl)CCC 2013 (829.1-834.8 mbl)

46 SKB R-16-04
Figure 3-35. Variation with pH and date of DOC, hydrogen sulphide and δ18O (V-SMOW) in borehole KFM08D. Data from the initial and repeated CCC investigations in sections at 669.7–676.8 m and 828.4–835.5 m borehole length in blue and yellow, respectively, are compared to data from the monitored sections at 660.0–680.0 m and 825.0–835.0 m borehole length (red). The contained significant flow anomalies may unintentionally be somewhat different in the shallowest sections and besides the change in pH and the implications on some of the constituents also the overall water composition differs between the CCC and the monitoring. The repeated tests (two samples) in 2013 (CCC 2013_2) after moving the packers and lowering the equipment to the deep section and back showed results similar to the previous monitoring. From the difference in water composition and the increased flow rate it is concluded that the hydraulic conditions are changed at these occasions and the samples probably include an additional groundwater with somewhat different composition. Concentrations below the detection limits are plotted on the x-axes (zero).
0
2
4
6
8
10
6.5 7.5 8.5 9.5 10.5 11.5
DO
C (m
g/L)
pH
−14
−13
−12
−11
−10
−9
−8
6.5 7.5 8.5 9.5 10.5 11.5
pH
0
2
4
6
8
10
2006-03-24 2008-06-01 2010-08-10 2012-10-18 2014-12-27
Date
0
1
2
3
4
2006-03-24 2008-06-01 2010-08-10 2012-10-18 2014-12-27
Date
−14
−13
−12
−11
−10
−9
−8
2006-03-24 2008-06-01 2010-08-10 2012-10-18 2014-12-27
Date
0
1
2
3
4
6.5 7.5 8.5 9.5 10.5 11.5
pH
CCC 2007 (669.7-676.8 mbl)Monit. (660-680 mbl)CCC 2013 (669.7-676.8 mbl)CCC 2013_2 (669.7-676.8)CCC 2007 (828.4-835.5 mbl)Monit. (825-835 mbl)CCC 2013 (829.1-834.8 mbl)
HS− (m
g/L)
δ18O
‰V-
SMO
W

SKB R-16-04 47
3.7 pH development in other boreholes in ForsmarkThe pH time series for other monitored cored boreholes in Forsmark, besides the “high pH” boreholes KFM06A, KFM06C, KFM07A, KFM08A and KFM08D, are plotted in Figures 3-36 and 3-37 to check if there is an overall systematic increase of pH, although not reaching to the same extreme values. Borehole KFM11A, which is a high pH borehole, is included here and not treated separately since the really high values are observed as late as 2015. The increasing trends are clear in both investigated borehole sections. Besides borehole KFM11A, only KFM01A shows a slightly increasing trend. The fact that no high pH values or clear pH trends can be seen for borehole KFM04A is worth mentioning since this is the only borehole with observed corrosion problems but without observed high pH values. The corrosion problems appeared already during the first CCC investigations in 2004.
Figure 3-36. Variation of pH with date in boreholes KFM11A, KFM01A, KFM01D and KFM02A. Data from the initial CCC investigations are compared to pH data (laboratory measurements) from the monitored sections. Sample series including at least three samples have been collected routinely since 2009 and the pH values for KFM11A decrease in each series with the increased purged volume prior to sampling.
6.9
7.1
7.3
7.5
7.7
7.9
8.1
8.3
pH
Date
7.0
7.2
7.4
7.6
7.8
8.0
8.2
8.4
8.6
8.8
9.0
6.8
7.0
7.2
7.4
7.6
7.8
8.0
8.2
pH
Date
6.8
7.0
7.2
7.4
7.6
7.8
8.0
8.2
Date
6.8
7.0
7.2
7.4
7.6
7.8
8.0
8.2
pH
Date
6.6
6.8
7.0
7.2
7.4
7.6
7.8
8.0
8.2
Date
KFM11A (447.5-454.6 mbl)
KFM11A (446.0-456.0 mbl)
2004-01-14 2006-07-02 2008-12-18 2011-06-06 2013-11-22
Date2004-01-14 2006-07-02 2008-12-18 2011-06-06 2013-11-22
KFM11A (690.0-710.0 mbl)
2003-10-06 2006-03-24 2008-09-09 2011-02-26 2013-08-14 2013-08-142011-02-262008-09-092006-03-242003-10-062001-04-19
2002-09-01 2005-04-08 2007-11-14 2010-06-21 2013-01-26 2003-10-06 2006-03-24 2008-09-09 2011-02-26 2013-08-14
KFM01D (428.5-435.6 mbl)
KFM01D (429.0-438.0 mbl)KFM01A (110.1-120.8 mbl)KFM01A (109.0-130.0 mbl)
KFM02A (413.5-433.5 mbl)KFM02A (411.0-442.0 mbl)
KFM02A (509.0-516.1 mbl)
KFM02A (490.0-518.0 mbl)

48 SKB R-16-04
6.6
6.8
7.0
7.2
7.4
7.6
7.8
8.0
pH
Date
6.4
6.6
6.8
7.0
7.2
7.4
7.6
7.8
8.0
8.2
8.4
Date
6.8
7.0
7.2
7.4
7.6
7.8
8.0
8.2
pH
Date
6.8
7.0
7.2
7.4
7.6
7.8
8.0
8.2
Date
KFM04A (230.0-245.0 mbl)
KFM04A (230.5-237.6 mbl)
KFM03A (639.0-646.1 mbl)
KFM03A (633.5-650.0 mbl)
KFM03A (980.0-1001.2 mbl)
KFM03A (969.5-994.5 mbl)
KFM10A (436.9-437.9 mbl)
KFM10A (430.0-440.0 mbl)
2001-04-19 2003-10-06 2006-03-24 2008-09-09 2011-02-26 2013-08-14
2001-04-19 2003-10-06 2006-03-24 2008-09-09 2011-02-26 2013-08-14 2004-01-14 2006-07-02 2008-12-18 2011-06-06 2013-11-22 2016-05-10
2001-04-19 2003-10-06 2006-03-24 2008-09-09 2011-02-26 2013-08-14
Figure 3-37. Variation of pH with date in boreholes KFM03A, KFM04A and KFM10A. Data from the initial CCC investigations (blue if available) are compared to pH data (laboratory measurements) from the monitored sections (red). Sample series including at least three samples have been collected routinely since 2009.
3.8 DiscussionWith Section 3.2 as a background, it can be concluded that the increased pH values in Forsmark prior to 2010 must be due to sampling of a borehole section where the rod is exposed to in-leaking current from F1. Accordingly, corrosion damages prior to 2010 appear at a location where the equip-ment is exposed to out-leaking current from F1.
After 2010, the pull rods have been cathodically protected by a constant current. As the system has to compensate for the stray current, the in-leaking current density varies with time and along the length of each rod, depending on the power output from Fenno-Skan. This measure should, hopefully prevent the corrosion but the pH of the water in the borehole sections surrounding the rods will still be affected and even more so.
After 2011 also F2 has been in operation which makes it more complex to make prognoses before-hand, where and when pH increases will occur. Operation records of the HVDC link are stored since the autumn 2014 but no information is available before that time.
The following explanations to the high pH values are based on probable but assumed interference situations. All high pH values have been observed at relatively large depths.
• Boreholes KFM06A and KFM06C are exposed to in-leaking stray current at depth when F1 > F2 but the interference is weak, see Figure 3-38 a. This is probably the explanation to why no high pH values were recorded before 2010. At that time only F1 existed and the stray current density was probably too low to cause corrosion and increase the pH. The increase in pH after 2010 is most likely a result of the current applied for the cathodic protection.

SKB R-16-04 49
• Boreholes KFM07A and KFM08A are the two boreholes being exposed to the strongest impacts from stray current and the stray current enters the rods at depth when F1 > F2 in both cases, see Figure 3-38 b. This explains why high pH values were recorded already before the protection sys-tems were installed. After 2010, pH is constantly high due to the effect of the cathodic protection.
• In three boreholes KFM04A, KFM08B and KFM08D, the current enters the rods at great depth when F2 > F1, see Figure 3-39 a. All other rods show the opposite stray current direction. In 2004, the pull rod in borehole KFM04A was exposed to in-leaking current on the upper parts and out-leaking current further down. No increase in pH was observed in the groundwater samples since they were collected at the place of the corrosion. The high pH recorded in KFM08D in 2013 was probably a consequence of an unbalance situation with F2 > F1. This together with the cathodic protection created an over-protection at the lower part of the rod causing the pH to rise.
• The rectifier supplying the pull rod in KFM11A with cathodic protection was exposed to over-voltages caused by thunder in 2015, see Figure 3-39 b. Instead of ceasing to work, the rectifier started an out-put of maximum current. This resulted in heavy over-protection which explains the high pH values recorded after this occasion.
In principle all monitored boreholes have cathodic protection and an increase in pH might be antici-pated on all drill sites. However, for this to happen, the pull rod has to lack Teflon coating or the coated metal surface has to be damaged. If the current is picked up by the rod in the borehole section where the water is sampled, it will be proportional to the amount of surface without coating on the rod. With undamaged Teflon coating, the current density will be zero and pH will not change. For the instal-lations in the boreholes showing no pH increase (Section 3.7) the situation is the following: 1) The rods in boreholes KFM01A and KFM02A are in contact with the casing and the large surface area of the casing lowers the risk of over-protecting the rod. 2) Boreholes KFM01B, KFM03A and KFM10A, on the other hand, are distinguished by being very little influenced by stray currents and as a consequence, the current output from the cathodic protection rectifier is too low to cause pH increase.
a
b
Figure 3-38. Outline of stray current situation in a) boreholes KFM06A and KFM06C before and after 2010, b) boreholes KFM07A and KFM08A before and after 2010.

50 SKB R-16-04
a
b
Figure 3-39. Outline of stray current situation in a) boreholes KFM04A in 2004 and KFM08D in 2013 b) borehole KFM11A in 2015.

SKB R-16-04 51
4 Observations of high pH values at other sites
4.1 The SFR BoreholesHigh pH values (exceeding pH 8.7) have been observed in only one borehole in the SFR; borehole KFR83 at 0-20 m (the entire borehole is sampled, its old id-code was SH3). The end of this borehole is close to zone ZFM871 (formerly named zone H2) and the borehole is hydraulically connected to both KFR10 and KFR09 through zone ZFM871 and/or zone ZFMNNE869 (formerly named zone 3). It is most probable that the pH values are due to grout injection although this cannot be verified. The borehole existed until September 1987 and it was filled with grout after that.
Four samples were collected between 1987-02-16 and 1987-03-05 and the pH varies between pH 9.9 and pH 10.5, cf. Table 4-1.
Table 4-1. Observations of high pH values in the SFR.
IDCODE START_DATE SECUP SECLOW PH_L SAMPLE_NO Comment
KFR83 1987-02-16 0.00 20.00 10.30 1 322 The borehole is grouted today.KFR83 1987-02-18 0.00 20.00 10.50 1 323KFR83 1987-02-24 0.00 20.00 10.10 1 326KFR83 1987-03-05 0.00 20.00 9.90 1 332
4.2 The Laxemar boreholes (PLU and subsequent monitoring phase)
High pH values (pH 8.7 or higher) have been observed in some sections of boreholes HLX37, KLX06, KLX09, KLX10, KLX11A, KLX15A, KLX19A and KLX27A. Totally, 39 samples show elevated pH values (both field – and laboratory measurements are included). No value exceeds pH 10 and very few exceed pH 9 (one laboratory value and two field values). Unlike the situation in the Forsmark site boreholes, the values are associated with different investigation methods, not only hydrogeochemical monitoring. The boreholes, sections, samples and sampling methods are listed in Appendix 1. The samples with high pH are distributed on different investigation methods as follows:
• 7 samples were collected during drilling.
• 1 sample (KLX06 590–640 m borehole length) is from hydrogeochemical logging (tube sampling) (Berg 2005).
• 19 samples are from CCC investigations, all from KLX27A 641.50-650.56 m borehole length (Bergelin et al. 2008).
• 10 samples are from 5 different monitored borehole sections (Askling and Nilsson 2007).
• 1 sample was collected in the sulphide project (the monitored borehole section KLX06 554–570m borehole length) (Rosdahl et al. 2011).
• 1 sample was collected with the PSS equipment (KLX06 260–265 m borehole length) (Berg and Wacker 2006).
No indications were found to support that impacts from grout have caused the relatively high pH values. The following factors suggest that the pH values could very well be representative of the groundwaters in the concerned boreholes and borehole sections:
• The general pH range in these boreholes is quite high. The 19 samples collected from KLX27A (641.5–650.56 m), for example, show an average value pH of 8.845 ± 0.024.
• Different adjacent and/or overlapping borehole sections of KLX06 were sampled at different occa-sions and with different methods and show somewhat lower but still relatively high pH values.

52 SKB R-16-04
• Despite that the monitoring samples from Laxemar also show the same decreasing sulphide trends with the pumped volume, there are no clear correlations between the pH and the sulphide values in the sample series as in the Forsmark cases. This might indicate that the water in the borehole sections is not affecting the pH, but only the sulphide concentration of the samples.
4.3 The Äspö HRL boreholes and measurement weirsTotally 34 pH values in samples from the Äspö HRL exceed pH 8.7, see Table 4-2. From these, ten samples have incomplete sets of basic analyses and most of the major ions are missing. Two more samples lack anion analyses. Generally, high pH values have been measured once or in a few cases twice in the same borehole section and it is very often the case that these samples do not have complete analyses which complicates further evaluation. The samples have probably been considered as not representative due to impacts from grouting and many of the basic analyses have therefore been omitted. Two different cases with observations of enhanced pH-values may contribute to the understanding of the causes; these are 1) an investigation of the effects of grout during passage through water-bearing fracture zones and 2) the REX project (the REX field measurements). Also the project SU32516 Fintätning was a test of grouting technique and its impact on pH. The test was performed during construction of a short tunnel (TASS) and some of the samples show enhanced pH values see Table 4-3. However, the number of samples and analyses from the same locations is few and incomplete. Unfortunately, the overall chemical compositions vary too much between them to interpret for example alkalinity changes caused by the grouting. Only one of the remaining other samples in Table 4-3, the one from sampling location (HA1290F 0-10 m), has a comparable sample collected before grouting. In this case the alkalinity is significantly lower in the impacted sample with the high pH value, cf. Table 4-3.
Table 4-2. Observations of high pH values in the Äspö HRL groundwaters and suggested causes (references to sources of information are given below the table).
Idcode Date Secup (m) Seclow (m)
pH-L pH-F Sample No.
Suggested causes
HA1290F 1992-03-24 0.00 10.00 10.30 13300 Grouting of tunnel roof at 1 290 m tunnel length 1992-03-23 and grouting of tunnel face at 1289.9 m tunnel length, regrouting of various holes 1992-03-241. See Table 4-4 for comparison of chemical compositions.
KA0575A 1991-06-03 30.00 160.08 10.60 294 Passage through water-bearing fracture zones. Sampling after grouting 1991-06-031. Impact on pH commented on in sampling activity log in Sicada. See Table 4-4 for comparison of chemical compositions.
KA2048B 1993-02-07 0.00 45.80 10.70 13756 The borehole is grouted 1993-02-08 from 0 to 45.8 m borehole length. Single sample. Incomplete analyses1. One of the dates may be erroneous1.
KA2861A 1999-02-18 8.69 9.34 9.80 2831 The Rex project2
See Table 4-4 for comparison of chemical compositions.
KA2861A 1999-05-19 8.69 9.34 10.10 2925 The Rex project2
See Table 4-4 for comparison of chemical compositions.
KA3007A01 2011-04-27 0.00 13.22 10.00 10.35 20667 Several sections sampled during drilling. The borehole interval 3.9–12.36 m was grouted 2011-04-183.

SKB R-16-04 53
KA3007A01 2011-04-27 0.00 16.78 8.34 9.06 20666 Several sections sampled during drilling. The borehole interval 3.9–12.36 m was grouted 2011-04-183.
KA3007A01 2011-05-09 0.00 72.68 10.00 11.07 20670 Several sections sampled during drilling. The borehole interval 12.0–17.0 m was grouted 2011-05-063.
KA3007A01 2011-05-12 0.00 166.78 9.97 8.86 20672 Several sections sampled during drilling. The borehole interval 12.0–17.0 m was grouted 2011-05-063.
KI0023B 1997-10-23 5.91 8.79 8.74 2464 Sampling during drilling?
KXBLOTS1 1996-10-10 0.00 5.78 9.70 2364 Induced high pH from cement5. Two samples. Missing alkalinity and chloride data.
MA2840G 1999-04-06 8.90 2852 After-grouting 1995-05-21, weir cleaning 1998 and weir calibration 1999-02-101.
MA3426G 2007-12-07 8.96 14466 Cleaning from Silicasol had to be done 2007-11-29, disturbance from project SU32516 Fintätning1.
MA3426G 2008-09-15 9.25 14623 The disturbance seems to remain, see above1.
PA2013F 1993-01-13 11.70 13746 (YA2013F), sampling location in tunnel front during tunnel construction. Grouting at 2 013.2 m borehole length 1993-01-14. One of the dates may be erroneous1.
SA0289A 1991-02-19 6.00 19.90 10.00 13169 Sampled just after percussion drilling during tunnel construction. Grouting was performed at 275.9 and 284.5 m tunnel length 1991-01-08 and 1991-01-111. Missing alkalinity data.
SA0361B 1991-02-12 6.00 19.00 8.70 13165 Sampled just after percussion drilling during tunnel construction. Grouting was performed at 284.5 m tunnel length 1991-01-111. Comparison not possible. The sample is much more dilute than the other samples from the same sampling location.
SA0722A 1991-06-06 0.00 20.20 9.10 279 Passage through water-bearing fracture zones. Sampling after grouting1. Single sample.
SA1713A 1992-10-22 5.80 20.10 9.20 76 Sampled just after percussion drilling during tunnel construction. Grouting at 1693 m tunnel length 1992-10-20 (connection, surface leakage). After-grouting later on1. Single sample.
SA1730A 1992-10-29 5.60 20.00 11.60 13720 Sampled just after percussion drilling during tunnel construction. Grouting at 1 725.8 m tunnel length 1992-10-28 (connection + sonde borehole)1. Deviating sample, incomplete analyses.
SA2142B 1993-02-23 6.00 20.40 11.40 59 Sampled just after percussion drilling during tunnel construction. Grouting at 2 141.9 m tunnel length 1993-02-22 (connection)1. Single sample.

54 SKB R-16-04
SA2912A 1994-02-04 0.00 20.00 11.40 13900 Sampled just after percussion drilling during tunnel construction. Grouting at 2 912.0 m tunnel length 1994-02-03 (connection)1. Single sample, incomplete analyses.
SM00231 1991-06-03 0.00 28.50 10.40 295 Passage through water-bearing fracture zones. Sampling after grouting 1991-06-031. Impact on pH commented on in sampling activity log in Sicada.
SM00401 1991-06-03 0.00 34.50 10.50 298 Passage through water-bearing fracture zones. Sampling after grouting 1991-06-031. Impact on pH commented on in sampling activity log in Sicada.
SM00452 1991-06-03 0.00 28.60 11.30 13464 Passage through water-bearing fracture zones. Sampling after grouting 1991-06-031.
SM00452 1992-05-05 0.00 28.60 11.30 299 Passage through water-bearing fracture zones. Sampling after grouting 1991-06-031.
SS0032A02 2008-05-22 0.00 20.00 11.00 14532 SU32516 Fintätning. Test of grout-ing technique during construction of a short tunnel (TASS). Use of grout with low pH and silica fume4.
TASS 2008-04-17 20.00 20.00 9.01 14511 SU32516 Fintätning. Test of grout-ing technique during construction of a short tunnel (TASS). Use of grout with low pH and silica fume4. Sampling from tunnel floor.
TASS 2008-06-04 21.00 21.00 8.94 14540 SU32516 Fintätning. Test of grout-ing technique during construction of a short tunnel (TASS). Use of grout with low pH and silica fume4. Sampling from tunnel floor.
TASS 2008-06-17 22.00 22.00 9.27 14544 SU32516 Fintätning. Test of grout-ing technique during construction of a short tunnel (TASS). Use of grout with low pH and silica fume4. Sampling from tunnel floor.
TASS 2008-06-10 23.00 23.00 9.37 14542 SU32516 Fintätning. Test of grout-ing technique during construction of a short tunnel (TASS). Use of grout with low pH and silica fume4. Sampling from tunnel floor.
TASS 2008-06-05 35.00 35.00 10.00 14541 SU32516 Fintätning. Test of grout-ing technique during construction of a short tunnel (TASS). Use of grout with low pH and silica fume4. Sampling from tunnel floor.
TASS 2008-06-12 43.00 43.00 8.90 14543 SU32516 Fintätning. Test of grout-ing technique during construction of a short tunnel (TASS). Use of grout with low pH and silica fume4. Sampling from tunnel floor.
1 Sicada/activity log and Sicada/activity comment2 REX field experiment (Puigdomenech et al. 2000)3 LOTS4 (Funehag 2008)
During passage of the fracture zones NE-1, EW-7 and NE-3, pH measurements were conducted in a number of boreholes to investigate the spread of the grout. Enhanced pH values were observed in the boreholes KA0575A, SA0722A, SM00231, SM00351, SM00352, SM00401, SM00451, SM00452,

SKB R-16-04 55
SM00456. This means that impacts were seen on the west side of the side tunnel (M) and on the west side of the main tunnel in the tunnel section 722–742 m. The water composition of the impacted samples and some other samples collected relatively close in time from the same sampling locations is given in Table 4-3. The existing data indicate that samples with enhanced pH values have lower concentrations of magnesium, alkalinity and silicon (values in bold font) compared to samples with normal pH values (7.2–7.5). This is not in line with the high pH samples from Forsmark where the alkalinity increases. However, it should be remembered that only one of the sampling locations (KA0575A) has comparable samples collected before the grouting. Repeated pH measurements were performed in November the same year in most of the sampling locations. At this occasion the pH values were back in the normal range (7.2–7.5).
The field REX experiment implied injection and monitoring of O2 uptake in a confined fracture surface under in-situ conditions (Puigdomenech et al. 2000). Several O2 pulses were injected, ranging from ≈ 1 to 26 mg/L and O2 concentration, pH, Eh, temperature and pressure were measured regularly each hour. Furthermore, a number of samples were collected for chemical analyses, see Table 4-3, and for microbial characterisation. Unfortunately, the analyses are far from complete and some of the results are not in Sicada and only available from (Puigdomenech et al. 2000). During the O2 pulses, pH increased to ≈ pH 10. The groundwater used in the experiment originated from borehole KA2862A and comparisons reveal that the alkalinity has increased from ≈ 7 mg/L to > 15 mg/L and the iron and manganese concentrations have disappeared in the samples with enhanced pH values. At these initially low alkalinities the buffering capacity is low and any reaction taking place in the experiments is quickly reflected in the change of alkalinity and pH.
Although, the supportive data are few and scattered, the evaluation of the samples with high pH from Äspö HRL indicate that if the reason is impacts from grout, the samples show decreased alkalinity values. If there is another process or processes causing enhanced pH values as in the REX experi-ments also the alkalinity is increased. Suggested reactions by (Puigdomenech et al. 2000) are:
• Corrosion under reducing conditions for example of iron: Fe(cr)+2 H+→Fe2++H2(aq)
• Uptake of O2 by reducing minerals according to: [FeII, 1/zM+Z]silicate+H++1/4O2→[FeIII]silicate+1/zM+z+1/2H2O where M is a cation of charge +z.
• Respiration and biomass synthesis by microbes according to the overall reaction: CH4+0.3118 O2+0.468 HCO3
-+0.468 H+→0.2936 C5H7O2+1.4404 H2O
These processes would explain the increase in pH but not the increase in alkalinity and organic carbon. Some reductants are, however, available in unknown amounts like Fe(II) silicates or due to corroding metal parts and/or leaching or degradation of plastic components.

56 SKB R-16-04
Tabl
e 4-
3. G
roun
dwat
er c
ompo
sitio
n in
sel
ecte
d sa
mpl
es fr
om th
e Ä
spö
HR
L. D
ata
repr
esen
ting
the
inve
stig
atio
n of
the
spre
ad o
f gro
utin
g du
ring
pass
age
of
wat
er-b
earin
g fr
actu
re z
ones
in 1
991
and
the
REX
fiel
d ex
perim
ent i
n 19
99 a
re g
rey
tone
d an
d hi
gh p
H-v
alue
s as
wel
l as
chan
ged
mag
nesi
um, a
lkal
inity
and
si
licon
val
ues
are
give
n in
bol
d fo
nt.
Star
t dat
eID
CO
DE
SEC
UP
mSE
CLO
W
mSa
mpl
e no
Na
KC
aM
gA
lkal
in-
ityC
lSO
4-S
mg/
LSi
FeM
nLi
SrpH
pH
Nov
-91
EC
mS/
m
1992
-03-
16H
A12
90F
0.00
10.0
013
541
190.
005
300.
07.
3019
92-0
3-24
HA
1290
F0.
0010
.00
13 3
001
940
8.10
1 02
070
.30
50.0
05
030.
061
.00
3.00
0.37
116
800
10.3
01
400
1991
-04-
28K
A05
75A
30.0
016
0.08
13 2
071
730
14.0
1 12
018
2.0
195.
05
160
38.7
7.5
0.78
01
950
0.31
017
.97.
2–
1 47
019
91-0
5-29
KA
0575
A30
.00
160.
0827
01
700
8.9
1 05
017
5.0
238.
04
930
43.4
6.8
––
0.25
815
.87.
3–
1 46
019
91-0
6-03
KA
0575
A30
.00
160.
0829
41
660
1 02
064
.968
.04
640
40.1
0.7
––
0.29
315
.210
.6–
–19
91-0
6-06
SA
0722
A0.
0020
.20
279
344.
120
4.9
20.0
106
15.3
2.4
––
0.00
80.
190
9.1
–36
1991
-06-
03S
M00
231
0.00
28.5
029
51
690
26.1
1 08
072
.250
.04
840
39.4
1.0
––
0.28
116
.010
.47.
3–
1991
-06-
03S
M00
351
0.00
33.0
029
61
600
20.4
912
–14
0.0
4 48
039
.75.
9–
–0.
248
14.2
8.0
––
1991
-06-
03S
M00
352
0.00
32.6
029
71
310
12.8
649
111.
014
0.0
3 49
037
.56.
6–
–0.
211
9.60
8.5
7.2
–19
91-0
6-03
SM
0040
10.
0034
.50
298
1 76
064
.588
760
.852
.04
660
27.8
0.5
––
0.25
216
.110
.57.
5–
1991
-06-
03S
M00
452
0.00
28.6
029
975
9.0
860.
915
0.0
160
13.3
5.9
––
0.00
70.
7711
.37.
2–
1991
-06-
03S
M00
456
0.00
29.0
013
465
914
11.8
577
109.
010
0.0
2 80
021
.94.
8–
–0.
143
8.20
8.2
7.2
–19
98-0
3-13
KA
2861
A0.
008.
522
517
3 19
012
.24
460
49.7
015
.00
13 6
0021
33.
900.
082
0.38
12
780
66.6
7.0
–3
220
1998
-02-
04K
A28
61A
8.69
9.34
2 47
43
260
26.3
4 97
043
.20
29.2
813
100
189
4.32
0.54
00.
434
3 14
069
.47.
2–
3 05
019
98-0
7-07
KA
2861
A8.
699.
342
577
3 53
015
.25
580
29.7
018
.80
15 4
0023
93.
400.
015
0.50
64
080
88.9
7.8
–3
250
1998
-07-
22K
A28
61A
8.69
9.34
2 5
823
540
14.8
5 52
030
.70
16.7
015
600
231
4.10
–0.
425
4 04
085
.37.
8–
2 86
019
98-1
0-29
KA
2861
A8.
699.
342
677
3 50
013
.75
440
33.4
07.
7315
700
231
4.10
0.12
70.
544
3 40
072
.27.
7–
3 33
019
99-0
2-18
KA
2861
A8.
699.
342
831
3 64
012
.55
590
33.2
017
.00
15 9
3023
73.
40–
–3
600
72.3
9.8
–3
170
1999
-05-
19K
A28
61A
8.69
9.34
2 9
25–
––
–39
.00
––
––
––
–10
.1–
3 34
019
99-0
5-31
KA
2861
A8.
699.
342
926
3 78
015
.35
890
22.6
07.
00–
258
2.07
0.00
90.
001
–10
7–
–19
95-0
1-27
KA
2862
A0.
0015
.98
2 2
973
230
13.6
4 72
041
.40
8.00
13 3
0023
26.
600.
119
0.38
03
240
80.5
7.6
–3
150
1998
-05-
12K
A28
62A
7.40
16.0
0–
3 80
018
.15
040
36.0
0–
15 4
4028
33.
99–
0.22
0–
95.0
7.7
––
1998
-07-
07K
A28
62A
7.40
16.0
0–
3 54
015
.15
500
29.0
02.
0015
400
239
4.60
0.12
10.
340
4 10
088
.27.
7–
3 32
019
98-0
7-22
KA
2862
A7.
4016
.00
–3
610
13.1
5 67
031
.20
2.00
15 7
0023
94.
600.
152
0.34
03
960
85.1
7.7
–3
360
1999
-04-
12K
A28
62A
7.40
16.0
0–
3 69
012
.05
530
32.3
07.
0015
900
234
3.80
0.12
40.
310
3 59
073
.87.
8–
3 08
019
99-0
5-19
KA
2862
A7.
4016
.00
––
––
–7.
00–
––
––
––
7.8
–3
350
1999
-05-
31K
A28
62A
7.40
16.0
0–
3 84
015
.66
000
31.7
0–
––
4.70
0.07
40.
290
–10
87.
8–
–

SKB R-16-04 57
4.4 The boreholes HAV10 and KOV01 (at Ävrö and in Oskarshamn)
High pH values have been obtained in two more boreholes in the Oskarshamn area, on the island Ävrö and in the Oskarshamn harbor, see Table 4-4. The reason for these enhanced values is easily explained as impacts from grout (documented in the Sicada database).
Table 4-4. Observations of high pH values in the percussion borehole HAV10 at Ävrö and the core borehole KOV01 in Oskarshamn.
Idcode Start date Secup Seclow pH-L Sample No. Comment
HAV10 2003-10-22 12.00 22.60 9.10 5 910 The borehole was grouted at 0.3–12.0 m borehole length 2003-10-20.
KOV01 2000-05-18 165.00 174.50 11.70 3 071 The borehole was grouted at 283.0–307.0 m borehole length 2000-05-17 and the impact on the sample is commented in Sicada.
4.5 The SKB study site programme 1976 to 1986 Totally 96 groundwater samples from the study sites Fjällveden, Gideå, Lansjärv och Svartboberget have a measured pH ≥ 8.7. Generally, all the samples with high pH are quite dilute with rather high alkalinity and a shallow groundwater character. The pH values do not exceed 9.4 for any of the samples. Comments on the pH measurements are frequent in the database Sicada and it seems that in several cases there were originally duplicate measurements and diverging values but the higher values have been consistently selected for storage in the database. Therefore, the conclusion is that the values may be representative for the natural conditions in the sampled groundwater or systemati-cally erroneous.

SKB R-16-04 59
5 Summary and conclusions
The SKB sites with observations of pH values ≥ 8.7 are summarised in Table 5-1 together with suggested explanations to the values and some comments.
5.1 ForsmarkThe groundwater that is present in some of the isolated sections in the “high pH boreholes” KFM06A, KFM06C, KFM07A, KFM08A, KFM08D and KFM11A show extremely high pH values. These values decrease when purging prior to sampling. The number of boreholes showing high pH values has increased with time and the occurrences of the high pH values are accompanied by pumping problems due to gas accumulation in the pump. This indicates that the enhanced pH values are due to earth currents and corrosion as indicated in Section 3.7. As expected, the alkalinity increases with increasing pH, while the Mg, Si, Fe and Mn concentrations decreases. Corrosion and hydrogen gas development has been verified in borehole KFM08D. However, no pH increase was observed in borehole KFM04A where severe corrosion of down-hole equipment occurred during the CCC cam-paign in 2004. This was due to in-leaking current at the top and out-leaking current and corrosion further down in the borehole. All the “high pH boreholes” are situated in the north-western part of the Forsmark site and close to the nuclear power plants where the secondary electrical field is strong as indicated in Figure 3-25.
No overall systematic increase in pH between the CCC investigation and the monitoring phase may be identified for the majority of the boreholes, except for one section in borehole KFM01A which shows a slightly increasing trend although the values do not reach the extreme range. Borehole KFM08D and to some extent also KFM06A show changes in the overall chemical conditions in the groundwater (the conservative constituents). These effects are not caused by reactions and processes in the borehole but rather by hydraulic conditions. For KFM08D, leakage in the installed monitoring equipment cannot be the reason since the difference in water composition was possible to reproduce by small changes in the packer position during the repeated CCC in 2013.
In summary, several processes/reactions might have affected the groundwater composition in the monitored borehole sections in the “high pH boreholes”;
• Corrosion reactions somewhere along the elongated down-hole equipment and corresponding reduction reactions in places where the current direction is inwards. If this occurs in the sampled borehole section, the result will be pH increase in the samples and hydrogen gas development.
• As a consequence of pH increase reactions will occur i.e. precipitation of Ca, Mg, Si, Mn and Fe as calcite, Mg(OH)2, amorphous silica as well as Mn and Fe-bearing phases.
• Introduction of organic material in the borehole section from the standpipe via the tubing.
• Contamination from the equipment installed in the borehole, i.e. from degradation of plastic material and/or corrosion processes.
• Effects from lubricants (Unisilicon L 50/2 containing silicon oil and PTFE) introduced during drilling (unlikely, no such effects are known).
• Microbial production of sulphide in borehole section, tubing and/or standpipe.
• Gas release during sampling due to lowered pressure.
• Finally, degradation of cement that possibly may be present in the borehole section or in the standpipe (unlikely). This will increase the pH, and supply calcium and silicon into the system followed by precipitation of calcite.
Presumably, the pH of unaffected formation groundwater (without any contribution from borehole section water) has not changed at all since the first CCC investigations or has changed within a moderate range due to minor changes in the groundwater conditions with time. Consequently, it may be possible to collect representative groundwater samples also from the “high pH borehole

60 SKB R-16-04
sections” in the monitoring programme if contribution from borehole section water to the samples can be avoided. However, the results until today indicate that even discharge of minimum five plug flow volumes (Tullborg et al. 2010, Nilsson et al. 2010) of water prior to sampling are not enough as indicated by the Figures 3-15, 3-16, 3-21 and 3-26. The sample series collected during continuous purging generally stabilises at reasonable pH values, but it is still possible that a small and constant contribution of section water preserves a somewhat higher pH than would otherwise be the case. This is indicated by the fact that pH generally do not return to the initial lower values from the first CCC investigations. Nevertheless, exclusion of affected boreholes from the current monitoring programme seems unwise. These boreholes needs further studies and it is important to continue collecting sample series of at least three samples. Special care has to be taken when purging the borehole section and when evaluating the data to facilitate the subsequent interpretations.
To avoid pH effects due to corrosion on the temporary downhole equipment (CCC) may be more difficult since the reduction reaction is obviously going on during the investigation period and on surfaces in very close contact with the sample water. Figure 3-31 shows an example of persistent high pH during several weeks of pumping (borehole KFM08D section 669.7–676.8 mbl).
5.2 Other sitesThe high pH samples from Äspö HRL (except the samples from the REX-project (Puigdomenech et al. 2001), which were affected by the experiments) as well as the SFR, the HAV10 and the KOV01 samples are most probably influenced from grouting. There is, generally, documentation showing use of grout in connection to the sampling occasions considered. Most often there is only one obser-vation of an elevated pH from each sampling location. In a few cases there are two observations.
The pH range represented by the remaining sites and boreholes, i.e. Laxemar and the SKB study sites (1976 to 1986) is more limited (pH=8.7 to pH=9.4). In both the Laxemar and the SKB study site cases, most groundwater samples from the concerned boreholes and borehole sections show an overall high pH level and a rather shallow character with high alkalinity. No documentation was found that could support impacts from grout.
For the REX-samples (cf. Section 4.3), the reason for the elevated pH values are reactions occurring due to the addition of oxygen during the experiments. The samples from Forsmark and the REX samples have the increased alkalinity in common, while there are a few observations indicating a decreased alkalinity in connection to grouting.
Tabell 5-1. The SKB sites with observations of pH values ≥ 8.7, suggested explanations to the values and comments.
Site Time period Explanation to pH Comment
Forsmark 2004 – onwards Stray current corrosion Current direction into pull rod in borehole section
Forsmark-SFR 1987 Grout injection Lack of documentation
Laxemar Natural representative values Generally rather high val-ues however no extremes
The shipyard in Oskarshamn 2000 Grout injection
Study Sites 1976–1986 Natural representative values Generally rather high val-ues however no extremes
Äspö HRL 1991–1999, 2007–2008 and 2011
Grout injection except for borehole KA2861A
Effect from experimental conditions in KA2861A
Ävrö 2003 Grout injection

SKB R-16-04 61
References
SKB’s (Svensk Kärnbränslehantering AB) publications can be found at www.skb.com/publications.
Andersson J, Ström A, Svemar C, Almén K-E, Ericsson L O, 2000. What requirements does the KBS-3 repository make on the host rock? Geoscientific suitability indicators and criteria for siting and site evaluation. SKB TR-00-12, Svensk Kärnbränslehantering AB.
Askling P, Nilsson K, 2007. Oskarshamn site investigation. Hydrochemical monitoring programme for core drilled boreholes 2006. Summary of analyses from water sampling. SKB P-07-167, Svensk Kärnbränslehantering AB.
Berg C, 2005. Oskarshamn site investigation. Hydrochemical logging in KLX06. SKB P-05-85, Svensk Kärnbränslehantering AB.
Berg C, Wacker P, 2006. Oskarshamn site investigation. Water sampling in KLX04 and KLX06. Summary of analyses from water sampling during pumping with The Pipe String System. SKB P-05-271, Svensk Kärnbränslehantering AB.
Berg C, Wacker P, Nilsson A-C, 2005. Forsmark site investigation. Chemical characterisation in borehole KFM07A. Results from the investigated section at 848.00–1001.55 m. SKB P-05-170, Svensk Kärnbränslehantering AB.
Berg C, Bergelin A, Wacker P, Nilsson A-C, 2006. Forsmark site investigation. Hydrochemical characterisation in borehole KFM08A. Results from the investigated section at 683.5–690.6 (690.8) m. SKB P-06-63, Svensk Kärnbränslehantering AB.
Bergelin A, Lindqvist A, Nilsson K, Wacker P, Nilsson A-C, 2007. Forsmark site investigation. Hydrochemical characterisation in borehole KFM08D. Results from two investigated sections at 669.7–676.8 m and 828.4–835.5 m. SKB P-07-190, Svensk Kärnbränslehantering AB.
Bergelin A, Nilsson K, Lindqvist A, Wacker P, 2008. Oskarshamn site investigation. Complete chemical characterisation in borehole KLX27A. Results from borehole section 641.5 to 650.6 m. SKB P-08-77, Svensk Kärnbränslehantering AB.
Claesson L-Å, Nilsson G, 2005a. Forsmark site investigation. Drilling of the telescopic borehole KFM07A at drill site DS7. SKB P-05-142, Svensk Kärnbränslehantering AB.
Claesson L-Å, Nilsson G, 2005b. Forsmark site investigation. Drilling of the telescopic borehole KFM08A and the core drilled borehole KFM08B at drill site DS8. SKB P-05-172, Svensk Kärnbränslehantering AB.
Funehag J, 2008. Injektering av TASS-tunneln. Delresultat t o m september 2008. SKB R-08-123, Svensk Kärnbränslehantering AB. (In Swedish.)
Gimeno M J, Auqué L F, Gómez J B, Acero P, 2011. Site investigation SFR. Water–rock inter-action and mixing modelling in the SFR. SKB P-11-25, Svensk Kärnbränslehantering AB.
Kristiansson S, 2007. Forsmark site investigation. Difference flow logging in borehole KFM08D. SKB P-07-84, Svensk Kärnbränslehantering AB.
Nilsson A-C (ed), Berg C, Harrström J, Jönsson S, Thur P, Borgiel M, Qvarfordt S, 2010. Forsmark site investigation. Hydrochemical monitoring of groundwaters and surface waters. Results from water sampling in the Forsmark area, January–December 2009. SKB P-10-40, Svensk Kärnbränslehantering AB.
Puigdomenech I, Kotelnikova S, Pedersen, Tullborg E-L, 2000. Äspö Hard Rock Laboratory. In-situ determination of O2 uptake by geological media: Field data for the redox experiment in detailed scale (REX). SKB IPR-00-23, Svensk Kärnbränslehantering AB.
Puigdomenech I, Ambrosi J-P, Eisenlohr L, Lartigue J-E, Banwart S A, Bateman K, Milodowski A E, West J M, Griffault L, Gustafsson E, Hama K, Yoshida H, Kotelnikova S, Pedersen K, Michaud V, Trotignon L, Rivas Perez J, Tullborg E-L, 2001. O2 depletion in granitic media. The REX project. SKB TR-01-05, Svensk Kärnbränslehantering AB.

62 SKB R-16-04
Rosdahl A, Pedersen K, Hallbeck L, Wallin B, 2011. Investigation of sulphide in core drilled boreholes KLX06, KAS03 and KAS09 at Laxemar and Äspö. Chemical-, micro biological- and dissolved gas data from groundwater in four borehole sections. SKB P-10-18, Svensk Kärnbränslehantering AB.
Rouhiainen P, Sokolnicki M, 2005a. Forsmark site investigation. Difference flow logging in borehole KFM07A. SKB P-05-63, Svensk Kärnbränslehantering AB.
Rouhiainen P, Sokolnicki M, 2005b. Forsmark site investigation. Difference flow logging in borehole KFM08A. SKB P-05-43, Svensk Kärnbränslehantering AB.
SKB, 2015. Monitoring Forsmark. Evaluation, recommendations and programme. SKB TR-15-01, Svensk Kärnbränslehantering AB.
Taxén C, Sandberg B, Lilja C, 2014. Possible influence from stray currents from high voltage DC power transmission on copper canisters. SKB TR-14-15, Svensk Kärnbränslehantering AB.
Tullborg E-L, Smellie J, Nilsson A-C, Gimeno M J, Auqué LF, Brüchert V, Molinero J, 2010. SR-Site – sulphide content in the groundwater at Forsmark. SKB TR-10-39, Svensk Kärnbränslehantering AB.


Arkite
ktkop
ia AB
, Bro
mm
a, 20
17
SVENSK KÄRNBRÄNSLEHANTERING
SKB is tasked with managing Swedish nuclear and radioactive waste in a safe way.
skb.se