elena proakis ellis, p.e., bcee methodologies in...
TRANSCRIPT

The Significance of Reporting Methodologies in Stringent Phosphorus NPDES Permits
MCWRS Symposium
May 11, 2016
Elena Proakis Ellis, P.E., BCEE
City of Melrose, MA
Jane E. Madden, P.E., BCEE
CDM Smith

Acknowledgments
MCWRS Symposium – May 11, 2016

Presentation Objectives
1) Review history of numeric nutrient criteria
2) Summarize reporting methodologies across US:
– Averaging durations (weekly, monthly, seasonal, annual)
– Averaging methods (means, medians, percentiles)
– Concentrations vs. loads
3) Evaluate impacts of methodologies on compliance with total phosphorus limits using four MA facilities
4) Discussion and recommendations
MCWRS Symposium – May 11, 2016MCWRS Symposium – May 11, 2016

NUMERIC NUTRIENT CRITERIA

US EPA Numeric Nutrient Criteria
• 1986 EPA “Gold Book” – 0.1 mg/L TP free-flowing streams
– 0.05 mg/L TP where stream enters lake/reservoir
– 0.025 mg/L TP in lake/reservoir
• 1998 EPA Regional Nutrient Criteria– US divided into 14 Ecoregions (with sub-regions)
– Criteria for TN, TP, chlorophyll-a, and turbidity
– Different criteria for lakes/reservoirs, rivers/streams, estuaries/coastal environments, wetlands
MCWRS Symposium – May 11, 2016MCWRS Symposium – May 11, 2016

Numeric Nutrient Criteria – 1998 Ecoregions
MCWRS Symposium – May 11, 2016MCWRS Symposium – May 11, 2016

US EPA Numeric Nutrient Criteria
• Using data from unimpaired reference waters:– Select 75th percentile levels for each parameter from each
water body type
OR…
• Using data from all regional water bodies:– Select 25th percentile levels for each parameter from each
water body type
• Done for each season, then averaged over year
MCWRS Symposium – May 11, 2016MCWRS Symposium – May 11, 2016

2014 Progress Toward State Nutrient Criteria
MCWRS Symposium – May 11, 2016
Nearly half of US states have not established criteria for either N or P
MCWRS Symposium – May 11, 2016

Massachusetts Nutrient Criteria
• 314 CMR 4.00 Surface Water Quality Standards– Narrative criteria unless site-specific
TMDL established
– Protect designated uses
– Highest and best practical treatment
• Typical NPDES Permit Limits– 0.1 mg/L, 0.2 mg/L, 0.75 mg/L, 1.0 mg/L
– Report-only
MCWRS Symposium – May 11, 2016
0.03125 mg/L TP Region-wide0.02375 mg/L TP - Sub-region 59 (Eastern MA except Cape Cod)
Eastern Coastal Plain
MCWRS Symposium – May 11, 2016

TOTAL PHOSPHORUS REPORTING
METHODOLOGIES

Phosphorus Regulation
• NPDES Permits issued by US EPA (2011 data):
–3,130 facilities with TP limits
–24,238 facilities with report-only TP
MCWRS Symposium – May 11, 2016MCWRS Symposium – May 11, 2016

NPDES Regulations: 40 CFR 122.45(d)(2)
“For continuous discharges all permit effluent limitations, standards, and prohibitions, including those necessary to achieve water quality standards, shall unless impracticable be stated as: (2) Average weekly and average monthly discharge limitations for POTWs.”
MCWRS Symposium – May 11, 2016MCWRS Symposium – May 11, 2016
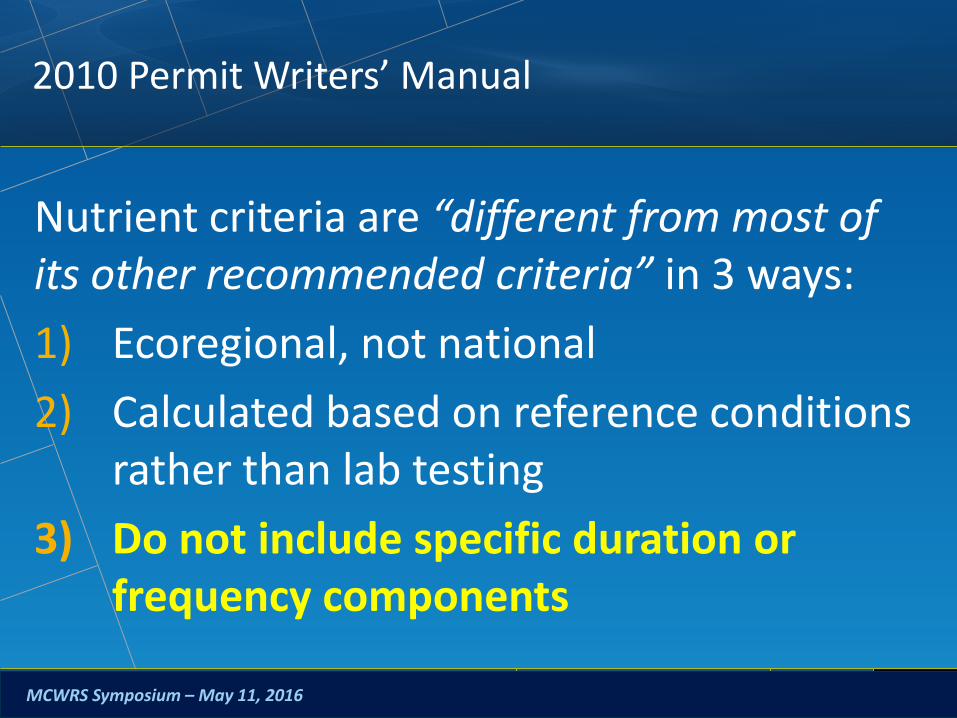
2010 Permit Writers’ Manual
Nutrient criteria are “different from most of its other recommended criteria” in 3 ways:
1) Ecoregional, not national
2) Calculated based on reference conditions rather than lab testing
3) Do not include specific duration or frequency components
MCWRS Symposium – May 11, 2016MCWRS Symposium – May 11, 2016

2000 Ecoregion XIV Rivers and Streams Report
“Identify appropriate periods of duration (i.e., how long) and frequency (i.e., how often) of occurrence in addition to magnitude (i.e., how much). EPA does not recommend identifying nutrient concentrations that must be met at all times, rather a seasonal or annual averaging period…is considered appropriate.”
MCWRS Symposium – May 11, 2016MCWRS Symposium – May 11, 2016

National NPDES Permits
MCWRS Symposium – May 11, 2016
Watershed POTW TP Limit Reported As Notes
Potomac River/ Chesapeake Bay
Blue Plains (DCWater)
0.18 mg/L 12-mo. rolling average
Less stringentmo. avg. load
Onondaga Lake Metropolitan Syracuse WWTP
0.10 mg/L and 9,757 kg/yr
12-mo. rolling average
Expect reduction to 0.02 mg/L
Tualatin River (Oregon)
Durham WWTF 0.11 mg/L Monthly median May – October only
Tualatin River (Oregon)
Rock Creek WWTF
0.10 mg/L Monthly median May – October only
Spokane River (Washington)
Riverside Park WRF (Spokane)
8.07 kg/d Seasonal avg. daily load
March – October
State of Colorado
Regulation #85 1.0 mg/L / 2.5 mg/L
Annual median / 95th percentile
Calculated as rolling values
MCWRS Symposium – May 11, 2016

MASSACHUSETTS CASE EXAMPLES

Seven Methodologies for Concentration & Load
• Monthly Average (arithmetic mean)
• Maximum of 60-day Rolling Average
• Seasonal Average (April – October)
• Annual Average
• Monthly Median
• Seasonal Median (April – October)
• Annual Median
MCWRS Symposium – May 11, 2016MCWRS Symposium – May 11, 2016

Case Examples – Four Treatment Facility Types
• Enhanced Biological Phosphorus Removal
– Secondary treatment; no chemical addition
• Ballasted Flocculation (tertiary)
• Cloth Disk Filtration (tertiary)
• Upflow Sand Filtration (tertiary)
4 year of data evaluated
MCWRS Symposium – May 11, 2016MCWRS Symposium – May 11, 2016

Enhanced Biological Phosphorus Removal
MCWRS Symposium – May 11, 2016
Year Month
Monthly
Average
Max 60-day
Rolling Avg
Seasonal
Average
Annual
Average
Monthly
Median
Seasonal
Median
Annual
Median
2012
(mg/L)
January 0.37 0.42 0.26 0.30
February 0.57 0.42 0.45 0.30
March 0.41 0.42 0.33 0.30
April 0.75 0.75 0.48 0.42 0.63 0.32 0.30
May 0.59 0.66 0.48 0.42 0.37 0.32 0.30
June 0.45 0.66 0.48 0.42 0.50 0.32 0.30
July 0.22 0.51 0.48 0.42 0.18 0.32 0.30
August 0.19 0.33 0.48 0.42 0.17 0.32 0.30
September 0.76 0.47 0.48 0.42 0.63 0.32 0.30
October 0.41 0.58 0.48 0.42 0.31 0.32 0.30
November 0.17 0.42 0.15 0.30
December 0.19 0.42 0.18 0.30
Shaded cells indicate compliance with 0.45 mg/L TP limit
MCWRS Symposium – May 11, 2016

Enhanced Biological Phosphorus Removal
MCWRS Symposium – May 11, 2016
Year Month
Monthly
Average
Max 60-day
Rolling Avg
Seasonal
Average
Annual
Average
Monthly
Median
Seasonal
Median
Annual
Median
2013
(kg/d)
January 18 21 11 13
February 18 21 11 13
March 43 21 21 13
April 27 27 21 21 31 13 13
May 22 25 21 21 13 13 13
June 37 31 21 21 20 13 13
July 11 31 21 21 11 13 13
August 11 26 21 21 9 13 13
September 10 11 21 21 11 13 13
October 23 16 21 21 15 13 13
November 18 21 15 13
December 13 21 10 13
Shaded cells indicate compliance with 95 kg/d and future 21 kg/d limits
MCWRS Symposium – May 11, 2016
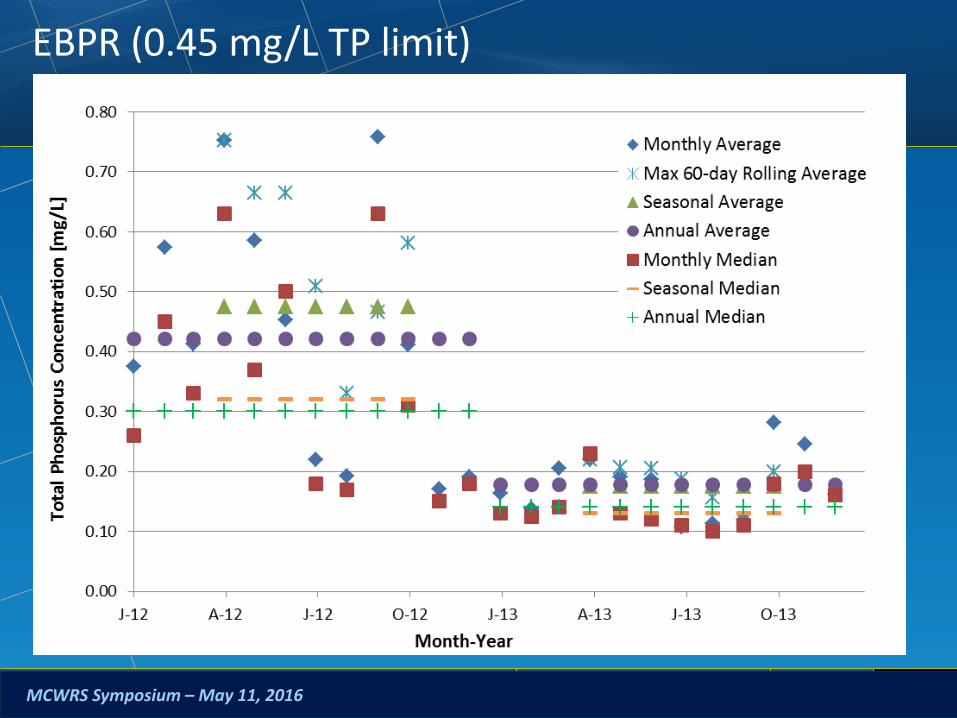
EBPR (0.45 mg/L TP limit)
MCWRS Symposium – May 11, 2016MCWRS Symposium – May 11, 2016

Ballasted Flocculation
MCWRS Symposium – May 11, 2016
Year Month
Monthly
Average
Max 60-day
Rolling Avg
Seasonal
Average
Annual
Average
Monthly
Median
Seasonal
Median
Annual
Median
2012
(mg/L)
January 0.48 0.25 0.50 0.20
February 0.79 0.25 0.73 0.20
March 0.82 0.25 0.79 0.20
April 0.24 0.24 0.19 0.25 0.24 0.18 0.20
May 0.21 0.23 0.19 0.25 0.22 0.18 0.20
June 0.18 0.22 0.19 0.25 0.19 0.18 0.20
July 0.20 0.21 0.19 0.25 0.19 0.18 0.20
August 0.13 0.19 0.19 0.25 0.14 0.18 0.20
September 0.21 0.17 0.19 0.25 0.22 0.18 0.20
October 0.14 0.18 0.19 0.25 0.14 0.18 0.20
November 0.20 0.25 0.16 0.20
December 0.35 0.25 0.32 0.20
Shaded cells indicate compliance with 0.2 mg/L TP limit
MCWRS Symposium – May 11, 2016

Ballasted Flocculation
MCWRS Symposium – May 11, 2016
Year Month
Monthly
Average
Max 60-day
Rolling Avg
Seasonal
Average
Annual
Average
Monthly
Median
Seasonal
Median
Annual
Median
2013
(mg/L)
January 0.53 0.17 0.58 0.11
February 0.43 0.17 0.43 0.11
March 0.29 0.17 0.28 0.11
April 0.12 0.12 0.10 0.17 0.13 0.09 0.11
May 0.11 0.12 0.10 0.17 0.12 0.09 0.11
June 0.11 0.11 0.10 0.17 0.07 0.09 0.11
July 0.08 0.12 0.10 0.17 0.02 0.09 0.11
August 0.08 0.10 0.10 0.17 0.08 0.09 0.11
September 0.10 0.09 0.10 0.17 0.11 0.09 0.11
October 0.06 0.09 0.10 0.17 0.06 0.09 0.11
November 0.24 0.17 0.24 0.11
December 0.83 0.17 1.07 0.11
Shaded cells indicate compliance with 0.2 mg/L TP limit
MCWRS Symposium – May 11, 2016

Ballasted Flocculation (0.2 mg/L TP limit)
MCWRS Symposium – May 11, 2016MCWRS Symposium – May 11, 2016

Upflow Sand Filtration (0.1 mg/L TP limit)
MCWRS Symposium – May 11, 2016MCWRS Symposium – May 11, 2016

Cloth Disk Filtration (0.2 mg/L TP limit)
MCWRS Symposium – May 11, 2016MCWRS Symposium – May 11, 2016

Conclusions from Case Examples
• 60-day rolling average results in highest values(One outlier can impact 3 months of reportable values)
• Medians generally lower than means (Applies to monthly, seasonal, and annual values)
• Processes with more variation/outliers benefit from median limits
• Longer averaging periods increase compliance
• Compliance higher with load-based limits at facilities operating below permitted flow
MCWRS Symposium – May 11, 2016MCWRS Symposium – May 11, 2016

DISCUSSION & RECOMMENDATIONS

Considerations in Permit Development
• D+ Rating of US Wastewater/Stormwater Infrastructure (ASCE, 2014)
• Poor to fair condition; mostly below standard
• $298 billion needed over 20 years
• Largely related to SSOs and CSOs (raw discharge)
• Competing needs for limited funding
Permits must meet simultaneous goals of water quality protection and sound investment
MCWRS Symposium – May 11, 2016MCWRS Symposium – May 11, 2016

Projected Costs to Treat Effluent at 10 mgd Facility
MCWRS – September 15, 2015 Meeting
Source: WERF, 2011
MCWRS Symposium – May 11, 2016

2011 WERF Study Findings
“Even exemplary plants may produce violations if regulators pick values that are inappropriate to the associated averaging period, no matter how much effort, cost and energy is expended.”
(Bott and Parker, 2011)
MCWRS Symposium – May 11, 2016MCWRS Symposium – May 11, 2016

Considerations in Permit Development (cont.)
• Uncertainties inherent in numeric criteria:
–Regional criteria not site-specific
–Variety of data quality used in their establishment
–Based on 25th/75th percentile methods
–Calculated using average of 4 seasons
Wouldn’t a monthly average permit limit imply a much higher level of certainty in the criteria?
MCWRS Symposium – May 11, 2016MCWRS Symposium – May 11, 2016

Considerations in Permit Development (cont.)
• Uncertain relationship between nutrient criteria and water quality impairment
–Nutrients do not pose acute toxicity
–Not adequate links between numeric criteria and impairment of beneficial uses
Too much variation in the natural world to have regional criteria accurately matched with site-specific impairments
MCWRS Symposium – May 11, 2016MCWRS Symposium – May 11, 2016

Recommendations
– Site-specific modeling and TMDLs
– Time frames for permits reflective of impacts
–Adaptive management approach – allow flexibility initially and monitor benefits
–Allow medians when consistent with water quality goals (if outliers don’t impact quality)
–Combine with 95th percentile value if needed
MCWRS Symposium – May 11, 2016MCWRS Symposium – May 11, 2016

Recommendations (cont.)
–Allow medians to encourage EBPR• Lower chemical consumption
• Lower energy use
• Lower O&M costs
• More sustainable
–Allow load-based TP when operating below flow limits and permit is based on TMDL• Encourages phased implementation
• Allows phased expenditures
MCWRS Symposium – May 11, 2016MCWRS Symposium – May 11, 2016

Conclusion
–Averaging types (mean, median)
–Averaging durations
–Concentration vs. load-based limits
These are expensive decisions that require forethought, scientific basis, sound reasoning, and coordination between regulators and facility managers during permit development
MCWRS Symposium – May 11, 2016MCWRS Symposium – May 11, 2016

Questions?
Contact:
Elena Proakis Ellis, P.E., BCEE
City Engineer, City of Melrose, MA
Jane E. Madden, P.E., BCEE
CDM Smith
MCWRS Symposium – May 11, 2016MCWRS Symposium – May 11, 2016