elements for design of advanced development programmes
DESCRIPTION
ELEMENTS FOR DESIGN OF ADVANCED DEVELOPMENT PROGRAMMES. BEING. large regional firms in the Caribbean : Drivers of Growth and Opportunities for Expansion into new markets. EIL. THINKING. KNOWING. - PowerPoint PPT PresentationTRANSCRIPT

ELEMENTS FOR DESIGN OF ADVANCED DEVELOPMENT PROGRAMMES
LARGE REGIONAL FIRMS IN THE CARIBBEAN: DRIVERS OF GROWTH AND OPPORTUNITIES FOR EXPANSION INTO NEW MARKETS
1
BEING
KNOWING
DOING
THINKING EILLARGE REGIONAL FIRMS IN THE CARIBBEAN: Drivers of Growth and Opportunities for Expansion into new markets
Prof. Miguel Carrillo, Ph D.

ELEMENTS FOR DESIGN OF ADVANCED DEVELOPMENT PROGRAMMES
2
BEING
KNOWING
DOING
THINKING EIL
• Objective of the Study: Understand and Document Growth Strategies, Trajectories and Patterns in Large Regional Caribbean Firms.
• Large: Typically >> 500 employees• Countries:– DR– Guyana– Jamaica– Suriname– Barbados– Trinidad and Tobago
LARGE REGIONAL FIRMS IN THE CARIBBEAN: Drivers of Growth and Opportunities for Expansion into new markets

ELEMENTS FOR DESIGN OF ADVANCED DEVELOPMENT PROGRAMMES
3
BEING
KNOWING
DOING
THINKING EIL
• Project Funded by Compete Caribbean.• Progress:– 37 in depth interviews with CEOs, Chairman and
Top Executives of Largest Corporations in the Caribbean
– 6 Surveys of Base of the Pyramid Market Profile– Identification of about 9 Growth Trajectories– Mapping of LRF– Cases and Mini Cases
LARGE REGIONAL FIRMS IN THE CARIBBEAN: Drivers of Growth and Opportunities for Expansion into new markets

Business Mapping ofLarge Regional Firms in the Caribbean

Goddard Enterprises
Grace Kennedy
Ansa Mcal Guardian Holdings
Kersten Republic Bank
First Carib-bean Bank
Sagicor Massy Holdings
Ltd
Costs/Cost 116 119 62 150 40 20 45 54 64
Efficiency 0 5 2 2 0 0 25 0 3
Risk/Risks 100 326 26 218 36 21 420 293 81
Control 31 26 7 33 24 45 170 27 41
Profits 9 14 1 16 0 26 6 10 110
Profitability 6 7 1 3 0 5 3 0 18
Competition/Compete
5 6 0 2 9 2 2 7 5
Local 9 8 7 7 0 0 0 3 10
Same 13 9 1 13 9 7 5 10 7
Short Term 10 6 11 35 7 6 29 17 23
Innovation 0 6 1 1 1 6 20 7 0
Growth 5 58 14 36 0 0 5 2 97
New 36 45 19 26 34 29 61 23 86
50150250350450550650750850
Content Analysis of Selected Variables for 2012

Global Interna-tional
Oppor-tunities/Oppor-tunity
Explore Compet-itive
Alliance Joint Venture
Collabo-ration
Insight/Insights
Long term
Sustain-ability
Projects Start
Goddard Enter-prises
2 23 5 0 3 0 5 2 1 17 0 2 1
Grace Kennedy
41 45 14 0 5 1 6 0 0 16 3 1 5
Ansa Mcal
1 0 1 0 0 1 5 0 0 2 0 3 1
Guardian Holdings
4 26 7 1 6 12 8 2 0 53 1 5 2
Kersten 34 1 18 3 0 4 0 5 5 1 3 1 25
Republic Bank
21 10 22 2 0 4 7 0 0 5 1 9 1
First Car-ibbean Bank
30 80 5 0 9 46 0 1 47 5 4 1 1
Sagicor 46 56 7 0 5 5 0 1 34 1 7 2 2
Massy Holdings Ltd
34 1 0 5 34 1 1 12 0 12 4 17 4
25
75
125
175
225
275
Content Analysis of Selected Variables 2012

Top large Non Financial Firms Employment Size
Company Head quarters Employment
Size Year 2013Neal and Massey Trinidad and Tobago 8988Ansa McAl Trinidad and Tobago 6000Digicel Jamaica 5500Goddard Limited Barbados 5023Grace Kennedy Jamaica 2633Cerveceria Nacional Dominicana, S.A Dominican Republic 2500Jamaica Producers Jamaica 1534Agostini Trinidad and Tobago 1025TCL Group of Companies Trinidad and Tobago 1000Kersten Suriname 999The Generating Company Haina Dominican Republic 600Bank Holdings (Beverages company) Ltd Barbados 589Light and power holdings Barbados 451Jamaica Broilers Group Jamaica 273Angostura Holdings Limited Trinidad and Tobago 250

Top large Financial Firms Employment Size
Company Head quarters
Employment
Size
Year 2013
Grupo Popular Dominican Republic 6500
CIBC First Caribbean International Bank Barbados 3424
Republic Bank Trinidad and Tobago 4091
Memoria Banco BHD Dominican Republic 4000
Guardian Holdings Ltd Trinidad and Tobago 2529
Sagicor Trinidad and Tobago 1500
First Citizen Bank Trinidad and Tobago 900

Revenue Positioning of Top Non Financial and
Financial Firms

Revenue Positioning of Top Non-Financial Firms in the Caribbean 2010 to 2013

Revenue Positioning of Top Financial Firms in the Caribbean 2010 to 2013

Assets Positioning of Top Non Financial and
Financial Firms

Assets Positioning of Top Non Financial Firms in the Caribbean 2010 to 2013

Assets Positioning of Top Financial Firms in the Caribbean 2010 to 2013
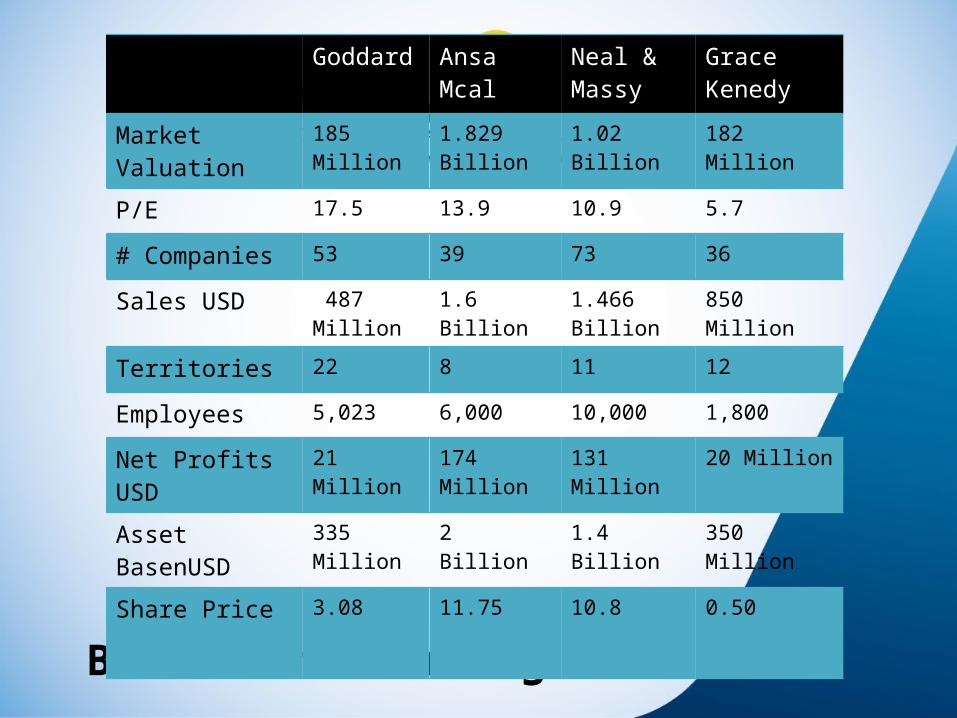
Basic Benchmarking some LRF
Goddard Ansa Mcal Neal & Massy
Grace Kenedy
Market Valuation 185 Million 1.829 Billion 1.02 Billion 182 Million
P/E 17.5 13.9 10.9 5.7
# Companies 53 39 73 36
Sales USD 487 Million 1.6 Billion 1.466 Billion 850 Million
Territories 22 8 11 12
Employees 5,023 6,000 10,000 1,800
Net Profits USD 21 Million 174 Million 131 Million 20 Million
Asset BasenUSD 335 Million 2 Billion 1.4 Billion 350 Million
Share Price 3.08 11.75 10.8 0.50

ELEMENTS FOR DESIGN OF ADVANCED DEVELOPMENT PROGRAMMES
16
BEING
KNOWING
DOING
THINKING EIL
• Geographic Growth Trajectories:– Trajectory 1: Country Centric– Trajectory 2: Caribbean Centric– Trajectory 3: Caribbean as platform for Global
Growth
LARGE REGIONAL FIRMS IN THE CARIBBEAN: Drivers of Growth and Opportunities for Expansion into new markets

ELEMENTS FOR DESIGN OF ADVANCED DEVELOPMENT PROGRAMMES
17
BEING
KNOWING
DOING
THINKING EIL
Location of HQ.
• Caribbean HQ serving the Caribbean Region: Ansa Mcal Sagicor, Guardian
• Non Caribbean HQ serving the Caribbean Region: PALIG, UNICOMER, Goddard Catering Group
• Caribben HQ serving non-Caribbean Regions: SM Jaleel, Grace Keenedy. Goddard.
LARGE REGIONAL FIRMS IN THE CARIBBEAN: Drivers of Growth and Opportunities for Expansion into new markets

ELEMENTS FOR DESIGN OF ADVANCED DEVELOPMENT PROGRAMMES
18
BEING
KNOWING
DOING
THINKING EIL
• Growth Patterns relative to Markets:– Pattern 1: Market Dominance. Have a bigger slide.– Pattern 2: Market Development. Have a bigger pie– Pattern 3: Market Dominance as the platform for
Market Development. Have a bigger slide of a bigger pie.
LARGE REGIONAL FIRMS IN THE CARIBBEAN: Drivers of Growth and Opportunities for Expansion into new markets

ELEMENTS FOR DESIGN OF ADVANCED DEVELOPMENT PROGRAMMES
19
BEING
KNOWING
DOING
THINKING EIL
• Growth Generic Strategies:– Strategy 1: Integration of new value chain steps– Strategy 2: Value deployment through new
channels– Strategy 3: Old Growth
LARGE REGIONAL FIRMS IN THE CARIBBEAN: Drivers of Growth and Opportunities for Expansion into new markets

Growth Playbook of LRF in the Caribbean
CoreBusiness
Horizon 1
AdjacentSpace
Horizon 2
Entirely NewSpace
Horizon 3


Old
Gro
wth
New
Gro
wth
Organic Growth Inorganic Growth
Growth Matrix
• Operations in New Locations
• Conquering new customer segments
• New Products/Services• New business model
• Market Penetration• Replication• Operational Effectiveness
• M&A in same sector/value chain step
• M&A in related Markets• JV with traditional
players
• M&A/ JV’s in new value chain step
• M&A/ JV’s of unrelated new businesses
• M&A/JV’s within new channels

How will your company grow in the next 3 years?
OLD
NEW
ORGANIC INORGANIC
65%
15%
15%
5%
N=11 LDF

How will your company grow in the next 5 years?
OLD
NEW
ORGANIC INORGANIC
40%
30%
20%
10%
N=11 LDF


Angostura(Alliance)
Kersten’s Housing (IJV)Ansa’s Water Treatment Solutions (Alliance)
Massy Auto InsuranceMicro Insurance for BOP(GF)
Beverage Company Access Colmados in DR (Alliance)
Almonde PopularEngineering (GF)
Massy Ecosystem (GF)
Goddard Enterprises(IJV)
What growth vehicles are preferred?
• Acquisitions
• Distribution Alliances
• Greenfield
• Least Used: International JV
27

Key Findings of the Study
• First Mover Advantage Vs. Unique Mover Advantage
• Lack of Volume/Critical Mass not enough to attract enough competition
• Most growth is based on the attaining operational excellent in already mature markets/businesses
• LRF are too regional centric. Global benchmarks are rarely used.
28

Key Findings of the Study
• Fear of Cannibalization (Innovations might not create new markets but cannibalize existing ones)
• Success breeds conservatism (fear of failure)• Localization of assets, resources, and
capabilities constrain expanding behavior• Technology is not a mainstream ingredient in
growth trajectories
29