elementary school social climate and school achievement
TRANSCRIPT

http://aerj.aera.netAmerican Educational Research Journal
http://aer.sagepub.com/content/15/2/301The online version of this article can be found at:
DOI: 10.3102/00028312015002301
1978 15: 301Am Educ Res JWisenbaker
Wilbur B. Brookover, John H. Schweitzer, Jeffrey M. Schneider, Charles H. Beady, Patricia K. Flood and Joseph M.Elementary School Social Climate and School Achievement
Published on behalf of
American Educational Research Association
and
http://www.sagepublications.com
can be found at:American Educational Research JournalAdditional services and information for
http://aerj.aera.net/alertsEmail Alerts:
http://aerj.aera.net/subscriptionsSubscriptions:
http://www.aera.net/reprintsReprints:
http://www.aera.net/permissionsPermissions:
http://aer.sagepub.com/content/15/2/301.refs.htmlCitations:
What is This?
- Jan 1, 1978Version of Record >>
at NORTH CAROLINA STATE UNIV on May 10, 2014http://aerj.aera.netDownloaded from at NORTH CAROLINA STATE UNIV on May 10, 2014http://aerj.aera.netDownloaded from
American Educational Research Journal Spring 1978, Vol 15, No. 2, Pp. 301-318
Elementary School Social Climate and School Achievement1
WILBUR B. BROOKOVER Michigan State University
JOHN H. SCHWEITZER Michigan State University
JEFFREY M. SCHNEIDER Brown University
CHARLES H. BEADY Morgan State University
PATRICIA K. FLOOD Lansing School District
JOSEPH M. WISENBAKER Research Triangle Institute
The present study investigates the relationships among a variety of school-level climate variables and mean school achievement in a random sample of Michigan elementary schools. School-level SE$, racial composition and climate were each highly related to mean school achievement; only
a small proportion of the between-school variance in achievement is explained by SES and racial composition after the effect of school climate
is removed. The climate variable we have called Student Sense of Academic Futility had the largest correlation with achievement. An
observational study of four schools with similar SES and racial composition but different achievement tended to support the more analytical
findings and suggest the processes by which climate affects achievement.
!The research on which this paper is based was supported in part by Grant Number NIE-G-74-0020 from the National Institute of Education, Department of Health, Education and Welfare. The Michigan Department of Education has assisted in this project by providing access to school assessment data and jointly requesting cooperation by the schools. See Brookover, Beady, Flood, Schweitzer and Wisenbaker, Schools Can Make A Difference, College of Urban Development, Michigan State University, East Lansing, Michigan, 1977, for a more comprehensive report of this research,
301
at NORTH CAROLINA STATE UNIV on May 10, 2014http://aerj.aera.netDownloaded from

BROOKOVER ET AL
This article examines the thesis that characteristics of the school social system which we identify as "school climate" explain much of the between-school variance in school achievement. We ask what, if any, difference in school level achievement do school cultural or normative social-psychological variables account for?
The research is a direct outgrowth of a preliminary study which focused on the identification of normative social-psychological variables that might distinguish between elementary schools with similar socio-economic and racial composition but significantly different levels of academic achievement (Brookover, Gigliotti, Henderson, & Schneider, 1973, and Brookover & Schneider, 1975). Elementary schools with atypical achievement were compared to typical schools with similar socio-economic and racial composition. These atypical schools, low SES with high achievement or high SES with low achievement, were matched with schools with similar racial and socio-economic composition but significantly different levels of achievement. The 24 schools provided the basis for identifying normative social-psychological variables that distinguished between high and low achieving schools. The desire to test the validity of the finding of the preliminary study prompted us to study a random sample of Michigan elementary schools.
The present study differs in many important methodological aspects from previous research in this area (Coleman et al., 1966; Hauser, Sewell, 8c Alwin, 1976; McDill, Meyers, & Rigsby, 1967; Hauser, 1971; and Jencks et al., 1972). First, rather than relying upon socio-economic status and school racial composition or other school variables as proxies for climate, we have endeavored to identify and measure specific social-psychological indices of school climate. Second, our research focuses upon elementary schools—a level where it might be expected that schools could have the greatest incremental impact on achievement, but one that previous researchers in this area have not studied extensively. Third, we have stratified schools on the basis of racial composition, thereby extending the generalizability of our results. Data from separate random majority black and majority white school subsamples as well as the representative state sample have been analyzed, thereby allowing examination of differences in the subgroups of schools vis a vis the impact of school climate.
School Climate Variables
The concept "school climate" has been used in many different ways. The composition of the student body as measured by socio-economic status, race, or other composition variables has frequently been used as a measure for school climate. Others have used measures of student personality or characteristics of school organization as proxies for school climate (Anderson, 1970; O'Reilly, 1975). Our conception of school academic climate is as follows:
The school social climate encompasses a composite of variables as defined and perceived by the members of this group. These factors may be broadly conceived as the norms of the social system and expectations held for various members as perceived by the members of the group and communicated to members of the group. (Brookover 8c Erickson, 1975, p. 364).
These two general dimensions—norms and expectations—are theoretically
302
at NORTH CAROLINA STATE UNIV on May 10, 2014http://aerj.aera.netDownloaded from
SCHOOL SOCIAL CLIMATE AND ACHIEVEMENT
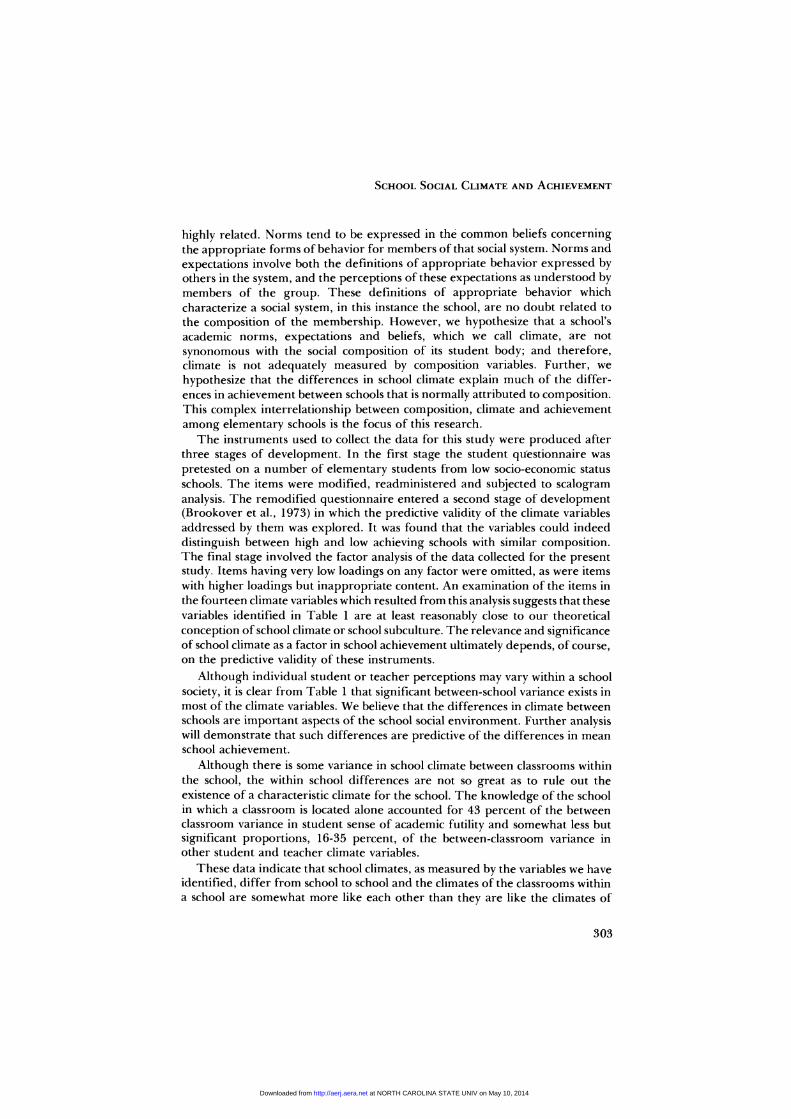
highly related. Norms tend to be expressed in the common beliefs concerning the appropriate forms of behavior for members of that social system. Norms and expectations involve both the definitions of appropriate behavior expressed by others in the system, and the perceptions of these expectations as understood by members of the group. These definitions of appropriate behavior which characterize a social system, in this instance the school, are no doubt related to the composition of the membership. However, we hypothesize that a school's academic norms, expectations and beliefs, which we call climate, are not synonomous with the social composition of its student body; and therefore, climate is not adequately measured by composition variables. Further, we hypothesize that the differences in school climate explain much of the differences in achievement between schools that is normally attributed to composition. This complex interrelationship between composition, climate and achievement among elementary schools is the focus of this research.
The instruments used to collect the data for this study were produced after three stages of development. In the first stage the student questionnaire was pretested on a number of elementary students from low socio-economic status schools. The items were modified, readministered and subjected to scalogram analysis. The remodified questionnaire entered a second stage of development (Brookover et al., 1973) in which the predictive validity of the climate variables addressed by them was explored. It was found that the variables could indeed distinguish between high and low achieving schools with similar composition. The final stage involved the factor analysis of the data collected for the present study. Items having very low loadings on any factor were omitted, as were items with higher loadings but inappropriate content. An examination of the items in the fourteen climate variables which resulted from this analysis suggests that these variables identified in Table 1 are at least reasonably close to our theoretical conception of school climate or school subculture. The relevance and significance of school climate as a factor in school achievement ultimately depends, of course, on the predictive validity of these instruments.
Although individual student or teacher perceptions may vary within a school society, it is clear from Table 1 that significant between-school variance exists in most of the climate variables. We believe that the differences in climate between schools are important aspects of the school social environment. Further analysis will demonstrate that such differences are predictive of the differences in mean school achievement.
Although there is some variance in school climate between classrooms within the school, the within school differences are not so great as to rule out the existence of a characteristic climate for the school. The knowledge of the school in which a classroom is located alone accounted for 43 percent of the between classroom variance in student sense of academic futility and somewhat less but significant proportions, 16-35 percent, of the between-classroom variance in other student and teacher climate variables.
These data indicate that school climates, as measured by the variables we have identified, differ from school to school and the climates of the classrooms within a school are somewhat more like each other than they are like the climates of
303
at NORTH CAROLINA STATE UNIV on May 10, 2014http://aerj.aera.netDownloaded from

TABLE 1 Mean and Standard Deviation of Mean School Variables in Three Samples of Michigan Ele
Variable State Sample m o"
1974 Achievement Mean SES Percent White
STUDENT Student Climate I, Sense of Academic
Futility Student Climate II, Future Evaluations and
Expectations Student Climate III, Perceived Present
Evaluations and Expectations Student Climate IV, Perception of Teacher
Push and Teacher Norms Student Climate V, Academic Norms
74.88 3.03
85.44
45.97
42.68
23.11
16.63 22.81
9.53 1.01
27.37
2.11
3.60
.81
.59
.62
56
42
42
24
16 22
at NORTH CAROLINA STATE UNIV on May 10, 2014http://aerj.aera.netDownloaded from
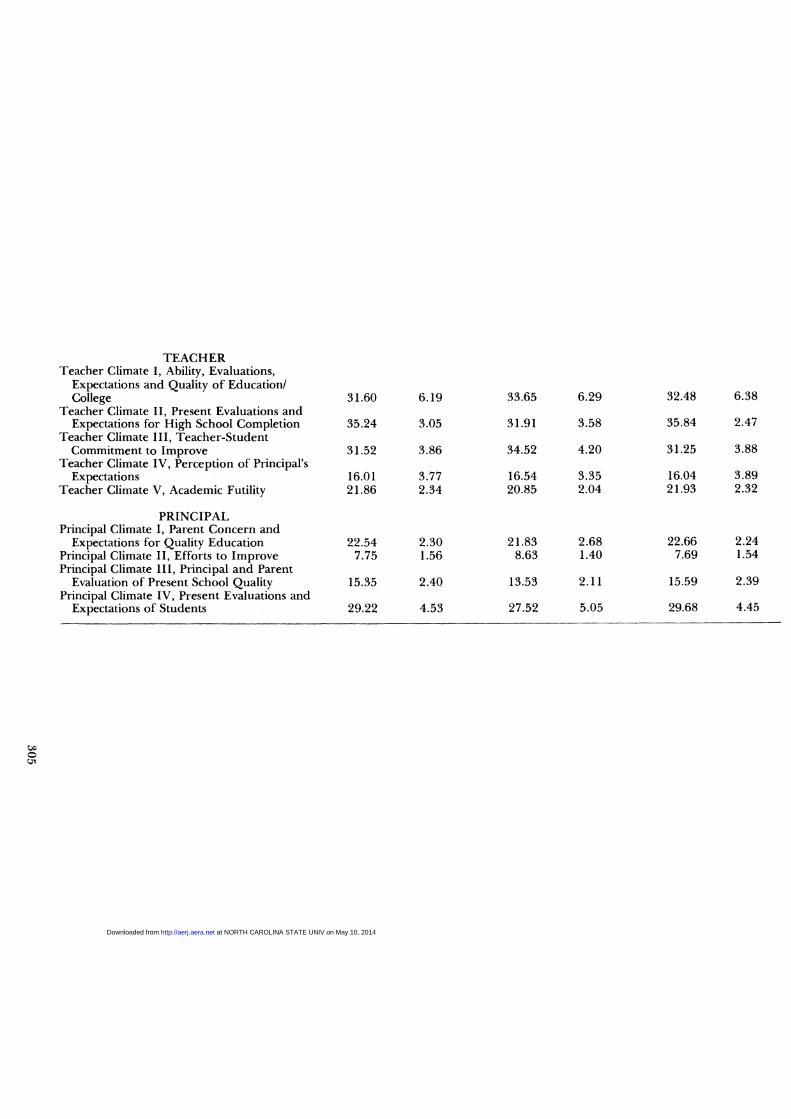
TEACHER Teacher Climate I, Ability, Evaluations,
Expectations and Quality of Education/ College 31.60
Teacher Climate II, Present Evaluations and Expectations for High School Completion 35.24
Teacher Climate III, Teacher-Student Commitment to Improve 31.52
Teacher Climate IV, Perception of Principal's Expectations 16.01
Teacher Climate V, Academic Futility 21.86
PRINCIPAL Principal Climate I, Parent Concern and
Expectations for Quality Education 22.54 Principal Climate II, Efforts to Improve 7.75 Principal Climate III, Principal and Parent
Evaluation of Present School Quality 15.35 Principal Climate IV, Present Evaluations and
Expectations of Students 29.22
o Ox
6.19
3.05
3.86
3.77 2.34
2.30 1.56
2.40
4.53
33
31
34
16 20
21 8
13
27
at NORTH CAROLINA STATE UNIV on May 10, 2014http://aerj.aera.netDownloaded from

BROOKOVER ET AL
classrooms in other schools in the state random sample. Thus, the school is an appropriate and meaningful social unit for the analysis of the effect of social climate on achievement.
School Composition Variables
Two school composition variables, mean socio-economic status and percent white, were used in this study. The mean socio-economic status of the schools in this sample was determined in one of two ways. In all the schools outside the City of Detroit, the students were asked to identify the occupation of the family's main breadwinner. Members of the research staff who administered the questionnaires provided assistance when needed in identifying occupations. The occupation data were scored using the Duncan occupational scale with the resulting scores being averaged across all fourth and fifth grade students within a school to provide the mean school SES. School officials in the City of Detroit asked the research team not to obtain occupational data from the students. A sample of 50 students from the fourth and fifth grades in each Detroit school was selected at random by the principal or his designated assistant. Occupational data for the parents of the students in these samples were obtained from the enrollment card files maintained in each school. The data were given to the research team without identifying information so as to preserve the anonymity of the students.
The racial composition in each school is reported to the State Department of Education on the fourth Friday of each school year. From this report the percent white for each school was determined and included in the school assessment report.
The Dependent Variable
The dependent variable was the mean achievement of students in the fourth grade in each of the elementary schools as calculated from school level state achievement data obtained from the Michigan Assessment Program of the Michigan State Department of Education (Michigan Department of Education, 1975-76). Objective referenced tests in reading and mathematics are administered to all fourth grade students in Michigan public schools annually. The objectives for both tests are identified by committees of teachers and other educators. Competence in each objective is measured by five items. The achievement data for each school consists of the percentage of students mastering each of the 19 reading and 30 arithmetic objectives as well as data on each of the 245 items entering into these 49 objectives. Our dependent variable of primary interest is the school level average of the percentages passing each of the 49 objectives. Preliminary analysis examining intercorrelations among this average, the separate reading percentage average, the separate arithmetic percentage average, an average equally weighing the reading and arithmetic percentage, reading total scores, arithmetic total scores, weighted and unweighted average of reading and arithmetic, demonstrated minimum correlations above .97.
306
at NORTH CAROLINA STATE UNIV on May 10, 2014http://aerj.aera.netDownloaded from

SCHOOL SOCIAL CLIMATE AND ACHIEVEMENT
The School Samples
The schools were random samples of the universe of Michigan public elementary schools that contained fourth and fifth grade students at the time the samples were drawn. There are three groups of schools upon which our analyses focused: the representative state sample, the black sample and the white sample. The 68 schools in the state sample constitute a random sample of Michigan public schools containing fourth and fifth grade students. The 61 schools in the white sample are those schools contained in the state sample whose student population is more than 50 percent white. These schools, therefore, constitute a random sample of majority white Michigan public schools containing fourth and fifth grade students. The black sample is composed of the seven majority black schools contained in the state sample along with 23 additional majority black schools randomly selected from the population of majority black Michigan public schools containing fourth and fifth grade students. Table 2 shows the characteristics for each group. Less than one percent of the student questionnaires were unusable and approximately two percent of the teachers failed to return completed questionnaires. As noted in Table 2, a small number of schools drawn in the samples refused to cooperate. Analysis carried out usins^ state assessment data revealed no significant difference between cooperative and non-cooperative schools on achievement, racial composition or community type. Based on these facts, we feel a strong case can be made to generalize the results to the relevant population of Michigan public schools containing fourth and fifth grade students.
Data Collection
The student questionnaires were administered in each school by a trained staff of research personnel. To avoid reading difficulties, the questions were read to the students. Each fourth and fifth grade teacher was asked to respond to the teacher questionnaire during the time at which the student questionnaires
TABLE 2 Population Data Concerning Three Random Samples of Public Elementary Schools in
Michigan with Fourth and Fifth Grade Students
Schools in Universe Sampled Schools
Participating Sampled Schools
Not Participating Students Participating Teachers Participating Principals Participating
State Sample
2,226
68
10 8,078
327 68
Black Sample
225
30
7 4,737
177 30
White Sample
2,001
61
7 6,729
276 61
307
at NORTH CAROLINA STATE UNIV on May 10, 2014http://aerj.aera.netDownloaded from
BROOKOVER ET AL
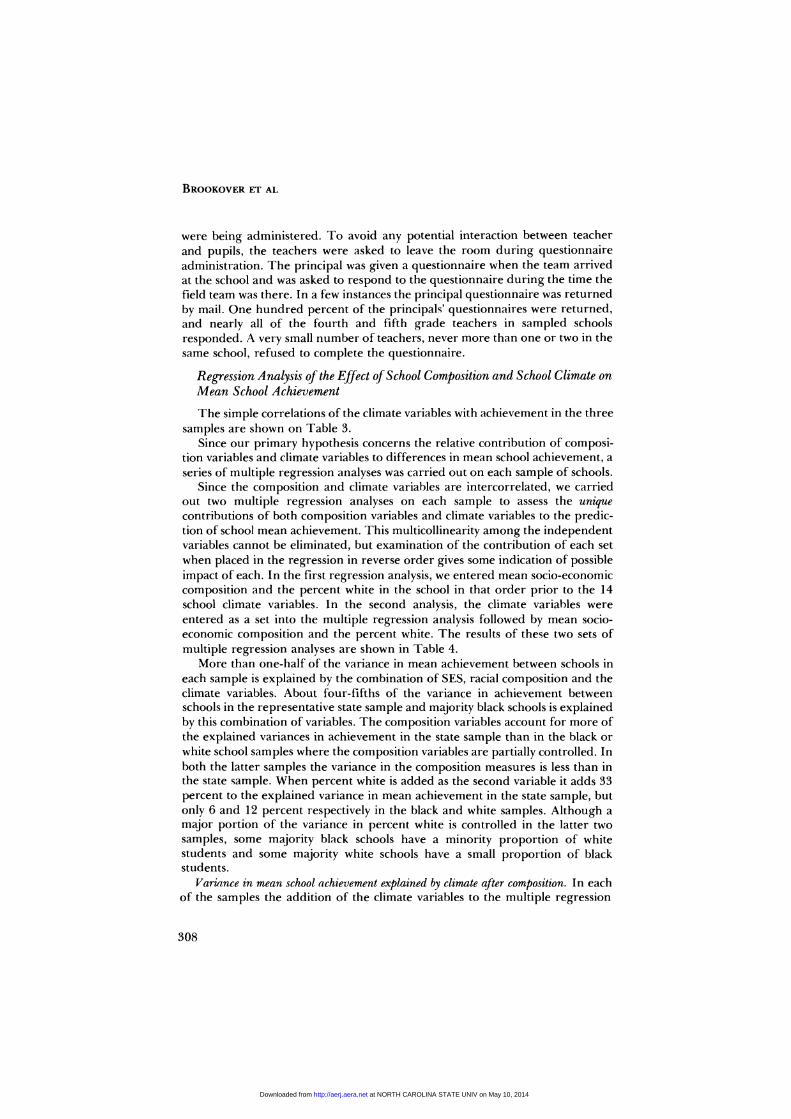
were being administered. To avoid any potential interaction between teacher and pupils, the teachers were asked to leave the room during questionnaire administration. The principal was given a questionnaire when the team arrived at the school and was asked to respond to the questionnaire during the time the field team was there. In a few instances the principal questionnaire was returned by mail. One hundred percent of the principals' questionnaires were returned, and nearly all of the fourth and fifth grade teachers in sampled schools responded. A very small number of teachers, never more than one or two in the same school, refused to complete the questionnaire.
Regression Analysis of the Effect of School Composition and School Climate on Mean School Achievement
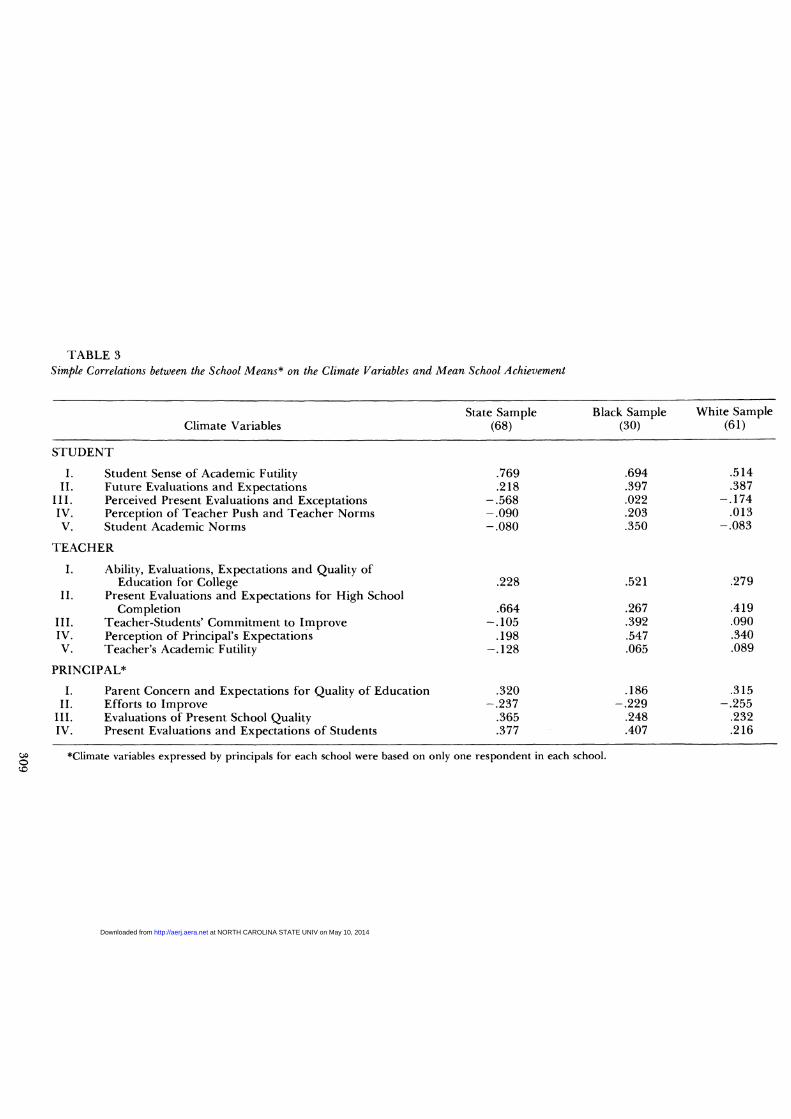
The simple correlations of the climate variables with achievement in the three samples are shown on Table 3.
Since our primary hypothesis concerns the relative contribution of composition variables and climate variables to differences in mean school achievement, a series of multiple regression analyses was carried out on each sample of schools.
Since the composition and climate variables are intercorrelated, we carried out two multiple regression analyses on each sample to assess the unique contributions of both composition variables and climate variables to the prediction of school mean achievement. This multicollinearity among the independent variables cannot be eliminated, but examination of the contribution of each set when placed in the regression in reverse order gives some indication of possible impact of each. In the first regression analysis, we entered mean socio-economic composition and the percent white in the school in that order prior to the 14 school climate variables. In the second analysis, the climate variables were entered as a set into the multiple regression analysis followed by mean socioeconomic composition and the percent white. The results of these two sets of multiple regression analyses are shown in Table 4.
More than one-half of the variance in mean achievement between schools in each sample is explained by the combination of SES, racial composition and the climate variables. About four-fifths of the variance in achievement between schools in the representative state sample and majority black schools is explained by this combination of variables. The composition variables account for more of the explained variances in achievement in the state sample than in the black or white school samples where the composition variables are partially controlled. In both the latter samples the variance in the composition measures is less than in the state sample. When percent white is added as the second variable it adds 33 percent to the explained variance in mean achievement in the state sample, but only 6 and 12 percent respectively in the black and white samples. Although a major portion of the variance in percent white is controlled in the latter two samples, some majority black schools have a minority proportion of white students and some majority white schools have a small proportion of black students.
Variance in mean school achievement explained by climate after composition. In each of the samples the addition of the climate variables to the multiple regression
308
at NORTH CAROLINA STATE UNIV on May 10, 2014http://aerj.aera.netDownloaded from
State Sam (68)
.76
.21 - . 5 6 - . 0 9 - . 0 8
TABLE 3 Simple Correlations between the School Means* on the Climate Variables and Mean School A
Climate Variables
STUDENT
I. Student Sense of Academic Futility II. Future Evaluations and Expectations
I I I . Perceived Present Evaluations and Exceptations IV. Perception of Teacher Push and Teacher Norms V. Student Academic Norms
TEACHER
I. Ability, Evaluations, Expectations and Quality of Education for College .22
II. Present Evaluations and Expectations for High School Completion .66
III. Teacher-Students' Commitment to Improve —.10 IV. Perception of Principal's Expectations .19 V. Teacher's Academic Futility —.12
PRINCIPAL*
I. Parent Concern and Expectations for Quality of Education .32 II. Efforts to Improve - . 2 3
III. Evaluations of Present School Quality .36 IV. Present Evaluations and Expectations of Students .37
g *Climate variables expressed by principals for each school were based on only one respond
at NORTH CAROLINA STATE UNIV on May 10, 2014http://aerj.aera.netDownloaded from

TABLE 4 Summary of Multiple Regression Analyses
Variance in Mean School Achievement Attributed to:
State Sample (68)
R2 R2 added
Black (
R2
With three variables:
SES entered first Percent white Climate
Climate entered first SES Percent white
With two variables:
SES entered first Climate
Climate entered first SES
.456
.785 .826«
.725
.746
.827
.456 746c
.725
.746
.329
.041
.021
.081
.290
.021
.360
.416
.778
.728
.777
.778
.360
.777
.728
.777
"One climate variable, Principal Climate I, was omitted because the F-level was insufficient *One climate variable, Teacher Climate II, was omitted because the F-level was insufficient cOne climate variable, Student Climate IV, was omitted because the F-level was insufficien
at NORTH CAROLINA STATE UNIV on May 10, 2014http://aerj.aera.netDownloaded from
SCHOOL SOCIAL CLIMATE AND ACHIEVEMENT
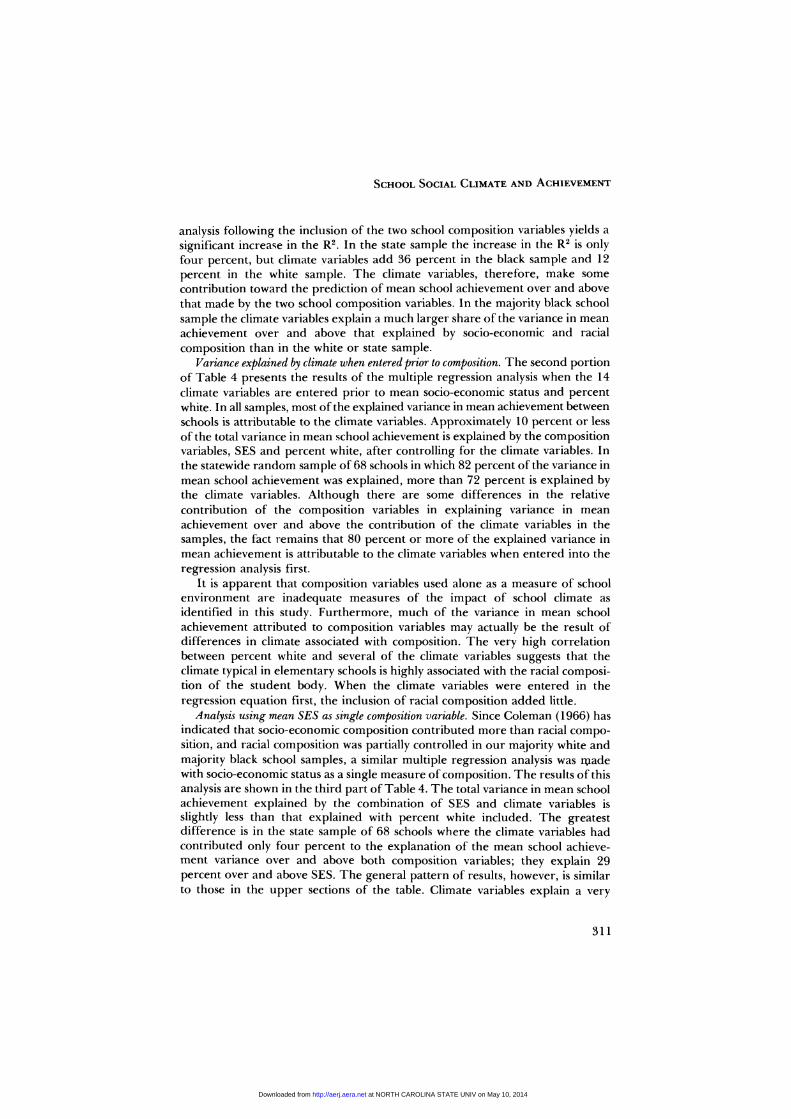
analysis following the inclusion of the two school composition variables yields a significant increase in the R2. In the state sample the increase in the R2 is only four percent, but climate variables add 36 percent in the black sample and 12 percent in the white sample. The climate variables, therefore, make some contribution toward the prediction of mean school achievement over and above that made by the two school composition variables. In the majority black school sample the climate variables explain a much larger share of the variance in mean achievement over and above that explained by socio-economic and racial composition than in the white or state sample.
Variance explained by climate when entered prior to composition. The second portion of Table 4 presents the results of the multiple regression analysis when the 14 climate variables are entered prior to mean socio-economic status and percent white. In all samples, most of the explained variance in mean achievement between schools is attributable to the climate variables. Approximately 10 percent or less of the total variance in mean school achievement is explained by the composition variables, SES and percent white, after controlling for the climate variables. In the statewide random sample of 68 schools in which 82 percent of the variance in mean school achievement was explained, more than 72 percent is explained by the climate variables. Although there are some differences in the relative contribution of the composition variables in explaining variance in mean achievement over and above the contribution of the climate variables in the samples, the fact remains that 80 percent or more of the explained variance in mean achievement is attributable to the climate variables when entered into the regression analysis first.
It is apparent that composition variables used alone as a measure of school environment are inadequate measures of the impact of school climate as identified in this study. Furthermore, much of the variance in mean school achievement attributed to composition variables may actually be the result of differences in climate associated with composition. The very high correlation between percent white and several of the climate variables suggests that the climate typical in elementary schools is highly associated with the racial composition of the student body. When the climate variables were entered in the regression equation first, the inclusion of racial composition added little.
Analysis using mean SES as single composition variable. Since Coleman (1966) has indicated that socio-economic composition contributed more than racial composition, and racial composition was partially controlled in our majority white and majority black school samples, a similar multiple regression analysis was made with socio-economic status as a single measure of composition. The results of this analysis are shown in the third part of Table 4. The total variance in mean school achievement explained by the combination of SES and climate variables is slightly less than that explained with percent white included. The greatest difference is in the state sample of 68 schools where the climate variables had contributed only four percent to the explanation of the mean school achievement variance over and above both composition variables; they explain 29 percent over and above SES. The general pattern of results, however, is similar to those in the upper sections of the table. Climate variables explain a very
311
at NORTH CAROLINA STATE UNIV on May 10, 2014http://aerj.aera.netDownloaded from

BROOKOVER ET AL
significant additional amount of the variance after the effect of SES has been removed in each of the samples. Approximately one-fifth or more of the total variance is explained by climate.
When the reverse process is used in the multiple regression analysis, the mean SES composition adds little to the explained variance after the effect of climate variables has been controlled. In none of the samples does SES add more than five percent to the variance explained after the effects of climate variables are removed.
Relative contribution of several climate variables to variance in mean achievement. Since it is clear that the combination of school climate variables identified in this study contribute significantly to the explanation of the variance in mean school achievement, we examined the individual contribution of each of several climate variables to mean achievement. The variables were entered in the order of their partial correlation with mean achievement after partialling out previously entered variables. A summary of the variables contributing to the variance in achievement with significance less than .01 are shown in Table 5. In all three samples, the students' sense of academic futility clearly contributes more than any of the other climate variables. This variable is more important in the prediction of achievement in schools containing black students than in majority white schools. Student and teacher variables concerned with the present evaluations and expectations which teachers hold for the students, and the students' perception of present evaluations and expectations also contribute significantly in the statewide sample. These three variables explain more than 68 percent of the between-school variance in mean achievement. In the majority black school sample two variables, student sense of futility and teacher-student commitment to improve, explain 60 percent of the total variance in mean school achievement between schools. In the majority white school sample, student sense of futility explains 26 percent of the variance in achievement between schools. Although this is the only single contribution significant at the .01 level, other climate variables added 18 percent to the between-school difference in mean achievement.
Examination of the regression of achievement on all climate variables reveals that a somewhat different set contribute more highly to mean school achievement in majority black schools than in majority white schools. In the black schools, the teachers' commitment to improve enters the regression analysis immediately following the students' sense of academic futility and contributes an additional 13 percent to the explained variance in mean achievement. The teachers' commitment to doing a good job and their perception of similar student commitment makes more differences in achievement in the majority black elementary schools than in the white ones. The climate variables that account for one percent or more of the variance in mean school achievement in the majority white sample in addition to the student sense of academic futility include student academic norms, the teachers' expressed evaluations and expectations, and the principal's efforts to improve. They contribute relatively more in the white than in the black sample. The 14 climate variables explain over 44 percent of the variance in mean school achievement in the white sample while
312
at NORTH CAROLINA STATE UNIV on May 10, 2014http://aerj.aera.netDownloaded from
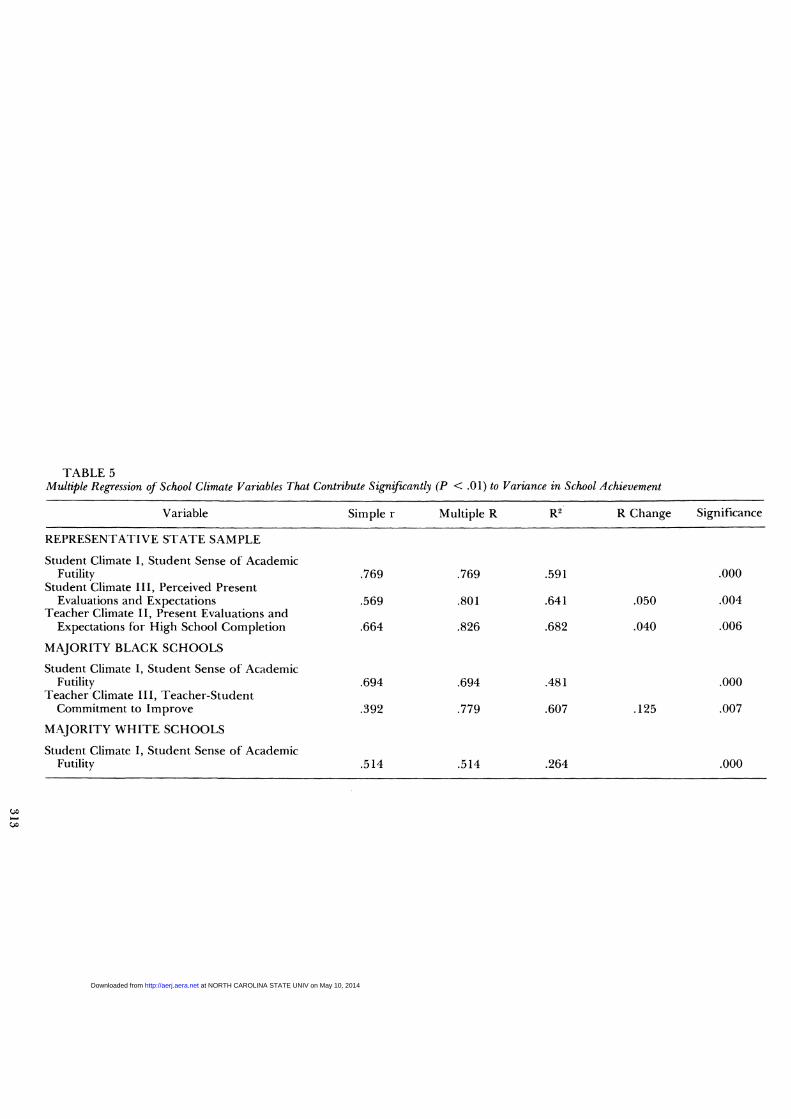
TABLE 5 Multiple Regression of School Climate Variables That Contribute Significantly (P < .01) to
Variable Simple r Multiple R
REPRESENTATIVE STATE SAMPLE
Student Climate I, Student Sense of Academic Futility
Student Climate III, Perceived Present Evaluations and Expectations
Teacher Climate II, Present Evaluations and Expectations for High School Completion
MAJORITY BLACK SCHOOLS
Student Climate I, Student Sense of Academic Futility
Teacher Climate III, Teacher-Student Commitment to Improve
MAJORITY WHITE SCHOOLS
Student Climate I, Student Sense of Academic Futility .514 .514
.769
.569
.664
.694
.392
.769
.801
.826
.694
.779
at NORTH CAROLINA STATE UNIV on May 10, 2014http://aerj.aera.netDownloaded from
BROOKOVER ET AL
they explain over 72 percent in both the state and black school samples. It appears, therefore, that other unidentified variables are contributing more to the variance in mean school achievement in representative white elementary schools than in the majority black ones.2
The Nature of Students' Sense of Academic Futility
Since students' sense of academic futility accounted for so much of the variance in mean school achievement in all the samples, further comments concerning the nature of this variable are appropriate. As will be noted by inspection of the items in this variable, it is in part composed of five items which are similar to Coleman's sense of control items. These are also similar to what has been identified as locus of control items. Clustered with these, however, are a set of items in which the students report the reaction of their fellow students to high achievement and another set that indicates the students' perception of the teachers' concern for academic achievement. A school characterized by a high sense of academic futility, therefore, is one in which the students feel they have no control over their success or failure in the school social system, the teachers do not care if they succeed or not, and their fellow students punish them if they do succeed. This variable then is not the same as one identified as sense of control or locus of control even though it encompasses a similar dimension. The items in students' sense of academic futility are oriented specifically toward the school and its members, while locus of control has a more general orientation. Furthermore, the types of items referring to fellow students' reactions to high achievement behavior and to the teachers' concern or lack of concern for high achievement are not included in what is commonly identified as locus of control. Although a measure of locus of control might be related to students' sense of academic futility, the two should not be equated. The latter, as used here, reflects the students' feelings about the possibility of functioning adequately in the school social system. High futility indicates a high degree of hopelessness in the school situation, low futility is a feeling that the system can be mastered.
Regression analyses were carried out using sense of academic futility as the dependent variable with the composition and other climate variables as independent ones to determine which, if any, of these significantly accounted for variance in sense of academic futility. In the state sample, teacher climate variables explain 54 percent of the mean variance in sense of academic futility with SES and percent white accounting for an additional 10 percent after the climate variables. In both the white and black samples, the teacher climate variables account for somewhat less of the variance in mean sense of academic futility, approximately 35 percent, and the contribution of SES and percent white was about the same.
A high student sense of academic futility is more typically characteristic of majority black schools than majority white ones and somewhat more characteris-
2 Analysis of the contribution of some school social structure variables indicates that emphasis on differentiated programs for different students contributes a significant additional percentage to the variance in mean achievement in the white schools. Differentiation is negatively associated with achievement.
314
at NORTH CAROLINA STATE UNIV on May 10, 2014http://aerj.aera.netDownloaded from
SCHOOL SOCIAL CLIMATE AND ACHIEVEMENT
tic of low SES white schools than high SES white ones. This relationship with composition makes it difficult to separate the effects of the two on school achievement in a regression analysis. Either removes most of the effect of the other when entered first. The students' sense of futility is thus an alternate explanation for much of the between-school difference in achievement which is explained by racial and socio-economic composition of the school or the racial and SES family background.
Findings from School Observation
It is clear from the above discussion that school climate is related to mean school achievement. However, the processes by which students become socialized in the school social system cannot be answered by our statistical analyses. Several of the sampled schools, therefore, were observed for several weeks following the survey to supplement the statistical results. Several comments concerning these schools and the findings from these observations are relevant to the issues of this paper.
Four schools were selected for participant observation based on their SES, racial composition and achievement levels. Schools having similar SES and racial composition but significantly different levels of achievement were paired. One pair was comprised of low SES, predominantly black schools having significantly different levels of achievement, and the other pair were low SES white schools having different levels of achievement. Two staff members who had been involved with the research from the outset and were, therefore, well acquainted with the climate variables were the observers in these schools.
Although observation was the primary source of data, meaningful additional data were obtained through informal interviews with teachers, principals and students. The time spent in each school ranged from two weeks to three months.
The relatively high achieving lower SES schools, one 100 percent white and the other predominantly black and Chicano, are distinguished from similar low achieving schools by several characteristics in addition to the school climate differences previously identified.
First, the teachers in higher achieving schools spend a larger proportion of class time in instruction. This commitment of time to instruction in higher achieving schools is associated with greater concern for and commitment to their students' achievement. The commitment is also expressed by other forms of interaction with their students.
Second, low SES schools achieving at lower levels tend to "write o f f a larger proportion of their student body. For example, in one of the schools, nearly half of the students are grouped in a slow group and low ceilings were established for their achievement. In one of the higher achieving schools observed, very few students were so identified and only for the purpose of giving them extra intruction to maximize their achievement. In another higher achieving low SES school, the teachers indicate that although they probably will not be able to achieve a normal full-year gain in math or reading with some of their students, they continue to teach them with the normal year's growth as a goal.
Third, those schools with higher achievement are likely to use more instruc-
315
at NORTH CAROLINA STATE UNIV on May 10, 2014http://aerj.aera.netDownloaded from

BROOKOVER ET AL
tional activities in which groups of students are competing as teams rather than individually. This finding is in accord with the results of other research (DeVries and Mescon, 1975).
Fourth, we observed differences in teacher and student reinforcement practices in higher achieving and lower achieving schools. In the two higher achieving lower SES schools, there was little evidence of either confused or positive reinforcement of students who gave incorrect answers. General practice was for the teachers to make immediate corrections and provide reinstruction when students failed to give correct responses. Also, positive reinforcement was generally given immediately to students who gave correct answers. In lower achieving schools we observed numerous instances where the students were neither positively nor negatively reinforced for their performance. On other occasions, students identified as slow were positively reinforced for incorrect answers. Confusion in reinforcement, in which students get the same kind of reinforcement for wrong answers as they get for right answers, is also evident in these lower achieving schools.
The above findings from observations of four schools are tentative. They do, however, demonstrate that schools with similar SES and racial composition do differ in the patterns of interaction associated with school climate. These differences may also contribute to differences in achievement between schools.
Conclusions and Implications
The first and foremost general conclusion derived from this research is that some aspects of school social environment clearly make a difference in the academic achievement of schools. There are large differences between schools in the percentage of students who master the basic academic objectives in the early elementary years. This mean percentage in our samples ranges from 42 percent to 88 percent. The socio-economic and racial composition of the schools can explain a significant portion of this variance. However, only a small proportion of the variance in achievement between schools is explained by these composition variables after the effect of the social-psychological climate variables has been removed. The climate variables are about as good an explanation of achievement in the representative state and white school samples as composition and are a decidedly better explanation in the majority black school sample. Some low SES white and black schools do have school climates favorable for achievement and some high SES schools have school climates that are not highly favorable for achievement. It is clear that school composition does not necessarily determine school climate, and therefore changes in school composition in the absence of changes in climate do not guarantee changes in school level achievement. Predominantly low SES and minority schools are more likely to be characterized by a high sense of student academic futility, low academic norms and low expectations for and evaluations of the students. In fact, these composition characteristics frequently may contribute to the development of differential expectations, norms, and feelings of futility. But these composition variables do not invariably produce such climate differences. Favorable climate
316
at NORTH CAROLINA STATE UNIV on May 10, 2014http://aerj.aera.netDownloaded from
SCHOOL SOCIAL CLIMATE AND ACHIEVEMENT
rather than specific composition is, we believe, the necessary condition for high achievement.
Our analysis demonstrates that the evaluations and expectations made of students and the students' perceptions of these evaluations and expectations and their feelings about possible success in the school are clearly related to the students' achievement. This research does not, however, demonstrate how these climate characteristics develop in a school. The atypical schools demonstrate that favorable climate can exist in low SES and minority schools, but the process by which such climate and associated higher achievement came to exist is not explicated by this research. Current efforts to change some schools should provide some answers to this question.
If we apply these findings to the school desegregation issue, it seems safe to conclude that neither racial nor socio-economic desegregation of schools automatically produces higher school achievement. If the unfavorable social-psychological climate which typically characterizes segregated black and lower SES schools continues to prevail for the poor or minority students in the desegregated schools, desegregation is not likely to materially affect achievement of the students. If the social-psychological climate relevant to the poor and minority is improved in conjunction with desegregation, higher achievement is likely to result. The inconsistent effect of racial desegregation on school achievement (St. John, 1975) may result from inconsistent patterns of change in the academic climate relevant to minority students in desegregated schools.
C O N T R I B U T O R S
WILBUR B. BROOKOVER, Professor, Department of Urban and Metropolitan Studies, College of Urban Development, Michigan State University, East Lansing, Michigan 48823.
JOHN H. SCHWEITZER, Associate Professor, Department of Urban and Metropolitan Studies, College of Urban Development, Michigan State University, East Lansing, Michigan 48823.
JEFFREY M. SCHNEIDER, Assistant Professor, Department of Education, Brown University, Providence, Rhode Island 02912.
CHARLES H. BEADY, Assistant Professor, Department of Education, Morgan State University, 321 Jenkins, Cold Springs and Hillen Road, Baltimore, Maryland 21239.
PATRICIA K. FLOOD, Evaluation Department, Lansing School District, 519 West Kalamazoo Street, Lansing, Michigan 48909.
JOSEPH M. WISENBAKER, Research Triangle in Chapel Hill, Chapel Hill, North Carolina 27514.
REFERENCES
ANDERSON, G. Effects of classroom social climate on individual learning. American Educational Research Journal, March, 1970,7, 135-152.
BROOKOVER, W. B., GIGLIOTTI, R., HENDERSON, R., 8C SCHNEIDER, J. Elementary school environment and achievement. East Lansing: Michigan State University, College of Urban Development, 1973.
317
at NORTH CAROLINA STATE UNIV on May 10, 2014http://aerj.aera.netDownloaded from
BROOKOVER ET AL
BROOKOVER, W. B., 8C ERICKSON, E. Sociology of education. Homewood, Illinois: Dorsey Press, 1975.
BROOKOVER, W. B., 8C SCHNEIDER, J. Academic environments and elementary school achievement. Journal of Research and Development in Education, 1975, 9, 83-91.
BROOKOVER, W. B., BEADY, C , FLOOD, P., SCHWEITZER, J., 8c WISENBAKER, J. Schools can
make a difference. A Study of Elementary School Social Systems and School Outcomes. East Lansing, Michigan: Michigan State University, Center for Urban Affairs, 1977.
COLEMAN, J., CAMPBELL, E., HOBSON, C , MCPARTLAND, J., MOOD, A., WEINFELD, F., 8C
YORK, R. Equality of educational opportunity. Washington, DC: US Government Printing Office, 1966.
DEVRIES, D., 8C MESCON, I. Team-games-tournament: An effective task and reward structure in elementary grades. Baltimore: Johns Hopkins University, Center for Social Organization of Schools, Report 189, 1975.
HAUSER, R. M. Socio-economic background and educational performance. Washington, DC: American Sociological Association, 1971.
HAUSER, R. M., SEWELL, W., 8C ALWIN, D. High school effects on achievement. In W. Sewell, R. Hauser and D. Featherman (eds.), School and academic achievement in American society. New York: Academic Press, 1976.
JENCKS, C , SMITH, M., ACLAND, H., BANE, M., COHEN, D., GINTIS, H., HEYNS, B., 8C
MICHELSON, S. Inequality. New York: Basic Books, Inc., 1972. MICHIGAN DEPARTMENT OF EDUCATION, Questions and answers about Michigan educational
assessment. Lansing, Michigan: Michigan Department of Education, 1975-76. MCDILL, L., MEYERS, E. D., 8C RIGSBY, L. Institutional effects on academic behavior of high
school students. Sociology of Education, 1967, 40, 181-99. O'REILLY, R. Classroom climate and achievement in secondary school mathematics classes.
Alberta Journal of Educational Research, 1975, XXI, 241-48. ST. JOHN, N. H. School desegregation-outcomes for children. New York: John Wiley and Sons,
1975.
318
at NORTH CAROLINA STATE UNIV on May 10, 2014http://aerj.aera.netDownloaded from