element partitioning between olivine and melt up to 10gpa: implications for the effect of pressure
TRANSCRIPT

Physics of the Earth and Planetary Interiors 212–213 (2012) 64–75
Contents lists available at SciVerse ScienceDirect
Physics of the Earth and Planetary Interiors
journal homepage: www.elsevier .com/locate /pepi
Element partitioning between olivine and melt up to 10 GPa: Implications forthe effect of pressure
Takamasa Imai a,⇑, Eiichi Takahashi a, Toshihiro Suzuki b, Takafumi Hirata c
a Magma Factory, Department of Earth and Planetary Sciences, Tokyo Institute of Technology, Ookayama, Meguro-ku, Tokyo 152-8550, Japanb IFREE, JAMSTEC, Natsushima-cho, Yokosuka-city, Kanagawa 237-0061, Japanc Department of Earth and Planetary Sciences, Kyoto University, Sakyo-ku, Kyoto-city, Kyoto 606-8501, Japan
a r t i c l e i n f o
Article history:Received 13 March 2012Received in revised form 31 July 2012Accepted 6 September 2012Available online 20 September 2012Edited by Kei Hirose
Keywords:Element partitioningTrace elementsOlivinePressure dependenceStructure of silicate melt
0031-9201/$ - see front matter � 2012 Elsevier B.V. Ahttp://dx.doi.org/10.1016/j.pepi.2012.09.001
⇑ Corresponding author. Address: Department of ETokyo Institute of Technology, 2-12-1 Ookayama, MJapan. Tel.: +81 3 5734 2338.
E-mail address: [email protected] (T. Imai).
a b s t r a c t
In order to investigate the effect of pressure on crystal–melt element partitioning, we have conductedpartitioning experiments between olivine and coexisting peridotite melt up to 10 GPa determining minorand trace compositions using electron microprobe and laser-ablation inductively coupled plasma-massspectrometry (ICP-MS). Partitioning data for monovalent and trivalent cations suggest a significant pres-sure effect. For monovalent cations, partition coefficients increase with pressure. In contrast, for trivalentcations, partition coefficients of smaller cations (Al, Ga) increase while those of large cations (Sc, REEs)decrease with pressure. To discuss the pressure effect on olivine–melt partitioning, data are interpretedusing partition coefficient – ionic radii (PC–IR) diagrams, in conjunction with the lattice strain model. Theresults show that the optimum ionic radius (r0) and apparent Young’s modulus (E) of the M-site in olivineboth decrease with pressure. The decrease in r0 can be explained by compression of the M-site in olivine.In contrast, the observed decrease in E of the M-site (width of the parabola increases with pressure) can-not be explained by the pressure and temperature effects on the crystal structure. The apparent softeningof a crystal site at high pressures is hard to reconcile with a change in crystal structure. We suggest thatthis effect may be explained by considering the change in structure of silicate melt at pressures that mayincrease the apparent ‘‘Young’s modulus of the M-site in the melt’’.
� 2012 Elsevier B.V. All rights reserved.
1. Introduction
Mineral–melt partition coefficients provide fundamental infor-mation for constraining chemical differentiation during meltingin the Earth’s interior and, as a result they have been studiedextensively. According to Onuma et al. (1968) and Matsui et al.(1977), who investigated so called PC–IR diagrams (in which parti-tion coefficients, PC, are plotted against the ionic radii, IR), themost important factors that control crystal/melt partition coeffi-cients are (1) the size of the crystallographic site into which theions partition, (2) the ionic radii of the ions that enter into the crys-tal site, and (3) the charge of the ion. Blundy and Wood (1994) ex-plained the general features in partition coefficients with the samevalence using free energy by lattice strain (Brice, 1975) and sug-gested that their theory could predict partition coefficients for ele-ments for which there are presently no experimental data.
Many subsequent experimental studies made use of Blundy andWood’s model. For example, PC–IR diagrams for garnet–melt equi-
ll rights reserved.
arth and Planetary Sciences,eguro-ku, Tokyo 152-8550,
librium have been studied experimentally (Van Westrenen et al.,1999) and thermodynamic models have been developed (Van Wes-trenen et al., 2001, 2003). However, experimental studies that havefocused on the pressure effect on PC–IR diagrams are still limited.Wood and Corgne (2007) summarized the experimental data ofpartition coefficients between garnet and melt and found somepressure effect on the PC–IR diagram. Van Westrenen and Draper(2007) also discussed the pressure effect on the garnet–melt PC–IR diagram. However, both discussions bear some ambiguity dueto the overwhelming compositional effect of complex substitutionsin garnet solid solutions (i.e., Pyrope-Grossular, Almandine, Major-ite, etc.).
In contrast to garnet solid solutions, the octahedral site (M-site)in olivine is dominated by the occupation of Mg and Fe and the Mg/Fe ratio is nearly constant in primitive mantle peridotite, thus thecompositional effect on the size of the M–O site is very small. Inaddition, olivine coexists with peridotite melt throughout uppermantle pressures (Takahashi, 1986; Zhang and Herzberg, 1994).For these reasons, we have studied the pressure effect on elementpartitioning between olivine and peridotite melt. Olivine–meltpartitioning at 1 atmosphere has previously been studied (e.g.,Beattie, 1994; Kennedy et al., 1993) and the pressure effect onmono- and trivalent cation partitioning has been reported (Taura

T. Imai et al. / Physics of the Earth and Planetary Interiors 212–213 (2012) 64–75 65
et al., 1998). We have undertaken a systematic study investigatingthe pressure dependence of the partition coefficients for 37 ele-ments (i.e., Si, K, Fe, Na, Ti, Al, Ca, Mn, Mg, Cr, Ni, REEs, Sc, Y, Ga,In, Sr, Li, Rb, Cs, Ge, Zr, Hf, Nb) between olivine and peridotite meltin the pressure range between 1 atmosphere and 10 GPa. Here wepresent the experimental results and discuss the origin of the pres-sure effect on elemental partitioning.
2. Experimental procedures
2.1. Melting experiments
Two starting materials, KLB-1D and KLB-1D2 were preparedbased on the composition of mantle peridotite KLB-1 (Takahashi,1986), whose high pressure melting relations have been exten-sively examined (Takahashi, 1986; Zhang and Herzberg, 1994;Takahashi et al., 1993). Since the concentrations of trace elementsin KLB-1 are generally too low to determine reliable partition coef-ficients, we added trace elements to natural peridotite KLB-1 byusing ‘‘doped basaltic glass (DBG)’’ which was prepared as follows:High purity oxides and carbonates of 26 elements (REEs, Sc, Y, Ga,In, Sr, Li, Rb, Cs, Ge, Zr, Hf, Nb) were mixed thoroughly with JB1 al-kali basalt (a reference rock distributed by the Geological Survey ofJapan). The concentration of each added element in DGB was1500–2000 lg/g. This mixture was fused twice in a furnace at1350 �C for 30 min in a CO2 atmosphere. In order to keep the bulkchemical compositions of starting materials close to that of KLB-1,we also added olivine, which was separated from peridotite KLB-1,to the starting materials. The mixed starting materials were thenfinely ground. Mixing ratios of natural peridotite KLB-1, DGB andolivine by weight were 90:3.5:6.5 for KLB-1D and 70:10.5:19.5for KLB-1D2. The resulting major, minor and trace element compo-sitions of these starting materials are given in Table 1.
Melting experiments were carried out at pressures ranging from1 atm to 10 GPa using a vertical quenching furnace, a piston-cylin-der apparatus and a multi anvil apparatus which are all installed atthe Magma Factory, Department of Earth and Planetary Sciences,Tokyo Institute of Technology. In order to keep the melt composi-tion close to that of the bulk composition of the starting materials,the experiments were conducted just below the liquidus of KLB-1(Table 2). The 1 atmosphere experiment was carried out using avertical quenching furnace. Oxygen partial pressure was main-tained at around the quartz–fayalite–magnetite (QFM) buffer,using a CO2–H2 gas mixture. The starting sample powder waspressed into a cylindrical shape (2 mm in diameter) and insertedinto the furnace by hanging on a Re-ribbon and Pt-wire. After themelting experiment, the sample was quenched by dropping ontoCu sheet placed at the bottom of the furnace.
The 2 GPa experiments were carried out using a Boyd & Eng-land-type piston cylinder apparatus. The furnace assembly con-sisted of a talc sleeve, Pyrex-glass, graphite heater and MgOinserts. The starting powder was loaded into a graphite capsulewith an outer diameter of 2.0 mm and inner diameter of 1.2 mm,and sealed in Pt tube to avoid water migration from the talc tothe sample. In order to obtain large enough crystals and melt poolsfor laser-ablation inductively coupled plasma-mass spectrometry(LA-ICP-MS) analysis (using a 32 lm spot size), the sample waskept at the run temperature for 20 h. The temperature of sampleswas monitored with a W5%Re–W26%Re thermocouple.
High pressure experiments at 5 and 10 GPa were performedusing a 1000 ton Kawai-type multi-anvil apparatus (‘‘SPI-1000’’).A 14 mm length Cr doped MgO octahedron was used as the pres-sure medium and tungsten carbide cubes with an 8 mm truncationwere used as second stage anvils. The starting powder was loadedinto a graphite capsule with an outer diameter of 2.0 mm and inner
diameter of 1.2 mm. The sample capsule was surrounded by MgOspacers, which were in turn surrounded by a cylindrical LaCrO3
heater with an outer diameter of 5.0 mm and inner diameter of3.0 mm (5 GPa) or 3.5 mm (10 GPa). The MgO cell parts and LaCrO3
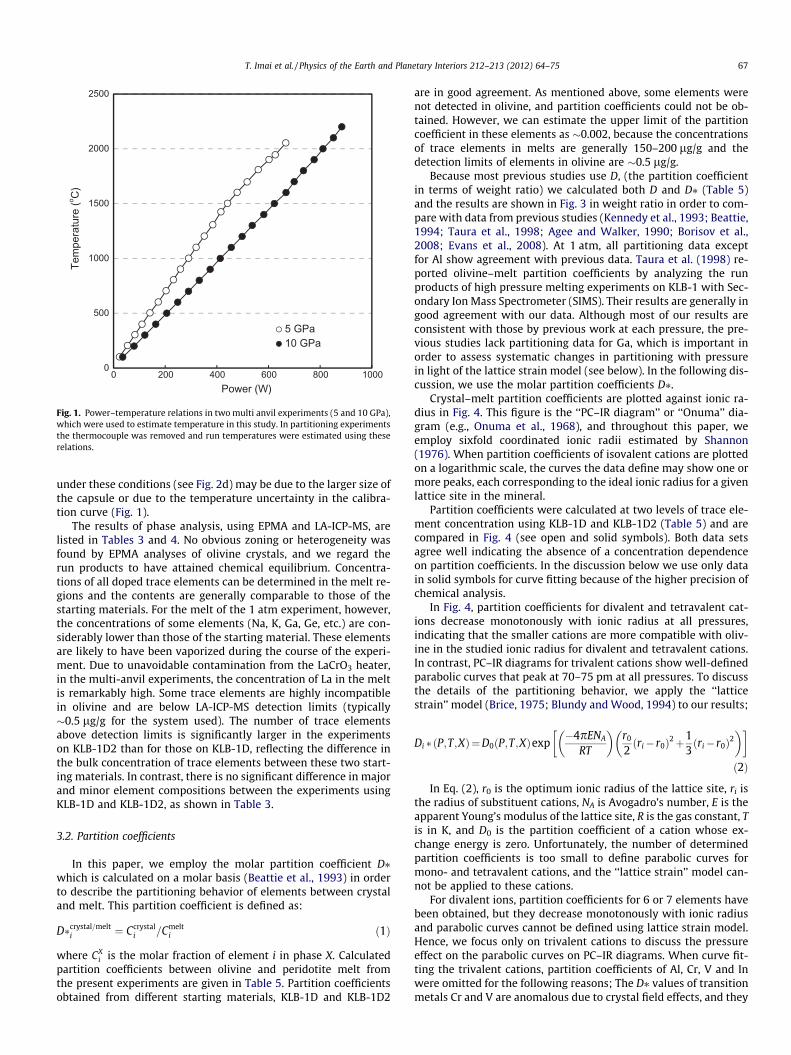
were fired at 1000 �C for more than 1 h prior to each experiment toeliminate moisture. Graphite capsules were dried in an oven at110 �C to eliminate absorbed water before assembly. Pressure val-ues were determined from the load of the press based on the pres-sure calibration by Aoki and Takahashi (2004). A thermocouplewas not used in the multi-anvil experiments; instead, the temper-ature was estimated using a systematic relationship betweenpower and temperature acquired from other experiments usingidentical cell-assemblies (Fig. 1). In the multi-anvil experiments,we employed a special heating path in order to obtain large enoughcrystals and melt pools (see Fig. 2). At the beginning of sampleheating, the temperature was increased to between 100 and150 �C above the liquidus temperature, and then cooled slowly(100 �C/min) to the desired run temperature, which was main-tained for 1 h, and followed by quenching of the sample by turningoff of the electrical power supply.
2.2. Analytical methods
Recovered samples were mounted in epoxy resin and polishedfor electron probe micro analysis (EPMA). This was conductedusing a JEOL JXA-8800 at the Department of Earth and PlanetarySciences, Tokyo Institute of Technology. The instrument was oper-ated at an accelerating voltage of 15 kV with a beam current of12 nA. Quantitative analyses were performed for 11 elements (Si,K, Fe, Na, Ti, Al, Ca, Mn, Mg, Cr, Ni) using the ZAF correction meth-od. Minerals were analyzed with a focused beam. Melt regions con-taining quenched crystals were analyzed with a defocused beam of30 lm diameter. In this case, standards were also analyzed withthe defocused beam.
Quantitative analysis of trace elements was conducted using la-ser-ablation inductively coupled plasma mass spectrometry (LA-ICP-MS) at the Department of Geology and Mineralogy, Kyoto Uni-versity. The laser ablation system is based on a 193 nm wave-length argon-fluoride (ArF) excimer laser (GeoLas 200 CQ, Micr-oLas). Laser spot sizes of 32 lm were used with a pulse energy of140 mJ/shot, and the repetition rate of laser-ablation was 2 Hz(see Fig. 2b for laser spots). Helium instead of Ar gas was flushedinto the cell, which increased the sample transport efficiency andreduced the aerosol deposition at or around the ablation pit (Eg-gins et al., 1998; Guillong and Günther, 2002). The setup used aVG PlasmaQuad 2 quadrupole-based ICP-MS. In this study, dataacquisition was made using the time resolved analysis (TRA) mode.Signals were measured without any laser ablation for 40 s to deter-mine background intensities, followed by ablation of sample andintegration of signal intensities for 50 s. The analysis was per-formed for 28 isotopes (29Si, 45Sc, 51V, 69Ga, 72Ge, 85Rb, 88Sr, 89Y,90Zr, 93Nb, 115In, 133Cs, 137Ba, 139La, 140Ce, 141Pr, 146Nd, 147Sm,153Eu, 157Gd, 159Tb, 163Dy, 165Ho, 166Er, 169Tm, 172Yb, 175Lu, 178Hf).The calibration standard for quantitative analysis of trace elementswas the NIST SRM 610 glass standard (Pearce et al., 1996). 29Si wasused for the internal standard isotope.
3. Results
3.1. Recovered samples
Backscattered electron images of recovered samples using KLB-1D and KLB-1D2 starting materials are shown in Fig. 2. Small oliv-ine crystals (10–40 lm) were distributed throughout the 1 atmo-sphere sample, and quenched crystals were also found all over

Table 1Composition of starting materials.
KLB-1a DBGb Olivine (KLB-l)a KLB-1Dc KLB-1D2c
Major and minor elements (wt%)SiO 44.48 50.01 39.64 44.36 44.12TiO2 0.16 1.29 – 0.19 0.25A12O3 3.59 13.93 0.03 3.72 3.98FeO 8.1 7.72 10.52 8.24 8.53MnO 0.12 0.15 0.16 0.12 0.13MgO 39.22 7.41 48.25 38.69 37.64CaO 3.44 8.9 0.08 3.41 3.36Na2O 0.3 2.68 0.01 0.36 0.49K2O 0.02 1.37 – 0.07 0.16P2O5 0.03 0.25 – 0.04 0.05Cr2O3 0.31 – 0.01 0.28 0.22NiO 0.25 – 0.39 0.25 0.25Total 100.02 99.8 99.09 99.74 99.18Total of trace elements – 6.09 – 0.21 0.64
KLB-1Dc KLB-1D2c
Added trace elements (lg/g)Li 44 131Sc 50 150Ga 49 148Ge 51 154Rb 81 242Sr 51 153Y 55 164Zr 50 151Nb 48 143In 51 152Cs 68 203La 61 184Hf 55 164Ce 50 149Pr 53 158Nd 57 170Sm 63 190Eu 50 149Gd 88 264Tb 51 154Dy 50 151Ho 54 162Er 53 158Tm 58 174Yb 66 199Lu 60 180
a Takahashi (1986).b Composition of DBG (doped basaltic glass) is calculated from composition of JB-1 and the amount of added trace
elements.c Calculated composition of KLB-1D and KLB-1D2. KLB-1D and KLB-1D2 are mixtures of KLB-1, DBG and olivine of
KLB-1 in the weight ratio of 90:3.5:6.5 and 70:10.5:19.5, respectively.
Table 2Overview of experiments.
Run No. Pressure (GPa) Holding temperature (�C) Maximum temperature (�C) Holding duration (h) Starting material Phase Assembly
5–2 latm 1590 – 1 KLB-1D2 ol + l Pt wireP775 2 1750 – 16 KLB-1D ol + l CP777 2 1700 – 20 KLB-1D2 ol + l CSI 606 5 1850 (580W)* 2000 (640W)* 1 KLB-1D ol + l CS1615 5 1850 (580W)* 2000 (640W)* 1 KLB-1D2 ol + l CS1605 10 2150 (870W)* 2250 (900W)* 1 KLB-1D gar + ol + 1 CS1614 10 2150 (870W)* 2250 (900W)* 1 KLB-1D2 gar + ol + 1 C
* Temperature was estimated using a systematic relationship between power and temperature acquired from other runs whose cell-assembly is the same cell-assemblyexcept for the thermocouple. See Fig. 1. ol: olivine, gar: garnet, l: liquid.
66 T. Imai et al. / Physics of the Earth and Planetary Interiors 212–213 (2012) 64–75
the melt region. In high pressure runs (2, 5, and 10 GPa), large oliv-ine crystals were located in the bottom of the capsules (low tem-perature side) of the run products, and quenched crystals werealso found in melt pools as observed in the 1 atm run. Garnet crys-tals were found to coexist with olivine at around the liquidus in the
10 GPa experiment. The phase relations obtained at 1 atm, 2 and5 GPa are consistent with the phase diagram of KLB-1 (Takahashi,1986; Zhang and Herzberg, 1994). The experiments at 10 GPaand 2150 �C were carried out at a temperature slightly above theinferred liquidus. The presence of a large amount of solid residue
0
500
1000
1500
2000
2500
0 200Power (W)
400 600 800
5 GPa10 GPa
1000
Tem
pera
ture
(o C)
Fig. 1. Power–temperature relations in two multi anvil experiments (5 and 10 GPa),which were used to estimate temperature in this study. In partitioning experimentsthe thermocouple was removed and run temperatures were estimated using theserelations.
T. Imai et al. / Physics of the Earth and Planetary Interiors 212–213 (2012) 64–75 67
under these conditions (see Fig. 2d) may be due to the larger size ofthe capsule or due to the temperature uncertainty in the calibra-tion curve (Fig. 1).
The results of phase analysis, using EPMA and LA-ICP-MS, arelisted in Tables 3 and 4. No obvious zoning or heterogeneity wasfound by EPMA analyses of olivine crystals, and we regard therun products to have attained chemical equilibrium. Concentra-tions of all doped trace elements can be determined in the melt re-gions and the contents are generally comparable to those of thestarting materials. For the melt of the 1 atm experiment, however,the concentrations of some elements (Na, K, Ga, Ge, etc.) are con-siderably lower than those of the starting material. These elementsare likely to have been vaporized during the course of the experi-ment. Due to unavoidable contamination from the LaCrO3 heater,in the multi-anvil experiments, the concentration of La in the meltis remarkably high. Some trace elements are highly incompatiblein olivine and are below LA-ICP-MS detection limits (typically�0.5 lg/g for the system used). The number of trace elementsabove detection limits is significantly larger in the experimentson KLB-1D2 than for those on KLB-1D, reflecting the difference inthe bulk concentration of trace elements between these two start-ing materials. In contrast, there is no significant difference in majorand minor element compositions between the experiments usingKLB-1D and KLB-1D2, as shown in Table 3.
3.2. Partition coefficients
In this paper, we employ the molar partition coefficient D⁄which is calculated on a molar basis (Beattie et al., 1993) in orderto describe the partitioning behavior of elements between crystaland melt. This partition coefficient is defined as:
D�crystal=melti ¼ Ccrystal
i =Cmelti ð1Þ
where CXi is the molar fraction of element i in phase X. Calculated
partition coefficients between olivine and peridotite melt fromthe present experiments are given in Table 5. Partition coefficientsobtained from different starting materials, KLB-1D and KLB-1D2
are in good agreement. As mentioned above, some elements werenot detected in olivine, and partition coefficients could not be ob-tained. However, we can estimate the upper limit of the partitioncoefficient in these elements as �0.002, because the concentrationsof trace elements in melts are generally 150–200 lg/g and thedetection limits of elements in olivine are �0.5 lg/g.
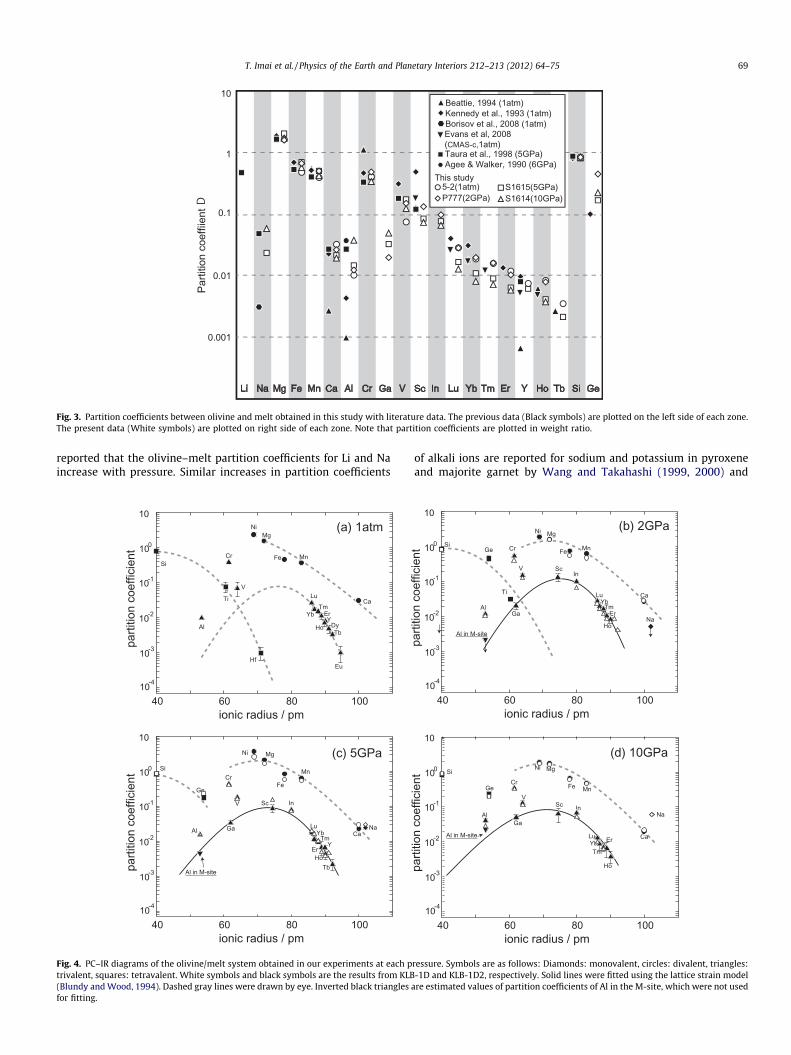
Because most previous studies use D, (the partition coefficientin terms of weight ratio) we calculated both D and D⁄ (Table 5)and the results are shown in Fig. 3 in weight ratio in order to com-pare with data from previous studies (Kennedy et al., 1993; Beattie,1994; Taura et al., 1998; Agee and Walker, 1990; Borisov et al.,2008; Evans et al., 2008). At 1 atm, all partitioning data exceptfor Al show agreement with previous data. Taura et al. (1998) re-ported olivine–melt partition coefficients by analyzing the runproducts of high pressure melting experiments on KLB-1 with Sec-ondary Ion Mass Spectrometer (SIMS). Their results are generally ingood agreement with our data. Although most of our results areconsistent with those by previous work at each pressure, the pre-vious studies lack partitioning data for Ga, which is important inorder to assess systematic changes in partitioning with pressurein light of the lattice strain model (see below). In the following dis-cussion, we use the molar partition coefficients D⁄.
Crystal–melt partition coefficients are plotted against ionic ra-dius in Fig. 4. This figure is the ‘‘PC–IR diagram’’ or ‘‘Onuma’’ dia-gram (e.g., Onuma et al., 1968), and throughout this paper, weemploy sixfold coordinated ionic radii estimated by Shannon(1976). When partition coefficients of isovalent cations are plottedon a logarithmic scale, the curves the data define may show one ormore peaks, each corresponding to the ideal ionic radius for a givenlattice site in the mineral.
Partition coefficients were calculated at two levels of trace ele-ment concentration using KLB-1D and KLB-1D2 (Table 5) and arecompared in Fig. 4 (see open and solid symbols). Both data setsagree well indicating the absence of a concentration dependenceon partition coefficients. In the discussion below we use only datain solid symbols for curve fitting because of the higher precision ofchemical analysis.
In Fig. 4, partition coefficients for divalent and tetravalent cat-ions decrease monotonously with ionic radius at all pressures,indicating that the smaller cations are more compatible with oliv-ine in the studied ionic radius for divalent and tetravalent cations.In contrast, PC–IR diagrams for trivalent cations show well-definedparabolic curves that peak at 70–75 pm at all pressures. To discussthe details of the partitioning behavior, we apply the ‘‘latticestrain’’ model (Brice, 1975; Blundy and Wood, 1994) to our results;
Di �ðP;T;XÞ¼D0ðP;T;XÞexp�4pENA
RT
� �r0
2ðri� r0Þ2þ
13ðri� r0Þ2
� �� �
ð2Þ
In Eq. (2), r0 is the optimum ionic radius of the lattice site, ri isthe radius of substituent cations, NA is Avogadro’s number, E is theapparent Young’s modulus of the lattice site, R is the gas constant, Tis in K, and D0 is the partition coefficient of a cation whose ex-change energy is zero. Unfortunately, the number of determinedpartition coefficients is too small to define parabolic curves formono- and tetravalent cations, and the ‘‘lattice strain’’ model can-not be applied to these cations.
For divalent ions, partition coefficients for 6 or 7 elements havebeen obtained, but they decrease monotonously with ionic radiusand parabolic curves cannot be defined using lattice strain model.Hence, we focus only on trivalent cations to discuss the pressureeffect on the parabolic curves on PC–IR diagrams. When curve fit-ting the trivalent cations, partition coefficients of Al, Cr, V and Inwere omitted for the following reasons; The D⁄ values of transitionmetals Cr and V are anomalous due to crystal field effects, and they
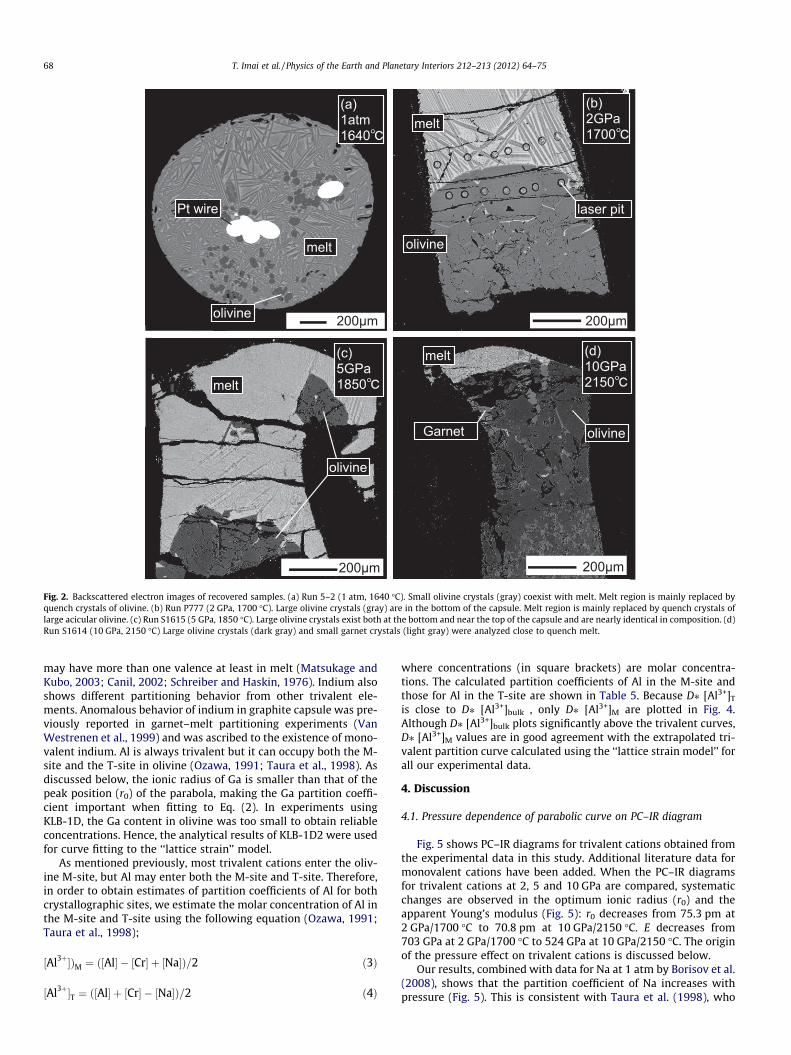
Fig. 2. Backscattered electron images of recovered samples. (a) Run 5–2 (1 atm, 1640 �C). Small olivine crystals (gray) coexist with melt. Melt region is mainly replaced byquench crystals of olivine. (b) Run P777 (2 GPa, 1700 �C). Large olivine crystals (gray) are in the bottom of the capsule. Melt region is mainly replaced by quench crystals oflarge acicular olivine. (c) Run S1615 (5 GPa, 1850 �C). Large olivine crystals exist both at the bottom and near the top of the capsule and are nearly identical in composition. (d)Run S1614 (10 GPa, 2150 �C) Large olivine crystals (dark gray) and small garnet crystals (light gray) were analyzed close to quench melt.
68 T. Imai et al. / Physics of the Earth and Planetary Interiors 212–213 (2012) 64–75
may have more than one valence at least in melt (Matsukage andKubo, 2003; Canil, 2002; Schreiber and Haskin, 1976). Indium alsoshows different partitioning behavior from other trivalent ele-ments. Anomalous behavior of indium in graphite capsule was pre-viously reported in garnet–melt partitioning experiments (VanWestrenen et al., 1999) and was ascribed to the existence of mono-valent indium. Al is always trivalent but it can occupy both the M-site and the T-site in olivine (Ozawa, 1991; Taura et al., 1998). Asdiscussed below, the ionic radius of Ga is smaller than that of thepeak position (r0) of the parabola, making the Ga partition coeffi-cient important when fitting to Eq. (2). In experiments usingKLB-1D, the Ga content in olivine was too small to obtain reliableconcentrations. Hence, the analytical results of KLB-1D2 were usedfor curve fitting to the ‘‘lattice strain’’ model.
As mentioned previously, most trivalent cations enter the oliv-ine M-site, but Al may enter both the M-site and T-site. Therefore,in order to obtain estimates of partition coefficients of Al for bothcrystallographic sites, we estimate the molar concentration of Al inthe M-site and T-site using the following equation (Ozawa, 1991;Taura et al., 1998);
½Al3þ�ÞM ¼ ð½Al� � ½Cr� þ ½Na�Þ=2 ð3Þ
½Al3þ�T ¼ ð½Al� þ ½Cr� � ½Na�Þ=2 ð4Þ
where concentrations (in square brackets) are molar concentra-tions. The calculated partition coefficients of Al in the M-site andthose for Al in the T-site are shown in Table 5. Because D⁄ [Al3+]T
is close to D⁄ [Al3+]bulk , only D⁄ [Al3+]M are plotted in Fig. 4.Although D⁄ [Al3+]bulk plots significantly above the trivalent curves,D⁄ [Al3+]M values are in good agreement with the extrapolated tri-valent partition curve calculated using the ‘‘lattice strain model’’ forall our experimental data.
4. Discussion
4.1. Pressure dependence of parabolic curve on PC–IR diagram
Fig. 5 shows PC–IR diagrams for trivalent cations obtained fromthe experimental data in this study. Additional literature data formonovalent cations have been added. When the PC–IR diagramsfor trivalent cations at 2, 5 and 10 GPa are compared, systematicchanges are observed in the optimum ionic radius (r0) and theapparent Young’s modulus (Fig. 5): r0 decreases from 75.3 pm at2 GPa/1700 �C to 70.8 pm at 10 GPa/2150 �C. E decreases from703 GPa at 2 GPa/1700 �C to 524 GPa at 10 GPa/2150 �C. The originof the pressure effect on trivalent cations is discussed below.
Our results, combined with data for Na at 1 atm by Borisov et al.(2008), shows that the partition coefficient of Na increases withpressure (Fig. 5). This is consistent with Taura et al. (1998), who
0.001
0.01
0.1
1
Li
Parti
tion
coef
fiien
t
Na Mg Fe Mn Ca Al Cr Ga V Sc In Lu Yb Tm Er Y Ho SiTb Ge
10
P777(2GPa)S1615(5GPa)5-2(1atm)S1614(10GPa)
Beattie, 1994 (1atm)Kennedy et al., 1993 (1atm)
Taura et al., 1998 (5GPa)Agee & Walker, 1990 (6GPa)
Borisov et al., 2008 (1atm)Evans et al, 2008 (CMAS-c,1atm)
This study
Fig. 3. Partition coefficients between olivine and melt obtained in this study with literature data. The previous data (Black symbols) are plotted on the left side of each zone.The present data (White symbols) are plotted on right side of each zone. Note that partition coefficients are plotted in weight ratio.
T. Imai et al. / Physics of the Earth and Planetary Interiors 212–213 (2012) 64–75 69
reported that the olivine–melt partition coefficients for Li and Naincrease with pressure. Similar increases in partition coefficients
Si
Ti
Hf
Al
Cr
VLu
YbTm
Er
HoY
TbDy
Eu
NiMg
Fe Mn
Ca
40 60 80 100
10
10
10
10
10
10
0
-1
-2
-3
-4
parti
tion
coef
ficie
nt
ionic radius / pm
(a) 1atm
Si
Ge
Al
Cr
Ga
V Sc In
LuYb
Tm
ErHo
Y
Tb
Na
Ni Mg
Fe
Mn
Ca
Al in M-site
40 60 80 100
10
10
10
10
10
10
0
-1
-2
-3
-4
parti
tion
coef
ficie
nt
ionic radius / pm
(c) 5GPa
Fig. 4. PC–IR diagrams of the olivine/melt system obtained in our experiments at each ptrivalent, squares: tetravalent. White symbols and black symbols are the results from KLB(Blundy and Wood, 1994). Dashed gray lines were drawn by eye. Inverted black trianglesfor fitting.
of alkali ions are reported for sodium and potassium in pyroxeneand majorite garnet by Wang and Takahashi (1999, 2000) and
Al
Cr
Ga
Ti
V ScIn
LuYb
TmEr
HoAl in M-site
SiGe
Ni Mg
Fe Mn
Ca
Na
40 60 80 100
10
10
10
10
10
10
0
-1
-2
-3
-4
parti
tion
coef
ficie
nt
ionic radius / pm
(b) 2GPa
Si
Ge
Al
Cr
Ga
VSc In
LuYbTm
Er
Ho
Na
Ni Mg
Fe Mn
CaAl in M-site
40 60 80 100
10
10
10
10
10
10
0
-1
-2
-3
-4
parti
tion
coef
ficie
nt
ionic radius / pm
(d) 10GPa
ressure. Symbols are as follows: Diamonds: monovalent, circles: divalent, triangles:-1D and KLB-1D2, respectively. Solid lines were fitted using the lattice strain model
are estimated values of partition coefficients of Al in the M-site, which were not used
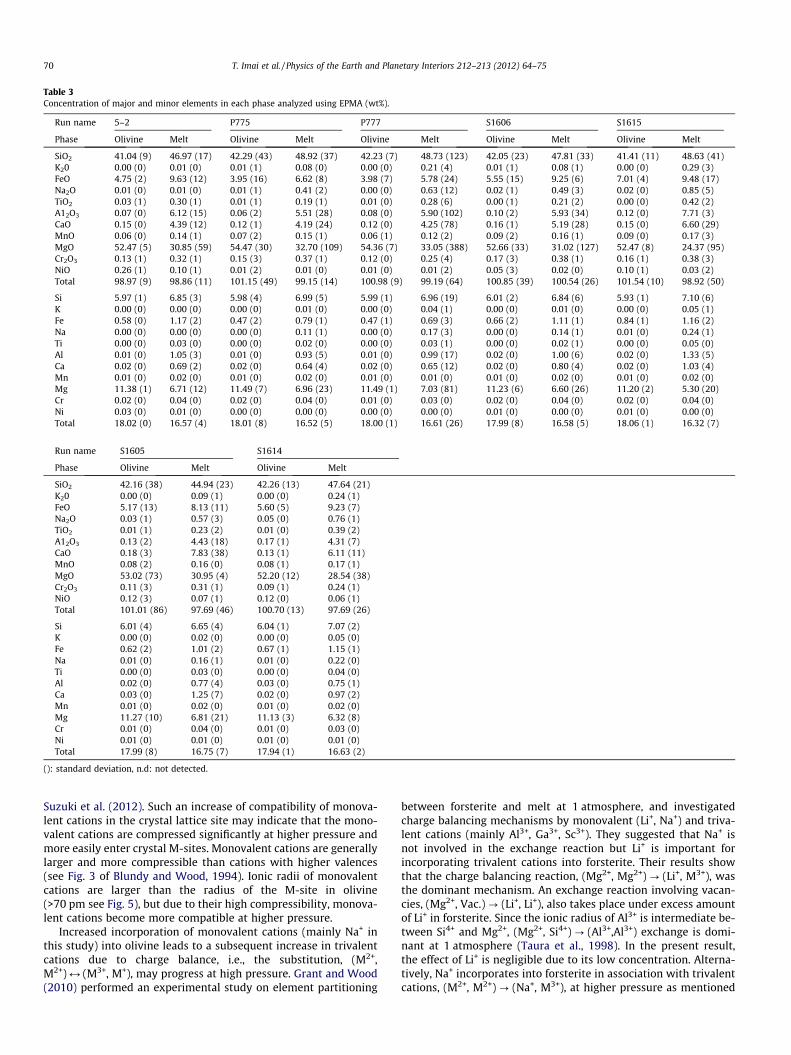
Table 3Concentration of major and minor elements in each phase analyzed using EPMA (wt%).
Run name 5–2 P775 P777 S1606 S1615
Phase Olivine Melt Olivine Melt Olivine Melt Olivine Melt Olivine Melt
SiO2 41.04 (9) 46.97 (17) 42.29 (43) 48.92 (37) 42.23 (7) 48.73 (123) 42.05 (23) 47.81 (33) 41.41 (11) 48.63 (41)K20 0.00 (0) 0.01 (0) 0.01 (1) 0.08 (0) 0.00 (0) 0.21 (4) 0.01 (1) 0.08 (1) 0.00 (0) 0.29 (3)FeO 4.75 (2) 9.63 (12) 3.95 (16) 6.62 (8) 3.98 (7) 5.78 (24) 5.55 (15) 9.25 (6) 7.01 (4) 9.48 (17)Na2O 0.01 (0) 0.01 (0) 0.01 (1) 0.41 (2) 0.00 (0) 0.63 (12) 0.02 (1) 0.49 (3) 0.02 (0) 0.85 (5)TiO2 0.03 (1) 0.30 (1) 0.01 (1) 0.19 (1) 0.01 (0) 0.28 (6) 0.00 (1) 0.21 (2) 0.00 (0) 0.42 (2)A12O3 0.07 (0) 6.12 (15) 0.06 (2) 5.51 (28) 0.08 (0) 5.90 (102) 0.10 (2) 5.93 (34) 0.12 (0) 7.71 (3)CaO 0.15 (0) 4.39 (12) 0.12 (1) 4.19 (24) 0.12 (0) 4.25 (78) 0.16 (1) 5.19 (28) 0.15 (0) 6.60 (29)MnO 0.06 (0) 0.14 (1) 0.07 (2) 0.15 (1) 0.06 (1) 0.12 (2) 0.09 (2) 0.16 (1) 0.09 (0) 0.17 (3)MgO 52.47 (5) 30.85 (59) 54.47 (30) 32.70 (109) 54.36 (7) 33.05 (388) 52.66 (33) 31.02 (127) 52.47 (8) 24.37 (95)Cr2O3 0.13 (1) 0.32 (1) 0.15 (3) 0.37 (1) 0.12 (0) 0.25 (4) 0.17 (3) 0.38 (1) 0.16 (1) 0.38 (3)NiO 0.26 (1) 0.10 (1) 0.01 (2) 0.01 (0) 0.01 (0) 0.01 (2) 0.05 (3) 0.02 (0) 0.10 (1) 0.03 (2)Total 98.97 (9) 98.86 (11) 101.15 (49) 99.15 (14) 100.98 (9) 99.19 (64) 100.85 (39) 100.54 (26) 101.54 (10) 98.92 (50)
Si 5.97 (1) 6.85 (3) 5.98 (4) 6.99 (5) 5.99 (1) 6.96 (19) 6.01 (2) 6.84 (6) 5.93 (1) 7.10 (6)K 0.00 (0) 0.00 (0) 0.00 (0) 0.01 (0) 0.00 (0) 0.04 (1) 0.00 (0) 0.01 (0) 0.00 (0) 0.05 (1)Fe 0.58 (0) 1.17 (2) 0.47 (2) 0.79 (1) 0.47 (1) 0.69 (3) 0.66 (2) 1.11 (1) 0.84 (1) 1.16 (2)Na 0.00 (0) 0.00 (0) 0.00 (0) 0.11 (1) 0.00 (0) 0.17 (3) 0.00 (0) 0.14 (1) 0.01 (0) 0.24 (1)Ti 0.00 (0) 0.03 (0) 0.00 (0) 0.02 (0) 0.00 (0) 0.03 (1) 0.00 (0) 0.02 (1) 0.00 (0) 0.05 (0)Al 0.01 (0) 1.05 (3) 0.01 (0) 0.93 (5) 0.01 (0) 0.99 (17) 0.02 (0) 1.00 (6) 0.02 (0) 1.33 (5)Ca 0.02 (0) 0.69 (2) 0.02 (0) 0.64 (4) 0.02 (0) 0.65 (12) 0.02 (0) 0.80 (4) 0.02 (0) 1.03 (4)Mn 0.01 (0) 0.02 (0) 0.01 (0) 0.02 (0) 0.01 (0) 0.01 (0) 0.01 (0) 0.02 (0) 0.01 (0) 0.02 (0)Mg 11.38 (1) 6.71 (12) 11.49 (7) 6.96 (23) 11.49 (1) 7.03 (81) 11.23 (6) 6.60 (26) 11.20 (2) 5.30 (20)Cr 0.02 (0) 0.04 (0) 0.02 (0) 0.04 (0) 0.01 (0) 0.03 (0) 0.02 (0) 0.04 (0) 0.02 (0) 0.04 (0)Ni 0.03 (0) 0.01 (0) 0.00 (0) 0.00 (0) 0.00 (0) 0.00 (0) 0.01 (0) 0.00 (0) 0.01 (0) 0.00 (0)Total 18.02 (0) 16.57 (4) 18.01 (8) 16.52 (5) 18.00 (1) 16.61 (26) 17.99 (8) 16.58 (5) 18.06 (1) 16.32 (7)
Run name S1605 S1614
Phase Olivine Melt Olivine Melt
SiO2 42.16 (38) 44.94 (23) 42.26 (13) 47.64 (21)K20 0.00 (0) 0.09 (1) 0.00 (0) 0.24 (1)FeO 5.17 (13) 8.13 (11) 5.60 (5) 9.23 (7)Na2O 0.03 (1) 0.57 (3) 0.05 (0) 0.76 (1)TiO2 0.01 (1) 0.23 (2) 0.01 (0) 0.39 (2)A12O3 0.13 (2) 4.43 (18) 0.17 (1) 4.31 (7)CaO 0.18 (3) 7.83 (38) 0.13 (1) 6.11 (11)MnO 0.08 (2) 0.16 (0) 0.08 (1) 0.17 (1)MgO 53.02 (73) 30.95 (4) 52.20 (12) 28.54 (38)Cr2O3 0.11 (3) 0.31 (1) 0.09 (1) 0.24 (1)NiO 0.12 (3) 0.07 (1) 0.12 (0) 0.06 (1)Total 101.01 (86) 97.69 (46) 100.70 (13) 97.69 (26)
Si 6.01 (4) 6.65 (4) 6.04 (1) 7.07 (2)K 0.00 (0) 0.02 (0) 0.00 (0) 0.05 (0)Fe 0.62 (2) 1.01 (2) 0.67 (1) 1.15 (1)Na 0.01 (0) 0.16 (1) 0.01 (0) 0.22 (0)Ti 0.00 (0) 0.03 (0) 0.00 (0) 0.04 (0)Al 0.02 (0) 0.77 (4) 0.03 (0) 0.75 (1)Ca 0.03 (0) 1.25 (7) 0.02 (0) 0.97 (2)Mn 0.01 (0) 0.02 (0) 0.01 (0) 0.02 (0)Mg 11.27 (10) 6.81 (21) 11.13 (3) 6.32 (8)Cr 0.01 (0) 0.04 (0) 0.01 (0) 0.03 (0)Ni 0.01 (0) 0.01 (0) 0.01 (0) 0.01 (0)Total 17.99 (8) 16.75 (7) 17.94 (1) 16.63 (2)
(): standard deviation, n.d: not detected.
70 T. Imai et al. / Physics of the Earth and Planetary Interiors 212–213 (2012) 64–75
Suzuki et al. (2012). Such an increase of compatibility of monova-lent cations in the crystal lattice site may indicate that the mono-valent cations are compressed significantly at higher pressure andmore easily enter crystal M-sites. Monovalent cations are generallylarger and more compressible than cations with higher valences(see Fig. 3 of Blundy and Wood, 1994). Ionic radii of monovalentcations are larger than the radius of the M-site in olivine(>70 pm see Fig. 5), but due to their high compressibility, monova-lent cations become more compatible at higher pressure.
Increased incorporation of monovalent cations (mainly Na+ inthis study) into olivine leads to a subsequent increase in trivalentcations due to charge balance, i.e., the substitution, (M2+,M2+) M (M3+, M+), may progress at high pressure. Grant and Wood(2010) performed an experimental study on element partitioning
between forsterite and melt at 1 atmosphere, and investigatedcharge balancing mechanisms by monovalent (Li+, Na+) and triva-lent cations (mainly Al3+, Ga3+, Sc3+). They suggested that Na+ isnot involved in the exchange reaction but Li+ is important forincorporating trivalent cations into forsterite. Their results showthat the charge balancing reaction, (Mg2+, Mg2+) ? (Li+, M3+), wasthe dominant mechanism. An exchange reaction involving vacan-cies, (Mg2+, Vac.) ? (Li+, Li+), also takes place under excess amountof Li+ in forsterite. Since the ionic radius of Al3+ is intermediate be-tween Si4+ and Mg2+, (Mg2+, Si4+) ? (Al3+,Al3+) exchange is domi-nant at 1 atmosphere (Taura et al., 1998). In the present result,the effect of Li+ is negligible due to its low concentration. Alterna-tively, Na+ incorporates into forsterite in association with trivalentcations, (M2+, M2+) ? (Na+, M3+), at higher pressure as mentioned

Table 4Concentration of trace elements in each phase analyzed using LA-ICP-MS (lg/g).
5–2 P775 P777 S1606 S1615 S1605 S1614
Olivine Melt Olivine Melt Olivine Melt Olivine Melt Olivine Melt Olivine Melt Olivine Melt
Sc 33 (26) 210 (69) n.d. 65 (55) 22(6) 156 (25) 11(4) 67(4) 19(6) 213 (11) n.d. 76(5) 12(6) 182 (23)V 5.8 (27) 97 (16) 16(3) 99 (17) 11 (1) 72(6) 18(2) 96(2) 21(1) 116(7) 13(4) 101 (6) 13(2) 97(9)Ga n.d. 6.7 (32) n.d. 47 (14) 3(7) 136 (26) n.d. 67(2) 8(1) 242 (17) 4.5 (2) 66(3) 11(2) 220 (21)Ge n.d. n.d. n.d. 17 (13) 52 (12) 102 (15) 12(5) 48(6) 33(6) 196 (17) 11 (5) 50(1) 44(11) 187 (17)Rb – n.d. 105 (8) – n.d. 94(5) – n.d. 90(6) –Sr – n.d. 92(7) – n.d. 103 (7) n.d. 234 (14) –Y 1.2 (3) 177 (43) n.d. 58 (17) 1.2(8) 161 (32) 6(4) 92(4) 1.6 (3) 246 (21) n.d. 226 (5) 16(11) 255 (34)Zr n.d. 172 (38) n.d. 52 (13) n.d. 159 (30) n.d. 85(5) n.d. 229 (21) 1.7 (3) 142 (11) n.d. 235 (29)Nb - 0.3 (1) 59(4) – n.d. 57(4) – n.d. 62(4) –In n.d. n.d. 1.2(4) 15(4) 11 (1) 100 (15) 2.8 (2) 36(1) 16(1) 198(11) 2.2 (0) 39(3) 12(1) 188 (19)Cs – n.d. 76(6) – 0.5 (1) 63(4) – n.d. 54(9) –Ba – n.d. 19(2) – n.d. 26(4) – n.d. 44(4) –La n.d. 212 (48) n.d. 69 (24) n.d. 208 (47) 2(1) 2169 (111) n.d. 770 (83) n.d. 6558 (332) 1.8 (12) 850 (118)Ce n.d. 207 (38) n.d. 62 (21) n.d. 190 (36) 1(0) 73(3) n.d. 243 (22) n.d. 115 (6) n.d. 278 (35)Pr n.d. 166 (36) n.d. 49 (15) n.d. 139 (30) n.d. 60(3) n.d. 192 (17) n.d. 91(9) n.d. 222 (29)Nd n.d. 192 (42) n.d. 59 (17) n.d. 178 (38) n.d. 81(4) n.d. 254 (28) n.d. 124 (4) n.d. 270 (34)Sm n.d. 208 (51) n.d. 63 (24) n.d. 196 (47) n.d. 77(2) n.d. 266 (20) 0.7 (2) 105 (8) n.d. 304 (44)Eu 0.2 (1) 169 (41) n.d. 53 (18) n.d. 150 (33) n.d. 66(3) n.d. 212 (17) n.d. 84(3) n.d. 240 (32)Gd n.d. 256 (59) n.d. 88 (26) n.d. 236 (55) 0.3 (2) 110 (6) n.d. 327 (24) n.d. 139 (13) n.d. 386 (50)Tb 0.5 (1) 160 (36) 0.3 (1) 48 (15) 0.5 (3) 144 (33) n.d. 60(2) 0.4 (2) 197 (15) n.d. 73(4) 0.5 (4) 219 (28)Dy 0.7 (2) 162 (36) 0.5 (2) 52 (18) 0.7 (6) 141 (31) 0.3 (1) 63(4) 0.9 (6) 193 (16) n.d. 85(6) 1.3 (12) 203 (26)Ho 1.4 (2) 171 (39) 0.4 (1) 53 (16) 1.3 (3) 154 (34) 0.3 (1) 66(2) 0.9 (3) 221 (19) 0.4 (3) 77(2) 0.8 (3) 209 (26)Er 1.8 (6) 160 (36) 0.4 (3) 51 (15) 1.7(4) 158 (31) 0.4 (2) 65(4) 1.2 (6) 205 (16) n.d. 76(3) 1.1 (6) 181 (25)Tm 2.7 (5) 182 (41) 0.9 (2) 55 (16) 2.9 (4) 163 (34) 0.8(1) 69(3) 1.8 (2) 216 (14) 0.5 (1) 76(3) 1.4 (4) 199 (27)Yb 3.9 (8) 220 (49) 1.7(10) 72 (23) 4.3 (13) 197 (38) 1.5 (2) 83(4) 2.9 (6) 270 (28) 0.6 (3) 94(7) 1.8 (7) 220 (29)Lu 5.2 (8) 192 (43) 1.9(3) 60 (16) 5.3 (6) 173 (33) 1.3(1) 72(3) 3.7 (4) 232 (14) 0.8 (3) 76(2) 2.4 (3) 193 (24)Hf 0.2 (1) 167 (34) n.d. 48 (12) n.d. 151 (23) n.d. 63(2) n.d. 202 (15) n.d. 70(4) n.d. (4) 203 (27)
(): standard deviation.n.d.: not detected.–: no data.
T. Imai et al. / Physics of the Earth and Planetary Interiors 212–213 (2012) 64–75 71
above. However, the total amount of M+ is much less than the totalamount of M3+ in olivine in this study (see Table 3). For trivalentcations, partition coefficients of small cations (Al, Ga) increase,and those of large cations (Sc, REE) decrease with pressure,although the partitioning behavior of REE is nearly constant be-tween 1 atm to 2 GPa (see Fig. 5). The pressure effect on partitioncoefficient for trivalent cations, based on the optimum ionic radius(r0) and apparent Young’s modulus (E) is discussed below.
4.2. Change of optimum ionic radius and volume of the site
The optimum ionic radius (r0) of trivalent cations in the olivineM-site decreases with pressure from 75.3 pm (2 GPa) to 70.8 pm(10 GPa) (see Fig. 5 and Table 6). We consider that the change ofthe r0 of trivalent cations was largely affected by the size of theM-site in olivine. Using the third order Birch–Murnaghan equationof state (EoS) of olivine by Liu and Li (2006), normalized unit cellvolumes and their third roots of olivine crystal (V/V0, (V/V0)1/3)were calculated at 2 GPa/1700 �C, 5 GPa/1850 �C and 10 GPa/2000 �C (Table 6). The ratios of the latter value against that at2 GPa/1700 �C are compared with the pertinent ratio in r0 (Table 6).Both r0/r0at 2GPa and ((V/V0)1/3/(V/V0)1/3)at 2GPa decrease withincreasing pressure and temperature, indicating that the effect ofpressure is larger than that of temperature. The same comparisonwas also made using the calculated M–O distance in the M-siteof olivine using the experimental data of Hazen (1976). Hazen(1976) reported that the M–O distance decreases linearly withpressure (�3 pm/5 GPa) and increases with temperature (�3 pm/1000 K). Considering the range of experimental pressure (1 atmto 10 GPa) and temperature (1590–2150 �C), pressure seems tohave a larger effect than temperature on the M–O distance. Theamount of expected change in the M–O distances, under the exper-imental conditions of the present study, was estimated, and wascompared with those in r0 (Table 6). The expected change in M–O distance is similar to the difference in r0 between 2 GPa/
1700 �C and those in 5 GPa/1850 �C and 10 GPa/2150 �C, respec-tively. The agreement is better than those in unit cell volumeand is probably due to the existence of relatively incompressibletetrahedral sites (Hazen and Finger, 1982). Accordingly, we inter-pret the change in r0 to be explained simply by compression ofthe M-site in olivine (which is mostly due to compressible O2�
ions) and the compressibility of trivalent cations is negligiblysmall.
4.3. Pressure dependence on the apparent Young’s modulus of M-sitein olivine
With increasing pressure, another significant change was foundin the PC–IR diagram, i.e., the parabolic curve widened with pres-sure (see Fig. 5). According to the lattice strain model of Blundyand Wood (1994), the width of the curve is constrained by theapparent Young’s modulus of the site, E, and temperature (seeEq. (2)). Using the data of this study, E decreases with pressurefrom 703 GPa at 2 GPa to 524 GPa at 10 GPa. In other words, theM-site in olivine seems to become more elastic with pressure. Thisresult is consistent with Wood and Corgne (2007) and Van Westre-nen and Draper (2007), which summarized existing experimentaldata and found that the dodecahedral site of garnet becomes moreelastic at high pressure. However, it is not easily understood why agiven M-site in a crystal becomes more elastic (‘‘softer’’) at higherpressures, even through the crystal is under compression. In thegarnet solid solutions, both r0 and E depend strongly on the garnetchemical composition. In this study however, the composition ofolivine (Fo94–96) and the chemistry of the coexisting melt arenearly constant (close to peridotite KLB-1). Therefore, any compo-sitional effect on the olivine structure should be unlikely to explainthe observed variation in E in our study.
Temperature is one of the candidates to decrease apparentYoung’s modulus of a given crystal site. Although we have no infor-mation about the temperature dependence for the Young’s modu-

Table 5Partition coefficients between olivine and melt in each conditions.
5–21 atm/1590 �C
P7752 GPa/1750 �C
P7772 GPa/1700 �C
S16065 GPa/1850 �C
S16155 GPa/1850 �C
S160510 GPa/2150 �C
S161410 GPa/2150 �C
D⁄ D D⁄ D D⁄ D D⁄ D D⁄ D D⁄ D D⁄ D
Na n.d. n.d. n.d. 0.03 (2) 0.03 (2) 0.02 (3) 0.02 (0) 0.06 (2) 0.06 (2) 0.06 (4) 0.06 (0)Ni 2.51 (20) 2.60 (8) n.d. n.d. 2.53 (167) 2.63 (155) n.d. 1.69 (43) 1.83 (43) 1.86 (6) 1.99 (6)Mg 1.64 (3) 1.70 (0) 1.59 (5) 1.67 (1) 1.58 (18) 1.64 (0) 1.64 (7) 1.70 (1) 2.03 (8) 2.15 (0) 1.60 (5) 1.71 (2) 1.71 (1) 1.83 (0)Fe 0.47 (1) 0.49 (0) 0.57 (3) 0.60 (2) 0.66 (3) 0.69 (1) 0.58 (2) 0.60 (2) 0.70 (1) 0.74 (0) 0.59 (2) 0.64 (2) 0.57 (1) 0.61 (1)Mn 0.39 (3) 0.41 (3) 0.48 (12) 0.50 (12) 0.50 (9) 0.52 (4) 0.53 (15) 0.55 (15) 0.50 (8) 0.53 (2) 0.45 (10) 0.48 (11) 0.42 (3) 0.45 (4)Ca 0.03 (0) 0.03 (0) 0.03 (0) 0.03 (0) 0.03 (5) 0.03 (0) 0.03 (0) 0.03 (0) 0.02 (1) 0.02 (0) 0.02 (0) 0.02 (0) 0.02 (1) 0.02 (0)Al 0.010 (0) 0.011 (0) 0.011 (0) 0.011 (3) 0.012 (2) 0.013 (1) 0.016 (0) 0.017 (3) 0.015 (1) 0.016 (0) 0.028 (0) 0.030 (4) 0.038 (2) 0.040 (2)Cr 0.40 (3) 0.42 (3) 0.39 (7) 0.40 (7) 0.48 (8) 0.50 (2) 0.43 (7) 0.44 (7) 0.40 (4) 0.42 (3) 0.32 (9) 0.35 (9) 0.34 (4) 0.36 (4)Ga n.d. n.d. 0.020 (5) 0.022 (5) n.d. 0.033 (6) 0.033 (6) 0.068 (36) 0.069 (37) 0.051 (10) 0.050 (10)V 0.074 (3) 0.060 (3) 0.16 (3) 0.16 (3) 0.15 (2) 0.16 (2) 0.17 (2) 0.19 (2) 0.17 (1) 0.18 (1) 0.13 (4) 0.13 (4) 0.13 (2) 0.13 (2)Sc 0.19 (15) 0.16 (12) n.d. 0.13 (3) 0.14 (4) 0.17 (5) 0.17 (5) 0.08 (2) 0.09 (3) n.d. 0.06 (3) 0.06 (3)In n.d. 0.075 (2) 0.077 (3) 0.097 (9) 0.105 (11) 0.073 (6) 0.080 (6) 0.077 (3) 0.078 (4) 0.052 (1) 0.056 (1) 0.066 (4) 0.066 (4)Lu 0.028 (4) 0.027 (4) 0.031 (5) 0.032 (5) 0.028 (3) 0.031 (4) 0.020 (1) 0.022 (1) 0.017 (2) 0.016 (2) 0.009 (3) 0.011 (3) 0.013 (2) 0.012 (1)Yb 0.019 (3) 0.018 (4) 0.025 (1) 0.024 (1) 0.020 (6) 0.022 (6) 0.016 (2) 0.018 (3) 0.011 (2) 0.011 (2) 0.006 (3) 0.006 (3) 0.009 (3) 0.008 (3)Tm 0.016 (3) 0.015 (3) 0.016 (3) 0.016 (3) 0.016 (2) 0.018 (2) 0.010 (1) 0.011 (1) 0.009 (1) 0.009 (1) 0.006 (1) 0.007 (1) 0.007 (2) 0.007 (2)Er 0.012 (3) 0.011 (3) 0.008 (6) 0.008 (6) 0.010 (2) 0.011 (3) 0.005 (3) 0.005 (3) 0.006 (3) 0.006 (3) n.d. 0.006 (3) 0.006 (3)Y 0.007 (2) 0.007 (2) n.d. 0.007 (5) 0.007 (5) 0.006 (4) 0.007 (4) 0.006 (1) 0.006 (1) n.d. 0.006 (4) 0.006 (4)Ho 0.008 (1) 0.008 (1) 0.007 (2) 0.007 (2) 0.008 (2) 0.009 (2) 0.004 (1) 0.004 (2) 0.004 (2) 0.004 (1) 0.004 (3) 0.005 (4) 0.004 (2) 0.004 (2)Dy 0.005 (2) 0.005 (1) 0.011 (4) 0.010 (3) 0.005 (4) 0.005 (4) 0.005 (2) 0.005 (2) n.d. n.d. 0.006 (6) 0.006 (6)Tb 0.004 (0) 0.003 (0) 0.006 (2) 0.006 (2) 0.003 (2) 0.004 (2) n.d. 0.002 (1) 0.002 (1) n.d. 0.002 (2) 0.002 (2)Gd n.d. n.d. n.d. 0.003 (2) 0.003 (2) n.d. n.d. n.d.Eu 0.001 (1) 0.001 (1) n.d. n.d. n.d. n.d. n.d. n.d.Sm n.d. n.d. n.d. n.d. n.d. 0.006 (2) 0.006 (2) n.d.Si 0.84 (0) 0.87 (0) 0.82 (1) 0.86 (1) 0.83 (2) 0.87 (0) 0.85 (1) 0.88 (0) 0.80 (1) 0.85 (0) 0.87 (1) 0.94 (1) 0.83 (0) 0.89 (0)Ge n.d. n.d. 0.44 (10) 0.51 (11) 0.25 (10) 0.25 (10) 0.17 (3) 0.17 (3) 0.22 (9) 0.22 (9) 0.23 (6) 0.24 (6)Ti 0.08 (2) 0.08 (2) n.d. 0.03 (1) 0.03 (1) n.d. n.d. n.d. 0.02 (6) 0.02 (1)Hf 0.0011 (5) 0.0011 (5) n.d. n.d. n.d. n.d. n.d. n.d.D⁄A1-M 0.00 (2) 0.00 (2) 0(2) 0.001 (1) 0.003 (1) 0.012 (2) 0.021 (0)DVr 0.01 (0) 0.01 (3) 0.013 (2) 0.015 (2) 0.012 (0) 0.016 (2) 0.017 (1)
D⁄ and D are partition coefficients by molar ratio and by weight ratio, respectively.D⁄ Al-M and D⁄Al-T are estimated partition coefficient of Al in M-site and T-site of olivine, respectively. See the text.(): standard deviation.n.d.: not determined.
72T.Im
aiet
al./Physicsof
theEarth
andPlanetary
Interiors212–
213(2012)
64–75

40 60 80 100
10
10
10
10
0
-1
-2
-3
parti
tion
coef
ficie
nt
ionic radius / pm
2GPa5GPa
10GPa
r0 at 2GPa= 75.3 pmr0 at 5GPa= 73.0 pm
r0 at 10GPa= 70.8 pm
E at 2GPa= 703 GPa
E at 10GPa= 524 GPa
Na
Li(Taura et al., 1998)
Na1atm(Borisov et al., 2008)
Al in M-site
Ga
REE
at 5GPa= 567 GPaE
Sc
Fig. 5. PC–IR diagram for mono and trivalent cations showing a large pressure effect. Triangles and inverted triangles are trivalent, and diamonds are monovalent. Invertedtriangles, white triangles, gray symbols, and black symbols are the results at 1 atm, 2, 5 and 10 GPa in this study, respectively. The data of Li at 3, 5, 9.7 GPa are from Tauraet al., and that of Na at 1 atm is from Borisov et al. (2008). Solid lines were fitted using the lattice strain model (Blundy and Wood, 1994). The optimum ionic radius r0 andapparent Young’s modulus E for trivalent cations both decrease with pressure. See text for discussion.
Table 6Best fit values for lattice strain model of olivine/melt partition coefficients.
Pressure Temperature (�C) r0 (pm)a E (GPa)a D0a r0 � r0 at 2 GPa
b Change of M–O bond lengthc r0/r0 at 2 GPad
VV0
� �e
VV0
� �13 V
V0
� �13= V
V0
� �13f
2 GPa
1 atm 1590 1.081 1.0262 GPa 1700 75.3(1) 703(16) 0.13(0) 0 0 1 1.061 1.0205 GPa 1850 73.0(1) 567(13) 0.09(0) 2.3 1.4 0.97 1.028 1.009 0.9910 GPa 2150 70.8(2) 524(14) 0.08(0) 4.5 3.5 0.94 0.975 0.992 0.97
a Best fit values for lattice strain modeling of olivine/melt partitioning.b The difference in values of r0 at each pressure and temperature condition for that at 2 GPa/1700 �C.c The difference in values of M–O bond length in olivine at each pressure and temperature condition for that at 2 GPa/1700 �C were calculated using the amount of change
in M–O bond length for pressure and temperature estimated from Hazen (1976) (�0.6 pm/GPa, 0.3 pm/100 �C, respectively).d The ratios of r0 at each pressure and temperature condition for that at 2 GPa/1700 �C.e Unit cell volume ratios for that at ambient condition were calculated using the third-order Birch–Murnaghan EoS of olivine by Liu and Li (2006).f The ratios of V
V0
� �13 at each pressure and temperature condition for that at 2 GPa/1700 �C.
T. Imai et al. / Physics of the Earth and Planetary Interiors 212–213 (2012) 64–75 73
lus of the M-site in olivine, Wood and Blundy (1997) and Van Wes-trenen and Draper (2007) reported a temperature and pressuredependence (and compositional effect; Van Westrenen and Draper,2007) for the apparent Young’s modulus E of the octahedral site indiopside (EDi) and the hexahedron site in garnet (EGar), respectively.According to their study, EDi and EGar increase with pressure(6.9 GPa/GPa and 12.4 GPa/GPa) and decrease with temperature(0.036 GPa/K and 0.072 GPa/K), respectively. According to theseestimates, the temperature effect on E by 450 K, which is the tem-perature range of this study (from 1700 to 2150 �C), would be 18–33 GPa. On the other hand, E decreased from 703 GPa at 2 GPa/1700 �C to 524 GPa at 10 GPa/2150 �C in the present study. There-fore, the large decrease in E found in this study is difficult to ex-plain by the temperature effect alone.
Hazen and Finger (1982) reported that the Young’s moduli ofthe M-site in olivine and other crystals are nearly constant at pres-sures up to 6 GPa and 1000 �C. With the nearly constant compress-ibility and thermal compressibility of olivine, the change in theapparent Young’s modulus of the M-site is difficult to explain fromthe crystal chemical point of view. In the following discussion weattempt to explain it from the view point of the change in structureof the silicate melt.
In Blundy and Wood’s model, the partition coefficient is givenas;
Di ¼ D0 exp�DGexchange
RT
� �ð5Þ
where DGexchange is the free energy that is required when a cation isremoved from the crystal to the melt;
DGexchange ¼ DGcrystal � DGmelt ð6Þ
and D0 is the partition coefficient of the host cation whose exchangeenergy is zero. In this model, it is assumed that the exchange energyis dominated by strain energy around mismatched cations in thecrystal. In other words, DGmelt ¼ 0 is assumed because the melt ismuch softer than the crystal. Hence, DGexchange is written using thestrain model by Brice (1975),
DGstrain ¼ DGcrystal ¼ 4pENAr0
2ðri � r0Þ2 þ
13ðri � r0Þ3
� �ffi DGexchange
ð7Þ
As discussed above, the change in apparent Young’s moduluswould require an explanation that involves a contribution fromthe melt structure. It is well known that the local melt structureschange with pressure. Keppler and Rubie (1993) investigated thepressure dependence of the local melt structure of albite meltdoped with trace amounts of Co and Ni using crystal field spectros-copy. They showed that the local environments of Ni and Co

74 T. Imai et al. / Physics of the Earth and Planetary Interiors 212–213 (2012) 64–75
change from tetrahedral to octahedral at higher pressure. Theysuggested that crystal/melt partition coefficients for these ele-ments would decrease by an order of magnitude under lower man-tle conditions due to the change in local melt structure.
A change in melt structure with pressure is also reported inmore mafic melt (e.g., forsterite). At ambient pressure, forsteritemelt is composed of MgO4, MgO5, MgO6 polyhedras which formnetwork structure with interstitial SiO4 tetrahedra and Si2O7 di-mers (Kohara et al., 2004). Wilding et al. (2012) investigated thepressure dependence of the local structure of a silicate melt whosewith a composition close to that of forsterite (62 mol% MgO,38 mol% SiO2) using in-situ high pressure experiments. They re-ported that the mean coordination number of Mg increased from4.6 at ambient pressure to 5.6 at 8.6 GPa. This means that theMgO4 site decreases and MgO6 site increases with pressure. Thischange in M–O polyhedra is similar to that in the albite melt re-ported by Keppler and Rubie (1993).
Van Westrenen et al. (2000) showed the effect of the local meltstructure changes on tri-valent PC–IR diagrams in garnet melt sys-tems by theoretical calculations using the General Utility LatticeProgram (GULP; Gale, 1997). They hypothesized local structuresthat resemble J2O3 (oxide) and J3Al5O12 (garnet) in silicate meltcoexisting with garnet. They showed that calculated partition coef-ficients between silicate melt with the garnet-like site and garnetare more consistent with experimental data than those betweensilicate melt with the oxide-like site and garnet. Accordingly, theyproposed that the presence and structure of coexisting silicate meltinfluenced partition coefficients and the absolute values of r0 and E.Therefore, we have to consider the effect of the local melt structureon the changes in partition coefficients.
In order to consider the melt structure effect on partition coef-ficients, we apply the lattice strain model to melt employing a verysimple assumption that the size of sites in the melt is equal tothose of olivine. The free energy by strain in the melt, DGmelt
strain, isthen written as:
DGmeltstrain ¼ 4pEmeltNA
r0
2ðri � r0Þ2 þ
13ðri � r0Þ3
� �; ð8Þ
where Emelt is the Young’s modulus of a site in the melt and r0 is theoptimum size of the site in olivine. Using this equation, the latticestrain model of Blundy and Wood (1994) is expanded as:
Di � ðP; T;XÞ ¼ D0ðP; T;XÞ
� exp�4pNA
RTðEolivine � EmeltÞ
r0
2ðri � r0Þ2 þ
13ðri � r0Þ3
� �� �:
ð9Þ
where Eolivine is the Young’s modulus of the M-site in olivine.ðEolivine � EmeltÞ in Eq. (9) corresponds to E in Eq. (2). In this formu-lation, decreasing E with pressure equates to decreasingðEolivine � EmeltÞ. When Eolivine is constant with pressure (Hazen andFinger, 1982), Emelt will increase with pressure. In other words,the M-site in the melt becomes ‘harder’ with pressure.
The observed change in the apparent Young’s modulus of theM-site of olivine (see Table 6), implies that Emelt at 10 GPa wouldamount to 1/4 Ecrystal. Calculations were also made assuming thatr0 in the melt structure is different from r0 in the crystal. Essen-tially the same conclusion was obtained when the difference inr0 is small (<5%). On the other hand, the parabola cannot be fittedwhen the difference in r0 is large (>10%).
Although our model is still primitive (in that it assumes an iden-tical site size between melt and crystal), it is important to note thatour model predicts that the effect of the melt structure becomesincreasingly important for element partitioning at very high pres-sures. Further investigations on the pressure dependence of parti-
tion coefficients between crystal and silicate melt, involving widerpressure ranges, are necessary.
Acknowledgements
The authors are grateful to T.D. Yokoyama for his advice in LA-ICP-MS measurements. We also thank K. Kawamura, H. Iwamoriand K. Mibe for their valuable comments. J. Tuff improved the man-uscript and gave us some comments. Constructive comments byW. Van Westrenen and J. Kimura were helpful to improve the man-uscript. Part of this research was supported by Grants-in-Aid forJSPS Fellows.
References
Agee, C., Walker, D., 1990. Aluminum partitioning between olivine and ultrabasicsilicate liquid to 6 GPa. Contrib. Mineral. Petrol. 105, 243–254.
Aoki, I., Takahashi, E., 2004. Density of MORB eclogite in the upper mantle. Phys.Earth Planet. Int. 143–144, 129–143.
Beattie, P., Drake, M., Jones, J., Leeman, W., Longhi, J., Mckey, G., Nielsen, R., Palme,H., Shaw, D., Takahashi, E., Watson, B., 1993. Terminology for trace-elementpartitioning. Geochim. Cosmochim. Acta 57, 1605–1606.
Beattie, P., 1994. Systematics and energetics of trace-element partitioning betweenolivine and silicate melts: implications for the nature of mineral/meltpartitioning. Chem. Geol. 117, 57–71.
Blundy, J., Wood, B., 1994. Prediction of crystal–melt partition coefficients fromelastic moduli. Nature 372, 452–454.
Borisov, A., Pack, A., Kropf, A., Palme, H., 2008. Partitioning of Na between olivineand melt: an experimental study with application to the formation of meteoriticNa2O-rich chondrule glass and refractory forsterite grains. Geochim.Cosmochim. Acta 72, 5558–5573.
Brice, J., 1975. Some thermodynamic aspects of the growth of strained crystals. J.Cryst. Growth 28, 249–253.
Canil, D., 2002. Vanadium in peridotites, mantle redox and tectonic environments:Archean to present. Earth Planet. Sci. Lett. 195, 75–90.
Eggins, S., Kinsley, L., Shelley, J., 1998. Deposition and element fractionationprocesses duri atmospheric pressure laser sampling for analysis by ICP-MS.Appl. Surf. Sci. 127–129, 278–286.
Evans, T., O’Neill, H.St.C., Tuff, J., 2008. The influence of melt composition on thepartitioning of REEs, Y, Sc, Zr and Al between forsterite and melt in the systemCMAS. Geochim. Cosmochim. Acta 72, 5708–5721.
Gale, J., 1997. GULP: a computer program for the symmetry-adapted simulation ofsolids. J. Chem. Soc. Faraday Trans. 93, 629–637.
Grant, K., Wood, B., 2010. Experimental study of the incorporation of Li, Sc, Al andother trace elements into olivine. Geochim. Cosmochim. Acta 74, 2412–2428.
Guillong, M., Günther, D., 2002. Effect of particle size on ICP-induced elementalfractionation on laser ablation-inductively coupled plasma-mass spectrometry.J. Anal. At. Spectrom. 17, 831–837.
Hazen, R., 1976. Effect of temperature and pressure on the crystal structure offorsterite. Am. Mineral. 61, 1280–1293.
Hazen, M., Finger, L., 1982. Comparative Crystal Chemistry: Temperature, Pressure,Composition, and the Variation of Crystal Structure. Wiley, New York.
Kennedy, A., Lofgren, G., Wasserburg, G., 1993. An experimental study of traceelement partitioning between olivine, orthopyroxene and melt in chondrules:equilibrium values and kinetic effects. Earth Planet. Sci. Lett. 115, 177–195.
Keppler, H., Rubie, D., 1993. Pressure-induced coordination changes of transition-metal ions in silicate melts. Nature 364, 221–228.
Kohara, S., Suzuya, K., Loong, C., Grimsditch, M., Weber, J., Tangeman, J., Key, T.,2004. Glass formation at the limit of insufficient network formers. Science 303,1649. http://dx.doi.org/10.1126/science.1095047.
Liu, W., Li, B., 2006. Thermal equation of state of (Mg0.9Fe0.1)2SiO4 olivine. Phys.Earth Planet. Int. 157, 188–195.
Matsui, Y., Onuma, N., Nagasawa, H., Higuchi, H., Banno, S., 1977. Crystal structurecontrol in trace element partition between crystal and magma. Bull. Soc. Fr.Mineral. Crystallogr. 100, 315–324.
Matsukage, K., Kubo, K., 2003. Chromian spinel during melting experiments of dryperidotite KLB-1 at 1.0–2.5 GPa. Am. Mineral. 88, 1271–1278.
Onuma, N., Higuchi, H., Wakita, H., Nagasawa, H., 1968. Trace element partitionbetween two pyroxenes and the host lava. Earth Planet. Sci. Lett. 5, 47–51.
Ozawa, S., 1991. Trivalent cations in olivine and their implication to the uppermantle tectonics as inferred from the high pressure experiments. Doctral thesis,University of Tokyo.
Pearce, N., Perkins, W., Westgate, J., Gorton, M., Jackson, S., Neal, C., Chenery, S.,1996. A complication of new and published major and trace element data forNIST SRM 610 and NIST SRM 612 glass reference materials. Geostand. Newsl.21, 115–144.
Schreiber, H., Haskin, L., 1976. Chromium in basalts: experimental determination ofredox states and partitioning among synthetic silicate phases. Proc. Lunar Sci.Conf. 7th, 1221–1259.
T. Imai et al. / Physics of the Earth and Planetary Interiors 212–213 (2012) 64–75 75
Shannon, R.D., 1976. Revised effective ionic radii and systematic studies ofinteratomic distances in halides and chacogenides. Acta Crystallogr. A32,751–767.
Suzuki, T., Hirata, T., Yokoyama, T.D., Imai, T., Takahashi, E., 2012. Pressure effect onelement partitioning between minerals and silicate melt: melting experimentson basalt up to 20 GPa. Phys. Earth Planet. Inter. (in revision).
Takahashi, E., 1986. Melting of a dry peridotite KLB-1 up to 14 GPa: implications onthe origin of peridotitic upper mantle. J. Geophys. Res. 91, 9367–9382.
Takahashi, E., Shimazaki, T., Tsuzaki, Y., Yoshida, H., 1993. Melting study of aperidotite KLB-1 to 6.5 GPa and the origin of basaltic magmas. Philos. Trans. R.Soc. Lond. Ser. A 342, 105–120.
Taura, H., Yurimoto, H., Kurita, K., Sueno, S., 1998. Pressure dependence on partitioncoefficients for trace elements between olivine and the coexisting melts. Phys.Chem. Minerals 25, 469–484.
Van Westrenen, W., Allan, N., Blundy, J., Purton, J., Wood, B., 2000. Atomisticsimulation of trace element incorporation into garnets—comparison withexperimental garnet–melt partitioning data. Geochim. Cosmochim. Acta 64,1629–1639.
Van Westrenen, W., Blundy, J., Wood, B., 1999. Crystal-chemical controls on traceelement partitioning between garnet and anhydrous silicate melt. Am. Mineral.84, 838–847.
Van Westrenen, W., Wood, B., Blundy, J., 2001. A predictive thermodynamic modelof garnet–melt trace element partitioning. Contrib. Mineral. Petrol. 142, 219–234.
Van Westrenen, W., Allan, N., Blundy, J., Lavrentiev, M., Lucas, B., Purton, J., 2003.Trace element incorporation into pyrope–grossular solid solutions: an atomisticsimulation study. Phys. Chem. Minerals 30, 217–229.
Van Westrenen, W., Draper, D., 2007. Quantifying garnet–melt trace elementpartitioning using lattice-strain theory: new crystal-chemical andthermodynamic constraints. Contrib. Mineral. Petrol. 154, 717–730.
Wang, W., Takahashi, E., 1999. Subsolidus and melting experiments of a K-richbasaltic composition to 27 GPa: implication for the behavior of potassium inmantle. Am. Mineral. 84, 357–361.
Wang, W., Takahashi, E., 2000. Subsolidus and melting experiments of K-dopedperidotite KLB-1 to 27 GPa: Its geophysical and geochemical implications. J.Geophys. Res. 105, 2855–2868.
Wilding, M., Guthrie, M., Kohara, S., Bull, C., Akola, J., Tucker, M., 2012. The structureof MgO–SiO2 glasses at elevated pressure. J. Phys.: Condens. Matter 24, 225403.
Wood, B., Blundy, J., 1997. Trace element partitioning under crustal and uppermostmantle conditions: the influences of ionic radius, cation charge, pressure andtemperature. In: Carlson, R.W. (Ed.), The Mantle and Core, Treatise onGeochemistry, vol. 2, pp. 395–424.
Wood, B., Corgne, A., 2007. Mineralogy of the earth – trace elements and hydrogenin the earth’s transition zone and lower mantle. In: Treatise on Geophysics.Elsevier, Amsterdam.
Zhang, J., Herzberg, C., 1994. Melting experiments on anhydrous peridotite KLB-1from 5.0 to 22.5 GPa. J. Geophys. Res. 99, 17729–17742.