element 6: economic developmenta1d2eaaa-7a29-46d6-bf1a... · the layout, data, and ... the...
TRANSCRIPT

Polk County, Wisconsin Economic Development
Comprehensive Plan 2009-2029 200
ELEMENT 6: ECONOMIC DEVELOPMENT
Economic development element. A compilation of objectives, policies, goals, maps and programs to promote the stabilization, retention or expansion, of the economic base and quality employment opportunities in the local governmental unit, including an analysis of the labor force and economic base of the local governmental unit. The element shall assess categories or particular types of new businesses and industries that are desired by the local governmental unit. The element shall assess the local governmental unit’s strengths and weaknesses with respect to attracting and retaining businesses and industries, and shall designate an adequate number of sites for such businesses and industries. The element shall also evaluate and promote the use of environmentally contaminated sites for commercial or industrial uses. The element shall also identify county, regional and state economic development programs that apply to the local governmental unit.
6.1 VISIONING 6.2 EXISTING CONDITIONS 6.3 DESIRED TYPES OF ECONOMIC
DEVELOPMENT 6.4 SWOT ANALYSIS 6.5 ISSUES AND OPPORTUNITIES 6.6 OPPORTUNITIES FOR REDEVELOPMENT 6.7 CURRENT ECONOMIC DEVELOPMENT
PROGRAMS 6.8 GOALS, OBJECTIVES, AND POLICIES
6.1 VISIONING From the March 25th, 2009 County Plan Meeting: Question: Imagine Polk County in 20 years. What does it look like regarding economic development? Economic Development Preferred Future
• Continue growth along main corridors • Promote “green/sustainable” buildings in new developments • Higher education facility • Tourism focused
o Support second homes/resorts

Polk County, Wisconsin Economic Development
Comprehensive Plan 2009-2029 201
o Recreation opportunities o Trails, multi-use, walking, bike, horses o Arts tour, community
• Indoor recreation facility/venue • North County – Capitalize on rural assets • South of Hwy. 8 services • Diversified economic development
6.2 EXISTING CONDITIONS Economic development as part of comprehensive planning is the process by which the Polk County community initiates and generates solutions to local economic problems. The primary purpose of economic development initiatives is to promote the stabilization, retention, or expansion of the economic base and to provide quality employment opportunities in the local governmental unit. This includes assisting existing businesses, encouraging business expansion, recruiting new businesses, and strategically planning important capital improvements and related infrastructure expenditures. Such endeavors should be guided by the vision and goals in County and local comprehensive plans to encourage efficiency and ensure a positive impact on the community. These efforts collectively build long-term local economic capacity so the community is more self-sufficient and able to better weather economic downturns. As successful economic development endeavors strengthen and diversify local economies, local businesses may locate in close proximity to the primary industry that supports them. These secondary or support businesses take advantage of economic spillovers of the primary industry. A local example of this is the close relationship between the existing agriculture and food processing industries. The layout, data, and description of the economy in this section was largely compiled during the Summer of 2008 with the input of a variety of economic development agencies in the region, including economic development corporations, universities, technical colleges, and Wisconsin Department of Workforce Development.

Polk County, Wisconsin Economic Development
Comprehensive Plan 2009-2029 202
The Wisconsin Economy4
Perhaps more than many comprehensive plan elements, the local economy and economic development are influenced by regional, State, national, and global factors. As such, great uncertainty exists when analyzing and forecasting the economy.
Recent Economic Trends The economy is always in flux, often occurring in cycles or periods of growth, prosperity, and expansion followed by periods of decline, contraction, or recession. There is no reliable methodology to predicting such cycles, and some economists argue that these fluctuations are the result of “shocks” to the economy in terms of productivity or demand changes, and the use of the term “cycle” is a misnomer.
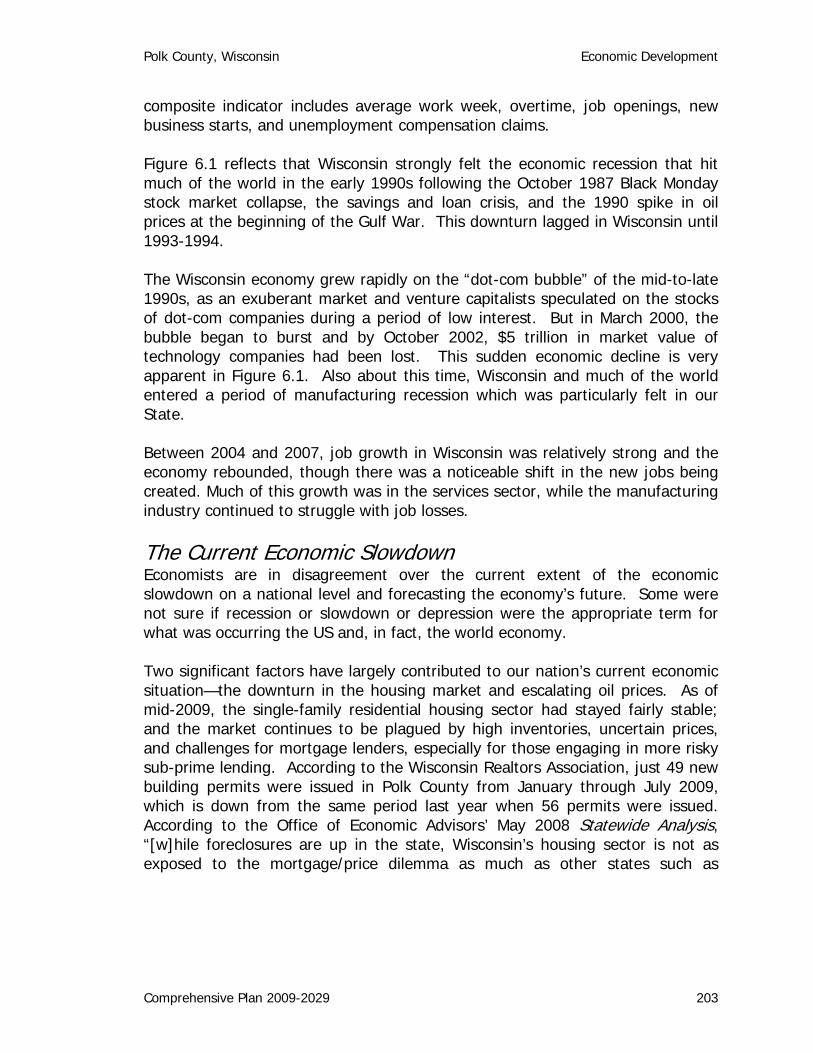
Gross domestic product is often used to measure economic cycles, though Wisconsin’s annual average GDP has been growing quite steadily over the last decade. Instead, in order to show these economic fluctuations, Figure 6.1 charts the composite index of leading indicators between 1990 and May 2008 for Wisconsin.
Leading economic indicators are based on certain economic activities which foreshadow a forthcoming economic change. In the case of Figure 6.1, the
4 Unless otherwise noted, the information in this section was largely extracted from the following two sources: (1) Winters, Dennis, Chief Economist. Department of Workforce Development-Office of Economic Advisors. Data Dashboard-Statewide Analysis. <http://dwd.winsonsin.gov/oea/data_dashboard>. May 1, 2008. (2) Wisconsin Department of Revenue-Division of Research & Policy. Wisconsin Economic Outlook. May 2008.
70
80
90
100
110
120
130
140
150
160
170
1990
1991
1992
1993
1994
1995
1996
1997
1998
1999
2000
2001
2002
2003
2004
2005
2006
2007
2008
Com
posi
te In
dex
of L
eadi
ng In
dica
tors
(199
4 av
g. =
100
)
Figure 6.1 – Composite Index of Leading Indicators for Wisconsin (1990-May 2008)
source: Wisconsin Office of Economic
Polk County, Wisconsin Economic Development
Comprehensive Plan 2009-2029 203
composite indicator includes average work week, overtime, job openings, new business starts, and unemployment compensation claims. Figure 6.1 reflects that Wisconsin strongly felt the economic recession that hit much of the world in the early 1990s following the October 1987 Black Monday stock market collapse, the savings and loan crisis, and the 1990 spike in oil prices at the beginning of the Gulf War. This downturn lagged in Wisconsin until 1993-1994. The Wisconsin economy grew rapidly on the “dot-com bubble” of the mid-to-late 1990s, as an exuberant market and venture capitalists speculated on the stocks of dot-com companies during a period of low interest. But in March 2000, the bubble began to burst and by October 2002, $5 trillion in market value of technology companies had been lost. This sudden economic decline is very apparent in Figure 6.1. Also about this time, Wisconsin and much of the world entered a period of manufacturing recession which was particularly felt in our State. Between 2004 and 2007, job growth in Wisconsin was relatively strong and the economy rebounded, though there was a noticeable shift in the new jobs being created. Much of this growth was in the services sector, while the manufacturing industry continued to struggle with job losses. The Current Economic Slowdown Economists are in disagreement over the current extent of the economic slowdown on a national level and forecasting the economy’s future. Some were not sure if recession or slowdown or depression were the appropriate term for what was occurring the US and, in fact, the world economy. Two significant factors have largely contributed to our nation’s current economic situation—the downturn in the housing market and escalating oil prices. As of mid-2009, the single-family residential housing sector had stayed fairly stable; and the market continues to be plagued by high inventories, uncertain prices, and challenges for mortgage lenders, especially for those engaging in more risky sub-prime lending. According to the Wisconsin Realtors Association, just 49 new building permits were issued in Polk County from January through July 2009, which is down from the same period last year when 56 permits were issued. According to the Office of Economic Advisors’ May 2008 Statewide Analysis, “[w]hile foreclosures are up in the state, Wisconsin’s housing sector is not as exposed to the mortgage/price dilemma as much as other states such as

Polk County, Wisconsin Economic Development
Comprehensive Plan 2009-2029 204
Arizona, California, Florida, Nevada, and Ohio.”5 In fact, Wisconsin ranked 38th nationally in foreclosures in March of 2009. Figure 6.2 Foreclosures in Polk County, September 2009
Source: Wisconsin Realtors Association As shown in Figure 6.2 to the right, gasoline prices have increased tremendously since the mid part of this decade. With the record-breaking increases in the cost of oil, retail prices in the U.S. increased by five percent between June 2007 and June 2008.6 Gas prices jumped by nearly one-third during this same time period. This increase in gas and energy prices has had corresponding increases in food and other commodities, thereby decreasing household purchasing power and decreasing spending by consumers and businesses. In particular, automotive sales have been hurt as consumers hold on to their existing vehicles longer or begin to use alternative modes of transportation. General Motors has announced 5 Ibid. 6 Isidore, Chris. CNN Money.com. Inflation: Price Jump Worst Since ’91. <http:cnnmoney.com> June 16, 2008.
source: Wisconsin Office of Economic Advisors, May 2008.
70
100
130
160
190
220
2001 2002 2003 2004 2005 2006 2007 2008
All itemsGasolineMedical
2001 = 100
Figure 6.2 - Gasoline & Medical Costs Compared to Consumer Price Index: All Items

Polk County, Wisconsin Economic Development
Comprehensive Plan 2009-2029 205
its intent to close its Janesville plant, which primarily makes SUVs, resulting in the loss of 2,390 jobs. Major restructuring and downsizing of airlines are also taking place due to increasing costs, thereby impacting routes, availability, and shipping. The May unemployment rate for Wisconsin increased from 4.2 percent in 2007 to 4.7 percent in 2008.7 Yet, the State rate was a full one percent below the national average in May 2008; and unemployment in Wisconsin has risen at a slower rate during the past year than the national average. Since mid 2007, employment numbers in Wisconsin have been relatively flat, while the employment growth rate has been diminishing since 2004. Even though unemployment has increased and the housing- and automotive-related industries have suffered, the previously referenced Office of Economic Advisors’ analysis does state that other sectors in Wisconsin are doing relatively well. “The weak dollar is benefitting exports of machinery, equipment, and agricultural commodities. Milk and grain prices are at or near record highs, although high feed prices are cutting into dairy profits.” The report goes on to note that during the previous year, 9,600 new jobs were created in the service sector, particular in the health-care industry. Business and professional services showed an annual increase of 1,800 jobs. The combination of a slowing economy and inflating prices is an added challenge to address. Interest rate cuts, a primary tool for avoiding an economic recession, can add to economic pressure. Meanwhile, the reduction in tax revenues related to decreasing development and new housing starts, combined with quickly escalating gas and commodity prices, has created a budgetary conundrum for many state, county, and local governments. Wisconsin’s Economic Outlook Forecasting the economy is difficult at best and such projections are based on historical economic fluctuations, current trends, and a variety of economic indicators. The Wisconsin Economic Outlook report issued by the Wisconsin Department of Revenue-Division of Research and Policy in May 2008 states that the Wisconsin economy is expected to slow for 2009 with the number of jobs slightly decreasing in 2008 and being steady in 2009. The following is a brief summary of the report’s employment outlook by some key industry sectors based on the most likely forecast scenario:
Construction - continue to decline to reach bottom by the end of 2008 and recovering positive growth toward 2010.
7 Wisconsin Department of Workforce Development. May 2008 Local Unemployment Rates Announced. press release. June 25, 2008.

Polk County, Wisconsin Economic Development
Comprehensive Plan 2009-2029 206
Education, Health, Professional, & Business Services - continued growth of 1.6% to 2.4% for 2008 and 2009.
Trade Transportation & Utilities - mild decreases of 0.2% to 0.5%, then recovering positive growth in 2010.
Manufacturing – loss of 2% of jobs in 2008 and 2009, 0.2% loss in 2010, then recovering job growth in 2011.
Natural Resources & Mining – job losses in 2008 and 2009, with growth in 2010.
Leisure & Hospitality – 1.1% decline in 2009, then healthy growth rate thereafter.
Financial Sector – no growth in 2008, slight growth in 2009, then healthy growth thereafter.
Information Sector – slight declines or no increases until 2011.
Government – 0.6% decline in 2008, slight decrease in 2009, peak in 2010 as the 2010 Census is carried out.
While the economy adjusts, opportunities do arise. Consumers are turning more to fuel-efficient vehicles, and the sale of hybrid vehicles is increasing. Research and development funding for alternative energy and energy-reducing technology is on the increase. Greater attention is being given to the planning and use of alternative means of passenger and commercial transportation. For instance, many public transit and Amtrak services are setting new records. And increased energy costs have increased attention on land-use patterns, alternative building materials, and other related sustainability concepts. Polk County Economic Profile Economic Data There is a significant amount of background data and information that is available from various public and private sources that is integrated into this document, including information from the following sources:
U.S. Census Bureau data o American Fact Finder Fact Sheets o County Business Patterns o Misc. demographic and other data
State of Wisconsin Department of Administration o Demographics Services Center
State of Wisconsin Department of Workforce Development o County Workforce Profiles o County Snapshots

Polk County, Wisconsin Economic Development
Comprehensive Plan 2009-2029 207
o Office of Economic Advisors State of Wisconsin Department of Revenue
o Wisconsin Economic Outlook State of Wisconsin Department of Commerce University of Wisconsin-Extension West Central Wisconsin Regional Planning Commission (WCWRPC)
o County summaries available at www.wcwrpc.org o Comprehensive Economic Development Strategy
Indiana Business Research Center USA County Profiles Polk County and other local agencies
Given the wealth of economic data available at the State, regional, county, and local levels, the plethora of specialized business studies, and the wide variety of economic models, no such compilation can truly be comprehensive in scope. As such, a community may need to consider additional studies focusing on a specific issue or topic as their planning efforts proceed. Further, there has been no clear consensus to date in the region as to which particular data source and which economic indicators should be used to measure economic vitality while allowing for comparisons between communities and regions. The State of Wisconsin, through the Department of Workforce Development-Office of Economic Advisors, has developed Wisconsin Regional Metrics Benchmarks with a common set of core economic, demographic, and labor market indicators. Due to Polk County’s proximity to the Minneapolis-St. Paul, MN-WI Metropolitan Statistical Area, some select data comparisons are included for the metro area. For ease of reference, the metro area is simply referred to as the Twin Cities MSA in the remainder of this section. Certain types of economic data and forecasts are only available at a county or regional level, and inferences must be made as to how it may be applicable for individual communities. However, earlier in the Issues and Opportunities section of this report, a variety of demographic, education, and labor force data tables were provided for Polk County and its municipalities. This section does not restate the data tables and maps provided earlier but, instead, builds upon this data to provide an economic “snapshot” of Polk County. Demographic Overview Current demographic trends, including population changes and educational attainment, are important foundational factors in many economic development initiatives. The population profile describes the existing and potential labor force that may fill the jobs located in the region. Educational attainment statistics are
Polk County, Wisconsin Economic Development
Comprehensive Plan 2009-2029 208
a proxy for the general skill level of the population. And household income allows inferences to be made about discretionary spending in Polk County as a whole.
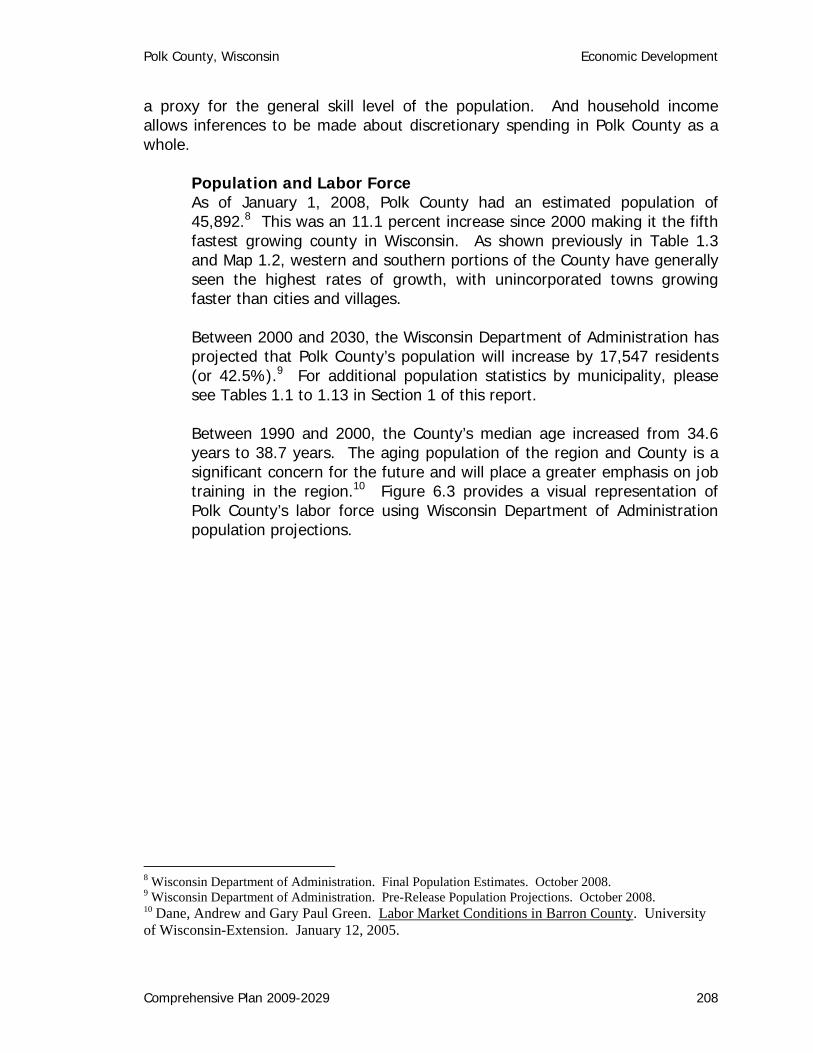
Population and Labor Force As of January 1, 2008, Polk County had an estimated population of 45,892.8 This was an 11.1 percent increase since 2000 making it the fifth fastest growing county in Wisconsin. As shown previously in Table 1.3 and Map 1.2, western and southern portions of the County have generally seen the highest rates of growth, with unincorporated towns growing faster than cities and villages. Between 2000 and 2030, the Wisconsin Department of Administration has projected that Polk County’s population will increase by 17,547 residents (or 42.5%).9 For additional population statistics by municipality, please see Tables 1.1 to 1.13 in Section 1 of this report. Between 1990 and 2000, the County’s median age increased from 34.6 years to 38.7 years. The aging population of the region and County is a significant concern for the future and will place a greater emphasis on job training in the region.10 Figure 6.3 provides a visual representation of Polk County’s labor force using Wisconsin Department of Administration population projections.
8 Wisconsin Department of Administration. Final Population Estimates. October 2008. 9 Wisconsin Department of Administration. Pre-Release Population Projections. October 2008. 10 Dane, Andrew and Gary Paul Green. Labor Market Conditions in Barron County. University of Wisconsin-Extension. January 12, 2005.

Polk County, Wisconsin Economic Development
Comprehensive Plan 2009-2029 209
Currently, most of the Polk County labor force is between the ages of 20 and 44. Most notable in Figure 6.3 is that the number of residents ages 65 and over is projected to more than double between 2005 to 2030. In short, while the County’s overall population is expected to increase 31.6 percent from 2005 to 2030, the size of the primary workforce (ages 20-64) to support the local economy will only increase by 13.8 percent. Meanwhile, the number of seniors age 65 and over increases dramatically.
For additional insight into the Polk County labor force, the Office of Economic Advisors’ County Workforce Profiles are an excellent source and are updated annually. Housing Market According to data provided by the US Bureau of the Census, the estimated number of single-family residential building permits issued in 1998 was 336 compared to 215 in 2007, a 36 percent decrease. Permits for all units decreased even more substantially (-43.7%) from 442 units in 1998 to 249 units in 2007. Building permit numbers reflect larger economic trends and can vary significantly from year to year. For instance, the highest number of units issued permits during the past decade occurred in 2004 when 569 total units valued at $75.3 million were permitted. This was over $39.3 million more in estimated construction value compared to 2007. Additionally, in 2004, Polk County experienced the largest number of new sanitary sewer systems in the past 20 years with 398 permits. So far in 2009 there have only been 54 new systems permits issued. Also in
Figure 6.3 – Polk County Age/Labor Force Projection (2005-2030)
source: Wisconsin Department of Administration, 2008
6,000
8,000
10,000
12,000
14,000
16,000
2005 2010 2015 2020 2025 2030
Year
Pop
ulat
ion
by A
ge G
roup
0-1920-4445-6465+
Age Groups

Polk County, Wisconsin Economic Development
Comprehensive Plan 2009-2029 210
2004 was the highest number of new rural addresses registered, 397, which closely correlates to the new sanitary sewer permits. So far in 2009, 40 new rural addresses have been distributed. These statistics give a good indication of how the economy has slowed significantly in recent years. Education As shown in Table 6.1, of the 2000 Polk County population that is 25 years and over, 86.9 percent had a high school education or higher, which is similar to the statewide rate. In 2000, 15.6 percent of residents had a bachelor’s degree or higher, which is a significant increase since 1990, but still substantially below the averages for the State and Twin Cities.
The demand for labor in the region is shifting toward more skilled work, although not as quickly as in some other regions in the State. This trend increases the need for worker training opportunities. A strong, traditional secondary educational system and a variety of worker training programs including WITC are important factors in economic development. For more detailed data on educational attainment by municipality in Polk County, please see Table 1.14 in Section 1 of this report. The Utilities and Community Facilities section identifies public schools and post-secondary institutions supporting the training needs of Polk County businesses. Income and Wages Summarizing income statistics yields insight on purchasing power. The 2005 median household income for Polk County was $48,022 which was 21st in the State of Wisconsin and 101.9 percent of the State average.
Table 6.1 – Polk County Educational Attainment (1990 and 2000)
source: U.S. Census Bureau, 1990, 2000.
Wisconsin1990 2000 90 to '00 2000
% % % Change %Less than high school diploma 22.0 14.1 -35.9 9.4 15.0
High school graduate 43.2 41.1 -4.9 9.1 34.6Some college, no degree 16.2 21.9 35.2 24.2 20.6
Associate degree 7.2 7.3 1.4 7.7 7.5Bachelor’s degree or higher 11.4 15.6 36.8 33.3 22.5
High school graduate or higher 78.0 85.9 10.1 90.6 85.1
Educational Attainment (residents 25 years or older)
Polk County Twin Cities MSA 2000

Polk County, Wisconsin Economic Development
Comprehensive Plan 2009-2029 211
Figure 6.4 compares Polk County’s per capita personal income11 to State averages. About 7.4 percent of individuals in the County were below the poverty level in 2005, up from 7.1 percent in 2000. For household income data by municipality, please see Tables 1.21 and 1.22 in Section 1. Overall average annual wages for Polk County increased by 15.3 percent in the six years from 2001 to 2006 as shown in Table 6.2. The biggest percentage increase was in the financial activities industry, while
11 Personal income is the income received by persons from all sources.
Figure 6.4 – Polk County vs. State Per Capita Personal Income (1997-2006)
source: U.S. Department of Commerce – Bureau of Economic Analysis.
$34,405
$24,514
$29,022
$20,734
$27,362
$20,041$18,000
$20,000
$22,000
$24,000
$26,000
$28,000
$30,000
$32,000
$34,000
$36,000
1997 1998 1999 2000 2001 2002 2003 2004 2005 2006
Wisconsin (all)Wisc. (non-metro)Polk County
Table 6.2 – Polk County Average Annual Wages by Industry (2001-2006) for covered employment and wages
source: Wisconsin Department of Workforce Development, Office of Economic Advisors
Industry 2001 2002 2003 2004 2005 2006 % change '01-'06
Natural Resources $22,339 $25,228 $23,070 $24,905 $26,210 $28,253 26.5%Construction 33,732 32,616 32,803 32,624 33,314 35,222 4.4%Manufacturing 30,507 32,695 33,957 36,377 36,272 35,831 17.5%Trade, Transportation, Utilities 20,742 21,710 22,286 23,487 23,843 24,634 18.8%Financial Activities 25,872 28,007 30,257 32,060 32,552 33,331 28.8%Education & Health 25,624 26,592 27,265 28,455 29,471 30,953 20.8%Information 23,767 23,116 23,061 32,983 23,825 23,752 -0.1%Leisure & Hospitality 9,119 9,035 9,245 9,211 9,419 9,968 9.3%Professional & Business Services 21,524 24,469 27,134 27,215 23,056 23,848 10.8%Other Services 18,425 19,268 17,935 supressed 18,797 19,060 3.4%Public Admininistration 22,029 22,722 24,588 23,999 25,336 25,510 15.8%All Industries $24,564 $25,566 $26,330 $27,737 $27,691 $28,320 15.3%

Polk County, Wisconsin Economic Development
Comprehensive Plan 2009-2029 212
information services wages decreased slightly. The 2006 average wage in Polk County was $28,320 or about 76.9 percent of the average Wisconsin wage for all industries ($36,830). For 2004 estimated salary and wages by occupation, please see Table 6.8 later in this section. Employment Trends Of Polk County residents 16 years of age and over, 67.7 percent were in the labor force as of 2006, below the State average of 70 percent. As the monthly employment rates presented in Figure 6.5 show, Polk County experiences a significantly higher amount of employment seasonality compared to State averages, with increased unemployment during the winter months. For example, in February 2008, the Polk County unemployment rate was 7.9 percent, but this dropped to 4.7 percent by May 2008. Historically since 1990, unemployment in Polk County has been above the State average, dropping to a low of 2.3 percent in October 1999 during this timeframe. But the County’s unemployment rate increased significantly from the 2000 annual average rate of 3.3 percent, reaching an annual average of 6.9 percent in 2003. Since 2003, the County’s annual average unemployment rate has hovered between 5.3 to 6.2 percent. In the 2nd Quarter of 2009, the unemployment rate in Polk County was 10.4%. This rate is exceedingly high and ranks Polk County 16th highest in the State among all counties. Unemployment is not only a reflection of job availability, but total available labor force. Figure 6.6 shows that the Polk County average annual labor force grew by 7,324 persons or 42.5 percent from 1900 to 2007. According to the UW-Extension 2005 labor market conditions report, the region’s labor market remains tight, with most employers having a difficult time attracting and retaining qualified workers.12 Table 1.15 in Section 1 provides unemployment statistics for the 1990 and 2000 labor force by municipality.
12 Dane, Andrew and Gary Paul Green. Labor Market Conditions in Barron County. University of Wisconsin-Extension. January 12, 2005.

Polk County, Wisconsin Economic Development
Comprehensive Plan 2009-2029 213
source: Wisconsin Department of Workforce Development, Office of Economic Advisors
Figure 6.5 – Polk Co. & Wisconsin Monthly Unemployment Rate (1990-June 2008) not seasonally adjusted
2.0
3.0
4.0
5.0
6.0
7.0
8.0
9.0
10.0
11.0
1990
1990
1991
1992
1993
1993
1994
1995
1996
1996
1997
1998
1999
1999
2000
2001
2002
2002
2003
2004
2005
2005
2006
2007
2008
Unem
ploy
men
t (%
)
Polk County
Wisconsin
Lines are averaged trend lines (polynomial method)
for relative comparison purposes only.

Polk County, Wisconsin Economic Development
Comprehensive Plan 2009-2029 214
Commuting Patterns Of Polk County workers 16 years of age and over in 2000, 76.9 percent drove to work alone; and workers had a mean travel time of 28.7 minutes. Figure 6.7 shows that commuting distances and travel time for Polk County resident workers have been increasing, with fewer persons working at home. In 2000, 61.7 percent of the Polk County workforce was employed outside of Polk County, with 23.3 percent employed outside the State of Wisconsin. Tables 1.18 and 1.19 provide statistics on travel time to work and place of work for the County and by municipality. Commuting patterns are discussed in greater detail within the Transportation discussion (See Section 3: Transportation).
Figure 6.6 – Polk Co. Monthly Total Potential Labor Force (1990-June 2008) not seasonally adjusted
source: Wisconsin Department of Workforce Development, Office of Economic Advisors
16,500
17,500
18,500
19,500
20,500
21,500
22,500
23,500
24,500
1990
1990
1991
1992
1993
1993
1994
1995
1996
1996
1997
1998
1999
1999
2000
2001
2002
2002
2003
2004
2005
2005
2006
2007
2008
Tota
l Pot
entia
l Lab
or F
orce
Monthly Labor Force
Average Trend Line
Red line is the averaged trend line
(polynomial method).

Polk County, Wisconsin Economic Development
Comprehensive Plan 2009-2029 215
Economic Base While the previous sub-section focused on general economic indicators for Polk County, the following information focuses more on the different industry sectors and occupations which constitute the County’s economic base.
Industry Composition According to statistics from the U.S. Bureau of the Census and Bureau of Economic Analysis for Polk County:
In 2000, about 77.5% of the employed workforce was private-sector wage and salary workers; about 11.4% were government workers. About 10.4% of the workers were self-employed in a non-incorporated business
In 2006, the average income per job in sole proprietorships was about 43.7% of the County’s total average wages and salaries per job, including employer contributions.
Annual average earnings per job in 2006 were $27,791. Annual average earnings per farm proprietor were -$2,864.
Figure 6.7 – Polk County Travel Time to Work (1990 and 2000)
source: U.S. Census
1,7331,268
3,6693,803 3,761
4,915
1,905
3,002
4,139
7,300
0
1,000
2,000
3,000
4,000
5,000
6,000
7,000
8,000
# of
Com
mut
ers
Worked at home < 10 min. 10-19 min. 20-29 min. 30+ min.Travel Time to Work
1990
2000

Polk County, Wisconsin Economic Development
Comprehensive Plan 2009-2029 216
As shown in Table 6.3, the construction industry has the largest number of establishments, reflecting the County’s significant growth rate, though this number was fairly stable from 2004 to 2006.
The construction industry also had the largest number of new establishments between 1998 and 2006 with 53, while the fastest growing industries in terms of new establishments were educational services and real estate/leasing. Employment by Industry As shown in Table 6.4 below, employment in the service sectors (e.g., professional, leisure, financial, and education/health) has been growing at a faster rate than the goods-producing sectors in Polk County. In fact, manufacturing employment decreased by 7.5 percent from 2001 to 2006.
Table 6.3 – Polk County Number of Establishments by Industry (1998-2006)
source: U.S. Census Bureau County Business Patterns
Industry Code 1998 1999 2000 2001 2002 2003 2004 2005 2006 % change '98-'06
Forestry, fishing, hunting, and agri. support 6 6 6 5 3 3 2 3 3 -50.0%Mining 3 3 3 3 3 3 3 4 4 33.3%Utilities 9 8 9 9 8 8 8 9 9 0.0%Construction 142 150 148 156 183 185 195 200 195 37.3%Manufacturing 97 103 102 100 107 108 114 114 117 20.6%Wholesale trade 33 32 31 27 35 28 28 33 34 3.0%Retail trade 180 185 178 175 186 191 193 183 183 1.7%Transportation & warehousing 37 37 37 40 45 39 35 37 36 -2.7%Information 19 18 18 16 21 20 19 16 16 -15.8%Finance & insurance 47 45 44 45 49 51 54 55 56 19.1%Real estate & rental & leasing 20 25 25 28 31 35 38 43 39 95.0%Professional, scientific & technical services 65 65 64 70 69 67 72 71 72 10.8%Management of companies & enterprises 0 0 0 0 0 1 2 2 2 n.a.Admin, support, waste mgt, remediation 26 26 28 36 41 37 41 46 41 57.7%Educational services 4 4 6 6 7 3 4 4 7 75.0%Health care and social assistance 85 88 86 86 97 100 102 99 103 21.2%Arts, entertainment & recreation 25 22 19 21 23 27 28 31 28 12.0%Accommodation & food services 119 113 105 113 122 122 128 126 123 3.4%Other services (except public administration) 127 124 130 127 142 133 137 136 127 0.0%Unclassified/Auxillary establishments 19 19 23 17 4 4 8 3 4 -78.9%Total 1,063 1,073 1,062 1,080 1,176 1,165 1,211 1,215 1,199 12.8%

Polk County, Wisconsin Economic Development
Comprehensive Plan 2009-2029 217
These trends are consistent with the historical employment data provided previously for Polk County and its municipalities in Tables 1.15 and 1.16. However, while the historical data is arranged by Standard Industrial Classification (SIC) code, most industry data available today is organized by the North American Industry Classification System (NAICS), often making comparisons between newer and older industry data challenging.
Table 6.4 – Polk County Employment by Industry (2001-2006)
source: Wisconsin Department of Workforce Development-Office of Economic Advisors
Industry 2001 2002 2003 2004 2005 2006 % change '01-'06
Natural Resources 148 147 182 184 191 184 24.3%Construction 736 790 777 788 794 741 0.7%Manufacturing 4,136 3,813 3,664 3,812 3,922 3,827 -7.5%Trade, Transportation, Utilities 2,606 2,624 2,631 2,561 2,642 2,695 3.4%Financial Activities 490 520 516 510 520 525 7.1%Education & Health 3,417 3,474 3,562 3,589 3,636 3,661 7.1%Information 321 300 305 456 319 323 0.6%Leisure & Hospitality 1,334 1,379 1,374 1,485 1,552 1,490 11.7%Professional & Business Services 408 444 494 641 733 727 78.2%Other Services 284 266 238 supressed 250 258 -9.2%Public Admininistration 588 598 600 618 622 626 6.5%All Industries 14,467 14,356 14,342 14,894 15,181 15,056 4.1%
Figure 6.8 – Polk County Employment by Industry (2006)
source data:: Wisconsin Department of Workforce Development-Office of Economic Advisors
Manufacturing26%
Education & Health24%
Construction &Nat. Resources
6%
Trade, Transportation,& Utilities
18%
Leisure &Hospitality
10%
Prof., Business,& Financial Services
8%
PublicAdmininistration
4%Information &
Other Services4%
Polk County, Wisconsin Economic Development
Comprehensive Plan 2009-2029 218
Though manufacturing employment decreased from 2001 to 2006 overall, the industry has gained jobs since 2003. Manufacturing remains the largest industry by employment as represented in Figure 6.8. If trends continue as expected, the second largest employment sector—education and health—may have already become the top employment industry in the County. Retail trade employment constitutes the largest component of the trade, transportation, and utilities industry.
Eight of Polk County’s top 25 employers are manufacturing companies (see Table 6.5), including the County’s largest employer, Polaris Industries Manufacturing. While the manufacturing sector in Polk County paid one of the highest annual average wages in 2006, these wages were only 78 percent of the State average for the manufacturing sector. The Wisconsin Department of Workforce Development in the 2007 Polk County Workforce Profile notes that rural jobs do tend to pay less than their urban counterparts, explaining the lower wages locally in the County. Six employers in the top 25 were school districts, while medical facilities and nursing homes constituted another four. Like all Polk County industries, wages in education and health services were also below State averages. Polk County government was the second largest employer in the County in 2007.
Given that numerous residents commute to Minnesota for work, it is valuable to compare the Polk County employment by industry to that of the top employers in the larger Twin Cities MSA. In 2006, those were:
Education and health services 20.6% Manufacturing 14.5% Professional, Scientific, Waste Mgmt. 11.6% Retail trade 10.9% Finance, insurance, and real estate 11.6% Arts, entertainment, & hospitality 7.9% As of 2006, 7.9 percent of Polk County jobs were in farming, of which 83.9% were sole proprietors. Polk County ranked 37th among the State’s 72 counties in the total value of agricultural products sold in 2002. As noted in the U.S. Department of Agriculture Censuses, and as discussed previously in Section 5, the acreage of farmland and average farm size in Polk County continue to decrease. Even with these changes in agriculture, Polk County farmers sold nearly $72.5 million worth of agricultural products in 2002, which has a significant economic impact.

Polk County, Wisconsin Economic Development
Comprehensive Plan 2009-2029 219
Seventy-three percent of this value was in livestock, poultry, and related products, rather than crop and nursery products. Polk County ranked fifth in the State in turkey livestock, given its proximity to the large turkey processing plants in Barron County; tenth in aquaculture; thirteenth in poultry and eggs; and fifteenth in sheep, goats, and their products. For a more detailed discussion of employment and wage trends in Polk County, please refer to the 2007 Polk County Workforce Profile compiled by the Wisconsin Department of Workforce Development.
Employment by Occupation Like employment by industry, employment by occupation is also difficult to compare across years due to changing definitions and data-gathering
Table 6.5– Polk County Top Employers (March 2007) (with 100+ employees)
source: Wisconsin Department of Workforce Development-Office of Economic Advisors
Rank Employer Name Industry Type Employee size range
1 Polaris Industries Mfg All other transportation equipment mfg. 500-9992 County of Polk Executive & legislative offices, combined 500-9993 Wal-Mart Discount department stores 250-4994 St Croix Regional Medical Center General medical & surgical hospitals 250-4995 Osceola Public School Elementary & secondary schools 250-4996 Amery Regional Medical Center Inc General medical & surgical hospitals 250-4997 School District of Amery Elementary & secondary schools 250-4998 Bishop Fixture & Millwork Inc Showcases, partitions, shelving, & lockers 100-2499 Balsam Lake-Unity-Milltown Public School Elementary & secondary schools 100-24910 Ladd Memorial Hospital Inc General medical & surgical hospitals 100-24911 School District of St Croix Falls Elementary & secondary schools 100-24912 Menards Home centers 100-24913 Trollhaugen Inc Skiing facilities 100-24913 Tenere Inc Sheet metal work manufacturing 100-24915 Scientific Molding Corp Ltd All other plastics product manufacturing 100-24916 Durex Products Inc All other plastics product manufacturing 100-24917 Cardinal Glass Industries Inc Glass product mfg. made of purchased glass 100-24918 Northwire Inc Other communication & energy wire mfg. 100-24919 Good Samaritan Center Nursing care facilities 100-24920 School District of Clear Lake Elementary & secondary schools 100-24921 Advanced Food Products Cheese manufacturing 100-24922 Westaff Temporary help services 100-24923 School District of Luck Elementary & secondary schools 100-24924 Masterson Personnel Inc Temporary help services 100-24925 Oxbo Intl Corp Farm machinery & equipment manufacturing 100-24926 The Riverbank Commercial banking 100-24927 St Croix Valley Hardwoods Cut stock, resawing lumber, & planing 100-24928 Frederic Public School Elementary & secondary schools 100-249

Polk County, Wisconsin Economic Development
Comprehensive Plan 2009-2029 220
approaches. Employment by occupation for 1990 and 2000 for each Polk County municipality is included in Table 1.18 in Section 1 of this report. According to the 2000 U.S. Census, of the Polk County employed civilian population 16 years of age and over (20,553):
26.4% were employed in management, professional, and related occupations
21.6% were employed in production, transportation, and material moving occupations
21.7% were employed in sales and office occupations
Together, these three general occupation categories constitute 76.4 percent of the County’s workforce.
Table 6.6 provides additional insight into the occupations of our region. These numbers are similar to the 2000 U.S. Census Bureau occupation statistics for Polk County.
Table 6.6 – West Central Wisconsin WDA Region
Estimated Employment and Salary by Occupation (2004)
West Central WDA includes Barron, Chippewa, Clark, Dunn, Eau Claire, Pepin, Pierce, Polk and St. Croix Counties. source: Wisconsin Department of Workforce Development-Office of Economic Advisors
Office and Administrative Support 27,090 15.6% $27,099Production 21,580 12.4% $28,765Sales and Related 17,120 9.8% $27,743Food Preparation and Serving Related 16,870 9.7% $16,748Transportation and Material Moving 14,670 8.4% $26,349Education, Training, and Library 11,010 6.3% $39,300Healthcare Practitioners and Technical 8,580 4.9% $49,793Construction and Extraction 7,480 4.3% $39,111Installation, Maintenance, and Repair 6,700 3.9% $34,441Management 6,070 3.5% $74,714Healthcare Support 5,830 3.4% $23,325Business and Financial Operations 5,560 3.2% $48,430Building and Grounds Cleaning and Maintenance 5,380 3.1% $22,256Personal Care and Service 4,570 2.6% $19,567Protective Service 3,260 1.9% $33,184Architecture and Engineering 2,960 1.7% $55,024Community and Social Services 2,800 1.6% $38,992Computer and Mathematical 2,060 1.2% $54,277Arts, Design, Entertainment, Sports, and Media 1,930 1.1% $33,885Life, Physical, and Social Science 1,410 0.8% $49,461Legal 670 0.4% $63,731Farming, Fishing, and Forestry 270 0.2% $24,922Total 173,880 100.0% $32,266
% of Total Employ-
ment
2004 Employ-
mentOccupation
Average Annual Salary

Polk County, Wisconsin Economic Development
Comprehensive Plan 2009-2029 221
In the West Central Wisconsin Workforce Development Area (see Figure 6.9) which includes Polk County, office and administrative support and production are the most frequent occupations, though they are below the average annual salary for the region.
Employment Projections
In November 2003, the Wisconsin Department of Workforce Development (WDWD) released a publication entitled Wisconsin Projections, 2000-2010. This publication makes economic projections for the State regarding the labor force, industries, and occupations. This information was further supplemented by ten-year projections (2004-2014) by regional workforce development area (WDA). This sub-section relies, in large part, on these WDWD documents.
Municipal units within Polk County have employment patterns that are similar to the State. It is anticipated that for the near future, Wisconsin’s total population will grow more slowly while average age will increase more rapidly than the nation as a whole, leading to lower participation rates in the workforce. Wisconsin is also having difficulty attracting international immigrants and domestic migrants and retaining its own citizens. Wisconsin will continue to face the challenge of filling job openings.
As shown in Table 6.7, the region’s WDA industries that are projected to add the most jobs from 2004-2014 are education and health services. Ambulatory health case services jobs alone will grow 36.6 percent, reflecting, in part, our region’s aging demographic. The number of total jobs in the manufacturing industry is estimated to remain fairly unchanged during this timeframe. These projections account for anticipated changes in Wisconsin’s economy within the timeframe, though unanticipated events may impact accuracy.
Figure 6.9 – West Central Wisconsin Workforce Development Area
source: Wisconsin Department of Workforce Development-Office of Economic Advisors

Polk County, Wisconsin Economic Development
Comprehensive Plan 2009-2029 222
Industry Title 2004
Estimated Employment
2014 Projected
Employment
2004-2014 Employment
Change
2004-2014 Percentage
Change
Total Non-Farm Employment 173,880 194,330 20,450 11.8%Construction/Mining/Natural Resources 8,380 9,880 1,500 17.9%
Manufacturing 31,990 32,030 40 0.1% Paper Manufacturing 1,720 1,720 0 0.0%
Plastics and Rubber Products Manufacturing 3,400 3,670 270 7.9%
Computer and Electronic Product Manufacturing 3,220 3,020 -200 -6.2%
Trade 28,800 30,900 2,100 7.3%
Food and Beverage Stores 5,040 5,250 210 4.2%Transportation and Utilities (Including US Postal) 8,270 9,520 1,250 15.1%
Financial Activities 7,010 7,710 700 10.0%
Education and Health Services (Including gov’t) 37,330 45,540 8,210 22.0%
Ambulatory Health Care 5,540 7,570 2,030 36.6%
Hospitals (Including gov’t) 7,050 8,640 1,590 22.6%Leisure and Hospitality 17,300 19,930 2,630 15.2%
Information/Prof Services/Other Services 21,470 24,920 3,450 16.1%
Government (Excluding US Postal, State and Local Educ and Hospitals)
13,310 13,930 620 4.7%
TABLE 6.7 West Central Wisconsin WDA Region Industry Projections (2004-2014)
West Central WDA includes Barron, Chippewa, Clark, Dunn, Eau Claire, Pepin, Pierce, Polk and St. Croix Counties. source: Wisconsin Dept. of Workforce Development, Bureau of Workforce Information, 2006

Polk County, Wisconsin Economic Development
Comprehensive Plan 2009-2029 223
Table 6.8 provides the estimated employment by occupation in 2004 and projected employment occupation for 2014 in the west central WDA. Overall, total employment is expected to increase by 11.8 percent in the region from 2004 to 2014, with 2,050 new jobs created annually and 4,300 job replacements annually. The largest increase in the total number of jobs is expected in the food preparation- and serving-related occupations. Large employment growth (both total and percentage) is also expected in the health care practitioners and related technical occupations. Notably, these two occupation groups have very different salary and wage estimates.
Table 6.9 presents 2014 employment and wage projections for the top 10 occupations within the west central WDA. This represents occupation opportunities in our region that are available to the residents of Polk County, though not all of these jobs may grow at a similar rate within the County. Some Polk County residents also benefit from job opportunities in the Minneapolis/St. Paul area. The greatest demand for workers in the region are the occupations on the “Most Openings” list. This list includes many occupations considered as first-time or temporary jobs that workers often leave as other opportunities open up; turnover is high and wages are low. There are a few exceptions on the list,
Table 6.8 – West Central Wisconsin WDA Region Occupation Projections and Estimated Wages (2004-2014)
West Central WDA includes Barron, Chippewa, Clark, Dunn, Eau Claire, Pepin, Pierce, Polk and St. Croix Counties. source: Wisconsin Dept. of Workforce Development – Office of Economic Advisors
2004 2014 Change%
ChangeNew Jobs
Replace-ments Total
Average Annual Salary
Entry Level
Hourly Wage
Experienced Hourly Wage
Management 6,070 6,860 790 13.0% 80 110 190 $74,714 $18.55 $44.61Business and Financial Operations 5,560 6,530 970 17.4% 100 100 200 $48,430 $13.84 $28.01Computer and Mathematical 2,060 2,570 510 24.8% 50 30 80 $54,277 $16.17 $31.06Architecture and Engineering 2,960 3,230 270 9.1% 30 70 100 $55,024 $16.79 $31.29Life, Physical, and Social Science 1,410 1,640 230 16.3% 20 30 50 $49,461 $14.58 $28.38Community and Social Services 2,800 3,300 500 17.9% 50 50 100 $38,992 $12.79 $21.73Legal 670 780 110 16.4% 10 10 20 $63,731 $13.59 $39.17Education, Training, and Library 11,010 12,740 1,730 15.7% 170 240 410 $39,300 $10.82 $22.93Arts, Design, Entertainment, Sports, and Media 1,930 2,190 260 13.5% 30 40 70 $33,885 $8.74 $20.06Healthcare Practitioners and Technical 8,580 10,920 2,340 27.3% 230 160 390 $49,793 $11.44 $30.19Healthcare Support 5,830 7,510 1,680 28.8% 170 90 260 $23,325 $8.91 $12.37Protective Service 3,260 3,480 220 6.7% 20 100 120 $33,184 $9.02 $19.42Food Preparation and Serving Related 16,870 19,260 2,390 14.2% 240 670 910 $16,748 $5.91 $9.12Building and Grounds Cleaning and Maintenance 5,380 6,290 910 16.9% 90 110 200 $22,256 $7.26 $12.42Personal Care and Service 4,570 5,640 1,070 23.4% 110 110 220 $19,567 $6.80 $10.71Sales and Related 17,120 18,320 1,200 7.0% 120 610 730 $27,743 $6.74 $16.64Office and Administrative Support 27,090 28,170 1,080 4.0% 110 640 750 $27,099 $8.57 $15.26Farming, Fishing, and Forestry 270 300 30 11.1% <5 10 10 $24,922 $8.60 $13.67Construction and Extraction 7,480 8,740 1,260 16.8% 130 150 280 $39,111 $12.52 $21.94Installation, Maintenance, and Repair 6,700 7,400 700 10.4% 70 150 220 $34,441 $11.00 $19.34Production 21,580 22,220 640 3.0% 60 520 580 $28,765 $9.55 $15.97Transportation and Material Moving 14,670 16,240 1,570 10.7% 160 320 480 $26,349 $7.98 $15.01Total 173,880 194,330 20,450 11.8% 2,050 4,300 6,350 $32,266 $8.04 $19.25
Occupational Title
Estimated Employment(Estimated Average Annual Openings
Estimated Salary and Wages (2005)

Polk County, Wisconsin Economic Development
Comprehensive Plan 2009-2029 224
including registered nurses and truck drivers. Both require a greater degree of education or training, and the wage scales also reflect this.
TABLE 6.9 - West Central Wisconsin WDA Region Occupation Projections (2014)
West Central WDA includes Barron, Chippewa, Clark, Dunn, Eau Claire, Pepin, Pierce, Polk and St. Croix Counties. source: Wisconsin Dept. of Workforce Development, Bureau of Workforce Information, 2006
Top 10 Occupations Typically Required Education/Training
Average Wage
Home Health Aides 1-month on-the-job training $9.29 Medical Assistants 1-12 mo. on-the-job training $12.63 Network and Data Analysts Bachelor’s degree $22.19 Computer Software Engineers/Applications
Bachelor’s degree $37.08
Personal and Home Care Aides 1-month on-the-job training $8.82
Dental Assistants 1-12 mo. on-the-job training $12.50
Dental Hygienists Associate degree $23.34
Employment, Recruitment & Placement
Bachelor’s degree $19.67
Medical Records & Health Information Associate degree $12.71
Fast
est G
row
th
Occupational Therapists Master’s degree $25.53
Cashiers 1-month on-the-job training $7.64 Retail Salespersons 1-month on-the-job training $11.06
Comb Food Prep/Serv Wrk/Incl Fast 1-month on-the-job training $7.04 Waiters/Waitresses 1-month on-the-job training $7.34
Registered Nurses Associate’s or Bachelor’s degree
$25.83
Laborers/Freight/Stock/Material Movers/Handlers
1-month on-the-job training $10.09
Janitors/Cleaners, except Maids/Housekeeping
1-month on-the-job training $10.67
Team Assemblers 1-12 mo. on-the-job training $12.94
Stock Clerks/Order Fillers 1-month on-the-job training $9.47
Mos
t Ope
ning
s
Bartenders 1-month on-the-job training $8.16

Polk County, Wisconsin Economic Development
Comprehensive Plan 2009-2029 225
The “Fastest Growth” occupations are often referred to as “hot jobs,” with more training requirements and better wages. There are often fewer openings in these jobs since the list is based on the greatest percent change in employment; for example, an occupation that increases from 5 to 10 jobs increased 100 percent whereas an occupation that increases from 2,000 to 2,200 jobs increased only 10 percent. A 2005 University of Wisconsin-Extension study states that the largest demand in the region continues to be for assemblers, processors, and laborers.13
Tourism Polk County offers a wide variety of natural, historical, and entertainment amenities and attractions. Tourism and outdoor recreation in the County often revolve around the County’s many lakes and water features. The County has 437 lakes totaling over 22,600 acres and 200 miles of rivers and streams, including 98 miles of trout streams. The St. Croix River, a National Scenic and Wild River, borders the County to the west and is very popular for canoeing, fishing, and picnicking along. Often located adjacent to these water bodies, numerous federal, State, County and municipal parks, trail systems, wildlife areas, campgrounds/resorts, and public hunting grounds offer a variety of places to play, picnic, hike, lodge, and enjoy the outdoors. Wisconsin’s oldest State Park, Interstate State Park, is located on the St. Croix River just south of St. Croix Falls. Residents and visitors can enjoy seven golf courses in the County, as well as a variety of hiking, biking, snowmobile, ATV, and equestrian trails. Of regional or State significance, the Gandy Dancer Trail, Cattail Trail, and National Ice Age Scenic Trail all transverse portions of the County. Many of these outdoor recreational assets are inventoried in the community facilities and natural resources sections of this report. These natural resources and open spaces attract both visitors and new residents. Given the County’s close proximity to the Twin Cities and abundance of natural resources, the County has a relatively high number of seasonal and recreational housing units. Over 20 percent of the County’s total housing supply are seasonal or recreational units, which ranks the County 11th in the State in the number of seasonal units, but 31st in the State in the total of all housing units. As such, seasonal resort destinations and related tourism are significant parts of the Polk County economy.
13 Ibid.

Polk County, Wisconsin Economic Development
Comprehensive Plan 2009-2029 226
Travelers also can experience the area’s history through museums and historical sites, such as the Emily Olson House in Hudson, Rural Life Museum in Balsam Lake, or the Osceola & St. Croix Valley Railway. Visitors explore the County’s many antique stores and specialty shops, perhaps following the Wisconsin’s Northwest Heritage Passage or attending an event sponsored by Polk County Earth Arts. Music and theater performances can be seen at the St. Croix Art Barn, Pipe Dream Center, Northern Lakes Center for the Arts, or St. Croix Festival Theatre. Residents and visitors alike can also enjoy local, fresh foods at a variety of different orchards, vegetable growers, and numerous specialty farms and outlets. The Economic Impact of Expenditures by Travelers on Wisconsin 2007, compiled by Davidson-Peterson & Associates, provides insight into the positive economic impacts of tourism on the Polk County economy. As shown in Figure 6.10, traveler expenditures in Polk County increased by 88.7 percent in the ten years between 1998 and 2007, with large increases between 1998 to 2000.
In 2007, travelers spent an estimated $75.2 million in Polk County, ranking the County 41st in the State for traveler spending. This was a $35.4-million increase from the amount spent ten years earlier. The study goes on to estimate that employees in Polk County directly earned over $20.6 million in wages generated from traveler spending, supporting an estimated 937 full-time equivalent jobs in
Figure 6.10 Traveler Expenditures in Polk County (1998 to 2007)
source: Davidson-Peterson & Associates. Economic Impact of Expenditures by Travelers on Wisconsin 2007.
$39,898,511
$43,460,847
$64,625,715
$66,787,625
$70,452,217
$70,255,269 $68,625,740$69,104,378
$76,441,615
$75,296,626
$35,000,000
$40,000,000
$45,000,000
$50,000,000
$55,000,000
$60,000,000
$65,000,000
$70,000,000
$75,000,000
$80,000,000
1998 1999 2000 2001 2002 2003 2004 2005 2006 2007

Polk County, Wisconsin Economic Development
Comprehensive Plan 2009-2029 227
2007. Additionally, an estimated $1.3 million in local revenues (e.g., sales taxes, property taxes) were collected in 2007 as a direct result of travelers in Polk County. As Figure 6.11 shows, travelers are an important year-round contributor to the Polk County economy with 17 percent of traveler expenditures made during the winter, 20 percent during the spring, 39 percent during the summer, and 24 percent in the fall in 2007. In summary, tourism and travelers are a significant part of the Polk County economy. This part of the economy is built upon the County’s natural resources, large proportion of seasonal housing, and proximity to the Twin Cities. Transportation improvements planned for the region (see Transportation section) could further increase tourism opportunities in the future. Tourism in Polk County is promoted by the Polk County Tourism Council and the Polk County Information Center in St. Croix Falls. For more information on tourism in Polk County, please contact the Polk County Information Center:
Polk County Information Center 710 State Highway 35
St. Croix Falls, WI 54024 1-800-222-POLK
www.polkcountytourism.com 6.2 DESIRED TYPES OF ECONOMIC DEVELOPMENT
- Agriculture (preferably small scale and organic) - Green industry - Green businesses - Tourism-related - Businesses that fit Polk County’s rural and small-town character - Downtown revitalization - Locally based businesses - Home-based businesses
Figure 6.11 Seasonality of Traveler Expenditures in Polk County (2007)
source: Davidson-Peterson & Associates. Economic Impact of Expenditures by Travelers on Wisconsin 2007.
17%
20%
39%
24%
Winter Spring Summer Fall

Polk County, Wisconsin Economic Development
Comprehensive Plan 2009-2029 228
6.3 ENVIRONMENTALLY CONTAMINATED SITES The State Comprehensive Planning Law (§66.1001) states that the economic development element “shall also evaluate and promote the use of environmentally contaminated sites for commercial or industrial uses.” Polk County has no properties actively receiving long-term remedial action financed under the federal Superfund program. However, numerous smaller leaking underground storage tank, environmental repair, and spill sites are located throughout the County. The Wisconsin Bureau for Remediation and Redevelopment Tracking System (BRRTS) provides an inventory of the contaminated properties and other activities related to the investigation and cleanup of contaminated soil or groundwater in Wisconsin. Table 6.10 at the end of this section is a list of the 210 sites in Polk County where contamination has occurred requiring significant attention,14 including closed sites where clean-up has been completed. Of these, 73.3 percent (or 154) are associated with leaking underground storage tanks (LUSTs). The remaining 56 records are environmental repair (ERP) sites -- ranging from non-LUST activities, such as industrial spills, dumping, buried containers, and landfills -- which have contaminated soil or groundwater requiring long-term attention. The largest concentration of such sites (44) in Table 6.10 is located within the City of Amery. Many, if not most, of the sites identified in Table 6.10 may currently be in active use and may not be available for redevelopment activities. Further, communities will need to consider the appropriateness and land use compatibility of the redevelopment of such sites for commercial or industrial use. Redevelopment opportunities are not limited to contaminated sites, however. Local comprehensive planning efforts may need to identify those deteriorating structures and under-utilized properties within their communities which have potential for re-use.
14 Table 6.10 excludes abandoned containers and spills for which no discharge to the environment has been identified or the spill was cleaned up quickly.

Polk County, Wisconsin Economic Development
Comprehensive Plan 2009-2029 229
Table 6.10 – Contaminated Sites in Polk County (open & closed)
Municipality or Nearest Post Office Location Activity Status
ALDEN ALDEN TN GARAGE LUST CLOSEDAMERY EQUITY COOP (FORMER BULK PLT) ERP CLOSED
AMERY CTY WWTP ERP CLOSEDEQUITY COOP - AMERY BULK PLT ERP CLOSEDANDERSON PROPERTY ERP CLOSEDAMERY FLEET SUPPLY ERP CLOSEDPLASTECH CORP AMERY DIV FORMER ERP CLOSEDGOLDSTAR COOPERATIVE ERP CLOSEDEQUITY COOP - AMERY ERP CLOSEDELECTRO-CRAFT CORP/THOMPSON MACHINE ERP OPENAMERY CTY LF ERP OPENEXXON MOBIL (FORMER) BP 48104 ERP OPENQUALITY POWDER COATINGS INC ERP OPENWANDEROOS GIFT & GROCERY LUST CLOSEDHOME BASE BAR LUST CLOSEDCHRISTOPHERSON, TERRY RESIDENCE LUST CLOSEDAUTO STOP AMERY LUST CLOSEDLITTLE FALLS STORE LUST CLOSEDNORDQUIST TRUCKING LUST CLOSEDAMERY FLEET SUPPLY LUST CLOSEDDICKS IGA LUST CLOSEDAMERY PROFESSIONAL BLDG 2 LUST CLOSEDERICKSONS OIL PRODUCTS LUST CLOSEDEQUITY COOP LUST CLOSEDNSPW AMERY LUST CLOSEDGTE AMERY LUST CLOSEDWILLOW RIDGE NURSING HOME LUST CLOSEDVETERAN AFFAIRS LUST CLOSEDAMERY LUST CLOSEDMORTS MARINA LUST CLOSEDMIDAS MUFFLER LUST CLOSEDBRYNES, DAN LUST CLOSEDAMERY MIDDLE SCHOOL LUST CLOSEDLAKEVIEW INTERMEDIATE SCHOOL LUST CLOSEDAMERY HIGH SCHOOL LUST CLOSEDSUPERLOCKER LUST CLOSEDBEAM JERRY LUST CLOSEDEQUITY COOP - AMERY BULK PLT LUST CLOSEDAMERY AIRPORT-AMERY CTY LUST CONDITIONALLY CLOSEDAMERY AMOCO LUST OPENSKOGLUND CONOCO LUST OPENLOU JOHN APPRAISAL SERVICE LUST OPENAMERY AIRPORT - RON ANDERSON LUST OPENAMERY PROFESSIONAL BLDG LUST OPENAMOCO OIL C0 BULK PLT LUST OPEN
APPLE RIVER PAPS GENERAL STORE LUST OPENBALSAM LAKE BALSAM LAKE ASPHALT PLT ERP CLOSED
BALSAM LAKE VIL ERP OPENPOLK CNTY GOVERNMENT CTR LUST CLOSEDREEDS SUNNYSIDE MARINA LUST CLOSEDJONZY MARKET LUST CLOSEDPEPERS SERVICE STATION LUST CLOSEDPETERSON BLDG LUST CLOSEDUNITY SCHOOL DIST LUST CLOSEDPOLK CNTY HWY GARAGE LUST CLOSEDSTOP A SECK LUST CLOSEDUNITY SCHOOL DIST LUST CLOSEDPARADISE SUPPER CLUB LUST OPEN

Polk County, Wisconsin Economic Development
Comprehensive Plan 2009-2029 230
Table 6.10 – Contaminated Sites in Polk County (open & closed) continued
Municipality or Nearest Post Office Location Activity Status
BEAVER YELLOW RIVER SUPPLY LUST OPENCENTURIA CITGO GAS STATION LUST CLOSED
POLK-BURNETT ELECTRIC COOP LUST CLOSEDAT&T CENTURIA NWD LUST CLOSEDCENTURY SCHOOL LUST CLOSED
CLAM FALLS CLAM FALLS STORE LUST CLOSEDCLAYTON DANIEL ROTH ERP CLOSED
CLAYTON SERVICE LUST CLOSEDFOREMOST FARMS USA LUST CLOSEDCLAYTON SCHOOL DIST LUST CLOSEDCLAYTON VIL LUST CLOSEDHEINTZ OIL (FORMER ICO) LUST OPENSALLYS GAS STATION LUST OPENWISCONSIN DAIRIES COOP LUST OPEN
CLEAR LAKE FRANKLIN SIGNAL CORP ERP OPENCLEAR LAKE CONOCO LUST CLOSEDSOMSEN OIL CO LUST CLOSEDAFP ADVANCED FOOD PRODUCTS LLC LUST CLOSEDUS POSTAL SERVICE LUST CLOSEDCOUNTRY SIDE AUTO (FORMER) LUST CLOSEDCENTENNIAL APTS LUST CLOSEDCLEAR LAKE CIRCLE C LUST CONDITIONALLY CLOSED
CUMBERLAND JACKIES PUB LUST CLOSEDCUSHING CUSHING COOPERATIVE SOCIETY ERP CLOSED
CUSHING COOP ERP CLOSEDCUSHING ELEMENTARY SCHOOL LUST CLOSEDCUSHING CORNER LUST OPENBAKERS SERVICE STATION LUST OPEN
DRESSER F & A DAIRY ERP CLOSEDDRESSER TRAP ROCK INC ERP OPENDRESSER OIL CO (FORMER) LUST CLOSEDDRESSER LUMBER & TIE LUST CLOSEDTROLLHAUGEN SKI AREA LUST CLOSEDDRESSER ELEMENTARY SCHOOL LUST CLOSEDOSCEOLA TN HWY GARAGE LUST CLOSEDDRESSER BAKERY LUST CLOSEDLITTLE STORE LUST OPENLITTLE STORE LUST OPEN
EAST FARMINGTON CORKRAN, PAT RESIDENCE LUST CLOSEDMORK, BRIAN PROPERTY LUST CLOSED
FARMINGTON SELZLER GRAVEL PIT ERP CLOSEDST CROIX VALLEY AIRPORT LUST OPENSMITH, GENE RESIDENCE LUST OPENCLEVELAND, PATRICK LUST CLOSED
FREDERIC NORTHWEST WISCONSIN ELECTRIC CO ERP CLOSEDBAIR, SALLY PROPERTY ERP CLOSEDSTANDARD OIL BULK PLT (FORMER) ERP CLOSEDRAYS FIRESTONE STORE ERP OPENMPM INC ERP OPENFREDERIC FARMERS COOP EXCHANGE ERP OPENCIRCLE C CONVENIENCE CTR LUST CLOSEDFREDERIC FARMERS COOP EXCHANGE LUST CLOSEDEARLY OIL CO LUST CLOSEDFREDERIC FARMERS COOP EXCHANGE LUST CLOSEDFREDERIC FARMERS COOP EXCHANGE LUST CLOSEDCENTURY TELEPHONE LUST CLOSEDLARSEN AUTO CENTER INC LUST CLOSEDFREDERIC HIGH SCHOOL LUST CLOSEDBERNICKS LUST CLOSEDEARLY OIL CO SERVICE STATION LUST CLOSED

Polk County, Wisconsin Economic Development
Comprehensive Plan 2009-2029 231
Table 6.10 – Contaminated Sites in Polk County (open & closed) continued
Municipality or Nearest Post Office Location Activity Status
GARFIELD GARFIELD ASHPALT PLT (FORMER) ERP OPENGEORGETOWN BLAKE LAKE ERP CLOSED
FOX CREEK STORE LUST CLOSEDMURPHY, ROBERT LUST CLOSED
LEWIS WI DOT - LEWIS SERVICE STATION ERP OPENLINCOLN BURMAN, WILLIAM PROPERTY ERP OPEN
HELLIE, ERIK RESIDENCE LUST CLOSEDLUCK LAUNDRY BASKET ERP OPEN
SCI CABLE SYSTEMS LUST CLOSEDLUCK SCHOOL DIST LUST CLOSEDATLAS GENERAL STORE LUST CLOSEDDENUCCIS 35 VILLA LUST CLOSEDGOULD-PEDERSEN INC LUST CLOSEDCOLONIAL CRAFT LUST CLOSEDTODDS CONOCO LUST CLOSEDNORTHSIDE AUTO CLINIC LUST CLOSEDLUCK SCHOOL DIST LUST CLOSEDLUCK SCHOOLS SITE #2 LUST CLOSEDHOVERMAN ESTATE PROPERTY LUST CLOSEDLUCK MARINE LUST OPENLAUNDRY BASKET LUST OPENEQUITY COOP LUST OPEN
MILLTOWN EQUITY COOP ERP CLOSEDEQUITY COOP ERP OPENOSCEOLA OIL BULK PLT (FORMER) ERP OPENHOLIDAY STATION 13 LUST CLOSEDRAPID REPAIR LUST CLOSEDMILLTOWN TN GARAGE LUST CLOSEDMILLTOWN AUTO STOP LUST CLOSED
OSCEOLA BJORNSTAD RESIDENCE ERP CLOSEDCENTRAL RIVERS COOP ERP CLOSEDOSCEOLA DAM - SEDIMENTS ERP CLOSEDFERRELLGAS INC-OSCEOLA ERP CLOSEDST CROIX RIVER VALLEY LF - #3484 ERP OPENQUICKIE TRANSPORT CO ERP OPENFEDERATED COOP ERP OPENOSCEOLA OIL CO BULK PLT ERP OPENCENTRAL RIVERS COOP ERP OPENPOLK CNTY CLNSWP COLLECTION ERP OPENLADD MEMORIAL HOSPITAL LUST CLOSEDOSCEOLA OIL CO BULK PLT LUST CLOSEDOSCEOLA VIL GARAGE LUST CLOSEDOSCEOLA AUTO SALES LUST CLOSEDCIRCLE C FOODS LUST CLOSEDCUSTOM FIRE APPARATUS INC LUST CLOSEDCASCADE ST LUST CLOSEDOSCEOLA LIQUOR & GAS LUST CLOSEDWI DOT LUST CLOSEDOSCEOLA AREA SCHOOLS BUS GARAGE LUST CLOSEDUS AIR FORCE STATION (FORMER) LUST CLOSEDSELZLER EXCAVATION INC LUST CLOSEDNYE STORE (FORMER) LUST OPENHANSON ELECTRIC LUST OPENMALLIN, GODFREY PROPERTY LUST OPENMORKS BIG LAKE STORE LUST OPEN
OSCEOLA TN OSCEOLA ROD & GUN CLUB ERP OPENST CROIX RIVER VALLEY LF INC LUST CLOSED

Polk County, Wisconsin Economic Development
Comprehensive Plan 2009-2029 232
source: Wisconsin BRRTS database, April 21, 2008.
Table 6.10 – Contaminated Sites in Polk County (open & closed) continued
Municipality or Nearest Post Office Location Activity Status
RICHARDSON LAKE MAGNOR STORE LUST CLOSEDST CROIX FALLS U S PARK SERVICE ERP CLOSED
U S PARK SERVICE ERP CLOSEDST CROIX ERP CLOSEDINDUSTRIAL TOOL & PLASTIC INC ERP CLOSEDST CROIX OIL ERP CLOSEDJOHNSON MOTORS ERP CLOSEDJOR-GAS (NEW SITE) ERP OPENST CROIX FALLS CTY LF ERP OPENST CROIX VALLEY COUNTRY CLUB LUST CLOSEDEUREKA TN GARAGE LUST CLOSEDST CROIX FALLS LEASE BLDG LUST CLOSEDST CROIX OIL LUST CLOSEDST CROIX FALLS FLEET SUPPLY LUST CLOSEDNAPA AUTO PARTS/FALLS AUTO R-O-W LUST CLOSEDJOHNSON MOTORS LUST CLOSEDJOR-GAS STATION (OLD SITE) LUST CLOSEDWI DNR INTERSTATE PARK SILVER BROOK LUST CLOSEDST CROIX FALLS ELEMENTARY SCHOOL LUST CLOSEDSORENSEN MIDDLE SCHOOL LUST CLOSEDWI DNR INTERSTATE PARK LUST CLOSEDWAYNES CAFE LUST CLOSEDHOLIDAY STATION #192 LUST CLOSEDPOLK CNTY BANK LUST CLOSEDEDINA REALTY LUST CLOSEDOSCEOLA OIL CO LUST CLOSEDJOR-GAS BULK LUST CLOSEDSIMONSON LUMBER LUST CLOSEDSTERLING TN GARAGE LUST CLOSEDSKOGLUND OIL CONVENIENCE STORE LUST OPEN
STAR PRAIRIE BIEGERT MATT RESIDENCE LUST CLOSEDNELSONS STORE/HORSE CREEK STORE LUST CLOSED
UNITY UNITY HIGH SCHOOL ERP CLOSEDWEST SWEDEN WEST SWEDEN TN GARAGE LUST CLOSED
FREDERIC VIL LF #1801* ERP OPEN

Polk County, Wisconsin Economic Development
Comprehensive Plan 2009-2029 233
6.4 SWOT ANALYSIS Strengths:
• Natural Resources • Lake shore housing • Shop retail • Land – available • Hwy 8 & 63 & 94 • Large labor force available • Close to metro easy access to special services • Space available for growth • Airports • Within 1 hour of UW Campuses • Available vacant commercial properties
Weaknesses:
• Lack of technology (internet, wireless, cell phone service) • Lack of higher education • Lack of cohesive economic development corporation, silos to themselves • Industrial parks are too rigid – lack options for green buildings • Lack of public transportation • Low wages
Opportunities:
• Agency as a one-stop shop – for Economic Development and location • Develop a Strong Economic Development Corporation • Hwy 8, 94 and 63 • Natural Resources • Variety of recreational activities • Some art and entertainment • Tech zone • “Green”/”Sustainable” economic development
Threats:
• Zoning/policies/government • Fear of change, behaviors, new residents versus older residents • Low wage scale • Big-Box stores • Infrastructure, older and vacant

Polk County, Wisconsin Economic Development
Comprehensive Plan 2009-2029 234
6.6 GOALS OBJECTIVES, AND POLICIES Goal 1: Ensure that economic development fits Polk County’s
rural and small town character Objectives:
1) Review, evaluate and update existing ordinances to meet today’s needs and issues regarding economic development
2) Promote “green” business and industrial parks 3) Consider development of additional aesthetic controls on
new developments Goal 2: Provide adequate infrastructure to support desired
types of economic development Objectives:
1) Sewer system to protect water resources versus each owner installing their own system
2) Roads: maintain and improve 3) Utilities
a. Fiber Optic network(s) b. Wireless c. Gas Lines d. Cell Phone Service
4) Utilize all options to provide the necessary infrastructure (public, private, and public-private collaborations)
Goal 3: Develop a high-quality, diverse, and flexible
workforce Objectives:
1) Evaluate opportunities for bricks and mortar post-secondary education
a. Continue discussions with Wisconsin Indianhead Technical College, Chippewa Valley Technical College, UW-System to develop post-secondary facilities in Polk County
2) At the very least, have locations to take post-secondary education courses via the web

Polk County, Wisconsin Economic Development
Comprehensive Plan 2009-2029 235
3) Coordinate educational offerings with area employer needs
Goal 4: Encourage collaboration of all area economic
development groups Objectives:
1) Share financial resources 2) Search additional funding sources 3) More points on applications that have multiple
governments involved 4) No Silos – work collaboratively on projects and marketing
Policies: 1) Utilize Polk County Economic Development
Corporation and UW-Extension to coordinate
Goal 5: Develop a countywide economic development strategy
Objectives: 1) Polk County Economic Development Corporation should
meet with key stakeholders and craft a strategy 2) Target businesses and industries
Goal 6: Encourage small-scale farming and organic farming Objectives: 1) Promote farmers’ markets 2) Promote Community Supported Agriculture
Goal 7: Promote local and downtown businesses Objectives:
1) encourage/promote existing programs and incentives to buy or shop local
2) Investigate additional programs and incentives
Goal 8: Encourage home-based businesses and telecommuting
Objectives: 1) Need for high-speed/fiber optic communications
i.) Investigate opportunities to expand infrastructure

Polk County, Wisconsin Economic Development
Comprehensive Plan 2009-2029 236
9) Foster entrepreneurial atmosphere Objectives:
1) Review and update existing ordinances 2) Minimize regulatory restrictions to desired types of
economic development