electrovalue - d3.3 - life cycle - isq
TRANSCRIPT

ELECTROVALUE
“Electric and Electronic Eco-assembly Alternatives for the Valorisation of the End-of-life Products in the Recycling Market”
LIFE07 ENV/P/000639
Document Title: Life Cycle Assessment
Deliverable no: D.3.3
Issue Date: 17 September 2010
Level of Dissemination (PU/CO):
PU
Author(s): ISQ
Contributor(s): EMPLACE, INTERECYCLING

i
Table of Contents List of Abbreviations............................................................................................. iii Executive Summary ............................................................................................. iv Chapter 1 – Goal and Scope Definition.................................................................5
1.1. Project Background ................................................................................5 1.2. Summary of Life Cycle Assessment Methodology..................................6 1.3. Goals of the study...................................................................................8
1.3.1. Life Cycle Assessment Purpose......................................................8 1.3.2. Target Audience and Use of the Life Cycle Assessment.................8
1.4. Scope of the Study .................................................................................9
1.4.1. Components ........................................................................................9 1.4.2. Product Systems ...........................................................................10 1.4.3. Functional Unit ...................................................................................12 1.4.4. Assessment Boundaries................................................................12
1.4.4.1. Life Cycle Stages and Processes................................................12 1.4.4.2. General Exclusions .....................................................................15 1.4.4.3. Geographical and Temporal Boundaries.....................................17
1.4.5. Data Requirements and General Methodology .............................18
1.4.5.1. Data Categories .....................................................................18 1.4.5.2. Decision Rules .......................................................................19 1.4.5.3. Data Collection and Data Sources .........................................20 1.4.5.4. Allocation Procedures ............................................................20 1.4.5.5. Data Quality Requirements ....................................................21

ii
1.4.6. Impact Assessment Methodology..................................................22 Chapter 2 – Life Cycle Inventory.........................................................................24
2.1. Data Collection .....................................................................................24
2.1.1. Materials Extraction, Processing and Components Manufacture ..24 2.1.2. Components Use/Application ........................................................28 2.1.3. End-of-Life.....................................................................................28
2.2. Flow Model Approach...........................................................................29 2.3. Life Cycle Inventory Results .................................................................31
Chapter 3 – Life Cycle Impact Assessment and Interpretation ...........................33
3.1. Life Cycle Impact Assessment..............................................................33
3.1.1. General Methodology ....................................................................33 3.1.2. Life Cycle Impact Assessment Results..........................................36
3.2. Life Cycle Interpretation........................................................................38
References .........................................................................................................41

D.3.3 – Life Cycle Assessment
iii
List of Abbreviations
EEE – Electrical and Electronic Equipment
ICT – Information and Communication Technologies
LCA – Life Cycle Assessment
LCI – Life Cycle Inventory
LCIA – Life Cycle Impact Assessment
LED – Light Emitting Diode
PWB – Printed Wiring Board
RoHS – Restriction on Hazard Substances
SETAC – Society of Environment Toxicology and Chemistry
SME – Small and Medium Enterprise
UNEP – United Nations Environment Programme
WEEE – Waste of Electrical and Electronic Equipment

D.3.3 – Life Cycle Assessment
iv
Executive Summary
This project report presents the Life Cycle Assessment (LCA) that was performed regarding ELECTROVALUE project and it is the main result from sub-action 3.3. ELECTROVALUE aims to develop and improve the recycling market for the Electric and Electronic Equipment products through the reuse and recovery of components, providing support to the electrical and electronic SMEs, in order to improve their competitiveness by adopting sustainable waste management, materials and process technologies by integrating LCA and “valorisation” of end-of-life.
The structure of the report follows the formal components of a LCA. The goal definition and scope of this study are the subject of Chapter 1, which provides an overview of the project that is the basis for this report, and it background, a summary of the methodology employed in this LCA, descriptions of the product systems, and an explanation of parameters that determine the project boundaries. The Chapter 2 presents the general methodology and the approach taken for collecting and evaluating LCI data for this study, the data sources, data quality and limitations and uncertainties for each life-cycle stage. Finally Chapter 3 presents the results of the Life Cycle Impact Assessment (LCIA) and its interpretation.

D.3.3 – Life Cycle Assessment
5
Chapter 1 – Goal and Scope Definition
This chapter provides an overview of the project that is the basis for this report. It includes project’s background information, the goals and scope of this study, a summary of the methodology that will be employed in this LCA, descriptions of the product systems that will be analysed, and an explanation of parameters that determine the project boundaries.
1.1. Project Background
The recent implementation of RoHS on the 1st of July 2006 has brought additional industrial concerns related with lead and lead-free components availability in the market for electronic production. This has become a quite relevant issue to SMEs which production is normally focused on small series and on different products. This production characteristic makes the described situation worst leading to long delays in the product delivery, and consequential financial problems.
In addition, used electronics represent a rapidly growing waste stream. Technological advances are rapidly rendering formerly cutting-edge electronics obsolete. The Waste of Electrical and Electronic Equipment (WEEE) full implementation in Europe has increased the amount of electronic waste in the recyclers in which part of it is still not reused and/or recycled. The amount registered in Europe rounds 10.3 million tonnes of electronic waste a year, around a quarter of the world’s total, and this figure is predicted to rise to 12.3 million tonnes per year by 2020 [1].
These figures evidence how big the potential opportunity to recover secondary raw materials is. In Europe the use of virgin raw materials in this equipment manufacturing is still close to 100%, and being one of the most material intensive manufacturing sector, the impact on nature resources depletion and climate change, among other environmental descriptors, is obviously very high. In addition, according to the WEEE directive, Member States should ensure that, by the end of 2006, the rate of recovery should be increased to a minimum of 80% by an average weight pre appliance and a minimum of 75% of components, material and substances should be reused and recycled. In the end of 2007, and considering the figures above mentioned, these goals are very far to be accomplished.
Actually, the main extractions on the Electrical and Electronic Equipment (EEE) recycling markets are related with valuable metals (e.g. gold, cooper, nickel) or hazardous ones. Numerous innovative processes for recovery of metals and other materials from electronic assemblies have been developed and WEEE recycling is now a commercial alternative. However, there is still a perception that the business case has not been truly made for recovery or reuse of electronics waste. Expensive components can be recovered using sometimes sophisticated processing such as infrared desoldering with robotics. The ELFNET Roadmap [2] lists the needs and requirements to the reuse of electronic waste still to be accomplished. Some of them are development of technologies; recovery of plastics; development of industry guidelines; standards for reuse; labelling; warranties; new design concepts and techniques for electronic assemblies with reusable modules.

D.3.3 – Life Cycle Assessment
6
This means that WEEE collection improvement is possible and imperative in order to increase the re-use and recycling these materials and to achieve a consistent reduction of raw materials consumption. Technical solutions for the re-use and recycling of electronic equipment are already available and represent an effective and demonstrated way to recover almost all materials from electronic waste, but many of which are scarce. This passes for sure through preparing the EEE since its conception, applying eco-design methodologies, in order to increase and help the recovery of used materials on its end-of-life.
ELECTROVALUE comes into this direction, aiming to develop and improve the recycling market for the EEE products through the reuse and recovery of EEE components, providing support to the electrical and electronic SMEs, in order to improve their competitiveness by adopting sustainable waste management, materials and process technologies by integrating LCA and “valorisation” of end-of-life in EEE.
The market for these recovered parts will need to be shown that final products that use them will present the reliability expected. Therefore the project addresses this by carrying out soldering trials, LCA and testing the reliability of refurbishment boards against similar products that contain only new parts (OEM-Original Equipment Manufacturers). Parameters such as material costs, consumption, time, emissions, are very important for the final assessment of the implementation of such alternative.
In fact, there are significant issues around reliability, joint integrity (role of intermetallics), expected life, degradation and warranties as well as training of operators. Electrical testing and qualification of such components will be done in the project against specifications that may be only available from the original supplier, if the part is not obsolete. To overcome these issues it is required new specifications and standards, allowing more confidence with regard to warranties and performance. Another issue that will be addressed is the labelling of electronics assemblies and products with hazardous substance information.
1.2. Summary of Life Cycle Assessment Methodology The ISO 14040: Environmental Management — Life cycle Assessment —Principles and Framework [4], has defined the four major components of an LCA as: (1) goal and scope; (2) inventory analysis; (3) impact assessment; and (4) interpretation of results, as illustrated in Figure 1.
An LCA starts with and explicit statement of the goal and scope of the study, the functional unit, the system boundaries, the assumptions and limitations and allocation methods used, and the impact categories chosen. The goal and scope includes a definition of the context of the study which explains to whom and how the results are to be communicated. The functional unit is quantitative and corresponds to a reference function to which all flows in the LCA are related. Allocation is the method used to partition the environmental load of a process when several products or functions share the same process.
In the inventory analysis a flow model of the technical system is constructed using data on inputs and outputs. The flow model is often illustrated with a flow chart including the activities that are going to be assessed and also gives a clear picture of the technical system boundary. The inputs and outputs data needed (resources, energy requirements, emissions to air and water and waste generation for all activities within the system

D.3.3 – Life Cycle Assessment
7
boundaries) for the model construction, are collected. Following the environmental loads of the system are calculated and related to the functional unit, and the flow model is finished.
Figure 1 - Working procedure for an LCA. [4] The unbroken line indicates the order of procedural
steps and the dotted line indicates interaction.
The inventory analysis is followed by impact assessment, which involves the translation of the environmental burdens identified in the inventory analysis into environmental impacts. Impact Assessment is typically a quantitative process involving characterization of burdens and assessment of their effects. In the classification stage, the inventory parameters are sorted and assigned to specific impact categories. The next step is characterisation, where inventory parameters are multiplied by equivalency factors for each impact category. Thereafter all parameters included in the impact category are added and the result of the impact category is obtained.
For many LCA, characterization the analysis is concluded by which also is the last compulsory stage according to ISO 14040 standard. However, some studies involve the further step of normalisation, in which the results of the impact categories from the study are compared with the total impact in category. During weighting, the different environmental impacts are weighted against each other to get a single number for total environmental impact.
Finally, the results from the phase of inventory analysis and impact assessment are summarised during the phase of interpretation. The outcome of the interpretation is conclusions and recommendation for the study. According ISO 14043 the interpretation should include:
• identification of significant issues for the environmental impact, • evaluation of the study considering completeness, sensitivity and consistency, • conclusions and recommendations.
n
n n Impact Assessment
Classification Characterisation
Normalisation Weighting
n
n n
n
n
n
n
n
n
n
n
Goal & Scope Definition
Interpretation Inventory Analysis

D.3.3 – Life Cycle Assessment
8
The working procedure of LCA is iterative as illustrated with the dotted lines in Figure 1. The iteration means that information gathered in a later stage can cause effects of a former stage. When this occurs the former stage and the following stages have to be reworked considering the new information.
Accordingly, from a general perspective, LCA evaluates the environmental performance of products, processes or services throughout its entire life cycle, from its “cradle” all the way to the “grave”. The life cycle model of a product, process or service usually starts with the acquisition of raw materials and energy that is needed for the production of the studied object, the “cradle”. The model follows the stages of processing, transportation, manufacturing, use phase and finally waste management which is considered as the “grave”. The assessment is accomplished by identifying quantitatively and qualitatively the studied object stages requirements for energy and materials, and the emissions and waste materials released to the environment. An exact description of each of these stages of the ELECTROVALUE product system is given in section 1.4.4.1.
1.3. Goals of the study
Defining goals, the first phase of any LCA, is crucial to the project’s success because it determines why the LCA is being conducted as well as its general intent and target audience. For this project the main goal is to determine the potential environmental benefits regarding the reuse of electric and electronic components against its recycling.
1.3.1. Life Cycle Assessment Purpose
The purpose of this study is three-fold: (1) to establish a scientific baseline that evaluates the potential life-cycle environmental impacts of electronic components reuse using LCA methodologies; (2) to evaluate the effects of components at end-of-life; and (3) to identify data gaps or other potential areas of analysis for future investigation. The evaluation will consider impacts related to material consumption, energy, air resources, water resources, landfills, human toxicity, and ecological toxicity, as well as landfill disposal, incineration and recycling. It is intended to provide valuable data not previously published, and an opportunity to use the model developed for this project in future improvement evaluations that consider life-cycle impacts. It also provides the industry and regulating authorities with valuable information to make environmentally informed decisions regarding EEE, and enable them to consider the relative environmental merits with its performance and cost.
1.3.2. Target Audience and Use of the Life Cycle As sessment
The electronics industry is expected to be one of the primary users of the ELECTROVALUE project results. This study aims to provide the industry with an objective analysis of the life-cycle environmental impacts of selected components. Scientific verification of these relative impacts allows industry to consider environmental concerns along with traditionally evaluated parameters of cost and performance, and to potentially redirect efforts towards products and processes that reduce component’s environmental footprint, including energy consumption, releases of toxic chemicals, and risks to health and the environment.

D.3.3 – Life Cycle Assessment
9
This study is designed to provide the electronics industry with information needed to identify impacts throughout the life-cycle of various components. This can lead to improving the environmental attributes of components. This study also allow the electronics industry to make environmentally informed choices about components when assessing and implementing improvements such as changes in product, process, and activity design; raw material use; industrial processing; consumer use; and waste management.
Identification of impacts from the life-cycle of components also can encourage industry to implement pollution prevention options such as development and demonstration projects, and to foster technical assistance and training. The electronics industry can use the tools and data provided by this study to evaluate the health, environmental, and energy implications of the components. Using this evaluation, the electronics industry may be better prepared to meet the growing demand for extended product responsibility; to help guide public policy towards informed, scientifically-based solutions that are environmentally preferable; and to be better able to meet the competitive challenges of the world market. In addition, the LCA model and results that presented by this study intents to provide a baseline upon which components not included in the study can be evaluated. This will allow for further, expedited LCA studies, whose growing popularity within the industry puts them in demand by original equipment manufacturers and international organizations.
The information generated in this study can also be used by the electronics industry to select the components that work well for a given application and that pose the fewest impacts to public health and the environment over their entire life cycles. The study results also should help governmental organizations to better manage their electronics purchasing and disposition activities, and to inform the activities of community.
1.4. Scope of the Study
The following sections describe the scope of this study, including the product systems and processes that are the subject of the component’s LCA, the components that studied, the functional unit, system boundaries and how the end-of-life alternatives are compared for the purposes of the study.
1.4.1. Components
Taking into account the existent amount of components in the market, and the impossibility to study all of them, during sub-action 2.1 of the ELECTROVALUE project the main added value components were identified. The identification of components was based on a printed wired board (PWB), specifically created for this project, which will be incorporated on lifter, as explained in deliverable of this project D.2.1 - Identification of the main added value components. The next table presents the selected components.

D.3.3 – Life Cycle Assessment
10
Table 1 – Components selected for the LCA
Component Type Components Identification
(as specified in D.2.1 - Identification of the main added value components)
Number of Components used in
PWB
Fuse Fuse 5x20 mm (0,5V) 2
Fuse Holder Fuse Holder 5x20 mm 2
Converter TRACO TEN8-2411 1
Relay Tyco RP421024 1
PIC 18F2520 DIP 1 Integrated Circuit
PIC 16F876 1
MC9B222-1034 1
MC9B232-1634 2
MC6FD016-30P1 2 Connector
Socket 28 Pin 1
Electrolytic Capacitor 330uF/35V 2
Ceramic Capacitator 100nF 2 Capacitor
Ceramic Capacitor 22pF 2
Electrical Resistance 10K 6
Electrical Resistance 200R 8
Electrical Resistance 1K 1
Electrical Resistance 68K 2
Electrical Resistance 47R 1
Electrical Resistance
Electrical Resistance 100K 3
BD136 1 Transistor
BC548 6
1N4007 1 Diode
BAT54 1
Digit Numeric Display 7SEG SC56-11EWA 4
Cap 5 Pin Cap 1
Crystal 20 MHz Crystal 1
Terminal Block Screw Clamp Terminal Block (2 Pin) 5
This study approach for each one of these components is described in the next sections.
1.4.2. Product Systems
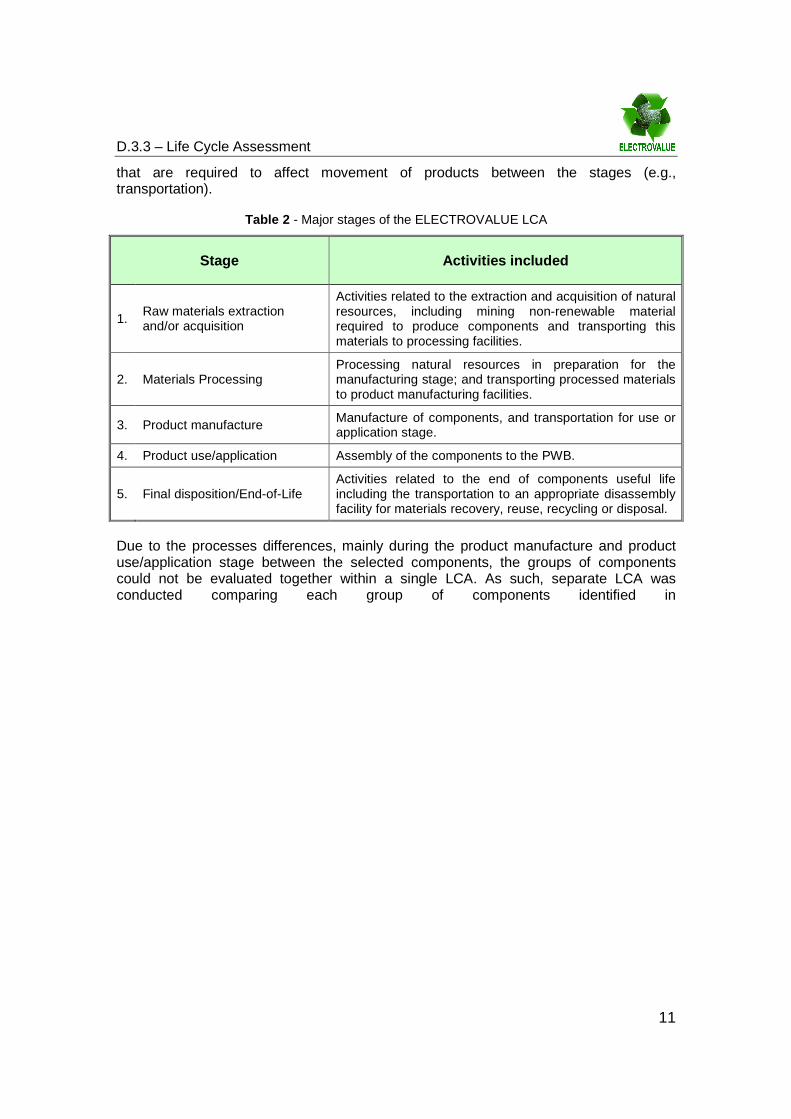
As noted above, in a comprehensive “cradle-to-grave” analysis, the product system includes five major life-cycle stages. The Table 2 depicted these five stages that were modelled in this study and details the activities and processes partitioned among each stage, within the life cycle. Despite not explicit in Table 2, also included are the activities
D.3.3 – Life Cycle Assessment
11
that are required to affect movement of products between the stages (e.g., transportation).
Table 2 - Major stages of the ELECTROVALUE LCA
Stage Activities included
1. Raw materials extraction and/or acquisition
Activities related to the extraction and acquisition of natural resources, including mining non-renewable material required to produce components and transporting this materials to processing facilities.
2. Materials Processing Processing natural resources in preparation for the manufacturing stage; and transporting processed materials to product manufacturing facilities.
3. Product manufacture Manufacture of components, and transportation for use or application stage.
4. Product use/application Assembly of the components to the PWB.
5. Final disposition/End-of-Life Activities related to the end of components useful life including the transportation to an appropriate disassembly facility for materials recovery, reuse, recycling or disposal.
Due to the processes differences, mainly during the product manufacture and product use/application stage between the selected components, the groups of components could not be evaluated together within a single LCA. As such, separate LCA was conducted comparing each group of components identified in
D.3.3 – Life Cycle Assessment
12
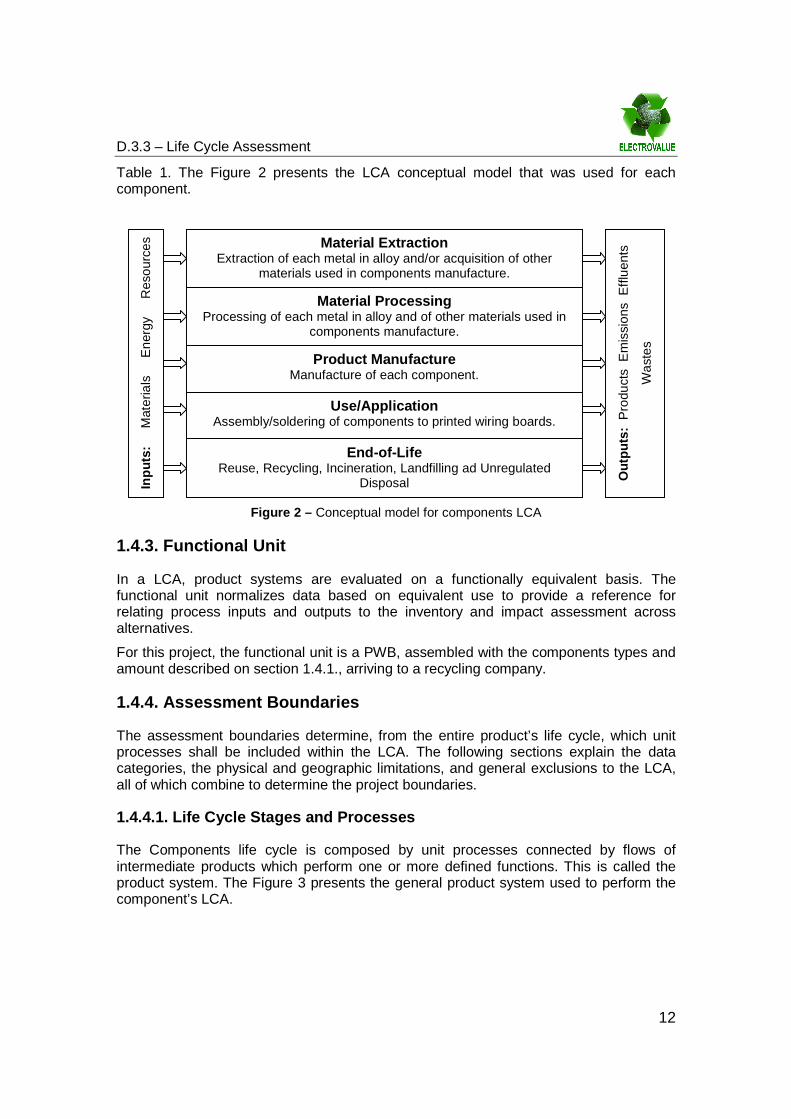
Table 1. The Figure 2 presents the LCA conceptual model that was used for each component.
Figure 2 – Conceptual model for components LCA
1.4.3. Functional Unit
In a LCA, product systems are evaluated on a functionally equivalent basis. The functional unit normalizes data based on equivalent use to provide a reference for relating process inputs and outputs to the inventory and impact assessment across alternatives.
For this project, the functional unit is a PWB, assembled with the components types and amount described on section 1.4.1., arriving to a recycling company.
1.4.4. Assessment Boundaries
The assessment boundaries determine, from the entire product’s life cycle, which unit processes shall be included within the LCA. The following sections explain the data categories, the physical and geographic limitations, and general exclusions to the LCA, all of which combine to determine the project boundaries.
1.4.4.1. Life Cycle Stages and Processes
The Components life cycle is composed by unit processes connected by flows of intermediate products which perform one or more defined functions. This is called the product system. The Figure 3 presents the general product system used to perform the component’s LCA.
Inpu
ts:
M
ater
ials
E
nerg
y
Res
ourc
es
Material Extraction Extraction of each metal in alloy and/or acquisition of other
materials used in components manufacture.
Material Processin g Processing of each metal in alloy and of other materials used in
components manufacture.
Product Manufacture Manufacture of each component.
Use/Application Assembly/soldering of components to printed wiring boards.
End-of -Life Reuse, Recycling, Incineration, Landfilling ad Unregulated
Disposal
Out
puts
: P
rodu
cts
Em
issi
ons
Effl
uent
s
Was
tes

D.3.3 – Life Cycle Assessment
13
Figure 3 – Schematic representation of components life-cycle
As explained above, in a “cradle-to-grave” product analysis, the product system starts with the extraction and/or acquisition of materials. This includes mining, quarrying and drilling processes to extract from nature the materials used to manufacture the product, in this case, the components. Following to this extraction processes, there is a sequence of operations that transforms these materials from a raw-material state into industrial usable materials. As example, the metal raw materials are usually produced in two steps. Firstly, the crude ore is processed to increase the concentration of the desired metal; this is called beneficiation. Typical beneficiation processes include crushing, roasting, magnetic separation, flotation, and leaching. And secondly, additional processes such as smelting and alloying are used to produce the metal that is to be fabricated into parts that are eventually assembled into a product. All this processes are included in the Materials Processing stage of the components life cycle [5].
The next stage represents to the components manufacture. This includes a several number of processes that, generally, corresponds to the assembly of materials, already shaped and sized, into the final product, the components. Following comes the use phase which refers to the application of components in the electric and electronic industry. This corresponds to the attachments of components to PWB by reflow or wave welding processes. As can be seen in the schematic representation of life cycle (Figure 3) there are also two different processes that come up and joint this stage. They are the PWB and solder manufacturing.
Following the life cycle, the PWB are assembled as well with other several types of materials into an EEE. The next stage represents the use of EEE. This stage is usually associated only with the consumption of energy by the equipment in order to perform the purpose for what it was made for.
End-of-Life
Extration/A cquisition of Materials
Inpu
ts:
M
ater
ials
Ene
rgy
R
esou
rces
Processing of Materials
Components Manufacture
Application /Assembly of Components to the PWBs
Assembly of P WB to the EEE
PWB Production
Solder Production
Use of EEE
Other Materials Production
Out
puts
: P
rodu
cts
/ Em
issi
ons
/ Effl
uent
s / W
aste
s
WEEE Collection
System Unregulated Disposal

D.3.3 – Life Cycle Assessment
14
When the holder discards, intents or is required to discard the EEE, it come into the next stage of the life cycle called the End-of-life. This means that EEE has became obsolete or has completed the purpose for what it was made for, and accordingly with the awareness of the owner may follow two main different routes. The unregulated disposal is strongly not recommended, due its associated impacts on the environment and public health, although there is still exist and therefore is needed to take into account. In order to reduce or even avoid these impacts, collection systems were specifically built to manage WEEE aiming their valorisation. And here appears the main difference between the two scenarios which are compared in this study. These two scenarios are presented in the Figure 4 and Figure 5.
Also included are the activities that are required to affect movement of products between the stages (e.g., transportation).
In scenario A, which in fact represents the actual situation, the WEEE arrive the recycler from collection system and it is sorted accordingly with type of equipment in order to be placed into a specific process for separation of its constituents. There is also WEEE which, when economically viable, is set for refurbishment and only the damaged parts of it are removed.
Figure 4 – Scenario A. End-of-Life involving materials recycling processes.
Several types of processes are used to separate WEEE constituents taking mainly into account the constituents materials characteristics. The most common separation processes are: mechanical, physical, magnetic, sensorial and manual separation. All these separation processes are then used to recover the constituent’s materials, and following the life cycle scheme, this can be made on the recycler’s facilities or don’t. Usually the materials easier to recover are separated on the recycler’s facility, and those hard to recover, as PWB materials, batteries or liquid crystal displays are sent to other enterprises with specific separation processes.
Finally, the separated materials can be used again to produce components, re-entering on the life-cycle, or other products, avoiding the exploitation of nature raw materials and
End-of-Life
Separation of WEEE constituents
Sorting
Processing of Materials
...
Other Appli cations
WEEE Collection System
Materials Disposal and/or Incineration
Materials Separation

D.3.3 – Life Cycle Assessment
15
associated impacts. This process is called recycling. Although there are also parts of WEEE that are still sent to landfills and incineration, mainly due to their low economic value or costly recycling processes.
In addition, in the scenario B a new stage related to the separation of components from PWB is introduced after the separation of the WEEE constituents. This separation corresponds to a manual process of desoldering the components from PWB. The components, before sent for reuse processes, passes through a certification process in order to guarantee their feasibility. Accordingly with the results of this feasibility study, the component is sent for reuse and re-enter the life-cycle in the Application phase, if confirm in compliance, or for material recovery, if it is not in compliance, following the actual course explained for scenario A.
Figure 5 – Scenario B. End-of-Life involving components reuse.
1.4.4.2. General Exclusions
Considering the processes and stages explained above, a number of items were excluded from the LCA. General exclusions of processes or data are as follows:
End-of-Life
Separation of WEEE constituents
Sorting
Materials Separation
Processing of Materials
...
Other Applications
Manual Separation of PWB components
No Compliance
Compliance
Application /Assly of Components to the PWBs
...
WEEE Collection System
Materials Disposal and/or Incineration

D.3.3 – Life Cycle Assessment
16
• impacts associated with the infrastructure needed to support manufacturing facilities (e.g., general plant building and maintenance);
• the solder and PWB manufacturing in order to focus this study only in the impacts and benefits resulting from the components use and reuse;
• the EEE production stage, due to enormous amount of different equipments that can be represented and as well the quantity of materials that can be used in this production;
• the use of the final product in which a PWB is installed, the EEE, due to the infinitude of possible equipments making impossible the collection of accurate data;
• in the use of recycling components materials, the scope of possible applications of these materials is obviously exhaustive and, therefore was not be taken into account;
• transportation between stages in the upstream part of the life cycle, mainly due to the large diversity of materials sources and intended markets.
Resuming, the Figure 6 and Figure 7 present the complete components life cycle used to perform this study for scenario A and scenario B, respectively.
Figure 6 – Components Product System Boundaries for Scenario A.
Extration/Acquisition of Materials
Processing of Materials
Components Manufacture
Application/Assembly of Components to the PWBs
Assembly of PWB to the EEE
PWB Manufacture
Solder Manufacture
Use of EEE
Other Materials Production
Unregulated Disposal
Separation of WEEE constituents
Sorting
Materials Separation
Materials Disposal and/or Incineration
Other Applications
Product System Boundaries
WEEE Collection System

D.3.3 – Life Cycle Assessment
17
Figure 7 – Components Product System Boundaries for Scenario B.
1.4.4.3. Geographical and Temporal Boundaries
Geographic and temporal boundaries are used in a LCA to show where and when impacts are likely to occur for each life-cycle stage. This is important for assessing the impact of such activities as transportation of materials between life-cycle stages.
Regarding the geographical boundaries the acquisition and processing of materials used in the components manufacture is done throughout the world and is represented by a worldwide database. Similarly, components manufacturing also occurs worldwide with data being collected from worldwide sources. Regarding the components application and end-of-life on components LCA it was assumed that the resulting impacts occur worldwide, despite ELECTROVALUE project perspective assume a Portuguese case study where components assembly and end-of-life occur in Portuguese companies. This is mainly due to the used data sources and provides the generation of wide-ranging results.
Therefore, for purposes of this study, the geographic boundaries for all life cycle stages are worldwide.
Extration/Acquisition of Materials
Processing of Materials
Components Manufacture
Application/Assembly of Components to the PWBs
Assembly of PWB to the EEE
PWB Manufacture
Solder Manufacture
Use of EEE
Other Materials Production
WEEE Collection System
Unregulated Disposal
Separation of WEEE constituents
Sorting
Materials Separation
Materials Disposal and/or Incineration
Other Applications
Manual Separation of PWB components
No Compliance Compliance
Product System Boundaries

D.3.3 – Life Cycle Assessment
18
Concerning the temporal boundaries, it is obviously dependent from collected data quality and specifications being explained on section 2.1. Due to the uncertainty related to the lifetime of the equipments, it was not taken into account.
1.4.5. Data Requirements and General Methodology
This section describes the data categories evaluated in the ELECTROVALUE LCI, decision rules used to determine which materials to evaluate in the study, and data collection methods. It also describes procedures for allocating inputs and outputs from a process to the product of interest (i.e., the components) when the process is used in the manufacture, recycle, or disposal of more than one product type at the same facility. Finally, it describes the data management and analysis software used for the project, and methods for maintaining overall data quality.
1.4.5.1. Data Categories
Table 3 describes the data categories for which inventory data was collected, including material and resource flows (inputs), and emission, waste, and product flows (outputs). In general, inventory data was normalized to either (1) the mass of an input or output per functional unit, or (2) energy input (i.e., megajoules, [MJ]) per functional unit.
As discussed in see Section 1.4.3, the functional unit is an amount of a particular component equal to 100 components. Data that reflect production for one year of continuous processes was scaled to distribute over time the excessive material or energy consumption associated with startups, shutdowns, and changeovers. Consequently, any modeling associated with the impact assessment reflects continuous emissions when equilibrium concentrations may be assumed. If data were reported over a period of less than one year for any inventory item, the analysis was adjusted as appropriate to the functional unit. Data was collected on the final disposition of emissions and waste flows, such as whether these flows are reused, recycled, treated, and disposed.
Table 3 – LCI Data Categories
Data Category Unit Description
Materials and Resources flows (input)
Material flows
kilograms [kg] per functional unit
Actual materials that make up the final product for a particular process (primary materials) and materials that are used in the processing of a product for a particular process. Materials may be non-renewable (i.e., materials extracted from nature that are non-renewable or stock resources such as coal), renewable, or flow resources such as water.
Energy flows
MJ per functional unit
Process energy and pre-combustion energy (i.e., energy expended to extract, process, refine, and deliver a usable fuel for combustion) consumed by any process in the life-cycle.

D.3.3 – Life Cycle Assessment
19
Data Category Unit Description
Emissions, wastes, and product flows (outputs)
Emissions to Air
kilograms [kg] per functional unit
Air outputs represent the releases to the environment of gaseous or particulates from a point or diffuse source of any stage of life cycle, after passing through emission control devices, if applicable.
Emissions to water
kilograms [kg] per functional unit
Water outputs represent liquid surface and groundwater discharges to from point or diffuse sources of any stage of life cycle, after passing through any water treatment devices.
Emissions to soil
kilograms [kg] per functional unit
Soil emissions represent discharges of masses of chemical constituents that are considered pollutants to soil from point or diffuse sources of any stage of life cycle.
Wastes kilograms [kg] per functional
unit
Represents the mass of a product or material, either solids or liquids, that are deposited as hazardous or non-hazardous waste, either before or after treatment (e.g., incineration, composting), recovery, or recycling processes.
Primary Products
kg of material or substance per functional unit
Material or substance outputs from a process that are received as input by a subsequent unit process within the components life cycle.
Co-Products
kilograms [kg] per functional unit
Material outputs from a process that can be used, either with or without further processing, that are not used as part of the final functional unit product.
1.4.5.2. Decision Rules
Decision rules are usually applied in LCA in order to make manageable the collection process of the enormous amount of data involved in inventorying all of the flows for a product system. Decision rules are a set of criteria established by project participants used to determine if a given process or material flow is to be evaluated in the LCA. For example, in materials extraction and processing stage, the decision rules were based on the materials used on components manufacture and consequently, the processes to be included on this stage, and for which data was necessary, are related to the extraction and processing of these materials. Therefore, and due to enormous amount of that involved in ELECTROVALUE LCA, the decision rules presented below were taken into account.
The decision rule process for the ELECTROVALUE LCA stages begins by assessing the inputs used in the various processes within the life-cycle for the following attributes:
1. The quantitative contribution of material or energy source to the product system.
Decision rule: Materials or energy sources used in large quantities have the potential for even more materials and resources to be associated with their manufacture, and thus should be included, due to their higher potential for having a significant environmental impact.

D.3.3 – Life Cycle Assessment
20
2. Materials that are of known or suspected environmental significance.
Decision Rule: In an environmental LCA, materials or components that are known to or are suspected to exhibit an environmental hazard or significant impact should be included to the extent feasible.
3. Materials that are known or suspected to have a large energy contribution to the systems energy requirements.
Decision Rule: Significant environmental impacts are associated with the production of energy, therefore, materials or processes that are known or suspected to consume large amounts of energy should be included.
4. Materials that are physically unique to one component over another.
Decision Rule: The physical uniqueness of a material or component has the potential to accentuate the environmental differences among components and, thus, should be included in the study.
5. Materials that are functionally significant to the components.
Decision Rule: “Functionally significant” is defined as important to the technically successful use of the components as it functions to allow the successful operation of a PWB, and therefore should be included.
1.4.5.3. Data Collection and Data Sources
ELECTROVALUE LCI data was collected from secondary sources. Secondary data comes from literature sources or other LCA, being specific to either a product, material, or process in question. For those processes that both secondary data were lacking, modeled data or assumptions was served as defaults.
All the collected data was normalized to the study functional unit and then imported into SIMAPRO 7, a commercially available LCA software program. The SIMPARO 7 software tool stores and organizes life-cycle inventory data and calculates life-cycle impacts for a product profile. It is designed to allow flexibility in conducting life-cycle design and LCA functions, and to provide the means to organize inventory data, investigate alternative scenarios, evaluate impacts, and assess data quality.
1.4.5.4. Allocation Procedures
An allocation procedure is required when a process within a system shares a common management structure, or where multiple products or co-products are produced. In fact, most industrial processes yield more than a single product and recycle intermediate or discarded products as raw materials. Therefore, the materials and energy flows as well as associated environmental releases shall be allocated to the different products according to clearly stated procedures [5].
With this in mind, in the ELECTROVALUE LCI, allocation procedures were required when processes within the product system boundaries generate more than one product. Flows are allocated among the product lines to avoid over-estimating the environmental burdens associated with the product under evaluation.

D.3.3 – Life Cycle Assessment
21
The ISO 14040:2006 [4] recommends that wherever possible, allocation should be avoided or minimized. This may be achieved by sub-dividing the unit process into two or more sub-processes, some of which can be excluded from the system under study. As suggested by ISO, if sub-processes within the facility can be identified that distinguish between products used during application, the sub-processes using a sub-product that are not of interest can be eliminated from the analysis, thus reducing allocation procedures.
Regarding reuse and recycling the allocation procedures require additional elaboration mainly because they may change the inherent properties of materials in subsequent use. Being one of the ELECTROVALUE LCA objectives to determine the benefits related to the reuse of components, this became an important issue. ISO 14042:2000 [6] distinguish two main allocation procedures for reuse and recycling processes, as following:
• Closed-loop allocation procedure – applied when no changes occur in the inherent properties of the reused or recycled material;
• Open-loop allocation procedure – applied when the material is reused or recycled into other product system, and consequently undergoes a change to its inherent properties.
Considering this, in this study the allocation procedures were used as follows:
- Inventory data for utilities and services common to several processes were allocated to reflect the relative use of the service;
- Where a unit process produces co-products, the burdens associated with the unit process are allocated to the co-product on a mass or volume basis, as appropriate;
- Regarding the components reuse a close loop allocation procedure was used. As referred in section 1.1. the ELECTROVALUE project intents to perform reliability and feasibility tests on the components and therefore, to the reuse of components occur the maintenance of inherent properties should be guaranteed.
1.4.5.5. Data Quality Requirements
Descriptions of data quality are important to understand the reliability of the study and properly interpret the outcome and results of the study. Data quality requirements specify in general terms the characteristics of the data needed for the study. LCI data quality was evaluated based on the following data quality indicators [4]:
• the source type (i.e., primary or secondary data sources); • the method in which the data were obtained (e.g., measured, calculated,
estimated); • the time-related period for which the data are representative; and • the geographical coverage for which the data are representative;
In addition, the uncertainties regarding the information or related to the data collection process were also determined.

D.3.3 – Life Cycle Assessment
22
1.4.6. Impact Assessment Methodology
The results from ELECTROVALUE LCIA was presented relating the inputs and outputs of each process and activity, defined on inventory analysis, with impact categories already defined and accepted by the scientific community, namely by the UNEP/SETAC Life-cycle Initiative.
LCIA of ELECTROVALUE used the Eco-indicator 99 impact assessment methodology. The Eco-indicator 99 method uses damage oriented method and has been developed by Pré Consultants being also integrated on SIMAPRO 7 software.
In Eco-indicator 99 enunciates three damage categories as follows [8]: • Human health – contains the idea that all human beings, in present and future,
should be free from environmentally transmitted illness, disabilities or premature deaths.
• Ecosystem health – contains the idea that non-human species should not suffer from disruptive changes of their populations an geographical distribution;
• Resources – contains the idea that the nature’s supply of non-living goods, which are essential to human society, should be available also for the future generations.
Taking into account these three damage categories, the Eco-indicator 99 methodology implements the connection between inventory results and environmental impacts results with similar impact pathways, the inventory results are then classified into impact categories at midpoint level, also called midpoint categories. For each inventory result, an indicator value is calculated per midpoint category, characterising the inventory result according to its specific contribution to the common impact. The term 'midpoint' expresses that this point is located on the impact pathway at an intermediate position between the inventory results and the damage category (often referred to as endpoints) [9].
Then, in order to better understand the relative magnitude of each damage category result of the product system, a normalisation is performed. In the normalisation step the results of the damage categories are divided by a reference (“normal”) value. The result is a set of factors without or with the same dimension that reflect the relative share of the calculated damages to the reference. The purpose of normalisation can be manifold, such as:
• Errors checking; • Providing information on the relative significance of the damage category results; • Preparing for additional procedures such as grouping and weighting.
This last application is clearly the most relevant for ELECTROVALUE. In weighting, factors are assigned to the normalised results which represent the different views of the society or a group of stakeholders. This is obviously an interactive process which changes from case to case, being necessary to take always into account the target audience, the product system and goal and scope of the LCA. Weighting can also be a source of enormous amount of uncertainties, and due to this, Eco-indicator 99 has developed three different perspectives of the methodology, using the archetypes specified in Cultural Theory [10] [11] as follows.

D.3.3 – Life Cycle Assessment
23
In the individualist version, only proven cause effect relations were included. The preference for proven relationships is the attitude of individualists to consider each limit as negotiable. Of course also an individualist will accept that a limit is not negotiable if sufficient proof is given. Similarly it is not proven that long term effects cannot be corrected by the progress of science and societal developments. For human health issues age-weighting is used, since in the Individualist perspective a person is valued higher at the age between 20 and 40 years [8].
In the hierarchical version facts that are backed up by scientific and political bodies with sufficient recognition were included. The hierarchical attitude is rather common in the scientific community, and among policy makers. A typical example is the wide acceptance of the IPCC guidelines for climate change [8].
In the egalitarian version, a precautionary principle is consistently used. Egalitarians do not accept guidance from internationally accepted scientific or political organisations. Similarly a very long time perspective is used, as egalitarians do not accept that future problems can be avoided. It is clear that this version is the most comprehensive version, but it also has the largest data uncertainties, as we sometimes have to include data on which consensus is lacking [8].
A better explanation of the impact assessment methodology can be seen at chapter 3.

D.3.3 – Life Cycle Assessment
24
Chapter 2 – Life Cycle Inventory
A Life Cycle Inventory (LCI) is the identification and quantification of the material, resource, emission, waste, and product flows from the unit processes in the life cycle of a product system (Figure 8). For ELECTROVALUE, LCI inputs include materials used in the components themselves, ancillary materials used in processing and manufacturing of the components, and energy and other resources consumed in the manufacturing, use (application), or final disposition. LCI process output flows include primary and co-products, as well as releases to air, water, and land.
Figure 8 - Unit process inventory conceptual diagram
This Chapter describes the approach taken for collecting and evaluating LCI data for this study. Section 2.1 describes the general methodology for LCI data collection. Section 2.2 presents the specific methodologies, data sources, data quality, limitations and uncertainties for each life-cycle stage. Section 2.3 presents the flow model approach and Section 2.4 the LCI results.
2.1. Data Collection
2.1.1. Materials Extraction, Processing and Compone nts Manufacture This stage represents the extraction and/or acquisition of materials, which includes mining, quarrying and drilling processes to extract from nature the materials used to manufacture the components. Following to this extraction processes, there is a sequence of operations that transforms these materials from a raw-material state into industrial usable materials. All this processes are included in the Materials Processing stage of the components life cycle.
Due to the impossibility in determining the types and quantities of materials present in each component, the components manufacture was also included in this upstream stage. As previous explained the used data sources present the two upstream life cycle stages (material extraction and material processing) on the components manufacture dataset. Therefore, the data was collected taking into account each type of component which has also content the associated data for the components materials extraction and processing.
Nevertheless, due to their specificity, not all data was available for all components. In these cases this project used the unspecified electronic components dataset to fill this lack of data. As can be seen in the table 4, this dataset represents an average of all
Unit Process
Materials
Energy
Resources
Emissions
Wastes
Primary products
Co-products

D.3.3 – Life Cycle Assessment
25
components represented in database. The next table presents the datasets names for the components types under study.
Table 4 – Dataset names used for the components
Component Type Dataset name
Fuse electronic component (unspecified)
Fuse Holder electronic component (unspecified)
Converter integrated circuit (logic type)
Relay switch (toggle type)
Integrated Circuit integrated circuit (memory type)
Connector connector (clamp connection)
Capacitor capacitor (unspecified)
Electrical Resistance resistor (unspecified)
Transistor transistor (small size)
Diode diode (SMD type)
Digit Numeric Display light emitting diode (LED)
Cap electronic component (unspecified)
Crystal electronic component (unspecified)
Terminal Block electronic component (unspecified)
The next tables summarize sources of data and data information for each dataset.
Table 5 – summary of data sources and data quality information for each component
Name Source Time period
Geographic Boundaries
Data quality description
Capacitors
Ecoinvent 2007 (based on Life Cycle Inventories of Electric and Electronic Equipment - Production, Use & Disposal, 2007)
1994-2007 Worldwide
Data represents an unweighted average of all specific capacitor datasets represented in the ecoinvent database.
Connectors
Ecoinvent 2007 (based on Life Cycle Inventories of Electric and Electronic Equipment - Production, Use & Disposal, 2007)
2004-2006 Worldwide
Ecoinvent states that it is “based on literature and assumptions”.
Diodes
Ecoinvent 2007 (based on Life Cycle Inventories of Electric and Electronic Equipment - Production, Use & Disposal, 2007)
1994-2007 Worldwide
Data represent a typical SMD type diode for surface mounting, used in the ICT. Material data are taken from datasheets of producers of such diodes and from the literature. Infrastructure and production efforts are based on assumptions.

D.3.3 – Life Cycle Assessment
26
Name Source Time period
Geographic Boundaries
Data quality description
Converter
Ecoinvent 2007 (based on Life Cycle Inventories of Electric and Electronic Equipment - Production, Use & Disposal, 2007)
2000-2006 Worldwide
Data is based on two semiconductor companies in the USA and Western Europe representing international standard.
Electronic components (unspecified)
Ecoinvent 2007 (based on Life Cycle Inventories of Electric and Electronic Equipment - Production, Use & Disposal, 2007)
1994-2007 Worldwide
Data represents an unweighted average of all components represented in ecoinvent database.
Integrated circuits
Ecoinvent 2007 (based on Life Cycle Inventories of Electric and Electronic Equipment - Production, Use & Disposal, 2007)
2000-2006 Worldwide Data was calculated for 1 kg
of packaged memory IC.
LED Diodes
Ecoinvent 2007 (based on Life Cycle Inventories of Electric and Electronic Equipment - Production, Use & Disposal, 2007)
1994-2007
Worldwide
The data represent a typical light emitting diode (LED) for hole-through mounting. Infrastructure and production efforts are based on assumptions.
Resistors
Ecoinvent 2007 (based on Life Cycle Inventories of Electric and Electronic Equipment - Production, Use & Disposal, 2007)
1994-2007 Worldwide
The data represents an unweighted average of all specific resistors datasets represented in the ecoinvent database.
Switches
Ecoinvent 2007 (based on Life Cycle Inventories of Electric and Electronic Equipment - Production, Use & Disposal, 2007)
2004-2006 Worldwide
The data represent a current toggle type switch, as applied in current ICT. Material data are taken from product sheets of producers. The energy demand is estimated based on literature. Infrastructure and transport efforts rough estimations.
Transistors
Ecoinvent 2007 (based on Life Cycle Inventories of Electric and Electronic Equipment - Production, Use & Disposal, 2007)
1994-2007 Worldwide
Data represent a typical wired, small-size, transistor for through-hole mounting, used in the ICT. Material data are taken from datasheets of producers of such transistors and from the literature. Infrastructure and production efforts are based on assumptions.
Printed wired board
Ecoinvent 2007 (based on Life Cycle Inventories of Electric and Electronic Equipment - Production, Use & Disposal, 2007)
2003-2006
EU
Data represent an unspecified Pb-free PWB , used in electronic devices. Material data are based on literature. Infrastructure and production efforts are based on assumption.

D.3.3 – Life Cycle Assessment
27
Table 6 – summary information from data sources
Component Processes included
Capacitors
The dataset covers raw material input and production efforts for the production of current capacitors including: formulation; build-up process; cutting; bisquing; Pre-Firing; Firing; Tumbling; termination (SMT) resp. metallization; slitting; winding; metal spray; heat treatment; sawing; lead welding; epoxy filling (THT).
Connectors
The dataset covers raw material input, energy consumption, infrastructure and transport efforts for the production of clamp type connectors. The data represent a current clamp type connector for three wires used in the electronics industry in general. Material data are taken from product sheets of a producer. The energy demand for the production is from literature. Infrastructure and transport efforts rough estimations.
Diodes
The dataset covers raw material input and production efforts for the production of current diodes, including: comprising the diode wafer production (cleaing, masking, etching, doping, oxidising, metal deposition) and the final assembly of the diode (wafer sawing, die bonding, moulding, trimming and forming)
Converters
Describes all the processes required to produce a logic type microchip. Included are 'die separation', 'encapsulation', 'die attachment', 'lead bonding', 'plating', and 'marking'. These operations are represented by the material input of glass epoxy, metals, epoxy resin, doped silicon, glue, gold (wires) etc. and the assembly process energy used. The required infrastructure, and ship, train and road transport are also inventoried.
Electronic components (unspecified)
The dataset covers material input (and within this the respective production efforts) for unspecified electronic components.
Integrated circuits
Describes all the processes required to produce a memory type microchip. Included are 'die separation', 'encapsulation', 'die attachment', 'lead bonding', 'plating', and 'marking'. These operations are represented by the material input of copper alloy, epoxy resin, doped silicon, glue, gold (wires) etc. and the assembly process energy used. The required the infrastructure, and the ship, train and road transport are also inventoried.
LED Diodes
The dataset covers raw material input and production efforts for the production of currently used light emitting diodes (LED) for hole-through mounting technology, including: comprising the diode wafer production (cleaing, masking, etching, doping, oxidising, metal deposition) and the final assembly of the diode (wafer sawing, die bonding, moulding, trimming and forming).
Resistor The dataset covers raw material input and production efforts for the production of current resistors
Switches The dataset covers raw material input, energy consumption, infrastructure and transport efforts for the production of toggle type switches.
Transistors The dataset covers raw material input and production efforts for the production of current transistors.
Printed wired boards
The functional unit represents 1 m2 of a 6-layer FR-4 PWB, surface finished (mixture of Pb-containing and Pb-free methods), with soldermask, for surface mount applications, without mounted components. It is designed to be used in ICT applications.
The limitations and uncertainties associated these upstream stages inventories are mainly due to the fact that these datasets derived from secondary sources and are not tailored to the specific goals and boundaries of this project. Nevertheless, being the study of environmental benefits and implications of components reuse the major goal of

D.3.3 – Life Cycle Assessment
28
the project, it is not expected that these limitation and uncertainties affect the results by not being specific for the board created for the project.
2.1.2. Components Use/Application
This stage represents the use phase which refers to the application of components in the electric and electronic industry. This corresponds to the attachments or assembly of components to PWB by soldering processes. The next tables present the data sources and its summary information used in this stage.
Table 7 – summary of data sources and data information for mounting process
Name Source Time period
Geographic Boundaries
Data quality description
Mounting process
Ecoinvent 2007 (based on Life Cycle Inventories of Electric and Electronic Equipment - Production, Use & Disposal, 2007)
2005 Worldwide
Data is based on literature (report from a European research project in the field of lead-free soldering). Infrastructure and transportation efforts are based on assumptions.
Table 8 - summary information from data sources
Process Processes included
Mounting process
The dataset includes soldering material input, energy consumption and waste, as well as an estimation of emissions to air, the efforts for transportation and of the infrastructure for the mounting process of surface mount components. Input of PWB and components are not included in this dataset.
2.1.3. End-of-Life
This stage refers to the end-of-life of components. At this stage EEE has became obsolete or has completed the purpose for what it was made for, and accordingly with the awareness of the owner may follow two main different routes. The unregulated disposal is strongly not recommended, due its associated impacts on the environment and public health, although there is still exist and therefore is needed to take into account. In order to reduce or even avoid these impacts, collection systems were specifically built to manage WEEE aiming their valorisation. And here appears the main difference between the two scenarios which are compared in this study.
In scenario A, which in fact represents the actual situation, the WEEE arrive the recycler from collection system and it is sorted accordingly with type of equipment in order to be placed into a specific process for separation of its constituents. Several types of processes are used to separate WEEE constituents taking mainly into account the constituents materials characteristics. The most common separation processes are: mechanical, physical, magnetic, sensorial and manual separation. All these separation processes are then used to recover the constituent’s materials, and following the life cycle scheme, this can be made on the recycler’s facilities or don’t. Usually the

D.3.3 – Life Cycle Assessment
29
materials easier to recover are separated on the recycler’s facility, and those hard to recover, as PWB materials, batteries or liquid crystal displays are sent to other enterprises with specific separation processes.
Finally, the separated materials can be used again to produce components, re-entering on the life-cycle, or other products, avoiding the exploitation of nature raw materials and associated impacts. This process is called recycling . Taking into account the functional unit selected for this study, it was considered that all components received by recycling company, in this scenario, are sent to recycling.
In addition, in the scenario B a new stage, related to the separation of components from PWB, is introduced after the separation of the WEEE constituents, in order to begin the reuse process. This separation corresponds to a manual process of desoldering the components from PWB. The components, before sent for reuse processes, pass through a certification process in order to guarantee their feasibility. Accordingly with the results of this feasibility study, the component is sent for reuse and re-enter the life cycle in the Application phase, if confirm in compliance, or for material recovery, if it is not in compliance, following the actual course explained for scenario A. To make the project results more consistent, during the reuse process, different reuse percentages were given to the components in order to simulate the amount of components that confirm in compliance and those were not in compliance with the quality requirements. Therefore, three scenarios were built up with 25%, 50% and 75% reuse percentages. In each scenario the percentage value means the components that enter the recycling company that can be sent for reuse, due to their compliance with the quality requirements. Due to the PWB and components sorting and desoldering processes are mainly based on manual techniques associated to a small consumption of energy, it was assumed that it not affects the LCA results, so they were not taken into account during this study.
Despite these two main courses, there is also WEEE parts, including components, that are still sent to landfills and incineration processes, mainly due to their low economic value or costly recycling processes. Even though, and taking in to account the stated goal for this study, these two disposal scenarios were not taking into account in this study.
2.2. Flow Model Approach
As referred above the main difference between scenario A and B is related to the end-of-life. Representing the actual situation, in scenario A all components are sent to recycling, as well with other WEEE parts, which corresponds mainly to the recovery of main added value materials. This recycling process, by a life cycle point of view, represents a lower resources and raw materials exploitation, avoiding all processes involved in these practices, due to the possibility to reintroduce the recovered materials in the life cycle. In scenario B part of components, those which confirm compliance with the quality requirements, are sent for reuse. This reuse process avoid not only the processes involved in the recycling process, but also the components manufactures, being those components reintroduced in the life cycle on the PWB assembly stage.
Taking this into account, and being the main goal of the ELECTROVALUE LCA to determine the benefits related to the reuse of components against its recycling, the approach to the flow model regarding reuse and recycling requires additional

D.3.3 – Life Cycle Assessment
30
elaboration. ISO 14042:2000 [6] distinguish two main allocation procedures for reuse and recycling processes, as following:
• Closed-loop allocation procedure – applied when no changes occur in the inherent properties of the reused or recycled material;
• Open-loop allocation procedure – applied when the material is reused or recycled into other product system, and consequently undergoes a change to its inherent properties.
In ELECTROVALUE LCA different approached were taken into account for recycling and reuse. Due to the impossibility on determination and tracking the recycled materials current uses, an open-loop was considered for recycling. This means that components recycled materials are used in other product systems and were not considered for LCIA. Despite of this, all recycling processes were considered as part of the current product system. Regarding the reuse process, it was assumed that components can be easily reintroduced in the ICT market, mainly due to their main added value and compliance with quality requirements. As referred, the components are reintroduced in the PWB assembly stage of life cycle, making possible the application a close-loop allocation. Different reuse percentages were given to the components in order to simulate the amount of components that confirm in compliance and those were not in compliance with the quality requirements. Therefore, for scenario B, three scenarios were built up with 25%, 50% and 75% reuse percentages. In each scenario the percentage value means the components that can be sent for reuse, due to their compliance with the quality requirements.
The next figures present the flow model approach taken for both scenarios.
End-of-life
Recycling
Extration and processing of Materials
Components Manufacture
PWB Assembly
PWB Manufacture Solder Manufacture
End-of-life
Recycling
Extration and processing of Materials
Components Manufacture
PWB Assembly
PWB Manufacture Solder Manufacture
100%
2nd PWB
1st PWB
100%
Figure 9 – Flow model approach for Scenario A.
D.3.3 – Life Cycle Assessment
31
End-of-life Reuse
Recycling
Extration and processing of Materials
Components Manufacture
PWB Assembly
PWB Manufacture Solder Manufacture
End-of-life Reuse
Recycling
Extration and processing of Materials
Components Manufacture
PWB Assembly
PWB Manufacture Solder Manufacture
x%
100 - x%
2nd PWB
1st PWB
100%
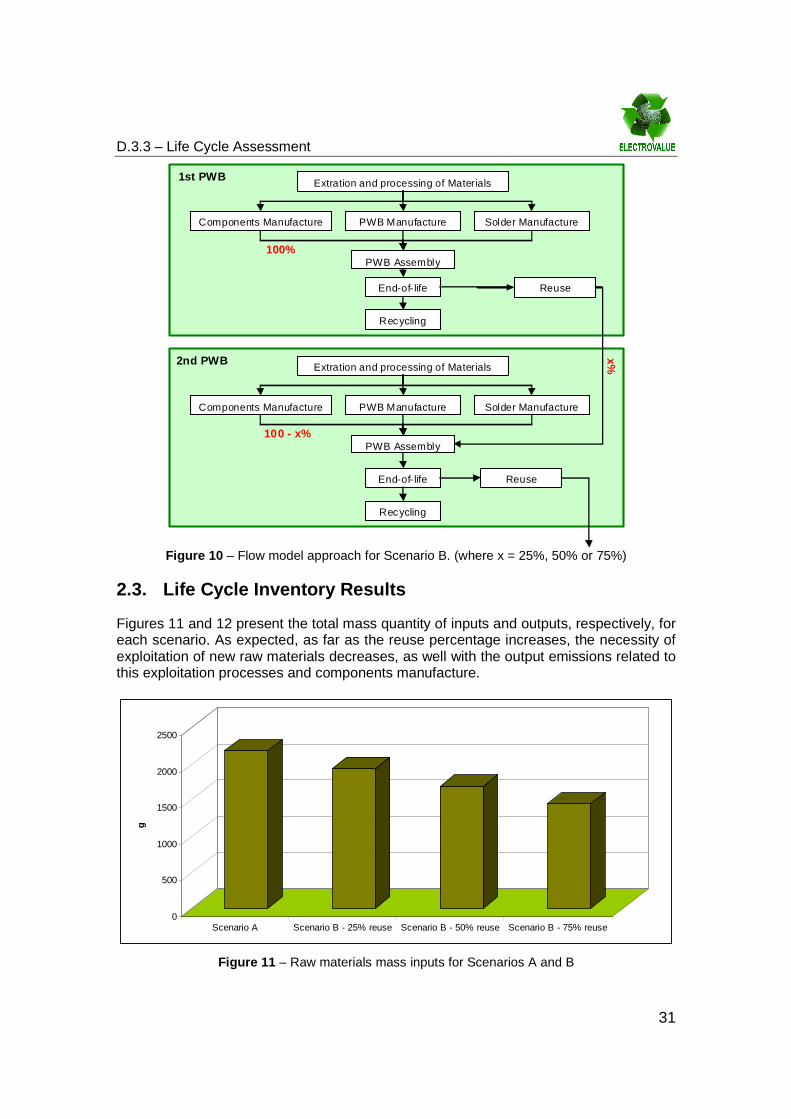
Figure 10 – Flow model approach for Scenario B. (where x = 25%, 50% or 75%)
2.3. Life Cycle Inventory Results
Figures 11 and 12 present the total mass quantity of inputs and outputs, respectively, for each scenario. As expected, as far as the reuse percentage increases, the necessity of exploitation of new raw materials decreases, as well with the output emissions related to this exploitation processes and components manufacture.
0
500
1000
1500
2000
2500
g
Scenario A Scenario B - 25% reuse Scenario B - 50% reuse Scenario B - 75% reuse
Figure 11 – Raw materials mass inputs for Scenarios A and B

D.3.3 – Life Cycle Assessment
32
0
50
100
150
200
250
300
kg
Scenario A Scenario B - 25% reuse Scenario B - 50% reuse Scenario B - 75% reuse
Air emissions Water Emissions Soil Emissions
Figure 12 – Mass outputs for Scenarios A and B
0
20
40
60
80
100
120
140
160
MJ
Scenario A Scenario B - 25% reuse Scenario B - 50% reuse Scenario B - 75% reuse
Figure 13 – Energy consumption of Scenario A and B

D.3.3 – Life Cycle Assessment
33
Chapter 3 – Life Cycle Impact Assessment and Interpretation
According to ISO 14040:2006 the LCIA is aimed to understand and evaluate the magnitude and significance of potential environmental impacts of a product system using the results of the LCI. In general, the LCIA involves the association of inventory data with specific environmental impacts, being typically a quantitative process involving characterization of burdens and assessment of their effects.
This Chapter describes the general LCIA methodology used in this study, presents the results and its interpretation.
3.1. Life Cycle Impact Assessment
3.1.1. General Methodology Due to the complexity of the LCIA process many methodologies have been suggested and described. These methodologies can be divided into two main categories [7]:
• Theme oriented methods, which converts the inventory results into a number of themes, usually Greenhouse effect (or climate change), Natural resource depletion, Stratospheric ozone depletion, Acidification, Photochemical ozone creation, Eutrophication, Human toxicity and Aquatic toxicity.
• Damage oriented methods, also starts by classifying a system's flows into presented environmental themes, but modelling each environmental theme's damage into three main damage categories: human health, ecosystem health and damage to resources.
The LCIA of ELECTROVALUE used the Eco-indicator 99 impact assessment methodology. The Eco-indicator 99 method uses damage oriented method and has been developed by Pré Consultants being also integrated on SIMAPRO 7 software.
In Eco-indicator 99 the enunciated three categories are used as follows [8]:
• Human health – contains the idea that all human beings, in present and future, should be free from environmentally transmitted illness, disabilities or premature deaths.
• Ecosystem health – contains the idea that non-human species should not suffer from disruptive changes of their populations an geographical distribution;
• Resources – contains the idea that the nature’s supply of non-living goods, which are essential to human society, should be available also for the future generations.
Taking into account these three damage categories, the Eco-indicator 99 methodology implements the connection between inventory results and environmental impacts results with similar impact pathways. The inventory results are then classified into impact categories at midpoint level, also called midpoint categories. For each inventory result, an indicator value is calculated per midpoint category, characterising the inventory result

D.3.3 – Life Cycle Assessment
34
according to its specific contribution to the common impact. The term 'midpoint' expresses that this point is located on the impact pathway at an intermediate position between the inventory results and the damage category (often referred to as endpoints) [9].
The next figure illustrates the sequenced steps where inventory data are translated into environmental impacts.
Car
cino
gens
Res
pira
tory
org
anic
Res
pira
tory
inor
gani
c
Clim
ate
Cha
nge
Rad
iatio
n
Ozo
ne L
ayer
Eco
toxi
city
Aci
dific
atio
n/E
utro
phic
atio
n
Land
Use
Min
eral
s
Foss
il F
uels
Mid
po
int
Ca
teg
ori
es
EcosystemHuman Health ResourcesE
nd
po
int
Ca
teg
ori
es
Cultural Theory Archetypes
LCI Results
Cla
ssi
fica
tion
Ch
ara
cte
risa
tion
No
rma
lisa
tion
a
nd W
eig
htin
g
Eco-indicator
Figure 14 – Life Cycle Impact Assessment Model
In the first step the inventory parameters and results are sorted, assigned and aggregated to specific impact categories, the midpoint categories. The midpoint categories used in this study are:
• Carcinogens – refers to the affects to air, water and soil due to emissions of carcinogenic substances.
• Respiratory organics – refers to the respiratory effects resulting from summer smog, due to the emission of organic substances to the air.
• Respiratory inorganics - refers to the respiratory effects resulting from winter smog, due to the emission of dust, sulphur and nitrogenoxides to the air.
• Climate Change – refers to the damage resulting from an increase of diseases and death caused by climate change.
• Radiation – refers to damage resulting from radioactive radiation. • Ozone Layer – refers to the damage due to the increased UV radiation as a
result of ozone depleting substances emitted to air.

D.3.3 – Life Cycle Assessment
35
• Ecotoxicity – refers to the damage to the ecosystem quality as a result of ecotoxic substances emitted to air, water and soil.
• Acidification/Eutrophication – refers to the damage to ecosystem quality as a result of acidifying substances emitted to air, water and soil.
• Land use – refers to the damage as a result of either conversion or occupation of land.
• Minerals – refers to surplus energy as a result of decreasing ore grades. • Fossil fuels – refers to surplus energy as a result of lower quality resources.
This aggregation of LCI result to the midpoint categories is called Classification stage. The next step represents the characterisation stage, where inventory parameters are multiplied by equivalency factors, accordingly to their potential damage effect to each impact category. Thereafter all parameters included in each impact category are added and the result of both midpoint and endpoint impact categories is obtained.
Then, in order to better understand the relative magnitude of each damage category result of the product system, the normalisation of damage categories results is performed. In the normalisation step the results of the damage categories are divided by a reference (“normal”) value. The result is a set of factors with or without the same dimension that reflect the relative share of the damages categories to the overall calculated damages. The purpose of normalisation can be manifold, such as:
• Errors checking; • Providing information on the relative significance of the damage category results; • Preparing for additional procedures such as grouping and weighting.
This last application is clearly the most relevant for ELECTROVALUE. In weighting, factors are assigned to the normalised results which represent the different views of the society or a group of stakeholders. This is obviously an interactive process which changes from case to case, being necessary to take always into account the target audience, the product system and goal and scope of the LCA. Weighting can also be a source of enormous amount of uncertainties, and due to this, Eco-indicator 99 has developed three different perspectives of the methodology, using the archetypes specified in Cultural Theory [10] [11]. The Figure 15 below presents the grid-group dependency of the five archetypes distinguished in Cultural Theory, although Eco-indicator 99 only uses the hierarchist, egalitarian and individualist perspectives.
Figure 15 - Grid-group dependency of the five archetypes distinguish in Cultural Theory [10]

D.3.3 – Life Cycle Assessment
36
Considering the archetype view, different weighting factors are then assigned to the results. Summarising the most important characteristics of the five archetypes which influence the weighting factors are [8]:
• Individualists – both free from strong links to group and grid. In this environment all limits are provisional and subject to negotiation. Although they are relatively free of control by others, they are often engaged in controlling others.
• Egalitarians – have a strong link to the group, but a weak link to their grid. In this environment there is no internal role differentiation, and relations between group members are often ambiguous, and conflicts can occur easily.
• Hierarchists – have both a strong link to group and grid. In this environment people are both controlling others and are subject of control by others. This hierarchy creates a high degree of stability in the group.
• Fatalists – have a strong link to grid, but not to a group. These people act individually, and are usually controlled by others.
• Autonomists – are assumed to be the relatively small group that escapes the manipulative forces of groups and grids.
As above referred, the Eco-indicator 99 only uses the hierarchist, egalitarian and individualist perspectives and therefore, for each perspective Eco-indicator 99 assigns typical values as follow.
In the individualist version, only proven cause effect relations were included. The preference for proven relationships is the attitude of individualists to consider each limit as negotiable. Of course also an individualist will accept that a limit is not negotiable if sufficient proof is given. Similarly it is not proven that long term effects cannot be corrected by the progress of science and societal developments. For human health issues age-weighting is used, since in the Individualist perspective a person is valued higher at the age between 20 and 40 years [8].
In the hierarchical version facts that are backed up by scientific and political bodies with sufficient recognition were included. The hierarchical attitude is rather common in the scientific community, and among policy makers. A typical example is the wide acceptance of the IPCC guidelines for climate change [8].
In the egalitarian version, a precautionary principle is consistently used. Egalitarians do not accept guidance from internationally accepted scientific or political organisations. Similarly a very long time perspective is used, as egalitarians do not accept that future problems can be avoided. It is clear that this version is the most comprehensive version, but it also has the largest data uncertainties, as we sometimes have to include data on which consensus is lacking [8].
3.1.2. Life Cycle Impact Assessment Results As discussed in section 1.4.5.3., all data was imported into SIMAPRO 7, a commercially available LCA software program that calculates life cycle impacts for a product profile. The next figures present the results of the LCIA. The interpretation of the presented results is discussed on next section.

D.3.3 – Life Cycle Assessment
37
Method: Eco-indicator 99 (E) V2.07 / Europe EI 99 E/E / CharacterisationComparing 1 p 'Scenario A', 1 p 'Scenario B 25%', 1 p 'Scenario B 50%' and 1 p 'Scenario B 75%';
Scenario A Scenario B 25% Scenario B 50% Scenario B 75%
Carcinogens Respiratory organics Respiratory inorganics Climate change Radiation Ozone layer Ecotoxicity Acidification/ Eutrophication
Land use Minerals Fossil fuels
%
120
115
110
105
100
95
90
85
80
75
70
65
60
55
50
45
40
35
30
25
20
15
10
5
0
Figure 16 – Characterisation Impact Assessment results for comparison of Scenarios A and B
Method: Eco-indicator 99 (E) V2.07 / Europe EI 99 E/E / WeightingComparing 1 p 'Scenario A', 1 p 'Scenario B 25%', 1 p 'Scenario B 50%' and 1 p 'Scenario B 75%';
Scenario A Scenario B 25% Scenario B 50% Scenario B 75%
Carcinogens Respiratory organics Respiratory inorganics Climate change Radiation Ozone layer Ecotoxicity Acidification/ Eutrophication
Land use Minerals Fossil fuels
Pt
17
16
15
14
13
12
11
10
9
8
7
6
5
4
3
2
1
0
Figure 17 – Weighting Impact Assessment results for comparison of Scenarios A and B
Method: Eco-indicator 99 (E) V2.07 / Europe EI 99 E/E / Single scoreComparing 1 p 'Scenario A', 1 p 'Scenario B 25%', 1 p 'Scenario B 50%' and 1 p 'Scenario B 75%';
Carcinogens Respiratory organics Respiratory inorganics Climate change Radiation Ozone layer Ecotoxicity Acidification/ EutrophicationLand use Minerals Fossil fuels
Scenario A Scenario B 25% Scenario B 50% Scenario B 75%
Pt
28
27
26
25
24
23
22
21
20
19
18
17
16
15
14
13
12
11
10
9
8
7
6
5
4
3
2
1
0
Figure 18 – Impact Assessment Single Score results for comparison of Scenarios A and B

D.3.3 – Life Cycle Assessment
38
Method: Eco-indicator 99 (E) V2.07 / Europe EI 99 E/E / Single scoreComparing 1 p 'Scenario A', 1 p 'Scenario B 25%', 1 p 'Scenario B 50%' and 1 p 'Scenario B 75%';
Human Health Ecosystem Quality Resources
Scenario A Scenario B 25% Scenario B 50% Scenario B 75%
Pt
28
27
26
25
24
23
22
21
20
19
18
17
16
15
14
13
12
11
10
9
8
7
6
5
4
3
2
1
0
Figure 19 – Impact Assessment Single Score results per damage impact categories considering
the comparison of Scenarios A and B
3.2. Life Cycle Interpretation
Considering the product systems for scenarios A and B discussed on section 1.4.4, and its approach (section 2.2), it becomes obvious that the differences in results are only related to the disposal scenario.
As previous explained, in scenario A the WEEE arrive the recycler from collection system and it is sorted accordingly with type of equipment in order to be placed into a specific process for separation of its constituents and its materials recovered. The separated materials can be used again to produce components, re-entering on the life-cycle, or other products, avoiding the exploitation of nature raw materials and associated impacts. This process is called recycling . In addition, in the scenario B a new stage, related to the separation of components from PWB, is introduced after the separation of the WEEE constituents, in order to begin the reuse process. This separation corresponds to a manual process of desoldering the components from PWB. Accordingly with the results of the feasibility study, the component is sent for reuse and re-enter the life cycle in the Application phase, if confirm in compliance, or for material recovery, if it is not in compliance, following the actual course explained for scenario A. Different reuse percentages were given to the components in order to simulate the amount of components that confirm in compliance and those were not in compliance with the quality requirements. Three scenarios were built up inside scenario B with 25%, 50% and 75% reuse percentages. In each scenario the percentage value means the components that enter the recycling company that can be sent for reuse, due to their compliance with the quality requirements. The only difference between the scenario A and B is then the percentage reuse values for components.
The results presented in the previous section are then illustrative of this fact. As can be seen, the results obtained in the different impact assessment stages are easily correlated considering the overall benefits of each scenario. Regarding the impact assessment characterisation, the scenario B presents a decrease on environmental impacts between 10%, considering the reuse of 25% of components, and 35%,

D.3.3 – Life Cycle Assessment
39
considering the reuse of 75% of components, for all impact categories. The next table presents the results for this impact assessment characterisation.
Table 9 – Characterisation Impact Assessment results for comparison of Scenarios A and B
Impact category Unit Scenario A Scenario B 25%
Scenario B 50%
Scenario B 75%
Carcinogens DALY 0,000926 0,000813 0,000701 0,000588 Respiratory organics DALY 1,45E-07 1,28E-07 1,11E-07 9,34E-08 Respiratory inorganics DALY 0,000111 9,83E-05 8,54E-05 7,25E-05 Climate change DALY 3,14E-05 2,77E-05 2,41E-05 2,05E-05 Radiation DALY 1,55E-06 1,37E-06 1,19E-06 1,02E-06 Ozone layer DALY 1,49E-08 1,32E-08 1,16E-08 9,91E-09 Ecotoxicity PAF*m2yr 204,9563 181,4289 157,9015 134,3741 Acidification/ Eutrophication PDF*m2yr 3,146264 2,774796 2,403328 2,031861 Land use PDF*m2yr 3,609137 3,17307 2,737004 2,300937 Minerals MJ surplus 35,27652 31,58098 27,88545 24,18991 Fossil fuels MJ surplus 126,2259 111,7023 97,17864 82,65502
Analysing table 9, and as can be also observer on figure 16, the impact categories which present higher differences between both scenarios are the carcinogens and land use. Evaluating the processes contribution it is concluded that the processes which contribute mostly to these two impact categories are the components manufacture and the extraction of materials, which in fact are the two avoided stages if the components reuse is considered as on scenario B.
The same can be also seen in Weighting and Single Score results as presented in next tables.
Table 10 – Weighting Impact Assessment results for comparison of Scenarios A and B
Impact category Unit Scenario A Scenario B 25%
Scenario B 50%
Scenario B 75%
Carcinogens Pt 28,85538 25,42455 21,99372 18,56289 Respiratory organics Pt 17,97122 15,78541 13,59959 11,41378 Respiratory inorganics Pt 0,002818 0,002483 0,002148 0,001813 Climate change Pt 2,158875 1,908092 1,657309 1,406527 Radiation Pt 0,608701 0,538545 0,468389 0,398232 Ozone layer Pt 0,030018 0,026599 0,02318 0,019762 Ecotoxicity Pt 0,000289 0,000257 0,000225 0,000192 Acidification/ Eutrophication Pt 1,998324 1,768932 1,53954 1,310148 Land use Pt 0,306761 0,270543 0,234325 0,198106 Minerals Pt 0,351891 0,309374 0,266858 0,224341 Fossil fuels Pt 1,185291 1,061121 0,936951 0,812781

D.3.3 – Life Cycle Assessment
40
Table 11 – Impact Assessment Single Score results per damage impact categories considering the comparison of Scenarios A and B
Impact category Unit Scenario A Scenario B 25%
Scenario B 50%
Scenario B 75%
Total Pt 28,85538 25,42455 21,99372 18,56289 Human Health Pt 20,77192 18,26138 15,75084 13,2403 Ecosystem Quality Pt 2,656976 2,348849 2,040722 1,732596 Resources Pt 5,426481 4,814317 4,202153 3,58999
As can be seen, the damage impact category associated to the major negatives impacts is the human health mainly due to the emissions of carcinogenic substances. These emissions occur mostly on component manufacture stage and despite the consideration of reuse process, which represents a decrease of 36% of impacts on scenario B considering 75% of components reuse, the values of these emissions is still considerable.
Additionally, a parallel scenario was built up in order to understand the impact of the reuse process results in just one PWB and perform the sensitivity analysis of the previous results. The next tables present the results of this scenario.
Table 12 – Impact Assessment Single Score results per damage impact categories considering the comparison of Scenarios A and B
Impact category Unit Scenario A Scenario B 25%
Scenario B 50%
Scenario B 75%
Total Pt 14,42769 10,99686 7,56603 4,1352 Human Health Pt 10,38596 7,875422 5,364882 2,854343 Ecosystem Quality Pt 1,328488 1,020361 0,712234 0,404108 Resources Pt 2,71324 2,101077 1,488913 0,876749
For this scenario, the calculations were performed taking into account a single PWB produced with the components assuming the percentages values as for previous scenarios A and B. This means that for scenario A 100% of used components were new, and all upstream stages were included. For scenario B the same percentages used on previous analysis were used, i.e. 25%, 50% and 75%, meaning that only 75%, 50% and 25% of used components, respectively, were new.
As expected, analysing the table 12 it is possible to prove the consistency of previous results. Taking the scenario B with 25% of components reuse as example, a decrease of 23,78% of overall environmental impact is achieved. Being the decrease value close to the components reuse value, this means that the components have a large influence on environmental impacts, but it is not 100%. The difference between the two values is related to the PWB, which was not considered for reuse in both scenarios, and obviously the assembly process, which requires energy and materials, as solder, inputs.
As major conclusion of this project report it can be said that the components have large influence on the environmental impacts of a PWB life cycle, and its reuse decreases substantially these impacts, between 12%, considering 25% of components reused, and 36%, considering a 75% of components reused.

D.3.3 – Life Cycle Assessment
41
References
[1] Kuehr, R. et all. 2007. “2008 Review of Directive 2002/96 on Waste Electrical and Electronic Equipment (WEEE) – Final Report”. United Nations University Contract No: 07010401/2006/442493/ETU/G4 ENV.G.4/ETU/2006/0032, Bonn, Germany.
[2] Pearce, J., 2007. “ELFNET – Roadmap European Electronic Interconnection Version 1”. European Lead Free Soldering Network, Hertfordshire, UK.
[3] SETAC (Society of Environmental Toxicology and Chemistry). 1994. Life-Cycle Assessment Data Quality: A Conceptual Framework. SETAC and SETAC Foundation for Environmental Education, Inc. Washington, USA.
[4] ISO (International Standards Organization). 2006. ISO 14040, Environmental Management – Life Cycle Assessment Principles and Framework. International Standards Organization, Geneve.
[5] Geibig, J.R., Socolof, M.L. 2005. "Solders in electronics: a life cycle assessment", USEPA, Washington, DC, United States Environmental Protection Agency Report No. EPA 744-R-05-001
[6] ISO (International Standards Organization). 2000. ISO 14042, Environmental Management – Life Cycle Assessment – Life Cycle impact assessment. International Standards Organization, Geneve.
[7] Jolliet, O. et all. 2003. “Impact 2002+: A New Life Cycle Impact Assessment Methodology”. International Journal of Life Cycle Assessment, Vol.6, pages 324-330.
[8] Goedkoop, M., Spriensma, R., 2001. “The Eco-indicator 99 – A damage oriented method for Life Cycle Impact Assessment. Methodology Report”. Pré Consultants.
[9] Sonnemann, G., Castells, F., Schuumaker, M. 2004. “Integrated Life-Cycle and Risk Assessment for industrial processes”. Lewis Publishers.
[10] Thompson, M. Ellis R., Wildavsky, A. 1990. “Cultural Theory”. Westview Print Boulders.
[11] Hofstetter, P. 1998. “Perspectives in Life Cycle Impact Assessment; A Structured approach to combine models of technosphere, ecosphere and Valuesphere”. Kluwers Academic Publishers