electrostatic and dielectric measurements for hair ...€¦ · recently, the interest in hair...
TRANSCRIPT
Abstract—In recent years, the hair building fiber has become
popular, in other words, it is an effective method which helps people
who suffer hair loss or sparse hair since the hair building fiber is
capable to create a natural look of simulated hair rapidly. In the
markets, there are a lot of hair fiber brands that have been designed to
formulate an intense bond with hair strands and make the hair appear
more voluminous instantly. However, those products have their own
set of properties. Thus, in this report, some measurement techniques
are proposed to identify those products. Up to five different brands of
hair fiber are tested. The electrostatic and dielectric properties of the
hair fibers are macroscopically tested using design DC and high
frequency microwave techniques. Besides, the hair fibers are
microscopically analysis by magnifying the structures of the fiber
using scanning electron microscope (SEM). From the SEM photos,
the comparison of the uniformly shaped and broken rate of the hair
fibers in the different bulk samples can be observed respectively.
Keywords—Hair fiber, electrostatic, dielectric properties, broken
rate, microwave techniques.
I. INTRODUCTION
AIR loss has become a common issue for the public
nowadays, which is influenced by age, disease, and a
wide variety of other factors. Recently, the interest in hair
building fiber has increased because it is able to conceal hair
loss within 30 seconds by spreading the fiber on the hair. The
fiber will be tied to every existing individual strand of hair
based on the electrostatic principles which can result more
voluminous hair [1], [8]. In the markets, there are a lot of hair
fiber brands that have been designed to formulate an intense
bond with hair strands. However, those products have their
own set of properties. Thus, in this work, some measurement
techniques are proposed to identify those hair fibers. Up to
five different brands of hair fiber are tested, namely BioTHIK,
SMH, Nanogen, Toppik and XFussion. The hair fibers are
microscopically analysis by magnifying the structures of the
fiber using scanning electron microscope (SEM). From the
SEM photos, the comparison of the uniformly shaped and
broken rate of the hair fibers in the different bulk samples can
be observed respectively. Besides, the electrostatic and
dielectric properties of the hair fibers are macroscopically
tested using design DC and high frequency microwave
techniques. In this work, the dielectric properties of the hair
fiber has been measured in the microwave frequency range,
since the microwave signal often circulate around our daily
K. Y. You and Y. L. Then are with the Communication Engineering
Department, Faculty of Electrical Engineering, Universiti Teknologi Malaysia, 81310 UTM Skudai, Malaysia (e-mail: [email protected],
life, such as the signal generated from mobile phone and WiFi
internet server. The measurement methods and results analysis
will be described in Sections III, IV and V, respectively.
II. ELECTROSTATIC AND DIELECTRIC PROPERTIES OF HAIR
FIBER
Basically, the performance of the hair fiber is measured
based on its charge density which allow the fiber to be
attached to the real human hair [1]. In fact, the total amount of
charge in the fiber is often changing depends on the fiber
conditions and the environmental conditions [4]. As a matter
of fact, the amount of charge on the fiber can be increased by
shaking the fiber in the container before the fiber is used.
Friction between the fiber and the inner wall of the container
will generate an additional frictional charge on the fiber.
In this study, all fiber samples are measured without
performing any shaking, so that the measurement results will
be more consistent and precise. The charges on the hair fiber
at DC stage is determined based on the measured voltage, V
(in unit Volt) and measured capacitance, C (in unit Farad) of
the hair fiber. The relationship between the accumulated
charge, Q, voltage, V and capacitance, C is given as:
Q V C= × (1)
The capacitance, C in (1) is the parameter to measure the
ability of the hair bulk fiber to store an electrical charge. The
value of the capacitance, C, which is higher indicates that
more charges can be stored in the bulk fiber.
According to electrostatic theory, the capacitance, C is
directly proportional to the dielectric properties of the fiber.
Thus, indirectly, the performance of the fiber can also be
referred to the dielectric properties of the bulk fiber. The
dielectric properties are quantitatively represented by the value
of relative permittivity, εr, which is written as:
rrr jεεε ′′−′= (2)
where the real part, εr’ is the dielectric constant and imaginary
part, εr” is the dielectric loss factor. The dielectric constant, εr’
influences the electric field distribution and the phase of
waves traveling through the fiber. In contrast, the loss factor,
εr” influences the energy absorption or attenuation of the fiber.
From the loss factor, εr”, the conductivity, σ of the five types
of the hair fibers can be relatively compared, since the loss
factor at low frequencies, f (f < 2 GHz) is mainly contributed
by the conductivity of the hair fiber. The relationship between
the conductivity, σ (in unit S/m) and the loss factor, εr” is
given as:
Electrostatic and Dielectric Measurements for Hair
Building Fibers from DC to Microwave Frequencies K. Y. You, Y. L. Then
H
World Academy of Science, Engineering and TechnologyInternational Journal of Electrical, Computer, Energetic, Electronic and Communication Engineering Vol:9, No:3, 2015
312International Scholarly and Scientific Research & Innovation 9(3) 2015 scholar.waset.org/1999.5/10000730
Inte
rnat
iona
l Sci
ence
Ind
ex, M
edic
al a
nd H
ealth
Sci
ence
s V
ol:9
, No:
3, 2
015
was
et.o
rg/P
ublic
atio
n/10
0007
30

2 o rfσ π ε ε ′′= (for f < 2 GHz) (3)
where εo (≈ 8.854187817 × 10⁻¹²
F/m) is the permittivity of
free space. The conductivity, σ of the fiber can contribute to
the perpendicular fiber binding effect. This means that every
individual rod fiber can conduct opposite charge between both
ends of the rod. One end of the rod fiber can bind to the
human hair whilst other end will be repelled from the human
hair and produce the perpendicular arrangement [1].
III. SCANNING ELECTRON MICROSCOPE ANALYSIS
(a) BioTHIK (b) SMH
(c) Nanogen (d) Toppik
(e) XFusion
Fig. 1 SEM images of the distribution of hair fiber with 100-fold
magnification
The structure of the five fibers is magnified up to ×100 and
×1000, respectively, using Hitachi TM 3000 Tabletop
Scanning Electron Microscope (SEM) as shown in Figs. 1 and
2, respectively. Fig. 1 shows that the fiber distribution of the
SMH is more compact compared to other fiber. Among the
five types of fibers, XFusion shows the highest broken rates.
The magnified images (×1000) reveal that the fiber structure
of BioTHIK is very similar to SMH and both fiber rods have
uniform shape. On the other hand, the fiber structure of
Nanogen is similar to Xfussion. In addition, the Nanogen fiber
rod is quite similar to the structure of the actual human hair.
(a) Normal human hair structure [2]
(b) BioTHIK (c) SMH
(d) Nanogen (e) Toppik
(f) XFusion
Fig. 2 Comparison between the human hair [2] and the simulated hair
fiber structures
World Academy of Science, Engineering and TechnologyInternational Journal of Electrical, Computer, Energetic, Electronic and Communication Engineering Vol:9, No:3, 2015
313International Scholarly and Scientific Research & Innovation 9(3) 2015 scholar.waset.org/1999.5/10000730
Inte
rnat
iona
l Sci
ence
Ind
ex, M
edic
al a
nd H
ealth
Sci
ence
s V
ol:9
, No:
3, 2
015
was
et.o
rg/P
ublic
atio
n/10
0007
30

IV. DC ELECTROSTATIC MEASUREMENTS
In this work, the charge, Q on the hair fiber is measured
using designed capacitance sensor as shown in Fig. 3.
Fig. 3 Cross-sectional view of the capacitance sensor with labeled
dimensions
The sensor consists of two circular metallic plates (Brass)
with 3 cm of radius, two plate clampers (Nylon) and one
sample holder cover (Nylon) as shown in Fig. 4. Up to 19.64
cm3 of fiber sample is required to be fully filled into the
sample holder with 1 cm height (at the center of the gap
between the two metallic plates). The sensor which filled with
fiber sample, is connected to Fluke 289 multi-meter via test
probe and test lead as shown in Fig. 5.
The DC voltage difference, V (mV) and capacitance, C (nF)
between the two metallic plates with filled fiber samples are
respectively measured. The measurements are recorded in 15
minutes period and the average values are recorded as listed in
Table I. From the measured V and C, the accumulated charge,
Q (pC) on the surface of the metallic plate can be calculated
using (1). In addition, the DC relative dielectric constant, εr of
the fiber can be interpreted as:
sample
r
empty
C
Cε = (4)
where the Cempty and Csample are the empty-filled and fiber
sample-filled measured capacitance, respectively. From the
measurement results, the BioTHIK hair fiber shows the ability
to store the charge is much higher compared to other fibers at
DC stage. TABLE I
MEASURED V, C, Q AND ΕR AT DC STAGE
Brand
V
(±0.01 mV) C
(±0.001 nF)
V (mV)
(typ)
C (nF)
(typ)
Q = V×
C (pC) εr
Empty 0.03-0.05 0.043 - 0.048 0.04 0.046 0.0018 1
BioTHIK 40 - 70 200 - 400 55 300 16500 6522
SMH 45 - 65 45 - 65 55 55 3025 1196
Nanogen 0.2 - 1 0.23 - 0.24 0.6 0.235 0.14 5.1
XFusion 0.1-0.3 0.148-0.173 0.2 0.16 0.032 3.5
Toppik 0.06-0.2 0.135-0.145 0.13 0.14 0.018 3.04
Capacitor plate (Brass)
Plate clamper (Nylon)
Sample holder
(a)
(b)
Fig. 4 (a) Sensor components (b) Sensor fabrication
(a)
Sample holder
(Nylon)
Capacitor plate (Brass)
Plate clamper
(Nylon)
Capacitor plate
(Brass)
Plate clamper
(Nylon)
Screw
Fluke 289
multi-meter Keysight
U1733C
LCR meter
Test probe
Test probe
Sensor
World Academy of Science, Engineering and TechnologyInternational Journal of Electrical, Computer, Energetic, Electronic and Communication Engineering Vol:9, No:3, 2015
314International Scholarly and Scientific Research & Innovation 9(3) 2015 scholar.waset.org/1999.5/10000730
Inte
rnat
iona
l Sci
ence
Ind
ex, M
edic
al a
nd H
ealth
Sci
ence
s V
ol:9
, No:
3, 2
015
was
et.o
rg/P
ublic
atio
n/10
0007
30

(b) (c)
Fig. 5 (a) Sensor without sample (b) Sensor filled with fiber sample
(c) Experimental set-up
V. LOSS FREQUENCY CAPACITANCE AND DIELECTRIC
MEASUREMENTS
(a)
(b)
Fig. 6 (a) Cross-sectional view of capacitor sensor (b) The series
combination for the measured ideal capacitance, Cideal and the
measured series resistance, ESR is equivalent to the actual
capacitance, Cactual of the hair fibers
In this measurement, the Fluke 289 multi-meter which
connected to the sensor, is replaced by Keysight (formerly
Agilent) U1733C handheld LCR meter. The capacitance
measurement is referred to as an ideal capacitance, Cideal in
series with a resistance so-called equivalent series resistance
(ESR) as shown in Fig. 6 (b). However, the given output
measurement is in term of Cideal , ESR and phase angle, θc as
tabulated in Table II. The relationship between the Cideal, ESR
and θc are described in Fig. 6.
The series combination of ESR and Cideal can be written in
term of impedance, Z as [6]:
1
ESRideal
Z jCω
= − (5)
On the other hand, the actual impedance, Z of the hair fiber
sample is represented as:
1
actual
Z jCω
= − (6)
In fact, the value of Cactual in (6) is a complex number as:
actual actual actualC C jC′ ′′= − (7)
The vector diagram for (5) and (6) is shown in Fig. 7.
TABLE II RAW MEASUREMENT DATA FOR HAIR FIBER USING U1733C LCR METER
f (Hz) Empty BioTHIK
Cideal (pF) θc (o) ESR (MΩ) Cideal (pF) θc (
o) ESR (MΩ)
100 22 -82.0 9.94 22000 -9.3 0.44
1k 22 -86.5 0.43 1858 -13.4 0.36
10k 20.3 -86.9 0.041 110.7 -44.4 0.15
100k 19 -89.9 0.0014 40.5 -70.4 0.014
SMH Nanogen
100 9590 -9.2 1.02 31.5 -70 18.4
1k 450 -25.2 0.75 26 -83.5 0.70
10k 65 -57 0.16 25 -86.5 0.039
100k 31.8 -72 0.016 23.5 -89.0 0.0012
Toppik XFusion
100 27.5 -81 9.2 28 -78 12.1
1k 26 -86 0.43 26 -85.5 0.48
10k 24.6 -87 0.034 24 -87 0.035
100k 23 -89.3 0.0021 22.5 -89.4 0.00074
Fig. 7 Vector diagram of the impedance, Z
( )
actual
actual actual
j
C
j
C jC
ω
ω
−
= −′ ′′−
ESR
i d e a l
j
Cω−
θc
Metallic plate Metallic plate
Metallic plate Metallic plate
ESR
Cideal
Cactual
To ground terminal of LCR meter
Hair fiber sample
To positive terminal of LCR meter
Nylon
Metallic plate (Brass)
Metallic plate (Brass)
Empty (εr = 1) Fiber sample
World Academy of Science, Engineering and TechnologyInternational Journal of Electrical, Computer, Energetic, Electronic and Communication Engineering Vol:9, No:3, 2015
315International Scholarly and Scientific Research & Innovation 9(3) 2015 scholar.waset.org/1999.5/10000730
Inte
rnat
iona
l Sci
ence
Ind
ex, M
edic
al a
nd H
ealth
Sci
ence
s V
ol:9
, No:
3, 2
015
was
et.o
rg/P
ublic
atio
n/10
0007
30

Appling (7) in (6), yields,
( )
( ) ( ) ( ) ( ) 2 2 2 2
1
actual actual
actual actual
actual actual actual actual
Z jC jC
C jC
C C C C
ω
ω ω
= −′ ′′−
′′ ′= −
′ ′′ ′ ′′+ +
(8)
Through the comparison of (5) and (8), the ESR and Cideal can
be written as:
( ) ( ) 2 2ESR actual
actual actual
C
C Cω
′′=
′ ′′+ (9)
and
( ) ( )2 2
actual actual
ideal
actual
C CC
C
′ ′′+=
′ (10)
Finally, the C’actual and C”actual can be obtained by solving
(9) and (10) simultaneously with aid of data in Table II, as
shown in Fig. 8. The C’actual and C”actual can be interpreted in
relative permittivity, εr as:
( ) ( )
( ) ( )
actual sample actual sample
r
actual empty actual empty
C jC
C jCε
′ ′′−=
′ ′′− (11)
102
103
104
105
10-11
10-10
10-9
f (Hz)
C , (
F)
Empty
BioTHIK
SMH
Nanogen
Toppik
XFussion
102
103
104
105
10-14
10-12
10-10
10-8
f (Hz)
C ,,
(F
)
Empty
BioTHIK
SMH
Nanogen
Toppik
XFussion
102
103
104
105
0
10
20
30
40
50
f (Hz)
ε r ,
Empty
BioTHIK
SMH
Nanogen
Toppik
102
103
104
105
-50
0
50
100
150
200
f (Hz)
ε r ,,
Empty
BioTHIK
SMH
Nanogen
Toppik
Fig. 8 Results of C′, C″, εr′ and εr″ versus operating frequency, f
VI. MICROWAVE FREQUENCY DIELECTRIC MEASUREMENTS
The relative permittivity, εr, of the hair fiber sample which
filled in a 5 cm length of coaxial waveguide are obtained by
measuring the reflection coefficient, S11, and the transmission
coefficient, S21 [5], [7], [9]. The structure, material and
dimension of the coaxial waveguide used in the measurements
is shown in Fig. 9.
(a)
World Academy of Science, Engineering and TechnologyInternational Journal of Electrical, Computer, Energetic, Electronic and Communication Engineering Vol:9, No:3, 2015
316International Scholarly and Scientific Research & Innovation 9(3) 2015 scholar.waset.org/1999.5/10000730
Inte
rnat
iona
l Sci
ence
Ind
ex, M
edic
al a
nd H
ealth
Sci
ence
s V
ol:9
, No:
3, 2
015
was
et.o
rg/P
ublic
atio
n/10
0007
30

(b)
(c)
(d)
Fig. 9 (a) Components of coaxial waveguide (b) Fully-filled hair
sample in coaxial line (c) Experimental setup (d) Dimension of
coaxial waveguide
The linear magnitude, |S11|, |S21|, and the phase shift, Ø21, for
air and the hair fiber samples are measured with an Agilent
E5071C vector network analyzer (VNA) from 0.5 GHz to 5
GHz. In Fig. 10, the 11| |SampleS and
21| |SampleS are the measured
linear magnitudes of the reflection coefficient and the
transmission coefficient for the sample, respectively. On the
other hand, the 21
Airφ (in radians) and 21
Sam pleφ are the
transmission phase shift of air and hair fiber sample,
respectively.
(a) Step 1: Measure the 21
A irφ of the air-filled coaxial line
(b) Step 2: Measure the11| |Sample
S , 21| |SampleS and
2 1
S am pleφ of the fiber-
filled coaxial line
Fig. 10 The measurement steps of hair fiber
Once the values of measured 11| |SampleS ,
21| |SampleS ,
21
A irφ and
2 1
S a m p leφ are obtained, the dielectric constant, εr′ , and the loss
factor, εr″, of the fiber sample can be determined as:
2
221 21
2
1Air Sample
o Sr S
o S
k d
k d
φ φε α
− + ′ = −
(12)
21 21
2
2 Air Sample
S o sr
o S
k d
k d
α φ φε
− +′′ =
(13)
The attenuation, αS due to the fiber sample is calculated as:
( )2 2
10 11 21
1.15129254log Sample Sample
S
S
S Sd
α ≈ − + (14)
where ko is the propagation constant of the air-filled coaxial
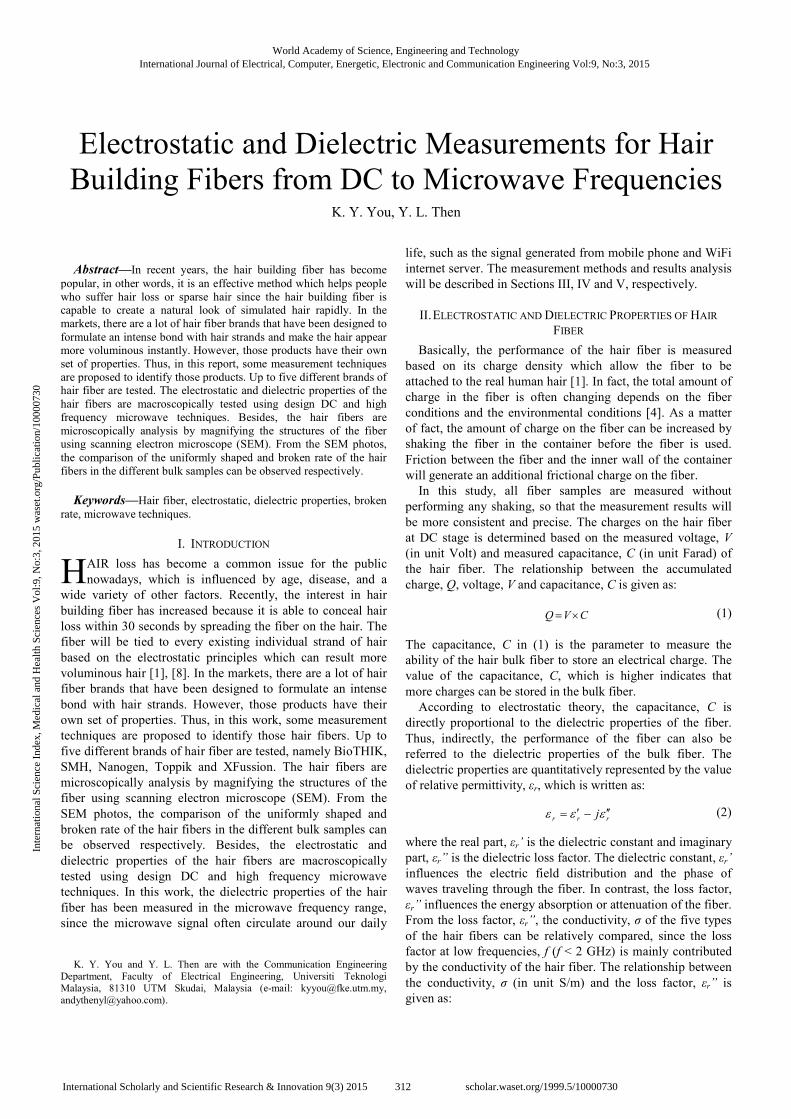
waveguide. The calculated εr’ and εr” for the five kinds of hair
fibers are shown in Fig. 11.
VII. DIELECTRIC MEASUREMENTS USING KEYSIGHT 85070D
DIELECTRIC PROBE
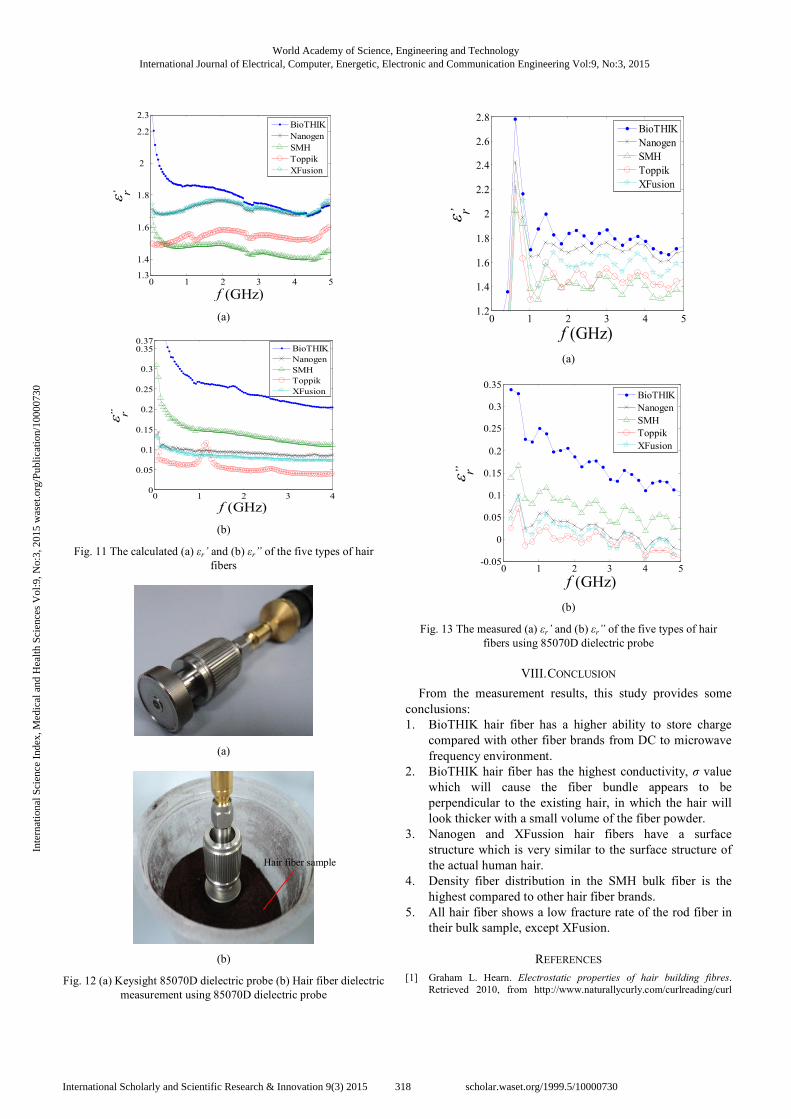
The Agilent 85070D dielectric probe [3] is used to measure
the dielectric properties of hair fiber from 300 MHz and 5
GHz at room temperature (25 ± 1)°C, as shown in Fig. 12. The
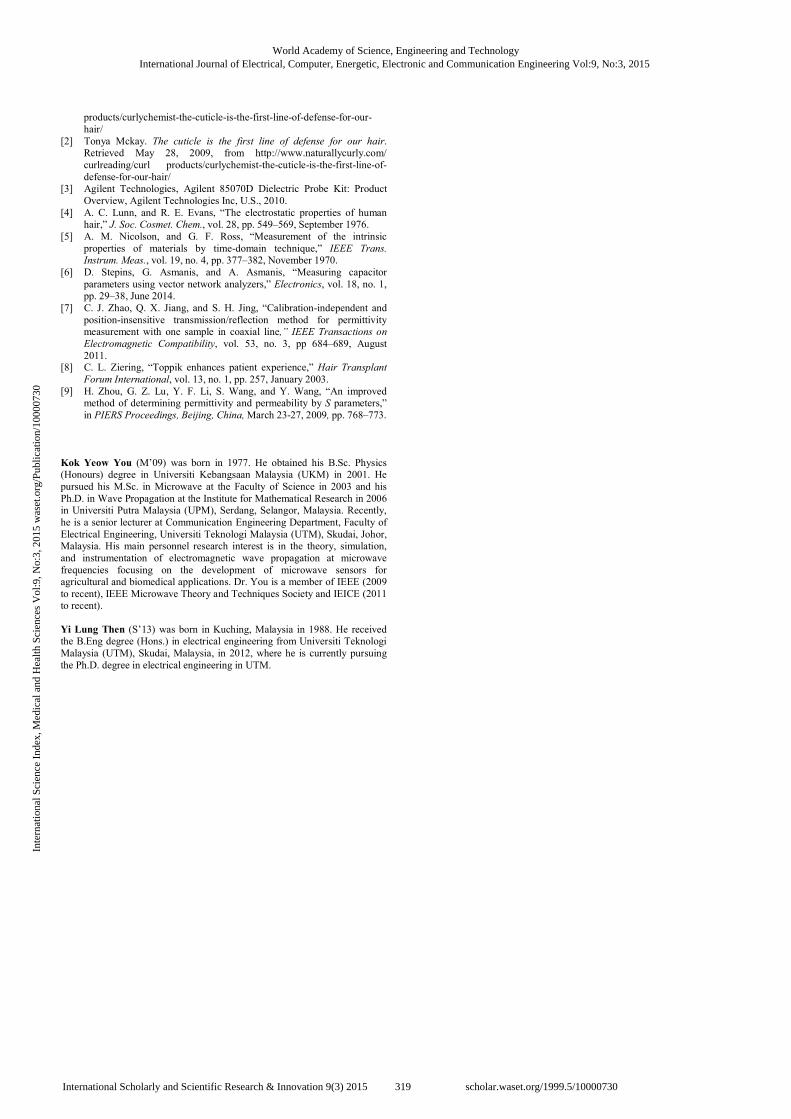
measurement results for the five types of hair fibers are shown
in Fig. 13, in which the results are in good agreement with the
calculated εr’ and εr” in Fig. 11.
Copper
N-type
connector
Connect to
post S11
Connect to
post S21
ds = 5 cm
N-type
connector
World Academy of Science, Engineering and TechnologyInternational Journal of Electrical, Computer, Energetic, Electronic and Communication Engineering Vol:9, No:3, 2015
317International Scholarly and Scientific Research & Innovation 9(3) 2015 scholar.waset.org/1999.5/10000730
Inte
rnat
iona
l Sci
ence
Ind
ex, M
edic
al a
nd H
ealth
Sci
ence
s V
ol:9
, No:
3, 2
015
was
et.o
rg/P
ublic
atio
n/10
0007
30
0 1 2 3 4 51.3
1.4
1.6
1.8
2
2.2
2.3ε , r
f (GHz)
BioTHIK
Nanogen
SMH
Toppik
XFusion
(a)
0 1 2 3 40
0.05
0.1
0.15
0.2
0.25
0.3
0.350.37
ε ,,
r
f (GHz)
BioTHIK
Nanogen
SMH
Toppik
XFusion
(b)
Fig. 11 The calculated (a) εr’ and (b) εr” of the five types of hair
fibers
(a)
(b)
Fig. 12 (a) Keysight 85070D dielectric probe (b) Hair fiber dielectric
measurement using 85070D dielectric probe
0 1 2 3 4 51.2
1.4
1.6
1.8
2
2.2
2.4
2.6
2.8
ε , r
f (GHz)
BioTHIK
Nanogen
SMH
Toppik
XFusion
(a)
0 1 2 3 4 5-0.05
0
0.05
0.1
0.15
0.2
0.25
0.3
0.35
ε ,,
r
f (GHz)
BioTHIK
Nanogen
SMH
Toppik
XFusion
(b)
Fig. 13 The measured (a) εr’ and (b) εr” of the five types of hair
fibers using 85070D dielectric probe
VIII. CONCLUSION
From the measurement results, this study provides some
conclusions:
1. BioTHIK hair fiber has a higher ability to store charge
compared with other fiber brands from DC to microwave
frequency environment.
2. BioTHIK hair fiber has the highest conductivity, σ value
which will cause the fiber bundle appears to be
perpendicular to the existing hair, in which the hair will
look thicker with a small volume of the fiber powder.
3. Nanogen and XFussion hair fibers have a surface
structure which is very similar to the surface structure of
the actual human hair.
4. Density fiber distribution in the SMH bulk fiber is the
highest compared to other hair fiber brands.
5. All hair fiber shows a low fracture rate of the rod fiber in
their bulk sample, except XFusion.
REFERENCES
[1] Graham L. Hearn. Electrostatic properties of hair building fibres.
Retrieved 2010, from http://www.naturallycurly.com/curlreading/curl
Hair fiber sample
World Academy of Science, Engineering and TechnologyInternational Journal of Electrical, Computer, Energetic, Electronic and Communication Engineering Vol:9, No:3, 2015
318International Scholarly and Scientific Research & Innovation 9(3) 2015 scholar.waset.org/1999.5/10000730
Inte
rnat
iona
l Sci
ence
Ind
ex, M
edic
al a
nd H
ealth
Sci
ence
s V
ol:9
, No:
3, 2
015
was
et.o
rg/P
ublic
atio
n/10
0007
30
products/curlychemist-the-cuticle-is-the-first-line-of-defense-for-our-
hair/
[2] Tonya Mckay. The cuticle is the first line of defense for our hair. Retrieved May 28, 2009, from http://www.naturallycurly.com/
curlreading/curl products/curlychemist-the-cuticle-is-the-first-line-of-
defense-for-our-hair/ [3] Agilent Technologies, Agilent 85070D Dielectric Probe Kit: Product
Overview, Agilent Technologies Inc, U.S., 2010.
[4] A. C. Lunn, and R. E. Evans, “The electrostatic properties of human hair,” J. Soc. Cosmet. Chem., vol. 28, pp. 549–569, September 1976.
[5] A. M. Nicolson, and G. F. Ross, “Measurement of the intrinsic
properties of materials by time-domain technique,” IEEE Trans. Instrum. Meas., vol. 19, no. 4, pp. 377–382, November 1970.
[6] D. Stepins, G. Asmanis, and A. Asmanis, “Measuring capacitor
parameters using vector network analyzers,” Electronics, vol. 18, no. 1, pp. 29–38, June 2014.
[7] C. J. Zhao, Q. X. Jiang, and S. H. Jing, “Calibration-independent and
position-insensitive transmission/reflection method for permittivity measurement with one sample in coaxial line,” IEEE Transactions on
Electromagnetic Compatibility, vol. 53, no. 3, pp 684–689, August
2011. [8] C. L. Ziering, “Toppik enhances patient experience,” Hair Transplant
Forum International, vol. 13, no. 1, pp. 257, January 2003.
[9] H. Zhou, G. Z. Lu, Y. F. Li, S. Wang, and Y. Wang, “An improved method of determining permittivity and permeability by S parameters,”
in PIERS Proceedings, Beijing, China, March 23-27, 2009, pp. 768–773.
Kok Yeow You (M’09) was born in 1977. He obtained his B.Sc. Physics (Honours) degree in Universiti Kebangsaan Malaysia (UKM) in 2001. He
pursued his M.Sc. in Microwave at the Faculty of Science in 2003 and his
Ph.D. in Wave Propagation at the Institute for Mathematical Research in 2006 in Universiti Putra Malaysia (UPM), Serdang, Selangor, Malaysia. Recently,
he is a senior lecturer at Communication Engineering Department, Faculty of
Electrical Engineering, Universiti Teknologi Malaysia (UTM), Skudai, Johor, Malaysia. His main personnel research interest is in the theory, simulation,
and instrumentation of electromagnetic wave propagation at microwave
frequencies focusing on the development of microwave sensors for agricultural and biomedical applications. Dr. You is a member of IEEE (2009
to recent), IEEE Microwave Theory and Techniques Society and IEICE (2011 to recent).
Yi Lung Then (S’13) was born in Kuching, Malaysia in 1988. He received the B.Eng degree (Hons.) in electrical engineering from Universiti Teknologi
Malaysia (UTM), Skudai, Malaysia, in 2012, where he is currently pursuing
the Ph.D. degree in electrical engineering in UTM.
World Academy of Science, Engineering and TechnologyInternational Journal of Electrical, Computer, Energetic, Electronic and Communication Engineering Vol:9, No:3, 2015
319International Scholarly and Scientific Research & Innovation 9(3) 2015 scholar.waset.org/1999.5/10000730
Inte
rnat
iona
l Sci
ence
Ind
ex, M
edic
al a
nd H
ealth
Sci
ence
s V
ol:9
, No:
3, 2
015
was
et.o
rg/P
ublic
atio
n/10
0007
30