electrospinning of ceramic solid electrolyte nanowires for · electrospinning of ceramic solid...
TRANSCRIPT

Electrospinning of Ceramic Solid Electrolyte Nanowires for
Lithium-Ion Batteries with Enhanced Ionic Conductivity
by
Ting Yang
A Dissertation Presented in Partial Fulfillment
of the Requirements for the Degree
Doctor of Philosophy
Approved November 2016 by the
Graduate Supervisory Committee:
Candace K. Chan, Chair
Peter Crozier
Jerry Y.S. Lin
ARIZONA STATE UNIVERSITY
May 2017

i
ABSTRACT
Solid electrolytes have great potential to address the safety issues of Li-ion
batteries, but better synthesis methods are still required for ceramics electrolytes such as
lithium lanthanum titanate (LLTO) and lithium lanthanum zirconate (LLZO). Pellets
made from ceramic nanopowders using conventional sintering can be porous due to the
agglomeration of nanoparticles (NPs). Electrospinning is a simple and versatile technique
for preparing oxide ceramic nanowires (NWs) and was used to prepare electrospun LLTO
and LLZO NWs. Pellets prepared from the electrospun LLTO NWs had higher density,
less void space, and higher Li+ conductivity compared to those comprised of LLTO
prepared with conventional sol-gel methods, which demonstrated the potential that
electrospinning can provide towards improving the properties of sol-gel derived ceramics.
Cubic phase LLZO was stabilized at room temperature in the form of electrospun NWs
without extrinsic dopants. Bulk LLZO with tetragonal structure was transformed to the
cubic phase using particle size reduction via ball milling. Heating conditions that
promoted particle coalescence and grain growth induced a transformation from the cubic
to tetragonal phase in both types of nanostructured LLZO. Composite polymer solid
electrolyte was fabricated using LLZO NWs as the filler and showed an improved ionic
conductivity at room temperature. Nuclear magnetic resonance studies show that LLZO
NWs partially modify the polymer matrix and create preferential pathways for Li+
conduction through the modified polymer regions. Doping did not have significant effect
on improving the overall conductivity as the interfaces played a predominant role. By
comparing fillers with different morphologies and intrinsic conductivities, it was found
that both NW morphology and high intrinsic conductivity are desired.

ii
ACKNOWLEDGEMENTS
I would like to thank my advisor, Prof. Candace Chan, for her instructions, and all
the Chan group members.
I would like to thank my committee members, Prof. Peter Crozier and Prof. Jerry
Lin, for their time and suggestions.
We gratefully acknowledge the use of facilities within the LeRoy Eyring Center
for Solid State Science and Goldwater Environmental Laboratory at Arizona State
University, and all the staff for their kind assistance. Funding from the National Science
Foundation (DMR-1553519) is greatly appreciated.
We gratefully thank Jin Zheng and Prof. Yan-Yan Hu at Florida State University
and the National High Magnetic Field Laboratory for performing the NMR
measurements and 6Li symmetric cell cycling, as well as the valuable discussion.
I would like to thank all my friends for their help, understanding and
encouragement.
Most importantly, I would like to thank my parents for their love and support.

iii
TABLE OF CONTENTS
Page
LIST OF TABLES ............................................................................................................. vi
LIST OF FIGURES .......................................................................................................... vii
CHAPTER
I: BACKGROUND ............................................................................................................. 1
1.1. Introduction .......................................................................................................... 1
1.2. Lithium-ion Batteries ........................................................................................... 2
1.2.1. Safety Issues with Lithium-ion Batteries .......................................................4
1.3. Solid Electrolytes for Lithium-ion Batteries ........................................................ 6
1.3.1. Inorganic Solid Electrolytes ..........................................................................7
1.3.2. Polymer Solid Electrolytes ............................................................................8
1.3.3. Composite Solid Electrolytes ........................................................................9
1.3.4. Parameters for Evaluating Solid Electrolytes ................................................9
1.4. One-Dimensional Nanomaterials as Solid Electrolytes ..................................... 17
1.5. Characterization Techniques .............................................................................. 19
1.5.1. X-ray Diffraction .........................................................................................19
1.5.2. Scanning Electron Microscopy ....................................................................21
1.5.3. Transmission Electron Microscopy .............................................................22
1.5.4. Inductively Coupled Plasma Optical Emission Spectrometry .....................23
1.6. Electrochemical Measurement Technique ......................................................... 23
1.6.1. Electrochemical Impedance Spectroscopy ..................................................24
iv
CHAPTER Page
1.7. Electrospinning................................................................................................... 28
1.7.1. Electrospinning of Oxide Materials .............................................................32
II: ELECTROSPINNING OF LITHIUM LANTHANUM TITANATE.......................... 34
2.1. Introduction ........................................................................................................ 34
2.2. Experimental ...................................................................................................... 35
2.2.1. Synthesis of LLTO ......................................................................................35
2.2.2. Materials Characterization ...........................................................................36
2.2.3. Ionic Conductivity Measurements ...............................................................37
2.3. Results and Discussion ....................................................................................... 38
2.4. Conclusions ........................................................................................................ 51
III: ELECTROSPINNING OF LITHIUM LANTHANUM ZIRCONATE ..................... 53
3.1. Introduction ........................................................................................................ 53
3.2. Experimental ...................................................................................................... 55
3.2.1. Synthesis of LLZO Nanowires ....................................................................55
3.2.2. Synthesis of Bulk LLZO ..............................................................................56
3.2.3. Materials Characterization ...........................................................................57
3.3. Results and Discussion ....................................................................................... 57
3.4. Conclusions ........................................................................................................ 73
IV: COMPOSITE POLYMER ELECTROLYTE WITH LLZO NANOWIRE FILLERS
........................................................................................................................................... 74
4.1. Introduction ........................................................................................................ 74
4.2. Experimental ...................................................................................................... 76

v
CHAPTER Page
4.2.1. Preparation of LLZO Sol-gel Precursor ......................................................76
4.2.2. Electrospinning of LLZO Nanowires ..........................................................77
4.2.3. Preparation of LLZO Nanoparticles ............................................................77
4.2.4. Preparation of Composite Electrolyte ..........................................................78
4.2.5. Materials Characterization ...........................................................................79
4.2.6. Electrochemical Characterization ................................................................79
4.2.7. Galvanostatic Cycling ..................................................................................80
4.2.8. NMR Characterization .................................................................................80
4.3. Results and Discussion ....................................................................................... 81
4.4. Conclusions ........................................................................................................ 97
V: SUMMARY ................................................................................................................. 99
REFERENCES ............................................................................................................... 100
APPENDIX
A: PERMISSIONS FROM ALL CO-AUTHORS...................................................... 114
B: LIST OF PUBLICATIONS ................................................................................... 116

vi
LIST OF TABLES
Table Page
1. Impedance Analysis Results of Both Conventional Sol-Gel and Electrospun LLTO
Samples………………………………………………………………………................. 45
2. Ionic Conductivities (S/cm) Calculated from Fitted Impedance Data of Two LLTO
Samples………………………………………………………………………................. 46
3. Ionic Conductivity of Different Samples at 20 °C………………………………........ 89

vii
LIST OF FIGURES
Figure Page
1. Schematic of the Brick-Layer Model .......................................................................... 25
2. (a) Schematic of an Ideal Nyquist Plot for Solid Electrolyte. (b) An Equivalent Circuit
of (a). ........................................................................................................................... 27
3. (a) Equivalent Circuit for a Typical Polycrystalline Sample. (b) Simplified Equivalent
Circuit of (a). ............................................................................................................... 27
4. Schematic of an Electrospinning Setup ...................................................................... 31
5. Electrospinning Setup Used in This Work.................................................................. 32
6. Crystal Structure of LLTO .......................................................................................... 35
7. Photographs of (a) As-Spun LLTO NW Mat Being Removed from the Collector, (b)
Free-Standing As-Spun LLTO Mat with Good Flexibility. SEM Image of LLTO NWs
(c) As-Spun, (d) After Calcination. (e) A Higher Magnification of (d) Showing the
NW Surfaces. (f) XRD Pattern of Electrospun LLTO NWs After Calcination with
P4/mmm Tetragonal Structure. ................................................................................... 39
8. XRD Pattern with Calculated Pattern from Rietveld Refinement of (a) Electrospun
LLTO NWs and (b) Conventional Sol-gel LLTO; (c) XRD Pattern Comparison of
Conventional Sol-gel LLTO vs. Electrospun LLTO NWs After Calcination. ........... 41
9. TEM Image of Calcined Electrospun LLTO NWs at (a) Low Magnification; (b) High
Magnification Showing Individual Grains. Inset Shows the Corresponding SAED
Pattern. HRTEM Image of (c) The Lattice Fringes and (d) GB Between Two Grains.
The Upper and Lower Inset Shows the FFT of the Upper and Lower Grain,
Respectively. ............................................................................................................... 42

viii
Figure Page
10. Nyquist Plots of LLTO Pellets Derived from Conventional Sol-gel vs. Electrospun
NWs, Normalized by Pellet Thickness in the (a) High Frequency Range and (b) Full
Frequency Range with Fitted Curves; Inset Shows the Equivalent Circuit Used for
Fitting. ......................................................................................................................... 44
11. (a) SEM Image of Bulk LLZO Powder. (b) SEM Image of the Same Powder in (a)
After Being Ball Milled. ............................................................................................. 49
12. Schematic Showing Agglomeration in NPs ................................................................ 49
13. Schematic Showing the Pellet Making Process with Different Starting Morphologies
..................................................................................................................................... 50
14. Cross-sectional SEM Image of Pellet Made of (a) Conventional Sol-gel LLTO and (b)
Electrospun LLTO. ..................................................................................................... 50
15. Crystal Structure of (a) Cubic Phase LLZO and (b) Tetragonal Phase LLZO ........... 55
16. SEM Image of (a) As-spun LLZO NWs and the NWs After Calcination at 700 °C for
(b) 1.5 h, (c) 2 h, (d) 2.5 h, (e) 3 h, (f) & (g) 5 h. (h) XRD Patterns Showing the Effect
of Calcination Time on the Product. ●: Unidentified Intermediate Phase; *: La2Zr2O7;
Light Blue: c-LLZO Phase; Dark Blue: Mixture of Tetragonal + Cubic LLZO Phases.
(i) Zoom-in of XRD Patterns Around 31°, Showing the Emergence of Peak Doublet
During Heating from 2.5 h to 5 h. ............................................................................... 59

ix
Figure Page
17. LLZO NWs from Nitrate-based Precursor. (a) Photograph of an As-spun LLZO Fiber
Mat. (b) SEM Image of As-spun LLZO NWs. (c) SEM Image of LLZO NWs After 3
h of Calcination at 700 °C. (d) XRD Patterns of LLZO NWs Calcined in Alumina and
Quartz Crucibles, Matching the HT-cubic LLZO Phase Shown as Reference. (●:
La2O3; *: La2Zr2O7) .................................................................................................... 60
18. (a) TEM Image of the Acetate-based NWs Calcined for 2.5 h, Showing One of the
Morphologies. Inset Is a Zoomed-in View Showing the La2Zr2O7 Crystals. (b) TEM
Image of One Branch in (a) Areas Indicated by Arrows Are Considered to Be a Li-
containing Amorphous Phase. Inset Is an HRTEM Image Showing the Lattice
Fringes. (c) TEM Image of the Same Sample Calcined for 2.5 h, Showing the Other
Morphology (LLZO Crystals). Inset Shows the HRTEM Image with Lattice Fringes.
..................................................................................................................................... 62
19. XRD Pattern of Bulk LLZO Calcined at 700 °C for 3 h, Showing a Mixture of Cubic
and Tetragonal LLZO. (●: La2O3) .............................................................................. 64
20. XRD Pattern of c-LLZO Derived from Electrospun NWs After 14-month Storage. . 67
21. XRD Patterns of Bulk LLZO Prepared from Nitrate-based Sol-gel (a) After Calcining
at 700 °C for 5 h, (b) After Ball Milling, (c) After 4-month Storage, (d) After
Annealing at 700 °C for 12 h. The Bulk LLZO Changed from Tetragonal to Cubic
after Ball Milling with the Re-emergence of t-LLZO After Heating. Tetragonal Peak
Doublets Are Marked with Arrows. (Dark Blue: t-LLZO; Light Blue: c-LLZO; ●:
La2O3; *: Artifact Peaks from Instrument) ................................................................. 67
22. EDS Spectrum Obtained in an SEM of the c-LLZO NW Sample. ............................. 68

x
Figure Page
23. Schematic of EIS Measurement in Oven .................................................................... 80
24. (a)-(h): SEM Images of Electrospun NWs. All Calcinations Were Performed at 700
°C (a) As-spun NWs. (b) c-LLZO NWs Prepared Using Water-based Precursor and
Calcined for 3 h. (c)-(h): c-LLZO NWs Prepared Using DMF-based Precursor and
Calcined for (c),(e),(g) 1 h or (d),(f),(h) 3 h. (c)-(d): Undoped LLZO; (e)-(f): Al-
LLZO; (g)-(h): Ta-LLZO. (i) TEM Image and (j) HRTEM Image of Undoped c-
LLZO NWs Prepared from DMF-based Precursor and Calcined for 1 h. Inset Is the
Corresponding SAED Pattern. .................................................................................... 83
25. (a) Diameter Distribution of the 1 h Calcined Undoped LLZO NWs. EDS Spectra of
(b) Al-LLZO and (c) Ta-LLZO, Both Calcined at 700 °C for 1 h. ............................ 84
26. XRD Patterns of LLZO NW Samples After Calcination for (a) 1 h and (b) 3 h at 700
°C; (c) Zoomed-in Patterns at the Region Around 52°. (*: La2Zr2O7; ●: La2O3) ...... 85
27. (a) SEM Image (Top-down View) of a CPE Film with 5 wt% Undoped LLZO NWs.
(b) Schematic of the EIS Test Setup. (c) Equivalent Circuit Used for EIS Data Fitting.
(d) Representative Nyquist Plots of CPEs Embedded with 5 wt% of Different Filler
Materials, All Tested at 20 °C and Normalized by Film Thickness. (e) Zoomed-in
View of the Region Marked by Dashed Lines in (d). (f) Ionic Conductivity
Comparison of CPEs Embedded with Different wt% of Undoped LLZO NWs at 20
°C, with the Conductivity of a Blank Sample for Reference. Each Point is the
Average of Three Measurements and the Error Bars Indicate the Standard Deviation.
(g) Arrhenius Plot of CPE with 5 wt% Undoped LLZO NWs. Each Point is the
Average of Two Measurements. ................................................................................. 87

xi
Figure Page
28. (a) Nyquist Plot of a Blank Sample Composed of 66.7 wt% PAN and 33.3 wt%
LiClO4, Tested at 20 °C. (b) Nyquist Plots of CPEs Embedded with Different wt% of
Undoped LLZO NWs, Tested at 20 °C and Normalized by Film Thickness. (c)
Nyquist Plots of Samples Embedded with 5 wt% Undoped LLZO NWs, Tested at
Different Temperatures and Normalized by Film Thickness. Inset Shows a Zoomed-
in View of the Region Marked by Dashed Lines. ....................................................... 88
29. Bulk Undoped LLZO After Ball Milling (BM-LLZO NPs): (a) SEM Image; (b) XRD
Patterns with c-LLZO Reference. The LLZO Adopted the c-LLZO Structure After
Ball Milling and Could Maintain this Structure Even After 4-month Storage. (*:
Artifact Peaks from Instrument) ................................................................................. 90
30. (a) Schematic Showing Possible Li+ Transport Pathways in the CPE. (b) 6Li NMR
Spectra of CPE Sample Containing 5 wt% Undoped LLZO NWs, Blank Sample with
Only PAN and LiClO4, and Undoped LLZO NW Powder. (c) 6Li NMR Spectra
Comparison Between the As-made (Pristine) and Cycled CPEs Containing 5 wt%
Undoped LLZO NWs. The Cycled CPE Had Undergone 10 Galvanostatic
Charge/discharge Cycles in a Symmetric 6Li Cell Using 7.2 µA/cm2. ....................... 93
31. Galvanostatic Cycling Data of a Symmetric 6Li Foil/CPE/6Li foil Cell. The Area of
6Li Electrodes Is 1.5386 cm2. The CPE Contains 5 wt% Undoped LLZO NWs. ...... 93
32. XRD Patterns of Blank Sample (PAN with 33.3 wt% LiClO4) and CPE Containing 5
wt% Undoped LLZO NWs, with c-LLZO for Reference. (*: Artifact Peaks from
Instrument) .................................................................................................................. 95

xii
Figure Page
33. (a) Li Symmetric Cell Galvanostatic Cycling Data of a CPE Sample Containing 5
wt% Undoped LLZO NWs. (b) The Tail Region of (a), Showing the Sudden Voltage
Drop. (c) Li Symmetric Cell Galvanostatic Cycling Data of a Blank Sample. (d) The
Tail Region of (c), Showing the Sudden Voltage Drop. ............................................. 97
34. Galvanostatic Cycling Data of a Blank Sample (PAN with 33.3 wt% LiClO4),
Showing the Cell Voltage and Current. ...................................................................... 97

1
I: BACKGROUND
1.1. Introduction
Electrical energy can be stored in many forms, such as mechanical, chemical,
thermal, nuclear, etc. In modern society, there has been a booming development and
popularity of portable electronics, and a rising trend for device miniaturization, posing a
high demand on batteries, which is the chemically stored form of electrical energy.
Laptop computers, cell phones, smart watches, Bluetooth devices… almost every gadget
is powered by batteries. Even for motor vehicles that are propelled by internal
combustion engines, batteries are needed to start the engine and to maintain the operation
of various electronic circuits within, and lead-acid batteries are still the dominant type
being used. Not to mention the growing production of all-electric cars, which drive
entirely on batteries. Technically speaking, cells are the building blocks of batteries, and
a battery is made by stacking two or more cells together, which is also why this device is
called a ‘battery’. A cell has three fundamental components: anode, cathode and
electrolyte. The materials chosen for the anode and cathode (the two electrodes) have the
property such that when they are in contact, a reduction-oxidation (redox) reaction will
take place spontaneously between them. In a redox reaction, the anode material is
oxidized, giving away electrons, and the cathode material accepts these electrons and
becomes reduced. However, by doing that alone does not provide us with electricity, as
all the electrons in the materials participated directly in the redox reaction. But if the two
electrodes are separated by a medium in which only ions can move across (electronically
insulating), and another electron-only connection is established between the two

2
electrodes, then the flow of electrons can be extracted and used by an external circuit, i.e.
chemical energy is converted to electrical energy. Such a medium is called the electrolyte,
which serves as an ion reservoir, ensuring charge balance and supplying reaction species.
When the cell is not in use, the two electrodes should be electronically disconnected to
prevent power dissipation.
Batteries are categorized into primary batteries and secondary batteries. Primary
batteries are of single-use and cannot be recharged after all the chemically stored energy
is depleted. Secondary batteries are also called rechargeable batteries, which means that
their charged state can be restored. This is done by selecting appropriate material
combinations with reversible redox reactions. To recharge the battery, an electrical bias
(voltage) is applied between the two electrodes, providing sufficient electrochemical
potential and electrons to reverse the redox reaction until the initial state is reached. It
should be pointed out that a good number of the redox reactions in the primary batteries
can actually be reversed as well. But doing that is either too expensive, or practically not
feasible. Among all the commercially available rechargeable batteries, our research is
focused on the electrolyte materials for lithium-ion batteries.
1.2. Lithium-ion Batteries
Lithium is the lightest metal and exhibits the highest oxidation potential, which
makes it an ideal material for batteries with the highest energy density.1 In 1976,
Whittingham reported the intercalation chemistry of lithium into a layered compound
(TiS2) and conceived a new type of reversible battery with high energy density2. Because
lithium metal was used as the anode, this type of battery can only be called a lithium

3
(metal) battery, but it nonetheless laid the very foundation for the development of
lithium-ion batteries. However, it was found out later that upon charging, lithium was
essentially being electrodepositing onto the anode non-uniformly, resulting in the
formation of lithium dendrites.3 The dendrites could keep growing after each charge-
discharge cycle, and at some point they could pierce through the separator (an
electronically insulating but ionically conducting material), putting the cathode and anode
in direct electrical contact and causing a short circuit to the battery. As the name suggests,
a short circuit means that it is the ‘shortest’ path for the electric current (electrons) to run
through. Therefore, the battery would discharge with a large current, generating a large
amount of heat due to Joule heating. This is extremely dangerous as the organic liquid
electrolyte and lithium metal in the battery are highly flammable, which could lead to fire
or even explosion.
It was discovered later that graphite, which is also a material with layered
structure, could also act as a host for Li+ intercalation.4 This means that the highly
reactive lithium metal can be replaced by graphite, leaving only Li+ in the system to ‘rock’
back and forth between the two electrodes. This type of battery is called a lithium-ion
batteries, and hence the term ‘rocking chair’ batteries. After that, some layered oxide
materials (e.g. LiCoO2) were also found to have intercalation chemistry, and much higher
operation voltage (electrochemical potential) than sulfides when used as the cathode,
allowing for higher energy density to be achieved.5,6 In 1991, Sony released the first
commercial lithium-ion battery, using graphite anode and LiCoO2 cathode.7 Nowadays, a
typical commercial lithium-ion battery still uses graphite as the anode, and lithium
transition metal oxides as the cathode. The most commonly used electrolyte is 1 M LiPF6

4
dissolved in a mixture of ethylene carbonate (EC, C3H4O3) and diethyl carbonate (DEC,
C5H10O3). The separator, usually a porous polymeric material, is placed in the electrolyte
between the anode and cathode. As mentioned earlier, the purpose of this separator is to
prevent short circuits caused by electrical contact between the two electrodes, while
allowing ions to pass through.8 Because of its light weight and high energy density, the
lithium-ion battery has become the prevailing battery type on the market, thanks to the
fast development and popularization of portable electronic devices. Most consumer
electronic devices today, such as cell phones, laptop computers, personal medical devices,
etc., are powered by lithium-ion batteries. Modern electric and hybrid vehicles also
utilize lithium-ion batteries as their primary source of energy.
1.2.1. Safety Issues with Lithium-ion Batteries
Although the lithium-ion battery has so many advantages and applications, some
inherent safety issues associated with the current design and material selection have
already caused a series of accidents. The two organic solvents (EC and DEC) used in the
liquid electrolyte are highly flammable by themselves, and their mixture has a flash point
lower than 30 °C.9,10 The flash point is the lowest temperature at which the vapor of a
flammable liquid can ignite in air. 30 °C is merely above room temperature, not to
mention that the device will heat up to even higher temperature during operation. As the
temperature rises, the internal vapor pressure builds up, sometimes causing the battery to
swell or bulge. When the battery’s external casing is no longer able to hold the pressure,
it will be ruptured and release the flammable gases. These high-temperature gases, upon
contact with air, can then catch fire and the whole battery will burn, or even explode in

5
some extreme cases. Another common fire hazard is a short circuit in the battery, which
is usually due to the failure of the separator. As already mentioned, short circuits generate
a large amount of heat, which accelerates the exothermic chemical reactions and
generates even more heat. This process is called thermal runaway and is analogous to a
chain reaction. Separator failure is typically caused by mechanical damage. For example,
if the battery is overcharged, lithium dendritic growth can take place, and continues as the
battery cycles, eventually breaching the separator. In some rare cases, the quality control
of the battery manufacturing is poor and some hard particles are accidentally introduced
into the battery, which can also puncture the separator after a certain number of cycles as
the battery expands and shrinks. Overheating is another major cause of separator failure,
which either softens the separator so that its mechanical strength is reduced and the
lithium dendrites take less effort to break through, or causes deformation of the separator
to widen some pores, providing extra room for the dendrites to grow.
According to the U.S. Consumer Product Safety Commission, almost all major
computer companies, especially Dell and HP, have recalled millions of laptop computer
batteries due to fire and burn hazard. In 2006, Sony recalled over 7 million defective
batteries that could lead to sudden ignition.11 Tesla Motor’s all-electric cars, which use
standard 18650 lithium-ion cells in the battery pack, have encountered multiple fire
accidents after running over debris.12 In 2013, the entire Boeing 787 Dreamliner fleet was
grounded due to problems caused by lithium-ion battery thermal runaway in the electrical
system.13 On October 10 2016, Samsung recalled all of its Galaxy Note7 cell phones due
to potential overheating and fire risk of the phone’s lithium-ion battery, which was less
than two months from the release date.14 Numerous (more than 40) incidents of phones

6
catching fire or even exploding were reported during that short period of time.
Preliminary investigations stated that the phone’s battery was faulty and caused the
insulation to fail, resulting in a short circuit and consequently rapid heating.
Approximately one million sold devices were affected, while about 2.5 million were
manufactured. All these incidents are pointing to the same demand – a safer design and
material selection for safer lithium-ion batteries.
1.3. Solid Electrolytes for Lithium-ion Batteries
There are many different approaches to deal with the flammability problem for
liquid electrolytes, but none of them can completely solve it so far. For instance, adding
flame retardant additives into the liquid electrolyte can make it less vulnerable to
catching fire, but often the performance is compromised as a trade-off. The viscosity of
the liquid electrolyte can be increased to lower the ion transfer speed, and hence the
current density is decreased in the external circuit to reduce heating, but this also means
less overall power. The electrochemical instability of the additives may also cause the
capacity to fade.10 Alternatively, this issue can be addressed by replacing the liquid
electrolyte with solid electrolyte, forming an all-solid-state battery.
Compared to liquid electrolytes, solid electrolytes generally offer reduced
flammability, better thermal and mechanical stability, and broader electrochemical
window. Additionally, most of them are electronic insulators, eliminating the need for a
separator.15–17 However, solid electrolytes typically suffer from low room temperature
ionic conductivity, which is an inherent issue due to the nature of solid-state ionic motion.
In order to be usable practically, the ionic conductivity of solid electrolytes have to be

7
comparable to that of the liquid electrolytes (~10-2 S/cm)18, or at least on the order of 10-3
S/cm.15 This criterion narrows the material selection down to a small number of
candidates, which will be briefly discussed in the following sections. Solid electrolytes
can be classified into inorganic solid electrolytes, polymer solid electrolytes and
composite solid electrolytes.17,19,20
1.3.1. Inorganic Solid Electrolytes
Inorganic solid electrolytes generally have better mechanical and thermal stability
over organic (polymer-based) electrolytes.21 Also, since many of them are electronic
insulators, they have the potential to completely eliminate the need for a separator, and
hence lower the total cost of batteries as the separator’s cost contributes nearly 25%.22,23
Nevertheless, there are still drawbacks with inorganic solid electrolyte materials, such as
low room temperature conductivity, and energy-consuming synthesis or processing
conditions. For example, the ionic conductivity of solid electrolytes is usually in the
range of 10-6 to 10-3 S/cm at room temperature.9 Some materials, especially oxides,
require high temperature synthesis, and some other materials need vacuum deposition
techniques. A number of different material classes have been studied, including sulfides,
oxides, oxynitrides (e.g. lithium phosphorus oxynitride, LIPON), NASICON-type
phosphates (Na Super Ionic CONductor) and LISICON-type materials (Li Super Ionic
CONductor).24,25 Among these materials, sulfides do not have very good chemical
stability, LIPON suffers from low room temperature ionic conductivity, NASICON-type
materials have good conductivity but are unstable against Li, and LISICON-type
materials have both low conductivity and stability.19 Some oxides, on the other hand,

8
either have exceptional room temperature conductivity, or are stable by themselves
and/or against Li.26 In this work, two oxide materials are of particular interest to us:
lithium lanthanum titanate (LLTO) and lithium lanthanum zirconate (LLZO). Detailed
studies will be presented in the following chapters.
1.3.2. Polymer Solid Electrolytes
For pure solid polymer electrolytes, their room temperature ionic conductivity is
too low (~10-6 S/cm) for practical use.27 The first reported polymer electrolytes with
reasonably high ionic conductivity were some polyethylene oxide (PEO) systems by
Wright et al.28 Later it was found that the addition of certain salts could amorphize some
polymers and form complexes, which helped promote the delocalization/dissociation of
the ions in the salts.29 The ions, especially the anions, then had more freedom to be
carried around by the segmental motion of the polymer chains. It was also discovered that
the amorphous regions in the polymer are actually contributing to ionic conduction.30 A
general material selection criterion is that the salt should have low lattice energy, and the
polymer should have high dielectric constant.31 Up till today, different systems with a
variety of polymer and salt combinations have been identified with satisfactory room
temperature ionic conductivity. The PEO-based systems are the most studied and
therefore are usually used as a model. Among all the polymer solid electrolytes, there is
one type that is of particular interest to us, which is the composite polymer solid
electrolyte. Sometimes another type of polymer electrolyte, called a gel electrolyte, is
counted as a polymer solid electrolyte; gel electrolytes are, essentially polymer soaked
with organic liquid electrolyte.29,31 Although significantly reduced compared to a battery

9
using solely liquid electrolyte, the amount of liquid electrolyte in the system is still
substantial and therefore the flammability problem is not fully addressed.
1.3.3. Composite Solid Electrolytes
Generally speaking, electrolytes that utilize two or more different types of
materials can all be categorized as composite electrolytes. Composite polymer electrolyte
is the most widely studied type of solid electrolyte, which is typically composed of a
polymer matrix and a small amount of inorganic solid particles as the filler, or in other
words, inorganic particles embedded in a polymer solid electrolyte.32,33 Sometimes when
ceramic NPs are used, it is also termed as the ‘nanocomposite polymer electrolyte’. The
overall ionic conductivity of the polymer matrix can be greatly improved (up to several
orders of magnitude) by dispersing a certain amount of ceramic NPs within the matrix.
The exact mechanism of this drastic increase in conductivity is still unclear, but it is
widely accepted that the presence of NPs interfered with the crystallization of the
polymer matrix, i.e. the crystallinity of the matrix is reduced.29,34,35 This is understandable
because those particles can inhibit the ordering and/or aligning of polymer chains,
creating amorphous regions around themselves. Another popular theory is that each
ceramic particle acts as a Lewis acid/base center, which helps promote the dissociation of
Li+ from the lithium salt, generating more ‘free’ Li+ and hence increasing the ionic
conductivity.34,36–39 This will be discussed in more detail in Chapter III.
1.3.4. Parameters for Evaluating Solid Electrolytes
1.3.4.1. Conductivity and Ionic Transport

10
In solid electrolytes, the conductivity consists of two components: electronic
conductivity and ionic conductivity.40 Since the aim is to replace both the liquid
electrolyte and the separator by solid electrolyte, the material needs to have negligible
electronic conductivity in order to prevent the cell from shorting. Therefore, solid
electrolyte materials are ideally electronic insulators. The ionic conductivity, usually
expressed as σ, is one of the most important properties for evaluating solid electrolyte
materials. The overall/total ionic conductivity is the resultant of all the conduction
mechanisms taking place within the material. For inorganic solid electrolytes, the two
major contributions to the total ionic conductivity are conduction through the bulk (grain
volume) and through the grain boundaries (GBs).17,19,41,42 The bulk conduction is
intragranular, meaning that it concerns how ions move within a grain. In ceramics, for
example, atoms are bonded together by strong covalent bonds, making it difficult to free
an ion by breaking bonds, and to move it all the way across the entire grain. Rather, ionic
conduction in ceramics depends on a short-range process called ‘hopping’. No material is
perfect, and so there are always some defects in the structure, including vacancies.
Vacancies are high-energy sites, which makes it energetically more favorable for Li+ to
‘hop’ to the nearest vacancy, than to travel from one end of the grain to the other.
Because the bonding strength, the structural configuration and the chemical environment
etc. of Li+ are governed by the types of material, and therefore the bulk ionic conductivity
is mainly a material property. The GB conduction is intergranular, in which Li+ have to
travel from across the GB between adjacent grains. One could image that this process
would be energy-demanding and requires physical contact between grains. This GB
conductivity can be improved by means of increasing the contact area between grains,

11
such as eliminating pores and gaps, applying external pressure, or using better
preparation methods. The total ionic conductivity can be calculated by the relationship
1
𝜎Total=
1
𝜎Bulk+
1
𝜎GB (1)
where σBulk and σGB represent the contribution from bulk and GBs, respectively. Detailed
explanation of how this relationship is established, and how to extract information from
experimental results to calculate these values, will be given in Section 1.6. It can be seen
in Equation (1) that the order of magnitude of σTotal is determined by the smallest value in
the individual contributions since it is a reciprocal sum. Therefore, it is necessary to
improve both σBulk and σGB in order to achieve a σTotal high enough for practical
applications. The best total ionic conductivity one can get from all the ceramic solid
electrolytes so far is in the range of 10-4–10-3 S/cm at room temperature.16,17,19,26,41,42
In composite polymer solid electrolytes, the scenario is more complex and not
well-understood. For pure polymers, as mentioned earlier, ionic conduction happens
primarily through the amorphous regions43, and more specifically, through the polymer
backbone segmental motions,44 with surface groups also participating in conduction.43,45
With the addition of ceramic particles, the list of conduction processes goes even longer.
Similar to pure ceramic solid electrolytes, intragranular and intergranular conductions can
take place in the particles. At the same time, conduction along and across the
polymer/ceramic interface, conduction of dissociated ions generated by the presence of
ceramic particles, so on and so forth, can all be taking place. Although a lot of the times,
it is nearly impossible to separate out and distinguish the contribution from every
conduction mechanism, the total ionic conductivity is still the most important.

12
Another important parameter is the ion transference number, or ion transport
number. The transference number of a given ion species is defined as the proportion of
the total electric current that is carried by that specific ion in the electrolyte, and the sum
of the transference number of all ions in one system should be unity.15 Ideally, for
applications in lithium-ion batteries, the transference number for Li+ should be 1, or very
close to it. It means that the current in the battery is completely (or mostly) due to the
motion of Li+, which is desired for maximum efficiency, because only Li+ can participate
in the intercalation-disintercalation reactions.20 For inorganic solid electrolyte materials
this is usually not an issue, but for the majority of polymer-based solid electrolytes, the
transference number can only reach ~0.5,29 which calls for further improvement.
However, some composite polymer solid electrolytes are an exception because the
selection of salt and polymer can be carefully tailored so that Li+ is only cation in the
system, and the anion(s) are trapped or immobilized by the polymer backbone, and hence
the transference number can approach unity.17
1.3.4.2. Interfaces
Within a cell, there are a number of different interfaces that are of importance to
the overall performance, namely, the interface between ceramic solid electrolyte particles
(for ceramic electrolytes), the interface between the polymer matrix and the ceramic
fillers (for composite electrolytes), and the interface between the solid electrolyte and the
electrodes. In all-solid-state cells, the contact between solid materials has been one of the
major problems faced by researchers.46,47 Unlike the liquid/solid interface in a
commercial cell, the solid/solid contact is very poor, and can even be considered the

13
limiting step to overall performance. The quality of interface generally depends on the
area that is in contact – more contacting area means a better interface. In the case of
contact between solids, surface roughness and the presence of external compressive
forces are two major factors dictating the amount of contact area. A rough surface
increases the exposed area, but contact can still be bad if the surface pattern/texture does
not match that of the other surface. Pressing two materials against each other help
improve the contact most of the time, but the magnitude of the force needs to be carefully
controlled to prevent the solids from cracking. Another issue with applying a
compressive force to a cell is that, since the force is uniaxial in most cases, only a
fraction of the surfaces, especially those that are perpendicular to the force direction, can
benefit from it. Surfaces that are parallel to the force direction usually will not be
affected. By using some bottom-up growth techniques, e.g. sol-gel or other deposition
methods, the materials can be directly grown onto another solid surface to produce a
uniform interface with good contact. Taking the sol-gel method as an example, it can
benefit from the liquid/solid interface when the liquid phase is in contact with the solid
phase. The sol/gel is then processed to remove the solvents, so the material can use the
surface of the solid as nucleation sites.48 Since the grains grow directly on the solid, the
interfaces tend to have low energy, and thus adhesion is considered to be improved.
Another example would be epitaxial growth, in which the material crystallizes with the
same lattice orientation (lattice match) as the substrate because that is the orientation with
the lowest energy.
For composite polymer solid electrolytes, the interface between the polymer
matrix and the ceramic filler particles is usually considered to be better than that in

14
ceramic solid electrolytes. This is because that the fabrication of such composite
electrolytes starts from the solution of the polymer matrix material in most cases.
Ceramic fillers are dispersed into the solution, which is then cast to form a thin film, and
dried by removing the organic solvents. It is still unclear, however, what is exactly
happening at the interfaces due to the complexity of the system. Recently, Zheng et al.49
studied the Li+ pathways in PEO-LLZO system by replacing 7Li with 6Li, and found that
conduction was more favored within the LLZO particles than at the PEO/LLZO interface.
It shed some light on how the conduction processes can be probed for the composite
system.
The quality of the interface can be quantitatively evaluated by the
resistance/impedance associated with it, or sometimes capacitance, too. A low value in
these properties means a good interface. But a lot of the times, due to the complexity of
the system, or the limit of the measuring technique, it is very difficult or even impossible
to distinguish/extract the interfacial component from the experimental data. In that case,
the overall or averaged value is used to approximate the order of magnitude of the actual
one.
1.3.4.3. Stability
The stability of the solid electrolyte materials includes chemical, physical and
electrochemical stabilities.50 The material needs to be chemically stable during synthesis,
fabrication and normal operation. Although air exposure is a very unlikely event under
normal operation conditions, it is still desirable to test the air stability (against oxygen
and moisture). Sometimes carbon dioxide (CO2) can be harmful to the material as well,

15
and therefore should also be looked at. In terms of physical stabilities, a series of
mechanical properties can be tested, including elastic moduli (e.g. Young’s modulus,
shear modulus), hardness and fracture toughness. Shear modulus is crucial to all types of
solid electrolytes since a large modulus (> 8.5 GPa) can in theory suppress Li dendrite
formation.51 For ceramic solid electrolytes, the fracture toughness is especially important
because ceramics are brittle materials, and cracks tend to form due to the calcination-
cooling cycles, or shocks during handling. The Young’s modulus should be studied on
polymer-based solid electrolytes when bending is required in the application.
Electrochemical stability means that the electrolyte must remain stable across the
operation voltage window of the battery. The material should not decompose, or take part
in any unwanted side reactions. In order to have an energy density as high as possible for
lithium-ion batteries, materials with high electrochemical potentials are preferred as the
cathode, as mentioned earlier. The problem with this is that, by increasing the working
voltage of the battery, the energy density is improved, but the electrolyte is also polarized
by a high voltage at the same time. In conventional lithium-ion batteries, this can cause
the organic liquid electrolyte to be oxidized at the cathode, and reduced at the anode,
forming a layer termed the ‘electrode-electrolyte interface’ (EEI) or ‘solid-electrolyte
interphase’ (SEI) on each electrode. This EEI layer does not contribute to the total battery
capacity; on the contrary, it consumes a small amount of energy to form upon the initial
cycle. On the other hand, it acts as a passivating layer that prevents further reaction
between the electrode and the electrolyte, while still allowing Li+ to go through, and
hence ensuring safety, long cycle life, high Coulombic efficiency and high voltage
efficiency.52 Therefore, in polymer-based solid electrolytes, the formation of EEI must be

16
assessed. For inorganic solid electrolytes, due to the absence of organic components and
the relatively high dielectric constant of ceramics, EEI is usually considered non-existing
and the materials can withstand higher voltages. However, a recent study49 showed that at
the LiCoO2/LLZO interface, a very thin layer of EEI would form if the two materials
were in direct contact, which negatively affected the electrochemical performance. This
suggests that EEI formation might have been overlooked for inorganic solid electrolytes
and therefore should also be carefully examined.
Thermal stability, apart from non-flammability, is still very important because the
reactions inside the battery are quite exothermic, not to mention that batteries are usually
located in a constricted space within the device where ventilation or any type of heat
dissipation is extremely poor and lacking, which can result in localized high temperatures.
This is especially true in polymer-based systems as organic materials are not known for
withstanding too high of a temperature, so melting and/or thermal decomposition can
happen, which can cause degradation of the performance, or even catastrophic failure.
Moreover, the added salts (e.g. LiClO4) can be highly reactive and problematic. For most
oxide-based ceramic solid electrolyte materials, they are completely immune to those
issues because of their refractory nature. However, another aspect of thermal stability is
required, which is the resistance to thermal shocks. Thermal shocks are rapid temperature
changes, and ceramics are brittle materials that are prone to cracking under thermal
shocks. Therefore, the tolerance of rapid thermal expansion/contraction should also be an
important parameter when evaluating candidate materials.
1.3.4.4. Activation Energy

17
The concept of activation energy was first introduced by Svante Arrhenius in
1889. It is the minimum energy required to initiate a process (chemical reaction). Ionic
conduction in solid electrolytes is considered to be an activation process, which follows
the Arrhenius equation (relationship)
𝜎(𝑇) = 𝐴exp(−𝐸a𝑅𝑇
) (2)
where σ is the ionic conductivity, T is the temperature in Kelvin, A is a pre-exponential
factor, Ea is the activation energy and R is the universal gas constant. A lower activation
energy means that the reaction is easier to take place, and therefore is desired for all solid
electrolytes. We can re-arrange the Arrhenius equation to get a new relationship:
log𝜎 = −𝐸a𝑅𝑇
+ log𝐴 (3)
If a plot of logσ vs. 1
𝑇 is drawn, then it will be a straight line with a slope of −
𝐸a
𝑅 and an
intercept of logA. Therefore, to measure the activation energy, a common practice is to
measure the ionic conductivity at various temperatures, and then make a logσ vs. 1
𝑇 plot to
calculate the slope.
1.4. One-Dimensional Nanomaterials as Solid Electrolytes
When materials reach the sub-micron regime, especially tens of nanometers in
size, their properties become significantly different from the bulk ones. This is because
bulk properties are essentially the average or overall behavior of all atoms within the

18
material. When the particle size is reduced, fewer and fewer atoms are left within the
material, and eventually the behavior of individual atoms becomes more dominant than
the overall effect. For instance, the NPs of some materials show different colors than their
bulk forms because factors like quantum confinement53,54 and surface plasmon
resonance55 come into play. In terms of mechanical properties, metals are generally
considered to be ‘soft’, as they are ductile and malleable, which is due to the fact that
atoms can ‘slide’ over each other when in bulk. However, inside metal NPs, these large-
scale ‘slidings’ are no longer present, and the relative density of dislocations and stacking
fault are largely increased. As a consequence, the metal becomes a very hard material.56
Other properties such as electrical, optical, chemical, magnetic, etc., can all exhibit very
interesting changes as the particle size is reduced. This is also why nanomaterials and
nanostructured materials have been attracting researchers’ attention for many years.
When used as solid electrolytes in lithium-ion batteries, nanomaterials can also be
advantageous in different aspects.57 For example, nanocrystalline solid electrolytes have
been shown to display higher ionic conductivities than their bulk single crystal forms.58,59
Recent studies have also shown improved properties when nanosized solid electrolyte is
used compared to bulk materials, such as higher ionic conductivity,60 cycling
performance and current density,47 and fracture strength.61 Among the different forms of
nanomaterials, one-dimensional (1D) nanostructures, e.g. nanowires (NWs), nanorods
and nanotubes, are of particular interest to us. A common point to all 1D nanostructures
is that their radial dimension (i.e. diameter) is on the nanometer scale, but the axial length
is orders of magnitude higher. Such high aspect ratio can have multiple advantages on the
material properties. For example, transport across the diameter, whether it is mass,

19
electron or heat, can benefit from the short distance. While on the other hand, processes
that happen along the length are highly directional, meaning that they can be made very
selective or controllable. A pertinent example would be that researchers have made
electrodes with different types of NWs and nanoribbons and demonstrated significant
improvement in performance,62–65 which is a direct result of the unique morphology and
properties of 1D nanomaterials. Electrospun LLTO NWs were used as fillers in a
polyacrylonitrile-LiClO4 polymer complex to make a composite solid electrolyte and
achieved a room temperature ionic conductivity of 2.4 ×10⁻⁴ S/cm.45 Electrospun LLZO
NWs were also embedded as a filler network in a PEO-LiTFSI (lithium
bis(trifluoromethane)sulfonimide salt) complex and demonstrated an ionic conductivity
of 2.5 × 10⁻⁴ S/cm at room temperature.66
1.5. Characterization Techniques
1.5.1. X-ray Diffraction
X-ray diffraction (XRD) is a very useful and straightforward technique for
identifying phases in crystalline samples, as well as revealing crystallographic
information. It is based on the fact that the wavelength of X-rays is comparable to the
interatomic spacing of solid materials, so diffraction will happen when the incident X-ray
beam hits the sample, and scattered X-rays are collected by the detector. The fundamental
relationship governing the diffraction behavior is described by Bragg’s Law
𝑛𝜆 = 2𝑑sin𝜃 (4)

20
where n is an integer, λ is the wavelength of the incident X-ray, d is the interplanar lattice
spacing and θ is the incident angle. A simple explanation of this formula is that, for a set
of planes with a fixed d, the incident beam is diffracted by a fixed angle (2θ), provided
that λ is kept unchanged. It means that, for crystalline samples, because of the presence
of long range order, all beams diffracted from a specific set of planes will point to the
same direction and hence can produce distinct and strong signals when they interfere with
each other constructively. When these signals are plotted on a signal intensity vs. angle
diagram, they appear as sharp peaks (high intensities), and this plot is called an XRD
pattern. For amorphous materials, or the amorphous part within the materials, the incident
beams are scattered to all possible directions due to the lack of long range order.
Therefore, only a very broad ‘hump’ is obtained, which is termed the amorphous halo.
All XRD analyses in this work were performed using a PANalytical X’Pert Pro
high resolution X-ray diffractometer. The X-ray used was CuKα radiation with λ =
1.541874 Å. Sample powders were held by a zero background substrate during
measurement. Sometimes double-sided tape was used to hold the sample in place. The
pattern of the tape is mostly low-intensity and amorphous, with some very broad peaks at
low angles. This means that the presence of tape does not interfere with crystalline
samples, and its contribution to the overall pattern can be simply subtracted. For polymer
film samples, they are placed directly onto the zero background substrate without any
adhesives.

21
1.5.2. Scanning Electron Microscopy
Scanning electron microscopy (SEM) is a commonly used technique for
examining sample morphology. In an SEM machine, electrons are generated from the
emission gun under high voltage, and are focused into a beam by electromagnetic lenses
onto the sample. As the incident electrons bombard the sample, some electrons in the
sample are knocked off from their orbitals within the atoms and become the secondary
electrons, while some incident electrons are deflected backwards and become the back-
scattered electrons. These two types of electrons are collected to image the sample as the
beam scans across it. Secondary electrons are useful in showing the sample topography,
while back-scattered electrons carry information about the mass of the atoms in the
sample. The SEM facility used in this work is an XL30 Environmental FEG, which is
also equipped with the EDAX system, capable of doing energy-dispersive X-ray
spectroscopy (EDS or EDX). Upon the bombardment of the incident beam, electrons on
the inner shell of an atom in the sample are excited and ejected, then electrons from a
higher energy shell fall back to fill the vacancies, emitting X-rays at the same time. The
energy of the X-rays is equal to the energy difference between the two shells. Because the
energy of each shell is quantized and specific for each element, the emitted X-rays are
called ‘characteristic X-rays’ and can be used for elemental identification and
compositional analysis. For SEM specimen preparation, sample powders were dispersed
in isopropanol through sonication. Droplets of the resulting suspension were then
deposited onto a substrate till the isopropanol dries out. For bulk samples, such as
electrospun fiber mats or polymer films, they can be directly loaded onto the holder using

22
a double-sided carbon tape. Sometimes a very thin layer of gold (~10 nm) was sputtered
onto the specimen to improve electronic conductivity for better image quality.
1.5.3. Transmission Electron Microscopy
As the name suggests, transmission electron microscopy (TEM) collects
transmitted electrons, rather than secondary or back-scattered electrons, to obtain
information. High energy electrons have very short wavelengths, and therefore they are
able to interact with features that are extremely fine (sub-ångström level) in the material.
For example, a 200 keV electron has a wavelength of only ~0.025 Å, comparing to the
aforementioned wavelength of CuKα X-rays of ~1.54 Å. This resolving power enables us
to look directly at crystallographic planes, dislocations, domains, etc., which is not
achievable with SEM. Also, since the interaction and imaging are both based on
diffraction, it is very easy to distinguish between crystalline and amorphous regions.
However, one important requirement for TEM specimens is that they need to be thin
enough for electrons to pass through (i.e. electron-transparent). Therefore, for bulk
materials, careful grinding and milling are usually needed in specimen preparation. But
for nanomaterials, fortunately, most samples automatically meet the size/thickness
requirement, and therefore can be used directly.
In this work, TEM studies were performed on a JEOL 2010F microscope at 200
kV accelerating voltage. Specimens were prepared firstly by dispersing the sample
powder in isopropanol using sonication, and then a tiny droplet of the dispersion was
deposited onto a copper TEM grid with lacey carbon (or carbon film) to allow all the
isopropanol to fully evaporate.
23
1.5.4. Inductively Coupled Plasma Optical Emission Spectrometry
Due to the fact that lithium is transparent to EDS, i.e. the characteristic X-rays of
light elements are blocked by the beryllium window protecting the detector, a different
technique is needed to measure the amount of lithium in the sample. The technique we
chose was the inductively coupled plasma optical emission spectrometry (ICP-OES).
Solid samples need to be prepared in the dissolved state, and therefore are often digested
by acids. Sometimes when the sample is difficult to dissolve under ambient conditions,
the digestion process can be assisted with microwaves under elevated temperature and
pressure. Droplets of the digested solution are fed into the device chamber and vaporized
by the plasma, releasing solute atoms. These atoms are ionized to an excited state,
emitting photons of characteristic wavelengths, which are then collected and measured to
identify each elemental species. The number of photons is proportional to the amount of
corresponding elements contained in the sample, and therefore quantitative measurements
can be achieved. This technique has very high sensitivity, which is ideal for ppm (parts
per million, mg/L) to sub-ppb (parts per billion, µg/L) level analysis.
The ICP-OES equipment used in this work is a Themo iCAP6300. The digestion
protocol used in this dissertation was to first add the sample into 50% H2SO4 (usually
around 5-10 ppm), and then the mixture was heated at 100 °C for 20 min using a CEM
SP microwave reactor (50 W, 2.56 GHz) with stirring. The resulting solution should be a
transparent one without any visible solid particles. If that is not the case, then the heating
temperature and/or time can be increased until all solids are fully dissolved.
1.6. Electrochemical Measurement Technique

24
1.6.1. Electrochemical Impedance Spectroscopy
Electrochemical impedance spectroscopy (EIS) is a widely used technique for
measuring the ionic conductivity of solid materials. Typically, the sample is probed by a
small sinusoidal potential or current stimulus across a range of frequencies, and its
response to such a perturbance is recorded and analyzed. The principle behind this
technique is that, in a system, each individual component or conduction mechanism has
its own response to various electrical stimulus frequencies.67 For ionic conductivity
measurements, the obtained data are usually presented in a Nyquist plot (imaginary
impedance vs. real impedance), and fitted to an equivalent circuit in order to extract the
contribution of each individual component.
Microscopically, the ‘brick-layer’ model can be used to study and extract the
ionic conductivity of different contributions, namely, bulk (grain or grain interior) and
GBs, from the experimental data. This model was proposed by van Dijk et al. and
Verkerk et al., and has been successfully applied to polycrystalline solid electrolyte
materials.68,69 As illustrated in Figure 1 (adopted from Haile et al.70), inside the
polycrystalline sample, this model represents the grains as cube-shaped ‘bricks’ with
edge length G, close-packed together. Between the grains are the GBs with thickness g,
which are divided into two categories: series GBs (perpendicular to the applied electric
field) and parallel GBs (parallel to the applied electric field). Since the intrinsic GB
thickness is usually on the order of 1 to 10 nm,71,72 and the grains are large after being
sintered, the condition g ≪ G is met and therefore, the total length of all series GBs (L⊥)
is

25
𝐿⊥ =𝑔
𝐺𝐿 (5)
and the total area of all series GBs (A⊥) is
𝐴⊥ = 𝐴 (6)
For parallel GBs, the total length and total area are
𝐿∥ = 𝐿 (7)
𝐴∥ =2𝑔
𝐺𝐴 (8)
respectively, where L is the sample length between the two electrodes, and A is the
sample cross-sectional area.
Figure 1. Schematic of the brick-layer model
For a typical pure solid electrolyte sample with ionically non-blocking electrodes,
the Nyquist plot typically consists of two semicircles/arcs and a tail, as shown in Figure
2a.40,73,74 The tail at low frequencies is usually a straight line with a slope around 45° if
non-blocking electrodes are used, and is a result of solid-state diffusion through the

26
electrodes.40,75 This plot can be fitted using the equivalent circuit in Figure 2b, in which
Q is a constant phase element with impedance 𝑍Q =1
𝑌(𝑗𝜔)𝑛 (𝑗 = √−1, ω is frequency, Y
and n are constants, 0 ≤ n ≤ 1), and R is a resistor with impedance ZR = R. If we assume
that both the bulk and GB components in the brick-layer model can be represented by a
pair of Q and R, then Figure 2b can be further improved to suit the model, as shown in
Figure 3a. This circuit can be simplified (Figure 3b) so that the value of QBulk+GB∥ is (YBulk
+ YGB∥), and the value of RBulk+GB∥ is (1/RBulk + 1/RGB∥)-1. If we make another assumption
that ionic conduction in both the grain interior and GBs is governed by the same
mechanism (e.g. σGB∥ = σGB⊥), we get
1
𝑅1=
1
𝑅Bulk+
1
𝑅GB∥
𝐴
𝐿𝜎1 =
𝐴Bulk𝐿Bulk
𝜎Bulk +𝐴∥𝐿∥𝜎GB∥
𝐴
𝐿𝜎1 =
𝐴
𝐿𝜎Bulk +
2𝑔
𝐺
𝐴
𝐿𝜎GB
𝜎1 = 𝜎Bulk +2𝑔
𝐺𝜎GB
(9)
1
𝑅2=
1
𝑅GB⊥
𝐴
𝐿𝜎2 =
𝐴⊥𝐿⊥
𝜎GB⊥ =𝐴
𝐿
𝐺
𝑔𝜎GB
𝜎2 =𝐺
𝑔𝜎GB
(10)
when we take the definition 𝜎 =𝐿
𝐴
1
𝑅 into account.

27
Figure 2. (a) Schematic of an ideal Nyquist plot for solid electrolyte. (b) An equivalent
circuit of (a).
Figure 3. (a) Equivalent circuit for a typical polycrystalline sample. (b) Simplified
equivalent circuit of (a).
From the derivation we can see that the first semicircle R1 at high frequencies
corresponds to the bulk and parallel grain boundary impedance, and the second
semicircle R2 in the intermediate frequency range corresponds to the series GB
impedance. However, because it is difficult to characterize the microscopic properties of
g and G, some approximations must be made in order to get σ1 and σ2 using the
information that we are able to extract from the impedance measurement. First, as
mentioned above, since g ≪ G, the ratio 2g/G becomes negligible and hence Equation (9)
approximates to
𝜎1 = 𝜎Bulk (11)

28
Second, the relationship between the macroscopic and microscopic GB conductivities is
𝜎GBmac =
𝐺
𝑔𝜎GBmic (12)
according to van Dijk et al.,68 and therefore Equation (10) becomes
𝜎2 = 𝜎GBmac = 𝜎GB (13)
The macroscopic GB conductivity will be termed σGB henceforth. It should be noted that,
although the macroscopic GB conductivity is not the ‘true’ conductivity, we at least can
obtain an estimation of the order of magnitude of the microscopic one.68
So far, we have demonstrated that the bulk and GB conductivities can be
extracted from the experimental EIS data. The leftmost arc in the Nyquist plot
(corresponding to high frequencies) is associated with the bulk conductivity, and the
other arc at intermediate frequencies is associated with the GB component.
In this work, EIS was performed using a Biologic VMP3 potentiostat over the
frequency range 1 Hz – 1 MHz, or a Biologic SP-200 potentiostat over 1 Hz – 5 MHz,
both with 10 mV stimulus voltage and at various temperatures. Details pertaining to
different samples will be given in their corresponding chapters.
1.7. Electrospinning
Electrospinning is a simple and versatile technique of producing very fine
fibers/NWs from liquids or gels. It is based on electrostatic interactions, and can be
deemed as a variant of electrospraying.76 In 1887, C.V. Boys discovered that fibers can
be drawn from various viscous materials when insulated and connected with an electrical

29
machine, and the phrase ‘electrical spinning’ was mentioned for the first time.77 In 1995,
Doshi and Reneker described the electrospinning of polymer fibers. The modern lab-scale
electrospinning set up typically consists of a spinneret (e.g. a metallic needle tip), a
metallic collector and a power supply, as depicted schematically in Figure 4. Before
spinning, a syringe is filled with a viscous solution, and the spinneret is connected to the
syringe. The positive electrode of the power supply is linked to the spinneret, and the
collector is connected to ground. During spinning, both the syringe pump and the power
supply are turned on, and the solution will be pushed out of the spinneret tip, forming a
droplet. Since the droplet is electrified, it will experience dragging forces towards the
collector, exerted by the electric field, but is still balanced by the surface tension of the
liquid at this stage. When the applied voltage exceeds a critical value, surface tension can
no longer hold the liquid in place, and then the droplet will shape into a cone and a jet
will shoot out from the apex. This geometry is termed the ‘Taylor cone’, which is named
after Sir Geoffrey Taylor, who studied extensively the formation of such process.78–80 The
jet gets accelerated along the field direction, and at the same time, is being
stretched/elongated due to its high viscosity, forming into a fiber, which will eventually
land on the collector.
Some important parameters for electrospinning are the applied voltage, distance
between the tip and the collector, feed rate and viscosity of the liquid. The applied
voltage determines whether the Taylor cone can form, and usually several kilovolts (kV)
is required to overcome the liquid surface tension. The distance from the tip to the
collector should not be too short, as it allows the liquid to be stretched completely into
fibers. The combined effect of voltage and distance, which is the electric field strength

30
(kV/cm), can be used for selecting an appropriate range for the spinning to work.
Empirically, a field strength of 0.7 to 2 kV/cm should fit most systems. The feed rate, i.e.
the speed at which the pump is pushing the liquid, should match the applied voltage, in
order to achieve a steady stream of jet. Like the field strength, the feed rate can also have
a range within which the spinning is stable. Therefore, when other parameters are fixed,
changing the feed rate can fine tune the diameter of fibers on the order of tens of
nanometers. A rule-of-thumb is that a slower feed rate produces finer fibers. If the tip is
‘spitting’ liquid and there is no Taylor cone forming, the voltage needs to be increased. If
the Taylor cone is formed, but disappears due to not enough liquid at the tip, then a faster
feed rate is needed, and/or the voltage needs to be turned down. The viscosity of the
liquid needs to be sufficiently high to produce uniform fiber diameter. Low viscosity
solutions often leads to ‘beaded’ fibers, or varying diameter within one fiber. When
beading is observed under SEM, more polymer should be added into the precursor
solution. Some other factors can have effect on the spinning process as well. For
example, the evaporation speed of the solvent(s) can affect the porosity of the fibers. The
electrical property of the liquid, e.g. the ion species in it, can also determine how it
behaves under applied voltage. It should be noted that the ambient humidity can also
have significant effects on electrospinning. If the humidity is too high, the evaporation of
solvents can be inhibited, especially for water-based precursors. Thus the jet can have
difficulty solidifying, resulting in droplets on the collector (similar to spraying). In that
case, a dehumidifying device should be used to reduce and control the humidity around
the working area. Fortunately, the Phoenix area in Arizona is very dry most of the time

31
(average annual humidity: 37%), and therefore no device was deployed to control the
ambient humidity in this work.
In our experiments, the home-made electrospinning setup (Figure 5) was
composed of a syringe pump (New Era), a high voltage power supply (Gamma Power
Supply, ES40P-20W/DAM), and a flat stationary collector made of aluminum foil. A BD
PrecisionGlide 21 gauge (21G) needle firstly had its bevel removed by pliers, and then
the remaining flat/blunt tip was polished by both coarse and fine sand papers. The
processed needle tip was then installed onto a BD Luer-Lok Tip 5 mL syringe. Of course,
needles with flat tip as-purchased are good to be used, too. Electrical connections were
established using cables with alligator clips. In a typical electrospinning experiment, the
voltage was set between 7 to 11 kV, depending on the type of sol (but unfortunately no
rule-of-thumb can be followed); the distance between the needle tip and the collector was
kept at 10-15 cm, and the feed rate was adjusted between 0.1 to 0.3 mL/h.
Figure 4. Schematic of an electrospinning setup

32
Figure 5. Electrospinning setup used in this work
1.7.1. Electrospinning of Oxide Materials
Technically speaking, the electrospinning of oxide materials can be roughly
categorized into ‘decorative’ spinning and ‘formational’ spinning, in terms of the type of
precursor materials. For ‘decorative’ spinning, the oxides used are pre-synthesized
particles, usually in the nano- or microscale to avoid clogging the tip. These particles are
dispersed in the electrospinning precursor solution as a secondary phase. After being
spun, the fibers are decorated by those particles (on the surface and/or embedded in the
fiber), and are usually used as-spun without any calcination. On the other hand,
‘formational’ spinning involves the formation of fibers made up completely by the oxide
materials, thanks to the development of sol-gel synthesis of oxides. Typically, the oxide
precursors are dissolved into a homogeneous sol, and a polymer is also dissolved in the
sol to act as a sacrificial carrier, as well as to increase the viscosity. The as-spun fibers
are then calcined at high temperature to remove all the organic components and to
crystallize the oxides. As long as the heating ramp rate is fast, and the calcination time
and/or temperature do not allow significant sintering to take place, the resulting oxides
should be able to preserve the fiber morphology, owing to the dimensional confinement

33
of the as-spun fibers. Each calcined oxide fiber is composed of multiple crystal grains
(crystallites), either small or large, connecting each other.81 This is significantly different
from the NWs yielded using other growth techniques, such as hydrothermal or
chemical/physical vapor deposition, in which each NW is one single crystal.
34
II: ELECTROSPINNING OF LITHIUM LANTHANUM TITANATE
2.1. Introduction
LLTO is an ABO3 type perovskite material with a generic chemical formula
Li3xLa2/3-x□1/3-2xTiO3 (0 < x < 0.16), where □ stands for vacancies. Its crystal structure is
shown in Figure 6 (image adopted from Stramare et al.82). LLTO has by far the highest
reported bulk ionic conductivity among all oxide solid electrolyte materials, which
exceeds 1×10⁻³ S/cm at room temperature,83 only one order of magnitude less than that of
the typical liquid electrolyte. This high value is achieved when x ≈ 0.1, i.e. the
stoichiometry becomes Li0.33La0.56TiO3. The conduction mechanism is considered to
depend mainly on the concentration of A-site vacancies and the size of cations.82 Besides,
it has been determined that the ionic conductivity is due entirely to the motion of Li+ ions,
so the transference number is 1.84 However, one major problem with LLTO is that the
Ti4+ can get reduced to Ti3+ when in direct contact with metallic Li,82 thus greatly
compromising its stability and preventing its use in battery applications where Li metal is
used as the anode. Such reaction also promotes LLTO’s electronic conductivity, which
may cause the cell to short circuit. Another problem is that the GB ionic conductivity of
LLTO is typically several orders of magnitude less than the bulk conductivity, and
therefore the total ionic conductivity is dominated by the GB conductivity’s order of
magnitude, according to Equation (1). A lot of research efforts have been focused on the
origin of this large difference in conductivity, and also on how to improve the GB
component.
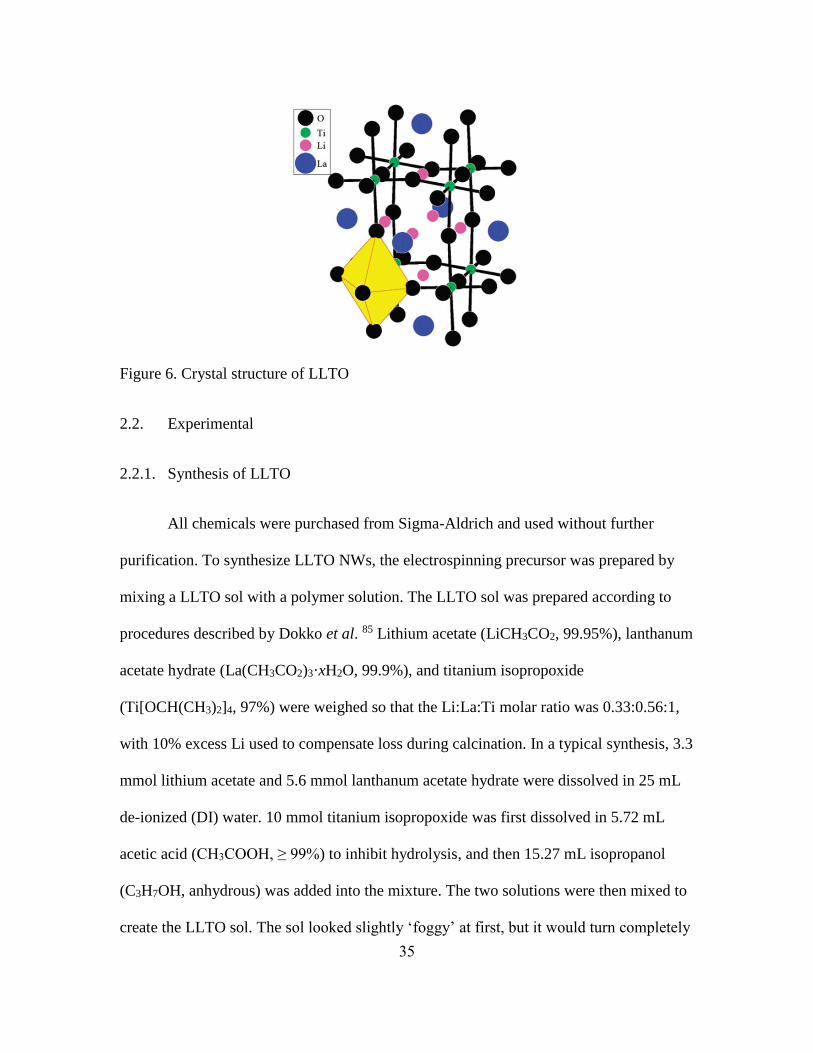
35
Figure 6. Crystal structure of LLTO
2.2. Experimental
2.2.1. Synthesis of LLTO
All chemicals were purchased from Sigma-Aldrich and used without further
purification. To synthesize LLTO NWs, the electrospinning precursor was prepared by
mixing a LLTO sol with a polymer solution. The LLTO sol was prepared according to
procedures described by Dokko et al. 85 Lithium acetate (LiCH3CO2, 99.95%), lanthanum
acetate hydrate (La(CH3CO2)3·xH2O, 99.9%), and titanium isopropoxide
(Ti[OCH(CH3)2]4, 97%) were weighed so that the Li:La:Ti molar ratio was 0.33:0.56:1,
with 10% excess Li used to compensate loss during calcination. In a typical synthesis, 3.3
mmol lithium acetate and 5.6 mmol lanthanum acetate hydrate were dissolved in 25 mL
de-ionized (DI) water. 10 mmol titanium isopropoxide was first dissolved in 5.72 mL
acetic acid (CH3COOH, ≥ 99%) to inhibit hydrolysis, and then 15.27 mL isopropanol
(C3H7OH, anhydrous) was added into the mixture. The two solutions were then mixed to
create the LLTO sol. The sol looked slightly ‘foggy’ at first, but it would turn completely

36
transparent after several hours of sitting. The polymer solution used was a 10 wt%
polyvinylpyrrolidone (PVP, (C6H9NO)n, Mw ~ 1,300,000) in acetic acid, which was
prepared by dissolving PVP in acetic acid with vigorous stirring. The LLTO sol and PVP
solution were then mixed at a 1:1 volume ratio to form the precursor solution for
electrospinning. In a typical electrospinning run, the voltage was set to 7 kV, the distance
between the needle tip and the collector was kept at 10 cm, and the feed rate was 0.3
mL/h. After electrospinning, the as-spun NWs were peeled off the collector as a free-
standing, flexible mat (Figure 7a and b) and calcined in an alumina combustion boat in
air at 1000 °C for 3 h (Lindberg/Blue M Moldatherm box furnace) to remove all the
organic components and to crystallize the LLTO NWs. The mass of the calcined NWs is
about 1/7 of the as-spun ones.
To serve as a comparison, LLTO was also synthesized using a conventional sol-
gel method.86 The conventional sol-gel was prepared by dissolving 3.3 mmol lithium
nitrate (LiNO3, ≥ 98.5%) and 5.6 mmol lanthanum nitrate hexahydrate (La(NO3)3∙6H2O,
≥ 99.0%) into 12.5 mL DI water, and 10 mmol titanium isopropoxide into 10 mL
isopropanol. The two solutions were mixed together to form the gel, which was then
dried at 100 °C on a hotplate for 10 h in air. The dried gel was calcined in air at 500 °C
for 5 h and then 1000 °C for 5 h with 10 °C/min ramp rate (Lindberg/Blue M
Moldatherm box furnace).
2.2.2. Materials Characterization
XRD was performed for phase identification, and sample morphology was
examined using SEM. TEM studies were carried out to examine the sample’s
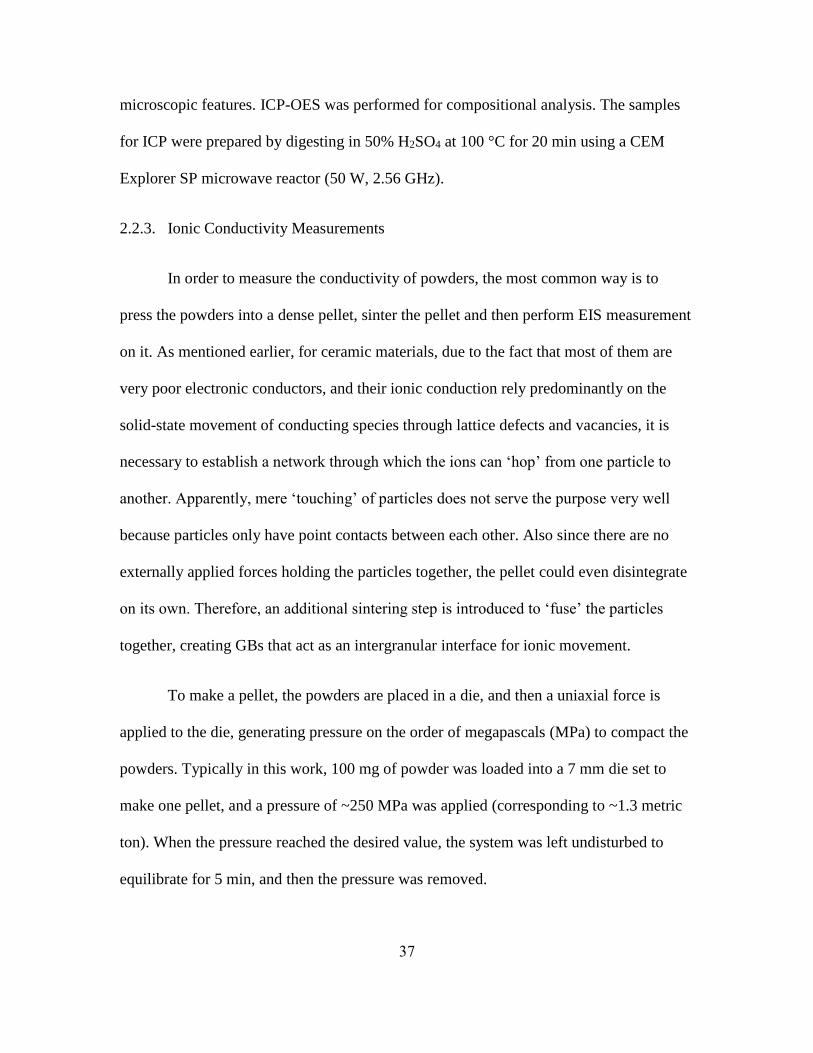
37
microscopic features. ICP-OES was performed for compositional analysis. The samples
for ICP were prepared by digesting in 50% H2SO4 at 100 °C for 20 min using a CEM
Explorer SP microwave reactor (50 W, 2.56 GHz).
2.2.3. Ionic Conductivity Measurements
In order to measure the conductivity of powders, the most common way is to
press the powders into a dense pellet, sinter the pellet and then perform EIS measurement
on it. As mentioned earlier, for ceramic materials, due to the fact that most of them are
very poor electronic conductors, and their ionic conduction rely predominantly on the
solid-state movement of conducting species through lattice defects and vacancies, it is
necessary to establish a network through which the ions can ‘hop’ from one particle to
another. Apparently, mere ‘touching’ of particles does not serve the purpose very well
because particles only have point contacts between each other. Also since there are no
externally applied forces holding the particles together, the pellet could even disintegrate
on its own. Therefore, an additional sintering step is introduced to ‘fuse’ the particles
together, creating GBs that act as an intergranular interface for ionic movement.
To make a pellet, the powders are placed in a die, and then a uniaxial force is
applied to the die, generating pressure on the order of megapascals (MPa) to compact the
powders. Typically in this work, 100 mg of powder was loaded into a 7 mm die set to
make one pellet, and a pressure of ~250 MPa was applied (corresponding to ~1.3 metric
ton). When the pressure reached the desired value, the system was left undisturbed to
equilibrate for 5 min, and then the pressure was removed.

38
The calcined LLTO NWs and conventional sol-gel powder were made into pellets
using identical procedures for ionic conductivity measurements. The sample was pressed
into a 7 mm diameter pellet with a pressure of 255 MPa using a Specac Atlas manual
hydraulic press. The pellet was then placed in an alumina combustion boat and sintered in
air at 1100 °C for 12 h using a tube furnace (Lindberg/Blue M Mini-Mite) with a ramp
rate of 1 °C/min. Both surfaces of the sintered pellets were polished using a fine grit (e.g.
2000 grit) sand paper and then gold (Au) electrodes were sputtered onto both surfaces. It
should be noted that since Au and Li can form alloy, Au electrodes are not completely
ion-blocking for Li+, and therefore a non-vertical tail is seen in the EIS spectrum
(diffusion is present). The impedance of the bulk and GB components are RBulk and RGB,
respectively. The ionic conductivity (σ) of each individual component can be calculated
by
𝜎 =𝑡
𝑅𝐴 (14)
in which t is the thickness of the pellet, R is the impedance and A is the surface area of
the pellet. The total ionic conductivity can then be obtained using Equation (1).
2.3. Results and Discussion
The as-spun NWs had diameters around 1 µm and smooth surface (Figure 7c).
After calcination, the NWs shrank to around 100 - 200 nm in diameter and showed rough
surfaces with kinky morphology, as seen in Figure 7d. SEM observation at higher
magnification revealed that the NWs were formed through the merging of LLTO particles
(Figure 7e), but without void or porosity, as was seen in TiO2 NWs prepared by

39
electrospinning.81 This is likely due to the higher crystallization temperature of 1000 °C
for LLTO, which promoted grain coarsening, compared to only 500 °C for TiO2.
However, despite the higher temperature to crystallize LLTO, coalescence was
minimized due to the separation of the NWs, with grain growth restricted by the
dimensions of the as-spun NWs.
Figure 7. Photographs of (a) as-spun LLTO NW mat being removed from the collector,
(b) free-standing as-spun LLTO mat with good flexibility. SEM image of LLTO NWs (c)
as-spun, (d) after calcination. (e) A higher magnification of (d) showing the NW surfaces.
(f) XRD pattern of electrospun LLTO NWs after calcination with P4/mmm tetragonal
structure.

40
LLTO is stable over a wide range of compositions and can adopt simple cubic,
hexagonal tetragonal, tetragonal, and orthorhombic perovskite (ATiO3) distorted
structures with different distribution of La3+, Li+, and vacancies on the A sites.82 The
XRD pattern of the crystallized NWs (Figure 7f) matched the tetragonal structure of
LLTO with no impurity phases observed. ICP analysis gave a composition of
Li0.26La0.61TiO3 for the acid-digested NWs, indicating that the NWs are Li+-poor (x <
0.10), possibly due to Li+ loss during calcination. Although the annealing times were
short, the high surface area of the NWs could facilitate Li+ volatilization during heating.
Rietveld method was used to refine the crystal structure of the LLTO samples
from their XRD patterns. This method, developed by Dutch scientist Hugo M. Rietveld,
is a simulation-based technique used for the refinement of powder XRD or neutron
diffraction results. Parameters such as crystallographic configuration, crystallite size and
shape, instrument settings, etc. are varied until the simulated pattern is the closest match
to the experimentally obtained pattern. Then the crystal structure of the simulated pattern
can be deemed as a good representation of the sample’s crystal structure. The program
used was PANalytical X’Pert HighScore Plus with built-in Rietveld refinement function.
Rietveld analysis of the calcined LLTO NWs XRD pattern using the La content
determined from ICP, the tetragonal (P4/mmm) space group, and the atomic coordinates
from Fourquet et al.87 yielded lattice constants of a = 3.875 Å and c = 7.739 Å, with Rexp
= 16.03, Rw = 15.57 (Figure 8a). Rietveld analysis of the calcined LLTO powder from
conventional sol-gel is shown in Figure 8b, in which Rexp = 19.54, Rw = 19.42. Due to the
low scattering factor of Li, its contribution to LLTO XRD patterns is often neglected and
therefore was not included in the refinement.88

41
Figure 8. XRD pattern with calculated pattern from Rietveld refinement of (a)
electrospun LLTO NWs and (b) conventional sol-gel LLTO; (c) XRD pattern comparison
of conventional sol-gel LLTO vs. electrospun LLTO NWs after calcination.
TEM examination showed that the calcined NWs were about 50 - 500 nm in
length and were polycrystalline, consisting of connected grains with the grain width
spanning the diameter of the NWs (Figure 9a). Figure 9b shows a zoomed-in view of one
grain and the inset is the corresponding selected-area electron diffraction (SAED) pattern
with major spots circled and indexed, showing that each grain is a single crystal. Figure
9c is a high-resolution TEM (HRTEM) image showing the lattice fringes with spacing of
3.88 Å, which is close to the a-parameter obtained from XRD Rietveld refinement (3.875
Å). A typical HRTEM image of the boundary between two adjacent grains is shown in
Figure 9d with the fast Fourier transform (FFT) of each grain shown in the insets.
Analysis of the lattice spacings in each grain revealed that the GB is highly coherent and

42
the mismatch between the two grains is relatively small. There are also no visible or
secondary phase segregations at the boundary.
Figure 9. TEM image of calcined electrospun LLTO NWs at (a) low magnification; (b)
high magnification showing individual grains. Inset shows the corresponding SAED
pattern. HRTEM image of (c) the lattice fringes and (d) GB between two grains. The
upper and lower inset shows the FFT of the upper and lower grain, respectively.
From these results, we can see that the calcination temperature and time required
to obtain crystalline LLTO using the electrospinning approach (1000 °C for 3 h) is
greatly reduced compared with conventional solid state methods.83 Also, one problem
with conventional sol-gel synthesis of LLTO is the tendency to form impurity phases
such as La2Ti2O7, particularly when using calcination times < 12 hours.89,90 However, we
can see that the LLTO prepared using electrospinning does not have these problems due

43
to the short diffusion distances along the NW diameters, which allows for better
distribution of the ionic species.
To better characterize the Li+ transport properties of the electrospun LLTO NWs,
room temperature EIS measurements were performed and compared with LLTO
synthesized using conventional sol-gel methods. The XRD pattern of the conventional
sol-gel powder was very similar to that of the NW sample and had the same tetragonal
structure as the NWs (Figure 8b and c). The measured impedance data are presented as
Nyquist plots in Figure 10. The total ionic conductivity of the sample can be
approximated by extrapolating the low frequency semicircle to intercept the x-axis.40 The
total conductivity given by this method is 7.8 × 10⁻⁷ S/cm for the conventional sol-gel
sample and 3.3 × 10⁻⁶ S/cm for the electrospun NW sample (tconventional = 0.076 cm,
telectrospun = 0.064 cm). The impedance associated with Li+ conduction in the grain interior
is typically observed in the high frequency range between 200 kHz – 13 MHz as a
depressed semi-circle.83,85 The high frequency region of the Nyquist plots is shown in
Figure 10a. Due to the frequency limitation of the instrument (1 MHz maximum), the full
semi-circle could not be resolved in our data. However, it is clear that the impedance is
higher for the pellet prepared from conventional sol-gel compared to the NW sample.

44
Figure 10. Nyquist plots of LLTO pellets derived from conventional sol-gel vs.
electrospun NWs, normalized by pellet thickness in the (a) high frequency range and (b)
full frequency range with fitted curves; inset shows the equivalent circuit used for fitting.
The Nyquist plots over the entire frequency range are shown in Figure 10b. Semi-
circles associated with Li+ conduction through the GBs were observed from about 200
kHz – 30 Hz and a tail due to the polarization behavior of the blocking electrode was
observed at low frequencies. The GB arc is clearly much larger for the conventional sol-
gel sample compared to the electrospun NW one. An equivalent circuit (Figure 10b inset)
proposed by Bohnke et al.91 was used to fit the experimental data, where L represents the
inductance of the wire connections, Chf is the high frequency capacitance, which is
related to the high frequency dielectric constant of the material, Cp is the bulk
polarization capacitance, Qb is a constant phase element for the bulk interface, Qel is a
constant phase element for the electrode interfaces, and Relect, Rgb, and Rcond represent the
resistance from the electrode interfaces, GBs, and grain interior, respectively. The fitting
parameters and fitted values for both samples are shown in Table 1.

45
Table 1. Impedance analysis results of both conventional sol-gel and electrospun LLTO
samples
Equivalent
Circuit Symbol
Fitting
Parameter[a]
Value
(Conventional)
Value
(Electrospun)
L L1 0.121 × 10⁻¹⁸ H 9.805 × 10⁻²⁵ H
Chf C1 3.958 × 10⁻¹² F 1.169 × 10⁻¹¹ F
Cp C2 4.982 × 10⁻⁹ F 8.753 × 10⁻⁷ F
Qb Q2 4.938 × 10⁻⁹ 3.313 × 10⁻⁸
N/A α2 0.8339 0.9091
Rcond R2 245231 Ω 37121 Ω
Qgb Q3 7.848 × 10⁻⁶ 2.244 × 10⁻⁶
N/A α3 0.6476 0.6403
Rgb R3 1046000 Ω 273266 Ω
Qel Q4 1.092 × 10⁻⁷ 3.214 × 10⁻⁸
N/A α4 0.3836 1.141 × 10⁻⁵
Relect R4 7593 Ω 1384 Ω
[a] The impedance of a constant phase element is expressed by 𝑍 =1
𝐴0(𝑗𝜔)𝛼 where A0 is a
capacitance related term, j is the current, ω is the applied frequency and α is an exponent.
Here α2, α3 and α4 are the corresponding α for Qb, Qgb and Qel, respectively.
The bulk (grain interior), GB, and total conductivities calculated from the fitting
results are shown in Table 2. The bulk conductivity for the electrospun sample was on
the order of 10-4 S/cm, which is comparable to some LLTO samples that were
synthesized using solid state method.92,93 Based on the ICP data, the electrospun NW
sample was slightly Li+ deficient, which would decrease its bulk ionic conductivity.88,93–
96 The total conductivity from the fitted data was on the order of 10-7 S/cm for the
conventional sol-gel sample and 10-6 S/cm for the electrospun NW sample, similar to the
values determined from extrapolation of the low-frequency semi-circle. Compared to the

46
total Li+ conductivity reported of 7 × 10⁻⁵ S/cm for the record LLTO samples synthesized
with solid state method,83 these values are still lower. This is reasonable considering that
the sol-gel LLTO typically demonstrates lower conductivity compared to LLTO prepared
with solid state methods.85,86,90
Table 2. Ionic conductivities (S/cm) calculated from fitted impedance data of two LLTO
samples
Sample Bulk Grain Volume Grain Boundary Total
Conventional 2.63 × 10⁻⁵ 8.16 × 10⁻⁷ 7.91 × 10⁻⁷
Electrospun 1.22 × 10⁻⁴ 4.54 × 10⁻⁶ 4.37 × 10⁻⁶
The total conductivity of LLTO is typically limited by its GB
conductivity.83,85,86,92,93,95,97,98 Hence, using nanostructured LLTO with high surface-to-
volume ratio and large GB area could be considered a disadvantage. Indeed, LLTO
nanopowders 15 - 20 nm in diameter prepared using a combustion method showed an
extremely low GB conductivity of ~ 10-10 S/cm at room temperature.99 Also, previous
studies have shown that increasing the LLTO grain size with sintering can improve
(lower) the GB resistance,92,100 suggesting that nanostructured LLTO is undesirable.
However, the advantages of the electrospun NW samples over the conventional sol-gel
sample can be clearly seen in our results. Both the bulk and GB conductivities of the
NW-derived sample were more than four times higher than that in the conventional sol-
gel sample, with the GB conductivity nearly six times higher for the NW sample.
To better understand the observations, the pellets were fractured and SEM images
of the cross-sectional areas were taken. The pellet derived from conventional sol-gel

47
(Figure 14a) had many more pores and voids compared to the one derived from the
electrospun NWs (Figure 14b). In general, the sintering of particles involves neck
formation, mass transport and pore closure, with the major driving force being the
reduction of total surface energy. NPs have very large surface-to-volume ratio, which
means that the driving force of reducing surface energy is tremendous, and should in
theory yield high density in sintered pellets. However, one common problem with NPs is
that they tend to form agglomerates due to electrostatic or van der Waals forces. Figure
11 shows an example of such behavior. Figure 11a is an SEM image of an oxide material
(LLZO) in bulk form, and Figure 11b is the same material after being ball milled, with
the average particle size being approximately 25 nm. It can be seen that although the
particles have their dimensions greatly reduced after ball milling, they are not scattered
uniformly all over the place. Instead, they stick together and form agglomerates with
different sizes. Figure 12 is a schematic of a more microscopic view to this
phenomenon.101 It shows that particles are more close-packed within each agglomerate,
but the inter-agglomerate pores are large.101–104 During sintering, these agglomerates will
start to densify first since the particles inside are close together. This process is very
effective and most of them can reach nearly full density. However, because the total
surface energy is significantly reduced by those as-sintered agglomerates, the driving
force for further densification diminishes, and so the inter-agglomerate pores are difficult
to eliminate (Figure 13). On the other hand, using 1D nanomaterials can potentially
circumvent this problem by taking advantage of their shape.105,106 As illustrated in Figure
13, 1D nanomaterials tend to lie down on their axial direction (long axis) because it is the
most stable (lowest energy) position, which allows them to pack more efficiently.

48
Additionally, the particle size of 1D nanomaterials (a few hundred nm in the long axis) is
usually much larger than NPs (several tens of nm in diameter), so the increased mass
helps cancel out the attractive forces between particles, and the particles are less likely to
adhere to each other. These combined effects should in theory yield denser pellets and
hence improved GB conductivity. The sol-gel method is known to produce very fine
nanopowders, but they also suffer from agglomeration, which means that the large pores
seen in Figure 14a are very likely to be the inter-agglomerate ones. Moreover, the necks
between adjacent pores, which formed during the necking stage of sintering, acted as the
‘bottlenecks’ for ionic conduction. Because ions cannot move across the void area of
pores, the effective cross-sectional area for conduction is limited to the necks only, which
are usually very thin, as is apparent in Figure 14a. It has also been shown, in LLZO for
example, that improving the pellet density can greatly increase the total ionic
conductivity.107 Therefore, it becomes clear that the relative density of the pellets needs
to be included when reporting the conductivity, which serves as an indicator of how
relevant the calculated value is to the ‘true’ (theoretical) conductivity. For instance, a
pellet with 50% porosity (i.e. 50% relative density) means that only half of the volume
participates in the conduction process, and the calculated macroscopic conductivity will
be undoubtedly far lower than the theoretical value. In other words, the
calculated/measured conductivity has at most 50% correlation with the true value, and
hence cannot be deemed significant. Although there has not been an established universal
relationship between the pellet density, measured conductivity and theoretical
conductivity (but empirical ones exist for some individual materials), and to what extent
of the pellet density can one report the measured conductivity with confidence, it shows

49
that improving the pellet density is very important, which again is one of the reasons for
using 1D nanomaterials.
Figure 11. (a) SEM image of bulk LLZO powder. (b) SEM image of the same powder in
(a) after being ball milled.
Figure 12. Schematic showing agglomeration in NPs

50
Figure 13. Schematic showing the pellet making process with different starting
morphologies
Figure 14. Cross-sectional SEM image of pellet made of (a) conventional sol-gel LLTO
and (b) electrospun LLTO.
Nanocrystallites from electrospinning, on the other hand, circumvent the
agglomeration problem by connecting each other and forming NWs at the crystallization
stage. This is clearly observed in the TEM images of the LLTO NWs (Figure 9a), in
which the NWs formed due to the merging of adjacent particles. Thus, agglomeration in
NWs derived from electrospinning can be greatly prevented while maintaining many high
energy surfaces, which means that the main driving force for sintering is not
compromised. Hence, with the pellet preparation and calcination steps kept identical for
the two samples, the increase in conductivities in the NW-derived sample can be
attributed to the improved microstructure and densification processes in the pellet. Using
the mass and dimensions of the pellet, the density of the pellet prepared from

51
conventional sol-gel LLTO was 3.42 g/cm3. This corresponds to a relative density of ~68%
(with respect to the theoretical LLTO density of 5.01 g/cm3), which is comparable to
other results obtained using similar pellet preparation conditions. For example, Ban and
Choi used 1050 °C for 2 h and obtained a relative density of ~58%,92 while Yang et al.
achieved ~64% when sintering at 1050 °C for 8 h.93 Higher density (> 90%) can only be
achieved using more advanced techniques, such as hot-pressing.98 In contrast, the pellet
derived from electrospun NWs had a density of 4.06 g/cm3, or a relative density of ~81%,
showing improved densification using conventional sintering. These observations are also
similar to previous studies that showed pressed pellets of titanate-based ferroelectric
NWs had higher green and sintered densities than pellets derived from sol-gel
synthesized nanopowders.105,106 Even though the NWs lost their 1D morphology and
nanostructure after sintering, the pellets derived from NWs still showed better dielectric
and piezoelectric properties than those from conventional sol-gel nanopowders. The
improved sinterability of the NWs in that study was attributed to: 1) better packing
efficiency, 2) enhanced plastic deformation under uniaxial pressing, and 3) high amounts
of surface defects such as oxygen vacancies, which can accelerate mass and energy
transfer between reactants.108 It is also reasonable to believe that similar processes may
occur in the LLTO NW pellets and contribute to the better ionic conductivity properties
compared to the conventional sol-gel powders.
2.4. Conclusions
In summary, LLTO NWs were successfully synthesized for the first time using
electrospinning. The calcination temperature and time required to obtain crystalline

52
LLTO NWs was greatly reduced compared with conventional solid state and sol-gel
methods, with only 3 hours at 1000 °C needed to obtain the tetragonal form of the
perovskite-type structure. Characterization results showed that the NWs were
polycrystalline with diameter < 200 nm and grain sizes ranging from 50 - 500 nm. Pellets
derived from the electrospun materials were denser, had less void space, and displayed
improved ionic conductivities over LLTO made through the conventional sol-gel route. It
is expected that the ionic conductivity of the electrospun LLTO NWs can be further
enhanced by tuning the parameters during synthesis, for example by identifying and
minimizing the source of the Li+ loss. These results highlight the potential of utilizing the
electrospinning method to improve the ionic conductivity of sol-gel derived solid
electrolytes.

53
III: ELECTROSPINNING OF LITHIUM LANTHANUM ZIRCONATE
3.1. Introduction
LLZO belongs to the garnet-type fast Li+ conducting material family, with a
nominal chemical formula Li5La3M2O12 (M = Nb, Ta).109 When M is replaced by Zr, and
seven instead of five Li atoms are contained per formula, the nominal stoichiometry
becomes Li7La3Zr2O12, which is also called the ‘Li-stuffed’ (Li-rich) garnet. It has been
found that the total Li+ conductivity can reach 10-4 S/cm at room temperature,110 which is
considered to be originated from the excess Li in the structure.111 Moreover, it is stable
against metallic Li,112 making it a very promising candidate for battery applications. But
on the other hand, studies show that there are three polymorphs of LLZO: a tetragonal
phase (t-LLZO), and two associated with the cubic phase (c-LLZO), namely, high
temperature cubic (HT-cubic), and low temperature cubic (LT-cubic). The remarkable
high conductivity is only associated with the HT-cubic phase (space group: 𝐼𝑎3𝑑, Figure
15a), which is due to the disordered Li sublattice with partial site occupation.113
Unfortunately, this phase will transform into the tetragonal phase when temperature drops
below 650 °C.114 A common way to achieve stabilization of the HT-cubic phase at room
temperature is by adding dopants, such as Al, Ta and Nb.113,115,116 The stabilization
mechanism of Al, for instance, is believed to be due to the formation of Li+ vacancies (2
per each Al3+ added to maintain electroneutrality), which increases the total entropy and
reduces the free energy gain from Li ordering to destabilize t-LLZO with respect to HT-
cubic.117 Indeed, when the Li content is increased from 6.24 to 7.32 per formula unit, a
transformation from HT-cubic to t-LLZO was observed.118 However, the drawback to Al

54
doping is that non-conducting compounds such as LaAlO3 may form as byproducts that
segregate at the GBs and are detrimental to the ionic conductivity.47,113 Also, a higher
activation energy for Li+ conduction was observed in Al-containing HT-cubic LLZO
compared to the Al-free counterpart, likely because the partial occupation of Al on the Li
sites can cause increased electrostatic repulsion from the +3 charge of Al and also hinder
Li+ mobility.114 For Zr substitutional dopants such as Ta and Nb, a narrow composition
range for peak conductivity was observed, meaning that doping must be carefully
controlled.116,119,120 For the tetragonal phase (space group: I41/acd, Figure 15b), the ionic
conductivity is 2-3 orders of magnitude lower than that of the HT-cubic phase.121 The
tetragonal distortion is a result of Li+ ordering (blue spheres in Figure 15) that eliminates
the short Li-Li interactions and disordered Li+ clustering that is responsible for the high
conductivity in the HT-cubic phase.117,122–125 The LT-cubic phase was discovered through
the development of low temperature synthesis methods.126,127 This phase has the same
structure as the HT-cubic phase, but with a slightly larger lattice constant and lower ionic
conductivity than even t-LLZO.128 Detailed studies on LT-cubic LLZO have indicated
that it may be stabilized at low temperatures due to adsorption of CO2 or H2O,114,128,129
and that it transforms to t-LLZO once these adsorbates are removed using calcination (e.g.
between 450 to 650 °C).114 Therefore, it is advantageous to find other ways to stabilize
the HT-cubic LLZO phase at room temperature without relying on extrinsic dopants, or
incurring the formation of LT-cubic phase.

55
Figure 15. Crystal structure of (a) cubic phase LLZO and (b) tetragonal phase LLZO
3.2. Experimental
In order to obtain nanostructured LLZO and investigate its phase transformations,
the electrospinning technique was selected as it has been a versatile method for preparing
ceramic nanofibers or NWs from sol-gel precursors.81,130 To our knowledge, this is the
first report on the synthesis of LLZO NWs using electrospinning. The synthesis of LLZO
NWs also enables detailed structural characterization using TEM to better understand the
formation mechanism of LLZO synthesized from sol-gel precursors.
3.2.1. Synthesis of LLZO Nanowires
All chemicals were purchased from Sigma-Aldrich and used without further
purification. The precursor for electrospinning was prepared by mixing an LLZO sol with
a polymer solution. For the nitrate-based sol, lithium nitrate (LiNO3, ≥ 98.5%),
lanthanum nitrate hexahydrate (La(NO3)3∙6H2O, ≥ 99.0%), and zirconium oxynitrate
hydrate (ZrO(NO3)2·xH2O, 99%) were weighed so that the Li:La:Zr molar ratio was
7.7:3:2, with 10% excess Li used to compensate loss during calcination. In a typical

56
synthesis, the three salts were dissolved in 25 mL DI water with stirring. For the acetate-
based sol, lithium acetate (LiCH3CO2, 99.95%), lanthanum acetate hydrate
(La(CH3CO2)3·xH2O, 99.9%), and zirconium propoxide (ZrC12H28O4, 70 wt% in 1-
propanol) were weighed so that the Li:La:Zr molar ratio was 7.7:3:2. In a typical
synthesis, 7.7 mmol of lithium acetate and 3 mmol of lanthanum acetate hydrate were
dissolved in 14.5 mL DI water with stirring. 2 mmol zirconium propoxide was dissolved
in 1.2 mL acetic acid (CH3COOH, ≥ 99%) first, and then 3.06 mL isopropanol (C3H7OH,
anhydrous) was added. The two solutions were then mixed to make the sol. In both
methods, the polymer solution is a 15 wt% PVP (Mw ~ 1,300,000) solution, prepared by
dissolving PVP in acetic acid with vigorous stirring. The LLZO sol and PVP solution
were then mixed at a 2:1 volume ratio to form the precursor for electrospinning.
In the electrospinning setup, the distance between the needle tip and the collector
was kept at 10 cm. For the acetate-based precursor, the voltage was set to 7 kV and the
feed rate was 0.12 mL/h. After electrospinning, the as-spun NWs were peeled off the
collector and calcined in an alumina crucible in air at 700 °C (Lindberg/Blue M
Moldatherm box furnace) to remove the PVP and crystallize LLZO. The ramp time for
calcination was 1 h in order to retain the NW morphology. For the nitrate-based precursor,
the voltage was set to 11 kV and the feed rate was 0.16 mL/h. The ramp time for
calcination was 2.5 h. The mass of the calcined NWs is about 1/4 of the as-spun ones.
3.2.2. Synthesis of Bulk LLZO
Bulk LLZO was prepared using the sol-gel method described by Janani et al. but
without the addition of Al2O3.127 In a typical synthesis, 0.7 mmol lithium nitrate, 0.3

57
mmol lanthanum nitrate hexahydrate, 0.2 mmol zirconium oxynitrate hydrate and 2.4
mmol citric acid (C6H8O7, 99%) were dissolved in 50 mL DI water with stirring and
heating (60 °C). 10 mL isopropanol was added into the solution as a surfactant. The
mixture was then stirred and heated at 60 °C until a thick and transparent gel formed. The
gel was fired at 250 °C for 1 h (Lindberg/Blue M Moldatherm box furnace) in air to
obtain a brown foam-like solid. The solid was ground into powder with mortar and pestle.
The powder was calcined at 500 °C for 2 h in air first, then 700 °C for 5 h in air to obtain
t-LLZO, both with 2 °C/min ramp rate (Lindberg/Blue M Moldatherm box furnace).
To obtain c-LLZO from the bulk LLZO, the powder was ball milled for 1 h using
a SPEX SamplePrep 8000M with methacrylate cylinder and tungsten carbide balls and
caps. Ball milling is a type of grinding process in which solids are crushed by taking
impact from a hard grinding media, and therefore particle size reduction can be achieved.
The media needs to have higher hardness than the sample material, and the impact needs
to have enough energy to induce cracking/fracture on the sample material.
3.2.3. Materials Characterization
XRD was performed for phase identification. The sample morphology was looked
at using SEM. TEM examination was conducted to take high-resolution images and to
study the structure of the samples.
3.3. Results and Discussion
SEM images of the as-spun NWs prepared from acetate-based precursor are
shown in Figure 16a, showing diameters ranging from ~100 to 200 nm. Figure 16b-e

58
shows the morphology evolution of the LLZO NWs after being heated at 700 °C for 1.5 h,
2 h, 2.5 h and 3 h, respectively. Figure 16f and g are both from the same sample that was
calcined for 5 h. The dimensions and morphology of the NWs did not change much after
1.5 h of heating (Figure 16b). However, as the heating time increased, the NWs became
thicker and underwent coalescence to form larger ligaments. More interestingly, these
morphology changes were also accompanied by a phase transformation, as determined
using XRD. As shown in Figure 16h, 1.5 h was not sufficient time for formation of
LLZO. The peaks labelled with asterisks were assigned to the intermediate phase
La2Zr2O7. After 2 h of calcination, a small amount of cubic phase LLZO was observed,
but the majority of the sample was still La2Zr2O7. After 2.5 h of calcination, c-LLZO was
the majority product and the amount of La2Zr2O7 decreased significantly. This is also
consistent with the findings of other groups that La2Zr2O7 is the first intermediate phase
as well as the main byproduct.61,110,126,127

59
Figure 16. SEM image of (a) as-spun LLZO NWs and the NWs after calcination at
700 °C for (b) 1.5 h, (c) 2 h, (d) 2.5 h, (e) 3 h, (f) & (g) 5 h. (h) XRD patterns showing
the effect of calcination time on the product. ●: unidentified intermediate phase; *:
La2Zr2O7; light blue: c-LLZO phase; dark blue: mixture of tetragonal + cubic LLZO
phases. (i) Zoom-in of XRD patterns around 31°, showing the emergence of peak doublet
during heating from 2.5 h to 5 h.

60
Figure 17a shows a flexible fiber mat made of as-spun LLZO NWs from nitrate-
based precursor. The NWs showed similar as-spun morphology to that in Figure 16, only
that the higher feed rate during electrospinning resulted in larger NW diameter. After
being calcined with the same conditions as the ones from acetate-based precursor, the
NW morphology retention appeared to be better, but they contained a higher amount of
byproduct (Figure 17d, upper pattern) apart from c-LLZO. For NWs calcined in quartz
crucible, c-LLZO still formed (Figure 17d, lower pattern), meaning that the formation of
c-LLZO in alumina crucible was not due to Al doping. A large amount of La2Zr2O7 was
present in the product, which was likely due to the reaction between Li and the quartz
crucible.
Figure 17. LLZO NWs from nitrate-based precursor. (a) Photograph of an as-spun LLZO
fiber mat. (b) SEM image of as-spun LLZO NWs. (c) SEM image of LLZO NWs after 3
h of calcination at 700 °C. (d) XRD patterns of LLZO NWs calcined in alumina and
quartz crucibles, matching the HT-cubic LLZO phase shown as reference. (●: La2O3; *:
La2Zr2O7)

61
To better understand the spatial distribution of La2Zr2O7 and LLZO in the acetate-
based NW sample calcined for 2.5 h, TEM studies were performed. As shown in Figure
18, TEM imaging revealed that the sample contained two types of morphologies.
Polycrystalline NWs composed of small crystallites 10 to 20 nm in size (Figure 18a inset)
were observed as the first morphology. The measured lattice spacing from the HRTEM
image is 3.12 Å (Figure 18b inset), which corresponds to the {222} spacing of La2Zr2O7.
It is also evident from the corresponding XRD pattern (Figure 16h, 2.5 h) that the
La2Zr2O7 peaks are broadened, indicating nano-sized crystallites. The NWs appeared to
be surrounded by a layer of amorphous material, as noted by the arrows in Figure 18b,
which is believed to be a Li-containing amorphous phase. The formation of sol-gel
derived LLZO from La2Zr2O7 and an amorphous Li-phase has been proposed before61
based on XRD analysis. Figure 18c shows the other morphology, which is composed of
much larger crystals with particle size of 100 – 200 nm interconnected to form ligaments,
similar to those observed more distinctly in the SEM images of the samples calcined for 3
h (Figure 16e). The inset in Figure 18c is an HRTEM image showing the lattice fringes
with d = 2.91 Å, in good agreement with the {024} spacing (2.90 Å) in c-LLZO. Due to
the thickness of the samples, it was difficult to measure the grain sizes within the
ligaments, but using the Scherrer equation on the XRD pattern yielded a grain size of ~
65 nm, which is smaller than the size of the ligament diameter.

62
Figure 18. (a) TEM image of the acetate-based NWs calcined for 2.5 h, showing one of
the morphologies. Inset is a zoomed-in view showing the La2Zr2O7 crystals. (b) TEM
image of one branch in (a) Areas indicated by arrows are considered to be a Li-containing
amorphous phase. Inset is an HRTEM image showing the lattice fringes. (c) TEM image
of the same sample calcined for 2.5 h, showing the other morphology (LLZO crystals).
Inset shows the HRTEM image with lattice fringes.
From the TEM image (Figure 18a), it appears that nucleation of these ligaments
occurred at the intersections between adjacent or crossing NWs, as shown by the dark
regions. These results along with the XRD data in Figure 16h suggest that, during the
calcination process, La2Zr2O7 first formed as small crystallites within the NW core, and
then reacted with the Li-rich amorphous shell to form c-LLZO. During the reaction, the
NWs changed in morphology and the resulting c-LLZO formed ligaments with larger

63
grain sizes due to the coalescence of neighboring La2Zr2O7 crystallites with the
amorphous Li-containing regions. To our knowledge, this is the first time that the
formation steps of LLZO are elucidated, which is made possible by studying the LLZO
NWs synthesized from electrospinning.
As shown in the XRD pattern in Figure 16h, after 3 h of calcination, the sample
was composed of phase pure c-LLZO, which is consistent with the SEM images showing
the sample morphology consisted entirely of ligaments associated with c-LLZO. The c-
LLZO derived from the electrospun NWs was structurally stable, as XRD performed on a
sample after 14 months of storage showed the structure remained in the cubic phase
(Figure 19). When heated for an additional 2 h, some of the XRD peaks split into
‘doublets’ (Figure 16h, 5 h), indicating the emergence of t-LLZO. This is shown more
clearly in Figure 16i, in which the (024) planes for c-LLZO split into the tetragonal
double peaks as the set of (042) and (024) planes at ~31°. Based on the visible coarsening
of grains from the corresponding SEM images in Figure 16f and g, this cubic to
tetragonal phase transformation between 3 and 5 h calcination time appears to be due to
the increase in ligament diameter. Morphologically, the 5 h sample is a mixture of small
ligaments (Figure 16f) and larger micron-sized particles (Figure 16g). The small
ligaments are almost identical in morphology and size to the ones observed in the 3 h
sample. Therefore, it is not unreasonable to assign the c-LLZO peaks to the small
ligaments. On the other hand, the large particles would give rise to the tetragonal peaks
emerging in the XRD pattern. Hence, from these results, we can see a clear correlation
between the particle size and preferred crystal structure, with smaller particles adopting
the cubic phase and larger particles the tetragonal phase.

64
Figure 19. XRD pattern of bulk LLZO calcined at 700 °C for 3 h, showing a mixture of
cubic and tetragonal LLZO. (●: La2O3)
In fact, similar observations have been made in other studies. Kokal et al.
synthesized Al-free LLZO using the Pechini sol-gel method and calcined the sample at
various temperatures. They found that after heating at 700 °C, the sample was c-LLZO
with a particle size of 300 - 500 nm. When 800 °C was used, the particle size increased to
500 - 1000 nm and the phase changed to tetragonal.126 In the study by Xie et al., Al-free
c-LLZO particles with ~20 nm in size was also obtained by sol-gel methods.131 Neither of
the aforementioned groups discussed the possible mechanism for stabilization of the
cubic phase in Al-free LLZO. Several mechanisms from the literature could be in play,
e.g. a high concentration of Li vacancies,117,118,132 CO2 adsorption 114,128 and H2O
doping129 (the latter two are proposed to stabilize the LT-cubic phase). Additionally, here
we propose another possible mechanism, in which the phase transformation can be
induced by the change in particle size as a result of the difference in surface energy
between the cubic and tetragonal LLZO phases.
Several differential thermal analysis (DTA) and differential scanning calorimetry
(DSC) studies have shown that the t-LLZO to HT-cubic phase transformation is an

65
endothermic reaction, and the reverse transformation is an exothermic one.114,126,129
Filipovich, Kalinina and Garvie independently postulated that for any solid state
endothermic transformation, there exists a critical crystallite size below which the high
temperature structure is stable at temperatures much lower than the bulk transformation
temperature.133,134 This in fact has been confirmed both theoretically and experimentally
in several systems, perhaps most famously in the titania (TiO2) and zirconia (ZrO2)
polymorphs. Although rutile is the thermodynamically stable (equilibrium) phase of
titania at both room temperature and elevated temperatures, anatase is a kinetically stable
(metastable) phase at low temperatures.135 Anatase can transform irreversibly to rutile by
heating, which acts to accelerate the phase transformation kinetics. However, when the
crystallite size is reduced to a few nanometers, anatase becomes the thermodynamically
stable phase.136–138 For zirconia, the monoclinic structure is the equilibrium phase at room
temperature and it transforms to a tetragonal phase at around 1200 °C.134,139 Since pure
zirconia cannot be quenched to retain the tetragonal phase, a common practice is to
stabilize it with dopants, such as yttria (Y2O3), to form yttria-stabilized zirconia (YSZ).
However, by reducing the size of the crystallites, the tetragonal phase can exist at
ambient conditions without requiring extrinsic dopants.130,134,139–141 The origin of this
phenomenon is the difference in surface energy between the two polymorphs for each
material. As proposed by Garvie,134 the most probable reason of such a transformation is
that the high temperature phase zirconia has a lower surface energy than the low
temperature phase. When the crystallite size is sufficiently small, the material has to
undergo a phase transformation to the low surface energy phase in order to relieve the
internal stress (to lower the total energy). Indeed, it was verified that the surface energy

66
of rutile is larger than that of anatase,136 and the surface energy of monoclinic zirconia is
larger than that of tetragonal zirconia.140 Based on these previous works, therefore, we
envision that a similar size-dependent phase transformation could also be present in
LLZO. In other words, for particles with grains below a critical size, the HT-cubic phase
of LLZO will be more stable than the t-LLZO phase at room temperature.
Several proof-of-concept experiments were conducted as follows. First, bulk
LLZO powder was prepared and calcined at 700 °C in air for 3 h (Lindberg/Blue M
Moldatherm box furnace) in an alumina crucible. Unlike the electrospun NWs, these
conditions were not sufficient for a complete phase transformation, as the products were a
mixture of the cubic and tetragonal phases (Figure 19). This shows that the shorter
diffusion distances for the reactants (e.g. diffusion of Li from the Li-rich amorphous
phase) in the NWs is advantageous for obtaining the crystallized LLZO using shorter
calcination times. After calcining the bulk LLZO at 700 °C for 5 h, the XRD pattern
showed that the product was t-LLZO (Figure 21a). SEM imaging of this product showed
agglomerated particles 1 – 10 microns in size (Figure 11a). These results are consistent
with the calcination studies on the c-LLZO NWs, showing that the t-LLZO structure was
favored for the larger particle sizes. The data also show that Al dopants diffusion from
the crucible was unlikely in the calcination conditions used, which rules out the
possibility that stabilization of c-LLZO in the NWs calcined at 700 °C for 3 h was from
the Al dopants. Example reaction conditions that have been used to intentionally
introduce Al dopants include 850 °C for 25 h,142 or 1180 °C for 35 h,143,144 which are
obviously of much higher temperatures and heating time periods. Moreover, examination
using EDS in the SEM showed that there was no Al in the c-LLZO NW sample (Figure

67
22). Calcination of the as-spun NWs in a quartz crucible at 700 °C for 3 h also resulted in
c-LLZO (Figure 17d), further suggesting that the stabilization is due to the small size of
the NWs and not from Al dopants.
Figure 20. XRD pattern of c-LLZO derived from electrospun NWs after 14-month
storage.
Figure 21. XRD patterns of bulk LLZO prepared from nitrate-based sol-gel (a) after
calcining at 700 °C for 5 h, (b) after ball milling, (c) after 4-month storage, (d) after
annealing at 700 °C for 12 h. The bulk LLZO changed from tetragonal to cubic after ball
milling with the re-emergence of t-LLZO after heating. Tetragonal peak doublets are
marked with arrows. (Dark blue: t-LLZO; light blue: c-LLZO; ●: La2O3; *: artifact peaks
from instrument)

68
Figure 22. EDS spectrum obtained in an SEM of the c-LLZO NW sample.
The bulk t-LLZO was then subjected to ball milling for 1 h in order to reduce the
particles size. SEM imaging after ball milling showed that the sample consisted of
agglomerates of smaller particles (Figure 11b). The XRD pattern (Figure 21b) of the ball
milled sample showed broadening of the diffraction peaks, which is an indication of
particle size reduction. The grain size was determined to be ~ 25 nm using the Scherrer
equation. Additionally, most of the tetragonal double peaks became unified, indicating
the transformation of the bulk t-LLZO to c-LLZO after ball milling. The ball milled
powder was then stored in a capped scintillation vial in air. After 4 months, the sample
was re-examined with XRD. Notably, the ball milled sample was still c-LLZO (Figure
21c); also the peak widths had significantly reduced and the position of some peaks had
shifted, which we interpret to be due to the relaxation of the large residual strains in the
crystal lattice induced by ball milling. This stored sample was then annealed at 700 °C in
a quartz crucible for 12 h in air (Lindberg/Blue M Moldatherm box furnace), the same
temperature at which the sample was initially synthesized, to induce grain growth. The

69
resulting XRD pattern (Figure 21d) showed that a number of the doublets re-appeared,
indicating the return of t-LLZO. According to the Scherrer equation, the grain size of the
c-LLZO doubled to ~ 50 nm, and the grains corresponding to the t-LLZO peaks were
even larger at ~ 80 nm. This further confirms our hypothesis that c-LLZO can be
stabilized below a certain critical grain size, and the transformation to t-LLZO during
heating is due to grain growth and particle coalescence. This notion, that c-LLZO can
exist at room temperature without stabilizing extrinsic dopants provided that the particle
size is small enough, is consistent with our results as well as those reported by Kokal et
al.126 and Xie et al.131 We point out that the recent work by Teng et al.,145 whereby t-
LLZO was transformed to c-LLZO using pulsed laser annealing, is not in conflict with
our observations, as the LLZO grain sizes in that work were ~ 4 µm and the laser
irradiation may have caused sufficient local heating to thermally promote the tetragonal
to cubic phase transformation.
On the other hand, the fact that the LT-cubic phase is difficult to distinguish from
the HT-cubic phase by XRD complicates the discussion. One could argue that since
smaller particles have larger surface area, the stabilization effect from adsorption of
CO2/H2O would be easier than with larger particles. For example, as shown by Toda et
al., t-LLZO (presumably bulk particles, although the size was not reported) transformed
into the LT-cubic phase after being annealed in air at 450 °C for 20 h. Partial
transformation back to t-LLZO could be achieved with heating at temperatures as low as
600 °C to drive off the CO2; full transformation could be achieved by annealing at 800 °C
for just 1 h.128 Matsui et al. also showed that the extraction of CO2 from LLZO occurs
around 450-650 °C.114 Based on these results, we believe that calcination of LT-cubic

70
LLZO at 700 °C for 12 h would most likely drive off any adsorbed CO2 or H2O and cause
the material to transform completely to t-LLZO, if the cubic phase stabilization were
indeed adsorption-based. Since our sample remained mostly c-LLZO (Figure 21d), it is
not likely that the stabilization was, as reported for the LT-cubic phase, due to CO2 or
H2O adsorption. Similarly, in Xie et al.’s study, their cubic phase LLZO had been
calcined at 750 °C for 20 h,131 which means that it is also unlikely that CO2 or H2O was
causing the stabilization. Since in their study, detailed particle size information was not
provided either, it is not clear how much coalescence had occurred after 20 h of
calcination. But from the TEM data provided, the LLZO was still only 20 nm after 8 h of
calcination at 750 °C, so the crystallite size could still be smaller than the critical
transition size even after 20 h of calcination.
This critical grain size for the LLZO phase transition can be determined from the
difference in surface energy between the cubic and tetragonal phases. In the titania and
zirconia systems, the calculated critical grain size showed good agreement to the
experimental observations.138,140 The surface energy difference between rutile and anatase
titania is approximately 0.59 J/m2 and the critical size is ~14 nm.138 For monoclinic and
tetragonal zirconia, the surface energy difference is ~0.36 J/m2 and the critical size is ~9
nm.140 Hence we can see that a smaller difference in the surface energy between the two
polymorphs of a material would require a smaller critical grain size in order to stabilize
the higher temperature phase. Although the surface energy for the tetragonal and cubic
LLZO structures is not yet known, we expect that the surface energy difference is
relatively large, since the LLZO grains must be at least larger than the La2Zr2O7
crystallites at the intermediate stage. Based on our SEM and TEM data, it appears that c-

71
LLZO with dimensions of ~200 nm (the grain size would be even smaller, since the
LLZO studied here was polycrystalline) have sufficient excess surface area to be
stabilized at room temperature, which can be feasibly obtained with top-down approaches
such as ball milling, in addition to more sophisticated chemical synthesis approaches
such as the electrospinning method we present here.
While achieving c-LLZO particles using these surface energy considerations
should not be difficult, the more challenging aspect is how to maintain the cubic phase
once it is integrated into a suitable form, such as a dense pellet, for use as a solid state
electrolyte in a Li-ion battery. Conventional sintering conditions for preparing dense
LLZO pellets, e.g. calcination at 1230 °C for 36 h,110 would promote significant grain
growth/coalescence and hence the transformation of c-LLZO to t-LLZO. Ionic
conductivity measurements on pellets derived from Al-free, c-LLZO fine powders
synthesized using sol-gel methods at 750-800 °C gave rather low bulk conductivities of ~
10-6 S/cm,128,131 or two orders of magnitude lower than the c-LLZO stabilized with Al
doping at high temperature. This is why the LT-cubic phase was proposed as a separate
(and undesired) polymorph of LLZO with low ionic conductivity. However, based on the
observations presented here, it is possible that this low apparent ionic conductivity is due
to the c-LLZO transformation to the tetragonal phase during the pellet formation. For this
reason, structural characterization of fine powders should also be performed after
densification, particularly for correlation to ionic conductivity measurements.
Another possible reason for the lower ionic conductivity observed in Al-free,
nanostructured c-LLZO could be a high GB resistance in the sintered pellet due to

72
insufficient densification.128 Wolfenstine et al. found that the total conductivity of t-
LLZO can be greatly improved by about 2 orders of magnitude to ~10-5 S/cm by making
a very dense pellet (~98% relative density) through hot-pressing.107 NPs have very large
surface-to-volume ratios and should in theory yield sintered pellets with high density, but
tend to form agglomerates due to electrostatic or van der Waals forces. Indeed, we
observed this phenomenon in the ball milled LLZO (Figure 11b). Particles are more
close-packed within each agglomerate, but the inter-agglomerate pores are large.101–104
During sintering, these agglomerates can reach near-full density, while the pores between
them are difficult to eliminate. This is because that the surface energy of the as-sintered
agglomerate is already significantly reduced, and hence the material loses its driving
force to densify further. This could possibly explain the high GB resistivity observed in
the c-LLZO pellets prepared by Xie et al., which had a density of 89.2%.131
In this regard, the electrospun LLZO NWs have a clear advantage in that the
nanocrystallites connect to each other and form larger structures (NWs) at the
crystallization stage. Thus, agglomeration in powders derived from electrospinning can
be greatly prevented while maintaining many high energy surfaces, which means that the
main driving force for sintering is not compromised. Additionally, advanced sintering
techniques such as two-step sintering (TSS), spark plasma sintering (SPS), or templated
grain growth sintering (TGGS) may also be employed to create dense pellets from c-
LLZO NWs. TSS suppresses grain growth by first using rate-controlled sintering to
produce uniform pore microstructures, followed by sintering at a lower temperature
where GB-controlled densification predominates.146 SPS uses a very high current through
the material, causing localized heating, with pressure applied at the same time for better

73
densification. Therefore the temperature required is much lower than conventional
sintering and grain growth is greatly inhibited.147 TGGS is typically achieved by
embedding anisotropic particles into a precursor matrix, followed by calcination to grow
the templates from the matrix materials and densify the films.148 All of these methods
have been used for preparing dense pellets of other types of NWs while preserving the
1D morphologies108,146–149 and are anticipated to work similarly for LLZO NWs.
Moreover, the highly anisotropic NWs are ideal templates for using TGGS to obtain
dense films.
3.4. Conclusions
In summary, we synthesized LLZO NWs using the electrospinning technique for
the first time. During calcination, La2Zr2O7 nanocrystals and Li-containing amorphous
phases are first formed, and then react with further annealing time to form c-LLZO. We
also show that the transformation between the tetragonal and cubic phases in the LLZO
system can be induced by a change in particle size, with c-LLZO stabilized in
nanostructures and t-LLZO preferred for larger particles. The mechanism is likely related
to the difference in surface energy between the high temperature cubic phase and the low
temperature tetragonal phase. Using nanostructured LLZO as solid electrolyte can be
beneficial in terms of ionic conductivity, cycle life, and mechanical strength, in addition
to improving the safety characteristics of lithium-ion batteries.

74
IV: COMPOSITE POLYMER ELECTROLYTE WITH LLZO NANOWIRE FILLERS
4.1. Introduction
Developing solid Li+ conducting electrolytes for all-solid-state batteries has
attracted a great deal of research interest recently17, particularly since solid electrolytes
have the potential to increase the safety characteristics of Li metal batteries150, mitigate
the polysulfide dissolution problem in Li/S batteries151, and circumvent the organic
electrolyte oxidation problem in Li/O2 batteries152. Polymer-based electrolytes avoid the
brittleness and interfacial problems found in inorganic electrolytes, but are typically
characterized by poor mechanical properties and low ionic conductivities at room
temperature32,33,36. The use of composite polymer electrolytes (CPEs), comprising a
polymer electrolyte embedded with ceramic fillers, has become an attractive strategy for
enhancing the mechanical stability and ionic conductivity of the polymer27,32,34,36,43,153.
The ceramic filler can increase the ionic transport of Li+ in the CPE by several orders of
magnitude, for example by decreasing the crystallinity of the conducting polymer and
creating space-charge regions that can enhance the Li+ diffusion32,34,36,39,154.
While early studies investigated ceramic fillers comprising spherical particles of
inert or ‘passive’ components with no intrinsic Li+ conductivity (e.g. Al2O3 and
SiO2)34,155, recent advances in nanomaterials synthesis have enabled the development of
novel CPEs containing fillers of ‘active’ Li+ conductors with NW morphologies.
Electrospinning has emerged as a versatile and effective method to prepare oxide Li+
conductors such as LLTO45,156 and LLZO66,157 as NWs . So far, very promising results
have been reported regarding the use of these materials as CPE fillers. LLTO NWs

75
embedded into polyacrylonitrile (PAN) achieved three orders of magnitude improvement
in room temperature Li+ ionic conductivity compared to the polymer and Li+ salt alone,
but the mechanism was not thoroughly investigated45. A CPE prepared from a mat of Al-
doped LLZO NWs infiltrated with PEO was effective for preventing Li dendrite
formation under repeated lithium stripping/plating and also showed good flammability
resistance66. Both studies attribute the long-range and continuous Li+ diffusion pathways
formed at the interfaces between the NWs and polymers as key to the improvements in
conductivity. However there are still many critical questions remaining, such as how the
nature of the ceramic filler and its properties (e.g. morphology, composition) affect the
total conductivity of the CPE and the mechanism of conductivity enhancement.
Our group’s recent studies157,158 on nanostructured LLZO have examined the role
of particle and grain size on the phase stability of this garnet-type material.
Nanostructured LLZO, either prepared by electrospinning, templating onto cellulose
nanofibers, or ball milling bulk powders, was observed to remain stable in the non-
equilibrium cubic phase (c-LLZO) at room temperature without the use of extrinsic
dopants. Calcining the c-LLZO induced grain growth and coalescence, which was
correlated to the formation of the thermodynamically stable tetragonal phase (t-LLZO).
As t-LLZO typically displays two orders of magnitude lower ionic conductivity than c-
LLZO121, our findings point to a new way to access c-LLZO, namely through the use of
nanostructures, which can subsequently be exploited as new ceramic fillers for CPEs.
This approach allows for the systematic study of different c-LLZO fillers (with and
without dopants), in order to understand the critical parameters needed for high
conductivity CPEs. The substitution of Al3+ on Li+ sites113,114,118,142,159 and Ta5+ on Zr4+

76
sites115,120,159–161 both stabilize c-LLZO and create Li+ vacancies, which could increase
the number of hopping sites for Li+.121,160–163
Herein we report the following: 1) the synthesis of undoped and doped (with Al or
Ta) c-LLZO NWs using electrospinning from a dimethylformamide (DMF)-based
precursor solution; 2) the evaluation of the aforementioned LLZO NWs as fillers in CPEs
containing PAN and LiClO4 using EIS, and 3) the determination of the Li+ pathways
through the CPEs using selective isotope labelling and solid-state Li nuclear magnetic
resonance (NMR). We also evaluated CPEs containing c-LLZO NPs or Al2O3 NWs to
understand the role of filler type (active vs. passive), c-LLZO composition (undoped vs.
doped), and c-LLZO morphology (NW vs. NP) on the total ionic conductivity of the
CPE.
4.2. Experimental
4.2.1. Preparation of LLZO Sol-gel Precursor
All chemicals were purchased from Sigma-Aldrich and used without further
purification. The precursor for electrospinning was prepared by mixing an LLZO sol and
a polymer solution. In a typical synthesis, the sol was prepared by first dissolving 2 mmol
zirconium propoxide (ZrC12H28O4, 70 wt% in 1-propanol) into and 2 mL acetic acid
(CH3COOH, ≥ 99%), an then 10 mL N,N-dimethylformamide (DMF, C3H7NO, ≥ 99%)
was added into the solution. The purpose of acetic acid was to inhibit hydrolysis of the
alkoxides. Then, 7.7 mmol lithium nitrate (LiNO3, ≥ 98.5%) and 3 mmol lanthanum
nitrate hexahydrate (La(NO3)3∙6H2O, ≥ 99.0%) were dissolved into the above solution
with stirring (10% excess Li was used to compensate for losses via volatilization during

77
calcination ). For the polymer solution, a 15 wt% PVP (Mw ~ 1,300,000) solution was
prepared by dissolving PVP in acetic acid with vigorous stirring. The sol and PVP
solution were then mixed at 1:1 volume ratio and stirred for 5 h to form the precursor
solution. For the Al-doped sample (Al-LLZO), 0.24 mmol aluminum nitrate nonahydrate
(Al(NO3)3∙9H2O, ≥ 98%) was added into the sol with the other nitrates during the
preparation (nominal final composition: Li6.28La3Zr2Al0.24O12). For Ta-doped (Ta-LLZO),
0.5 mmol tantalum ethoxide (TaC10H25O5, in < 2 wt% toluene) was added together with
1.5 mmol zirconium propoxide into acetic acid (nominal final composition:
Li6.5La3Zr1.5Ta0.5O12).
4.2.2. Electrospinning of LLZO Nanowires
The electrospinning setup used a syringe pump (New Era) to feed the precursor
through the electric field generated by a high voltage power supply (Gamma Power
Supply, ES40P-20W/DAM) between the needle tip and a flat stationary collector made of
aluminum. The distance between the needle tip and the collector was 15 cm, the voltage
of the power supply was set to 8 kV, and the syringe pump feed rate was 0.24 mL/h. The
as-spun fibers formed a mat on the collector, which was then peeled off the collector and
placed into an alumina combustion boat for calcination using a Lindberg/Blue M
Moldatherm box furnace at 700 °C for 1 h or 3 h in air with 1 h ramp. For Al-doped and
Ta-doped samples, the steps were identical. The mass of the calcined NWs is about 1/7 of
the as-spun ones. The NWs were transferred immediately to an Ar-filled glovebox (M.
Braun) after calcination.
4.2.3. Preparation of LLZO Nanoparticles

78
Bulk undoped LLZO was synthesized according to our previous work157 using a
modified synthesis from the sol-gel method reported by Janani et al.127. The bulk product
(t-LLZO) was then ball milled for 1 h using a SPEX SamplePrep 8000M with
methacrylate cylinder and tungsten carbide balls and caps to obtain c-LLZO NPs157. The
average particle size was calculated to be ~25 nm according to the Scherrer equation.
4.2.4. Preparation of Composite Electrolyte
The polymer matrix for the composite solid electrolyte was prepared using a
solution containing 10 wt% PAN ((C3H3N)n, Mw ~ 150,000) and 5 wt% lithium
perchlorate (LiClO4, ≥ 95%) in DMF, which corresponds to ~33.3 wt% of LiClO4 in the
final dry film. PAN powder was dried in a vacuum oven (MTI Corporation) at 50 °C
overnight prior to use, and LiClO4 had been stored in an Ar-filled glovebox with H2O
level < 0.1 ppm. In a typical synthesis, 0.53 g PAN and 0.265 g LiClO4 were added into 5
mL DMF and the mixture was stirred at 80 °C for 5 h in a sealed vial in air until a clear
solution was obtained. The desired ceramic filler was added into the polymer matrix
solution so that amount of ceramic in the final CPE was between 1 – 15 wt%, and the
mixture was vigorously stirred for 5 h, after which a homogeneous suspension was
obtained. To make the composite films, the suspension was then cast onto a glass slide
using an automatic drawdown machine (Auto-Draw III) and dried in the vacuum oven
overnight at 50 °C. The thickness of the film can be varied by applying different number
of layers of tape (labeling tape, Scotch tape, etc.) onto the long edges of the glass slide.
For the films with passive ceramic filler, Al2O3 NWs (Sigma-Aldrich, 2-6 nm diameter,
200-400 nm length) were used without further processing. For comparison, a blank

79
control sample consisting of only PAN and LiClO4 was made without adding any
ceramic filler. All dried films were stored in the vacuum oven at 50 °C before any tests.
To remove the dried film from the glass substrate, a pair of tweezers was used to
carefully lift and peel the film off. The thickness of each dried composite film was
measured with a Mitutoyo micrometer, and the average thickness of all films was about
28 microns.
4.2.5. Materials Characterization
XRD on the as-calcined samples was performed for phase identification. The
reference pattern for c-LLZO was generated according to Awaka et al.121 The sample
morphology was examined using SEM. EDS spectra were acquired using an EDAX
system equipped on the SEM. TEM studies were performed to investigate the
microstructure of the NW sample.
4.2.6. Electrochemical Characterization
EIS was performed using a Biologic SP-200 potentiostat with 10 mV stimulus
voltage and a frequency range from 5 MHz – 1 Hz at 20 °C and 50-80 °C (10 °C interval)
in air. Two identical stainless steel discs (MTI Corporation, 15.5 mm diameter) were used
as the electrodes. The dried composite film was peeled off from the substrate,
sandwiched between the electrodes, and trimmed to fit the size of the discs using a pair of
scissors. A spring-loaded clamp was used to hold the assembly together. EIS
measurements at 50-80 °C were carried out on the sample containing 5 wt% undoped
LLZO NWs in a Thermo Heratherm OGS60 oven (Figure 23). Starting from 50 °C, at
each temperature, sufficient time was allowed for the sample to reach equilibrium with

80
the surroundings before conducting measurements. The obtained conductivities were
plotted on a logσ vs. 1/T graph, according to the Arrhenius equation (Equation (3)).
Figure 23. Schematic of EIS measurement in oven
4.2.7. Galvanostatic Cycling
The sample film (blank or composite) was sandwiched between two 7Li foils, and
then assembled into a coin cell. The configuration of the coin cell is: top case | wave
spring | stainless steel spacer | 7Li foil | sample film | 7Li foil | stainless steel spacer |
bottom case (all coin cell components and 7Li foils were purchased from MTI
Corporation). The cell was mounted onto a Biologic coin cell holder, which was
connected to a Biologic MPG-2 potentiostat. The cell was cycled using a current density
of 50 µA/cm2, and the sign of the current switched every 300 s. The cell voltage was
limited between -3 V and 3 V. All 7Li cycling experiments were carried out at 20 °C in
air.
4.2.8. NMR Characterization
6Li and 7Li magic-angle-spinning NMR experiments were carried out at the
National High Magnetic Field Laboratory at Florida State University on a Bruker Avance

81
III-500 with Larmor frequencies of 73.6 and 194.4 MHz for 6Li and 7Li, respectively. A
2.5 mm Bruker HXY probe was used and the samples were spun at 25 kHz. The 6,7Li
chemical shift was referenced to solid LiCl at 0 ppm.
To investigate the Li+ diffusion pathway, a CPE containing 5 wt% of undoped
LLZO NWs was prepared as described above. Symmetric cells were prepared by pressing
6Li foils (1.5386 cm2 surface area) on either side of the CPE using a spring-loaded clamp.
Charge and discharge cycling was conducted using a constant current of ±0.01 mA (300 s
hold per half-cycle) on a LANHE battery testing system in an Ar-filled glovebox (M.
Braun). After 10 cycles, the CPE was removed from the cell for the NMR measurement.
4.3. Results and Discussion
Our original method for preparing LLZO via electrospinning (Chapter III) used an
aqueous precursor solution containing an LLZO sol mixed within a polymer solution,
which resulted in the formation of NWs after electrospinning, as shown in Figure 24a.
Calcination of these NWs at 700 °C for 3 h led to formation of c-LLZO characterized by
interconnected ‘ligament’-like morphologies with dimensions of 100 – 200 nm (Figure
24b). In comparison, the c-LLZO NWs obtained using a DMF-based precursor solution
showed improved fiber-like morphologies (Figure 24c) after calcination for 1 h with
average diameter of 276 nm (Figure 25a). The Al-doped (Al-LLZO, Figure 24e) and Ta-
doped (Ta-LLZO, Figure 24g) samples displayed similar morphologies as the undoped
samples (Figure 24c), but the respective dopants were detectable using EDS (Figure 25b
and c).

82
TEM analysis revealed that the LLZO NWs were polycrystalline and became
interconnected after calcination. Figure 24i shows the TEM image of the undoped LLZO
NWs calcined for 1 h, while Figure 24j is an HRTEM image showing one region on a
NW. The HRTEM image shows that each NW is made of multiple small grains with
different shapes and sizes. The measured d-spacings were 3.23 Å and 2.78 Å, which
corresponds to the interplanar distance of 3.24 Å for the (004) planes and 2.77 Å for the
(233) planes, respectively, for c-LLZO121. The bottom-right inset is the SAED pattern of
a few grains, with some major reflections labelled. As shown in the SEM and TEM
images, if two NWs were in contact with each other, they could merge and form a
‘junction’ during calcination. Hence, the materials after calcination can be described as
clusters or aggregates of multiple NWs connected together. In contrast, the c-LLZO NWs
prepared from the aqueous precursor (Figure 24b) are characterized by ligaments with
rounded ends and fewer connections with neighboring particles. Hence, the c-LLZO
NWs prepared using the DMF-based precursors have more advantageous morphologies
to serve as interconnected CPE fillers that can create continuous Li+ diffusion pathways.

83
Figure 24. (a)-(h): SEM images of electrospun NWs. All calcinations were performed at
700 °C (a) As-spun NWs. (b) c-LLZO NWs prepared using water-based precursor and
calcined for 3 h. (c)-(h): c-LLZO NWs prepared using DMF-based precursor and
calcined for (c),(e),(g) 1 h or (d),(f),(h) 3 h. (c)-(d): undoped LLZO; (e)-(f): Al-LLZO;
(g)-(h): Ta-LLZO. (i) TEM image and (j) HRTEM image of undoped c-LLZO NWs
prepared from DMF-based precursor and calcined for 1 h. Inset is the corresponding
SAED pattern.

84
Figure 25. (a) Diameter distribution of the 1 h calcined undoped LLZO NWs. EDS
spectra of (b) Al-LLZO and (c) Ta-LLZO, both calcined at 700 °C for 1 h.
XRD analysis revealed that the undoped NW product was predominately c-LLZO
(Figure 26a) after calcination, but a small degree of bifurcation (peak doublets) was
observed in some high angle peaks, indicating the presence of some t-LLZO (Figure
26c). However, both Al-LLZO and Ta-LZZO samples also displayed XRD peak doublets
as well (Figure 26c), suggesting that the dopants did not fully stabilize the c-LLZO
structure. The rapid heat treatment (1 h calcination) likely resulted in a non-uniform
distribution of dopants within the grains of the NWs, leading to formation of c-LLZO
(stabilized by dopants) and t-LLZO in the undoped regions. This can also explain the
presence of secondary phases in the two doped samples. La2Zr2O7 was found in Al-LLZO
and La2O3 in Ta-LLZO, which could be caused by incomplete reaction61,126,127 or Li+ loss
due to volatilization during calcination110,126, with the former scenario being more likely
since the heat treatment time was very short. Undoped samples subjected to 3 h
calcination under the same conditions displayed particle coalescence and loss of the NW
morphology (Figure 24d), along with more pronounced peak bifurcation in the XRD
pattern (Figure 26c). This is consistent with our previous observations that longer heating
times cause particle coalescence and increase the fraction of t-LLZO (Chapter III). For
Al-LLZO and Ta-LLZO, although 3-hour calcination also destroyed the NW morphology

85
(Figure 24f and h, respectively), the t-LLZO peak doublets disappeared (Figure 26c).
These results show that the incorporation of dopants was indeed limited by the kinetics in
this situation. Unlike our previous work, in which the NWs prepared from water-based
precursors required 3 h of calcination to completely crystallize into c-LZZO, the NWs
from DMF-based precursors required only 1 h to form c-LLZO at the same temperature,
even without requiring the dopants.
Figure 26. XRD patterns of LLZO NW samples after calcination for (a) 1 h and (b) 3 h at
700 °C; (c) zoomed-in patterns at the region around 52°. (*: La2Zr2O7; ●: La2O3)
The SEM image in Figure 27a shows a top-down view of a CPE film containing 5
wt% of undoped LLZO NWs. It can be see that the NWs were embedded within the

86
polymer matrix, but the dispersion was not highly uniform, as some clusters/aggregates
of NWs were observed. EIS measurements were performed using the configuration in
Figure 27b and the equivalent circuit used for data fitting is shown in Figure 27c, which
was previously applied to CPEs with ceramic fillers164. Here Qc is a constant phase
element for the bulk capacitance of the CPE, Rc is the overall resistance of the film, and
Qel is a constant phase element for the capacitances at the electrode interfaces. The
representative total ionic conductivity (σ) of various CPE films obtained at 20 °C is
shown in Table 3, normalized by the thickness of each individual film. The associated
Nyquist plots are shown in Figure 27d, with the high-frequency region shown in Figure
27e. As expected, all of the CPEs displayed higher conductivities than the blank sample
containing only PAN and LiClO4, which had an ionic conductivity ~10-7 S/cm and a
Nyquist plot (Figure 28a) similar to previous reports43–45. Figure 28b shows the Nyquist
plots of CPEs loaded with undoped LLZO NWs at different weight percentages. The
peak conductivity of 1.31 × 10⁻⁴ S/cm was observed when using 5 wt% loading, but this
decreased when the wt% of filler was increased further. This was likely due to an
increase in the amount of aggregated NW clusters as the wt% increased, which was also
observed in PAN-based CPEs containing LLTO NW fillers.45 EIS measurements of the
CPE containing 5 wt% of undoped LLZO NWs were studied further at different
temperatures (Figure 28c). The activation energy, Ea, was calculated to be 0.12 eV from
the Arrhenius plot (Figure 27g).

87
Figure 27. (a) SEM image (top-down view) of a CPE film with 5 wt% undoped LLZO
NWs. (b) Schematic of the EIS test setup. (c) Equivalent circuit used for EIS data fitting.
(d) Representative Nyquist plots of CPEs embedded with 5 wt% of different filler
materials, all tested at 20 °C and normalized by film thickness. (e) Zoomed-in view of the
region marked by dashed lines in (d). (f) Ionic conductivity comparison of CPEs
embedded with different wt% of undoped LLZO NWs at 20 °C, with the conductivity of
a blank sample for reference. Each point is the average of three measurements and the
error bars indicate the standard deviation. (g) Arrhenius plot of CPE with 5 wt% undoped
LLZO NWs. Each point is the average of two measurements.

88
Figure 28. (a) Nyquist plot of a blank sample composed of 66.7 wt% PAN and 33.3 wt%
LiClO4, tested at 20 °C. (b) Nyquist plots of CPEs embedded with different wt% of
undoped LLZO NWs, tested at 20 °C and normalized by film thickness. (c) Nyquist plots
of samples embedded with 5 wt% undoped LLZO NWs, tested at different temperatures
and normalized by film thickness. Inset shows a zoomed-in view of the region marked by
dashed lines.

89
Table 3. Ionic conductivity of different samples at 20 °C
Ceramic Type Wt% of Filler σ (S/cm)
None
(LiClO4 in PAN only) 0 4.06 × 10⁻⁷
Undoped LLZO NWs
1 6.17 × 10⁻⁶
2.5 1.00 × 10⁻⁵
5 1.31 × 10⁻⁴
10 2.52 × 10⁻⁶
15 3.10 × 10⁻⁶
Al-doped LLZO NWs 5 1.27 × 10⁻⁴
Ta-doped LLZO NWs 5 1.50 × 10⁻⁴
BM-LLZO NPs 5 1.13 × 10⁻⁵
Al2O3 NWs 5 1.52 × 10⁻⁵
In order to investigate the effect of dopants in the LLZO on the overall ionic
conductivity of the composite, CPEs loaded with 5 wt% Al- or Ta-LLZO NWs were
prepared and tested. The EIS results showed that the CPEs with doped LLZO NW fillers
had similar ionic conductivities, ~10-4 S/cm, as the CPEs with undoped LLZO NWs
(Table 3), suggesting that the Li+ conduction mechanism through the CPEs is dominated
by a polymer/filler interfacial phenomenon that is independent of the LLZO filler
composition. When undoped c-LLZO NPs (average particle size ~25 nm, Figure 29)
prepared by ball milling bulk t-LLZO (BM-LLZO NPs) were used as fillers with 5 wt%
loading, the total ionic conductivity measured was 1.13 × 10⁻⁵ S/cm (Figure 27d), roughly
an order of magnitude lower than with LLZO NW fillers. This indicates that the NW
morphology was important for the increased conductivity of the CPEs. Since the BM-
LLZO NPs had much smaller diameters than the LLZO NWs, this suggests that the local
continuous conduction pathways provided by the NWs are more important than the small

90
particle diameters, which has previously been shown to play a large role in the
plasticizing effect for spherical fillers34,35.
Figure 29. Bulk undoped LLZO after ball milling (BM-LLZO NPs): (a) SEM image; (b)
XRD patterns with c-LLZO reference. The LLZO adopted the c-LLZO structure after
ball milling and could maintain this structure even after 4-month storage. (*: Artifact
peaks from instrument)
Since previous studies45,165 have shown that the intrinsic ionic conductivity of the
filler materials can also play an important role in the ionic conductivity of the CPE, 5
wt% Al2O3 NWs were used as passive fillers. The total ionic conductivity at room
temperature was similar to that of the CPE with BM-LLZO NPs, but still higher than the
conductivity of the blank sample containing only PAN and LiClO4. These results suggest
that the ceramic fillers should be made of ‘active’ Li+ conductors with NW morphology
in order to obtain CPEs with high ionic conductivity. However, since all of the LLZO
NW samples displayed an ionic conductivity with similar order of magnitude, it appears
that the presence of dopants is not crucial. Using the undoped c-LLZO NW as filler is
advantageous because these materials had fewer impurities and better NW morphology
than the doped samples.

91
To better understand the Li+ local environment and transport mechanism in the
LLZO-PAN CPEs, solid-state Li NMR was performed with selective 6Li-isotope
labelling and a 6Li-7Li isotope-replacement strategy. This method was established in a
previous study to map out Li+ pathways in CPEs comprising 50 wt% Al-doped LLZO
particles in a PEO matrix. It was determined that there is preferential transport of Li+
through the LLZO phase rather than the polymer phase or polymer-LLZO interface.49
The method builds on the basis that 6Li replaces 7Li during Li+ transport; by evaluating
changes in the 6Li amount in the CPE before and after electrochemical cycling, the Li+
transport pathway can be determined. As shown in Figure 30a, the possible Li+ transport
pathways in the CPE in this work are through the polymer phase, through the LLZO NW
phase, or through the interface region between the polymer and LLZO. In order to
experimentally determine the actual Li+ pathway in this CPE, it is necessary to first
distinguish the Li ions in these three different local environments. Figure 30b shows the
high-resolution 6Li NMR spectra for the CPE containing 5 wt% undoped LLZO NWs, a
blank film containing only PAN and LiClO4, and the undoped LLZO NW powder. The
6Li resonance in the undoped LLZO NWs was observed at 2.3 ppm, which is similar to
what was observed in Al-doped LLZO in previous studies.49 This resonance was not
observed in the 6Li NMR spectrum for the CPE, indicating that the amount of LLZO was
too small. The 6Li resonance of the LiClO4 within the PAN in the blank film appeared at
0.90 ppm. In the NMR spectrum of the CPE, in addition to the 0.90 ppm peak, a new
resonance was observed at 0.85 ppm. This resonance is attributed to LiClO4 within the
PAN with a local structural environment modified by the LLZO NW fillers, i.e. at the
PAN/LLZO interfacial regions. Quantification of the Li NMR spectrum of the CPE

92
reveals that 37.4% of the Li resonates at 0.85 ppm and 62.6% of the Li at 0.90 ppm,
which suggests that 37.4% of the PAN polymer matrix is modified by the LLZO NW
filler.
To identify the preferred Li+ diffusion pathway in the CPE, symmetric 6Li
foil/CPE/6Li foil cells were assembled and tested galvanostatically (Figure 31). After 10
cycles, the 6Li NMR spectrum was acquired. As shown in Figure 30c, the intensity of the
resonance at 0.85 ppm increased after cycling, while the intensity of the resonance at 0.9
ppm did not change. This indicates that Li+ prefer to travel through this LLZO-modified
PAN phase rather than the unmodified PAN regions. This mechanism is different from
what occurs in PEO-based CPEs containing 50 wt% Al-doped LLZO particles, wherein
the Li+ transport is preferred through an interconnected LLZO percolation network,
despite the formation of an local Li+ environment at the interface between the LLZO and
PEO that is detected using NMR.49 For the films containing 5 wt% of LLZO NWs
(corresponding to 2 vol%), there is insufficient LLZO to form a percolation network to
enable Li+ transport solely through the LLZO phase. However, these results show that for
the PAN-based CPEs, very little LLZO is required to modify a significant fraction of the
Li+ local environment in the polymer phase and improve the ionic conductivity.

93
Figure 30. (a) Schematic showing possible Li+ transport pathways in the CPE. (b) 6Li
NMR spectra of CPE sample containing 5 wt% undoped LLZO NWs, blank sample with
only PAN and LiClO4, and undoped LLZO NW powder. (c) 6Li NMR spectra
comparison between the as-made (pristine) and cycled CPEs containing 5 wt% undoped
LLZO NWs. The cycled CPE had undergone 10 galvanostatic charge/discharge cycles in
a symmetric 6Li cell using 7.2 µA/cm2.
Figure 31. Galvanostatic cycling data of a symmetric 6Li foil/CPE/6Li foil cell. The area
of 6Li electrodes is 1.5386 cm2. The CPE contains 5 wt% undoped LLZO NWs.

94
Unlike PEO-based CPEs, in which ionic conductivity is increased by introduction
of ceramic fillers acting as plasticizers to decrease the crystallinity of the polymer and
enhance Li+ transport through amorphous PEO regions34, previous studies demonstrated
that introduction of ceramic fillers does not significantly change the crystallinity of PAN
films containing Li+ salts43,45. XRD of the blank sample and CPE with 5 wt% undoped
LLZO NWs also confirmed that the PAN was amorphous in both cases (Figure 32).
Instead, LLZO NW fillers could improve the ionic conductivity of the CPE by increasing
the Li+ dissociation from the ClO4- anion, which would increase the concentration of free
Li+ in the CPE44,166,167. This has been observed in CPEs using ceramic fillers with high
dielectric constants and Lewis base surface groups with high affinity to the salt anion37,168.
The dielectric constants (relative permittivities) of doped c-LLZO materials have been
reported to be in the range of 40 – 60169,170. This is much higher than the dielectric
constant of 9 for Al2O3171, indicating that LLZO can better promote ionic dissociation of
the salt. Differences between the Lewis basicity of Al2O3 and LLZO may also explain the
observed differences in conductivity for the CPEs containing either type of NW filler.
Al2O3 is amphoteric and contains both surface Lewis acid centers (Al) and Lewis base
centers (O)37. Although the acid-base properties of LLZO has, to our knowledge, not
been thoroughly investigated yet, the negatively charged Li+ vacancies created by
Al118,163,172 and Ta132,173 doping should act as strong Lewis base centers. Li+ vacancies
may also play a role in the stabilization of the c-LLZO structure117,118,132 in the undoped
LLZO NW samples, although this needs to be further investigated. We also note that the
ionic conductivities of our CPEs are of the same order of magnitude but roughly half of
those reported by Liu, et al.45, who observed a peak conductivity using 15 wt% LLTO

95
NWs with average diameter of 223 nm. Similar to LLZO, LLTO is also characterized by
Li+ vacancies82. Currently, it is not clear why only 5 wt% loading of LLZO NWs was
needed to reach the peak CPE conductivity in our study, and why the peak value is lower
than what was observed with the LLTO NWs. However, this could be due to differences
in NW diameter and aggregation, differences in the intrinsic ionic conductivity of LLTO
vs. LLZO, in addition to the aforementioned dielectric and Lewis base properties of the
materials. Also, since there was no elucidation of the conductivity-enhancing mechanism
or Li+ transport pathways in the study using LLTO NW fillers, there could be other
potential causes that are still unknown.
Figure 32. XRD patterns of blank sample (PAN with 33.3 wt% LiClO4) and CPE
containing 5 wt% undoped LLZO NWs, with c-LLZO for reference. (*: Artifact peaks
from instrument)
Galvanostatic cycling was also performed to test the durability of the CPE sample
containing 5 wt% undoped LLZO NWs (Figure 33a). The CPE film was sandwiched
between two Li foils and tested at 20 °C, with a constant current density of 50 µA/cm2
and changing the sign of the current every 300 s. It can be seen that there was an overall

96
decrease in the cell voltage, which is similar to other studies.66,174 At around the 535th
cycle, a sudden voltage drop was observed (Figure 33b), which is characteristic of the
penetration of the CPE film by Li dendrites, leading to failure of the cell.174,175 For
comparison, a blank film containing no LLZO fillers was cycled under the same
conditions and the result is shown in Figure 33c. The overall cell voltage remained stable
until it failed at the 492nd cycle (Figure 33d), which is about 92% of the lifetime of the
CPE containing 5 wt% undoped LLZO NWs. It should be noted that the data presented in
Figure 33b are the best cycling result obtained from our blank samples. All other blank
samples either failed at very early stages (e.g. at the 221st cycle), or did not display stable
cell voltages (Figure 34). These results imply that adding an appropriate amount of
undoped LLZO NWs may have also reinforced the polymer matrix and made it
mechanically stronger, similar to what has been observed in other nanocomposite
polymer electrolytes29,34,45,49,66,176, which helped to resist the piercing of the CPE from
growing Li dendrites. Further mechanical property testing in the future may help to shed
light on this enhancement in cycling durability.
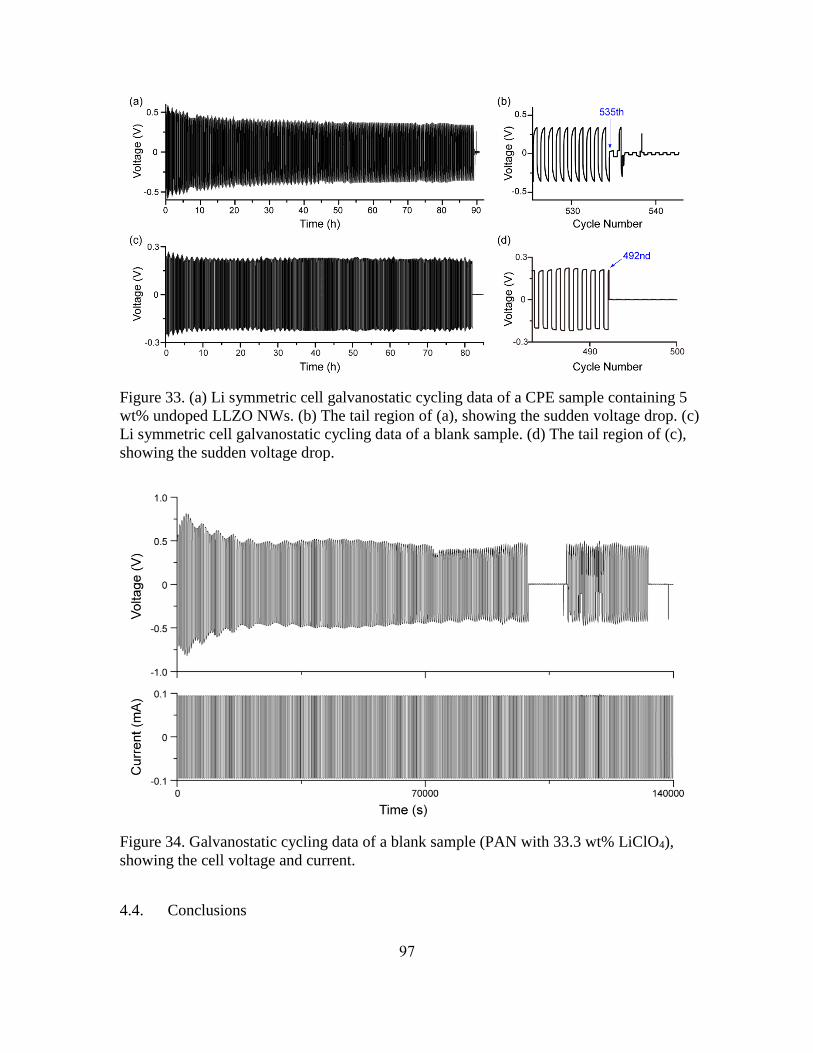
97
Figure 33. (a) Li symmetric cell galvanostatic cycling data of a CPE sample containing 5
wt% undoped LLZO NWs. (b) The tail region of (a), showing the sudden voltage drop. (c)
Li symmetric cell galvanostatic cycling data of a blank sample. (d) The tail region of (c),
showing the sudden voltage drop.
Figure 34. Galvanostatic cycling data of a blank sample (PAN with 33.3 wt% LiClO4),
showing the cell voltage and current.
4.4. Conclusions

98
In summary, CPEs with LLZO NWs as ceramic fillers were fabricated and
showed great improvement in the room temperature ionic conductivity of a PAN-based
polymer electrolyte to the scale of 10-4 S/cm. The optimal mass loading for undoped
LLZO NWs was determined to be 5 wt%. Doping of the LLZO did not have a
pronounced influence on the ionic conductivity of the CPE, as films containing Al- and
Ta-doped LLZO NWs displayed similar conductivity as those with the undoped LLZO
NWs. NMR results showed that the presence of LLZO NWs partially altered the PAN
polymer matrix, and that Li+ diffusion occurred preferentially in those modified regions.
We also demonstrated that both intrinsic ionic conductivity and NW morphology were
required for the filler materials to achieve maximum effectiveness.

99
V: SUMMARY
It has been demonstrated that electrospinning is very effective in producing NWs
made of oxide materials, such as LLTO and LLZO. Pellets made from electrospun LLTO
NWs had their density greatly increased over the ones made from LLTO powders
synthesized through conventional sol-gel method, which was attributed to the reduced
agglomeration brought by the shape and morphology of the NWs. As a result, the Li+
conductivity was largely improved in the NW-made pellets. Electrospun LLZO NWs
enabled the observation of a particle size related phase transformation phenomenon, in
which undoped c-LLZO could be stabilized at room temperature when the grain size is
below some critical value, and would change back to t-LLZO when the grain grew larger.
It was proved preliminarily that this phenomenon is due to the difference in the surface
energy of the two polymorphs. LLZO NWs was also incorporated as fillers into a PAN-
LiClO4 matrix to form a flexible CPE. The CPE showed the highest ionic conductivity
when the added undoped LLZO NWs was at 5 wt%. It was decided that both filler
morphology and the intrinsic Li+ conductivity of the filler were two of the crucial factors
to the overall ionic conductivity of the CPE. NMR studies showed that the addition of
undoped LLZO NWs modified the interface regions between the fillers and the polymer
matrix, and acted as the preferential conduction pathways for Li+ transport.

100
REFERENCES
(1) Tarascon, J.-M.; Armand, M. Issues and Challenges Facing Rechargeable Lithium
Batteries. Nature 2001, 414, 359–367.
(2) Whittingham, M. S. Electrical Energy Storage and Intercalation Chemistry.
Science (80-. ). 1976, 192, 1126–1127.
(3) Huggins, R. A. Negative Electrodes in Lithium Cells. In Advanced Batteries:
Materials Science Aspects; Springer US: New York, 2009; pp. 123–149.
(4) Yazami, R.; Touzain, P. A Reversible Graphite-Lithium Negative Electrode for
Electrochemical Generators. J. Power Sources 1983, 9, 365–371.
(5) Mizushima, K.; Jones, P. C.; Wiseman, P. J.; Goodenough, J. B. LixCoO2 (0<x<-
1): A New Cathode Material for Batteries of High Energy Density. Mater. Res.
Bull. 1980, 15, 783–789.
(6) Whittingham, M. S. Lithium Batteries and Cathode Materials. Chem. Rev. 2004,
104, 4271–4302.
(7) Nagaura, T.; Tozawa, K. Lithium Ion Rechargeable Battery. Prog. Batter. Sol.
Cells 1990, 9, 209.
(8) Arora, P.; Zhang, Z. Battery Separators. Chem. Rev. 2004, 104, 4419–4462.
(9) Goodenough, J. B.; Kim, Y. Challenges for Rechargeable Li Batteries. Chem.
Mater. 2010, 22, 587–603.
(10) Balakrishnan, P. G.; Ramesh, R.; Prem Kumar, T. Safety Mechanisms in Lithium-
Ion Batteries. J. Power Sources 2006, 155, 401–414.
(11) Dudley, B. Lithium-ion batteries pack a lot of energy — and challenges
http://www.seattletimes.com/business/lithium-ion-batteries-pack-a-lot-of-energy-
mdash-and-challenges/.
(12) Ivory, D. Federal Safety Agency Ends Its Investigation of Tesla Fires. The New
York Times, 2014, B4.
(13) Dreamliner: Boeing 787 planes grounded on safety fears
http://www.bbc.com/news/business-21054089.
(14) Samsung Expands Recall to All Galaxy Note7 Devices
http://www.samsung.com/us/note7recall/ (accessed Oct 13, 2016).
(15) Quartarone, E.; Mustarelli, P. Electrolytes for Solid-State Lithium Rechargeable
Batteries: Recent Advances and Perspectives. Chem. Soc. Rev. 2011, 40, 2525–
2540.

101
(16) Cao, C.; Li, Z.-B.; Wang, X.-L.; Zhao, X.-B.; Han, W.-Q. Recent Advances in
Inorganic Solid Electrolytes for Lithium Batteries. Front. Energy Res. 2014, 2, 1–
10.
(17) Chen, R.; Qu, W.; Guo, X.; Li, L.; Wu, F. The Pursuit of Solid-State Electrolytes
for Lithium Batteries: From Comprehensive Insight to Emerging Horizons. Mater.
Horiz. 2016.
(18) Hayashi, K.; Nemoto, Y.; Tobishima, S.; Yamaki, J. Electrolyte for High Voltage
Li/LiMn1.9Co0.1O4 Cells. J. Power Sources 1997, 68, 316–319.
(19) Knauth, P. Inorganic Solid Li Ion Conductors: An Overview. Solid State Ionics
2009, 180, 911–916.
(20) Fergus, J. W. Ceramic and Polymeric Solid Electrolytes for Lithium-Ion Batteries.
J. Power Sources 2010, 195, 4554–4569.
(21) Xiang, H.; Chen, J.; Li, Z.; Wang, H. An Inorganic Membrane as a Separator for
Lithium-Ion Battery. J. Power Sources 2011, 196, 8651–8655.
(22) Gaines, L.; Cuenca, R. Costs of Lithium-Ion Batteries for Vehicles; 2000.
(23) Daniel, C. Materials and Processing for Lithium-Ion Batteries. JOM 2008, 60, 43–
48.
(24) Dudney, N. J. Glass and Ceramic Electrolytes for Lithium and Lithium-Ion
Batteries. In Lithium Batteries - Science and Technology; Nazri, G.-A.; Pistoia, G.,
Eds.; Springer US, 2003; pp. 624–642.
(25) Fergus, J. W. Recent Developments in Cathode Materials for Lithium Ion
Batteries. J. Power Sources 2010, 195, 939–954.
(26) Ren, Y.; Chen, K.; Chen, R.; Liu, T.; Zhang, Y.; Nan, C.-W. Oxide Electrolytes
for Lithium Batteries. J. Am. Ceram. Soc. 2015, 1–21.
(27) Manuel Stephan, A.; Nahm, K. S. Review on Composite Polymer Electrolytes for
Lithium Batteries. Polymer (Guildf). 2006, 47, 5952–5964.
(28) Fenton, D. E.; Parker, J. M.; Wright, P. V. Complexes of Alkali Metal Ions with
Poly(ethylene Oxide). Polymer (Guildf). 1973, 14, 589.
(29) Agrawal, R. C.; Pandey, G. P. Solid Polymer Electrolytes: Materials Designing
and All-Solid-State Battery Applications: An Overview. J. Phys. D Appl. Phys.
2008, 41, 223001.
(30) Armand, M. The History of Polymer Electrolytes. Solid State Ionics 1994, 69,
309–319.
(31) Meyer, W. H. Polymer Electrolytes for Lithium-Ion Batteries. Adv. Mater. 1998,
10, 439–448.

102
(32) Kumar, B.; Scanlon, L. G. Polymer-Ceramic Composite Electrolytes. J. Power
Sources 1994, 52, 261–268.
(33) Nairn, K.; Forsyth, M.; Every, H.; Greville, M.; MacFarlane, D. R. Polymer-
Ceramic Ion-Conducting Composites. Solid State Ionics 1996, 86–88, 589–593.
(34) Croce, F.; Appetecchi, G. B.; Persi, L.; Scrosati, B. Nanocomposite Polymer
Electrolytes for Lithium Batteries. Nature 1998, 394, 456–458.
(35) Jayathilaka, P. A. R. D.; Dissanayake, M. A. K. L.; Albinsson, I.; Mellander, B.-E.
Effect of Nano-Porous Al2O3 on Thermal, Dielectric and Transport Properties of
the (PEO)9LiTFSI Polymer Electrolyte System. Electrochim. Acta 2002, 47, 3257–
3268.
(36) Wieczorek, W.; Florjanczyk, Z.; Stevens, J. R. Composite Polyether Based Solid
Electrolytes. Electrochim. Acta 1995, 40, 2251–2258.
(37) Wieczorek, W.; Stevens, J. R.; Florjańczyk, Z. Composite Polyether Based Solid
Electrolytes. The Lewis Acid-Base Approach. Solid State Ionics 1996, 85, 67–72.
(38) Croce, F.; Curini, R.; Martinelli, A.; Persi, L.; Ronci, F.; Scrosati, B.; Caminiti, R.
Physical and Chemical Properties of Nanocomposite Polymer Electrolytes. J.
Phys. Chem. B 1999, 103, 10632–10638.
(39) Croce, F.; Persi, L. L.; Scrosati, B.; Serraino-Fiory, F.; Plichta, E.; Hendrickson,
M. A. Role of the Ceramic Fillers in Enhancing the Transport Properties of
Composite Polymer Electrolytes. Electrochim. Acta 2001, 46, 2457–2461.
(40) Huggins, R. A. Simple Method to Determine Electronic and Ionic Components of
the Conductivity in Mixed Conductors A Review. Ionics (Kiel). 2002, 8, 300–313.
(41) Yao, X.; Huang, B.; Yin, J.; Peng, G.; Huang, Z.; Gao, C.; Liu, D.; Xu, X. All-
Solid-State Lithium Batteries with Inorganic Solid Electrolytes: Review of
Fundamental Science. Chin. Phys. B 2016, 25, 18802.
(42) Bachman, J. C.; Muy, S.; Grimaud, A.; Chang, H.-H.; Pour, N.; Lux, S. F.;
Paschos, O.; Maglia, F.; Lupart, S.; Lamp, P.; et al. Inorganic Solid-State
Electrolytes for Lithium Batteries: Mechanisms and Properties Governing Ion
Conduction. Chem. Rev. 2016, 116, 140–162.
(43) Chen-Yang, Y. W.; Chen, H. C.; Lin, F. J.; Chen, C. C. Polyacrylonitrile
Electrolytes: 1. A Novel High-Conductivity Composite Polymer Electrolyte Based
on PAN, LiClO4 and α-Al2O3. Solid State Ionics 2002, 150, 327–335.
(44) Yang, C. R.; Perng, J. T.; Wang, Y. Y.; Wan, C. C. Conductive Behaviour of
Lithium Ions in Polyacrylonitrile. J. Power Sources 1996, 62, 89–93.
(45) Liu, W.; Liu, N.; Sun, J.; Hsu, P.-C.; Li, Y.; Lee, H.-W.; Cui, Y. Ionic
Conductivity Enhancement of Polymer Electrolytes with Ceramic Nanowire

103
Fillers. Nano Lett. 2015, 15, 2740–2745.
(46) Cheng, L.; Crumlin, E. J.; Chen, W.; Qiao, R.; Hou, H.; Franz Lux, S.; Zorba, V.;
Russo, R.; Kostecki, R.; Liu, Z.; et al. The Origin of High Electrolyte-Electrode
Interfacial Resistances in Lithium Cells Containing Garnet Type Solid
Electrolytes. Phys. Chem. Chem. Phys. 2014, 16, 18294–18300.
(47) Cheng, L.; Chen, W.; Kunz, M.; Persson, K.; Tamura, N.; Chen, G.; Doeff, M.
Effect of Surface Microstructure on Electrochemical Performance of Garnet Solid
Electrolytes. ACS Appl. Mater. Interfaces 2015, 7, 2073–2081.
(48) Chen, R.-J.; Huang, M.; Huang, W.-Z.; Shen, Y.; Lin, Y.-H.; Nan, C.-W. Sol–gel
Derived Li–La–Zr–O Thin Films as Solid Electrolytes for Lithium-Ion Batteries. J.
Mater. Chem. A 2014, 2, 13277–13282.
(49) Zheng, J.; Tang, M.; Hu, Y.-Y. Lithium Ion Pathway within Li7La3Zr2O12 -
Polyethylene Oxide Composite Electrolytes. Angew. Chem. 2016, 128, 12726–
12730.
(50) Richards, W. D.; Miara, L. J.; Wang, Y.; Kim, J. C.; Ceder, G. Interface Stability
in Solid-State Batteries. Chem. Mater. 2016, 28, 266–273.
(51) Yu, S.; Schmidt, R. D.; Garcia-Mendez, R.; Herbert, E.; Dudney, N. J.;
Wolfenstine, J. B.; Sakamoto, J.; Siegel, D. J. Elastic Properties of the Solid
Electrolyte Li7La3Zr2O12 (LLZO). Chem. Mater. 2016, 28, 197–206.
(52) Gauthier, M.; Carney, T. J.; Grimaud, A.; Giordano, L.; Pour, N.; Chang, H.-H.;
Fenning, D. P.; Lux, S. F.; Paschos, O.; Bauer, C.; et al. The Electrode-Electrolyte
Interface in Li-Ion Batteries: Current Understanding and New Insights. J. Phys.
Chem. Lett. 2015, 6, 4653–4672.
(53) Anikeeva, P. O.; Halpert, J. E.; Bawendi, M. G.; Bulovic, V. Quantum Dot Light-
Emitting Devices with Electroluminescence Tunable over the Entire Visible
Spectrum. Nano Lett. 2009, 9, 2532–2536.
(54) Shirasaki, Y.; Supran, G. J.; Bawendi, M. G.; Bulovic, V. Emergence of Colloidal
Quantum-Dot Light-Emitting Technologies. Nat. Photonics 2012, 7, 13–23.
(55) Huang, X.; El-Sayed, M. A. Gold Nanoparticles: Optical Properties and
Implementations in Cancer Diagnosis and Photothermal Therapy. J. Adv. Res.
2010, 1, 13–28.
(56) Guo, D.; Xie, G.; Luo, J. Mechanical Properties of Nanoparticles: Basics and
Applications. J. Phys. D. Appl. Phys. 2014, 47, 13001.
(57) Aricò, A. S.; Bruce, P.; Scrosati, B.; Tarascon, J.-M.; van Schalkwijk, W.
Nanostructured Materials for Advanced Energy Conversion and Storage Devices.
Nat. Mater. 2005, 4, 366–377.

104
(58) Chiang, Y.-M.; Lavik, E. B.; Kosacki, I.; Tuller, H. L.; Ying, J. Y.
Nonstoichiometry and Electrical Conductivity of Nanocrystalline CeO2-X. J.
Electroceramics 1997, 1, 7–14.
(59) Kim, S.; Fleig, J.; Maier, J. Space Charge Conduction: Simple Analytical
Solutions for Ionic and Mixed Conductors and Application to Nanocrystalline
Ceria. Phys. Chem. Chem. Phys. 2003, 5, 2268–2273.
(60) Tenhaeff, W. E.; Rangasamy, E.; Wang, Y.; Sokolov, A. P.; Wolfenstine, J.;
Sakamoto, J.; Dudney, N. J. Resolving the Grain Boundary and Lattice Impedance
of Hot-Pressed Li7La3Zr2O12 Garnet Electrolytes. ChemElectroChem 2014, 1,
375–378.
(61) Sakamoto, J.; Rangasamy, E.; Kim, H.; Kim, Y.; Wolfenstine, J. Synthesis of
Nano-Scale Fast Ion Conducting Cubic Li7La3Zr2O12. Nanotechnology 2013, 24,
424005.
(62) Chan, C. K.; Peng, H.; Twesten, R. D.; Jarausch, K.; Zhang, X. F.; Cui, Y. Fast,
Completely Reversible Li Insertion in Vanadium Pentoxide Nanoribbons. Nano
Lett. 2007, 7, 490–495.
(63) Chan, C. K.; Peng, H.; Liu, G.; McIlwrath, K.; Zhang, X. F.; Huggins, R. A.; Cui,
Y. High-Performance Lithium Battery Anodes Using Silicon Nanowires. Nat.
Nanotechnol. 2008, 3, 31–35.
(64) Chan, C. K.; Zhang, X. F.; Cui, Y. High Capacity Li Ion Battery Anodes Using Ge
Nanowires. Nano Lett. 2008, 8, 307–309.
(65) Chan, C. K.; Patel, R. N.; O’Connell, M. J.; Korgel, B. A.; Cui, Y. Solution-Grown
Silicon Nanowires for Lithium-Ion Battery Anodes. ACS Nano 2010, 4, 1443–
1450.
(66) Fu, K. (Kelvin); Gong, Y.; Dai, J.; Gong, A.; Han, X.; Yao, Y.; Wang, C.; Wang,
Y.; Chen, Y.; Yan, C.; et al. Flexible, Solid-State, Ion-Conducting Membrane with
3D Garnet Nanofiber Networks for Lithium Batteries. P. Natl. Acad. Sci. USA
2016, 113, 7094–7099.
(67) Impedance Spectroscopy Theory, Experiment, and Applications; Barsoukov, E.;
MacDonald, J. R., Eds.; 2nd ed.; John Wiley & Sons, Inc.: Hoboken, NJ, 2005.
(68) Van Dijk, T.; Burggraaf, A. J. Grain Boundary Effects on Ionic Conductivity in
Ceramic GdxZr1-xO2-(x/2) Solid Solutions. Phys. Status Solidi 1981, 63, 229–240.
(69) Verkerk, M. J.; Middelhuis, B. J.; Burggraaf, A. J. Effect of Grain Boundaries on
the Conductivity of High-Purity ZrO2-Y2O3 Ceramics. Solid State Ionics 1982, 6,
159–170.
(70) Haile, S. M.; West, D. L.; Campbell, J. The Role of Microstructure and Processing
on the Proton Conducting Properties of Gadolinium-Doped Barium Cerate. J.

105
Mater. Res. 1998, 13, 1576–1595.
(71) KINGERY, W. D. Plausible Concepts Necessary and Sufficient for Interpretation
of Ceramic Grain-Boundary Phenomena: I, Grain-Boundary Characteristics,
Structure, and Electrostatic Potential. J. Am. Ceram. Soc. 1974, 57, 1–8.
(72) KINGERY, W. D. Plausible Concepts Necessary and Sufficient for Interpretation
of Ceramic Grain-Boundary Phenomena: II, Solute Segregation, Grain-Boundary
Diffusion, and General Discussion*. J. Am. Ceram. Soc. 1974, 57, 74–83.
(73) Bauerle, J. E. Study of Solid Electrolyte Polarization by a Complex Admittance
Method. J. Phys. Chem. Solids 1969, 30, 2657–2670.
(74) Armstrong, R. D.; Dickinson, T.; Willis, P. M. The A.C. Impedance of Powdered
and Sintered Solid Ionic Conductors. J. Electroanal. Chem. Interfacial
Electrochem. 1974, 53, 389–405.
(75) Ho, C.; Raistrick, I. D.; Huggins, R. A. Application of A-C Techniques to the
Study of Lithium Diffusion in Tungsten Trioxide Thin Films. J. Electrochem. Soc.
1980, 127, 343.
(76) Li, D.; Xia, Y. Electrospinning of Nanofibers: Reinventing the Wheel? Adv.
Mater. 2004, 16, 1151–1170.
(77) Boys, C. V. On the Production, Properties, and Some Suggested Uses of the Finest
Threads. Proc. Phys. Soc. London 1887, 9, 8–19.
(78) Taylor, G. Disintegration of Water Drops in an Electric Field. Proc. Roy. Soc.
Lond. A 1964, 280, 383–397.
(79) Taylor, G. The Force Exerted by an Electric Field on a Long Cylindrical
Conductor. Proc. Roy. Soc. Lond. A 1966, 291, 145–158.
(80) Taylor, G. Electrically Driven Jets. Proc. Roy. Soc. Lond. A 1969, 313, 453–475.
(81) Li, D.; Xia, Y. Fabrication of Titania Nanofibers by Electrospinning. Nano Lett.
2003, 3, 555–560.
(82) Stramare, S.; Thangadurai, V.; Weppner, W. Lithium Lanthanum Titanates: A
Review. Chem. Mater. 2003, 15, 3974–3990.
(83) Inaguma, Y.; Chen, L.; Itoh, M.; Nakamura, T.; Uchida, T.; Ikuta, H.; Wakihara,
M. High Ionic Conductivity in Lithium Lanthanum Titanate. Solid State Commun.
1993, 86, 689–693.
(84) Weppner, W.; Huggins, R. A. Determination of the Kinetic Parameters of Mixed-
Conducting Electrodes and Application to the System Li3Sb. J. Electrochem. Soc.
1977, 124, 1569–1578.
(85) Dokko, K.; Akutagawa, N.; Isshiki, Y.; Hoshina, K.; Kanamura, K. Preparation of

106
Three Dimensionally Ordered Macroporous LiLaTiO by Colloidal Crystal
Templating Process. Solid State Ionics 2005, 176, 2345–2348.
(86) Wöhrle, T.; Gómez-Romero, P.; Fries, T.; West, K.; Palacín, M. R.; Casañ-Pastor,
N. Sol-Gel Synthesis of the Lithium-Ion Conducting Perovskite La0.57Li0.3TiO3
Effect of Synthesis and Thermal Treatments on the Structure and Conducting
Properties. Ionics (Kiel). 1996, 2, 442–445.
(87) Fourquet, J. L.; Duroy, H.; Crosnier-Lopez, M. P. Structural and Microstructural
Studies of the Series La2/3−xLi3x□1/3−2xTiO3. J. Solid State Chem. 1996, 127, 283–
294.
(88) Ibarra, J.; Várez, A.; León, C.; Santamarıa, J.; Torres-Martınez, L. M.; Sanz, J.
Influence of Composition on the Structure and Conductivity of the Fast Ionic
Conductors La2/3−xLi3xTiO3 (0.03≤x≤0.167). Solid State Ionics 2000, 134, 219–
228.
(89) Bohnke, C.; Regrag, B.; Le Berre, F.; Fourquet, J.-L.; Randrianantoandro, N.
Comparison of pH Sensitivity of Lithium Lanthanum Titanate Obtained by Sol-
Gel Synthesis and Solid State Chemistry. Solid State Ionics 2005, 176, 73–80.
(90) Kitaoka, K.; Kozuka, H.; Hashimoto, T.; Yoko, T. Preparation of La0.5Li0.5TiO3
Perovskite Thin Films by the Sol-Gel Method. J. Mater. Sci. 1997, 32, 2063–2070.
(91) Bohnke, O.; Emery, J.; Fourquet, J.-L. Anomalies in Li+ Ion Dynamics Observed
by Impedance Spectroscopy and 7Li NMR in the Perovskite Fast Ion Conductor
(Li3xLa2/3-x□1/3-2x)TiO3. Solid State Ionics 2003, 158, 119–132.
(92) Ban, C. W.; Choi, G. M. The Effect of Sintering on the Grain Boundary
Conductivity of Lithium Lanthanum Titanates. Solid State Ionics 2001, 140, 285–
292.
(93) Yang, K.-Y.; Wang, J.-W.; Fung, K.-Z. Roles of Lithium Ions and La/Li-Site
Vacancies in Sinterability and Total Ionic Conduction Properties of Polycrystalline
Li3xLa2/3−xTiO3 Solid Electrolytes (0.21≤3x≤0.50). J. Alloys Compd. 2008, 458,
415–424.
(94) Inaguma, Y.; Chen, L.; Itoh, M.; Nakamura, T. Candidate Compounds with
Perovskite Structure for High Lithium Ionic Conductivity. Solid State Ionics 1994,
70–71, 196–202.
(95) Kawai, H.; Kuwano, J. Lithium Ion Conductivity of A-Site Deficient Perovskite
Solid Solution La0.67-xLi3xTiO3. J. Electrochem. Soc. 1994, 141, 78–79.
(96) Harada, Y.; Ishigaki, T.; Kawai, H.; Kuwano, J. Lithium Ion Conductivity of
Polycrystalline Perovskite La0.67−xLi3xTiO3 with Ordered and Disordered
Arrangements of the A-Site Ions. Solid State Ionics 1998, 108, 407–413.
(97) Birke, P.; Scharner, S.; Huggins, R. A.; Weppner, W. Electrolytic Stability Limit

107
and Rapid Lithium Insertion in the Fast-Ion-Conducting Li0.29La0.57TiO3
Perovskite-Type Compound. J. Electrochem. Soc. 1997, 144, 167–169.
(98) Wolfenstine, J.; Allen, J. L.; Read, J.; Sakamoto, J.; Gonalez-Doncel, G. Hot-
Pressed Li0.33La0.57TiO3. J. Power Sources 2010, 195, 4124–4128.
(99) Milian Pila, C. R.; Otero, T. M.; Pérez Cappe, E.; Alves, O. L.; Aranda, P.; Frutis,
M. A.; Laffita, Y. M. Influence of Citrate/nitrate Ratio on the Preparation of
Li0.5La0.5TiO3 Nanopowder by Combustion Method. Ceram. Int. 2014, 40, 249–
256.
(100) Geng, H. X.; Mei, A.; Dong, C.; Lin, Y. H.; Nan, C. W. Investigation of Structure
and Electrical Properties of Li0.5La0.5TiO3 Ceramics via Microwave Sintering. J.
Alloys Compd. 2009, 481, 555–558.
(101) Mayo, M. J. Processing of Nanocrystalline Ceramics from Ultrafine Particles. Int.
Mater. Rev. 1996, 41, 85–115.
(102) Groza, J. R.; Dowding, R. J. Nanoparticulate Materials Densification.
NanoStructured Mater. 1996, 7, 749–768.
(103) Fang, Z. Z.; Wang, H. Densification and Grain Growth during Sintering of
Nanosized Particles. Int. Mater. Rev. 2008, 53, 326–352.
(104) Lu, K. Sintering of Nanoceramics. Int. Mater. Rev. 2008, 53, 21–38.
(105) Hou, L.; Hou, Y.-D.; Song, X.-M.; Zhu, M.-K.; Wang, H.; Yan, H. Sol-Gel-
Hydrothermal Synthesis and Sintering of K0.5Bi0.5TiO3 Nanowires. Mater. Res.
Bull. 2006, 41, 1330–1336.
(106) Hou, Y.-D.; Hou, L.; Zhang, T.-T.; Zhu, M.-K.; Wang, H.; Van, H.
(Na0.8K0.2)0.5Bi0.5TiO3 Nanowires: Low-Temperature Sol–Gel–Hydrothermal
Synthesis and Densification. In Progress in Nanotechnology; John Wiley & Sons,
Inc.: Hoboken, NJ, USA, 2009; pp. 305–310.
(107) Wolfenstine, J.; Rangasamy, E.; Allen, J. L.; Sakamoto, J. High Conductivity of
Dense Tetragonal Li7La3Zr2O12. J. Power Sources 2012, 208, 193–196.
(108) Hou, Y.-D.; Hou, L.; Zhao, J.-L.; Zhu, M.-K.; Yan, H. Lead-Free Bi-Based
Complex Perovskite Nanowires: Sol-Gel-Hydrothermal Processing and the
Densification Behavior. J. Electroceramics 2011, 26, 37–43.
(109) Thangadurai, V.; Kaack, H.; Weppner, W. J. F. Novel Fast Lithium Ion
Conduction in Garnet-Type Li5La3M2O12 (M=Nb, Ta). J. Am. Ceram. Soc. 2003,
86, 437–440.
(110) Murugan, R.; Thangadurai, V.; Weppner, W. Fast Lithium Ion Conduction in
Garnet-Type Li7La3Zr2O12. Angew. Chem. Int. Ed. 2007, 46, 7778–7781.

108
(111) Cussen, E. J. Structure and Ionic Conductivity in Lithium Garnets. J. Mater.
Chem. 2010, 20, 5167–5173.
(112) Thangadurai, V.; Adams, S.; Weppner, W. Crystal Structure Revision and
Identification of Li+-Ion Migration Pathways in the Garnet-like Li5La3M2O12 (M =
Nb, Ta) Oxides. Chem. Mater. 2004, 16, 2998–3006.
(113) Geiger, C. A.; Alekseev, E.; Lazic, B.; Fisch, M.; Armbruster, T.; Langner, R.;
Fechtelkord, M.; Kim, N.; Pettke, T.; Weppner, W. Crystal Chemistry and
Stability of “Li7La3Zr2O12” garnet: A Fast Lithium-Ion Conductor. Inorg. Chem.
2011, 50, 1089–1097.
(114) Matsui, M.; Takahashi, K.; Sakamoto, K.; Hirano, A.; Takeda, Y.; Yamamoto, O.;
Imanishi, N. Phase Stability of a Garnet-Type Lithium Ion Conductor
Li7La3Zr2O12. Dalt. Trans. 2014, 43, 1019–1024.
(115) Logéat, A.; Köhler, T.; Eisele, U.; Stiaszny, B.; Harzer, A.; Tovar, M.; Senyshyn,
A.; Ehrenberg, H.; Kozinsky, B. From Order to Disorder: The Structure of
Lithium-Conducting Garnets Li7−xLa3TaxZr2−xO12 (x=0–2). Solid State Ionics 2012,
206, 33–38.
(116) Ohta, S.; Kobayashi, T.; Asaoka, T. High Lithium Ionic Conductivity in the
Garnet-Type Oxide Li7-XLa3(Zr2-X, NbX)O12 (X = 0-2). J. Power Sources 2011, 196,
3342–3345.
(117) Bernstein, N.; Johannes, M. D.; Hoang, K. Origin of the Structural Phase
Transition in Li7La3Zr2O12. Phys. Rev. Lett. 2012, 109, 205702.
(118) Rangasamy, E.; Wolfenstine, J.; Sakamoto, J. The Role of Al and Li Concentration
on the Formation of Cubic Garnet Solid Electrolyte of Nominal Composition
Li7La3Zr2O12. Solid State Ionics 2012, 206, 28–32.
(119) Buschmann, H.; Berendts, S.; Mogwitz, B.; Janek, J. Lithium Metal Electrode
Kinetics and Ionic Conductivity of the Solid Lithium Ion Conductors
“Li7La3Zr2O12” and Li7−xLa3Zr2−xTaxO12 with Garnet-Type Structure. J. Power
Sources 2012, 206, 236–244.
(120) Wang, Y.; Lai, W. High Ionic Conductivity Lithium Garnet Oxides of
Li7−xLa3Zr2−xTaxO12 Compositions. Electrochem. Solid-State Lett. 2012, 15, A68–
A71.
(121) Awaka, J.; Kijima, N.; Hayakawa, H.; Akimoto, J. Synthesis and Structure
Analysis of Tetragonal Li7La3Zr2O12 with the Garnet-Related Type Structure. J.
Solid State Chem. 2009, 182, 2046–2052.
(122) Cussen, E. J. The Structure of Lithium Garnets: Cation Disorder and Clustering in
a New Family of Fast Li+ Conductors. Chem. Commun. 2006, 412–413.
(123) Percival, J.; Kendrick, E.; Smith, R. I.; Slater, P. R. Cation Ordering in Li

109
Containing Garnets: Synthesis and Structural Characterisation of the Tetragonal
System, Li7La3Sn2O12. Dalt. Trans. 2009, 5177–5181.
(124) Jalem, R.; Yamamoto, Y.; Shiiba, H.; Nakayama, M.; Munakata, H.; Kasuga, T.;
Kanamura, K. Concerted Migration Mechanism in the Li Ion Dynamics of Garnet-
Type Li7La3Zr2O12. Chem. Mater. 2013, 25, 425–430.
(125) Meier, K.; Laino, T.; Curioni, A. Solid-State Electrolytes: Revealing the
Mechanisms of Li-Ion Conduction in Tetragonal and Cubic LLZO by First-
Principles Calculations. J. Phys. Chem. C 2014, 118, 6668–6679.
(126) Kokal, I.; Somer, M.; Notten, P. H. L.; Hintzen, H. T. Sol–gel Synthesis and
Lithium Ion Conductivity of Li7La3Zr2O12 with Garnet-Related Type Structure.
Solid State Ionics 2011, 185, 42–46.
(127) Janani, N.; Ramakumar, S.; Dhivya, L.; Deviannapoorani, C.; Saranya, K.;
Murugan, R. Synthesis of Cubic Li7La3Zr2O12 by Modified Sol-Gel Process. Ionics
(Kiel). 2011, 17, 575–580.
(128) Toda, S.; Ishiguro, K.; Shimonishi, Y.; Hirano, a.; Takeda, Y.; Yamamoto, O.;
Imanishi, N. Low Temperature Cubic Garnet-Type CO2-Doped Li7La3Zr2O12.
Solid State Ionics 2013, 233, 102–106.
(129) Larraz, G.; Orera, A.; Sanjuán, M. L. Cubic Phases of Garnet-Type Li7La3Zr2O12:
The Role of Hydration. J. Mater. Chem. A 2013, 1, 11419–11428.
(130) Davies, E.; Lowe, A.; Sterns, M.; Fujihara, K.; Ramakrishna, S. Phase
Morphology in Electrospun Zirconia Microfibers. J. Am. Ceram. Soc. 2008, 91,
1115–1120.
(131) Xie, H.; Li, Y.; Goodenough, J. B. Low-Temperature Synthesis of Li7La3Zr2O12
with Cubic Garnet-Type Structure. Mater. Res. Bull. 2012, 47, 1229–1232.
(132) Thompson, T.; Wolfenstine, J.; Allen, J. L.; Johannes, M.; Huq, A.; David, I. N.;
Sakamoto, J. Tetragonal vs. Cubic Phase Stability in Al-Free Ta Doped
Li7La3Zr2O12 (LLZO). J. Mater. Chem. A 2014, 2, 13431–13436.
(133) Filipovich, V. N.; Kalinina, A. M. Critical Amorphization Radius of Crystals.
Struct. Glas. 1965, 5, 34.
(134) Garvie, R. C. Stabilization of the Tetragonal Structure in Zirconia Microcrystals. J.
Phys. Chem. 1978, 82, 218–224.
(135) Hanaor, D. A. H.; Sorrell, C. C. Review of the Anatase to Rutile Phase
Transformation. J. Mater. Sci. 2011, 46, 855–874.
(136) Gribb, A. A.; Banfield, J. F. Particle Size Effects on Transformation Kinetics and
Phase Stability in Nanocrystalline TiO2. Am. Mineral. 1997, 82, 717–728.

110
(137) Hu, Y.; Tsai, H.-L.; Huang, C.-L. Phase Transformation of Precipitated TiO2
Nanoparticles. Mater. Sci. Eng. A 2003, 344, 209–214.
(138) Zhang, H.; Banfield, J. F. Thermodynamic Analysis of Phase Stability of
Nanocrystalline Titania. J. Mater. Chem. 1998, 8, 2073–2076.
(139) Garvie, R. C. The Occurrence of Metastable Tetragonal Zirconia as a Crystallite
Size Effect. J. Phys. Chem. 1964, 69, 1238–1243.
(140) Chraska, T.; King, A. H.; Berndt, C. C. On the Size-Dependent Phase
Transformation in Nanoparticulate Zirconia. Mater. Sci. Eng. A 2000, A286, 169–
178.
(141) Baldinozzi, G.; Simeone, D.; Gosset, D.; Dutheil, M. Neutron Diffraction Study of
the Size-Induced Tetragonal to Monoclinic Phase Transition in Zirconia
Nanocrystals. Phys. Rev. Lett. 2003, 90, 216103.
(142) Hubaud, A. A.; Schroeder, D. J.; Key, B.; Ingram, B. J.; Dogan, F.; Vaughey, J. T.
Low Temperature Stabilization of Cubic (Li7−xAlx/3)La3Zr2O12: Role of Aluminum
during Formation. J. Mater. Chem. A 2013, 1, 8813–8818.
(143) Kaeriyama, A.; Munakata, H.; Kajihara, K.; Kanamura, K.; Sato, Y.; Yoshida, T.
Evaluation of Electrochemical Characteristics of Li7La3Zr2O12 Solid Electrolyte.
ECS Trans. 2009, 16, 175–180.
(144) Shimonishi, Y.; Toda, A.; Zhang, T.; Hirano, A.; Imanishi, N.; Yamamoto, O.;
Takeda, Y. Synthesis of Garnet-Type Li7−xLa3Zr2O12−1/2x and Its Stability in
Aqueous Solutions. Solid State Ionics 2011, 183, 48–53.
(145) Teng, S.; Tan, J.; Tiwari, A. Recent Developments in Garnet Based Solid State
Electrolytes for Thin Film Batteries. Curr. Opin. Solid State Mater. Sci. 2014, 18,
29–38.
(146) Chen, I.-W.; Wang, X.-H. Sintering Dense Nanocrystalline Ceramics without
Final-Stage Grain Growth. Nature 2000, 404, 168–171.
(147) Zhang, G.; Kirk, B.; Jauregui, L. A.; Yang, H.; Xu, X.; Chen, Y. P.; Wu, Y.
Rational Synthesis of Ultrathin N-Type Bi2Te3 Nanowires with Enhanced
Thermoelectric Properties. Nano Lett. 2012, 12, 56–60.
(148) Seabaugh, M. M.; Kerscht, I. H.; Messing, G. L. Texture Development by
Templated Grain Growth in Liquid-Phase-Sintered Alpha-Alumina. J. Am. Ceram.
Soc. 1997, 80, 1181–1188.
(149) Kim, I.-D.; Rothschild, A.; Lee, B. H.; Kim, D. Y.; Jo, S. M.; Tuller, H. L.
Ultrasensitive Chemiresistors Based on Electrospun TiO2 Nanofibers. Nano Lett.
2006, 6, 2009–2013.
(150) Ohta, S.; Kobayashi, T.; Seki, J.; Asaoka, T. Electrochemical Performance of an

111
All-Solid-State Lithium Ion Battery with Garnet-Type Oxide Electrolyte. J. Power
Sources 2012, 202, 332–335.
(151) McCloskey, B. D. Attainable Gravimetric and Volumetric Energy Density of Li-S
and Li Ion Battery Cells with Solid Separator-Protected Li Metal Anodes. J. Phys.
Chem. Lett. 2015, 6, 4581–4588.
(152) Girishkumar, G.; McCloskey, B.; Luntz, A. C.; Swanson, S.; Wilcke, W. Lithium-
Air Battery: Promise and Challenges. J. Phys. Chem. Lett. 2010, 1, 2193–2203.
(153) Przyluski, J.; Siekierski, M.; Wieczorek, W. Effective Medium Theory in Studies
of Conductivity of Composite Polymeric Electrolytes. Electrochim. Acta 1995, 40,
2101–2108.
(154) Jiang, S.; Wagner, J. B. A Theoretical Model for Composite electrolytes—I. Space
Charge Layer as a Cause for Charge-Carrier Enhancement. J. Phys. Chem. Solids
1995, 56, 1101–1111.
(155) Kim, J.-W.; Ji, K.-S.; Lee, J.-P.; Park, J.-W. Electrochemical Characteristics of
Two Types of PEO-Based Composite Electrolyte with Functional SiO2. J. Power
Sources 2003, 119–121, 415–421.
(156) Yang, T.; Li, Y.; Chan, C. K. Enhanced Lithium Ion Conductivity in Lithium
Lanthanum Titanate Solid Electrolyte Nanowires Prepared by Electrospinning. J.
Power Sources 2015, 287, 164–169.
(157) Yang, T.; Gordon, Z. D.; Li, Y.; Chan, C. K. Nanostructured Garnet-Type Solid
Electrolytes for Lithium Batteries: Electrospinning Synthesis of Li7La3Zr2O12
Nanowires and Particle Size-Dependent Phase Transformation. J. Phys. Chem. C
2015, 119, 14947–14953.
(158) Gordon, Z. D.; Yang, T.; Gomes Morgado, G. B.; Chan, C. K. Preparation of
Nano- and Microstructured Garnet Li7La3Zr2O12 Solid Electrolytes for Li-Ion
Batteries via Cellulose Templating. ACS Sustain. Chem. Eng. 2016.
(159) Allen, J. L.; Wolfenstine, J.; Rangasamy, E.; Sakamoto, J. Effect of Substitution
(Ta, Al, Ga) on the Conductivity of Li7La3Zr2O12. J. Power Sources 2012, 206,
315–319.
(160) Adams, S.; Rao, R. P. Ion Transport and Phase Transition in Li7−xLa3(Zr2−xMx)O12
(M = Ta5+, Nb5+, X = 0, 0.25). J. Mater. Chem. 2012, 22, 1426.
(161) Miara, L. J.; Ong, S. P.; Mo, Y.; Richards, W. D.; Park, Y.; Lee, J.-M.; Lee, H. S.;
Ceder, G. Effect of Rb and Ta Doping on the Ionic Conductivity and Stability of
the Garnet Li7+2x-y(La3-xRbx)(Zr2-yTay)O12 (0≤x≤0.375, 0≤y≤1) Superionic
Conductor: A First Principles Investigation. Chem. Mater. 2013, 25, 3048–3055.
(162) Buschmann, H.; Dölle, J.; Berendts, S.; Kuhn, A.; Bottke, P.; Wilkening, M.;
Heitjans, P.; Senyshyn, A.; Ehrenberg, H.; Lotnyk, A.; et al. Structure and

112
Dynamics of the Fast Lithium Ion conductor “Li7La3Zr2O12.” Phys. Chem. Chem.
Phys. 2011, 13, 19378–19392.
(163) Zhang, Y.; Chen, F.; Tu, R.; Shen, Q.; Zhang, X.; Zhang, L. Effect of Lithium Ion
Concentration on the Microstructure Evolution and Its Association with the Ionic
Conductivity of Cubic Garnet-Type Nominal Li7Al0.25La3Zr2O12 Solid
Electrolytes. Solid State Ionics 2015, 8–15.
(164) Qian, X.; Gu, N.; Cheng, Z.; Yang, X.; Wang, E. Impedance Study of
(PEO)10LiClO4-Al2O3 Composite Polymer Electrolyte with Blocking Electrodes.
Electrochim. Acta 2001, 46, 1829–1836.
(165) Wang, Y.-J.; Pan, Y.; Kim, D. Conductivity Studies on Ceramic
Li1.3Al0.3Ti1.7(PO4)3-Filled PEO-Based Solid Composite Polymer Electrolytes. J.
Power Sources 2006, 159, 690–701.
(166) Huang, B.; Wang, Z.; Li, G.; Huang, H.; Xue, R.; Chen, L.; Wang, F. Lithium Ion
Conduction in Polymer Electrolytes Based on PAN. Solid State Ionics 1996, 85,
79–84.
(167) Huang, B.; Wang, Z.; Chen, L.; Xue, R.; Wang, F. The Mechanism of Lithium Ion
Transport in Polyacrylonitrile-Based Polymer Electrolytes. Solid State Ionics 1996,
91, 279–284.
(168) Golodnitsky, D.; Strauss, E.; Peled, E.; Greenbaum, S. Review—On Order and
Disorder in Polymer Electrolytes. J. Electrochem. Soc. 2015, 162, A2551–A2566.
(169) Rettenwander, D.; Welzl, A.; Cheng, L.; Fleig, J.; Musso, M.; Suard, E.; Doeff, M.
M.; Redhammer, G. J.; Amthauer, G. Synthesis, Crystal Chemistry, and
Electrochemical Properties of Li7–2xLa3Zr2–xMoxO12 (X = 0.1–0.4): Stabilization of
the Cubic Garnet Polymorph via Substitution of Zr4+ by Mo6+. Inorg. Chem. 2015,
54, 10440–10449.
(170) Rettenwander, D.; Redhammer, G.; Preishuber-Pflügl, F.; Cheng, L.; Miara, L.;
Wagner, R.; Welzl, A.; Suard, E.; Doeff, M. M.; Wilkening, M.; et al. Structural
and Electrochemical Consequences of Al and Ga Cosubstitution in Li7La3Zr2O12
Solid Electrolytes. Chem. Mater. 2016, acs.chemmater.6b00579.
(171) Robertson, J. High Dielectric Constant Oxides. Eur. Phys. J. Appl. Phys. 2004, 28,
265–291.
(172) Miara, L. J.; Richards, W. D.; Wang, Y. E.; Ceder, G. First-Principles Studies on
Cation Dopants and Electrolyte|cathode Interphases for Lithium Garnets. Chem.
Mater. 2015, 27, 4040–4047.
(173) Wang, Y.; Lai, W. Phase Transition in Lithium Garnet Oxide Ionic Conductors
Li7La3Zr2O12: The Role of Ta Substitution and H2O/CO2 Exposure. J. Power
Sources 2015, 275, 612–620.

113
(174) Zhang, J.; Zhao, N.; Zhang, M.; Li, Y.; Chu, P. K.; Guo, X.; Di, Z.; Wang, X.; Li,
H. Flexible and Ion-Conducting Membrane Electrolytes for Solid-State Lithium
Batteries: Dispersion of Garnet Nanoparticles in Insulating Polyethylene Oxide.
Nano Energy 2016, 28, 447–454.
(175) Pan, Q.; Smith, D. M.; Qi, H.; Wang, S.; Li, C. Y. Hybrid Electrolytes with
Controlled Network Structures for Lithium Metal Batteries. Adv. Mater. 2015, 27,
5995–6001.
(176) Agrawal, A.; Choudhury, S.; Archer, L. A. A Highly Conductive, Non-Flammable
Polymer–nanoparticle Hybrid Electrolyte. RSC Adv. 2015, 5, 20800–20809.

114
APPENDIX A
PERMISSIONS FROM ALL CO-AUTHORS

115
All co-authors have granted their permissions to use the copyrighted materials.

116
APPENDIX B
LIST OF PUBLICATIONS

117
Chapter II includes:
(1) Ting Yang, Ying Li and Candace K. Chan. “Enhanced Lithium Ion Conductivity in
Lithium Lanthanum Titanate Solid Electrolyte Nanowires Prepared by Electrospinning”
Journal of Power Sources 2015, 287, 164-169
Chapter III includes:
(2) Ting Yang, Zachary D. Gordon, Ying Li and Candace K. Chan. “Nanostructured
Garnet-Type Solid Electrolyte for Lithium Batteries: Electrospinning Synthesis of
Li7La3Zr2O12 Nanowires and Particle Size-Dependent Phase Transformation” The
Journal of Physical Chemistry C 2015, 119, 14947-14953
Chapter IV includes:
(3) Ting Yang, Jin Zheng, Yan-Yan Hu, Qian Cheng and Candace K. Chan. “Composite
Polymer Electrolytes with Li7La3Zr2O12 Garnet-Type Nanowires as Ceramic Fillers:
Mechanism of Conductivity Enhancement and Role of Doping and Morphology”
(Submitted)
Other publications generated during my graduate study:
(4) Ting Yang, Z. D. Gordon, and C. K. Chan. “Synthesis of Hyperbranched Perovskite
Nanostructures” Crystal Growth & Design 2013, 13, 3901-3907
(5) Q. Cheng, Ting Yang, M. Li and C. K. Chan. “Exfoliation of LiNi1/3Mn1/3Co1/3O2 into
Nanosheets using Electrochemical Oxidation and Reassembly with Dialysis or
Flocculation” Langmuir (Accepted)
(6) Zachary D. Gordon, Ting Yang, Guilherme Bruno Gomes Morgado and Candace K.
Chan. “Preparation of Nano- and Microstructured Garnet Li7La3Zr2O12 Solid Electrolytes
for Li-ion Batteries via Cellulose Templating”. ACS Sustainable Chemistry &
Engineering 2016, 4, 6391-6398
(7) T. Grewe, Ting Yang, H. Tüysüz and C. K. Chan. “Hyperbranched Potassium
Lanthanum Titanate Perovskite Photocatalysts for Hydrogen Generation” Journal of
Materials Chemistry A 2016, 4, 2837-2841
(8) Q. Cheng, Ting Yang, Y. Li, M. Li and C. K. Chan. “Oxidation-Reduction Assisted
Exfoliation of LiCoO2 into Nanosheets and Reassembly into Functional Li-ion Battery
Cathodes” Journal of Materials Chemistry A 2016, 4, 6902-6910
(9) R. Zhao, Ting Yang, M. A. Miller and C. K. Chan. “Electrochemical Properties of
Nanostructured Copper Hydroxysulfate Mineral Brochantite upon Reaction with Lithium”
Nano Letters 2013, 13, 6055-606
(10) J. Wang, R. Krishna, Ting Yang and S. Deng. “Nitrogen-rich Microporous Carbons
for Highly Selective Separation of Light Hydrocarbons” Journal of Materials Chemistry
A 2016, 4, 13957-13966
(11) J. Wang, J. Yang, R. Krishna, Ting Yang and S. Deng. “A Versatile Synthesis of
Metal-Organic Framework-Derived Porous Carbons for CO2 Capture and Gas Separation”
Journal of Materials Chemistry A 2016, 4, 19095-19106