electronic supplementary information for line vacancies in
TRANSCRIPT
1
Electronic Supplementary Information for
Defect evolution behaviors from single sulfur point vacancies to
line vacancies in the monolayer molybdenum disulfide
Chan Gao1,2, Xiaoyong Yang3, Ming Jiang1, Lixin Chen1, Zhiwen Chen1, Chandra Veer
Singh1,4,*
1Department of Materials Science and Engineering, University of Toronto, Toronto,
ON M5S 3E4, Canada2Institute of Nuclear Physics and Chemistry, China Academy of Engineering Physics,
Mianyang 621900, China3Condensed Matter Theory Group, Materials Theory Division, Department of Physics
and Astronomy, Uppsala University, Uppsala 75120, Sweden4Department of Mechanical and Industrial Engineering, University of Toronto,
Toronto, ON M5S 3G8, Canada
* Correspondence and request for materials should be addressed to C.V. Singh
Electronic Supplementary Material (ESI) for Physical Chemistry Chemical Physics.This journal is © the Owner Societies 2021
2
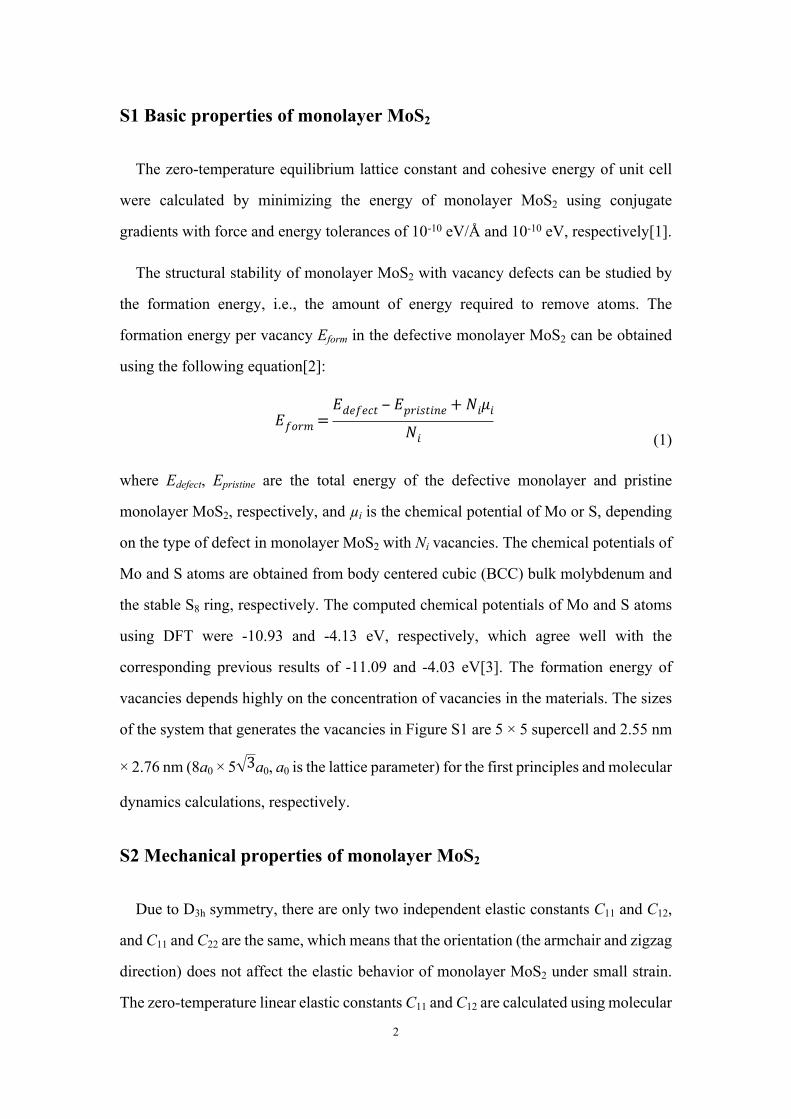
S1 Basic properties of monolayer MoS2
The zero-temperature equilibrium lattice constant and cohesive energy of unit cell
were calculated by minimizing the energy of monolayer MoS2 using conjugate
gradients with force and energy tolerances of 10-10 eV/Å and 10-10 eV, respectively[1].
The structural stability of monolayer MoS2 with vacancy defects can be studied by
the formation energy, i.e., the amount of energy required to remove atoms. The
formation energy per vacancy Eform in the defective monolayer MoS2 can be obtained
using the following equation[2]:
(1)𝐸𝑓𝑜𝑟𝑚=
𝐸𝑑𝑒𝑓𝑒𝑐𝑡 ‒ 𝐸𝑝𝑟𝑖𝑠𝑡𝑖𝑛𝑒 + 𝑁𝑖𝜇𝑖𝑁𝑖
where Edefect, Epristine are the total energy of the defective monolayer and pristine
monolayer MoS2, respectively, and µi is the chemical potential of Mo or S, depending
on the type of defect in monolayer MoS2 with Ni vacancies. The chemical potentials of
Mo and S atoms are obtained from body centered cubic (BCC) bulk molybdenum and
the stable S8 ring, respectively. The computed chemical potentials of Mo and S atoms
using DFT were -10.93 and -4.13 eV, respectively, which agree well with the
corresponding previous results of -11.09 and -4.03 eV[3]. The formation energy of
vacancies depends highly on the concentration of vacancies in the materials. The sizes
of the system that generates the vacancies in Figure S1 are 5 × 5 supercell and 2.55 nm
× 2.76 nm (8a0 × 5 a0, a0 is the lattice parameter) for the first principles and molecular 3
dynamics calculations, respectively.
S2 Mechanical properties of monolayer MoS2
Due to D3h symmetry, there are only two independent elastic constants C11 and C12,
and C11 and C22 are the same, which means that the orientation (the armchair and zigzag
direction) does not affect the elastic behavior of monolayer MoS2 under small strain.
The zero-temperature linear elastic constants C11 and C12 are calculated using molecular
3
statics simulation by finite difference[1, 4],
(2)𝐶11 =
Δ𝜎1Δ𝜀1
(3)𝐶12 =
12(Δ𝜎1Δ𝜀2
+Δ𝜎2Δ𝜀1)
(4)𝐶66 =
12(𝐶11 ‒ 𝐶12)
where Δσ and Δε are the stress and strain induced by infinitesimally changing
simulation box from their equilibrium state, respectively.
Theoretically, the isotropic linear elastic properties, the in-plane Young’s modulus E
and Poisson’s ratio ν can be calculated as[4]:
(5)𝐸= (𝐶 211 ‒ 𝐶
212)/𝐶11
(6)𝜈= 𝐶12/𝐶11
The elastic constants of monolayer MoS2 with defects depend on the defect
concentration. The size of monolayer MoS2 was taken as 5a0 × 3 a0 with a line 3
vacancies defect along x zigzag direction and single point vacancy defects, where a0 is
the lattice parameter. It should be noted that C11 is not equal to C22 in the monolayer
MoS2 with defects.
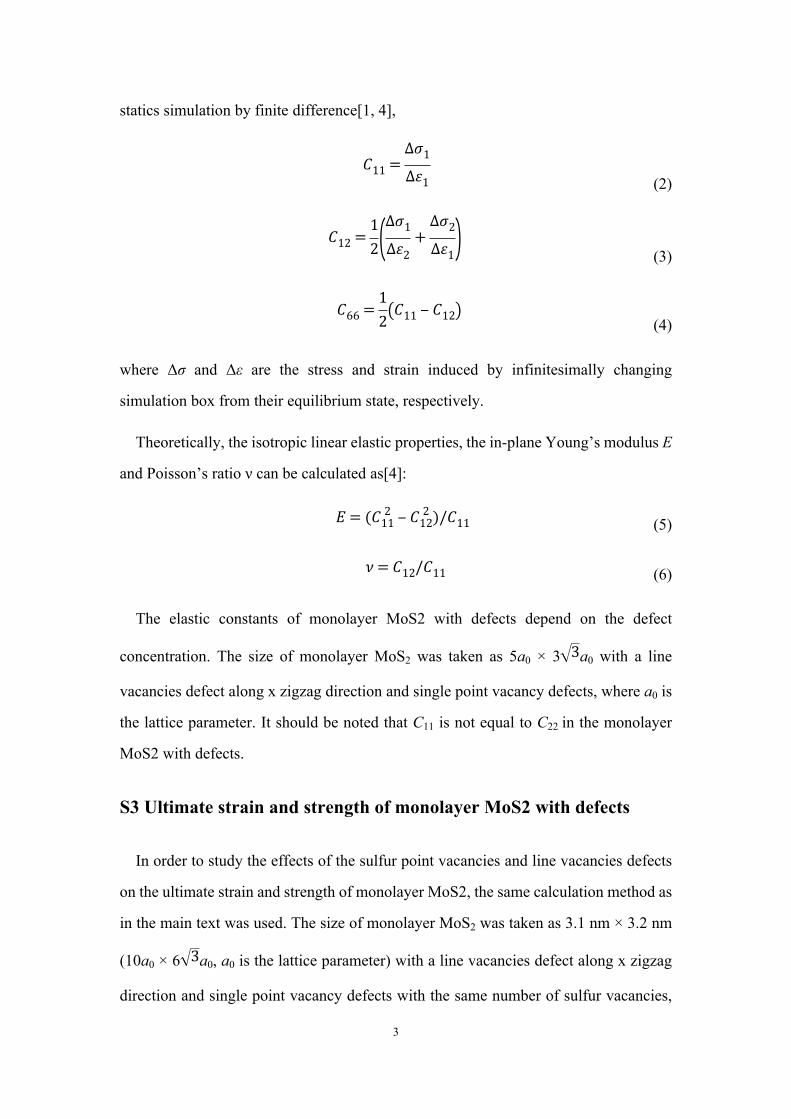
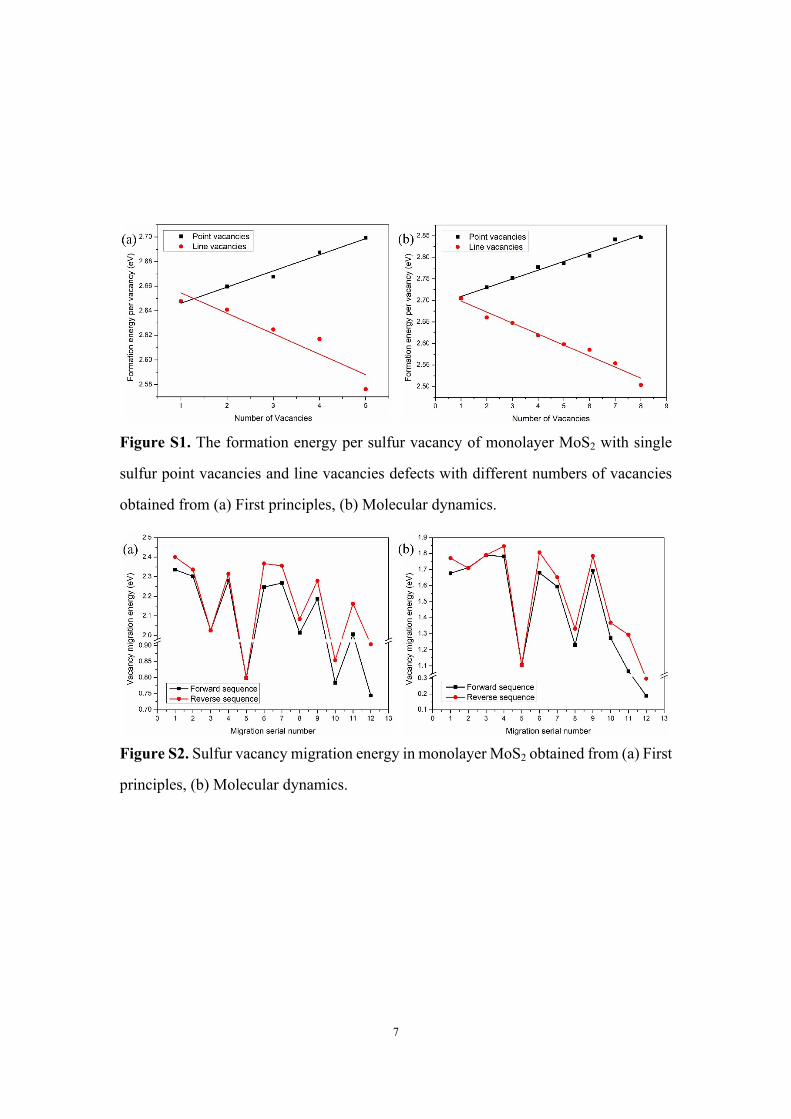
S3 Ultimate strain and strength of monolayer MoS2 with defects
In order to study the effects of the sulfur point vacancies and line vacancies defects
on the ultimate strain and strength of monolayer MoS2, the same calculation method as
in the main text was used. The size of monolayer MoS2 was taken as 3.1 nm × 3.2 nm
(10a0 × 6 a0, a0 is the lattice parameter) with a line vacancies defect along x zigzag 3
direction and single point vacancy defects with the same number of sulfur vacancies,
4
as shown in Figure S4.
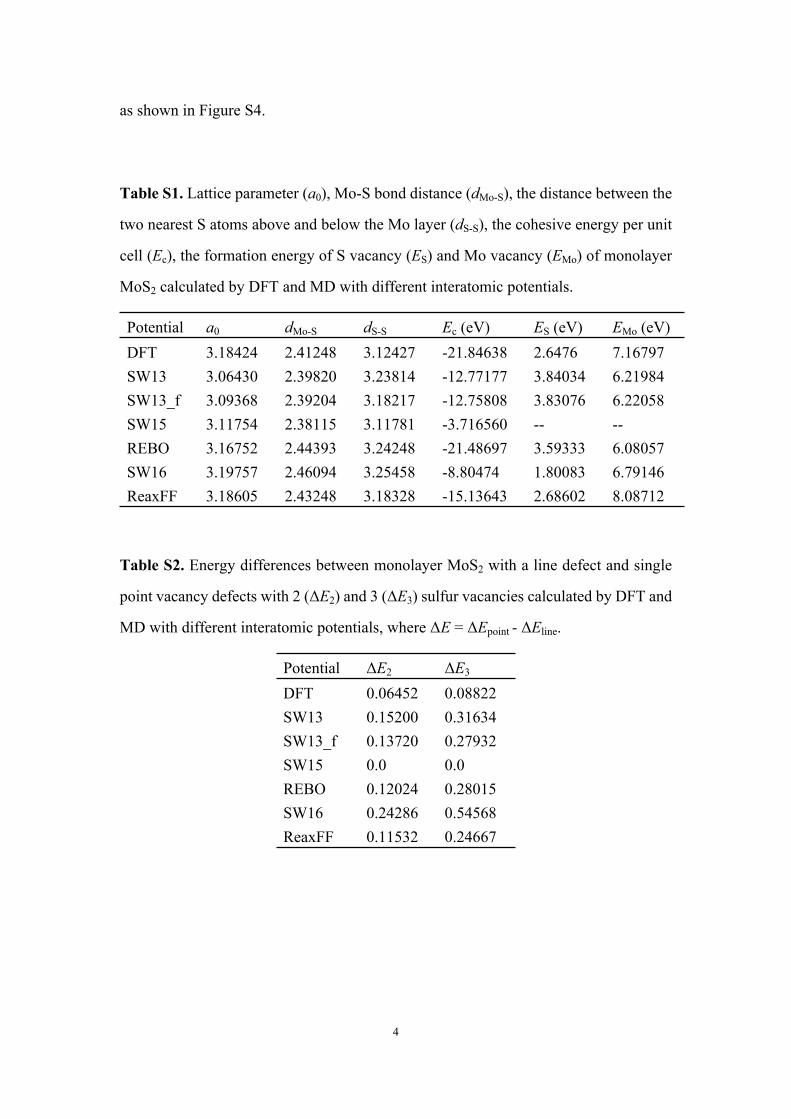
Table S1. Lattice parameter (a0), Mo-S bond distance (dMo-S), the distance between the
two nearest S atoms above and below the Mo layer (dS-S), the cohesive energy per unit
cell (Ec), the formation energy of S vacancy (ES) and Mo vacancy (EMo) of monolayer
MoS2 calculated by DFT and MD with different interatomic potentials.
Potential a0 dMo-S dS-S Ec (eV) ES (eV) EMo (eV)DFT 3.18424 2.41248 3.12427 -21.84638 2.6476 7.16797SW13 3.06430 2.39820 3.23814 -12.77177 3.84034 6.21984SW13_f 3.09368 2.39204 3.18217 -12.75808 3.83076 6.22058SW15 3.11754 2.38115 3.11781 -3.716560 -- --REBO 3.16752 2.44393 3.24248 -21.48697 3.59333 6.08057SW16 3.19757 2.46094 3.25458 -8.80474 1.80083 6.79146ReaxFF 3.18605 2.43248 3.18328 -15.13643 2.68602 8.08712
Table S2. Energy differences between monolayer MoS2 with a line defect and single
point vacancy defects with 2 (ΔE2) and 3 (ΔE3) sulfur vacancies calculated by DFT and
MD with different interatomic potentials, where ΔE = ΔEpoint - ΔEline.
Potential ΔE2 ΔE3
DFT 0.06452 0.08822SW13 0.15200 0.31634SW13_f 0.13720 0.27932SW15 0.0 0.0REBO 0.12024 0.28015SW16 0.24286 0.54568ReaxFF 0.11532 0.24667
5
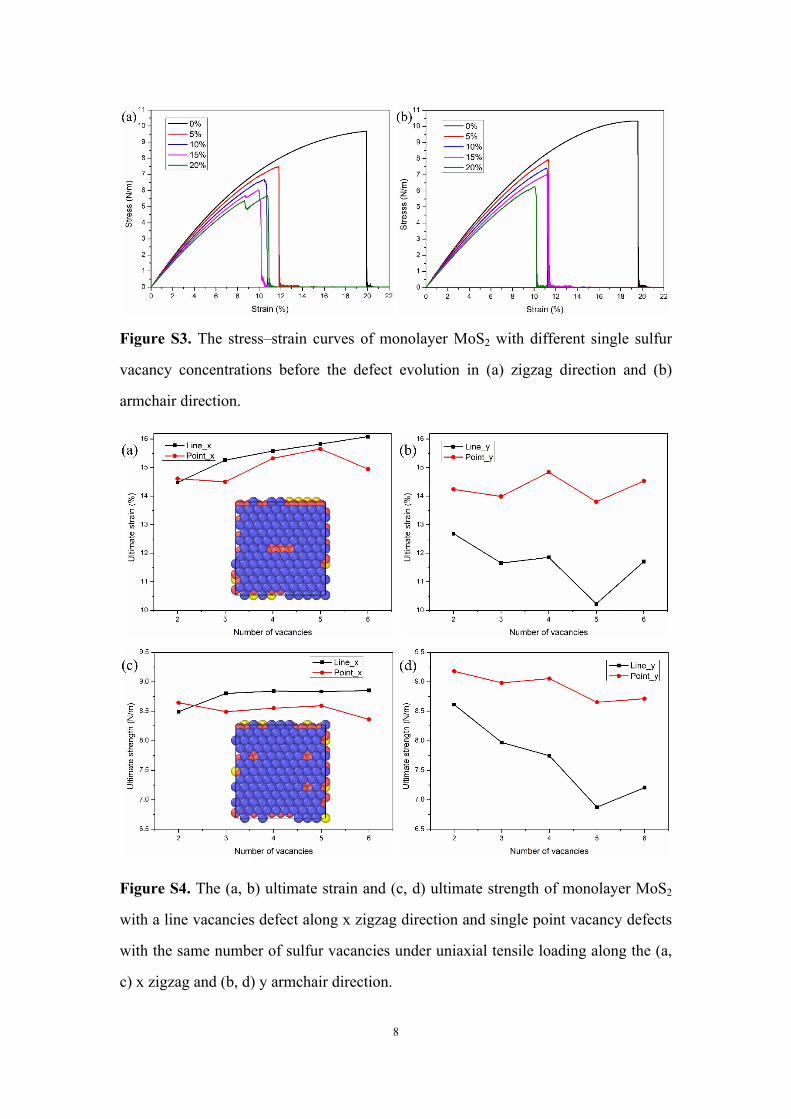
Table S3. The elastic constants C11, C12 and C66, Young’s modulus E and Poisson’s
ratio ν of monolayer MoS2 calculated by DFT and MD with different interatomic
potentials.
Potential C11 (N/m) C12 (N/m) C66 (N/m) E (N/m) νDFT 133.761 32.953 50.404 125.643 0.246SW13 81.775 30.168 25.80352 70.646 0.369SW13_f 140.774 52.735 44.018 121.019 0.375SW15 105.331 28.299 38.514 97.728 0.269REBO 154.361 45.760 54.299 140.796 0.296SW16 133.025 39.386 46.821 121.364 0.296ReaxFF 230.119 115.693 57.135 171.954 0.503
Table S4. The elastic constants C11 of monolayer MoS2 with a line defect and single
point vacancies defects with 1, 2 and 3 sulfur vacancies calculated by DFT and MD
with different interatomic potentials.
Potential Point_1 Point_2 Point_3 Line_2 Line_3DFT 128.657 124.367 120.877 126.079 124.054SW13 80.846 79.918 79.064 80.239 79.632SW13_f 137.734 134.770 132.249 135.680 133.746SW15 101.237 97.358 94.304 98.837 96.719REBO 150.087 145.980 142.894 147.744 163.409SW16 129.118 125.469 122.382 126.672 124.406ReaxFF 255.420 268.222 248.998 4191.688 -19290.578
6
Table S5. The elastic constants C12 of monolayer MoS2 with a line defect and single
point vacancies defects with 1, 2 and 3 sulfur vacancies calculated by DFT and MD
with different interatomic potentials.
Potential Point_1 Point_2 Point_3 Line_2 Line_3DFT 33.539 33.056 32.274 32.169 30.772SW13 29.766 29.367 28.968 29.332 28.885SW13_f 51.358 50.056 48.832 49.842 48.366SW15 26.886 25.633 24.433 25.133 23.390REBO 44.680 43.819 42.748 42.887 1.667SW16 38.184 37.049 36.081 36.957 35.781ReaxFF 98.136 125.731 75.249 1414.225 4707.022
Table S6. The elastic constants C22 of monolayer MoS2 with a line defect and single
point vacancies defects with 1, 2 and 3 sulfur vacancies calculated by DFT and MD
with different interatomic potentials.
Potential Point_1 Point_2 Point_3 Line_2 Line_3DFT 128.496 124.479 119.497 122.130 114.611SW13 80.842 79.912 79.033 79.945 79.032SW13_f 137.724 134.721 131.937 134.301 130.864SW15 101.207 97.214 93.499 95.703 89.739REBO 150.021 145.862 141.738 142.913 107.420SW16 129.155 125.296 122.017 125.188 121.380ReaxFF 222.711 264.662 208.454 -5970.110 -567.385
7
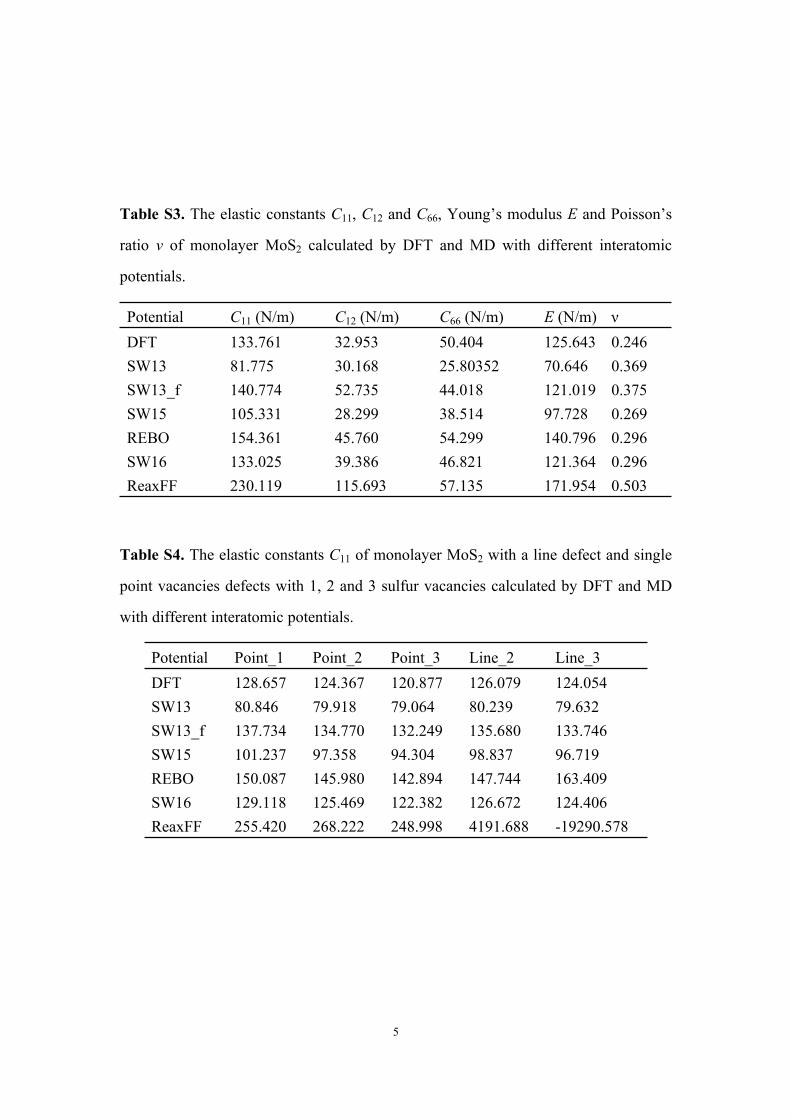
Figure S1. The formation energy per sulfur vacancy of monolayer MoS2 with single
sulfur point vacancies and line vacancies defects with different numbers of vacancies
obtained from (a) First principles, (b) Molecular dynamics.
Figure S2. Sulfur vacancy migration energy in monolayer MoS2 obtained from (a) First
principles, (b) Molecular dynamics.
8
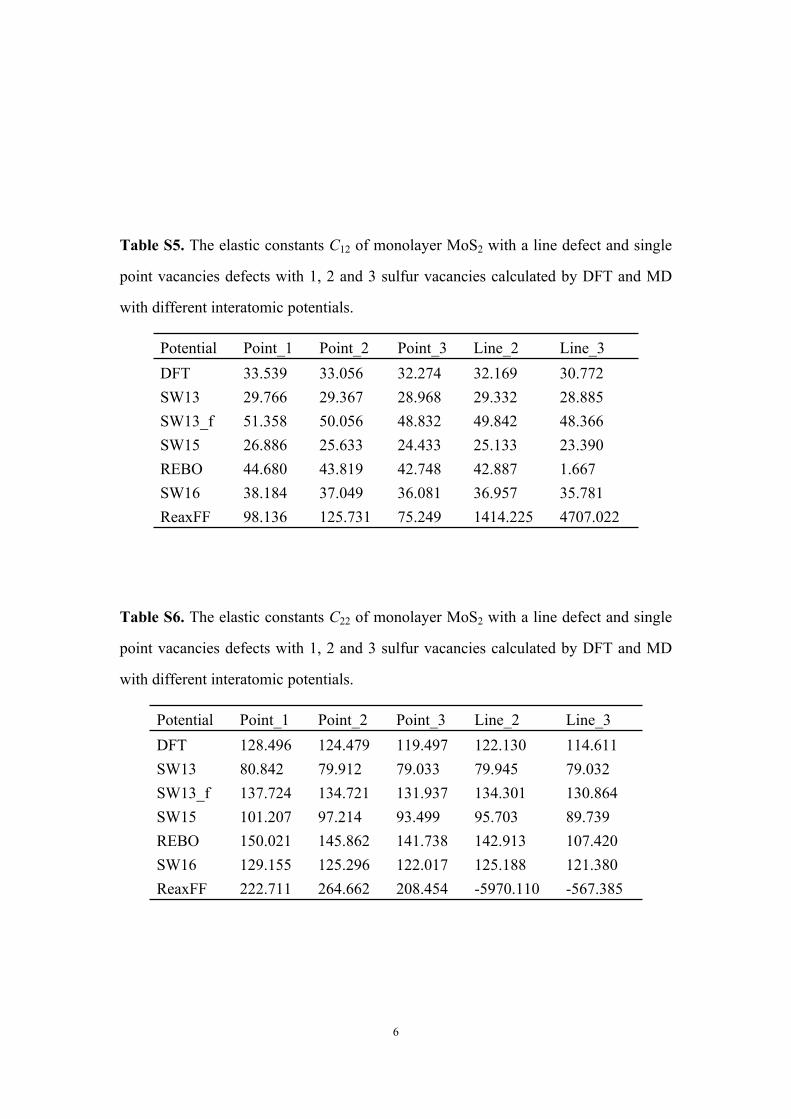
Figure S3. The stress–strain curves of monolayer MoS2 with different single sulfur
vacancy concentrations before the defect evolution in (a) zigzag direction and (b)
armchair direction.
Figure S4. The (a, b) ultimate strain and (c, d) ultimate strength of monolayer MoS2
with a line vacancies defect along x zigzag direction and single point vacancy defects
with the same number of sulfur vacancies under uniaxial tensile loading along the (a,
c) x zigzag and (b, d) y armchair direction.
9
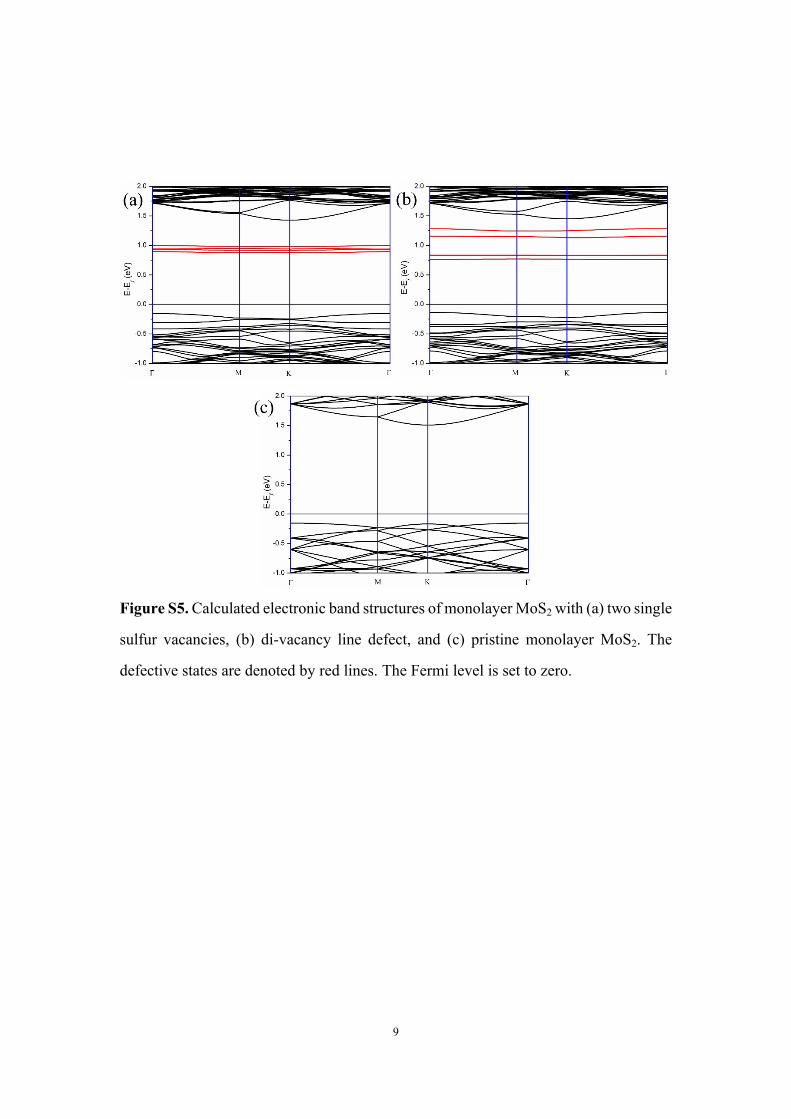
Figure S5. Calculated electronic band structures of monolayer MoS2 with (a) two single
sulfur vacancies, (b) di-vacancy line defect, and (c) pristine monolayer MoS2. The
defective states are denoted by red lines. The Fermi level is set to zero.
10
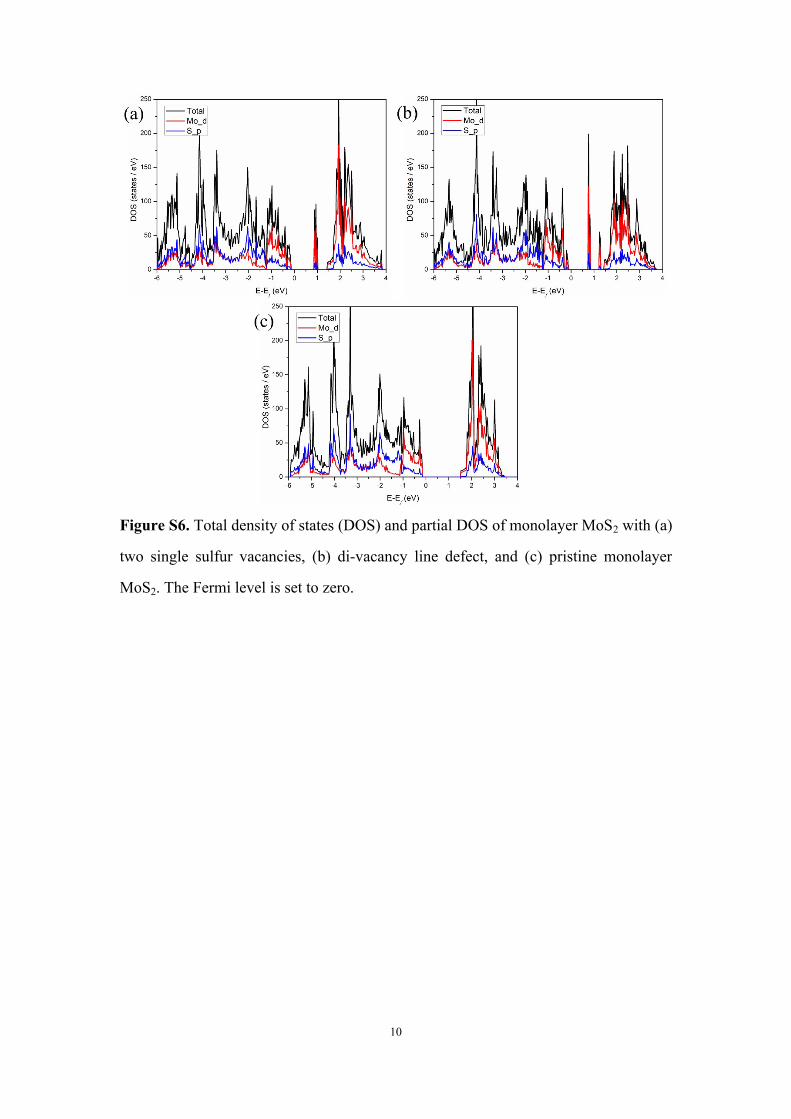
Figure S6. Total density of states (DOS) and partial DOS of monolayer MoS2 with (a)
two single sulfur vacancies, (b) di-vacancy line defect, and (c) pristine monolayer
MoS2. The Fermi level is set to zero.
11
References:
[1] M. Wen, S.N. Shirodkar, P. Plecháč, E. Kaxiras, R.S. Elliott, E.B. Tadmor, A force-
matching Stillinger-Weber potential for MoS2: Parameterization and Fisher
information theory based sensitivity analysis, Journal of Applied Physics, 122 (2017)
244301.
[2] Y. Han, T. Hu, R. Li, J. Zhou, J. Dong, Stabilities and electronic properties of
monolayer MoS2 with one or two sulfur line vacancy defects, Physical Chemistry
Chemical Physics, 17 (2015) 3813-3819.
[3] S. Kc, R.C. Longo, R. Addou, R.M. Wallace, K. Cho, Impact of intrinsic atomic
defects on the electronic structure of MoS2 monolayers, Nanotechnology, 25 (2014)
375703.
[4] S. Thomas, K.M. Ajith, M.C. Valsakumar, Directional anisotropy, finite size effect
and elastic properties of hexagonal boron nitride, Journal of Physics: Condensed
Matter, 28 (2016) 295302.