electronic, optical and thermal properties of the...
TRANSCRIPT
Electronic, optical and thermal properties of the hexagonal and rocksalt-likeGe2Sb2Te5 chalcogenide from first-principle calculations
Thierry Tsafack,1 Enrico Piccinini,2,a) Bong-Sub Lee3,b) Eric Pop,4 andMassimo Rudan2,1
1DEIS – Dipartimento di Elettronica, Informatica e Sistemistica, University of Bologna,Viale Risorgimento 2, I-40136 Bologna, Italy2E. De Castro Advanced Research Center on Electronic Systems ARCES, University of Bologna,Via Toffano 2/2, I-40125 Bologna, Italy3Department of Materials Science and Engineering and the Coordinated Science Laboratory,University of Illinois at Urbana-Champaign, Urbana, Illinois 61801, USA4Department of Electrical and Computer Engineering, Micro and Nanotechnology Lab,University of Illinois at Urbana-Champaign, Urbana, Illinois 61801, USA
(Received 4 March 2011; accepted 11 August 2011; published online 26 September 2011)
We present a comprehensive computational study on the properties of rock salt-like and hexagonal
chalcogenide Ge2Sb2Te5 supported by experimental data. We calculate the electronic structure
using density functional theory (DFT); the obtained density of states (DOS) compares favorably
with experiments, and is suitable for transport analysis. Optical constants including refractive index
and absorption coefficient capture major experimental features, aside from an energy shift owed to
an underestimate of the bandgap that is typical of DFT calculations. We also compute the phonon
DOS for the hexagonal phase, obtaining a speed of sound and thermal conductivity in good
agreement with the experimental lattice contribution. The calculated heat capacity
reaches�1.4� 106 J/(m3 K) at high temperature, in agreement with experiments, and provides
insight into the low-temperature range (<150 K), where data are unavailable. VC 2011 AmericanInstitute of Physics. [doi:10.1063/1.3639279]
I. INTRODUCTION
Over the past two decades phase-change materials have
generated much interest in the area of electronic devices for
memory applications thanks to the scaling properties, small
energy consumption (<100 fJ/bit),1 and large number (109)
of writing cycles.2 The ability of such materials to switch
between the crystalline and the amorphous phase makes them
suitable candidates for data storage. In fact, the two phases
are associated with large differences in the optical constants
and resistivity.3 Since the late 1960s digital disk-random
access memories, phase-change dual disks, re-writable
optical media with increasing storage capability and, later on,
solid-state non-volatile memories, have been designed and
released to the market.
Chalcogenide materials like Ge2Sb2Te5 (GST) have
extensively been investigated either theoretically or experi-
mentally in order to better understand the nature of their
structural, electronic, optical, thermal and electrical proper-
ties. X-ray diffraction experiments have provided cell param-
eters for the hexagonal and the cubic GST (Refs. 4–6), and
several hypotheses have also been made about the amor-
phous phase.7–9 The GST material is a semiconductor in
both the crystalline and the amorphous phase. Its optical
bandgap has been estimated around 0.5 eV for the former
phase and around 0.7 eV for the latter.10 Moreover, the opti-
cal dielectric constant of the crystalline phase is about twice
to three times greater than that of the amorphous phase.11
The origin of this high optical contrast has been sought in
the last years, and it has been linked to resonant bonded pstates of the crystalline phase that are lost in the amorphous
configuration. As a consequence, the remarkable difference
in the optical matrix elements associated to the two phases
causes the strong optical contrast.11–13
In the last decade several models have been
proposed14–16 to describe the snap-back phenomenon in the
I(V) characteristic of amorphous GST glasses. In fact, such a
feature is fundamental for using the material in the fabrica-
tion of solid-state memories. Even though the hexagonal
phase is the stable one, the metastable cubic crystals play a
major role in device applications. As a matter of fact the
amorphous structure of GST stems from a strongly distorted
rock salt-like one,7 and the material can easily switch
between the amorphous and the crystalline phase due to
Joule heating. The models describing carrier conduction in
semiconductors are usually based on the knowledge of the
electron and phonon dispersion relations for the material at
hand. In a similar manner this type of data are useful for a
better understanding of the transport characteristics of the
GST material.
This paper describes the results of a comprehensive
computational study of the GST chalcogenide, including
band structures and optical constants for both the hexagonal
and the rock salt-like phases. Two former studies devoted to
the hexagonal phase were recently published;17,18 they are
considered here for comparison purposes. Moreover, the
vibrational properties of the hexagonal phase are investi-
gated as well, in order to get information on the speed of
sound in the material, on the thermal conductivity, and heat
a)Author to whom correspondence should be addressed. Electronic mail:
[email protected])Present address: Tessera Inc., 2025 Orchard Parkway, San Jose, CA, USA.
0021-8979/2011/110(6)/063716/9/$30.00 VC 2011 American Institute of Physics110, 063716-1
JOURNAL OF APPLIED PHYSICS 110, 063716 (2011)
Downloaded 26 Sep 2011 to 192.17.112.46. Redistribution subject to AIP license or copyright; see http://jap.aip.org/about/rights_and_permissions

capacity. The starting point of the analyses is the calculation
of the band structure by means of the density-functional
(DFT) theory using plane waves as basis set.
After calculating the band structure, the imaginary part
�i(x) of the dielectric tensor �ab(x) (including Drude-type
contributions) is derived using the Drude-Lorentz expres-
sion. The real part �r(x) is then calculated through the
Kramers-Kronig transformation. The Maxwell model allows
one to link �r(x) and �i(x) to the refractive index n(x) and
the extinction coefficient k(x), as well as the absorption
coefficient a(x). Two measurable quantities like the optical
reflection R(x) and transmission T(x) are derived from n(x)
and k(x) using exact equations considering multiple reflec-
tions in a thin film. They are compared to the corresponding
experimental data.
Finally, the phonon density of states (DOS) is calculated
through the density-functional perturbation theory (DFPT)
for the hexagonal crystalline phase. From this, it is possible
to evaluate the sound velocity and the thermal conductivity,
which compare well with experimental data on the phonon
contribution in hexagonal GST. Moreover, the heat capacity
for this phase is obtained over a wide temperature range
(5–870 K) by integrating the DOS.
II. METHOD AND CALCULATIONS
The electronic structure has been computed using the
DFT equations that are implemented in the Quantum
Espresso 4.1 code.19 This software uses plane waves as a ba-
sis set for the expansion of atomic orbitals, and implements
periodic boundary conditions. The local density approxima-
tion (LDA) by Perdew and Zunger20 has been considered for
the exchange-correlation energy. The electron-ion interac-
tions have been described by means of norm-conserving
ionic Bachelet-Hamann-Schluter pseudopotentials without
non-linear corrections.21 The valence configurations are
4s24p2, 5s25p3, and 5s25p4 for Ge, Sb, and Te, respectively.
Recent papers17,22 included explicitly the role of Te 4d elec-
trons in the valence configuration (and not as a core contribu-
tion). Other authors have pointed out that spin-orbit coupling
could play a role for such heavy atoms.23 As discussed
throughout this paper, neglecting these details does not affect
the quality of our findings, which favorably compare to
experimental evidence.
The cut-off in the kinetic energy was set to 80 Ry, a
rather conservative choice since preliminary tests proved
that changes in the results become less and less significative
roughly beyond 50 Ry.
The first step of the analysis deals with geometry relaxa-
tion. As a result of the Born-Oppenheimer approximation,
this stage involves the determination of the cell parameters
and the atomic coordinates that minimize the energy func-
tional within the adopted numerical approximations.
According to the literature, the stacking sequence of the
hexagonal cell is made up of nine layers. Three possible config-
urations have been proposed, depending on the position of the
Sb and the Ge atoms. In an early work Petrov and coworkers4
proposed the sequence Te – Sb – Te – Ge – Te – Te – Ge – Te
– Sb; more recently, Kooi and de Hosson identified a new
stacking where all Sb and Ge atoms exchange their positions,5
while Matsunaga and coworkers suggested that Sb and Te can
randomly occupy the same layer, thus resulting in a mixed con-
figuration.6 Among these configurations, we have adopted that
proposed by Kooi and de Hosson, whose total energy is
claimed to be the lowest in the computational studies available
in the recent literature.17,18,24As for the rock salt-like structure,
the fact that the phase transition occurs easily from the hexago-
nal phase suggests that the transformation does not imply a
large atomic rearrangement, and the two stackings must share
a common background.
The unit cell for the hexagonal phase here considered is
then made up of nine atoms and arranged in the stacking
sequence Te – Ge – Te – Sb – Te – Te – Sb – Te – Ge, while
the rock salt-like structure comes out from shifting the hex-
agonal Te – Sb – Te – Ge sub-unit along the [210] direction
to the next crystallographic plane, thus creating a vacancy
site (v) in between. That leads to a unit cell of 27 atoms and
three vacancies arranged in the stacking sequence Te – Ge –
Te – Sb – Te – v – Te – Sb – Te – Ge repeated three times
(Fig. 1). This sequence corresponds to a rock salt-like config-
uration where Te atoms occupy the Cl sites, while Na posi-
tions are filled either by Ge atoms, Sb atoms, or vacancies.
The experimental values for the cell parameters are: a¼ 4.22
A, c¼ 17.18 A for the hexagonal phase,25 and a0¼ 6.02 A,
corresponding to a¼ 4.26 A, c¼ 52.13 A in the equivalent
hexagonal system, for the rock salt-like structure.26 The ge-
ometry relaxation resulted in a difference from the experi-
mental data of Da¼ 0.08%, Dc¼�3.02% for the hexagonal
phase, and of Da¼�2.05%, Dc¼�1.8% for the cubic
phase. Moreover, a slight shift in the position of internal
planes is also found. The calculated shrinkage of the cparameter is consistent with the adopted LDA approximation,
and can also be found in the works of Sun et al.24 and of Lee
and Jhi,17 but contrasts with the results of Sosso et al.18
A 12� 12� 4 k-point grid for the hexagonal GST and a
12� 12� 1 grid for the rock salt-like phase have respec-
tively been used for the self-consistent calculation in order to
FIG. 1. (Color online) Atomic arrangement of the hexagonal (left) and rock
salt-like (right) GST, showing the stacking sequence along the crystalline
planes.
063716-2 Tsafack et al. J. Appl. Phys. 110, 063716 (2011)
Downloaded 26 Sep 2011 to 192.17.112.46. Redistribution subject to AIP license or copyright; see http://jap.aip.org/about/rights_and_permissions

determine the ground-state configurations for the two
systems at hand. The whole relaxation process for the hexag-
onal structure took around two days on an 8-processor Linux
cluster. Due to the intrinsically higher structural complexity,
the computational load for the rock salt cell proved to be
four times higher.
As the material optical response is due to transitions
within and between valence and conduction bands, the first
step toward its calculation, once the ground state is known,
involves computing the eigenfunctions and eigenvalues also
for the conduction band. A uniform grid of 20� 20� 20 was
used at this stage for both the hexagonal and the rock salt-
like cases. As the optical response strongly depends on the
transitions to the conduction band, introducing a dense grid
in the calculations increases the accuracy of the calculations
themselves. The equations used to build the complex dielec-
tric tensor �ab(x) are reported in the appendix.
The last part of the present investigation concerns the
vibrational modes. To this aim we have adopted the DFPT
approach27 provided by the Quantum Espresso package. This
method sidesteps the need of constructing a superlattice typi-
cal of the standard frozen-phonon framework,28 and allows
one to calculate the phonon-dispersion relation. The calcula-
tion breaks into three steps, namely, (i) computing the
ground-state charge density for the unperturbed system, (ii)evaluating the phonon frequencies and the dynamical matri-
ces at a given q-vector and, (iii) transforming the dynamical
matrices back in the real space. The calculation of the
ground-state charge density is performed by the self-
consistent procedure described earlier. The parameters used
in step (i) (cutoff energy, convergence threshold, Gaussian
smearing, and so on) are the same as those of the band-
structure calculation. However, a 4� 4� 1-dense k-point
grid has been adopted here. The phonon calculation is per-
formed with a 4� 4� 4 q-vector grid.
III. RESULTS AND DISCUSSION
A. Band diagram and density of states
In Figs. 2 and 3 we report the electronic band structures
along high-symmetry lines around the top of the valence
band (VB) and the bottom of the conduction band (CB). The
DOS is also shown. The actual calculation was performed in
an energy interval larger than that shown, this proving the
existence of a few deeper bands. Apart from the extension of
the bandgap that will be discussed later, the shape of the
bands compares favorably with the calculations of Yama-
naka et al.29 and, despite the different parameterization of
the pseudopotentials, matches very well the results by Lee
and Jhi,17 both qualitatively and quantitatively. A prelimi-
nary band diagram for the rock salt-like phase has recently
been published by some of the authors.30
As a result of the simulations, a bandgap smaller than
what measured in optical experiments (0.5 eV) (Refs. 10 and
11) is found in both cases. More specifically, the hexagonal
phase apparently acts as a semi-metal (VB and CB are
degenerate at the C point), whereas an indirect bandgap of
about 0.1 eV is found for the rock salt-like phase. This result
is consistent in shape with the findings of optical experi-
ments that indicate an indirect bang gap for this phase.
In the recent works of Lee and Jhi17 and of Sosso et al.18
a bandgap of about 0.2 eV, smaller than the optically-
determined one, is found also for the hexagonal phase. The
work of Lee and Jhi and that of Sosso et al. do not share the
same parameterization of the valence electrons for Te, nor
have the same size of the unit cell, but achieve similar results
for the bandgap. On the other hand, the shape of the bands
found in this work is almost the same as that of Lee and Jhi
and, once the conduction band obtained by our calculation is
shifted toward higher energies, it can be superimposed
almost exactly to that of Lee and Jhi. Moreover, apart from
high-frequency oscillations probably related to different
interpolating schemes, the calculated DOS for the hexagonal
phase is consistent with that of Sosso et al. for both the
valence and conduction bands. The same situation also holds
true for the rock salt-like phase with respect to experimental
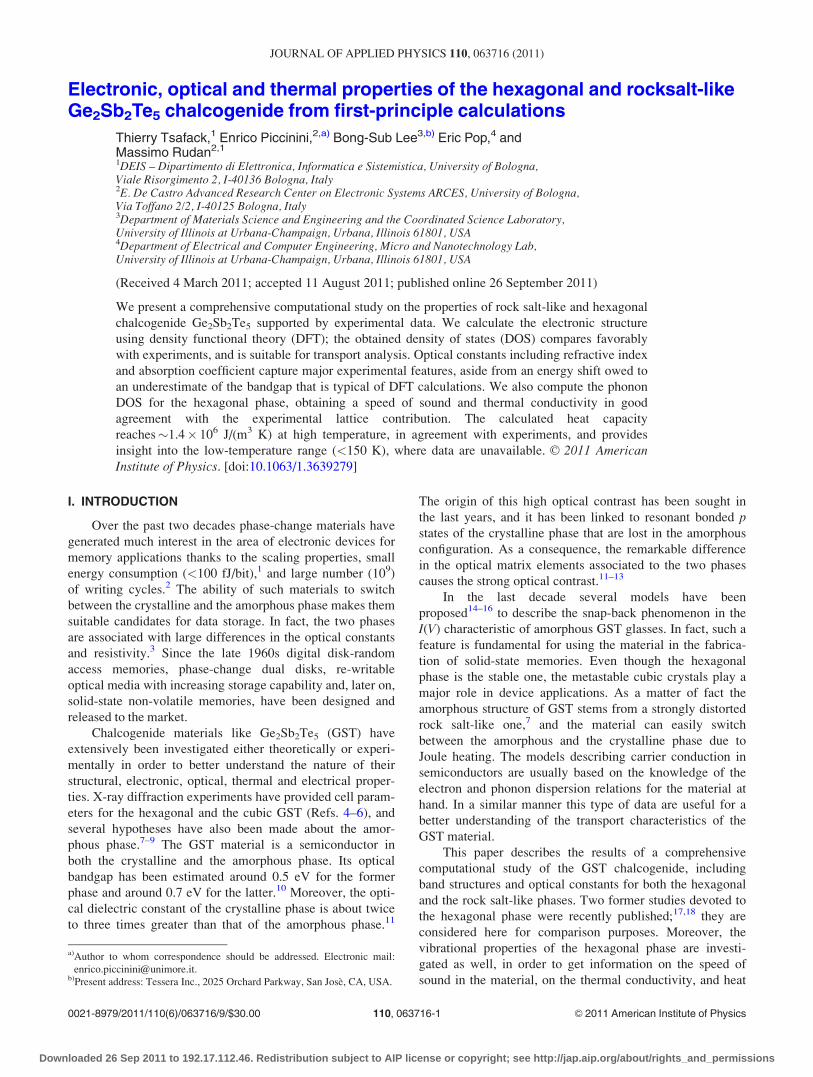
data (Fig. 4). Furthermore, the reported DOS compares well
to that calculated by Zhou and coworkers in a recent work
that was published during the revision process of the present
paper.32 One difference between this result and those of
FIG. 2. Band diagram for the hexagonal phase along the high symmetry
lines (left), and corresponding density of states (DOS) (right). The predicted
Fermi level is located at 0 eV.
FIG. 3. Band diagram for the rock salt-like phase along the high symmetry
lines. The predicted Fermi level is located at 0 eV. Only the valence band
and the bottom of the conduction band are shown. An indirect bandgap
of� 0.1 eV is found along the C-K line; the energy gap at C is about 0.2 eV.
The corresponding DOS is shown in Fig. 4.
063716-3 Tsafack et al. J. Appl. Phys. 110, 063716 (2011)
Downloaded 26 Sep 2011 to 192.17.112.46. Redistribution subject to AIP license or copyright; see http://jap.aip.org/about/rights_and_permissions
Sosso et al.,18 of Lee and Jhi17 and of Zhou et al.32 relies on
the approximation of the exchange-correlation potential
(LDA instead of the generalized-gradient approximation).
The use of different parameterizations for the pseudopoten-
tials and the exchange-correlation term results in different
lattice constants and bandgap values.
Nevertheless, the discrepancies in the bandgap among
this work and the three references cited above are well
within the intrinsic procedure error.33
The underestimation of the bandgap is a well-known
effect of the DFT calculation and can be corrected by the
GW approach and the Bethe-Salpeter equation, to take into
account many-body effects.34 Despite this limitation, DFT is
able to reproduce trends, such as a variation in the bandgap
due to structural changes. This is the case of the slight
increase in the bandgap found in the transition from the hex-
agonal to the rock salt-like cubic phase. In fact, the stoichi-
ometry of the cubic phase implies that 20% of the lattice
positions are represented by vacancies, situated between two
well-defined sub-units of the unit cell. Due to the increased
distance, the Te-Te bond of the rock salt-like structure is
much weaker than that of the hexagonal counterpart. When a
melt is quickly undercooled to the amorphous state, the num-
ber of weak bonds found in the final structure is quite large,
and rings and structural defects are also found.8,9,35 It has
been shown that the formation of vacancies in GST is driven
by an increase of the energy gap, this resulting in a lower
total energy of the structure.32 According to the capability of
predicting trends of the DFT calculations, since the presence
of vacancies and defects grows from the hexagonal to the
cubic crystal and from the cubic phase to the amorphous
one, a wider bandgap is expected for the latter, consistently
with optical determinations. For these reasons, the obtained
bands are suitable for being incorporated into a transport
simulation scheme that takes into account all of the material
phases, including the amorphous one.
The second effect leading to the underestimation of the
bandgap is that the measured bandgap depends on the posi-
tion of the Fermi level. For a p-type degenerate semiconduc-
tor such as crystalline GST (Ref. 36), the Fermi level is
inside the valence band. As a consequence, for an interband
optical transition to occur, a photon must be absorbed having
an energy larger than the difference between the band edges.
Therefore, the optical bandgap of a degenerate semiconduc-
tor is larger than the electronic bandgap (Burstein-Moss
shift).37 A proof that the crystalline GST is a p-type degener-
ate semiconductor comes from the experiments based on the
Hall effect. Indeed, to explain the temperature-dependence
of the Hall coefficient it is necessary to assume that the
Fermi level for the hexagonal GST is about 0.1 eV lower
than the valence band edge.10
B. Optical properties
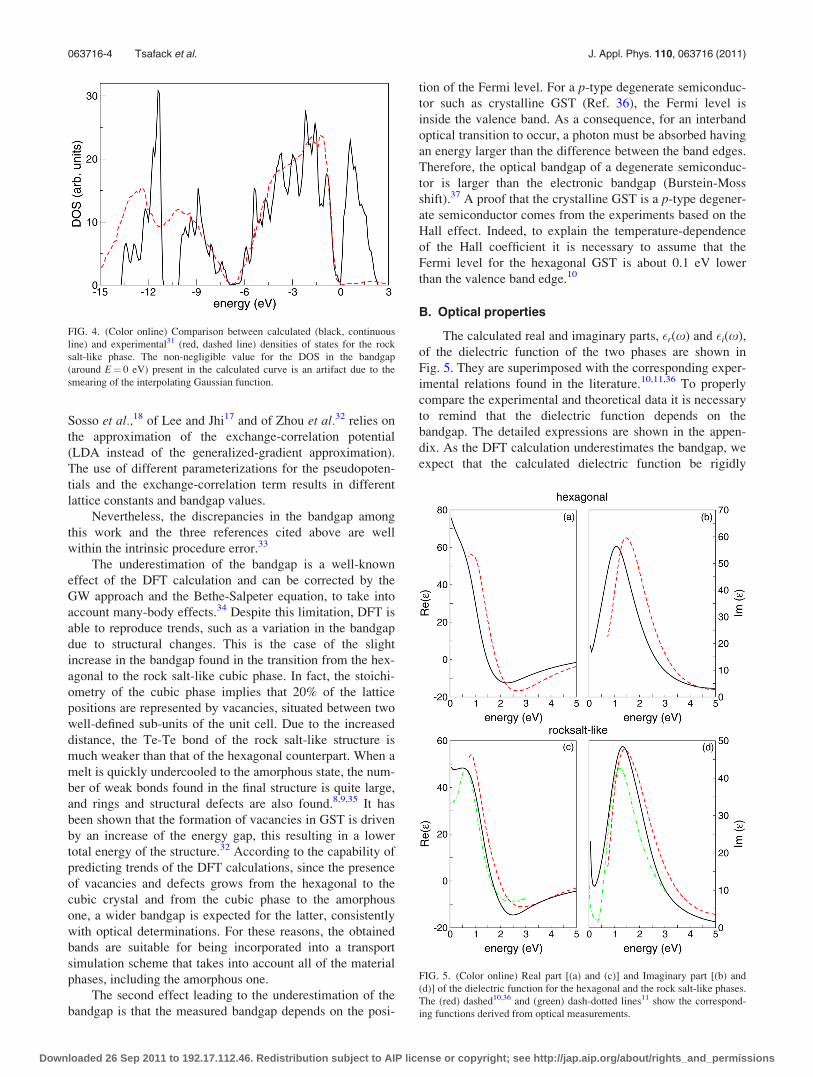
The calculated real and imaginary parts, �r(x) and �i(x),
of the dielectric function of the two phases are shown in
Fig. 5. They are superimposed with the corresponding exper-
imental relations found in the literature.10,11,36 To properly
compare the experimental and theoretical data it is necessary
to remind that the dielectric function depends on the
bandgap. The detailed expressions are shown in the appen-
dix. As the DFT calculation underestimates the bandgap, we
expect that the calculated dielectric function be rigidly
FIG. 4. (Color online) Comparison between calculated (black, continuous
line) and experimental31 (red, dashed line) densities of states for the rock
salt-like phase. The non-negligible value for the DOS in the bandgap
(around E¼ 0 eV) present in the calculated curve is an artifact due to the
smearing of the interpolating Gaussian function.
FIG. 5. (Color online) Real part [(a) and (c)] and Imaginary part [(b) and
(d)] of the dielectric function for the hexagonal and the rock salt-like phases.
The (red) dashed10,36 and (green) dash-dotted lines11 show the correspond-
ing functions derived from optical measurements.
063716-4 Tsafack et al. J. Appl. Phys. 110, 063716 (2011)
Downloaded 26 Sep 2011 to 192.17.112.46. Redistribution subject to AIP license or copyright; see http://jap.aip.org/about/rights_and_permissions
shifted on the energy axis toward the lower energies with
respect to the experimental one. This indeed happens, and
the horizontal offset found between the experimental and
theoretical curves (approx. 0.5 eV) complies with such an
interpretation. Since DFT does not take into account many-
body effects, excitonic effects have been ignored. As typical
of chalcogenides, the very large values of the static dielectric
constant legitimates this assumption.12
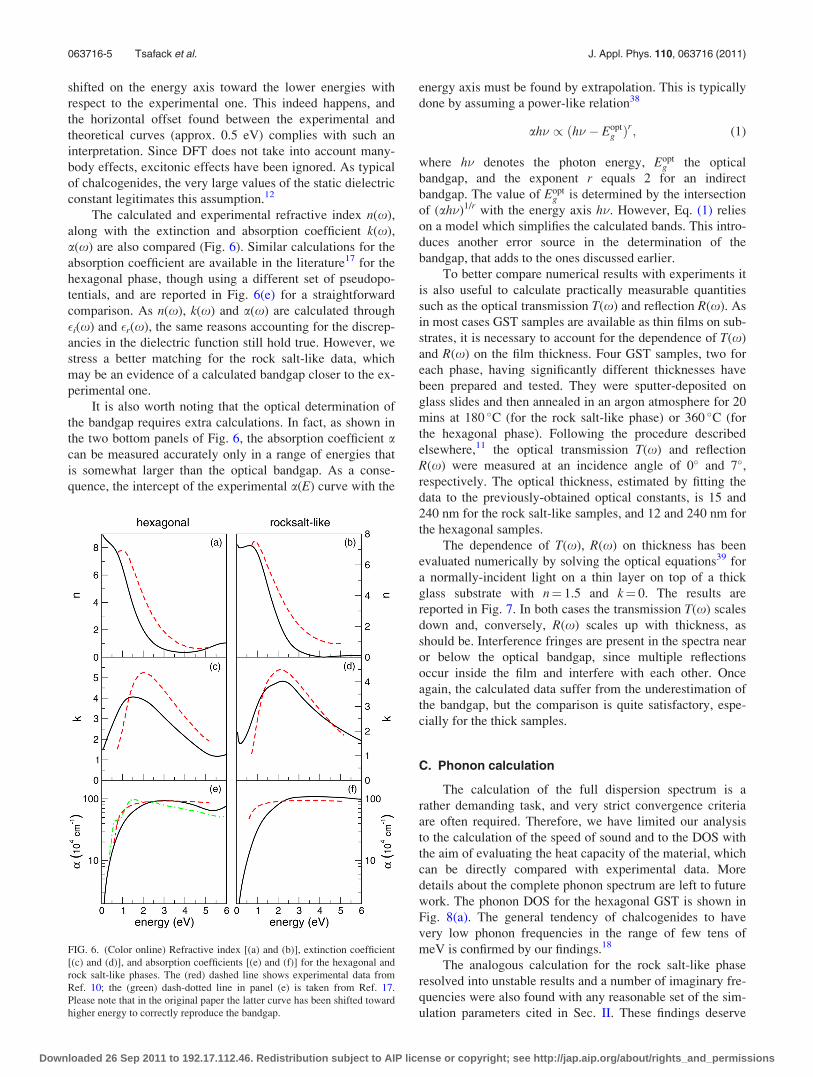
The calculated and experimental refractive index n(x),
along with the extinction and absorption coefficient k(x),
a(x) are also compared (Fig. 6). Similar calculations for the
absorption coefficient are available in the literature17 for the
hexagonal phase, though using a different set of pseudopo-
tentials, and are reported in Fig. 6(e) for a straightforward
comparison. As n(x), k(x) and a(x) are calculated through
�i(x) and �r(x), the same reasons accounting for the discrep-
ancies in the dielectric function still hold true. However, we
stress a better matching for the rock salt-like data, which
may be an evidence of a calculated bandgap closer to the ex-
perimental one.
It is also worth noting that the optical determination of
the bandgap requires extra calculations. In fact, as shown in
the two bottom panels of Fig. 6, the absorption coefficient acan be measured accurately only in a range of energies that
is somewhat larger than the optical bandgap. As a conse-
quence, the intercept of the experimental a(E) curve with the
energy axis must be found by extrapolation. This is typically
done by assuming a power-like relation38
ah� / ðh� � Eoptg Þ
r; (1)
where h� denotes the photon energy, Eoptg the optical
bandgap, and the exponent r equals 2 for an indirect
bandgap. The value of Eoptg is determined by the intersection
of (ah�)1/r with the energy axis h�. However, Eq. (1) relies
on a model which simplifies the calculated bands. This intro-
duces another error source in the determination of the
bandgap, that adds to the ones discussed earlier.
To better compare numerical results with experiments it
is also useful to calculate practically measurable quantities
such as the optical transmission T(x) and reflection R(x). As
in most cases GST samples are available as thin films on sub-
strates, it is necessary to account for the dependence of T(x)
and R(x) on the film thickness. Four GST samples, two for
each phase, having significantly different thicknesses have
been prepared and tested. They were sputter-deposited on
glass slides and then annealed in an argon atmosphere for 20
mins at 180 �C (for the rock salt-like phase) or 360 �C (for
the hexagonal phase). Following the procedure described
elsewhere,11 the optical transmission T(x) and reflection
R(x) were measured at an incidence angle of 0� and 7�,respectively. The optical thickness, estimated by fitting the
data to the previously-obtained optical constants, is 15 and
240 nm for the rock salt-like samples, and 12 and 240 nm for
the hexagonal samples.
The dependence of T(x), R(x) on thickness has been
evaluated numerically by solving the optical equations39 for
a normally-incident light on a thin layer on top of a thick
glass substrate with n¼ 1.5 and k¼ 0. The results are
reported in Fig. 7. In both cases the transmission T(x) scales
down and, conversely, R(x) scales up with thickness, as
should be. Interference fringes are present in the spectra near
or below the optical bandgap, since multiple reflections
occur inside the film and interfere with each other. Once
again, the calculated data suffer from the underestimation of
the bandgap, but the comparison is quite satisfactory, espe-
cially for the thick samples.
C. Phonon calculation
The calculation of the full dispersion spectrum is a
rather demanding task, and very strict convergence criteria
are often required. Therefore, we have limited our analysis
to the calculation of the speed of sound and to the DOS with
the aim of evaluating the heat capacity of the material, which
can be directly compared with experimental data. More
details about the complete phonon spectrum are left to future
work. The phonon DOS for the hexagonal GST is shown in
Fig. 8(a). The general tendency of chalcogenides to have
very low phonon frequencies in the range of few tens of
meV is confirmed by our findings.18
The analogous calculation for the rock salt-like phase
resolved into unstable results and a number of imaginary fre-
quencies were also found with any reasonable set of the sim-
ulation parameters cited in Sec. II. These findings deserve
FIG. 6. (Color online) Refractive index [(a) and (b)], extinction coefficient
[(c) and (d)], and absorption coefficients [(e) and (f)] for the hexagonal and
rock salt-like phases. The (red) dashed line shows experimental data from
Ref. 10; the (green) dash-dotted line in panel (e) is taken from Ref. 17.
Please note that in the original paper the latter curve has been shifted toward
higher energy to correctly reproduce the bandgap.
063716-5 Tsafack et al. J. Appl. Phys. 110, 063716 (2011)
Downloaded 26 Sep 2011 to 192.17.112.46. Redistribution subject to AIP license or copyright; see http://jap.aip.org/about/rights_and_permissions

some attention. The presence of imaginary frequencies can in
principle be ascribed to a mechanical instability of the simu-
lated structure and/or to convergence issues of the numerical
routine. It is well assessed in the literature that the stable crys-
tal for GST is hexagonal, while the rock salt-like structure is
metastable, i.e., it corresponds to a relative minimum on the
energy scale. As stated in Sec. II, the first stage of this work
was devoted to relaxation in order to bring the structure into
the lowest energy associated to the imposed atomic arrange-
ment. The relaxed configuration is always a rock salt structure
with internal distortions, which become almost insensitive to
the convergence conditions when typical threshold values for
this kind of simulations are reached. On the contrary, the cor-
responding simulations for the phonon spectrum presented
convergence issues, and even when (apparent) convergence is
reached, a significant amount of imaginary frequencies are
present. Nevertheless, we are confident on the validity of our
results for the electronic and optical properties owing to the
consideration above and to the good comparison of our elec-
tronic DOS and optical properties to experimental data and
other independent simulations, as shown in the previous sec-
tions. Convergence problems encountered with the rock salt-
like structure appear in fact more correlated to shortcomings
of the numerical procedure (probably due to the complexity
of the structure itself) than to a real mechanical instability of
the simulated crystal. Due to these convergence issues the cal-
culation of the phonon DOS for the rock salt-like phase is
omitted from the present publication.
For the hexagonal structure, the calculated speed of
sound along the three orthogonal directions is approximately
vt1¼ 1.74 nm/ps, vt2¼ 2.24 nm/ps and vl¼ 3.36 nm/ps for
the two transverse and the longitudinal branch, respectively.
The last value compares well with the experimentally
estimated� 3.3 nm/ps reported in the literature.40 In the high
temperature limit, the speed of sound can be exploited to
determine the lattice contribution to the minimum thermal
conductivity Kmin of the material:
Kmin ¼1
2
p6
� �1=3
kBn2=3ðvl þ vt1 þ vt2Þ; (2)
where n�3:4� 1022cm-3 is the atomic density, and kB is the
Boltzmann constant. The lattice contribution to the minimum
thermal conductivity is Kmin¼ 0.43 W/(m K), a lower value
than those observed in experiments for the hexagonal phase,
which also include an electronic contribution.
However, this result must be interpreted with care, and
three aspects deserve attention. First, it should be pointed out
that the hexagonal phase is the only stable phase existing at
high temperatures (typically above 600 K), and data often
refer to that range. Next, according to Reifenberg and co-
workers,41 the GST thermal conductivity depends also on the
film thickness. For the hexagonal phase they found a
decrease from 1.76 W/(m K) for a 350-nm thick sample to
0.83 W/(m K) for a 60-nm thick sample. Finally, the carrier
density in hexagonal crystalline GST is relatively large and
electrical carriers also contribute to the heat transport.
Experiments have estimated that the electrical contribution
is roughly equivalent to the lattice contribution,42 thus lead-
ing to an overall conductivity about twice that of Kmin calcu-
lated above. Thus, taking into account these remarks, Kmin is
consistent with the phonon contribution in the experiments.
A further confirmation about the validity of the reported
DOS comes from a comparison of the calculated heat
capacity of GST with that experimentally-determined by
Kuwahara and co-workers.43 Let E ¼ �hx be the energy of
the phonon; the heat capacity can be calculated from the
simulated phonon DOS by means of:
C ¼ð1
0
E@fBEðEÞ@T
DOSðEÞdE (3)
where fBEðEÞ ¼ exp½E=ðkBTÞ� � 1f g�1is the Bose-Einstein
distribution function, and T is the temperature. The calcu-
lated and experimental data are reported in Fig. 8 up to 870
K, which corresponds to the approximate melting tempera-
ture of GST. According to Kuwahara, the experimental heat
capacity slightly increases in the high-temperature region, as
the result of structural relaxation of point defects. However,
the integral in Eq. (3) includes only the lattice contribution
to heat capacity, and thus predicts a saturating value in the
classical limit at high temperature. Nevertheless, the
FIG. 7. (Color online) Optical transmission T [(a) and (c)], and reflection R[(b) and (d)] for a thin (12 or 15 nm, black lines) and for a thick sample (240
nm, red lines with solid dots). Calculated values are represented by continu-
ous lines, while dashed lines refers to experiments.
063716-6 Tsafack et al. J. Appl. Phys. 110, 063716 (2011)
Downloaded 26 Sep 2011 to 192.17.112.46. Redistribution subject to AIP license or copyright; see http://jap.aip.org/about/rights_and_permissions

comparison is good, and calculated data are consistent with
experiments in the whole range examined. In addition, these
calculations provide an estimate of the heat capacity of hex-
agonal GST in the temperature range where experimental
data are unavailable (T< 150 K).
IV. CONCLUSION
In this paper, we reported the electronic and optical
properties for the hexagonal and rock salt-like phases of the
Ge2Sb2Te5 chalcogenide.
The electronic band diagram and DOS were calculated
using the density functional theory combined with planes
waves, norm-conserving pseudo-potentials and the local den-
sity approximation implemented in the code Quantum
Espresso. The band diagram and DOS for the hexagonal
phase are in good agreement with those reported in the litera-
ture. Even though DFT equations are known to underesti-
mate the bandgap, the shape of the bands confirms the
existence of an indirect bandgap for the rock salt-like cubic
phase, and the DOS of the latter correctly compares to previ-
ously published data. The calculation also showed a tend-
ency of the bandgap to increase with respect of the degree of
disorder of the cell. This result makes the band diagrams
suitable to be used in transport simulations that describe the
electrical behavior of GST.
The dielectric function was obtained implementing the
Drude-Lorentz expression and the Kramers-Kronig relation-
ships. Furthermore, the refractive index, the extinction and
absorption coefficients were derived from the Maxwell
model. By incorporating these functions into equations
including multiple internal reflection, the optical transmis-
sion and reflection for a thin chalcogenide film deposited on
a glass substrate were calculated and then compared to
experiments. Most of the differences in the comparison can
be ascribed to the underestimation of the bandgap.
Moreover, the density functional perturbation theory
allowed us to calculate also the phonon DOS for the hexago-
nal phase. The analysis of the acoustic modes for the hexago-
nal phase led to reasonable values for both the speed of
sound and the minimum thermal conductivity at room tem-
perature. The heat capacity from 5 K up to the melting tem-
perature is also presented, in good agreement with
experimental data at high temperature, and providing insight
into the low temperature range (T< 150 K) where data are
unavailable.
ACKNOWLEDGMENTS
The authors appreciate the helpful ideas and sugges-
tions from Professor C. Jacoboni and Professor R. Brunetti
(University of Modena and Reggio Emilia), Professor P.
Giannozzi (University of Udine), and Dr. S. Pamidighantam
(National Center of Supercomputing Applications at the
University of Illinois). The authors also want to credit
Dr. A. Calzolari and Dr. A. Ferretti (University of Modena
and Reggio Emilia) for their support in the start-up of the
simulation environment. Special thanks are also due to Pro-
fessor J.R. Abelson and Professor S.G. Bishop for useful
discussions and support. B.-S. Lee was supported by the
National Science Foundation under Awards No. DMR
07-06267. The experimental samples were supplied by
Dr. Byung-ki Cheong at Korea Institute of Science and
Technology, and the optical properties were measured in
the Frederick Seitz Materials Research Laboratory Central
Facilities, University of Illinois, which are partially sup-
ported by the U.S. Department of Energy under Grants
DE-FG02-07ER46453 and DE-FG02-07ER46471. E. Pop
acknowledges support from the Materials Structures and
Devices (MSD) Focus Center, under the Focus Center
Research Program (FCRP), a Semiconductor Research Cor-
poration entity, and the Office of Naval Research (ONR)
Young Investigator Program (YIP) Grant No. N00014-10-
1-0853. Part of this work has been carried on under the
Grant No. 34524/2007 of the Intel Corporation, whose sup-
port is gratefully acknowledged.
APPENDIX: DERIVATION OF THE OPTICALPROPERTIES FROM THE BAND DIAGRAM
In the framework of band theory without electron-hole
interaction, the dielectric tensor �ab is defined as
�abðxÞ¼1þ e2
e0Xm2
Xn;n0
Xk
Mnn0
ab ½f ðEknÞ�f ðEkn0 Þ�ðEkn0 �EknÞ2
þ 1
ðxkn0 �xknÞþxþiCxþ 1
ðxkn0 �xknÞ�x�iCx
� �(A1)
with C! 0þ. In Eq. (A1) e, m and X are the electron charge
and mass, and the volume of the lattice cell, respectively;
Ekn are the eigenvalues of the Hamiltonian and f(Ekn) is the
Fermi distribution function accounting for the band occupa-
tion. Letting xp ¼ffiffiffiffiffiffiffiffiffiffiffiffiffiffiffiffiffiffiffiffiffiffiffiffiffiðe2NÞ=ðe0mÞ
pbe the plasma frequency
with N standing for the number of electrons per unit volume,
FIG. 8. (Color online) (a) Phonon density of states for the hexagonal phase.
(b) Heat capacity for hexagonal GST calculated using data from the panel
(a) and Eq. (3) (black line) compared to experimental data (solid red dots)
taken from Ref. 43. The inset shows the same data in the linear scale to bet-
ter represent the region above room temperature, and the error bars for the
experimental data.
063716-7 Tsafack et al. J. Appl. Phys. 110, 063716 (2011)
Downloaded 26 Sep 2011 to 192.17.112.46. Redistribution subject to AIP license or copyright; see http://jap.aip.org/about/rights_and_permissions

and D ¼ ðxkn0 � xknÞ2 � x2h i2
þC2x2, the imaginary part
�iabðxÞ of the dielectric tensor �abðxÞ is given by the follow-
ing Drude-Lorentz expression:
�iabðxÞ ¼x2
p
NmX
Xn;k
df ðEknÞdEkn
gxMnnab
x4 þ g2x2
"
þ2Xn;n0
Xk
f ðEknÞEkn0 � Ekn
CxMnn0
ab
D
#;
(A2)
where the original sum over n and n0 of Eq. (A1) has been
split into two terms, the former accounting for valence-to-
valence (or conduction-to-conduction) intraband transitions
(n0 ¼ n), the latter standing for transitions from states belong-
ing to the valence band (index n) to states belonging to the
conduction band (index n0). In the summands, the squared
matrix elements Mnn0
ab are weighted by a smearing coefficient
(g or C), and by a factor depending on the Fermi distribution
function for interband transitions, or on its derivative for the
intraband contribution. Considering that the derivative is
substantially zero except in the region close to the Fermi
level, the dielectric tensor is dominated by interband transi-
tions, as expected. Nevertheless, a few states near the top of
the valence band can be empty due to thermal excitations
and, conversely, a small amount of states in the conduction
band are occupied. As a consequence, a number of intraband
transitions occur, that are described by the first summand of
Eqs. (A2) and (A3). Accounting for such transitions is useful
to better reproduce the experimental behavior.
In order to keep the Drude-Lorentz approximation valid,
the two smearing coefficients g and C must be small, even
though not vanishing. For the case described in the text they
were treated as fitting parameters and both set to 1.0 for the
hexagonal phase and to 0.8 and 0.3, respectively, for the
cubic phase.
The real �rab(x) part of the dielectric tensor is then
calculated applying the Kramers-Kronig relationship to
Eq. (A2):
�rabðxÞ ¼1�x2
p
NmX
Xn;k
df ðEknÞdEkn
x2Mnnab
x4 þ g2x2
"
�2Xn;n0
Xk
f ðEknÞEkn0 � Ekn
ðD� C2x2ÞMnn0
ab
D
#:
(A3)
The squared matrix elements Mnn0
ab reveals the tensorial na-
ture of �abðxÞ and are defined as follows:
Mnn0
ab ¼ hukn0 jpajuknihuknjp†bjukn0 i (A4)
where jukni is a factor of the single particle Bloch function
obtained by the Kohn-Sham DFT calculation, and pa is the
momentum operator along the a direction.
In a principal system, the off-diagonal elements of the
dielectric tensor are zero and, for perfectly isotropic materi-
als, the diagonal elements are equal. For the two systems
considered here, only two eigenvalues out of three are equal.
In order to compare results with experimental data where
isotropy is assumed, the eigenvalues of the dielectric tensor
have been averaged to obtain a unique function.
The refractive index n(x), the extinction coefficient
k(x) and the absorption coefficient a(x) are calculated by
means of the Maxwell model through the following
relationships:
nðxÞ ¼
ffiffiffiffiffiffiffiffiffiffiffiffiffiffiffiffiffiffiffiffiffiffiffiffiffiffiffiffiffiffiffiffiffiffiffiffiffiffiffiffiffiffiffiffiffiffiffiffiffiffiffiffiffiffiffiffiffiffiffiffiffiffiffiffiffiffiffiffiffiffiffiffiffiffiffiffiffiffiffiffiffiffiffi�rðxÞ2 þ �iðxÞ2
qþ �rðxÞ
2
vuut; (A5)
kðxÞ ¼
ffiffiffiffiffiffiffiffiffiffiffiffiffiffiffiffiffiffiffiffiffiffiffiffiffiffiffiffiffiffiffiffiffiffiffiffiffiffiffiffiffiffiffiffiffiffiffiffiffiffiffiffiffiffiffiffiffiffiffiffiffiffiffiffiffiffiffiffiffiffiffiffiffiffiffiffiffiffiffiffiffiffiffi�rðxÞ2 þ �iðxÞ2
q� �rðxÞ
2
vuut; (A6)
aðxÞ ¼ xcnðxÞ �iðxÞ ¼
2xc
kðxÞ: (A7)
where the symbols �r and �i without superscripts represent an
average function determined as described above.
1F. Xiong, A. D. Liao, D. Estrada, and E. Pop, Science 332, 568 (2011).2H.-S. P. Wong, S. Raoux, S. B. Kim, J. Liang, J. P. Reifenberg, B. Rajen-
dran, M. Asheghi, and K. E. Goodson, Proc. IEEE 98, 2201 (2010).3S. R. Ovshinsky, Phys. Rev. Lett. 21, 1450 (1968).4I. I. Petrov, R. M. Imamov, and Z. G. Pinsker, Sov. Phys. Crystallogr. 13,
339 (1968).5B. J. Kooi and J. T. M. de Hosson, J. Appl. Phys., 92, 3584 (2002).6T. Matsunaga, N. Yamada, and Y. Kabota, Acta Crystallogr. B 60, 685
(2004).7A. Kolobov, P. Fons, A. I. Frenkel, A. L. Ankudinov, J. Tominaga, and T.
Uruga, Nature Mat. 3, 703 (2004).8J. Akola and R. O. Jones, Phys. Rev. B 76, 235201 (2007).9S. Caravati, M. Bernasconi, T. D. Kuhne, M. Krack, and M. Parrinello,
Appl. Phys. Lett. 91, 171906 (2006).10B.-S. Lee, J. R. Abelson, S. G. Bishop, D.-H. Kang, B. Cheong, and K.-B.
Kim, J. Appl. Phys. 97, 093509 (2005).11K. Shportko, S. Kremers, M. Woda, D. Lencer, J. Robertson, and M.
Wuttig, Nature Mat. 7, 653 (2008).12W. Welnic, S. Botti, L. Reining, and M. Wuttig, Phys. Rev. Lett. 98,
236403 (2007).13B. Huang and J. Robertson, Phys. Rev. B 81, 081204(R), (2010).14A. Pirovano, A. L. Lacaita, A. Benvenuti, F. Pellizzer, and R. Bez, IEEE
Trans. Electron Devices 51, 452 (2004).15D. Ielmini and Y. Zhang, J. Appl. Phys. 102, 054517 (2007).16F. Buscemi, E. Piccinini, R. Brunetti, M. Rudan, and C. Jacoboni, J. Appl.
Phys. 106, 103706 (2009).17G. Lee and S.-H. Jhi, Phys. Rev. B 77, 153201 (2008).18G. C. Sosso, S. Caravati, C. Gatti, A. Assoni, and M. Bernasconi, J. Phys.:
Condens. Matter 21, 245401 (2009).19P. Giannozzi, S. Baroni, N. Bonini, M. Calandra, R. Car, C. Cavazzoni,
D. Ceresoli, G. L. Chiarotti, M. Cococcioni, I. Dabo, A. Dal Corso, S. de
Gironcoli, S. Fabris, G. Fratesi, R. Gebauer, U. Gerstmann, C. Gougoussis,
A. Kokalj, M. Lazzeri, L. Martin-Samos, N. Marzari, F. Mauri, R. Mazzar-
ello, S. Paolini, A. Pasquarello, L. Paulatto, C. Sbraccia, S. Scandolo,
G. Sclauzero, A. P. Seitsonen, A. Smogunov, P. Umari, and R. M. Wentz-
covitch, J. Phys.: Condens. Matter 21, 395502 (2009).20J. P. Perdew and A. Zunger, Phys. Rev. B 23, 5048 (1981).21X. Gonze, R. Stumpf, and M. Scheffler, Phys. Rev. B 44, 8503 (1991).22G.-S. Do, J. Kim, S-H. Jhi, S. G. Louie, and M. L. Cohen, Phys. Rev. B
82, 054121 (2010).23E. van Lenthe, J. G. Snijders, and E. J. Baerends, J. Chem. Phys. 105,
6505 (1996).24Z. Sun, J. Zhou, and R. Ahuja, Phys. Rev. Lett. 96, 055507 (2006).25I. Friedrich, V. Weidenhof, W. Njoroge, P. Franz, and M. Wuttig, J. Appl.
Phys. 87, 4130 (2006).26Y.-J. Park, J.-Y. Lee, M.-S. Youm, Y.-T. Kim, and H.-S. Lee, J. Appl.
Phys. 97, 093506 (2005).
063716-8 Tsafack et al. J. Appl. Phys. 110, 063716 (2011)
Downloaded 26 Sep 2011 to 192.17.112.46. Redistribution subject to AIP license or copyright; see http://jap.aip.org/about/rights_and_permissions

27S. Baroni, S. de Gironcoli, A. Dal Corso, and P. Giannozzi, Rev. Mod.
Phys. 73, 515 (2001).28K. Parlinski, Z. Q. Li, and Y. Kawazoe, Phys. Rev. Lett. 78, 4063
(1997).29S. Yamanaka, S. Ogawa, I. Morimoto, and Y. Ueshima, Jpn. J. Appl. Phys.
37, 3327 (1998).30E. Piccinini, T. Tsafack, F. Buscemi, R. Brunetti, M. Rudan, C. Jacoboni,
Proc. of the 2008 Int. Conf. on Simulation of Semiconductor Processes
and Devices (SISPAD), 2008, p. 229.31J. J. Kim, K. Kobayashi, E. Ikenaga, M. Kobata, S. Ueda, T. Matsunaga,
K. Kifune, R. Kojima, and N. Yamada, Phys. Rev. B 76, 115124 (2007).32J. Zhou, Z. Sun, Y. Pang, Z. Song, and R. Ahuja, Eur. Phys. Lett. 95,
27002 (2011).33F. Gygi and A. Baldareschi, Phys. Rev. Lett. 62, 2160 (1989).34G. Onida, L. Reining, and A. Rubio, Rev. Mod. Phys. 74, 601 (2002).35J. Hegedus and S. R. Elliot, Nature Mat. 7, 399 (2008).
36B.-S. Lee and S. G. Bishop, Optical and Electrical Properties of PhaseChange Materials in Phase Change Materials (Science and Applications)(Springer, New York, 2009).
37T. S. Moss, Optical Properties of Semiconductors (Butterworths, London,
1959).38N. F. Mott and E. A. Davis, Electronic Processes in Non-Crystalline Mate-
rials, 2nd ed. (Clarendon, Oxford, 1979).39D. V. Tsu, J. Vac. Sci. Technol. A 17, 1854 (1999).40H.-K. Lyeo, D. G. Cahill, B.-S. Lee, J. R. Abelson, M-H. Kwon, K.-B.
Kim, S. G. Bishop, and B. Cheong, Appl. Phys. Lett. 89, 151904 (2006).41R. P. Reifenberg, S. Kim, A. Gibby, Y. Zhang, M. Panzer, E. Pop, S. Wong,
H.-S. Wong, and K. E. Goodson, Appl. Phys. Lett. 91, 111904 (2007).42Y. Yang, C. T. Li, S. M. Sadeghipour, H. Dieker, M. Wuttig, and M. Ashe-
ghi, J. Appl. Phys. 100, 024102 (2006).43M. Kuwahara, O. Suzuki, Y. Yamakawa, M. Taketoshi, T. Yagi, P. Fons,
T. Fukaya, J. Tominaga, and T. Baba, Jpn. J. Appl. Phys. 46, 3909 (2007).
063716-9 Tsafack et al. J. Appl. Phys. 110, 063716 (2011)
Downloaded 26 Sep 2011 to 192.17.112.46. Redistribution subject to AIP license or copyright; see http://jap.aip.org/about/rights_and_permissions