electronic excltatlon transfer in concentrated micelle
TRANSCRIPT

8930 J . Phys. Chem. 1992, 96, 8930-8937
Electronic Excltatlon Transfer in Concentrated Micelle Solutions
A. H. Marcus, Nathan A. Diacbun, and M. D. Fayer* Department of Chemistry, Stanford University, Stanford, California 94305 (Received: May 26, 1992)
Electronic excitation transport among interacting clusters of chromophores is investigated as a function of chromophore and cluster concentration. The technique of time-correlated single photon counting is employed to obtain time-resolved fluorescence depolarization data on aqueous octadecylrhodamine B/triton X- 100 micelle solutions. The time-dependent fluorescence anisotropy, the energy transport observable, is directly compared to a theory developed to model this system. The theory is based on a first-order cumulant approximation to the solution of the transport master equation. The model depicts the micelles as monodisperse hard spheres with chromophores (octadecylrhodamine B) distributed about their surfaces. At low micelle concentration, the dynamics of excitation transfer depend only on internal micelle structure. At high micelle concentration, excitation transfer occurs among chromophores on different micelles in addition to intramicelle transfer. The theoretical treatment provides nearly quantitative descriptions of the time and concentration dependence of the excitation transport. It correctly predicts the concentration at which intermicelle transfer becomes significant. In the low micelle concentration limit (energy transport confined to isolated micelles) the model having a Poisson distribution of chromophores works well for small v ([chromophores]/[micelle]), but progressively worse as v is increased. Following the literature, a chromophore interaction parameter (in the form of a two dimensional second virial coefficient) is used to skew the probe distribution. This enables the transport theory to reproduce the data for all the values of v investigated and provides a determination of the second virial coefficient.
I. Introduction Electronic excitation transport (EET) among chromophores
in isolated finite volumes has been extensively studied during the past 10 years. Theoretical and experimental work has focused on the transport dynamics in both donor-donor and donor-trap systems. Studies of donor-donor EET (identical probe chromo- phores) confined to restricted configurations have provided in- formation concerning macromolecular structure.14 Some com- monly studied confined geometry systems include probe molecules solubilized in aqueous micelle environments, specifically designed copolymers that contain chromophore constituents, probe mole- cules intercalated in the site specific pores of zeolite clays, and photosynthetic light-harvesting antenna pigment^.^,^,^
The configuration of a probe domain determines its excited state transport dynamics. The domain configuration is defined by the set K = (ri,Wi,ti), containing the probe coordinates, absolute ori- entations and site energies. In a dynamic system, K may evolve in time. However, depending on the relative time scale of the energy transport observable in comparison to that of the evolution of K, suitable approximations may be applied to accurately model both ergotic and nonergotic systems. For nondispersive systems, such as those presented in this work, the EET is independent of site energy disorder and only a function of distance and orientation. However, recent room-temperature experiments have found EET to be dependent on the dispersion of the site energies (for a tagged copolymer isolated in a polymeric glass)'-* as well as the time dependence of the site energies leading to spectral diffusion (for dye molecules in polar viscous solution^).^
Because the excited-state dynamics depend strongly on con- figuration, statistical theories have been developed and successfully employed to extract quantitative information concerning probe morphology. For example, the effective radius of octadecyl- rhodamine B (ODRB) chromophores distributed on the surfaces of isolated triton X-100 micelles (Figure 1) has been determined and found to agree with independent light-scattering measurements of the micelle hydrodynamic v01ume.~ Similarly, the rms radius of gyration of poly(co-methyl methacrylate-2-vinylnaphthalene) isolated in a poly(methy1 methacrylate) matrix has been found to agree quantitatively with light-scattering measurements.s In the systems discussed above, the excitation is confined to
migrate within a single cluster of chromophores. These are isolated systems since the micelle or polymer concentration is low enough that the interaction between chromophores on neighboring clusters is negligible. As the concentration is increased, however, transfer of excitations between clusters (chromophores solubilized in a micelle or tagged on a polymer chain) may compete with intra- cluster transfer events. Intercluster excited-state transfer will become increasingly more important as the concentration of
0022-3654/92/2096-8930$03.00/0
clusters is raised. It is the excited-state dynamics which occur in the intermediate and high concentration limits that will be explored here.
In this paper we report picosecond timecorrelated single photon counting fluorescence experiments on excitation transfer among ODRB chromophores randomly distributed on the surfaces of triton X-100 micelles at high and low concentrations. These experiments are compared to a theory previously developed to model this system.1°
The physicochemical properties of surfactant solutions have been extensively studied, and their various mesomorphous states are fairly well understood. The lyotropic mesophase structures of triton X-100 in water have been characterized. This system remains in an isotropic state comprised of essentially monodisperse spherical aggregates with hydrocarbon cores throughout the range of concentrations necessary to observe intermicelle EET.'OJI Previous workers have investigated the solubilization of ODRB in vesicles12 and triton X-100 micelles.2J3 The lipophylic nature of the ODRB probe, due to its long hydrocarbon tail, allows for essentially all ODRB molecules to be solubilized in the micelles. There is agreement that the polar chromophoric head of the ODRB molecule resides near the interface between the micelle surface and the surrounding water. This is a common finding for the case of aromatic type molecules solubilized in aqueous sur- factant so l~ t ions . '~J~ For this reason, the ODRB/triton X- 100/water system was chosen as a practical starting point to study intercluster excitation dynamics.
There are experimental situations where an understanding of intercluster excited-state transfer can prove useful. For example, twmmponent polymer blends will undergo phase separation when exposed to certain conditions. At the initial stages of this process, only two or three chains will aggregate to form a microphase separated domain. It has been previously shown that by tagging the chains in the microdomain with fluorescent probe molecules, interchain excitation transfer causes the overall transfer rate to increase.I6 Knowledge of the interchain transfer dynamics should make it possible to extract quantitative information concerning the nature of microphase separated domains and the initial stages of phase separation in two component polymer blends. Other possible applications include the study of probe molecules em- bedded in the pores of zeolite clays or biomolecular structures. The power in this technique lies in its ability to incorporate complicated spatial distribution functions into the analysis of measurements, enabling the determination of long-range mor- phology.
Although systems of interacting clusters are more complicated than their low-concentration counterparts, their behavior may be understood as a superposition of processes which include both the
0 1992 American Chemical Society
Concentrated Micelle Solutions The Journal of Physical Chemistry, Vol. 96, No. 22, 1992 0931
CH, -jLzCm (ocH,cH,),,oH
CH, CH,
Octadecylrhodamine B Triton X-100 Figure 1. Space-filling models and Lewis structures of the octadecyl- rhodamine B and triton X- IO0 molecules. The space-filling models show the most stable (all trans) conformations of both molecules. The charged head group of the ODRB molecule, which coordinates with a C1- coun- terion near the micelle/water interface, is perpendicular to at least part of the solubilized hydrophobic tail.
internal dynamics of a single cluster and the external dynamics between cluster pairs. Thus, the survival probability of an excited chromophore will depend on the relative efficiency between competing high-frequency transfer processes (those which occur among chromophores in the same cluster) and lower frequency events (intercluster transfer) which increase in frequency and amplitude as the average cluster separation decreases. We adopt a formalism which makes use of a truncated cumulant approxi- mation to the Green’s function solution of the Pauli master equation.17J8 The time-dependent motion of an excitation within an ensemble of interacting chromophores can be characterized by the function Gs(t).19*20 Gs(t) is the diagonal portion of the Green’s fun~ti0n.l~ It represents the probability that the initially excited chromophore is still excited at some later time. Gs(t) includes transfer events in which the excitation leaves the initial site and later returns. It does not include the excited-state lifetime.
The usefulness of @ ( t ) lies in its relationship to the observables obtained from fluorescence depolarization experiments. A po- larized excitation of an ensemble of randomly oriented chromo- phores results in a photoselective excited state. Only chromophores with the appropriate transition dipole vectors can be initially excited. Transfer of the excitation to surrounding molecules, which are randomly oriented, and subsequent emission by the excited molecule leads to depolarization of the observed fluorescence. This results in fluorescence anisotropies dominated by GS( t ) provided other depolarization processes (such as chromophore rotation) occur on a slower time scale. For the experiments presented here, we obtain high-resolution excited-state decay profiles polarized in both the parallel and perpendicular directions to the excitation polarization. These decays are converted to fluorescence an- isotropies which are related to GS(t) of the micelle systems.
This paper is organized in the following manner: In section 11, we briefly discuss the application of the two-particle cumulant approximation to calculate the observables obtained from ODRB/triton X-lOO/water systems. A more thorough and general treatment of this problem has been reported previously.IO Section I11 describes the experimental instrumentation and the preparative techniques employed. Section IV is a discussion of the results.
11. Theory and Calculation of Observables In this section, we present a model for energy transport among
identical chromophores distributed on the surfaces of interacting micelles in solution. The model is based on a truncated cumulant expansion as an approximation to the transport master equation.
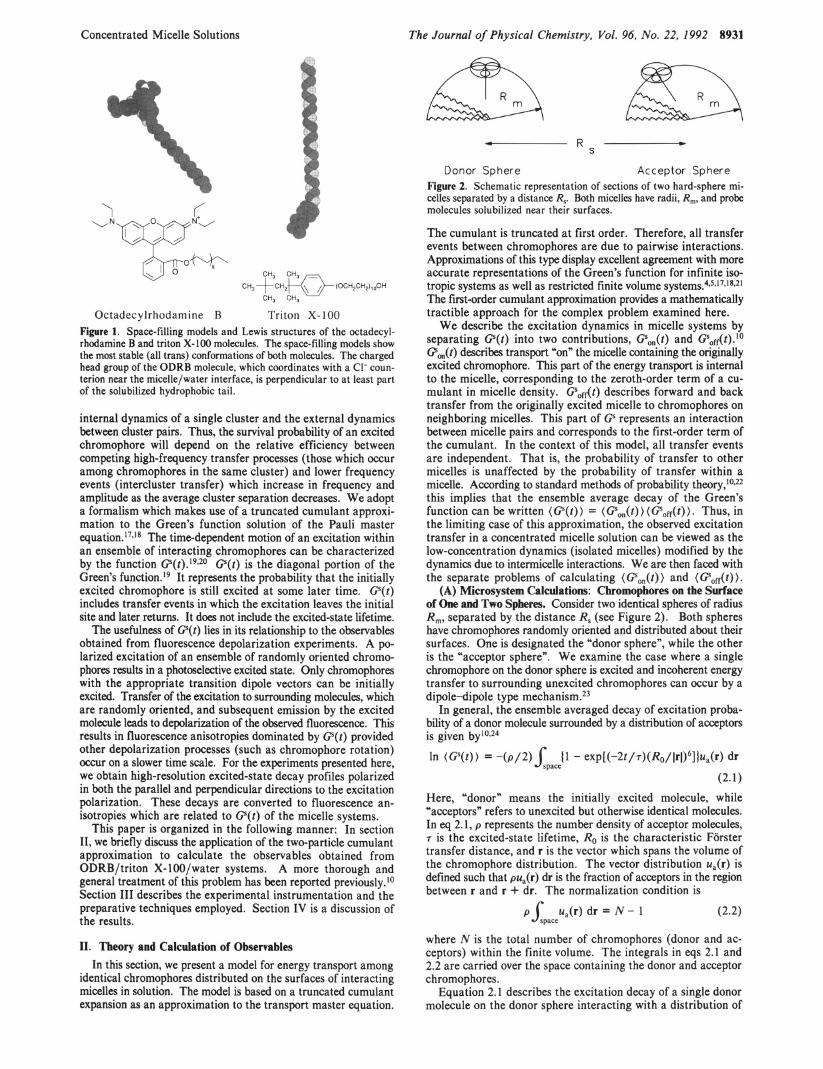
Donor Sphere Acceptor Sphere Figure 2. Schematic representation of sections of two hard-sphere mi- celles separated by a distance R,. Both micelles have radii, R,, and probe molecules solubilized near their surfaces.
The cumulant is truncated at first order. Therefore, all transfer events between chromophores are due to pairwise interactions. Approximations of this type display excellent agreement with more accurate representations of the Green’s function for infinite iso- tropic systems as well as restricted finite volume The first-order cumulant approximation provides a mathematically tractible approach for the complex problem examined here.
We describe the excitation dynamics in micelle systems by separating Gs(t) into two contributions, Gson(t) and Gsoff(t).lo @&) describes transport “on” the micelle containing the originally excited chromophore. This part of the energy transport is internal to the micelle, corresponding to the zeroth-order term of a cu- mulant in micelle density. Gsoff(t) describes forward and back transfer from the originally excited micelle to chromophores on neighboring micelles. This part of Gs represents an interaction between micelle pairs and corresponds to the first-order term of the cumulant. In the context of this model, all transfer events are independent. That is, the probability of transfer to other micelles is unaffected by the probability of transfer within a micelle. According to standard methods of probability theory,10T22 this implies that the ensemble average decay of the Green’s function can be written (GS(t ) ) = (Gson(t))(Gsoff(t)). Thus, in the limiting case of this approximation, the observed excitation transfer in a concentrated micelle solution can be viewed as the low-concentration dynamics (isolated micelles) modified by the dynamics due to intermicelle interactions. We are then faced with the separate problems of calculating ( Gson(t)) and ( Gsoff(t)).
(A) Microsystem Calculations: Chromophores on the Surface of One and Two Spheres. Consider two identical spheres of radius R,, separated by the distance R, (see Figure 2). Both spheres have chromophores randomly oriented and distributed about their surfaces. One is designated the “donor sphere”, while the other is the “acceptor sphere”. We examine the case where a single chromophore on the donor sphere is excited and incoherent energy transfer to surrounding unexcited chromophores can occur by a dipole-dipole type mechanism.23
In general, the ensemble averaged decay of excitation proba- bility of a donor molecule surrounded by a distribution of acceptors is given by10924
ln ( ~ ’ ( 1 ) ) = +/2) j’ space (1 - dr
(2.1) Here, “donor” means the initially excited molecule, while “acceptors” refers to unexcited but otherwise identical molecules. In eq 2.1, p represents the number density of acceptor molecules, 7 is the excited-state lifetime, Ro is the characteristic Forster transfer distance, and r is the vector which spans the volume of the chromophore distribution. The vector distribution u,(r) is defined such that pua(r) dr is the fraction of acceptors in the region between r and r + dr. The normalization condition is
p Jpac:a(r) dr = N - 1 (2.2)
where N is the total number of chromophores (donor and ac- ceptors) within the finite volume. The integrals in eqs 2.1 and 2.2 are carried over the space containing the donor and acceptor chromophores.
Equation 2.1 describes the excitation decay of a single donor molecule on the donor sphere interacting with a distribution of

8932 The Journal of Physical Chemistry, Vol. 96, No. 22, 1992
chromophores on the acceptor sphere. Since the distribution of acceptor chromophores depend on the location of the original donor position, eq 2.1 must be averaged over the space of the donor sphere:
Marcus et al.
Thus far, we have derived (GS(r ) ) for two specific cases: (Gso,,(t)) (eq 2.6) describes excitation transfer among N chro- mophores on a single isolated micelle, while (Gson(r)) (eqs 2.5) describes excitation transfer between a donor chromophore on a "donor micelle" and N - 1 acceptor chromophores on an uacceptor micelle", separated by the distance R,. (@,At)) contains the details of the chromophore distributions, and it represents the configurational average of the transport dynamics due to the painvise interaction between two micelles. These two descriptions of the micelle transport dynamics, which separately contain in- ternal and painvise interactions, are sufficient to model the micelle concentration dependence of Gs. (B) cflculetioas for Micelles in solutioa. To relate eqs 2.5 and
2.6 to experimental observables, we must consider the effect of molecular interactions on an ensemble of micelles in solution. There are two important classes of interaction potentials in this problem: probeprobe interactions and micellemicelle interac- tions. Interactions between probe molecules can influence the number distribution of chromophores per micelle, while forces between micelles can introduce a nonconstant radial distribution function. For our purposes, we assume the micelles are nonin- teracting so that their location in solution is random at all con- centrations.
Since micelles are dynamic structures which constantly gain or lose constituents to the surrounding medium, the number of probe molecules in a given micelle will fluctuate in time. The mechanism of solubilizate migration may involve collisions between micelles or exchange via the aqueous phase. Both these mecha- nisms produce a Poisson distribution of probe molecules provided that migration events are not influenced by the number of p r o h present.25 This is a very good assumption if interchromophore interactions are small. Then, in a system containing micelles with noninteracting chromophores, the correct excitation transport observables will include a Poisson average over chromophore number:
(&/lradl)61ba(ra) dra) (2-3b)
In eqs 2.3 the volumes Va and vd are those occupied by the donor and acceptor distributions. The vector rad joins the positions of the acceptors and donor molecules.
To perform the integrals in eqs 2.3, we adopt a multiframe coordinate system. The space containing the donor and acceptor distributions are spanned by the vectors rI and r2, respectively. The donor-acceptor separations are then given by a coordinate transformationIO that depends on the distance between the sphere centers. Thus, r2 = MI2, where f I2 spans the space containing the acceptor molecules in a newly defined coordinate system. The donor and acceptor distribution functions are modeled as radially dependent delta functions:
ud(rl) = Wl - R,) =
u,(rz) = 6(r2 - R,,J =
In eqs 2.4, the "volumes" of the distributions are the surface areas of the spheres. Substitution of eqs 2.4 into eqs 2.3 and further simplification by symmetry arguments results in
(@(t,R,)) = (GSofl(t,R,)) = I/,$sin 4 de1 exp( [ ( N - 8 ,
1 ) / 4 1 1 (exp[(-2t/T)(~o/r'~2(e'l2,el))61- 11 sin 02 d ~ , ) 82
(2.5a)
+ arcsin (roI2 sin 8'12/Rm) - arcsin (R, sin 81/r012) (2.5b)
B2 =
where P12(V12,Bl) = [Rm2 + R: - 2R,R, COS f
[cos2 Vr2(Rm2 + 2R,R, cos 0,) - (R: + 2R,Rs cos 8 , ) I 1 I 2 (2.5d)
Equations 2.5 express the excitation dynamics between two spheres separated by the distance 4. For nonzero finite separations, these integrals must be evaluated numerically. In the limit of vanishingly small &, however, the donor and acceptor distributions superim- pose and the resulting excitation dynamics occur on a single isolated sphere. This limiting case has an analytical solution:
( @ ( t , O ) ) = (G'on(t)) = ([(n - 1 ) / 2 1 [ ~ ~ / ~ d 2 / 3 , ~ ) - P ~ / W / ~ ) + exp(-P.) - 111
(2.6) where P = 2@f/T, Q = &/2R,,,, and I'(2/3) = 1.254 1 17 94. r(a) and r(a,x) are the complete and incomplete Euler gamma functions, respectively, defined by
r(a) = L m e - I t p 1 dt ?(a,%) = xxe- l tu- l dr
where Y is the average number of chromophores per micelle. The Poisson average is characteristic of systems which follow purely random occupation statistics. As chromophore interactions become more important, however, the occupation statistics will deviate from random behavior and this will be reflected in a perturbed Poisson distribution.
We treat the micelles as hard spheres and assume that the micelle pair correlation function is constant with respect to radial distance. The thermodynamic limit of (G"ofl(t)) can then be achieved by averaging over the micelle pair separation, 4, in the limit of infinite micelle number and infinite volume. The ratio of micelles to volume is restricted to equal the solution concen- tration.26 It is then straightforward to obtain a micelle concen- tration dependent expression for ( G d t ) ) which includes the effect of the volume excluded by the micelles:10~2'
In eq 2.8, d, = 2R, is the micelle diameter, c is the micelle concentration expressed as a volume fraction, Y is the average number of chromophores per micelle, and ( GSofl(f,Y,RI)) is the Poisson averaged value of eqs 2.5 after substitution into eq 2.7.
Equation 2.8 describes the decay of excitation probability in a concentrated micelle solution due solely to intermicelle transfer events. The intramicelle transfer, which is present at all con- centrations, contributes to the overall decay according to (C?(t,u,c)) = (Cson(r,v)) (GSorr(t,u,c)). According to eq 2.8, ( G s o ~ ( f , v , c ) ) approaches unity as the micelle concentration approaches zero. This allows the overall decay of G" to approach ( GSon(t,u) ) with decreasing concentration as expected.
The function G" represents the probability decay of a polarized excitation due to energy transfer. Its relationship to the

Concentrated Micelle Solutions The Journal of Physical Chemistry, Vol. 96, No. 22, 1992 8933
TABLE I: Series I InbrmiceUe EET Solutions" vol % [mI/M b l / M cmc [ODRB] /M Y width/rm OD 0.26 2.02 x 10⁻⁵ 3.21 x 10⁻³ 10.7 1.92 X lo4 9.50 100 0.3 0.26 2.02 x 10⁻⁵ 3.21 x 10⁻³ 10.7 9.60 x 10⁻⁵ 4.75 200 0.3 0.26 2.02 x 10⁻⁵ 3.21 X lo-' 10.7 4.80 x 10⁻⁵ 2.38 500 0.3 0.26 2.02 x 10⁻⁵ 3.21 x 10⁻³ 10.7 2.40 x 10⁻⁵ 1.19 lo00 0.26 0.26 2.02 x 10⁻⁵ 3.21 x 10⁻³ 10.7 1.20 x 10" 0.06 loo00 0.13
"The micelle concentration is held constant while the occupation number is varied. Vol % is the micelle volume percent, [m], [SI, and [ODRB] are the micelle, triton X-100, and octadecylrhodamine B contrations in units of moles/liter, respectively. Cmc is the critical micelle concentration, v is the occupation number, width is the sample thickness, and OD is the measured optical density at the absorption maximum (Amx = 562 nm).
TABLE 11: Series I1 Intermicelle EET Solutions" vol % [mI/M bI/M cmc [ODRB]/M V width/pm OD 19.93 1.56 X lo-' 0.225 750 7.73 x 10⁻³ 4.96 <2.5 0.28 14.24 1.11 x 10⁻³ 0.161 536 5.52 x 10⁻³ 4.96 <2.5 0.25 9.95 7.79 x 10⁻⁴ 0.112 375 3.86 X 4.96 5 0.23 4.98 3.89 X lo4 0.0564 188 1.93 x 10⁻³ 4.96 10 0.26 2.49 1.95 x 10⁻⁴ 0.0283 94 9.66 X lo4 4.96 25 0.25 1.24 9.74 x 10⁻⁵ 0.0143 48 4.83 X lo4 4.96 50 0.24
'The occupation number is held constant while the micelle concentration is varied. Symbols are defined as in Table I.
fluorescence anisotropy, which contains all sources of depolari- zation, can be written as
r(t,v,C) = (@(t)(Gs(t ,v ,c)) ) (2.9) Here @ ( r ) contains processes besides energy transport which contribute to the depolarization. The most important of these is molecular reorientation which, in the experiments discussed below, occurs on a much slower time scale than the energy transport we observe. The outside brackets in eq 2.9 indicate a configurational average that includes correlations between @(t ) and the energy transport. For the slow chromophore rotation that occurs in the experimental systems studied here, the difference in time scales suggests the correlations can be taken as insignificant and that excitation transfer is independent of the molecular ro- tation. Thus, eq 2.9 can be rewritten as
(2.10)
where T , ~ ~ is the rotational correlation time.
111. Experimental Metbods (A) Sample Reparation. Octadecylrhodamine B (ODRB) was
purchased from Molecular Probes, inc. The purity of this com- pound was checked by elution with a 50% diethyl ether/methylene chloride solution across a thin layer of silica gel (TLC). Triton X- 100 (octylphenoxypolyethoxyethanol) was purchased from Aldrich Chemical. Both reagents were used without further purification. Micelle samples were prepared by quantitatively measuring the concentrations of ODRB in aqueous triton X-100 solutions. All weights were measured using a Gram-Attic balance (Fisher Scientific Co.) accurate to within f0.0001 g. Volumes were measured with calibrated volumetric flasks and pipettes. The micelle concentrations were determined from the formula
(3.1) where [m] is the micelle concentration, [SI is the triton X-100 concentration, cmc is the critical micelle concentration of triton X-100 in water (3.0 X M), and 144 is the average number of triton X-100 molecules per micelle."
Two series of solutions were prepared and are presented in Tables I and 11, respectively. In series I, all samples contained an identically low concentration of micelles ([m] = 0.26%. roughly 1 1 times the cmc), but the number of ODRB molecules per micelle was varied (1.25 I v I 10). In series 11, the ratio of ODRB molecules to micelles was held constant (v = 9, while the micelle concentration was varied (1.25% I [m] I 20%). In both series, the samples were made as consecutive dilutions of a Yconcentratedn sample. In the case of series I, a stock solution of 3.21 X M aqueous triton X-100, corresponding to a micelle concentration of 2.02 X M, was prepared. An aliquot of a stock solution of ODRB in methylene chloride was transferred to a volumetric
[m] = ([SI - cmc)/144
flask. The solvent was evaporated in a stream of nitrogen, leaving the ODRB as a thin layer on the bottom of the flask. The stock triton X-100 solution was then added, the solubilization process aided by sonication. This final solution had an ODRB to micelle ratio of v = 9.5. Subsequent dilutions were made by consecutively dividing the ODRB concentration in half. This was done by transferring 5-mL aliquots to 10-mL volumetric flasks and filling to the mark with the stock triton X-100 solution ([m] = 0.26%). A similar procedure was performed for series I1 with the following important differences. The initial concentrated solution was prepared such that [m] = 19.94% and Y = 4.96. A stock solution of triton X-100 prepared at the critical micelle concentration was used to make the dilutions. In this way, the ratio of ODRB molecules to micelles was preserved while consecutive dilutions had lower micelle concentrations.
Techniques. All solutions were placed in fused silica cells of sufficiently narrow width (see Tables I and 11) to ensure an optical density below 0.3 at the peak absorption wavelength (- 562 nm). For the highest concentration samples of series 11, the solutions were pressed between optical flats without spacers to achieve pathlengths less than 5 pm.
Absorption spectra of all samples were measured using a Hewlett-Packard 8452A diode array spectrophotometer. Fluorescence decays were measured using time-correlated single photon counting. The apparatus and technique are described in detail elsewhere.*.27 The excitation pulses were provided by the cavity dumped output of a synchronously pumped dye laser tuned to 570 nm. The pulse repetition rate was 823 kHz, the pulse duration was -10 ps, and typical pulse energies were - 10 nJ. The excitation intensity was attenuated so that one fluorescent photon was detected for every 80 incident excitation pulses. Fluorescent photons were detected from the front face of the samples using a Hamamatsu microchannel plate in combination with a double monochromator tuned to 600 nm. The instrument response functions for this apparatus, although not symmetric, had full widths at half-maxima which varied between 40 and 56 PS.
Time-dependent decays of the polarized components of fluorescence, Z , , ( f ) and Zl(t), were collected in the following manner. A detection polarizer was held fmed while a Pockels cell was used to switch the plane polarization of the excitation beam between horizontal and vertical orientations. Each orientation was sampled for equal amounts of time, alternately changing the polarization direction every 20 s. This procedure minimized the effect of laser instabilities over long periods of time as well as any inherent bias in the detection system.
Data sets were collected for a time duration such that the peak of each decay contained approximately 45 000 counts. The fluorescence anisotropy was then calculated by point by point addition and subtraction of the fluorescence decays:
(B)

8934 The Journal of Physical Chemistry, Vol. 96, No. 22, 1992 Marcus et al.
(3.2)
(C) Data Analyses. Theoretical anisotropies were fit to data by calculating theory curves for parallel and perpendicular decays:
I , , (?) = exP(-t/7F)[1 + 2r(t)l (3.3a)
I*(l) = exP(-t/7F)I1 - 401 (3.3b)
These theoretical decays were numerically convolved with the measured instrument response function corresponding to the particular data set being fit. The convolved fluorescence decays were then recombined according to eq 3.2 and compared to the data.
The choice of time zero was made by matching the rising edge of both the data and the measured instrument response functions. The time corresponding to the peak of the instrument response (typically, three-quarters up the rising edge) was taken as time zero.
IV. Results and Discussion It is evident from eqs 2.5 and 2.6 that the single adjustable
parameter in the cumulant approximation is the ratio Q = A,/ 2R,. The dynamic Fbrster critical transfer distance for ODRB was previously measured spectroscopically to be 5 1.5 The orientationally dependent transfer distance can be obtained by multiplying the dynamic Ro by the factor (=0.9202) which includes geometrical considerations of the chromophore distri- b~ t ion .~ ,~ ' With the value of Ro determined independently, the only remaining adjustable parameter is the dimension of the micelle.
To find the best description for the micelle concentration de- pendence of the energy transport, we begin by fitting the data from the dilute micelle solutions prepared in series I. (A) Isolated Micelle Systems. Equation 2.6 describes the ex-
citation transfer of an isolated micelle with N chromophores randomly distributed on its surface. In light of comparisons to Monte Carlo calculations, however, it was necessary to employ (2/2) Pad6 approximants to correct the asymptotic behavior of the first-order cumulant approximation.I0 In this way, the ac- curacy of eq 2.6 at short times was retained while the long time values were forced to approach the proper GJ(t,N) asymptotic value, 1/N. For the case of N = 2 or 3, the Padt approximant for eq 2.6 is
1+?[-] - -
(4.la) For N L 4, the approximant is
In Gs(t,N) = (4.lb) 1 + - -
(N i ') [ 2r&3) ] where x = ( 2 Q t / ~ ~ ) ] / ~ and Q = Ro/2R,.28 Equations 4.1 were used in combination with eq 2.7 to produce Poisson averaged (Gs(t ,v)) curves used to analyze data for samples with values of Y > 1 listed in Table I.
The samples containing fewer than one chromophore for every 16 micelles ( u = 0.06, no excitation transport) provides data on the rotational reorientation time of the solubilized ODRB mol- ecules by the observed fluorescence anisotropy. The time-de- pendent depolarization data for the 'rotational" sample was therefore fit to a biexponential function. A least-squares fit was obtained with the following parameters: r,,(t) = 0.0363 exp(-t/0.388 ns) + 0.2987 exp(-t/6.999 ns)
a) 0.4 1 0.35 , Poisson Distribution 0.3 0.25
h Y
y 0.2 0.15 0.1 0.05
0 1 2 3 4 Time (ns)
b) 0.4 0.35 0.3 0.25 - = 0.2
L
0.15 0.1 0.05
Skewed Poisson
0- 0 1 2 3 4
Time (ns) Figure 3. (a) Time-dependent fluorescence anisotropy decays and theo- retical fits of series I solutions. Here, no interactions between chromo- phores are included, causing the micelle occupation statistics to follow a Poisson distribution given by eq 2.7. Data and theory are jointly identified by the mean occupation number, Y (see Table I): (a) 9.5; (b) 4.75; (c) 2.38; (d) 1.19; (e) 0.06. (b) Series I data are fit using the skewed poisson distribution eq 4.1 1 in place of eq 2.7. Equation 2.7 depends on an interaction parameter, a, related to the second virial coefficient in the chromophore density. The sign of the optimized value for a (=-0.058) indicates a repulsive interaction between the ODRB molecules.
The total fluorescence decay of this sample was monoexponential with a radiative lifetime of 2.69 ns. The very low amplitude fast component (first term) of eq 4.2 probably reflects a small degree of orientational relaxation in the restricted cage of the surrounding triton X-100 molecules. These results are consistent with previous measurements of ODRB in aqueous triton X- 100 solution^.^^'^ Unlike Visser, however, we attribute both long and short time components of eq 4.2 to rotation of ODRB molecules in the micelles. The rotation of the micelle itself would require a much longer rotational correlation time (-52 ns based on a simple Debye-Stokes-Einstein rotational diffusion model)29 than is possible to observe on the time scale of the fluorescence lifetime.
Theoretical anisotropies were constructed from eq 4.2 and the Poisson-averaged ( Gs(t,v) ) curves according to
r ( t ~ ) = rrot(t)(GYt,P)) (4.3) The micelle radius, R,, was varied to obtain the best overall fit to the fluorescence depolarization data of series I. Figure 3a shows the results of this procedure. Since the higher concentration curves (a and b) show clear disagreement between theory and data, these were not included in the analyses at this point. A best fit for the lowest two concentrations was obtained with R, = 37 f 1 A, in agreement with the results of Ediger, and consistent with light scattering data on triton X-lOO.*
There are two possible explanations for the mismatch between experiment and theory at high ODRB concentrations. The first assumes that our model, based on noninteracting chromophores randomly distributed on the surfaces of spheres, adequately de- scribes the chromophore configuration of the micelle systems prepared in series I. Then, any disagreement must be due to shortcomings of the cumulant approximation in producing ((?"(t)) from the random, spherical shell configurations. This cannot be the case, since the analytic functions (eqs 4.1) were favorably compared to Monte Carlo calculations that solve the transport master equation exactly.I0 The cumulant was shown to represent this model with an accuracy of 4%. Therefore, we focus on a
(4.2) second possibility that has be& discussed in the literat~re.~' Weak,

Concentrated Micelle Solutions
intermolecular interactions perturb the chromophore distribution, leading to nonrandom occupation statistics of the solubilized probe molecules.
The problem of weakly interacting probe molecules solubilized in micelie media is addressed in terms of equilibrium classical statistical mechanics. Racently, Barzykin has applied standard methodsM to treat spherical shell configurations in micelles.” We note, however, that the following argument is generally true for any molecular assembly of weakly interacting probe molecules, and the results do not depend on any particular geometrical constraints. The individual micelles in solution may be taken as subsystems of chromophores at equilibrium. The number of chromophores in a given micelle may fluctuate in time due to rapid inter-micelle exchange. Each subsystem is subject to constant volume (the micelle surface area), temperature and chromophore chemical potential. Thus, the micelle solution constitutes a grand canonical ensemble. The equilibrium distribution of chromophores in each subsystem is generally given by the Boltzmann distribution
(4.4)
where @ = l/kT, (=-PV) is the grand canonical thermodynamic potential, 1 is the chemical potential of the solubilized molecule, and F N is the Helmholtz free energy. The thermodynamic po- tential is expressed in terms of the configurational partition function and the chemical potential by
PN = exp[B(Q + PN - FN)]
The Journal of Physical Chemistry, Vol. 96, No. 22, 1992 8935
(4.5)
while the Helmholtz free energy has the form
(4.6)
Here, 4 = VZ,, exp(&), and Z N and Z,, are the configurational and translational partition functions, respectively. The configu- rational partition function contains the chromophore interaction potential, U(r3N), and depends on the 3N coordinates of the chromophore positions. Its form is easily simplified in terms of a two-body potential by assuming only two chromophores may interact at any given time. Then
Z N = S d r 3 ” exp[-@U(r3N)] = V“(1 + a2)N(N-1)/2 (4.7)
All the information concerning the chromophore distribution is now contained in the parameter
(4.8)
1 exp(-bFN) z ( z t r ) N z N
a2 = ( l / V ) S d r IexP[-bU12(r)l - 11
The meaning of a2 becomes apparent when considering the Taylor expansion of eq 4.5 in powers of (:
(4.9)
Quation 4.9 is analogous to a virial expansion of the chromophores in the micelles, and the coefficients, uN, are virial coefficients. The fmt virial coefficient, ai = 1. The mean occupation number in a given micelle is
Taking only the first two terms of eqs 4.9 and 4.10 allows both the chemical and thermodynamic potentials to be written in terms of v:
-gn = v(1 - av/2) (4.11a)
5 = v(1 - av) (4.1 1 b)
In eqs 4.1 1, a = az. Sulwtitution of eqs 4.6 and 4.1 1 into eq 4.4 allows the Boltzman distribution to be written in terms of the mean occupation number, v, and the second virial coefficient, a:
Equation 4.12 represents the probability that a micelle contains N chromophores as a function of the second virial coefficient. Notice that a may range between -1 and infinity depending on the sign and magnitude of U12(r). However, we assume only weak interactions so that the potential is never very different from zero. Then, if U12(r) > 0, corresponding to a repulsive interaction, a < 0. Alternatively, if U&) < 0, corresponding to an attractive interaction, a > 0. As UI2(r) - 0, a - 0 and the occupation probability (eq 4.12) approaches the Poisson distribution (eq 2.7) as it should.
Figure 3b shows fits of the series I data using eq 4.12 in place of eq 2.7. The micelle radius obtained in the low concentration limit ( n - 0, a - 0) was held fixed while the parameter a was adjusted to obtain the best overall agreement (a = -0.058) for curves a-d. The sign of the optimized a indicates that the probe interactions are repulsive in nature. This is not surprising since the head groups of the ODRB molecules are positively charged. As the number of solubilized ODRB molecules grows, so does the micelle surface charge; thus requiring a larger expenditure of work for any additional probe to overcome the Coulombic barrier. The repulsive interactions also tend to destabilize those ODRB mol- ecules that are already in micelles. The Coulombic potential detracts from the stabilizing hydrophobic interaction of the oc- tadecyl substituents with the micelle interior. The net effect is to skew the population distribution of chromophores toward smaller numbers than would be expected in the case of no in- teractions. Comparison of Figures 3a and b shows that the correction is much more important for the higher concentration samples than for the lower ones. Inclusion of the ODRB repulsive interaction substantially improves the agreement between theory and experiment.
While the skewed occupation distribution discussed above is reasonable and accounts for the data quantitatively, there may be other factors which contribute to the behavior of samples a and b. It has been s~ggested’~,’~ that probeinduced perturbations of the micelle structure indirectly effects the probe spatial dis- tribution by creating ‘preferential solubilization sites” that are nearby the perturbing chromophore. Clustered distributions such as these, however, would result in faster fluorescence anisotropy decays than our theory predicts, contrary to our observations. Offen and co-workers have shown that some ionic surfactant micelles increase in size as the concentration of pyrene, an aromatic probe molecule absorbed onto the micelle surface, is increa~ed.’~ A larger micelle radius would have the effect of slowing the anisotropy decay, which qualitatively agrees with our measure- ments. However, it seems unlikely that a concentration dependent increase in the micelle radius would, by coincidence, be properly modeled by skewing the occupation number distribution. The excellent agreement between data and theory shown in Figure 3b supports the thermodynamic argument that leads to the skewed occupation number distribution. (B) Concentrated Micelle Systems. Having characterized the
behavior of intramicelle EET in dilute micelle solutions, we are now prepared to examine the intermicelle EET of the concentrated solutions (see Table 11). The micelle radius (R, = 37 A) was determined by the measurements in the low micelle concentration limit. All the other parameters are known. Therefore, we can compare the intermicelle EET to the calculations without recourse to adjustable parameters.
Poisson averaged ( Gsoff(t,v,c) ) curves corresponding to the concentrations reported in Table I1 were constructed from eqs 2.8 and 2.7. These in turn were used to make theoretical an- isotropies according to
r(t,v,c) = ro,(t,v)(@ofdt,v,c)) (4.13)
Here, r0&) represents the observed anisotropy decay of the dilute micelle solution (eq 4.3). It contains the intramicelle EET as well as contributions to the anisotropy due to chromophore rotation. Since, in this section, we are only interested in intermicelle EET,

8936 The Journal of Physical Chemistry, Vol. 96, No. 22, 1992 Marcus et al.
0.35
0.3 Inter - mice l le EET
0.25 I 0.2 1
0 1 2 3 4 Time (ns)
Figure 4. Time-dependent anisotropy decays and theoretical fits of series I1 solutions (see Table 11). The lowest micelle concentration (vol % = 0.156) decays the least and represents intramicellar energy transfer. Subsequently decreasing decays contain contributions from intermicellar energy transfer for micelle concentrations 2.49%, 4.98% 9.95% 14.24% and 19.93%.
the anisotropy of the most dilute solution (vol % = 0.156) was fit to a stretched exponential function
ron(t,4.96) = 0.221 exp[-(t/2.098 ns)o.389] (4.14)
This empirical formula reproduces the data almost perfectly. The actual data could be used, but this would introduce noise into the theoretical calculations.
Figure 4 shows anisotropy decays and calculations for the high micelle concentration, series 11, samples. The intramicelle decay (c = 0.156%) is the slowest. The calculated line through this data is eq 4.14. The curves that lie below represent intermicelle EET for concentrations, c = 2.5, 5 , 10, 15, and 20%. As the micelle concentration is increased, the rate of EET also increases. This shows that at these high micelle concentrations, intermicelle EET is effectively competing with intramicelle EET. The theoretical calculations with no adjustable parameters are in semiquantitative agreement with the data. The theory correctly predicts the concentration for the onset of significant intermicelle EET and reproduces the essential features of the concentration dependence. However, the short time behavior of the data is reproduced poorly by the calculations.
While the theory does a reasonable job of reproducing the data, there are a number of possible causes for the disagreement. For the theory to reproduce the data accurately, at least two conditions must be met:
(i) The chromophore configurations are well described as random distributions of probes on the surfaces of spherical micelles which are randomly located in solution.
(ii) Given a suitable distribution of codigurations, the cumulant expansion, truncated at first-order accurately produces ( @ ( t ) ) .
The lack of agreement between theory and experiment may imply that other chromophore distributions are more appropriate for the interacting micelle systems. For example, a negative micelle-micelle interaction potential could have the effect of creating micelle pairs (nonrandom distribution of micelles shifted toward short distances). Such a situation would lead to faster depolarization decays than the random model predicts. The effect of pairing would be most pronounced at low concentrations where shifting the distances between micelles toward closer spacing would be a significant change from the distances that would be present for a random distribution. At higher concentrations, the effect would be masked somewhat by the small intermicelle spacings that would be encountered even for a random distribution. At all concentrations, the short time behavior (corresponding to fast, short distance transfer events) would be most significantly effected. This scenario is consistent with the observations and may be responsible for the differences between the experiments and theory. However, the lack of agreement may also be caused by inade- quacies of the calculations.
There are two stages in the formulation of ( Gs((t)) where the cumulant might fail. The first involves calculation of (@o,&&))
(eqs 2.5) for a pair of micelles separated by the distance &. The cumulant employs a two-particle approximation which may not work well for this problem. It has been shown, however, that the cumulant consistently predicts short time behavior well.Io Therefore, any inaccuracy of the asymptotic behavior of eqs 2.5 cannot completely account for the theory's disagreement with the data at short time.
The second and perhaps most important approximation in our treatment is the statement (@(t ,v ,c ) ) = (GS,(t,v)) (QOf&,v,c)). This follows naturally from the fmt-order cumulant approximation because all transfer events are mutually independent. Within the context of the first-order cumulant treatment, this separation is mathematically rigorous. That is, there is no correlation between @,,,, and Go, While this may be mathematically rigorous within the cumulant approximation, it is not clear that it is physically valid. The separation assumes that the fast intramicelle EET does not influence the transfer rates of the slower intermicelle EET. The separation is more accurate at higher concentrations, since the fast and slow transfer events approach similar time scales. For lower micelle concentrations (corresponding to larger separations), correlations between intra- and intermicelle transfer events may become significant.
The physical meaning of the correlation can be understood by considering a micelle solution with a concentration in the dilute regime (c * 2.5%). A micelle containing the initially excited chromophore may have as few as one neighboring micelle close enough to transfer the excitation to. Since the distance between the micelles is large, initially the excitation migrates to other probes on the same micelle. The initial excitation becomes delocalized. This tendency toward delocalization effectively enhances the in- termicelle transfer because chromophores that are closest to a neighboring micelle can quickly become populated through in- tramicelle transfer. The net effect may be to increase the overall transfer rate relative to that predicted by the cumulant approx- imation.
In section 4A, information concerning the probe morphology in isolated micelle systems was extracted from the time-resolved depolarization data. This was possible because the results of the cumulant were checked against Monte Carlo calculations. The asymptotic behavior of the cumulant result was then corrected with a Pad6 approximant. Presently, Monte Carlo calculations are being prepared to simulate the interacting micelle systems discussed above.34 The results of these simulations will determine if the differences between theory and calculation arise from the nature of the physical system or from an inability of the first-order cumulant treatment to properly model the excitation transfer.
V. Concluding Remarks The experiments presented above are the first detailed exam-
ination of excitation transport in a controlled system of finite clusters of chromophores. The system of octadecylrhodamine B probe molecules in triton X-100 micelles was chosen to study the complicated excitation dynamics due to donor-donor energy transport among many interacting finite volumes. Attention was given to noninteracting, dilute micelle solutions (isolated finite volumes) in addition to interacting, concentrated solutions. The experiments were directly compared to a theoryI0 which makes use of the truncated cumulant It has previously been demonstrated that a detailed understanding of excitation transport in isolated finite volume systems can provide a structural probe. Excitation transport experiments on chromophore tagged polymer chains isolated in untagged polymer hosts have provided information on polymer chain structure with angstrom resolution. Examination of chain-to-chain transfer will provide information on microphase separation and the microscopic dynamics of spi- nodal decomposition. The micelle solutions studied here provide a prototype system.
For the isolated micelle case, the PadE-corrected cumulant predicts the depolarization decays well. Comparison between theory and data at higher chromophore concentrations establishes the repulsive nature of the intermolecular potential between probe molecules. This leads to a skewing of the chormophore occupation

J. Phys. Chem. 1992, 96, 8937-8941 8937
distribution towards fewer probes per micelle. The interaction parameter, a, is qual to the second virial ooeficient which depends on the two-body potential. While the interaction is essentially coulombic, the value obtained for a (-0.058) can contain infor- mation concerning the role and proximity of counterions in ionic surfactant solutions.
For the interacting micelle case, the cumulant predicts the general behavior of the anisotropy decays but fails to achieve quantitative agreement. Although the specific source of the disagreement is presently unclear, we have suggested a nonrandom micelle spatial distribution or inadequacies in the truncated cu- mulant treatment of the micelle system as consistent with the observations. Monte Carlo calculations are currently in prepa- ration to investigate the validity of the first-order cumulant ap- proximation applied to these systems.34
Acknowledgment. We would like to thank Professor Hans C. Andersen for helpful discussions. This work was supported by the Department of Energy, Office of Basic Energy Sciences (DE-FG03-84ER13251). We would also like to thank the Stanford Center for Materials Research Polymer Thrust Program for additional support and acknowledge an NSF departmental instrumentation grant (No. CHE 88-21737) which provided computer equipment used in the calculations.
Registry No. Octadecylrhodamine B, 65603-19-2; triton X- 100, 9002-93-1.
References and Notes (1) There are several advantages to donor-donor experiments as opposed
to donor-trap. These typically include fewer adjustable parameters and a lower sensitivity of the observable to low energy traps such as eximers or fluorescent impurities.
(2) Ediger, M. D.; Fayer, M. D. J . Chem. Phys. 1983, 78, 2518. (3) Ediger, M. D.; Domingue, R. P.; Fayer, M. D. J. Chem. Phys. 1984,
80. 1246. (4) Fredrickson, G. H.; Andersen, H. C.; Frank, C. W. J . Polym. Sci.
1985, 23, 591.
( 5 ) Peterson, K. A.; Stein, A. D.; Fayer, M. D. Macromolecules 1990,23,
(6) Yamazaki, I.; Tamai, N.; Yamazaki, T. J . Phys. Chem. 1990,94, 516. (7) Stein, A. D.; Peterson, K. A.; Fayer, M. D. Chem. Phys. Lett. 1989,
(8) Stein, A. D.; Peterson, K. A.; Fayer, M. D. J . Chem. Phys. 1990, 92,
(9) Stein, A. D.; Fayer, M. D. Chem. Phys. f a t . 1991, 176, 159. (10) Marcus, A. H.; Fayer, M. D. J . Chem. Phys. 1991, 94, 5622. (1 1 ) Ekwall, P.; Mandell, L.; Fontell, K. Molecular Crystals and Liquid
(12) Johansson, L. B.-A.; Niemi, A. J . Phys. Chem. 1987, 91, 3020. (13) Visser, A. J. W. G.; Vos, K.; Hoek, A. V.; Santema, J. S. J . Phys.
(14) Grieser, F.; Drummond, C. J. J . Phys. Chem. 1988, 92. 5580. ( 1 5 ) Offen, H. W.; Dawson, D. R.; Nicoli, D. F. J . Colloid Interface Sci.
(16) Peterson, K. A.; Zimmt, M. B.; Linse, S.; Domingue, R. P.; Fayer,
(17) Huber, D. L. Phys. Rev. B 1979, 20, 2307. (18) Huber, D. L. Phys. Rev. B 1979, 20, 5333. (19) Gochanour, C. R.; Andersen, H. C.; Fayer, M. D. J . Chem. Phys.
(20) Haan, S. W.; Zwanzig, R. J . Chem. Phys. 1978, 68, 1879. (21) Blumen, A. J . Chem. Phys. 1980, 72, 2632. (22) Hoel, P. G.; Port, S. C.; Stone, C. J. Introduction to Probability
(23) FBrster, Th. Ann. Phys. 1948, 2, 5 5 . (24) Baumann, J.; Fayer, M. D. J . Chem. Phys. 1986,85,4087. (25) Tachiya, M. Kinetics of Nonhomogeneous Processes; Freeman, G.
(26) Inokuti, M.; Hirayama, F. J . Chem. Phys. 1965, 43, 1978. (27) OConnor, D. V.; Phillips, D. Time-correlated single photon counting,
(28) Note: eq 4.la is mistakenly omitted in ref 10. (29) Moog, R. S.; Ediger, M. D.; Boxer, S. G.; Fayer, M. D. J . Phys.
(30) Landau, L. D.; Lifshits, E. M. Statistical Physics; Pergamon Press:
(31) Barzykin, A. V. Chem. Phys. 1992, 161, 63. (32) Berberan-Santos, M. N.; Prieto, M. J. E . J . Am. Chem. SOC. 1987,
(33) Kaschke, M.; Kittelmann, 0.; Vogler, K.; Graness, A. J . Phys. Chem.
(34) Marcus, A. H.; Diachun, N. A.; Fayer, M. D., work in progress.
1 1 1 .
161, 16.
5622.
Crystals; Gordon and Breach Science Publishers: London, 1969.
Chem. 1988, 92, 759.
1981, 80, 118.
M. D. Macromolecules 1987, 20, 168.
1979, 70, 4254.
Theory; Houghton-Mifflin: Boston, 1971,
R., Ed.; Wiley: New York, 1987.
Academic Press: London, 1984.
Chem. 1982,86,4694.
Oxford, 1986.
83, 1391.
1988, 92, 5998.
Reaction of the Hydrated Electron with Water
Harold A. Schwarz Brookhaven National Laboratory, Upton, New York 1 1 973 (Received: May 28, 1992; In Final Form: July 18, 1992)
The reaction of e-(a ) with water was studied as a function of temperature in hydrogen-saturated water and in deaerated formate solutions. "he two systems gave similar results. The rate constant at 25 O C is 1040 s-I, and the activation energy is 7.5 f 0.2 kcal/mol. This activation energy and a recent determination of the activation energy for the reverse process give AHozSs = -1.4 f 0.2 kcal/mol for the reaction e-(aq). + H20vq, + H' + OH-, to be compared with an earlier value of -1.1 kcal/mol derived from the equilibrium of e-(aq) with NH4 . The earlier value is believed to be less susceptible to errors.
Introduction Studies of the eq~ilibrial-~
e-(,,) + H20(1iq) * H*(aq) + OH-(,,) (1)
e-(aq) + NH4+(aq) H*(aq) + NH,(aq) (2) and4
are the only routes available a t present to determine the ther- modynamic properties of the hydrated electron from the better- known properties of the hydrogen atom. The equilibrium with ammonium ion is sufficiently fast that it can be used to observe the equilibrium level of e-(a ) directly with minimal interference from decay reactions. A s t d y of this equilibrium, when combined with the thermodynamics of NH3 protonation, gave a value for
0022-3654/92/2096-8937%03.00/0
M ( 1 ) of -1.1 f 0.2 kcal/mol.4 The equilibrium constant of reaction 1 cannot be measured
directly, as the reaction is too slow, but the forward and reverse rate constants can be measured. The most recent values of the rate constant at 25 O C and activation energy for the reverse of reaction 1 are 2.51 X lo7 M-l s-' and 9.17 f 0.1 kcal/m~l. '~ The rate of disappearance of e-(q). in slightly basic hydrogen-saturated waterS is largely due to reaction 1, and the activation energy was found to be 4.5 f 1 kcal/moL6 These two activation energies combine to give A W ( 1) = -4.7 kcal/mol. Clearly, the two values of the enthalpy of reaction 1 disagree far beyond experimental error, and the most likely source of the error is in the activation energy of the forward reaction, as this is the most difficult to measure.
0 1992 American Chemical Society