electronic energy transfer processes and charge carrier...
TRANSCRIPT
Electronic energy transfer processesand charge carrier transport in
π-conjugated polymers
Dissertation
zur Erlangung des Grades”Doktor der Naturwissenschaften”
am Fachbereich Chemie, Pharmazie und Geowissenschaftender Johannes-Gutenberg-Universitat Mainz
vorgelegt von
Frederic Laquai
geboren in Wilhelmshaven
Mainz, im Jahr 2006

Non exiguum temporis habemus, sed multum perdidimus.(Lucius Annaeus Seneca)


Contents
1 Introduction 11.1 Organic electronics . . . . . . . . . . . . . . . . . . . . . . . . . . . . . 11.2 Motivation and Outline . . . . . . . . . . . . . . . . . . . . . . . . . . . 3
2 Theoretical Basics 52.1 Light absorption and emission . . . . . . . . . . . . . . . . . . . . . . . 52.2 Electronic transitions in organic molecules . . . . . . . . . . . . . . . . 9
2.2.1 Transition dipole moment . . . . . . . . . . . . . . . . . . . . . 92.2.2 The selection rules . . . . . . . . . . . . . . . . . . . . . . . . . 102.2.3 Electronic transitions - Configuration-Coordinate Diagram . . . 12
2.3 Energy transfer processes . . . . . . . . . . . . . . . . . . . . . . . . . . 152.4 From small molecules to conjugated polymers . . . . . . . . . . . . . . 18
2.4.1 Aggregates, excimers and exciplexes . . . . . . . . . . . . . . . . 182.4.2 Band-model versus exciton model . . . . . . . . . . . . . . . . . 192.4.3 Exciton models . . . . . . . . . . . . . . . . . . . . . . . . . . . 23
2.5 The fate of excited states . . . . . . . . . . . . . . . . . . . . . . . . . . 262.5.1 Exciton migration and relaxation . . . . . . . . . . . . . . . . . 262.5.2 Exciton decay . . . . . . . . . . . . . . . . . . . . . . . . . . . . 28
2.5.2.1 Singlet exciton decay . . . . . . . . . . . . . . . . . . . 282.5.2.2 Triplet exciton decay . . . . . . . . . . . . . . . . . . . 30
3 Photophysical properties of blue light emitting polyspirobifluorenehomo- and copolymers 353.1 Introduction - Light-emitting polymers . . . . . . . . . . . . . . . . . . 35
3.1.1 Poly-phenylene-vinylene (PPV) derivatives . . . . . . . . . . . . 353.1.2 Poly-p-phenylene (PPP) derivatives . . . . . . . . . . . . . . . . 373.1.3 Polyspirobifluorene polymers: Towards a stable blue . . . . . . . 39
3.2 A dielectric spectroscopy study on a spirobifluorene homopolymer . . . 413.2.1 Dielectric spectroscopy data . . . . . . . . . . . . . . . . . . . . 413.2.2 Ionic mobility . . . . . . . . . . . . . . . . . . . . . . . . . . . . 433.2.3 Molecular mobility . . . . . . . . . . . . . . . . . . . . . . . . . 43
3.3 On the morphology of Poly-spirobifluorene homopolymer films . . . . . 463.4 Experimental . . . . . . . . . . . . . . . . . . . . . . . . . . . . . . . . 483.5 Results . . . . . . . . . . . . . . . . . . . . . . . . . . . . . . . . . . . . 51
3.5.1 Polyspirobifluorene Homopolymer . . . . . . . . . . . . . . . . . 513.5.1.1 Fluorescence dynamics . . . . . . . . . . . . . . . . . . 51
i

Contents
3.5.1.2 Delayed fluorescence and phosphorescence in thin films 553.5.1.3 Delayed fluorescence and phosphorescence in frozen so-
lution . . . . . . . . . . . . . . . . . . . . . . . . . . . 593.5.1.4 Stability against oxidation . . . . . . . . . . . . . . . . 60
3.5.2 Polyspirobifluorene Copolymers . . . . . . . . . . . . . . . . . . 623.5.2.1 Fluorescence energies and kinetics . . . . . . . . . . . 633.5.2.2 Delayed fluorescence and phosphorescence in thin films 643.5.2.3 Delayed fluorescence and phosphorescence in solution . 68
3.6 Discussion . . . . . . . . . . . . . . . . . . . . . . . . . . . . . . . . . . 70
4 Energy transfer in polymer blends and doped polymer matrices 734.1 Introduction - Why blends and copolymers? . . . . . . . . . . . . . . . 734.2 Results . . . . . . . . . . . . . . . . . . . . . . . . . . . . . . . . . . . . 76
4.2.1 Blends of Spiro-co-TAD with S-NRS-PPV . . . . . . . . . . . . 764.2.2 Energy transfer in PSBF polymers doped with a triplet emitter 794.2.3 Temperature dependence of energy transfer in PtOEP doped
PSBF-co-TAD . . . . . . . . . . . . . . . . . . . . . . . . . . . . 804.2.4 Comparison of energy transfer in triplet-emitter doped PSBF
matrices . . . . . . . . . . . . . . . . . . . . . . . . . . . . . . . 824.3 Photon energy upconversion in PtOEP doped PSBF matrices . . . . . 85
4.3.1 Introduction - The phenomenon of energy upconversion . . . . . 854.3.2 Experimental . . . . . . . . . . . . . . . . . . . . . . . . . . . . 86
4.3.2.1 Materials . . . . . . . . . . . . . . . . . . . . . . . . . 864.3.2.2 Sample preparation . . . . . . . . . . . . . . . . . . . . 874.3.2.3 Instrumentation . . . . . . . . . . . . . . . . . . . . . 88
4.3.3 Results . . . . . . . . . . . . . . . . . . . . . . . . . . . . . . . . 884.3.4 Discussion and Outlook . . . . . . . . . . . . . . . . . . . . . . 96
5 Charge carrier transport in π-conjugated polymers 995.1 Introduction - Theoretical background . . . . . . . . . . . . . . . . . . 99
5.1.1 Charge carrier generation . . . . . . . . . . . . . . . . . . . . . 995.1.2 Charge carrier transport . . . . . . . . . . . . . . . . . . . . . . 1015.1.3 Time-of-flight (TOF) technique . . . . . . . . . . . . . . . . . . 1035.1.4 Charge-generation-layer TOF technique . . . . . . . . . . . . . . 1055.1.5 Other techniques to determine the charge carrier mobility . . . . 108
5.1.5.1 Dark-injection space-charge-limited current transient method1085.1.5.2 Space-charge-limited current-voltage measurements . . 1085.1.5.3 Time-resolved microwave conductivity measurements . 1095.1.5.4 Field-effect transistor mobilities . . . . . . . . . . . . . 109
5.1.6 Models of charge carrier transport . . . . . . . . . . . . . . . . . 1115.1.6.1 Dispersive and nondispersive charge carrier transport . 1125.1.6.2 The disorder model of charge carrier transport . . . . . 114
5.1.7 Charge carrier mobility in organic materials . . . . . . . . . . . 1185.2 Experimental part . . . . . . . . . . . . . . . . . . . . . . . . . . . . . 121
5.2.1 Materials . . . . . . . . . . . . . . . . . . . . . . . . . . . . . . 1215.2.2 Sample preparation and instrumentation . . . . . . . . . . . . . 122
ii

Contents
5.3 Cyclic voltammetry measurements . . . . . . . . . . . . . . . . . . . . . 1245.3.1 Cyclic voltammetry - Background . . . . . . . . . . . . . . . . . 1245.3.2 Results and Discussion . . . . . . . . . . . . . . . . . . . . . . . 125
5.4 Results and interpretation of TOF measurements . . . . . . . . . . . . 1285.4.1 TOF measurements on the PSBF-homopolymer and Spiro-co-
(10%)TAD . . . . . . . . . . . . . . . . . . . . . . . . . . . . . . 1285.4.1.1 Temperature and field-dependence of hole mobility . . 1285.4.1.2 Temperature dependence of zero-field mobility . . . . . 1295.4.1.3 Interpretation of charge carrier transport parameters . 1335.4.1.4 Hole mobility in an annealed sample . . . . . . . . . . 136
5.4.2 TOF measurements on Spiro-co-(10%)anthracene and Spiro-co-(10%)carbazole . . . . . . . . . . . . . . . . . . . . . . . . . . . 1395.4.2.1 Temperature and field-dependence of hole mobility . . 1395.4.2.2 Temperature dependence of the zero-field mobility . . 1425.4.2.3 The occurrence of a cusp at higher temperatures . . . 146
5.5 Discussion and Outlook . . . . . . . . . . . . . . . . . . . . . . . . . . 148
6 Amplified spontaneous emission in polymer waveguides 1516.1 Introduction - Theoretical background . . . . . . . . . . . . . . . . . . 151
6.1.1 Motivation . . . . . . . . . . . . . . . . . . . . . . . . . . . . . . 1516.1.2 Stimulated emission in organic materials . . . . . . . . . . . . . 152
6.2 Experimental . . . . . . . . . . . . . . . . . . . . . . . . . . . . . . . . 1566.2.1 Material and sample preparation . . . . . . . . . . . . . . . . . 1566.2.2 Experimental setup and techniques . . . . . . . . . . . . . . . . 157
6.3 Results and discussion . . . . . . . . . . . . . . . . . . . . . . . . . . . 161
7 Conclusions and Outlook 168
References 172
A Abbreviations 186
B List of scientific publications 189
iii

iv

Chapter 1
Introduction
1.1 Organic electronics
The electronic and optical properties of conjugated polymers have attracted tremen-
dous academic and industrial research interest over the past decades due to the ap-
pealing advantages that organic / polymeric materials offer for electronic applications
and devices such as organic light emitting diodes (OLED), organic field effect transis-
tors (OFET), organic solar cells (OSC), photodiodes and plastic lasers [MF05] [For05].
From the afore mentioned devices organic / polymer light emitting diodes have been
developed furthest and some products have already entered the market as precursors
of the next generation of display and lighting technology. A simplified scheme of an
organic light emitting diode is shown in Figure 1.1. The research field of organic
Substrate
TransparentElectrode
Light emittingmaterial
Counter electrode
Emitted Light
Figure 1.1: Simple scheme of an organic light emitting diode (OLED).
light emitting diodes is traditionally divided into the small molecule based devices
which were first reported by a team from Kodak [TvS87] and polymer based LEDs
(also PLEDs) first demonstrated by the research group of Friend from the University
1
1.1. Organic electronics
of Cambridge (UK) [BBB+90]. The former have already proven their applicability
from simple monochrome OLEDs up to full-color displays which have already been
introduced into the market. The latter still suffer from their limited lifetime and ef-
ficiency, especially for blue and red light-emitting-polymers (LEP) but a lot of effort
goes into these materials since they will offer the advantage of easy processing by ink-
jet techniques, for instance, and large areas can be covered by solution-based coating
techniques which is impossible (or too expensive) to realize by vapor deposition of
small molecules. There are a few exceptions among the conjugated polymers which
exhibit already excellent lifetimes and high luminance densities such as the family of
phenyl-substituted poly-p-phenylene-vinylene (PPV) known as ”Super Yellow PPVs”
introduced by the former Covion Organic Semiconductors GmbH (since 2004 Merck
OLED Materials) [SBK+98] [BSK+00]. However, since the properties of liquid crys-
tal based displays have also significantly been improved over the last years, there is
actually not much need anymore for monochrome displays based on polymers. Apart
from full-color displays with individual pixels based on conjugated polymers another
appealing application of conjugated polymers are large area white light emitting de-
vices consisting for instance of a copolymer that emits blue, green and red light at the
same time. The obvious application is room lighting. The further development of con-
jugated polymers for applications in optoelectronic devices requires detailed knowledge
of their photophysical properties and of the processes that are ongoing during device
operation.
Historically the research in conjugated polymers started booming in the late 1970’s
as Heeger, MacDiarmid and Shirakawa reported that doping of polyacetylene chains
leads to metal-like conductivity of the polymer. They were awarded the Nobel Prize
in Chemistry in 2000 for the initial invention of conducting polymers. Based on their
suggestions it had been initially proposed that conjugated polymers resemble the pho-
tophysical properties of one-dimensional semiconductors, i.e. electron-electron interac-
tion was considered to be negligible relative to electron-lattice interaction and the ele-
mentary optical excitations were expected to be electronically decoupled polarons (free
charge carriers) instead of coulombically bound electron-hole pairs (polaron excitons)
[Hee01]. However, there is independent and compelling evidence that semiconducting
polymers do not behave fundamentally different from small molecular organic materi-
als and organic crystals having a distribution of the excited and ground state energies
that leads, for instance, to inhomogeneous broadening of the absorption and emission
spectra. Further evidence comes from the observation of excitons with a binding en-
ergy on the order of 0.5 eV and the large energy difference between singlet excited and
triplet states, whose existence itself is a signature of strong electron-electron interaction
[PS99]. The distribution of energies is a direct consequence of the limited conjugation
2
Chapter 1: Introduction
length along the polymer backbone which limits the spatial extension of the excited
state to certain polymer chain segments or even to a single monomer. Furthermore
different environments of these segments lead to different intermolecular interactions
between them which introduces further positional disorder. The most often used de-
scription for energetic and positional disorder is based on a Gauß-type distribution
and was proposed by Bassler and coworkers. Meanwhile the validity of the Gaussian
disorder model (GDM) has been verified both theoretically as well as experimentally.
1.2 Motivation and Outline
The research presented in this work was driven by the aim to study the photophysical
properties of novel conjugated organic materials to get a deeper understanding of their
structure-property relationships. This includes time-resolved spectroscopy of excited
states such as singlet excited and triplet excited states in the time-region of picoseconds
to seconds to determine their energies, decay kinetics and decay pathways. Furthermore
charge carrier transport in different conjugated polymers was investigated employing
a modified time-of-flight (TOF) technique, namely the charge-generation-layer TOF
technique.
The thesis is split up into seven main chapters. The first chapter, Chapter 1,
is meant for giving a short and very general introduction into the topic of organic
electronics and to outline the thesis.
Chapter 2 gives an introduction to the interaction of light with organic molecules
which results in the generation of electronically excited states. Successively energy
transfer of excited states is discussed and this chapter draws a bow from the photo-
physical description of small molecules to the more complicated photophysics of conju-
gated polymers with a short discussion of the different models that are used to describe
conjugated polymers such as the band model and the disorder formalism. Finally the
fate of excited states is presented with special emphasis on the decay processes of
triplet states. The second chapter can be considered the introduction to Chapter 3
which presents the experiments, results and discussion of spectroscopic experiments on
selected blue-emitting Polyspirobifluorene (Co)polymers (Chapter 3 ) and energy trans-
fer processes in selected blends such as pure singlet emitter polymer blends and blends
consisting of a blue emitting polymer matrix doped with small molecule triplet emitters
(Chapter 4 ). Special interest was focussed to Section 4.3 which discusses photonenergy
upconversion in metallated porphyrin doped blue emitting polymer matrices.
Chapter 5 contains a theoretical introduction to charge carrier generation and
charge carrier transport in organic molecules. Special attention is paid to the descrip-
tion of the Gaussian disorder formalism which has been used to analyze the experi-
3

1.2. Motivation and Outline
mentally obtained data. Furthermore different techniques of measuring charge carrier
mobility are reviewed with an emphasis on the time-of-flight (TOF) technique which
was used to study hole transport in a series of different spirobifluorene copolymers.
The results of temperature and field-dependent hole mobility measurements are then
presented and analyzed in the framework of the GDM model.
Chapter 6 describes the phenomenon of amplified spontaneous emission (ASE) in
thin film polymer waveguides starting with a theoretical introduction to stimulated
emission in organic molecules. This chapter also explains in more detail the experimen-
tal setup that has been developed to study ASE in polymer film waveguides followed
by results obtained experimentally for a novel fully-arylated poly(indenofluorene) in
slab waveguide structures.
Finally Chapter 7 summarizes the whole work and places the results in a context
with respect to results that have been obtained by other groups which investigate the
photophysical properties of conjugated polymers for optoelectronic applications.
4

Chapter 2
Theoretical Basics
2.1 Light absorption and emission
Light can be described in two ways according to the phenomena that can be observed
when light interacts with matter. On the one hand it can be described as an electro-
magnetic wave of the wavelength λ = c/ν, with c being the speed of light and ν the
frequency, consisting of an oscillating electric field and an oscillating magnetic field
both perpendicular to each other and to the propagation direction of the wave. On the
other hand the quantum mechanical description of light emphasizes on its quantized
nature and characterizes light as quasi particles called photons. The former can be
mathematically expressed by a simple wave equation for the spatial extension of the
electric field perpendicular to its propagation direction
~E(x, t) = E0 × sin[2π
(νt− x
λ
)+ θ
](2.1)
where E0 is the magnitude of the vector in a plane perpendicular to the propagation
axis, 2π(νt− x
λ
)is the phase at the time t in position x and θ is the phase at time
t = 0, x = 0 and ν is the frequency in hertz (Hz). Equation 2.1 is valid for a linearly
polarized light wave only, with ~E being the polarization direction of the light.
A molecule that is located in a radiation field of photons with the spectral energy
density ρ(ν) can absorb a photon whereupon a transition between two energy levels
occurs. The system can absorb light only as quanta of radiation expressed by
E = hν = E2 − E1 = h× c
λ(2.2)
Macroscopically the absorption of light can be observed as attenuation of an incoming
light beam while it is passing an absorbing medium, no matter whether it is a gas, liquid
or solid. The Lambert-Beer law correlates the light intensity to the concentration c of
the absorbing species and the thickness d that is passed
I(ν) = I0 × e−α(ν)×d ⇔ log
(I0
I
)= ε(ν)× c× d (2.3)
5

2.1. Light absorption and emission
where α(ν) = 2.303 × ε(ν) × c is the absorption coefficient of the medium for light of
the frequency ν and ε(ν) is the extinction coefficient. If the concentration is given in
molarity units the extinction coefficient becomes the molar extinction coefficient and
absorptivity is measured as absorbance A, or optical density (OD)
A = ε(ν)× c× d (2.4)
An important parameter that characterizes the ”strength” of an optical transition
is the oscillator strength f . Historically it is related to the spectrum of the molar
decadic extinction coefficient ε(ν), where ν denotes wavenumbers, by integrating over
the absorption band [Per95] [MT95]
f =2303mec
2
πn0NLe2
∫ε(ν)dν =
4.319× 10⁻⁹
n0
∫ε(ν)dν (2.5)
with me the mass of an electron, e the elemental charge, n0 the refractive index of
the medium and NL Avogadro’s number. Furthermore∫
ε(ν)dν = N × σ(ν) where N
denotes the number of absorbing species and σ(ν) is the absorption cross-section per
molecule for the transition.
There are 3 types of transitions between two energy levels that can occur if ra-
diationless transitions are neglected [PS99] [Bub04]. Having absorbed a photon the
E1
E2
hn
B1
2r
B2
1r
A2
1
Figure 2.1: Simple scheme of a 2-level system and the transitions that can occur betweenthe two levels. Radiationless transitions are neglected.
molecule reaches an excited state. From their it can relax back to the ground state
via spontaneous emission of another photon. Furthermore an incoming photon which
interacts with an excited molecule can induce emission of another photon, so called
induced emission.
The transition probabilities, i.e. the number of transitions per time unit that occur
are
6
Chapter 2: Theoretical Basics
P12(induced) = B12ρ(ν) B12: Einstein coefficient of induced absorption
P21(induced) = B21ρ(ν) B21: Einstein coefficient of induced emission
P21(spontaneous) = A21 A21: Einstein coefficient of spontaneous emission
According to Einstein B21 = B12 and A21 is related to B21 by [PS99]
A21 =8πhν3n3
0
c3×B21 (2.6)
where n0 is the refractive index of the medium and the other parameters have their usual
meaning. As a consequence of large radiation fields ρ it is possible that B21 À A21, i.e.
induced transitions dominate. Furthermore the total absorption of light by the system
can be reduced since induced absorption and induced emission have the same transition
probabilities, an effect called saturable absorption. Technologically most important
is population inversion between the two energy levels, i.e. the excited state has a
larger population than the ground state. According to simple Boltzmann statistics
the population of the upper energy level at room temperature is vanishingly small
for typical energy gaps between E1 and E2 of a few electron volts (eV). Population
inversion can for instance be achieved by optical pumping via a third level. In this case
induced emission becomes more probable than absorption and stimulated emission
occurs which is a prerequisite for lasing.
The Einstein coefficient of induced absorption B12 can be measured according to
[PS99]
B12 =2303c
hn0NL
∫ε(ν)
νdν (2.7)
with ε being the decadic molar extinction coefficient and NL Avogadro’s number.
Furthermore the oscillator strength f is related to the Einstein coefficient for the tran-
sition between levels 1 and 2 by
f12 =mehν
πe2B12 (2.8)
If the molecule can relax from its excited state to the ground state only via emission
of a photon in a first order rate process, then the radiative decay rate kr is defined as
kr = (τr)−1 := P21(spontaneous) = A21 (2.9)
with τr being the radiative lifetime of the excited state.
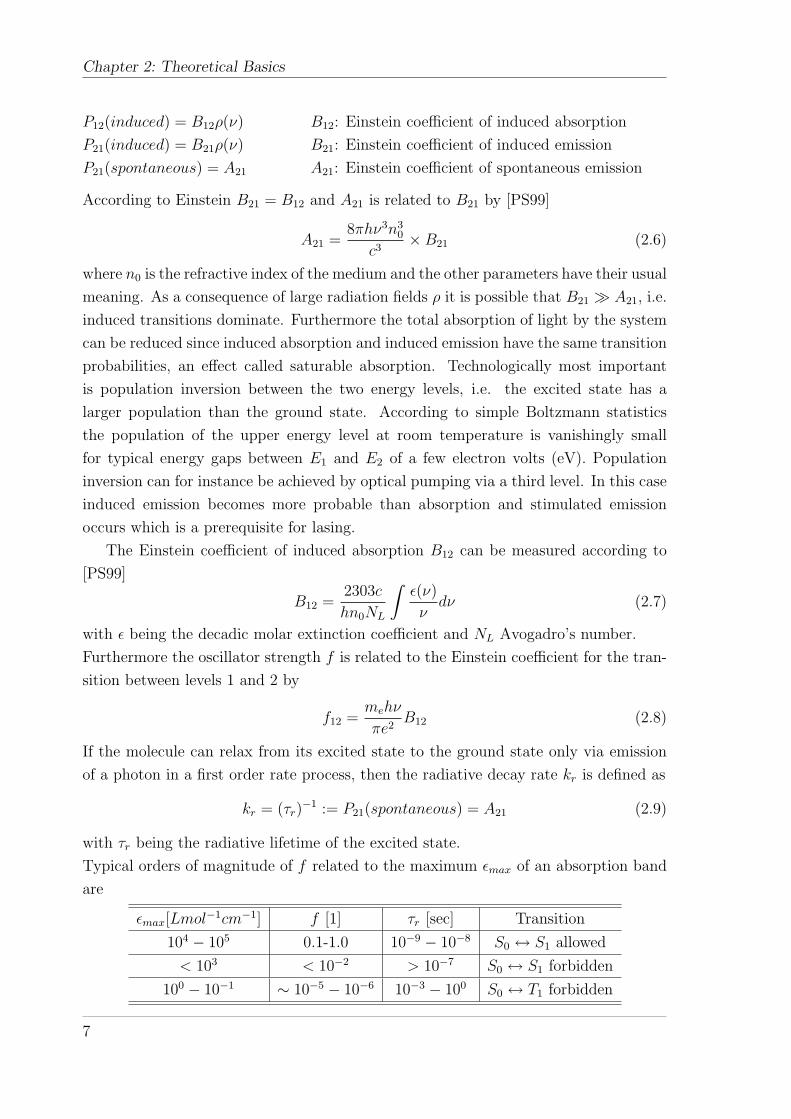
Typical orders of magnitude of f related to the maximum εmax of an absorption band
are
εmax[Lmol−1cm−1] f [1] τr [sec] Transition
104 − 105 0.1-1.0 10−9 − 10−8 S0 ↔ S1 allowed
< 103 < 10−2 > 10−7 S0 ↔ S1 forbidden
100 − 10−1 ∼ 10−5 − 10−6 10−3 − 100 S0 ↔ T1 forbidden
7

2.1. Light absorption and emission
Strickler and Berg [SB62] combined the radiative decay rate with measurable spectra
of emission and absorption
τ−1r =
8πhc
n0
∫I(ν)dν∫
ν−3I(ν)dνB12 (2.10)
where I(ν) is the relative number of photons emitted at the wavenumber ν. The relation
is valid only for diluted solutions of molecules which have a fluorescence quantum yield
Φ close to unity. Furthermore it does not hold anymore if additional relaxation channels
are present.
The quantum yield Φ for emission of light is defined as the number of emitted
photons per number of absorbed photons. In a real system not only radiative transitions
occur but also non-radiative transitions between different excited states. Figure 2.2
shows a schematic view of the depopulation transitions that can occur between typical
singlet- (S0, S1) and triplet-energy levels (T1). Vibronic transitions are neglected and
will be discussed in more detail later. The depopulation of the S1-state can occur with
S0
S1
T1k r knr
k ISC
k rp knrp
Figure 2.2: Simplified scheme of the possible depopulation mechanisms of an excited singletstate in a typical singlet-triplet energy level system.
transition rates k via different channels
kr: radiative (fluorescence)
knr: nonradiative (phonon emission)
kISC : intersystem crossing (S1 → T1)
krp: radiative (phosphorescence)
knrp: nonradiative (T1 → S0)
In a real system all these transitions occur and the fluorescence lifetime τF that can
be measured experimentally is defined as the reciprocal value of the sum of all the
transition rates of the involved processes
τF := (kr + knr + kISC)−1 (2.11)
8

Chapter 2: Theoretical Basics
which is different from the radiative lifetime τr described earlier. Hence the quantum
yield of fluorescence becomes
ΦF = Φ∗ kr
kr + kISC + knr
= Φ∗ τF
τr
(2.12)
with Φ∗ the yield of the fluorescent state (S1) per absorbed photon. Typically the
quantum yield of fluorescence ΦF is smaller than 1 which means that the fluorescence
lifetime τF is less than the radiative lifetime τr.
2.2 Electronic transitions in organic molecules
2.2.1 Transition dipole moment
If an organic molecule interacts with light of suitable energy an electronic transition
will occur within the molecule. In quantum mechanics a dipole moment operator is
used which resembles the classical electrical dipole moment defined for two charges
(+q and −q) of the distance ~r as ~M = q~r. Since organic molecules are multi-electron
systems the dipole moment is related to the sum over the number of i electrons:∑
e~ri,
with e being the charge of one electron. Quantum mechanically the transition dipole
moment is expressed as
< Mul >=< ψTu | ~M |ψT
l > (2.13)
with ~M being the dipole moment operator, ψTl the molecular ground eigenstate and
ψTu the excited eigenstate. The eigenstates represent the wavefunction of a molecular
electronic state, i.e. the sum of the vibrational and electronic energy in the system.
Rotational energies are considered small in comparison to vibrational and electronic
energies, therefore their contribution becomes important only in the case that the fine
structure of a vibrational line is observed.
Since the electron mass is small compared to the mass of the nuclei and the velocity of
an electron is fast compared to the velocity of the nuclei, the total wavefunctions ψT
can be separated into an electronic and a nuclear part. This approximation is known
as Born-Oppenheimer approximation. Moreover the spatial electronic wavefunction
corresponds to two different spin-state electronic wavefunctions the so called spin-
orbital functions. Therefore the total wavefunction splits up into electronic and nuclear
parts and the spin function and the transition dipole moment can be expressed by the
product of the respective electronic ψ, vibrational χ and electron spin S wavefunctions
that correspond to the molecular configuration in the ground and excited state.
~Mul =< ψu| ~M |ψl > × < χu|χl > × < Su|Sl > (2.14)
9

2.2. Electronic transitions in organic molecules
An immediate consequence of the Born-Oppenheimer approximation is that the elec-
tronic transition in a molecule occurs so rapidly as compared to the vibrational motion
that the nuclei have not changed their relative positions significantly immediately after
the electronic transition. This is known as the Franck-Condon principle which will be
discussed more deeply in the next section.
The transition probability between two electronic states is proportional to the
square of the transition dipole moment
Pul ∝ | < ~Mul > |2 = | < ψTu | ~M |ψT
l > |2 (2.15)
If < ~Mul >6= 0 the transition is called ”dipole allowed”, otherwise if < ~Mul >= 0 the
transition is ”dipole forbidden”.
Since the dipole moment operator works only on the electronic spacial functions the
Born-Oppenheimer approximation has to be applied to equation 2.15. This leads to
Pul ∝ | < ψu| ~M |ψl > |2 × | < χu|χl > |2 × | < Su|Sl > |2 (2.16)
The transition is forbidden, if one term of this product is equal zero. From equation
2.16 the so called four selection rules for electronic transitions can be derived.
Furthermore the quantum mechanical expression of the transition dipole moment is
related to the oscillator strength f of a transition by [MT95] [HW94]
f =8π2meν
3he2| < ~Mul > |2 = 4.702× 10⁻⁷ν| < ~Mul > |2 (2.17)
where ν and ν are the frequency and wavenumber, respectively. The oscillator strength
f is accessible by integration over the absorption band of the transition as expressed
in equation 2.5. Combining both equations leads to the following expression of the
oscillator strength
| < ~Mul > |2 =9.185× 10⁻³
n0ν
∫ε(ν)dν (2.18)
By means of this equation the transition probability can be evaluated from the absorp-
tion spectrum.
2.2.2 The selection rules
The four selection rules can be derived from equation 2.16. They allow to decide
whether an electronic transition is allowed or not.
According to the Symmetry Rule
only electronic transitions are allowed whereupon the symmetry of the
eigenstate of ψ changes from the ground to the excited state.
10
Chapter 2: Theoretical Basics
This is a consequence of ~M =∑
e~ri being an odd (”ungerade”) operator, but the
integral of the product ψ∗u∑
e~riψl must be even (”gerade”) to obtain a non-zero integral
over full space. This condition is only fulfilled for the product of the transition dipole
operator with wavefunctions of different symmetry. The Symmetry Rule is related to
the node rule, which aforesaid that
With excitation of the next higher quantum state the number of nodes of
the spacial part of the wavefunction is increased by one.
The spacial overlap rule relates the magnitude of Pul to the overlap of the wave-
functions ψu and ψl. According to this rule
the probability Pul ∝ | < ψu| ~M |ψl > |2 is large if the overlap of the elec-
tronic wavefunctions of the ground state and the excited state is large.
This condition is fulfilled for π → π∗ transitions since in the case of ψl = ψ(π −orbital), ψu = ψ(π∗− orbital) the spacial overlap is large. On the other hand a n → π∗
transition has weak overlap of the electronic wavefunctions, therefore its probability is
small.
Apart from the spacial overlap of the electronic wavefunctions ψ the Franck-Condon
factor | < χu|χl > |2 is related to the overlap of the spacial functions of the nuclei at
the upper and lower electronic states. This factor describes the excitation probability
of a vibronic transition which can occur in combination to the electronic transition.
The spin-selection rule forbids transitions between pure singlet and triplet states.
The total spin of an electronic system must not change during an electronic
transition.
Since in real systems the electronic states always compose of a mixture of states and
do not exhibit pure singlet or triplet character these transitions are partially allowed.
Especially heavy metal atoms enhance the spin-orbit coupling, thus enhancing the
intersystem crossing rates.
11

2.2. Electronic transitions in organic molecules
2.2.3 Electronic transitions - Configuration-Coordinate Dia-
gram
The coupled electronic and vibronic transitions of a simple molecule consisting of two
nuclei are typically displayed in a configuration-coordinate diagram. It is a plot of the
potential energy E versus the internuclear distance r which reflects the bond length.
The energy curve is based on the model of the harmonic oscillator but includes the bond
separation for large internuclear distances. The electronic excited state is higher in en-
ergy than the the ground state. Figure 2.3 shows a typical configuration-coordinate
diagram and the corresponding absorption and emission spectra. The first five vi-
Figure 2.3: Configuration coordinate diagram for the singlet ground state and first singletexited state. The left part shows the absorption of a photon and the transition into highervibrational sublevels according to the Franck-Condon principle together with the correspond-ing absorption spectrum. The right part shows the transition into the vibrational sublevelsof the ground state and the corresponding fluorescence spectrum. Note the mirror image ofthe absorption and emission spectra. From Pope and Swenberg. [PS99]
brational energy levels ν = 0, 1, 2, 3, 4 are indicated with their vibrational probability
functions χ2 for the positions of the nuclei. They are obtained from the vibrational
wavefunctions χ of a harmonic or anharmonic oscillator in most cases. According to the
Franck-Condon principle the electronic transitions occur ”vertically” since no change of
12

Chapter 2: Theoretical Basics
the internuclear distance r occurs during the fast transition. The Franck-Condon factor
| < χu|χl > |2 describes which transitions are the strongest. This does not necessarily
have to be the transition into the ν ′ = 0 vibronic of the excited state because the inter-
nuclear distance r of the electronically excited state can be different from the ground
state. Therefore several bands can be observed in the absorption spectrum which re-
flect the different vibrational sublevels of the electronic excited state. According to
Kasha’s rule, which is empirical:
The absorption of light from the zero vibrational level of the ground state
has the highest probability. For a singlet ground state S0, absorption will
take place from S0(ν = 0).
This is a direct consequence of the Boltzmann distribution law since at room temper-
ature the majority of molecules is in its vibronic ground state. Likewise the transition
from the excited state originates mostly from the ν ′ = 0 vibrational sublevel into the
different vibrational sublevels of the electronic ground state which causes the typical
band structure of fluorescence spectra. In the ideal case the absorption and fluorescence
spectra exhibit mirror symmetry and the 0-0 transition appears at the same energy but
in real systems the 0-0 transition of the fluorescence is typically shifted to lower energy
with respect to the 0-0 transition of the absorption. This is a consequence of structural
relaxation of the electronic excited state. The energy difference between the 0-0 tran-
sitions of absorption and emission is called Stokes shift. The Stokes shift is small for
molecules which have a rigid structure that does not allow structural relaxation of the
excited states. An example for small molecules is anthracene in diluted solution which
additionally shows well-resolved vibrational sublevels (see Turro 1978). An example
for a polymer is the class of ladder-type polyphenylenes discussed in the next chapter.
Even if the molecule is rigid, in solution it can show a so-called fluorescence gap be-
tween the 0-0 transitions of absorption and emission due to the difference of the static
dipole moment of the ground and excited states which cause a different polarization of
the environment. This is denoted solvent relaxation which happens immediately after
the electronic transition.
Figure 2.3 shows only a simplified scheme of the transitions that can occur in an organic
molecule. A visualisation of all the electronic transitions is depicted in the Jablonski
diagram in Figure 2.4. The different energy levels are ordered according to their energy
values. Each energy level represents a different electron configuration in the molecular
orbitals not the molecular orbitals themselves. Furthermore the energy levels are di-
vided into singlet states, which have a spin multiplicity of 1 and triplet states, which
have a spin multiplicity of 3. A singlet state is characterized by an antiparallel orien-
tation of the angular momentum of the electron spins, whereas the orientation of the
angular momentum of a triplet state is parallel. The triplet state is lower in energy
13
2.2. Electronic transitions in organic molecules
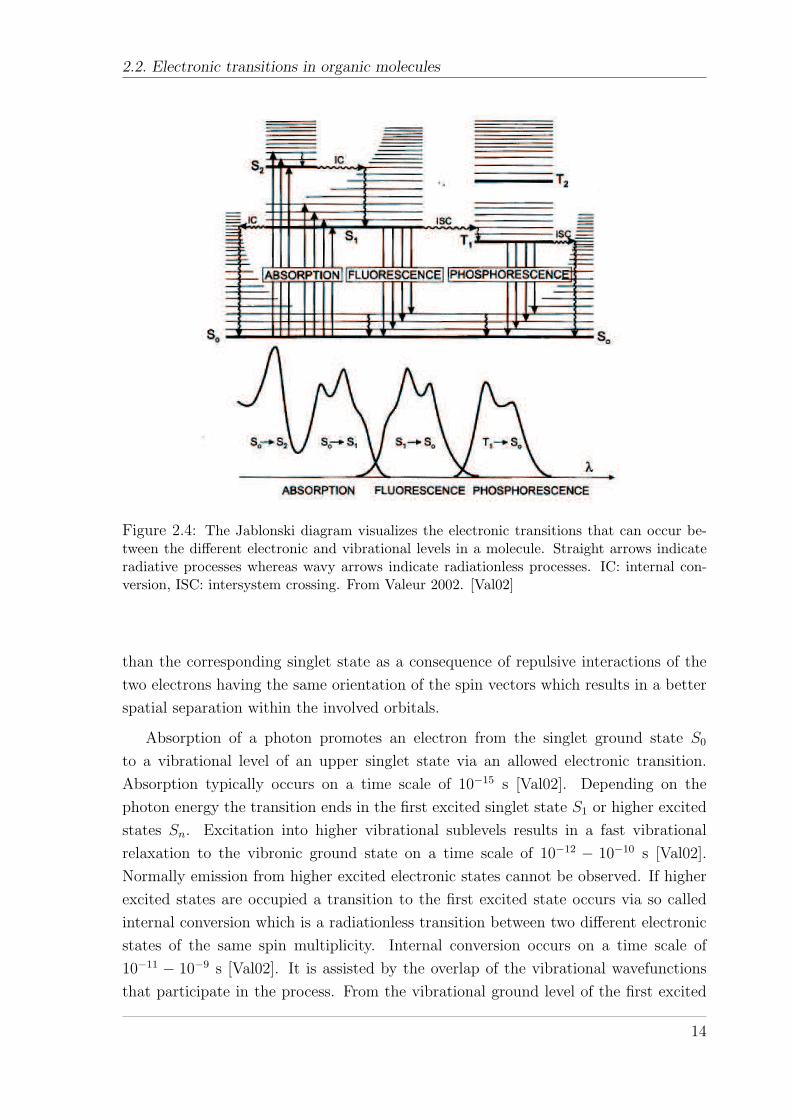
Figure 2.4: The Jablonski diagram visualizes the electronic transitions that can occur be-tween the different electronic and vibrational levels in a molecule. Straight arrows indicateradiative processes whereas wavy arrows indicate radiationless processes. IC: internal con-version, ISC: intersystem crossing. From Valeur 2002. [Val02]
than the corresponding singlet state as a consequence of repulsive interactions of the
two electrons having the same orientation of the spin vectors which results in a better
spatial separation within the involved orbitals.
Absorption of a photon promotes an electron from the singlet ground state S0
to a vibrational level of an upper singlet state via an allowed electronic transition.
Absorption typically occurs on a time scale of 10−15 s [Val02]. Depending on the
photon energy the transition ends in the first excited singlet state S1 or higher excited
states Sn. Excitation into higher vibrational sublevels results in a fast vibrational
relaxation to the vibronic ground state on a time scale of 10−12 − 10−10 s [Val02].
Normally emission from higher excited electronic states cannot be observed. If higher
excited states are occupied a transition to the first excited state occurs via so called
internal conversion which is a radiationless transition between two different electronic
states of the same spin multiplicity. Internal conversion occurs on a time scale of
10−11 − 10−9 s [Val02]. It is assisted by the overlap of the vibrational wavefunctions
that participate in the process. From the vibrational ground level of the first excited
14

Chapter 2: Theoretical Basics
singlet state the excess energy can be relaxed by emission of a photon. This is known
as fluorescence which exhibits a typical vibronic structure caused by transitions into
the vibrational sublevels of the electronic ground state. The lifetime of fluorescence
is typically of 10−10 − 10−7 s [Val02]. Furthermore internal conversion to the singlet
ground state and successive vibrational relaxation can deactivate the singlet state via
a nonradiative channel. Alternatively, the system can undergo spin-conversion to a
triplet manifold. This process is called intersystem crossing and it occurs on a time-
scale of 10−10 − 10−8 s [Val02]. After vibrational relaxation to the vibrational ground
state the excess energy can be emitted as phosphorescence. Phosphorescence is long-
lived, typically 10−6 − 1 s or even longer, since the transition to the ground state is
spin-forbidden by the spin selection rule. The triplet state can also be deactivated by a
non-emissive channel via ISC to S0 and successive vibrational relaxation. It was found
that the nonradiative decay channel increases exponentially with decreasing triplet
energies, known as energy-gap law [EJ70] [PS99]. The exponential relation has its
reason in an exponential decrease of the Franck-Condon factor with increasing energy
difference between the states that are involved in the transition as calculations have
shown [Sie67]. Hence, phosphorescence is more difficult to observe for low energy triplet
states.
2.3 Energy transfer processes
A molecule that is in an excited singlet or triplet state can transfer its energy to a
molecule in the ground state by electronic energy transfer (ET). The former is called
the donor (D) and the latter the acceptor (A). Energy transfer always involves two
molecules that are in close proximity to each other. It is the fundamental process of
energy / exciton migration which consists of multiple energy transfer processes and will
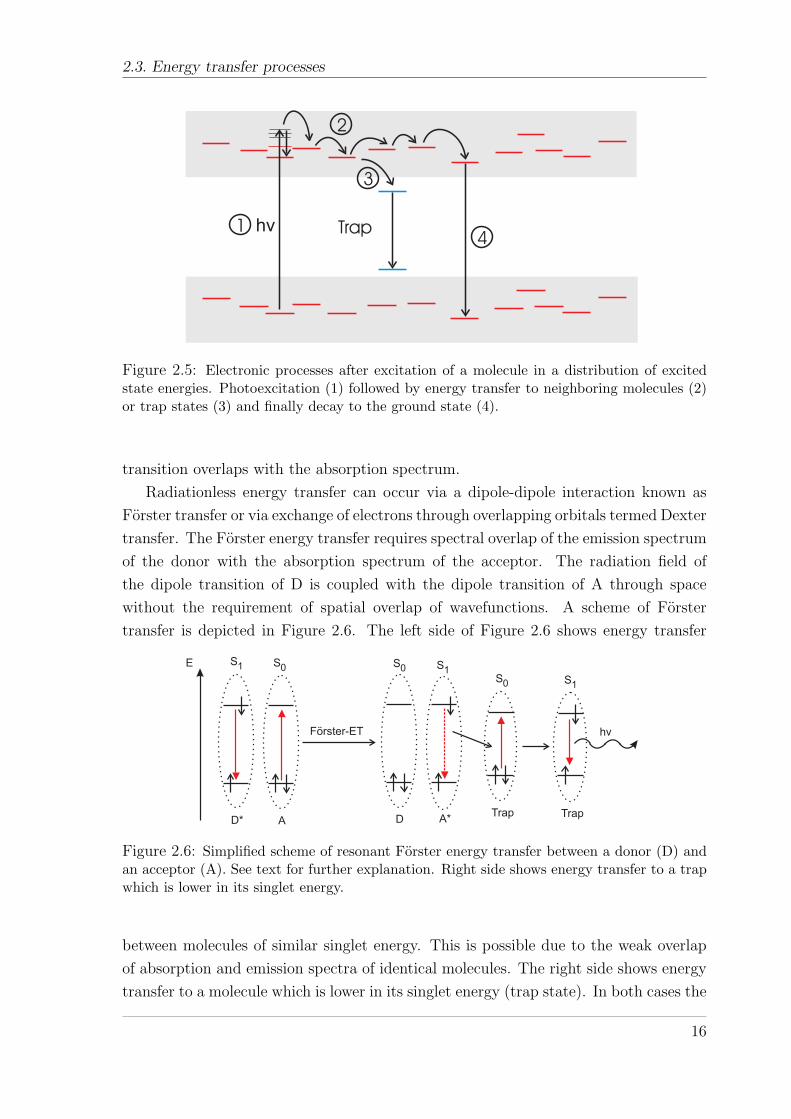
be explained in more detail later. Figure 2.5 depicts the most important processes that
occur after excitation of a molecule that is surrounded by other molecules which form
a distribution of excited state energies. After optical excitation (1) the excited state is
transferred during its lifetime to neighboring molecules (2) until the excited state either
transfers to a trap state, which is lower in energy (3) or decays to the ground state
(4). One has to differentiate between radiationless energy transfer processes and the
so-called trivial case of electronic energy transfer. The latter is caused by emission of
a photon from the donor which is subsequently reabsorbed by the acceptor molecule.
In this case the dependence of energy transfer efficiency on the distance between D
and A is weak and the only important factor that influences the energy transfer is the
quantum yield of the donor in the range of absorption of the acceptor. Reabsorption
can be observed, for instance, in thick films, especially for the 0-0 transition since this
15
2.3. Energy transfer processes
hv Trap1
2
3
4
Figure 2.5: Electronic processes after excitation of a molecule in a distribution of excitedstate energies. Photoexcitation (1) followed by energy transfer to neighboring molecules (2)or trap states (3) and finally decay to the ground state (4).
transition overlaps with the absorption spectrum.
Radiationless energy transfer can occur via a dipole-dipole interaction known as
Forster transfer or via exchange of electrons through overlapping orbitals termed Dexter
transfer. The Forster energy transfer requires spectral overlap of the emission spectrum
of the donor with the absorption spectrum of the acceptor. The radiation field of
the dipole transition of D is coupled with the dipole transition of A through space
without the requirement of spatial overlap of wavefunctions. A scheme of Forster
transfer is depicted in Figure 2.6. The left side of Figure 2.6 shows energy transfer
E S1
D* A
S0 S1
D A*
S0
Förster-ET
Trap Trap
hv
S0 S1
Figure 2.6: Simplified scheme of resonant Forster energy transfer between a donor (D) andan acceptor (A). See text for further explanation. Right side shows energy transfer to a trapwhich is lower in its singlet energy.
between molecules of similar singlet energy. This is possible due to the weak overlap
of absorption and emission spectra of identical molecules. The right side shows energy
transfer to a molecule which is lower in its singlet energy (trap state). In both cases the
16

Chapter 2: Theoretical Basics
ET occurs radiationless. If a molecule with a lower singlet energy level is present, its
fluorescence will be sensitized, i.e. the intensity of its fluorescence will be much stronger
than expected from its actual concentration. This is known as sensitized fluorescence.
Furthermore the fluorescence lifetime of the donor molecules is significantly reduced as
a consequence of efficient energy transfer to the lower energy trap. Since Forster energy
transfer is mediated by dipole-dipole interaction without the need of direct overlap of
orbitals, it can overcome distances up to 10 nm. The rate constant of Forster transfer
is expressed by
kD∗A→DA∗ =1
τD
(R0
R
)6
(2.19)
where τD is the measured fluorescence lifetime of D in the absence of A, R0 is the
Forster radius and R is the distance between D and A. If R = R0 the energy transfer
rate becomes kET = kr + knr ,i.e. the energy transfer has the same rate constant as
the excited state decay by the radiative and non-radiative channel. The Forster radius
can be expressed by
R60 =
9000ln10κ2ΦD
128π5NLn4Ω (2.20)
with κ being an orientation factor typically close to 1 in fluid systems and ≈ 0.6 in
solid solutions with random orientation of D and A molecules [Klo82], n the refractive
index of the medium, ΦD the fluorescence quantum yield of the donor D and Ω being
the spectral overlap defined as
Ω =
∫fD(ν)εA(ν)
ν4dν ≈
ν2∑ν1
∫fD(ν)εA(ν)
ν4∆ν (2.21)
where fD is the spectral distribution of the fluorescence of the donor normalized accord-
ing to∫∞0
fD(ν)dν = 1, εA is the molar decadic extinction coefficient of the acceptor,
ν1 and ν2 are the limits of fluorescence (D) and absorption (A) overlap, ν4 is the av-
erage wavenumber of fluorescence (D) and absorption (A) and ∆ν is the wavenumber
increment chosen for summation.
The second possibility of energy transfer is known as exchange type or Dexter energy
transfer. Dexter ET is based on quantum mechanical exchange interactions, therefore
it needs strong spatial overlap of the involved wavefunctions of D and A. Since the
overlap of electronic wavefunctions decays exponentially with distance, it is expected
that the rate constant kDA decreases even more rapidly with R than observed in the
case of singlet transfer [Klo82]. A schematic presentation of Dexter ET is shown in
Figure 2.7. Dexter ET occurs typically over distances which are similar to the van-der-
Waals distance, i.e. R = 0.5 − 1nm. The rate constant drops exponentially with the
distance RDA between D and A:
kD∗A→DA∗(R) =1
τ0
exp
[γ
(1− RAD
R0
)](2.22)
17

2.4. From small molecules to conjugated polymers
E S1
intersystem-crossing
T1
³D*
S0
A
T1
D
S0
³A*
Dexter-ET
Figure 2.7: Simplified scheme of Dexter energy transfer for a triplet state. Dexter ET is acorrelated two electron exchange process that desires strong overlap of wavefunctions.
Here τ0 is the phosphorescence decay time of the donor, R0 is the so called critical
radius where the rate of energy transfer equals the rate of radiative and nonradiative
deactivation, and γ = 2R0/L, where L denotes the effective average Bohr’s radius,
which cannot be calculated but is typically in the order of 0.1-0.2 nm. Dexter ET
is a correlated two electron exchange process. Hence it allows triplet energy transfer
without the additional need of intersystem crossing upon energy transfer of a triplet
state unlike the Forster energy transfer which requires spin-forbidden ISC for triplet
energy transfer. Due to this reason Forster ET is mostly used to describe singlet
migration, whereas Dexter ET is used to describe the triplet migration in the solid
state.
2.4 From small molecules to conjugated polymers
2.4.1 Aggregates, excimers and exciplexes
The photophysical properties of isolated small molecules can be well-explained by the
models discussed in the previous section. As soon as interaction of molecules has to be
included the situation becomes more difficult since many molecular orbitals have to be
taken into account which requires detailed knowledge of the number of atomic orbitals
that create the molecular orbitals and the electron-electron interaction between these
orbitals.
The interaction of two adjacent molecules, either by physical dimerisation, i.e. aggrega-
tion, or by chemical dimerisation, i.e. chemical bond formation between two molecules,
leads to a stabilisation of the ground and excited state due to coulombic energy inter-
action of the two units. Furthermore dimerisation leads to excited state splitting into
18

Chapter 2: Theoretical Basics
two levels due to the presence of an interaction potential. The splitting depends on
the magnitude of the resonance interaction energy of the excited states [PS99]. Ag-
gregation always refers to ground state interaction of two monomers that comprise the
aggregate.
If one monomer is in an excited state the intermolecular interaction is described
as excimer. The term excimer refers to interaction of equal monomers. The excited
state interaction of different monomers is known as exciplex. An example of the former
is the interaction of pyrene molecules upon increasing their concentration in solution.
Anthracene and dimethylaniline in toluene solution is an example for the latter [PS99].
Excimer and exciplex emission is typically broad and unstructured and shifted to lower
energies with respect to the emission of the monomer.
2.4.2 Band-model versus exciton model
A conjugated polymer consists of alternating single and double bonds. Most conjugated
polymers also include the benzene unit as one main part of their backbone structure.
The backbone itself is thus formed by σ-bonds which connect the sp2-hybridized carbon
atoms, whereas the double bonds (π-bonds) are formed by the remaining pz-orbitals
perpendicular to the plane in which the σ-bonds lie. A consequence of the alternation
of single and double bonds is that the pz-orbitals of adjacent (localized) double bounds
interact with each other so that theoretically the electrons of conjugated π-bonds are
delocalized over the whole π-electron system. For linear π-conjugated polyenes consist-
ing of n carbon atoms a Huckel approximation can be applied to calculate the lowest
lying electronically excited state:
Ek = α− 2 | β | cos(
kπ
n + 1
), k = 1, 2, ..., n (2.23)
where α and β denote the overlap and exchange integrals of the electronic wavefunctions
of the system, for instance the pz-orbitals of the carbon atoms in case of a π-electronic
system. However, the Huckel approximation is only valid for linear polyenes. In the case
of cyclic conjugated systems such as linked benzene rings for example the dependence
of the lowest electronically excited state on n can be described according to Davydov
by:
En = A− 2 | M | cos(
kπ
n + 1
), k = 1, 2..., n (2.24)
with A being the energy of the monomer unit and M the interaction between adjacent
units.
The above mentioned theoretical descriptions of the lowest electronically excited state
of a polymer chain are valid only for single polymer chains since interchain interactions
are not included. Solid state interactions are mathematically complicated to deal with
19
2.4. From small molecules to conjugated polymers
since there are many possible interactions of electronic wavefunctions within one chain
and between the chains in the bulk.
The conjugated polymer which comes closest to the description of an ideal one-
dimensional (1D) organic metal is the trans-polyacetylene (trans-PA). It is envisaged
as an infinite chain consisting of alternating single and double bonds totally neglecting
any contribution from endgroups. Its chemical structure implies that each carbon atom
contributes one pz electron to the π band, thus the π-band would be half-filled and
trans-PA should be a metallic conductor [Hee01]. However, experimental studies clearly
indicated that neutral polyacetylene exhibits an energy gap of around 1.5 eV, thus it
is a semiconductor [PS99]. It has been proposed years ago by Rudolf Peierls that 1D
metals are unstable with respect to a structural distortion which opens an energy gap
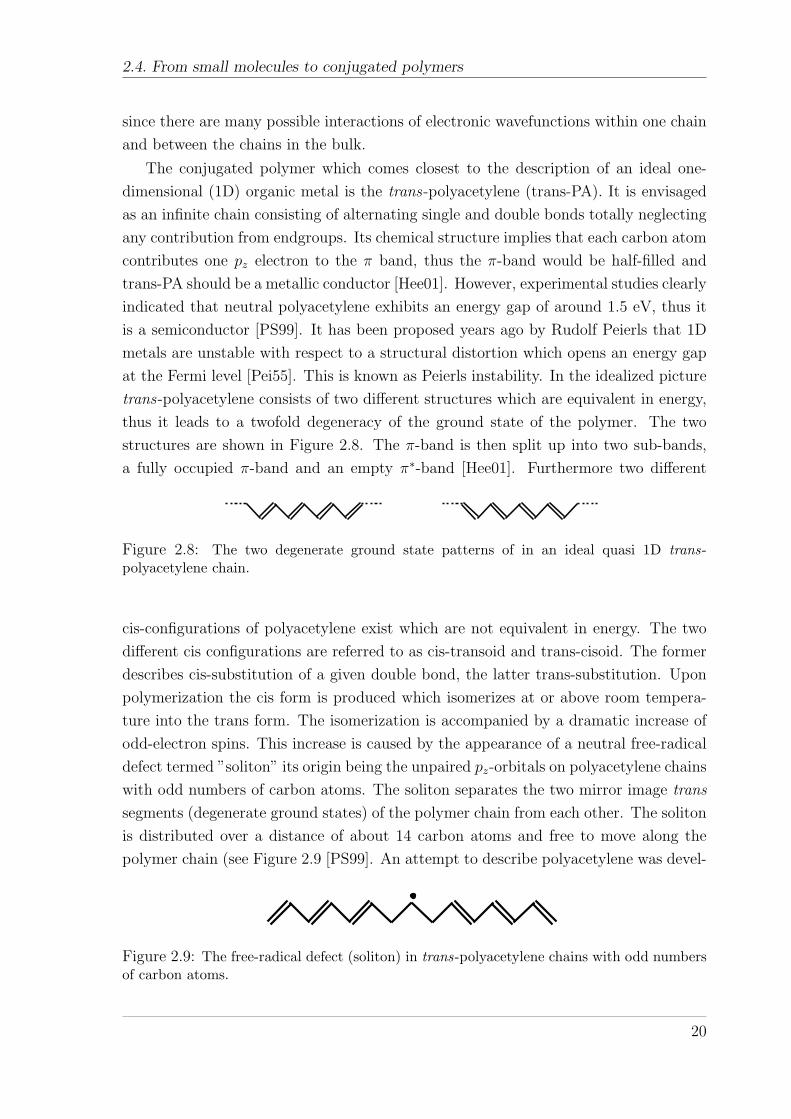
at the Fermi level [Pei55]. This is known as Peierls instability. In the idealized picture
trans-polyacetylene consists of two different structures which are equivalent in energy,
thus it leads to a twofold degeneracy of the ground state of the polymer. The two
structures are shown in Figure 2.8. The π-band is then split up into two sub-bands,
a fully occupied π-band and an empty π∗-band [Hee01]. Furthermore two different
Figure 2.8: The two degenerate ground state patterns of in an ideal quasi 1D trans-polyacetylene chain.
cis-configurations of polyacetylene exist which are not equivalent in energy. The two
different cis configurations are referred to as cis-transoid and trans-cisoid. The former
describes cis-substitution of a given double bond, the latter trans-substitution. Upon
polymerization the cis form is produced which isomerizes at or above room tempera-
ture into the trans form. The isomerization is accompanied by a dramatic increase of
odd-electron spins. This increase is caused by the appearance of a neutral free-radical
defect termed ”soliton” its origin being the unpaired pz-orbitals on polyacetylene chains
with odd numbers of carbon atoms. The soliton separates the two mirror image trans
segments (degenerate ground states) of the polymer chain from each other. The soliton
is distributed over a distance of about 14 carbon atoms and free to move along the
polymer chain (see Figure 2.9 [PS99]. An attempt to describe polyacetylene was devel-
Figure 2.9: The free-radical defect (soliton) in trans-polyacetylene chains with odd numbersof carbon atoms.
20
Chapter 2: Theoretical Basics
oped by Su, Schrieffer and Heeger (SSH) in 1979. They applied a Huckel treatment to
t-PA. In their model electron-electron interactions including coulomb interaction are
neglected and the dominant interaction is taken to be the electron-lattice coupling,
thus leading to the formation of valence and conduction bands typically observed for
inorganic semiconductors. A further consequence of their model is that the elementary
optical excitation in conjugated polymers would be a mobile charge carrier (charged
polaron) either created by injection at the contacts or created directly via interband
photoexcitation. However, meanwhile there is convincing evidence that the nature of
an excited state in conjugated polymers is a bound electron-hole pair as in the case
of molecular crystals. This bound state is termed ”exciton” also ”exciton polaron”.
An important evidence for excitons in conjugated polymers is the observation that
excitation into the first allowed excited state does not lead to efficient charge carrier
generation which should have been observed upon promotion of an electron from the
valence band to the conduction band [PS99]. Further evidence comes from fluorescence
quenching studies which revealed large exciton binding energies [KLD+94] [HSBR02].
Thus, conjugated polymers behave not fundamentally different from other organic ma-
terials. The reason is that in real world systems defects, kinks and deviations from the
rigid rod structure cause a limitation of the π-bond interaction. A straightforward con-
sequence is the occurrence of a so-called conjugation length for conjugated polymers.
According to the limitation of the π-system to polymer chain segments different con-
jugation lengths, a conjugated polymer can be considered a composition of oligomers
each exhibiting features of small molecules.
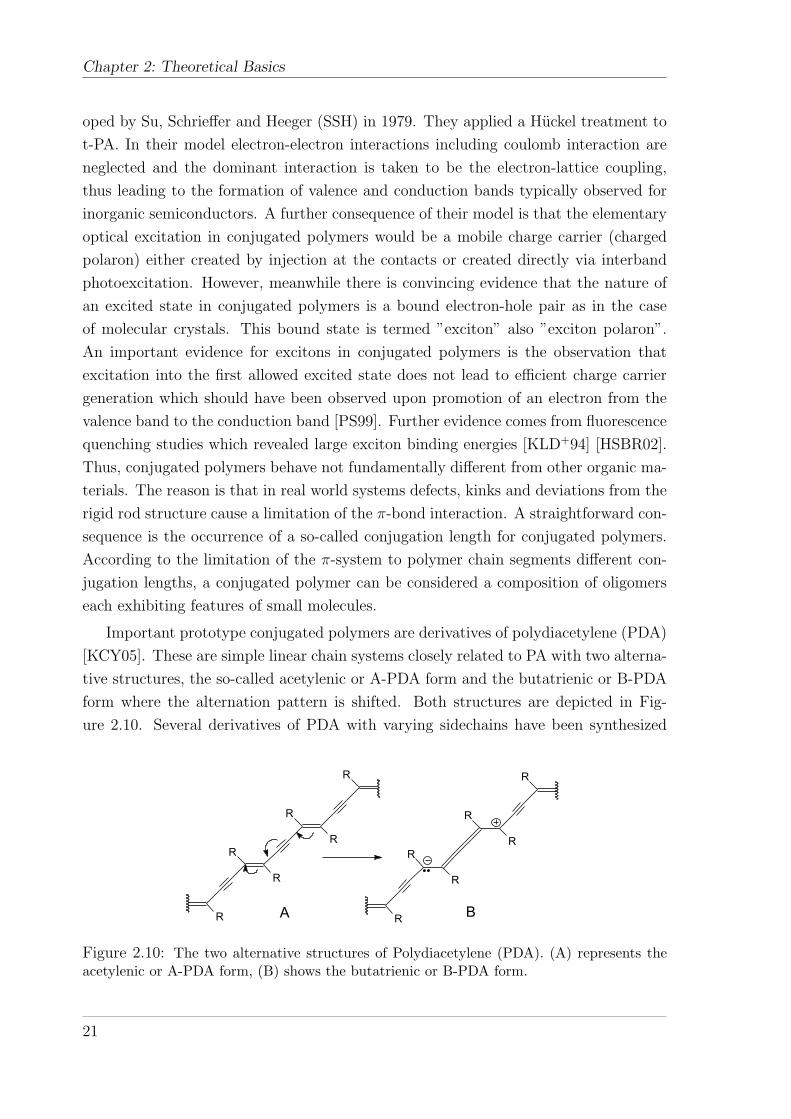
Important prototype conjugated polymers are derivatives of polydiacetylene (PDA)
[KCY05]. These are simple linear chain systems closely related to PA with two alterna-
tive structures, the so-called acetylenic or A-PDA form and the butatrienic or B-PDA
form where the alternation pattern is shifted. Both structures are depicted in Fig-
ure 2.10. Several derivatives of PDA with varying sidechains have been synthesized
R
R
R
R
R
R
R
R
R
R
R
R
A B
Figure 2.10: The two alternative structures of Polydiacetylene (PDA). (A) represents theacetylenic or A-PDA form, (B) shows the butatrienic or B-PDA form.
21

2.4. From small molecules to conjugated polymers
via topochemical polymerization and were investigated in single crystal X-ray studies.
The structures found for the PDA derivatives correspond to the acetylenic form (A)
(see for example [KCY05] and references herein). The reason is the higher stability of
the A-PDA with respect to the butatrienic form [Kar80]. This has been confirmed by
a number of theoretical studies using different calculation methods [Par77] [KKA78].
In fact the butatrienic form (B) represents one excited state (exciton) of PDA and
it is a self-trapped exciton (STE) since the movement of the exciton polaron would
require the expenditure of energy to effect the necessary bond order changes [PS99].
Since only one ground state exists for PDA and Peierls distortion is not directly ap-
plicable, PDA belongs to the class of nondegenerate ground-state polymers [CBBS86]
as most of the technologically more important polymers such as poly-p-phenylene,
poly-p-phenylene-vinylene and most other conjugated polymers. These polymers can
in principle be described by two structural isomers referred to as the ”aromatic” form
and the ”quinoid” form [KCY05]. The reality lies in between these two border case
structures which are depicted in Figure 2.11. Since the quinoid form is much higher in
Aromatic Quinoid
Figure 2.11: The two possible nondegenerate structural isomers of PPP calles aromatic andquinoid form.
energy than the aromatic structure only one ground state exists for these conjugated
polymers. The main conclusion that can be drawn from the above described scenario
is the existence of neutral bound electron-hole pairs (polaron excitons) rather than free
mobile charged polarons. The polaron excitons which can be described as quasipar-
ticles can indeed move coherently over a certain distance as very recently shown for
isolated PDA chains until the coherence is destroyed by a lattice defect [DMB+06]. In
most conjugated polymers the exciton is delocalized over a few repeat units only and
electron and hole are coloumbically bound by the exciton binding energy Eb. It may
also be delocalized over one monomer unit only. Hence, the excitons in conjugated
polymers may be described as Mott-Wannier excitons in some cases but in others as
Frenkel-excitons [Hee01] [PS99] as discussed later.
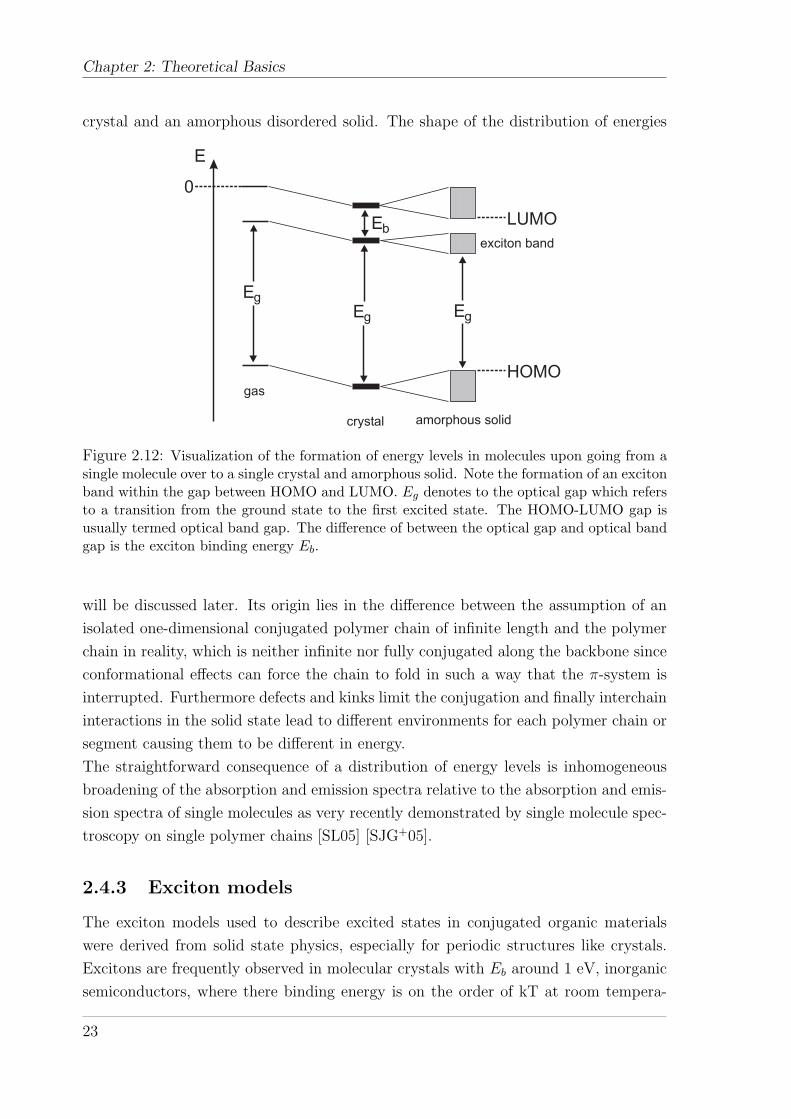
In the solid state an exciton band is created which lies in between the optical band
gap as defined by the HOMO-LUMO gap. Figure 2.12 depicts the formation of a dis-
tribution of energy levels upon going from a single molecule in the gas phase to a single
22
Chapter 2: Theoretical Basics
crystal and an amorphous disordered solid. The shape of the distribution of energies
E
Eg
Eg
EbLUMO
HOMO
Eg
exciton band
gas
crystal amorphous solid
0
Figure 2.12: Visualization of the formation of energy levels in molecules upon going from asingle molecule over to a single crystal and amorphous solid. Note the formation of an excitonband within the gap between HOMO and LUMO. Eg denotes to the optical gap which refersto a transition from the ground state to the first excited state. The HOMO-LUMO gap isusually termed optical band gap. The difference of between the optical gap and optical bandgap is the exciton binding energy Eb.
will be discussed later. Its origin lies in the difference between the assumption of an
isolated one-dimensional conjugated polymer chain of infinite length and the polymer
chain in reality, which is neither infinite nor fully conjugated along the backbone since
conformational effects can force the chain to fold in such a way that the π-system is
interrupted. Furthermore defects and kinks limit the conjugation and finally interchain
interactions in the solid state lead to different environments for each polymer chain or
segment causing them to be different in energy.
The straightforward consequence of a distribution of energy levels is inhomogeneous
broadening of the absorption and emission spectra relative to the absorption and emis-
sion spectra of single molecules as very recently demonstrated by single molecule spec-
troscopy on single polymer chains [SL05] [SJG+05].
2.4.3 Exciton models
The exciton models used to describe excited states in conjugated organic materials
were derived from solid state physics, especially for periodic structures like crystals.
Excitons are frequently observed in molecular crystals with Eb around 1 eV, inorganic
semiconductors, where there binding energy is on the order of kT at room tempera-
23

2.4. From small molecules to conjugated polymers
ture and in conjugated polymers with binding energies of around 0.5 eV. In solid state
physics an exciton is described by a wavefunction in a crystal lattice that in an extreme
case can coherently move over the coherence length lc within the lattice. The coher-
ence length is limited by defects in the crystal lattice or by interaction of the exciton
wave with lattice phonons. This is obviously not true in case of conjugated polymers
where exciton migration is an incoherent processes, i.e. a statistical hopping process
of successive individual energy transfer events between individual sites. This process
can be activated by phonons as most frequently observed for room temperature.
The different exciton models that exist reflect the different spatial separation of
the electron-hole pair within the lattice. Figure 2.13 displays the three different types
of exciton models. The Frenkel exciton was initially applied by Davydov to inter-
Figure 2.13: Presentation of the different types of excitons. (a) Small radius Frenkel-excitonin which a is small in comparison with the lattice constant aL. (b) Large radius Wannier-Mottexciton in which a is comparable to the lattice constant and (c) intermediate or charge-transferexciton. From Pope and Swenberg [PS99].
prete the optical spectra of molecular crystals. It can also be observed in crystals of
noble gases. The spatial extension of the Frenkel-exciton is not more than a single
site which means that the electron-hole-pair is located on one molecule within the
lattice. Davydov showed that a given molecular energy level splits up into as many
components as there are inequivalent molecules per unit cell. The splitting is caused
by the interaction of two adjacent molecules. For crystals, for example anthracene, the
crystal spectrum exhibits two distinct bands. The value of the splitting depends upon
the interaction between equivalent molecules. For a detailed description the reader is
referred to [PS99].
If the electron-hole pair is delocalized over several lattice constants the exciton is
referred to as Wannier-Mott exciton. This type of exciton is typically found in inor-
ganic semiconductors, where the interaction energy is great and the dielectric constant
is high, but sometimes it is discussed for conjugated polymers as well. The energy levels
24

Chapter 2: Theoretical Basics
and corresponding absorption bands can be easily calculated from modified Rydberg
levels which form a series described by
E = EG − G
n2(2.25)
with n = 1, 2, ..., and EG the energy required to ionize the solid and G the binding
energy of the exciton. The intervening medium between the electron and the hole
is treated as a dielectric continuum, whereas the hole can be considered a positively
charged atom dissolved in the solid with an interaction energy between hole and electron
of −e2/(εr) with e being the elementary charge and ε the dielectric constant of the
medium. An excellent example of a Wannier-Mott exciton state occurs in cuprous
oxide at low temperature [PS99].
Finally, in addition to neutral excitons there exist states referred to as charge-
transfer (CT) excitons, where the promoted electron is transferred to the nearest
or next-nearest neighboring molecule remaining still correlated with its parent hole
(compare Figure 2.13 (c)). These intermediate excitons can be considered distorted
Wannier-like excitons. Experimentally they are difficult to observe since optical tran-
sitions from the ground state to a CT state are extremely weak. Furthermore CT
transitions occur in the same energy range as highly allowed Frenkel exciton transi-
tions occur [SWB81].
Excitons in conjugated polymers are best described as charge-transfer excitons with
energy levels dispersed into a broad band of excited states. The exciton in a conjugated
polymer can be delocalized over several monomer units, i.e. a polymer chain segment,
or even over a single repeat unit only if a kink, defect or bond distortion interrupts
the conjugation with the following monomer unit. Hence an exciton is able to move
coherently along a polymer segment limited by the conjugation length of the segment.
To transfer to another polymer segment it has to hop by an energy transfer step which
can be, for instance, Forster transfer in the case of singlets or Dexter ET for triplets. It
follows that the exciton visits a certain number of sites during its lifetime performing a
random walk process. From experiments on energy transfer in doped organic crystals
(for instance tetracene doped into anthracene crystals) it was found that the number
of hopping events is around 105 lattice sites in molecular crystals [PS99]. The hopping
time can be derived from the ratio of the fluorescence lifetime of the matrix to the
number of hopping events. For the described molecular crystal hopping times in the
range of 100 femtoseconds were estimated. The number of sites visited by an exciton
is even larger for triplet excitons due to their considerably longer lifetime. A triplet
state can visit up to 1010 sites during its lifetime [PS99].
25

2.5. The fate of excited states
2.5 The fate of excited states
The fate of an excited state, whether it is in form of a singlet exciton or a triplet
exciton, is most important for the application of organic semiconductors in devices.
The successive processes that occur after exciton generation are exciton migration
within the density of states, exciton trapping, radiative decay as well as non-radiative
decay processes and nonlinear optical processes like bimolecular exciton annihilation.
2.5.1 Exciton migration and relaxation
The inherent limited conjugation of any conjugated polymer chain caused by kinks,
defects or bond angle distortion along the polymer backbone leads to a distribution
of conjugation lengths, therefore a distribution of energies. In fact the photophysi-
cal properties of conjugated polymers mostly reflect the properties of an ensemble of
oligomers (chromophores) of different length regarding emission spectra and excitation
dynamics. In addition to the distribution of energies, solid state interchain interaction
causes the polymer chain segments to be in different environments with their neighbor-
ing chains, thus increasing the width of the distribution of energy states. No matter
how an excited state is created, either by photogeneration or by charge carrier recom-
bination, it tends to relax to sites of lower energy by hopping between the polymer
chain segments. In this context a site denotes a segment of the polymer chain that
corresponds to a distinct exciton energy. The migration of the exciton towards sites of
lower energy can be observed as spectral diffusion of the emission in time [KLM+93]
[MLK+94] [HSP97]. Spectral diffusion occurs on a timescale of ps-ns and can be de-
tected as red-shift of the emission spectra [MHOB01a] [MHOB01b]. The underlying
process can be described as dispersive relaxation of the exciton within a density of
states (DOS) to sites which are in the lower energy tail of the DOS. The shape of the
DOS is best described by a Gaussian distribution with the width σ and the energy ε
relative to the center of the DOS [Kad91].
ρ(ε) =√
2πσ2exp−(
ε2
2σ2
)(2.26)
with a width σ of typically 50 to 100 meV in conjugated polymers. The assumption of
a Gaussian DOS is not arbitrary, it has been verified experimentally and theoretically
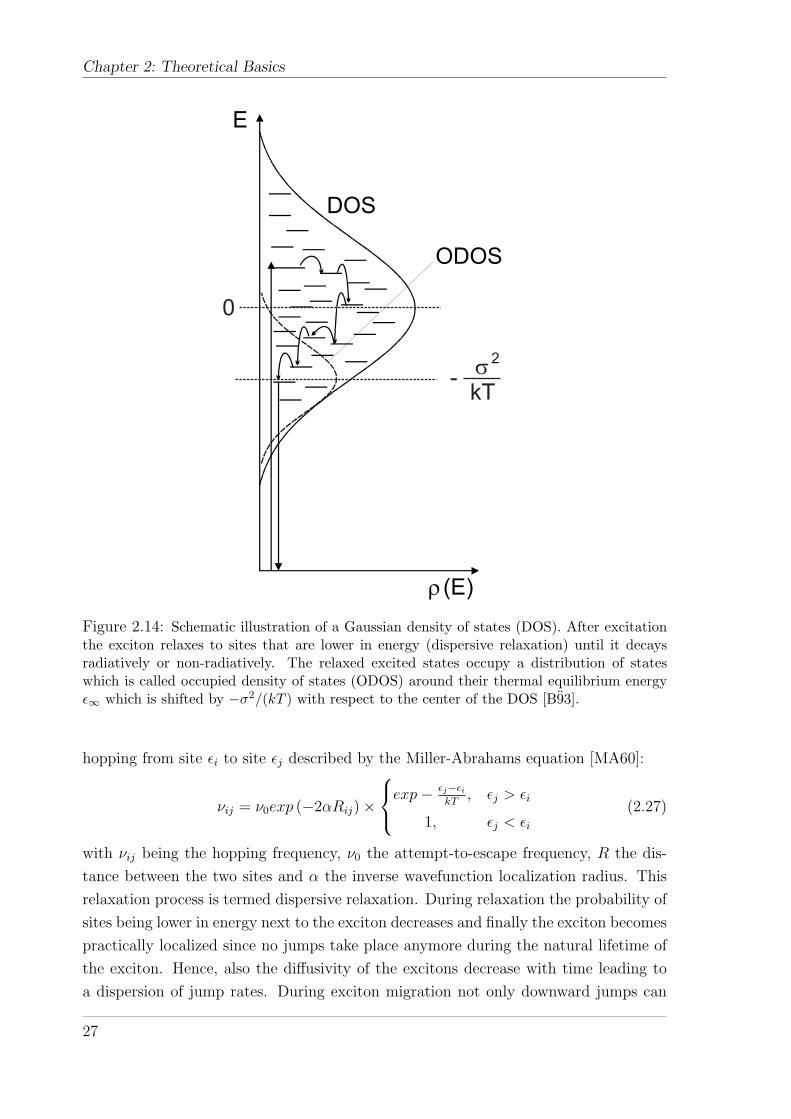
[MRG86] [RBGM88] [RBR+89]. Figure 2.14 illustrates schematically the relaxation
of an excited state within the DOS. The excited states (excitons) that are created
with arbitrary energy in the DOS relax to sites that are lower in energy until they
reach their dynamic equilibrium. The elementary step of such incoherent transport is
26
Chapter 2: Theoretical Basics
E
r (E)
DOS
ODOS
0
-kTs
2
Figure 2.14: Schematic illustration of a Gaussian density of states (DOS). After excitationthe exciton relaxes to sites that are lower in energy (dispersive relaxation) until it decaysradiatively or non-radiatively. The relaxed excited states occupy a distribution of stateswhich is called occupied density of states (ODOS) around their thermal equilibrium energyε∞ which is shifted by −σ2/(kT ) with respect to the center of the DOS [B93].
hopping from site εi to site εj described by the Miller-Abrahams equation [MA60]:
νij = ν0exp (−2αRij)×
exp− εj−εi
kT, εj > εi
1, εj < εi
(2.27)
with νij being the hopping frequency, ν0 the attempt-to-escape frequency, R the dis-
tance between the two sites and α the inverse wavefunction localization radius. This
relaxation process is termed dispersive relaxation. During relaxation the probability of
sites being lower in energy next to the exciton decreases and finally the exciton becomes
practically localized since no jumps take place anymore during the natural lifetime of
the exciton. Hence, also the diffusivity of the excitons decrease with time leading to
a dispersion of jump rates. During exciton migration not only downward jumps can
27

2.5. The fate of excited states
occur but also temperature assisted jumps to states that are higher in energy. After
relaxation the excitons occupy a distribution of sites which is called occupied density of
states (ODOS) around their thermal equilibrium energy ε∞. The center of the ODOS
is shifted by −σ2/(kT ) with respect to the center of the DOS [B93], i.e. the equilib-
rium energy of the excitons is temperature dependent. Higher temperatures result in
shifting of the ODOS towards the center of the DOS, whereas lower temperatures shift
the ODOS towards the tail of the DOS. At very low temperatures or in the case of
strong disorder the dynamic equilibrium cannot be attained anymore since ε∞ is too
far away from the center of the DOS.
Finally the exciton decays by radiative decay processes or non-radiative decay chan-
nels. Since the exciton visits many sites during its lifetime it is susceptible to get
trapped on sites that are outside the density of states and considerably lower in en-
ergy. The influence of traps is even more pronounced in case of triplet excitons due to
their much longer lifetime.
2.5.2 Exciton decay
2.5.2.1 Singlet exciton decay
The intrinsic decay of the lowest singlet excited state of a π-conjugated molecule can be
described as a first order reaction with a lifetime on the order of ns. Single exponential
decay can be observed on isolated molecules, for instance in dilute solutions or glassy
matrices of frozen solutions. It can also be observed in energy down-conversion blends
consisting for instance of a higher energy matrix and a lower energy dopant which
allows for efficient sensitization of the dopant fluorescence. At low dopant concentra-
tions (typically a few wt.%) the dopant molecules are isolated so far from each other by
the higher energy matrix molecules that energy transfer between dopant molecules is
effectively suppressed leading to fluorescence decaying with its intrinsic lifetime. Fur-
thermore copolymers with lower energy chromophores that are incorporated in low
concentrations feature single-exponential decay of the lower energy singlets.
As soon as interchain interaction comes into play, i.e. when going from isolated poly-
mer chains to the solid state, the decay usually deviates from the single-exponential
pattern. This is a straightforward consequence of intrachain and interchain energy
transfer to sites which are lower in energy. Typically one can observe very short decay
times at early times after excitation which gradually increase with time leading to a
more smooth decay pattern. Such a decay behavior can be described in terms of a
Kohlrausch-Williams-Watt analysis which describes stretched exponential decay pat-
terns with a distribution of different lifetimes of the excited states expressed by the
28

Chapter 2: Theoretical Basics
following equation
I(t) = I0 × exp
[−
(t
τ0
)β]
(2.28)
with 0 < β < 1 being a dispersion parameter. Plotting ln(I0/I(t)) versus t in a double-
logarithmic graph results in a straight line for single exponential decays with β = 1,
whereas slopes of β < 1 indicate stretched exponential behavior. In classic Forster type
donor-acceptor systems a slope of β = 1/2 can be observed. The time τ0 defines the
time when the initial intensity has dropped to 1/e. τ0 can be inferred from the ordinate
value lnI(t1/e/τ0)/I0 = 1. The increasing lifetime of the exciton is a consequence of
the relaxation process within the density of states. Employing site-selective fluores-
cence (SSF) spectroscopy [HMG+93] [Per83] [Moe88] of singlet excitons it is possible
to prove that excitation into the tail of the DOS leads to single-exponential decays
since no additional relaxation occurs during the lifetime of the excited state, whereas
excitation into upper states leads to highly non-exponential decay patterns featuring
KWW-type behavior [ILS+02].
Non single-exponential decay patterns can also be analyzed in terms of multi-exponential
decays. This implies the existence of two or more different but defined lifetimes of ex-
citons. Biexponential decay of fluorescence has been reported for polyfluorene chains
in dilute solution and was attributed to different chain conformations that exhibit
different singlet exciton lifetimes [DMSdM+03].
At high singlet exciton concentrations also bimolecular singlet-singlet-annihilation
(SSA) can occur. In this case two excited singlet states S1 collide and the energy of
both states is combined and creates one higher excited singlet state Sn and a singlet
ground state S0. SSA can be identified by plotting the integrated fluorescence intensity
as a function of the excitation intensity in double-log scale. A deviation from a linear
dependence towards a slope of m = 0.5 identifies bimolecular singlet-singlet annihila-
tion to be the major decay mechanism of singlet excited states. This occurs after a
certain threshold excitation intensity which corresponds to a threshold concentration
of excited singlet states. Taking into account monomolecular and bimolecular decay
mechanisms the singlet concentration can be expressed by
d[S]
dt= Gs − kS[S]− γS[S]2 (2.29)
where GS is the generation rate of singlets, kS is the decay rate constant for the
combined monomolecular part and γS is the bimolecular annihilation factor. γS is
time-dependent since the diffusivity of singlets decreases with time upon relaxation of
the excited states towards tail states of the DOS. This will be explained in more detail
when triplet states are discussed.
Apart from the generation of higher excited singlet states, the annihilation of two
29
2.5. The fate of excited states
singlets excitons can lead to the generation of geminate electron-hole pairs. The gem-
inate pair (GP) is a coloumbically bound electron-hole pair with the electron and hole
being located at non-nearest-neighbour sites. Their existence is known from organic
crystals. They play an important role in photophysics of organic solids [PS99], where
they can be created from autoionization of higher Franck-Condon-states. The GP is
metastable with respect to the S1 state with a much shorter lifetime, but the inherent
disorder of organic solids can greatly increase their lifetime.
The existence of geminate pairs in conjugated polymers has been experimentally proven
by the observation of thermally stimulated delayed luminescence upon photoexcitation
of the polymer at low temperatures (5 K) and successive heating which results in de-
layed luminescence from recombining charges locally trapped in tail states of the DOS
[KSV+01] [KVB+04]. Secondly, recombination of GPs leads to so-called delayed flu-
orescence (DF), which typically exhibits the same spectral position and shape as the
prompt fluorescence but its lifetime is significantly longer and can extend well into
the microsecond range at room temperature or second range at lower temperatures
[PS99]. Typically DF caused by geminate-pair recombination exhibits a power law
decay IDF (t) ∝ t−1 and a strong electric field dependence as shown on MeLPPP and
PhPPV [SASB99] [GB02]. Field-quenching experiments can also disentangle the origin
of DF and separate GP recombination from triplet-triplet-annihilation (TTA) which
is the major origin of DF in organic crystals [PS99] as will be discussed in the next
section.
Finally, singlet-excited states can be deactivated by non-radiative but monomolecular
processes. One example is internal conversion (IC) of the singlet excited state to vi-
bronically higher excited levels of the singlet ground state and successive vibrational
relaxation to the ground state. Another process is intersystem crossing to the triplet
manifold and successive nonradiative relaxation of the triplet state.
2.5.2.2 Triplet exciton decay
A triplet state T1 of an organic molecule is usually populated via intersystem crossing
(ISC) from the first singlet excited state S1. ISC requires a change of the total spin
which is a forbidden process due to the spin-selection rule. Spin-orbit coupling partially
allows the transition from S1 to T1 but it is typically weak for pure hydrocarbon mole-
cules. Furthermore the wavefunctions of the singlet excited state and triplet excited
state have to overlap to enable ISC, therefore ISC is more efficient if the two states
are close in energy, but typical singlet to triplet gaps are on the order of ∆ST ≈ 0.7eV
for conjugated polymers [WCAM+01] and ∆ST ≈ 1.0eV for small organic molecules
[PS99]. Since the ISC rate kISC decreases exponentially with the energy gap, the proba-
bility for ISC is rather low in conjugated organic materials. The ISC rate can be greatly
30

Chapter 2: Theoretical Basics
enhanced by the incorporation of heavy-metal atoms which lead to strong spin-orbit
coupling. Often platinum (Pt), palladium (Pd) or iridium (Ir) atoms are employed
in which iridium-based emitters play the most important role in device applications
due to their short radiative triplet lifetime, which greatly enhances the quantum yield.
Spin-orbit coupling can also be enhanced by the presence of n → π∗ transitions, such
as in benzophenone.
The existence of triplet states in organic molecules and conjugated polymers is
a signature of electron-electron correlation effects and it further proves that conju-
gated polymers do not behave fundamentally different from organic crystals where
triplet states are a ubiquitous feature. Mostly the generation and decay of triplets
in conjugated polymers has been studied via indirect techniques like transient photo-
induced triplet-triplet absorption (PIA) [CBF+90] [GEP+97] [WGLV99] [LKN+01] and
optically detected magnetic resonance (ODMR) [DRSF97] [LFV00]. Furthermore, de-
layed fluorescence (DF) can be caused by bimolecular annihilation of two triplet states.
Therefore, studies of DF can unravel triplet decay and transport mechanisms [PFU+99]
[RGS+99]. Unfortunately, no information about the energy of the triplet state, the
shape of the emission spectrum and the radiative decay times can be deduced from
experiments on DF. A powerful technique to estimate the triplet energy are pulse-
radiolysis-induced energy-transfer experiments in benzene solution containing the poly-
mer and a triplet sensitizer [MBH+01] [MBH+00] [MBHN01]. Upon irradiation with
a strong electron pulse, triplet states in benzene are populated. Appropriate triplet
sensitizers successively transfer the benzene triplet to the polymer where it can be de-
tected by PIA measurements of the triplet absorption. A sensitizer with a lower triplet
energy than the polymer will not sensitize the triplet of the polymer and no triplet-
triplet absorption can be detected. Since the triplet level of the sensitizer is known,
the triplet energy of the polymer can be estimated. Pulse radiolysis experiments on
different conjugated polymers showed that the triplet energy can be estimated from
the singlet energy by the empirical formula T1 = 1.13S1 − 1.43(±0.25)[eV ] [MBH+01].
Triplet states can in principle be detected by delayed time-resolved spectroscopy if
a fraction of the triplet excited states decays via the radiative channel, i.e. via phos-
phorescence. Phosphorescence is red-shifted with respect to the fluorescence since the
T1 state is lower in energy but it exhibits the same vibrational structure and splitting.
Gated time-resolved spectroscopy not only proves the existence of triplets but also en-
ables studies of the decay mechanisms, lifetimes and energy transfer processes. The first
observation of phosphorescence of conjugated polymers was reported by Romanovskii
et al. [RGS+00] on the ladder-type polymer MeLPPP which exhibits a triplet energy
of 2.08 eV in thin solid films at 80 K. This is in good agreement with the value of 2.15
eV [MBH+00] obtained from pulse-radiolysis experiments in benzene solution, tak-
31

2.5. The fate of excited states
ing into account the different experimental conditions. Successively phosphorescence
was reported for a similar phenyl-substituted ladder-type PPP (Ph-LPPP) [LCM02]
[RSP+03], although contaminated with covalently bound Pd, and for other PPP-
type polymers, such as dodecyloxy-poly(p-phenylene) (DDO-PPP) [HSN+01], poly-
2,8-indenofluorene (PIF) [HBGS01], poly(2,7-(9,9-bis(2-ethylhexyl)fluorene)) (PF2/6)
[RGSM01]. All the above mentioned polymers exhibit similar singlet-triplet gaps
∆ST ≈ 0.6 − 0.75eV . This is further supported by phosphorescence measurements
on a series of Pt-containing conjugated polymers, which exhibit greatly improved effi-
ciencies of phosphorescence due to enhanced spin-orbit coupling [KWF+02] [CKF+99]
[WKF+00] [CKF+98]. Sensitized phosphorescence was reported for a soluble phenyl-
substituted PPV derivative upon doping the material with the phosphorescent dye
platinum-octaethylporphyrin (PtOEP) [LIKB03]. Efficient energy transfer from the
dopant triplet (1.9 eV) to the matrix polymer was found due to the lower triplet
level of the substituted PPV, which successively exhibited phosphorescence at 1.63 eV.
Phosphorescence was observed either on excitation of the matrix polymer itself or on
excitation of the dopant but it could not be observed in the non-doped material. The
reason is that the majority of triplets decays via the non-radiative decay channel which
increases exponentially with decreasing triplet energy as expressed by the energy-gap
law [WCAM+01] [PS99] [Sie67] [EJ70]
knr ∝ exp−γ∆E
hωM
(2.30)
where knr is the rate constant of the non-radiative decay channel, γ a molecular para-
meter, ∆E the energy between the triplet excited state T1 and the singlet ground state
S0 and ωM the dominant vibrational frequency of the system.
Before beginning a discussion of the triplet kinetics in conjugated polymers it is
useful to recall briefly the scenario in molecular crystals [PS99]. A triplet state that
is created via intersystem crossing from the singlet manifold after optical excitation
can decay via a monomolecular channel, which includes radiative decay, i.e. phos-
phorescence and non-radiative decay. Furthermore triplets can decay via bimolecular
triplet-triplet-annihilation which leads to singlet excited states that decay via delayed
fluorescence. Hence, the rate equation for the triplet concentration [T ] can be expressed
as:dT
dt= GT − β0[T ]− γTTA[T ]2 (2.31)
with GT being the generation rate of triplets, β0 the sum of the monomolecular decay
channels (β0 = knr + kr = 1/τphos) and γTTA the bimolecular annihilation constant.
Equation 2.31 neglects all losses due to triplet quenching by impurities.
Two border cases have to be distinguished for the decay of triplet states, namely
the low excitation density regime and the high excitation density regime. In the former
32
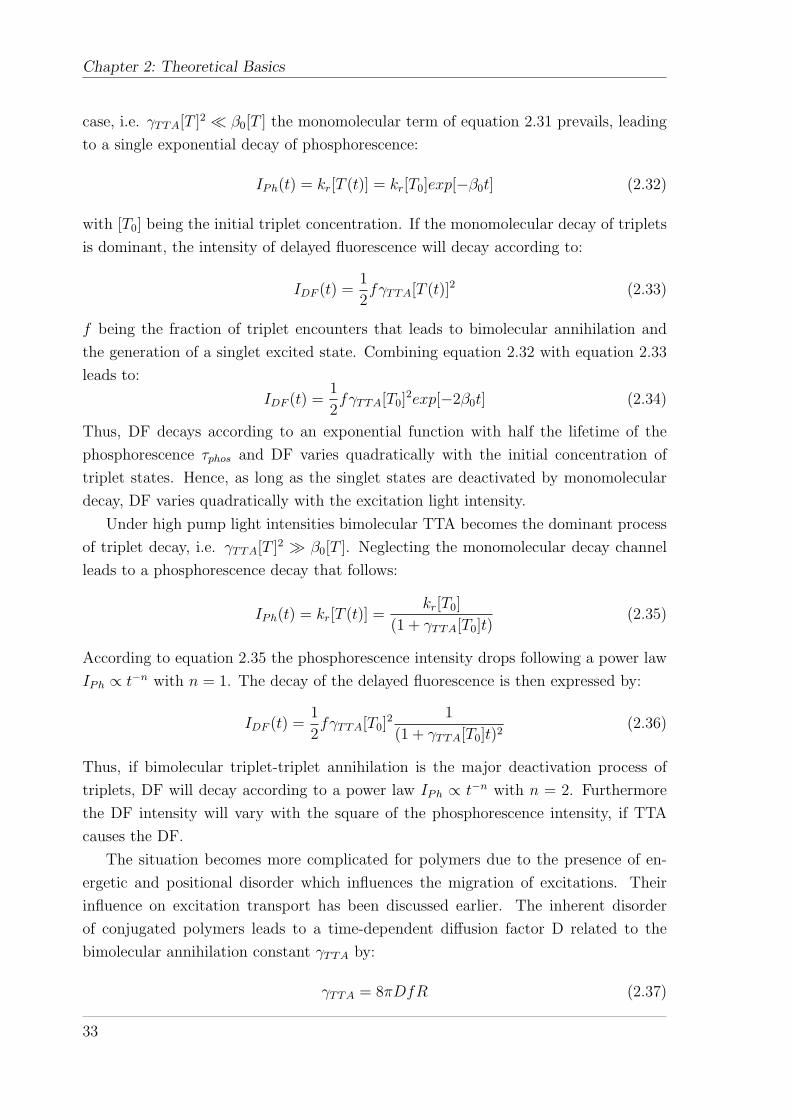
Chapter 2: Theoretical Basics
case, i.e. γTTA[T ]2 ¿ β0[T ] the monomolecular term of equation 2.31 prevails, leading
to a single exponential decay of phosphorescence:
IPh(t) = kr[T (t)] = kr[T0]exp[−β0t] (2.32)
with [T0] being the initial triplet concentration. If the monomolecular decay of triplets
is dominant, the intensity of delayed fluorescence will decay according to:
IDF (t) =1
2fγTTA[T (t)]2 (2.33)
f being the fraction of triplet encounters that leads to bimolecular annihilation and
the generation of a singlet excited state. Combining equation 2.32 with equation 2.33
leads to:
IDF (t) =1
2fγTTA[T0]
2exp[−2β0t] (2.34)
Thus, DF decays according to an exponential function with half the lifetime of the
phosphorescence τphos and DF varies quadratically with the initial concentration of
triplet states. Hence, as long as the singlet states are deactivated by monomolecular
decay, DF varies quadratically with the excitation light intensity.
Under high pump light intensities bimolecular TTA becomes the dominant process
of triplet decay, i.e. γTTA[T ]2 À β0[T ]. Neglecting the monomolecular decay channel
leads to a phosphorescence decay that follows:
IPh(t) = kr[T (t)] =kr[T0]
(1 + γTTA[T0]t)(2.35)
According to equation 2.35 the phosphorescence intensity drops following a power law
IPh ∝ t−n with n = 1. The decay of the delayed fluorescence is then expressed by:
IDF (t) =1
2fγTTA[T0]
2 1
(1 + γTTA[T0]t)2(2.36)
Thus, if bimolecular triplet-triplet annihilation is the major deactivation process of
triplets, DF will decay according to a power law IPh ∝ t−n with n = 2. Furthermore
the DF intensity will vary with the square of the phosphorescence intensity, if TTA
causes the DF.
The situation becomes more complicated for polymers due to the presence of en-
ergetic and positional disorder which influences the migration of excitations. Their
influence on excitation transport has been discussed earlier. The inherent disorder
of conjugated polymers leads to a time-dependent diffusion factor D related to the
bimolecular annihilation constant γTTA by:
γTTA = 8πDfR (2.37)
33
2.5. The fate of excited states
with R being the interaction distance and f the fraction of triplet encounters leading
to a generation of singlets. The time-dependency of D leads to a time-dependent
annihilation factor which is related to the hopping frequency ν(t) by
D(t) ∝ γTTA(t) ∝ ν(t) ∝ 1
tln(ν0t)(2.38)
In the long time limit equation 2.38 can be approximated by γTTA ∝ t1.04 as exper-
imentally verified on a polyfluorene derivative [RM03]. Here the DF and the triplet
concentration were monitored as a function of time and temperature to investigate the
influence of dispersion on TTA. The consequence of the dispersion of γTTA is a power
law decay of the DF with IDF ∝ t−1 as long as triplet states are not thermally equili-
brated with a turnover to IDF ∝ t−2 if the triplets reached their dynamic equilibrium.
The time dependence of the delayed fluorescence decay does not allow one to exclusively
assign the origin of DF to annihilation of two triplets since DF caused by the delayed
recombination of geminate pairs can also decay according to an algebraic law as shown
by Monte Carlo simulations [RB87]. In the short time range the recombination rate
obeys a ∝ n−1.3 law since those geminate pairs that are generated at favorable hopping
sites recombine quickly whereas in the long time limit the exponent changes to n = -1
since the remaining GPs relax towards metastable tail states of the DOS from which
escape is kinetically impeded. Thus, it is not possible to unravel the origin of DF by its
decay kinetics without measuring an excitation intensity dependence and the response
of the DF on an external electric field since geminate pairs are more liable to dissociate
in the electric field than singlet or triplet excitons.
34

Chapter 3
Photophysical properties of bluelight emitting polyspirobifluorenehomo- and copolymers
The following chapter gives a brief introduction to light-emitting polymers, especially
to the most important classes of conjugated polymers which were investigated in the
present work. After the introduction a closer look to the mechanical properties of the
spirobifluorene homopolymer is taken in form of a dielectric spectroscopy study which
was jointly carried out with Prof. Floudas (University Ioannina, Greece). Furthermore
the morphology of the homopolymer was analyzed by TEM, AFM and polarization
optical microscopy (POM). A discussion of the experiments and results on the spec-
troscopical properties such as fluorescence, delayed fluorescence and phosphorescence
energies, lifetimes and decay channels both in solid state as well as in solution follows for
the spirobifluorene homopolymer. Successively the results for copolymers containing a
triarylamine derivative, carbazole or anthracene are presented.
3.1 Introduction - Light-emitting polymers
3.1.1 Poly-phenylene-vinylene (PPV) derivatives
The phenomenon of electroluminescence (EL) of organic materials, i.e. the generation
of light via injection and recombination of charge carriers, has been known since the
’60ies [Dre69]. Helfrich and Schneider reported in 1965 the first observation of EL from
anthracene single crystals upon applying up to 100 V driving voltage [HS65]. But it
was not before 1987 that a group from Kodak reported on the first preparation of an
organic light emitting diode (OLED) made from small molecules [TvS87]. The first
observation of electroluminescence from conjugated polymers was reported by the re-
search group of Prof. Sir Richard Friend (University of Cambridge, UK) in 1989 for
35
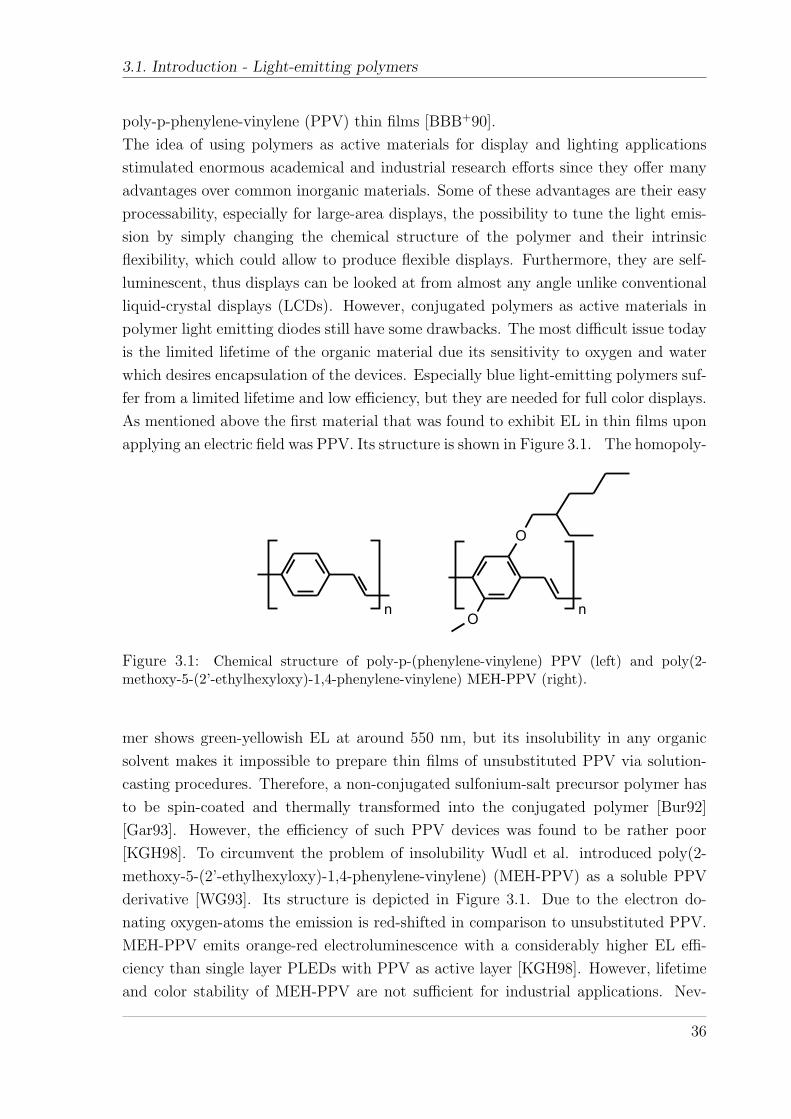
3.1. Introduction - Light-emitting polymers
poly-p-phenylene-vinylene (PPV) thin films [BBB+90].
The idea of using polymers as active materials for display and lighting applications
stimulated enormous academical and industrial research efforts since they offer many
advantages over common inorganic materials. Some of these advantages are their easy
processability, especially for large-area displays, the possibility to tune the light emis-
sion by simply changing the chemical structure of the polymer and their intrinsic
flexibility, which could allow to produce flexible displays. Furthermore, they are self-
luminescent, thus displays can be looked at from almost any angle unlike conventional
liquid-crystal displays (LCDs). However, conjugated polymers as active materials in
polymer light emitting diodes still have some drawbacks. The most difficult issue today
is the limited lifetime of the organic material due its sensitivity to oxygen and water
which desires encapsulation of the devices. Especially blue light-emitting polymers suf-
fer from a limited lifetime and low efficiency, but they are needed for full color displays.
As mentioned above the first material that was found to exhibit EL in thin films upon
applying an electric field was PPV. Its structure is shown in Figure 3.1. The homopoly-
nO
O
n
Figure 3.1: Chemical structure of poly-p-(phenylene-vinylene) PPV (left) and poly(2-methoxy-5-(2’-ethylhexyloxy)-1,4-phenylene-vinylene) MEH-PPV (right).
mer shows green-yellowish EL at around 550 nm, but its insolubility in any organic
solvent makes it impossible to prepare thin films of unsubstituted PPV via solution-
casting procedures. Therefore, a non-conjugated sulfonium-salt precursor polymer has
to be spin-coated and thermally transformed into the conjugated polymer [Bur92]
[Gar93]. However, the efficiency of such PPV devices was found to be rather poor
[KGH98]. To circumvent the problem of insolubility Wudl et al. introduced poly(2-
methoxy-5-(2’-ethylhexyloxy)-1,4-phenylene-vinylene) (MEH-PPV) as a soluble PPV
derivative [WG93]. Its structure is depicted in Figure 3.1. Due to the electron do-
nating oxygen-atoms the emission is red-shifted in comparison to unsubstituted PPV.
MEH-PPV emits orange-red electroluminescence with a considerably higher EL effi-
ciency than single layer PLEDs with PPV as active layer [KGH98]. However, lifetime
and color stability of MEH-PPV are not sufficient for industrial applications. Nev-
36
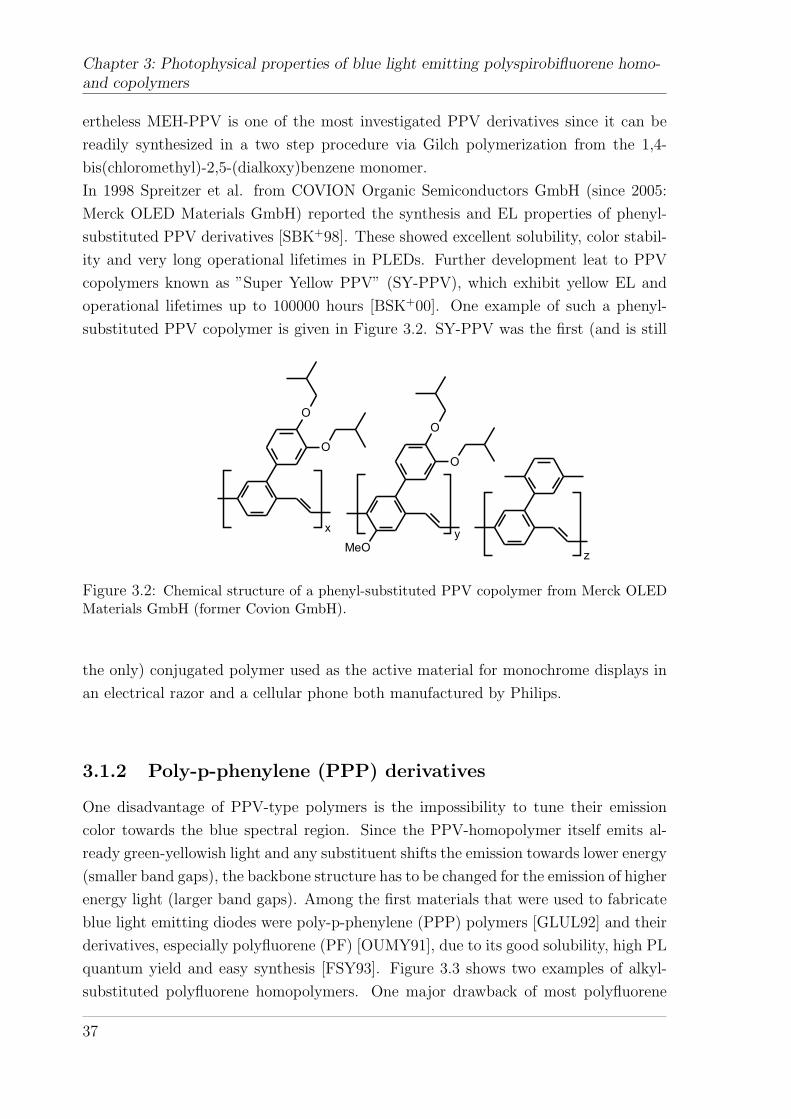
Chapter 3: Photophysical properties of blue light emitting polyspirobifluorene homo-and copolymers
ertheless MEH-PPV is one of the most investigated PPV derivatives since it can be
readily synthesized in a two step procedure via Gilch polymerization from the 1,4-
bis(chloromethyl)-2,5-(dialkoxy)benzene monomer.
In 1998 Spreitzer et al. from COVION Organic Semiconductors GmbH (since 2005:
Merck OLED Materials GmbH) reported the synthesis and EL properties of phenyl-
substituted PPV derivatives [SBK+98]. These showed excellent solubility, color stabil-
ity and very long operational lifetimes in PLEDs. Further development leat to PPV
copolymers known as ”Super Yellow PPV” (SY-PPV), which exhibit yellow EL and
operational lifetimes up to 100000 hours [BSK+00]. One example of such a phenyl-
substituted PPV copolymer is given in Figure 3.2. SY-PPV was the first (and is still
O
O
O
O
MeO
xy
z
Figure 3.2: Chemical structure of a phenyl-substituted PPV copolymer from Merck OLEDMaterials GmbH (former Covion GmbH).
the only) conjugated polymer used as the active material for monochrome displays in
an electrical razor and a cellular phone both manufactured by Philips.
3.1.2 Poly-p-phenylene (PPP) derivatives
One disadvantage of PPV-type polymers is the impossibility to tune their emission
color towards the blue spectral region. Since the PPV-homopolymer itself emits al-
ready green-yellowish light and any substituent shifts the emission towards lower energy
(smaller band gaps), the backbone structure has to be changed for the emission of higher
energy light (larger band gaps). Among the first materials that were used to fabricate
blue light emitting diodes were poly-p-phenylene (PPP) polymers [GLUL92] and their
derivatives, especially polyfluorene (PF) [OUMY91], due to its good solubility, high PL
quantum yield and easy synthesis [FSY93]. Figure 3.3 shows two examples of alkyl-
substituted polyfluorene homopolymers. One major drawback of most polyfluorene
37
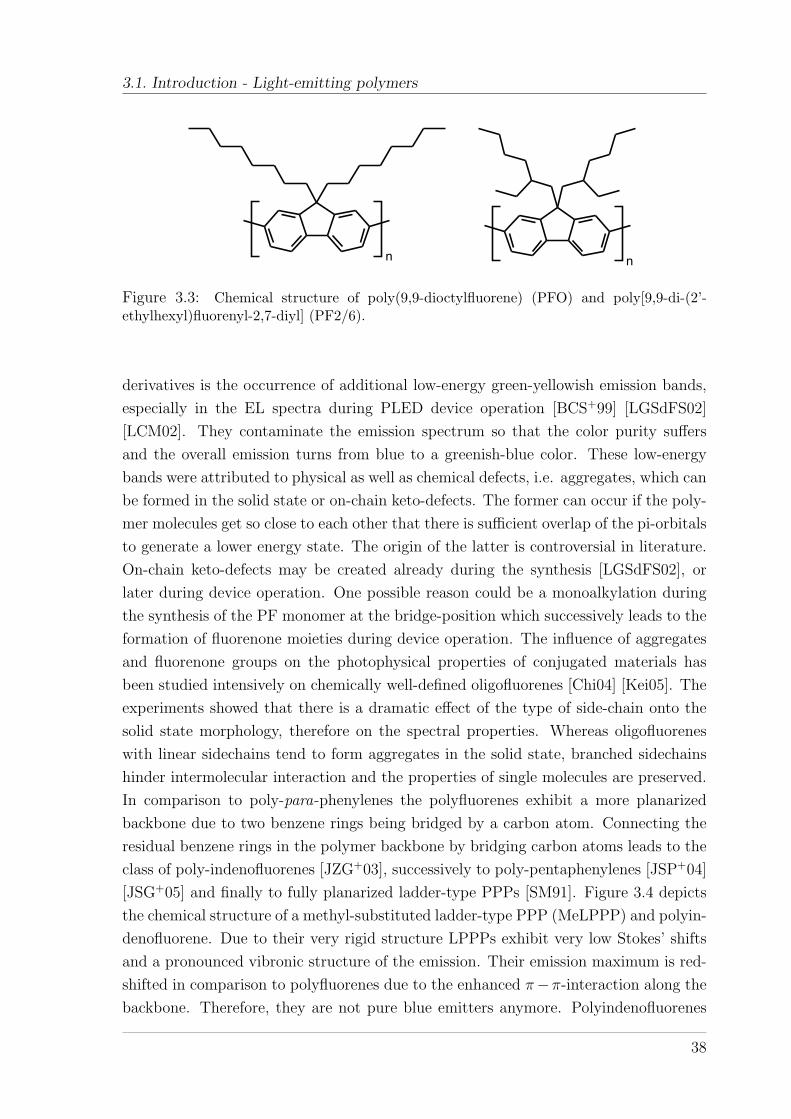
3.1. Introduction - Light-emitting polymers
n n
Figure 3.3: Chemical structure of poly(9,9-dioctylfluorene) (PFO) and poly[9,9-di-(2’-ethylhexyl)fluorenyl-2,7-diyl] (PF2/6).
derivatives is the occurrence of additional low-energy green-yellowish emission bands,
especially in the EL spectra during PLED device operation [BCS+99] [LGSdFS02]
[LCM02]. They contaminate the emission spectrum so that the color purity suffers
and the overall emission turns from blue to a greenish-blue color. These low-energy
bands were attributed to physical as well as chemical defects, i.e. aggregates, which can
be formed in the solid state or on-chain keto-defects. The former can occur if the poly-
mer molecules get so close to each other that there is sufficient overlap of the pi-orbitals
to generate a lower energy state. The origin of the latter is controversial in literature.
On-chain keto-defects may be created already during the synthesis [LGSdFS02], or
later during device operation. One possible reason could be a monoalkylation during
the synthesis of the PF monomer at the bridge-position which successively leads to the
formation of fluorenone moieties during device operation. The influence of aggregates
and fluorenone groups on the photophysical properties of conjugated materials has
been studied intensively on chemically well-defined oligofluorenes [Chi04] [Kei05]. The
experiments showed that there is a dramatic effect of the type of side-chain onto the
solid state morphology, therefore on the spectral properties. Whereas oligofluorenes
with linear sidechains tend to form aggregates in the solid state, branched sidechains
hinder intermolecular interaction and the properties of single molecules are preserved.
In comparison to poly-para-phenylenes the polyfluorenes exhibit a more planarized
backbone due to two benzene rings being bridged by a carbon atom. Connecting the
residual benzene rings in the polymer backbone by bridging carbon atoms leads to the
class of poly-indenofluorenes [JZG+03], successively to poly-pentaphenylenes [JSP+04]
[JSG+05] and finally to fully planarized ladder-type PPPs [SM91]. Figure 3.4 depicts
the chemical structure of a methyl-substituted ladder-type PPP (MeLPPP) and polyin-
denofluorene. Due to their very rigid structure LPPPs exhibit very low Stokes’ shifts
and a pronounced vibronic structure of the emission. Their emission maximum is red-
shifted in comparison to polyfluorenes due to the enhanced π−π-interaction along the
backbone. Therefore, they are not pure blue emitters anymore. Polyindenofluorenes
38

Chapter 3: Photophysical properties of blue light emitting polyspirobifluorene homo-and copolymers
RR
R R n
R
R
R
n
(R = n-C10H21)
R = alkyl, aryl-alkyl
Figure 3.4: Chemical structure of Poly(indenofluorene) (left) and methyl-substituted ladder-type PPP (MeLPPP) (right).
are intermediate in structure between PFs and LPPPs. Their emission is red-shifted
in comparison to PFs but blue-shifted with respect to LPPPs. Hence, they are promis-
ing materials for PLED applications, since their emission maximum is shifted into a
wavelength region where the eye is more sensitive but the overall emission is still blue.
The synthesis, EL and PL properties have recently been reported by J. Jacob et. al
from the research group of Prof. Mullen (MPIP Mainz) [JZG+03]. A study of their
photophysical properties has recently been reported by Keivanidis et al [KJO+05]. It
was found that aryl-substitution at the bridgehead carbon-atom greatly improves the
spectral stability of the polymer in comparison to alkyl-substituted derivatives. It was
suggested that the way of synthesis has a great influence onto the photophysical prop-
erties of the polymer since the formation of keto-defects can be avoided by a proper
synthetic route.
3.1.3 Polyspirobifluorene polymers: Towards a stable blue
The concept of linking two fluorene units at their bridgehead carbon atom to create
a so called spiro-linked molecule was reintroduced by Salbeck et al. in 1998 in order
to increase the glass transition temperature of certain fluorophores [SWB98]. Mean-
while, spiro-linked small molecules were successfully applied in organic light emitting
devices [SSS+00] [VBB+01], organic solar cells (OSC) [KPGM02] and optically pumped
organic lasers [SRR+05]. Polymers based on spirobifluorene attracted significant indus-
trial interest and are currently developed by the Merck OLED Materials GmbH (former
Covion GmbH). Their synthesis has been described elsewhere [BTS+03]. Figure 3.5
shows the chemical structure of an alkoxy-substituted spirobifluorene homopolymer.
They exhibit excellent solubility due to the bulky solubilizing sidegroup in combina-
39

3.1. Introduction - Light-emitting polymers
O
OO
O
n
Figure 3.5: Chemical structure of an alkoxy-substituted spirobifluorene (PSBF) homopoly-mer.
tion with short branched alkoxy-substituents. Furthermore, the glass transition tem-
perature of spirobifluorene polymers (Tg ∼ 240 C) is considerably higher than that
of polyfluorene, where a glass transition temperature of Tg ∼ 64C was extrapolated
from DSC measurements and dielectric spectroscopy measurements on oligofluorenes
and which shows a clear melting point [GKL+99] already at Tm ∼ 160C whereabove
it exists in a nematic liquid crystal state [NMM+00a]. The increased Tg greatly stabi-
lizes the amorphous glassy state of PSBF polymers. Most important PSBF polymers
are stable blue emitters due to the double aryl-substitution at the bridgehead car-
bon atom which prevents oxidation to fluorenone moieties as also shown on fully ary-
lated Poly(indenofluorene) [JZG+03] and Poly(pentaphenylene) [JSG+05] by the group
of Prof. Mullen. Therefore, spirobifluorene polymers and fully-arylated polyfluorene
derivatives in general are promising candidates for blue light emitting diodes, down-
conversion blend systems and in copolymers with additional emitters for multicolor or
white PLEDs.
40

Chapter 3: Photophysical properties of blue light emitting polyspirobifluorene homo-and copolymers
3.2 A dielectric spectroscopy study on a spirobiflu-
orene homopolymer
3.2.1 Dielectric spectroscopy data
The spirobifluorene homopolymer was investigated using dielectric relaxation spec-
troscopy to get a deeper insight into the molecular dynamics of spiropolymers, espe-
cially the glass transition and sidechain relaxation. The dielectric spectroscopy mea-
surements were jointly carried out with the help of Prof. Floudas (University Ioannina,
Greece).
Dielectric relaxation spectroscopy measures the response of a dielectric medium to elec-
tromagnetic waves in a simple capacitor setup in the frequency region of 10−6−1012 Hz.
Here molecular dynamics and collective dipolar fluctuations take place such as glass
transitions, charge transport and polarization effects at inner and outer boundaries.
The interpretation of DRS measurements by certain models allows to determine the
type of molecular relaxation processes and its onset temperature, for instance. Further-
more conduction of intrinsic charge carriers can be investigated as well as movement
of extrinsic charged species such as ionic impurities.
Figure 3.6 depicts the dielectric permittivity ε′ and dielectric loss ε′′ of the polyspirob-
ifluorene homopolymer as a function of the applied frequency for a selection of sample
temperatures. The results indicate four different processes that are active in the spirob-
10-2 10-1 100 101 102 103 104 105 106 107 108 109
10-4
10-3
10-2
10-1
100
101
1234567891011121314151617181920212223242526272829303132333435363738394041424344454647 ABCDEFGHIJKLMNOPQRSTUVWXYZAAABACADAEAFAGAHAIAJAKALAMANAOAPAQARASATAU abcdefghijklmnopqrstuvwxyzaaabacadaeafagahaiajakalamanaoapaqarasatau
123456789
101112131415161718192021222324252627282930313233
343536
37
3839
4041
42
43
44
4546
47
ABCDEFGHI
JKLMNOPQRSTUVWXYZAAABACADAEAF
AGAH
AIAJ
AK
AL
AM
AN
AO
AP
AQ
AR
AS
AT
AU
abcdefghi
jklmnopqrstuv
wxyzaa
abac
adae
afag
ahai
aj
ak
al
am
anao
ap
aq
ar
as
at
au
T113.15er T133.15er T153.15er T173.15er T193.15er T213.15er T233.15er T253.15er T273.15er T293.15er T313.15er T333.15er T353.15er T373.15er T393.15er T413.15er
1 T433.15erA T453.15era T473.15er
T493.15er T513.15er''
'
' and
''
f (Hz)
(a) Dielectric permittivity ε′ and loss ε′′
data.
10-2 10-1 100 101 102 103 104 105 106 107 10810-16
10-12
10-8
10-4
12
34
56
78
910
1112
1314
1516
1718
1920
2122
2324
2526
2728
2930
31
3233
343536
37
38
39
41
4243
4445
4647
AB
CD
EF
GH
IJ
KL
MN
OP
QR
ST
UV
WX
YZ
AAAB
AC
ADAEAF
AG
AH
AIAJ
AK
AL
AO
AP
AQASAT
AU
ab
cd
ef
gh
ij
kl
mn
op
qr
st
uv
wx
yz
aaab
acad
aeaf
ag
ahai
al
am
anap
aq
ar
as
at
12
34
567
8910
1112
1314
1516
1718
1920
2122
2324
2526
2728
29303132333435363738394041424344454647
AB
CD
EF
GH
IJK
LM
NO
PQ
RS
TU
VWX
YZAAABACADAEAFAGAHAIAJAKALAMANAOAPAQARASATAU
ab
cd
ef
gh
ijk
lm
no
pq
rs
tuv
wx
yzaaabacadaeafagahaiajakalamanaoapaqarasatau
12
34
56
78
910
1112
1314
1516
1718
1920
2122
2324
2526
2728
2930
3132
3334
3536
3738
3940
4142
4344
4546
47
AB
CD
EF
GH
IJ
KL
MN
OP
QR
ST
UV
WX
YZ
AAAB
ACAD
AEAF
AGAH
AIAJ
AKAL
AMAN
AOAP
AQAR
ASAT
AU
ab
cd
ef
gh
ij
kl
mn
op
qr
st
uv
wx
yz
aaab
acad
aeaf
agah
aiaj
akal
aman
aoap
aqar
asat
au
12
34
56
78
910
1112
1314
1516
1718
1920
2122
2324
2526
2728
2930
3132
3334
3536
3738
3940
4142
4344
4546
47
AB
CD
EF
GH
IJ
KL
MN
OP
QR
ST
UV
WX
YZ
AAAB
ACAD
AEAF
AGAH
AIAJ
AKAL
AMAN
AOAP
AQAR
ASAT
AU
ab
cd
ef
gh
ij
kl
mn
op
qr
st
uv
wx
yz
aaab
acad
aeaf
agah
aiaj
akal
aman
aoap
aqar
asat
au
slope:1''
'
','' (
Sm
-1)
f (Hz)
T113.15sr T323.15sr T123.15sr T333.15sr T133.15sr T343.15sr T143.15sr T353.15sr T153.15sr T363.15sr T163.15sr T373.15sr T173.15sr T383.15sr T183.15sr T393.15sr T193.15sr T403.15sr T203.15sr T413.15sr T213.15sr T423.15sr T223.15sr T433.15sr T233.15sr T443.15sr T243.15sr 1 T453.15sr T253.15sr A T463.15sr T263.15sr a T473.15sr
1 T273.15sr T483.15srA T283.15sr T493.15sra T293.15sr T503.15sr
T303.15sr T513.15sr T313.15sr T523.15sr
(b) Real σ′ and imaginary σ′′ parts of the con-ductivity.
Figure 3.6: Dielectric permittivity ε′ and loss data ε′′ (a) and real σ′ and imaginary σ′′ partsof the conductivity (b) measured over the T-range: 113-523 K. Two processes are active atlow temperatures (called δ- and γ-), two very weak processes at intermediate temperatures(called β- and α-) and ionic mobility at higher temperatures.
41
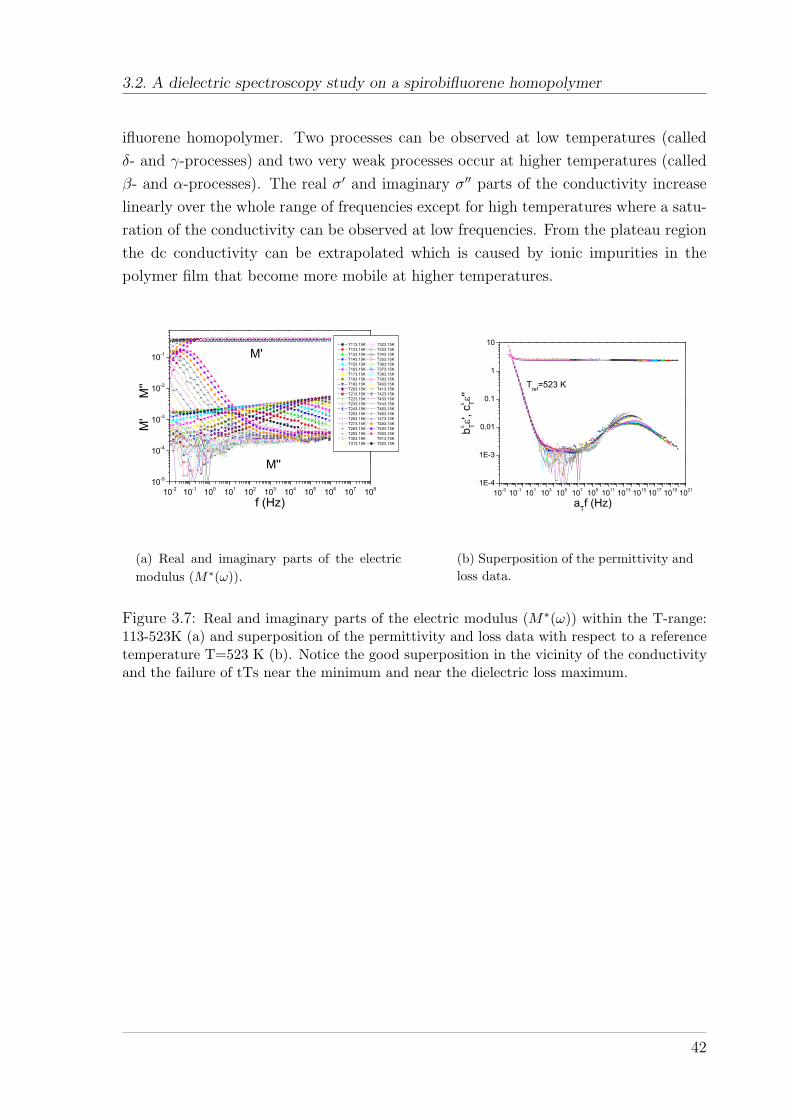
3.2. A dielectric spectroscopy study on a spirobifluorene homopolymer
ifluorene homopolymer. Two processes can be observed at low temperatures (called
δ- and γ-processes) and two very weak processes occur at higher temperatures (called
β- and α-processes). The real σ′ and imaginary σ′′ parts of the conductivity increase
linearly over the whole range of frequencies except for high temperatures where a satu-
ration of the conductivity can be observed at low frequencies. From the plateau region
the dc conductivity can be extrapolated which is caused by ionic impurities in the
polymer film that become more mobile at higher temperatures.
10-2 10-1 100 101 102 103 104 105 106 107 10810-5
10-4
10-3
10-2
10-1
1234567891011121314151617181920212223242526272829303132333435363738394041424344454647 ABCDEFGHIJKLMNOPQRSTUVWXYZAAABACADAEAFAGAHAIAJAKALAMANAOAPAQARASATAU abcdefghijklmnopqrstuvwxyzaaabacadaeafagahaiajakalamanaoapaqarasatau 1234567891011121314151617181920212223242526272829303132333435363738394041424344454647ABCDEFGHIJKLMNOPQRSTUVWXYZAAABACADAEAFAGAHAIAJAKALAMANAOAPAQARASAT
AU
abcdefghijklmnopqrstuvwxyzaaabacadaeafagahaiajakalamanaoapaqaras
at
au
12
34
56
78
91011121314151617181920212223242526
2728293031
3233
3435
36
37
38
3941
4243
4445
46
47
AB
CD
EF
GHIJ
KLMNOPQRSTUVWXYZAAABAC
ADAE
AF
AG
AH
AI
AJ
AK
AL
AO
AP
AQ
ASAT
AU
ab
cd
ef
ghij
klmnopqrstuvwxy
zaaabac
adaeafag
ahai
al
am
an
ap
aq
ar
as
at
123456
789
1011121314151617181920212223242526272829
3031
32
33
34
35
3637
38
39
40
4142
43
44
45
4647
ABCDEFGHI
JKLMNOPQRSTUV
WXYZAA
ABAC
ADAE
AF
AG
AH
AI
AJ
AK
AL
AM
ANAO
AP
AQ
ARAS
ATAU
abcdefghi
jklmnopqrstu
vwxyzaa
abac
adae
af
ag
ah
ai
aj
ak
al
am
an
ao
ap
aqar
asatau
M''
M'
M'
M
''
f (Hz)
T113.15K T323.15K T123.15K T333.15K T133.15K T343.15K T143.15K T353.15K T153.15K T363.15K T163.15K T373.15K T173.15K T383.15K T183.15K T393.15K T193.15K T403.15K T203.15K T413.15K T213.15K T423.15K T223.15K T433.15K T233.15K T443.15K T243.15K 1 T453.15K T253.15K A T463.15K T263.15K a T473.15K
1 T273.15K T483.15KA T283.15K T493.15Ka T293.15K T503.15K
T303.15K T513.15K T313.15K T523.15K
(a) Real and imaginary parts of the electricmodulus (M∗(ω)).
10-3 10-1 101 103 105 107 109 1011 1013 1015 1017 1019 10211E-4
1E-3
0.01
0.1
1
10
1234567891011121314151617181920212223242526272829303132333435363738394041424344454647 ABCDEFGHIJKLMNOPQRSTUVWXYZAAABACADAEAFAGAHAIAJAKALAMANAOAPAQARASATAU abcdefghijklmnopqrstuvwxyzaaabacadaeafagahaiajakalamanaoapaqarasatau 1234567891011121314151617181920212223242526272829303132333435363738394041424344454647 ABCDEFGHIJKLMNOPQRSTUVWXYZAAABACADAEAFAGAHAIAJAKALAMANAOAPAQARASATAU abcdefghijklmnopqrstuvwxyzaaabacadaeafagahaiajakalamanaoapaqarasatau
12
34
56
78
910
1112
1314
151617
181920212223242526
2728
2930
31
32
3334
35
36
38
39
40
41
42
43
44
45
4647
AB
CD
EF
GH
IJ
KL
MN
OPQRSTUVWX
YZAA
ABACAD
AE
AFAGAH
AI
AK
AL
AMAN
AO
AP
AQ
AS
AT
AU
ab
c
de
f
gh
ijk
lm
nopqrstu
vwxyzaaab
acadae
afag
ahai
aj
ak
al
amao
apaq
aras
at
au
123456
789
1011121314151617181920212223
242526272829303132
33
34
35
3637
38
39
40
41
42
43
44
45
46
47
ABCDE
FGHI
JKLMNO
PQRSTU
VWXYZAA
ABACADAE
AFAG
AH
AI
AJ
AK
AL
AM
AN
AO
AP
AQ
AR
AS
AT
AU
abcdef
ghi
jklmnopqrstuvw
xyzaa
abac
adae
af
ag
ah
ai
aj
ak
al
am
an
aoap
aq
ar
as
at
au
Tref=523 K
b T',
c T''
aTf (Hz)
(b) Superposition of the permittivity andloss data.
Figure 3.7: Real and imaginary parts of the electric modulus (M∗(ω)) within the T-range:113-523K (a) and superposition of the permittivity and loss data with respect to a referencetemperature T=523 K (b). Notice the good superposition in the vicinity of the conductivityand the failure of tTs near the minimum and near the dielectric loss maximum.
42
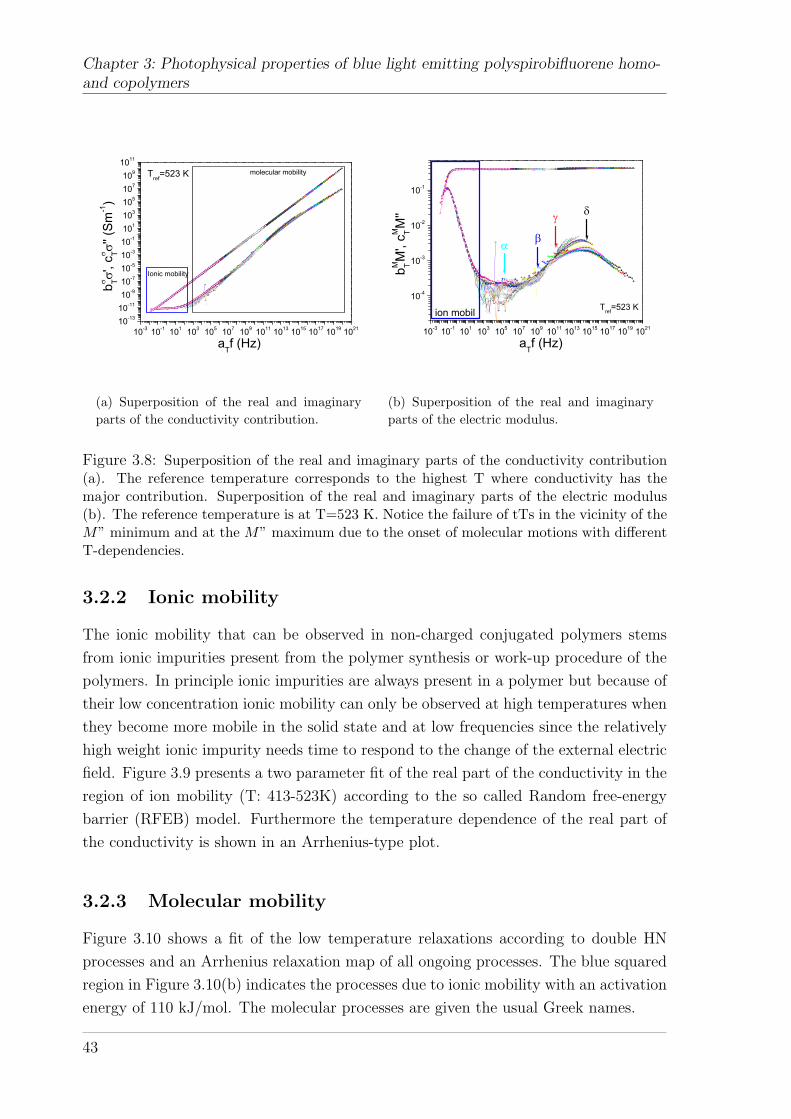
Chapter 3: Photophysical properties of blue light emitting polyspirobifluorene homo-and copolymers
10-3 10-1 101 103 105 107 109 1011 1013 1015 1017 1019 102110-13
10-11
10-9
10-7
10-5
10-3
10-1
101
103
105
107
109
1011
12
34
56
78
910
1112
1314
1516
1718
1920
2122
2324
2526
2728
2930
3132
3334
3536
3738
394041
4344
45
4647
AB
CD
EF
GH
IJ
KL
MN
OP
QR
ST
UVW
XY
ZAAAB
ACADAE
AFAG
AHAI
AJAK
ALAMAN
AO
AP
AR
ASATAU
ab
cd
ef
gh
ij
kl
mn
op
qr
st
uv
wx
yz
aaabac
adaeaf
agahai
ajak
alamanaoapaq
arasat
au
12
34
567
891011
1213
1415
1617
181920
21222324
252627
28293031
32333435363738394041424344454647
AB
CD
EFG
HIJK
LM
NO
PQ
RSTU
VWX
YZAAABAC
ADAEAFAGAHAIAJAKALAMANAOAPAQARASATAU
ab
cd
efg
hijk
lm
no
pq
rs
tu
vwx
yzaaabacadaeafagahaiajakalamanaoapaqarasatau
12
34
56
78
910
1112
1314
1516
1718
1920
2122
2324
2526
2728
2930
3132
3334
3536
3738
3940
4142
4344
4546
47
AB
CD
EF
GH
IJ
KL
MN
OP
QR
ST
UV
WX
YZ
AAAB
ACAD
AEAF
AGAH
AIAJ
AKAL
AMAN
AOAP
AQAR
ASAT
AU
ab
cd
ef
gh
ij
kl
mn
op
qr
st
uv
wx
yz
aaab
acad
aeaf
agah
aiaj
akal
aman
aoap
aqar
asat
au
12
34
56
78
910
1112
1314
1516
1718
1920
2122
2324
2526
2728
2930
3132
3334
3536
3738
3940
4142
4344
4546
47
AB
CD
EF
GH
IJ
KL
MN
OP
QR
ST
UV
WX
YZ
AAAB
ACAD
AEAF
AGAH
AIAJ
AKAL
AMAN
AOAP
AQAR
ASAT
AU
ab
cd
ef
gh
ij
kl
mn
op
qr
st
uv
wx
yz
aaab
acad
aeaf
agah
aiaj
akal
aman
aoap
aqar
asat
au
molecular mobility
Ionic mobility
Tref=523 K
b T',
c T'' (
Sm
-1)
aTf (Hz)
(a) Superposition of the real and imaginaryparts of the conductivity contribution.
10-3 10-1 101 103 105 107 109 1011 1013 1015 1017 1019 1021
10-4
10-3
10-2
10-1
1234567891011121314151617181920212223242526272829303132333435363738394041424344454647 ABCDEFGHIJKLMNOPQRSTUVWXYZAAABACADAEAFAGAHAIAJAKALAMANAOAPAQARASATAU abcdefghijklmnopqrstuvwxyzaaabacadaeafagahaiajakalamanaoapaqarasatau 1234567891011121314151617181920212223242526272829303132333435363738394041424344454647 ABCDEFGHIJKLMNOPQRSTUVWXYZAAABACADAEAFAGAHAIAJAKALAMANAOAPAQARASATAUabcdefghijklmnopqrstuvwxyzaaabacadaeafagahaiajakalamanaoapaqarasat
au
12
34
56
7
89
10
1112
1314
1516
1718192021
22232425
2627282930
313233
34
3536
37
38
39
40
41
43
44
45
4647
AB
C
D
EF
G
HIJ
KL
MN
OP
QRSTUV
WX
YZ
AAAB
ACAD
AE
AFAG
AHAI
AJ
AKAL
AMANAO
AP
AR
AS
AT
AU
a
b
c
d
ef
g
hij
kl
mn
opqr
stuvwxyzaaab
acad
ae
af
ag
ah
aiaj
akalam
anao
ap
aqar
as
at
au
123456
789
101112131415
161718192021222324252627282930
3132
33
34
35
3637
38
39
40
41
42
43
44
45
46
47
ABCDE
FGH
I
JKLMNO
PQRST
UV
WXYZAA
ABACADAE
AFAG
AH
AI
AJ
AK
AL
AM
AN
AO
AP
AQ
AR
AS
AT
AU
abcde
fgh
i
jklmnopqrstuvw
xyzaa
abac
ad
aeaf
ag
ah
ai
aj
ak
al
am
an
aoap
aq
ar
as
at
au
ion mobil Tref=523 K
bM TM
', cM T
M''
aTf (Hz)
(b) Superposition of the real and imaginaryparts of the electric modulus.
Figure 3.8: Superposition of the real and imaginary parts of the conductivity contribution(a). The reference temperature corresponds to the highest T where conductivity has themajor contribution. Superposition of the real and imaginary parts of the electric modulus(b). The reference temperature is at T=523 K. Notice the failure of tTs in the vicinity of theM” minimum and at the M” maximum due to the onset of molecular motions with differentT-dependencies.
3.2.2 Ionic mobility
The ionic mobility that can be observed in non-charged conjugated polymers stems
from ionic impurities present from the polymer synthesis or work-up procedure of the
polymers. In principle ionic impurities are always present in a polymer but because of
their low concentration ionic mobility can only be observed at high temperatures when
they become more mobile in the solid state and at low frequencies since the relatively
high weight ionic impurity needs time to respond to the change of the external electric
field. Figure 3.9 presents a two parameter fit of the real part of the conductivity in the
region of ion mobility (T: 413-523K) according to the so called Random free-energy
barrier (RFEB) model. Furthermore the temperature dependence of the real part of
the conductivity is shown in an Arrhenius-type plot.
3.2.3 Molecular mobility
Figure 3.10 shows a fit of the low temperature relaxations according to double HN
processes and an Arrhenius relaxation map of all ongoing processes. The blue squared
region in Figure 3.10(b) indicates the processes due to ionic mobility with an activation
energy of 110 kJ/mol. The molecular processes are given the usual Greek names.
43

3.2. A dielectric spectroscopy study on a spirobifluorene homopolymer
10-2 10-1 100 101 102 10310-12
10-11
10-10
10-9
10-8
413 K 423 K 433 K 443 K 453 K 463 K 473 K 483 K 493 K 503 K 513 K 523 K
413K < T < 523 K
Tref=523 K
b T
', c T
'' (S
m-1)
aTf (Hz)
(a) Two-parameter fit (σdc, τmax) of the realpart of the conductivity.
1.8 1.9 2.0 2.1 2.2 2.3 2.4 2.5
-14
-13
-12
-11
-10 dc
log(fMmax-10) log(fMx-10)
dc= 0exp(-E/kT)E=1.10 eV=110 kJ/mol
log(
dc/(
m-1))
1000/T (K-1)
(b) Temperature dependence of σ′dc.
Figure 3.9: (a) Two-parameter fit (σdc, τmax) of the real part of the conductivity, in theregion of ion mobility, based on the RFEB model. Notice that simultaneous fit of σ′′ with thesame parameters as for σ′ (green line) is not possible meaning that the model is inadequateto predict the exact σ∗ dependence. Nevertheless, σdc can be obtained from the extrapolationto low frequencies. (b) Temperature dependence of σ′dc as obtained from the fit to σ′ of theRFEB model or from the low-frequency extrapolation.
10-2 10-1 100 101 102 103 104 105 106-3.0
-2.5
-2.0
-1.5
T=173.15 K
2=0.134
2=0.394
2=1max2 =2.10x10⁻⁵
1=0.090
1=0.317
1=1max1 =2.64x10⁻³
log(
'')
f (Hz)
(a) Fit of the low-T relaxations.
2 3 4 5 6 7 8-2
0
2
4
6
8
ion mobility230 K
110 kJ/mol
max
M''max
''min
50 kJ/mol
30 kJ/mol
-log(
max
/s)
1000/T (K-1)
(b) Arrhenius relaxation map.
Figure 3.10: (a) Representative fit of the low-T relaxations with double HN processes. TheHN parameters are shown in the inset. (b) Arrhenius relaxation map of all processes observedin DS (further explanation see text).
44
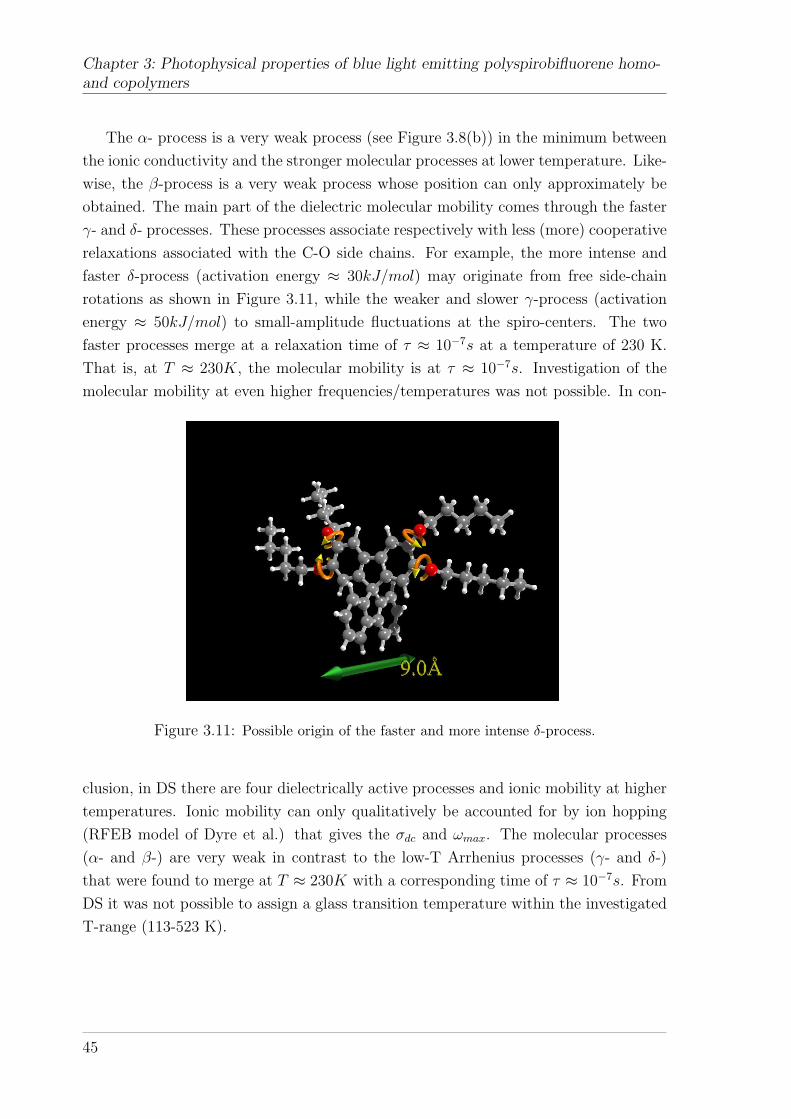
Chapter 3: Photophysical properties of blue light emitting polyspirobifluorene homo-and copolymers
The α- process is a very weak process (see Figure 3.8(b)) in the minimum between
the ionic conductivity and the stronger molecular processes at lower temperature. Like-
wise, the β-process is a very weak process whose position can only approximately be
obtained. The main part of the dielectric molecular mobility comes through the faster
γ- and δ- processes. These processes associate respectively with less (more) cooperative
relaxations associated with the C-O side chains. For example, the more intense and
faster δ-process (activation energy ≈ 30kJ/mol) may originate from free side-chain
rotations as shown in Figure 3.11, while the weaker and slower γ-process (activation
energy ≈ 50kJ/mol) to small-amplitude fluctuations at the spiro-centers. The two
faster processes merge at a relaxation time of τ ≈ 10−7s at a temperature of 230 K.
That is, at T ≈ 230K, the molecular mobility is at τ ≈ 10−7s. Investigation of the
molecular mobility at even higher frequencies/temperatures was not possible. In con-
Figure 3.11: Possible origin of the faster and more intense δ-process.
clusion, in DS there are four dielectrically active processes and ionic mobility at higher
temperatures. Ionic mobility can only qualitatively be accounted for by ion hopping
(RFEB model of Dyre et al.) that gives the σdc and ωmax. The molecular processes
(α- and β-) are very weak in contrast to the low-T Arrhenius processes (γ- and δ-)
that were found to merge at T ≈ 230K with a corresponding time of τ ≈ 10−7s. From
DS it was not possible to assign a glass transition temperature within the investigated
T-range (113-523 K).
45
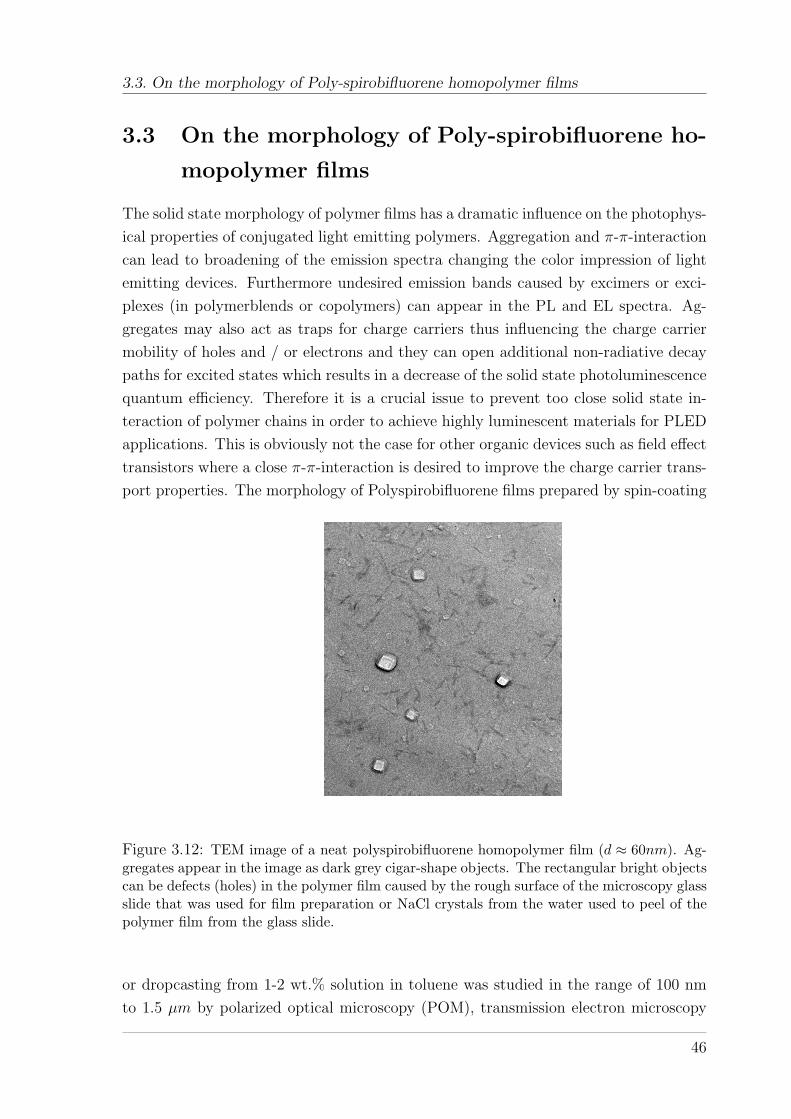
3.3. On the morphology of Poly-spirobifluorene homopolymer films
3.3 On the morphology of Poly-spirobifluorene ho-
mopolymer films
The solid state morphology of polymer films has a dramatic influence on the photophys-
ical properties of conjugated light emitting polymers. Aggregation and π-π-interaction
can lead to broadening of the emission spectra changing the color impression of light
emitting devices. Furthermore undesired emission bands caused by excimers or exci-
plexes (in polymerblends or copolymers) can appear in the PL and EL spectra. Ag-
gregates may also act as traps for charge carriers thus influencing the charge carrier
mobility of holes and / or electrons and they can open additional non-radiative decay
paths for excited states which results in a decrease of the solid state photoluminescence
quantum efficiency. Therefore it is a crucial issue to prevent too close solid state in-
teraction of polymer chains in order to achieve highly luminescent materials for PLED
applications. This is obviously not the case for other organic devices such as field effect
transistors where a close π-π-interaction is desired to improve the charge carrier trans-
port properties. The morphology of Polyspirobifluorene films prepared by spin-coating
Figure 3.12: TEM image of a neat polyspirobifluorene homopolymer film (d ≈ 60nm). Ag-gregates appear in the image as dark grey cigar-shape objects. The rectangular bright objectscan be defects (holes) in the polymer film caused by the rough surface of the microscopy glassslide that was used for film preparation or NaCl crystals from the water used to peel of thepolymer film from the glass slide.
or dropcasting from 1-2 wt.% solution in toluene was studied in the range of 100 nm
to 1.5 µm by polarized optical microscopy (POM), transmission electron microscopy
46

Chapter 3: Photophysical properties of blue light emitting polyspirobifluorene homo-and copolymers
(TEM) and atomic force microscopy (AFM). Optical microscopy employing crossed
polarizers showed independent of sample preparation no textures which could indicate
liquid crystalline behavior or preferred orientation of polymer chains leading to bire-
fringence. Measurements were performed up to 300 C in a dry nitrogen atmosphere.
An electron microscopy image of a polyspirobifluorene film is shown in Figure 3.12.
The image shows the amorphous polymer film as light grey background covered with
dark gray cigar-shape objects. Further investigation of the dark gray areas indicated
that these are caused by aggregates which probably have a higher density of polymer
chains and stick out of the polymer surface. The small rectangular objects that can
be observed in the TEM image within the thin polymer are of different origin. The
larger ones can simply be holes in the polymer film or NaCl crystals from the water
used to peel of the polymer film from the glass substrate whereas the smaller ones are
depressions caused by the rough surface of the microscopy glass slide that was used
to prepare the polymer film. This was verified on an uncovered glass slide by AFM
which showed equally shaped objects on top of the glass surface which could neither
be removed by cleaning the slides in an ultrasonic bath nor by mechanical wiping.
Investigation of PSBF homopolymer films of different thickness by AFM confirmed the
observation of cigar-shape aggregates that contaminate the polymer film. Figure 3.13
shows an AFM scanning image of a thin (d ≈ 60nm) PSBF polymer film spin-coated
from 1 wt.% toluene solution. The aggregates have a length of up to several 100 nm
Figure 3.13: AFM image (1µm × 1µm) of a neat polyspirobifluorene homopolymer film(d ≈ 60nm). The left image shows the topography information whereas the right imageshows the phase information. Both images prove the existence of cigar-shape aggregates thatcontaminate the polymer film.
47
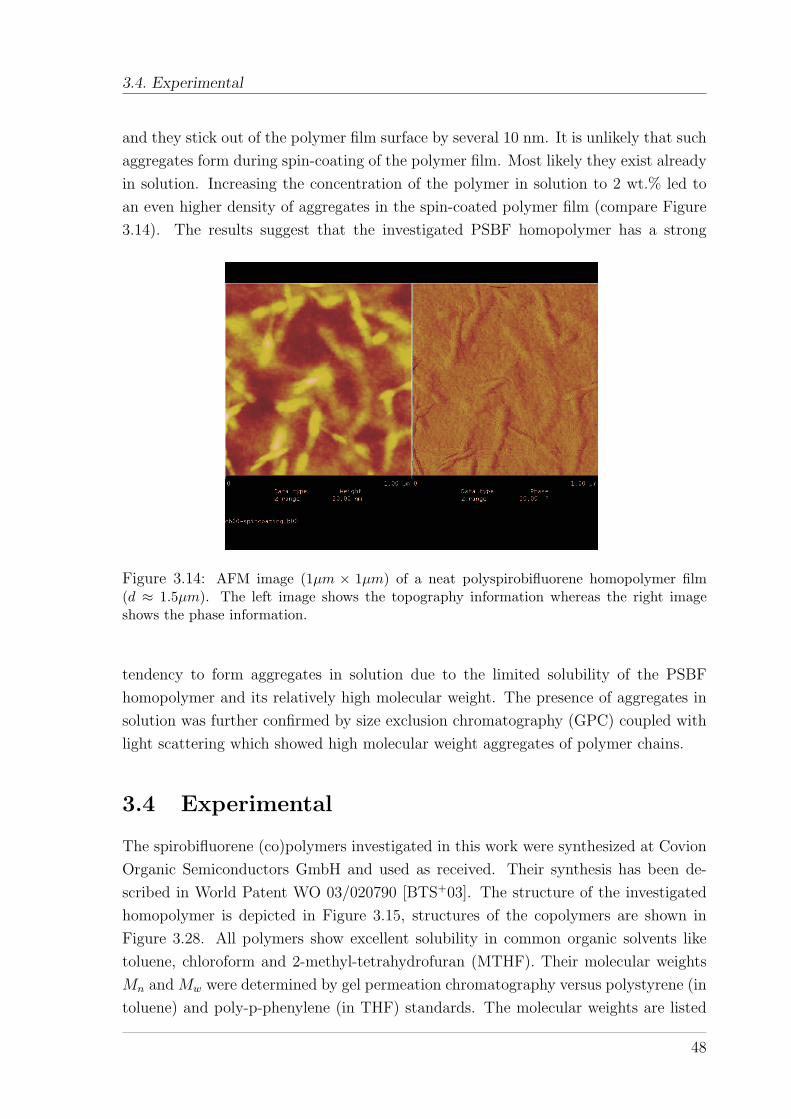
3.4. Experimental
and they stick out of the polymer film surface by several 10 nm. It is unlikely that such
aggregates form during spin-coating of the polymer film. Most likely they exist already
in solution. Increasing the concentration of the polymer in solution to 2 wt.% led to
an even higher density of aggregates in the spin-coated polymer film (compare Figure
3.14). The results suggest that the investigated PSBF homopolymer has a strong
Figure 3.14: AFM image (1µm × 1µm) of a neat polyspirobifluorene homopolymer film(d ≈ 1.5µm). The left image shows the topography information whereas the right imageshows the phase information.
tendency to form aggregates in solution due to the limited solubility of the PSBF
homopolymer and its relatively high molecular weight. The presence of aggregates in
solution was further confirmed by size exclusion chromatography (GPC) coupled with
light scattering which showed high molecular weight aggregates of polymer chains.
3.4 Experimental
The spirobifluorene (co)polymers investigated in this work were synthesized at Covion
Organic Semiconductors GmbH and used as received. Their synthesis has been de-
scribed in World Patent WO 03/020790 [BTS+03]. The structure of the investigated
homopolymer is depicted in Figure 3.15, structures of the copolymers are shown in
Figure 3.28. All polymers show excellent solubility in common organic solvents like
toluene, chloroform and 2-methyl-tetrahydrofuran (MTHF). Their molecular weights
Mn and Mw were determined by gel permeation chromatography versus polystyrene (in
toluene) and poly-p-phenylene (in THF) standards. The molecular weights are listed
48
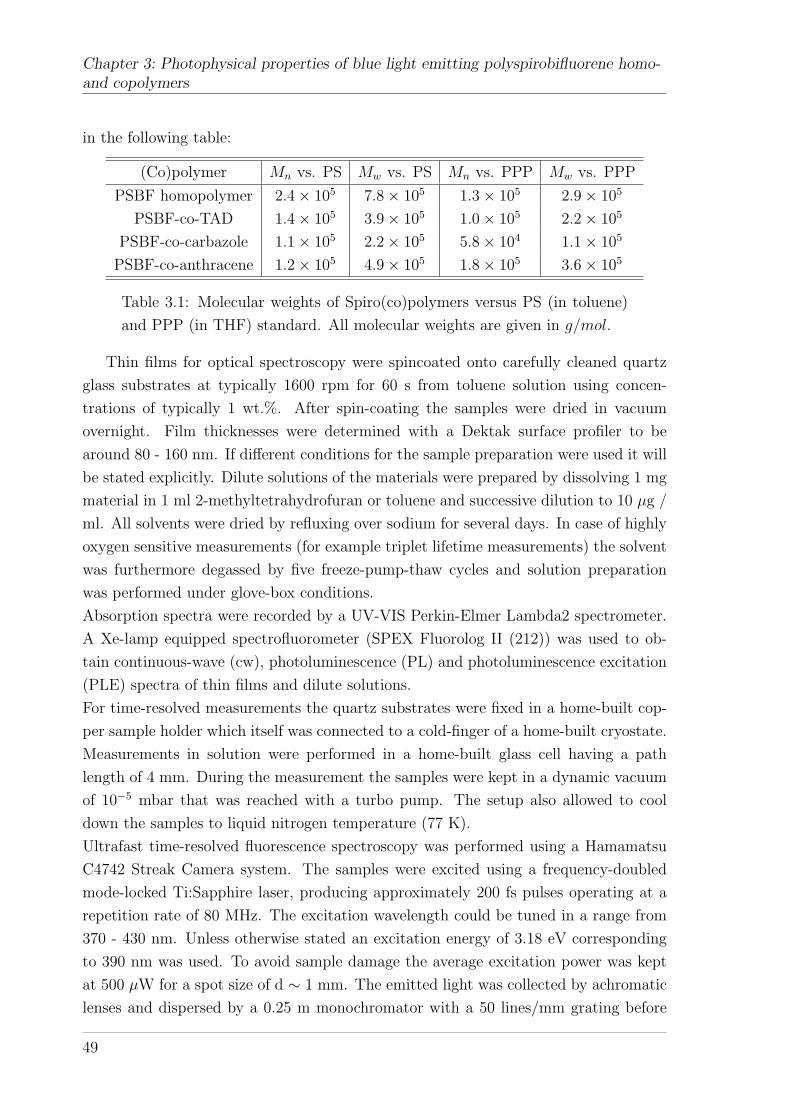
Chapter 3: Photophysical properties of blue light emitting polyspirobifluorene homo-and copolymers
in the following table:
(Co)polymer Mn vs. PS Mw vs. PS Mn vs. PPP Mw vs. PPP
PSBF homopolymer 2.4× 10⁵ 7.8× 10⁵ 1.3× 10⁵ 2.9× 10⁵
PSBF-co-TAD 1.4× 10⁵ 3.9× 10⁵ 1.0× 10⁵ 2.2× 10⁵
PSBF-co-carbazole 1.1× 10⁵ 2.2× 10⁵ 5.8× 10⁴ 1.1× 10⁵
PSBF-co-anthracene 1.2× 10⁵ 4.9× 10⁵ 1.8× 10⁵ 3.6× 10⁵
Table 3.1: Molecular weights of Spiro(co)polymers versus PS (in toluene)
and PPP (in THF) standard. All molecular weights are given in g/mol.
Thin films for optical spectroscopy were spincoated onto carefully cleaned quartz
glass substrates at typically 1600 rpm for 60 s from toluene solution using concen-
trations of typically 1 wt.%. After spin-coating the samples were dried in vacuum
overnight. Film thicknesses were determined with a Dektak surface profiler to be
around 80 - 160 nm. If different conditions for the sample preparation were used it will
be stated explicitly. Dilute solutions of the materials were prepared by dissolving 1 mg
material in 1 ml 2-methyltetrahydrofuran or toluene and successive dilution to 10 µg /
ml. All solvents were dried by refluxing over sodium for several days. In case of highly
oxygen sensitive measurements (for example triplet lifetime measurements) the solvent
was furthermore degassed by five freeze-pump-thaw cycles and solution preparation
was performed under glove-box conditions.
Absorption spectra were recorded by a UV-VIS Perkin-Elmer Lambda2 spectrometer.
A Xe-lamp equipped spectrofluorometer (SPEX Fluorolog II (212)) was used to ob-
tain continuous-wave (cw), photoluminescence (PL) and photoluminescence excitation
(PLE) spectra of thin films and dilute solutions.
For time-resolved measurements the quartz substrates were fixed in a home-built cop-
per sample holder which itself was connected to a cold-finger of a home-built cryostate.
Measurements in solution were performed in a home-built glass cell having a path
length of 4 mm. During the measurement the samples were kept in a dynamic vacuum
of 10−5 mbar that was reached with a turbo pump. The setup also allowed to cool
down the samples to liquid nitrogen temperature (77 K).
Ultrafast time-resolved fluorescence spectroscopy was performed using a Hamamatsu
C4742 Streak Camera system. The samples were excited using a frequency-doubled
mode-locked Ti:Sapphire laser, producing approximately 200 fs pulses operating at a
repetition rate of 80 MHz. The excitation wavelength could be tuned in a range from
370 - 430 nm. Unless otherwise stated an excitation energy of 3.18 eV corresponding
to 390 nm was used. To avoid sample damage the average excitation power was kept
at 500 µW for a spot size of d ∼ 1 mm. The emitted light was collected by achromatic
lenses and dispersed by a 0.25 m monochromator with a 50 lines/mm grating before
49

3.4. Experimental
detection with the Streak Camera.
Delayed spectroscopy on thin films and solutions was performed by exciting the sam-
ples at an energy of 3.49 eV (355 nm) with a frequency-tripled Nd:YAG laser system
at a repetition rate of 10 Hz. Alternatively an excitation energy of 3.18 eV (390 nm)
was used provided by a second harmonic generator (SHG, GWU Lasertechnik) itself
pumped by an optical parametric oscillator (OPO, GWU Lasertechnik). The emitted
light was dispersed by a monochromator with a 300 lines grating and a resolution of
0.5 nm before being detected by an optical multichannel analyzer (EG & G OMA
III). For detection of delayed fluorescence typically a delay of 1 µs was chosen with
an integration time from 1 µs up to 10 ms. In the case of long excited state lifetimes
the repetition rate of the laser was reduced by a home-built mechanical shutter. The
detection system was triggered by the electrical laser pulse and the triggering was
additionally checked by detecting the laser pulse with a photodiode and tracing the
gate and laser signal with an oscilloscope. Most spectra were accumulated over 100
measurements to increase the signal to noise ratio.
50
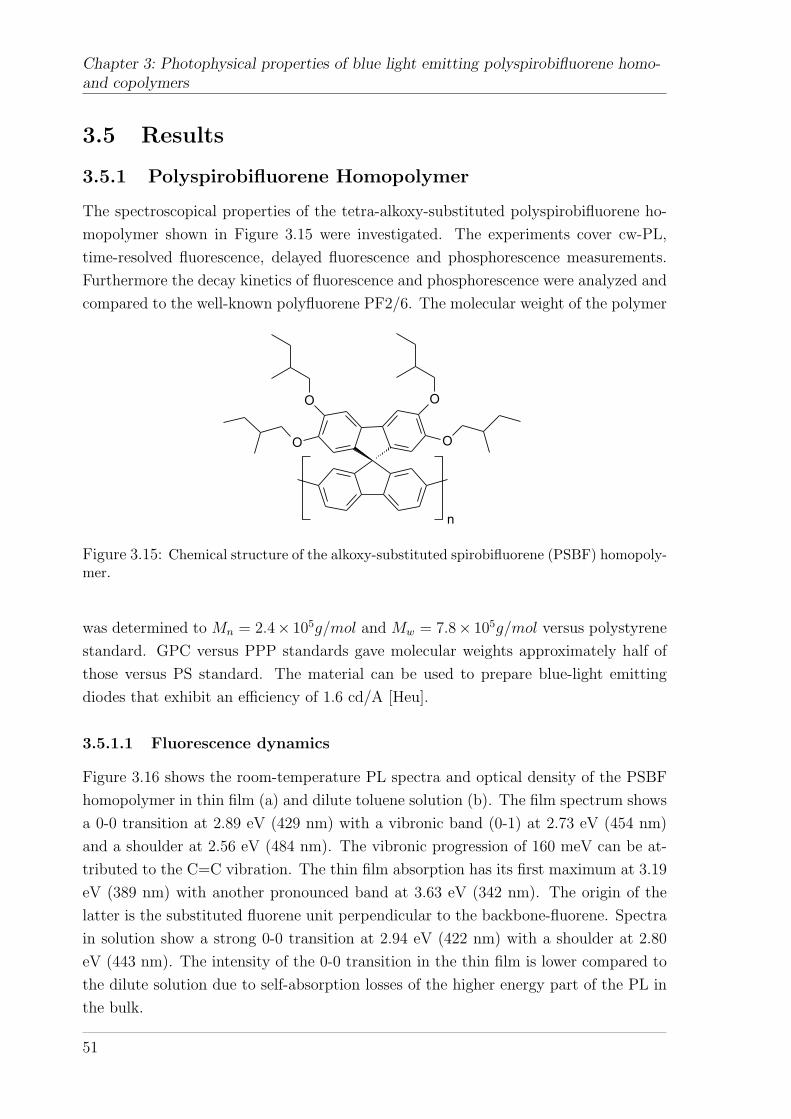
Chapter 3: Photophysical properties of blue light emitting polyspirobifluorene homo-and copolymers
3.5 Results
3.5.1 Polyspirobifluorene Homopolymer
The spectroscopical properties of the tetra-alkoxy-substituted polyspirobifluorene ho-
mopolymer shown in Figure 3.15 were investigated. The experiments cover cw-PL,
time-resolved fluorescence, delayed fluorescence and phosphorescence measurements.
Furthermore the decay kinetics of fluorescence and phosphorescence were analyzed and
compared to the well-known polyfluorene PF2/6. The molecular weight of the polymer
O
OO
O
n
Figure 3.15: Chemical structure of the alkoxy-substituted spirobifluorene (PSBF) homopoly-mer.
was determined to Mn = 2.4× 10⁵g/mol and Mw = 7.8× 10⁵g/mol versus polystyrene
standard. GPC versus PPP standards gave molecular weights approximately half of
those versus PS standard. The material can be used to prepare blue-light emitting
diodes that exhibit an efficiency of 1.6 cd/A [Heu].
3.5.1.1 Fluorescence dynamics
Figure 3.16 shows the room-temperature PL spectra and optical density of the PSBF
homopolymer in thin film (a) and dilute toluene solution (b). The film spectrum shows
a 0-0 transition at 2.89 eV (429 nm) with a vibronic band (0-1) at 2.73 eV (454 nm)
and a shoulder at 2.56 eV (484 nm). The vibronic progression of 160 meV can be at-
tributed to the C=C vibration. The thin film absorption has its first maximum at 3.19
eV (389 nm) with another pronounced band at 3.63 eV (342 nm). The origin of the
latter is the substituted fluorene unit perpendicular to the backbone-fluorene. Spectra
in solution show a strong 0-0 transition at 2.94 eV (422 nm) with a shoulder at 2.80
eV (443 nm). The intensity of the 0-0 transition in the thin film is lower compared to
the dilute solution due to self-absorption losses of the higher energy part of the PL in
the bulk.
51
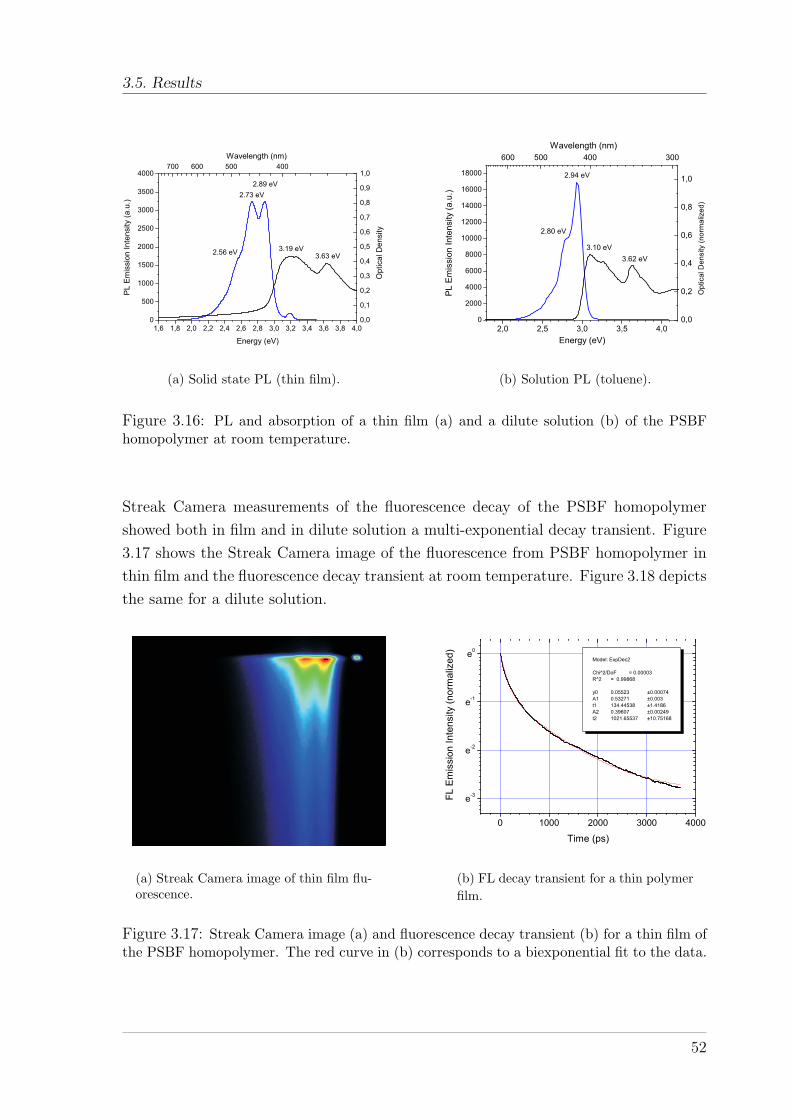
3.5. Results
1,6 1,8 2,0 2,2 2,4 2,6 2,8 3,0 3,2 3,4 3,6 3,8 4,00
500
1000
1500
2000
2500
3000
3500
4000700 600 500 400
0,0
0,1
0,2
0,3
0,4
0,5
0,6
0,7
0,8
0,9
1,0
3.63 eV3.19 eV2.56 eV
2.73 eV2.89 eV
PL E
mis
sion
Inte
nsity
(a.u
.)
Energy (eV)
Wavelength (nm)
Opt
ical
Den
sity
(a) Solid state PL (thin film).
2,0 2,5 3,0 3,5 4,00
2000
4000
6000
8000
10000
12000
14000
16000
18000
0,0
0,2
0,4
0,6
0,8
1,0
600 500 400 300
3.62 eV3.10 eV
2.80 eV
2.94 eV
PL
Em
issi
on In
tens
ity (a
.u.)
Energy (eV)
Opt
ical
Den
sity
(nor
mal
ized
)
Wavelength (nm)
(b) Solution PL (toluene).
Figure 3.16: PL and absorption of a thin film (a) and a dilute solution (b) of the PSBFhomopolymer at room temperature.
Streak Camera measurements of the fluorescence decay of the PSBF homopolymer
showed both in film and in dilute solution a multi-exponential decay transient. Figure
3.17 shows the Streak Camera image of the fluorescence from PSBF homopolymer in
thin film and the fluorescence decay transient at room temperature. Figure 3.18 depicts
the same for a dilute solution.
(a) Streak Camera image of thin film flu-orescence.
0 1000 2000 3000 4000
e-3
e-2
e-1
e0
Model: ExpDec2 Chi^2/DoF = 0.00003R^2 = 0.99868 y0 0.05523 ±0.00074A1 0.53271 ±0.003t1 134.44538 ±1.4186A2 0.39607 ±0.00249t2 1021.65537 ±10.75168
FL E
mis
sion
Inte
nsity
(nor
mal
ized
)
Time (ps)
(b) FL decay transient for a thin polymerfilm.
Figure 3.17: Streak Camera image (a) and fluorescence decay transient (b) for a thin film ofthe PSBF homopolymer. The red curve in (b) corresponds to a biexponential fit to the data.
52

Chapter 3: Photophysical properties of blue light emitting polyspirobifluorene homo-and copolymers
(a) Streak Camera image of fluorescencein solution.
0 1000 2000 3000 4000 5000
e-2
e-1
e0 Model: ExpDec2 Chi^2/DoF = 0.00004R^2 = 0.99866 y0 0.07376 ±0.00193A1 0.37884 ±0.00247t1 245.97669 ±3.04774A2 0.51199 ±0.00136t2 2401.77157 ±28.87256
PL
Em
issi
on In
tens
ity (n
orm
aliz
ed)
Time (ps)
(b) FL decay transient for a dilute solu-tion.
Figure 3.18: Streak Camera image (a) and fluorescence decay transient (b) for a dilutesolution of the PSBF homopolymer. The red curve in (b) corresponds to a biexponential fitto the data.
From a biexponential fit the following parameters were obtained:
A1 t1 A2 t2
solution 0.38 246 ps ± 3.0 ps 0.52 2400 ps ± 28.9 ps
film 0.53 134 ± 1.4 ps 0.40 1020 ±1 0.8 ps
Table 3.2: Biexponential fitting parameters for the fluorescence decay of the
PSBF homopolymer in solution and solid state for an excitation intensity
of 1mW.
The parameters of the fitting procedure imply that two processes are active in the
PSBF homopolymer. One process displays a fast decay with a lifetime of 134 ps in
film and 246 ps in dilute solution. The second process exhibits a much longer lifetime
of approximately 1 ns in the film and 2.4 ns in solution. The last value corresponds to
measurements done by the Monkman group which reported a fluorescence lifetime of
a PSBF homopolymer around 2.5 ns measured by the time-correlated single-photon-
counting (TCSPC) technique [KRM04]. Both processes are of similar importance as
the prefactors A1 and A2 imply. The origin of the faster process could not be uniquely
identified yet. The slower process may be the decay of the excited singlet state with its
intrinsic lifetime. The lifetime of both processes and their relative contribution to the
overall decay does not change at lower excitation powers such as 500µW , whereas at
higher excitation dose, for instance at 5 mW, the lifetime of both processes decreases
but their relative contribution stays constant.
53

3.5. Results
It is worth mentioning that the fluorescence lifetime of PSBF is considerably longer
than for PF2/6 [Kei05]. The reason may be the absence or very low concentration
of chemical defects. Furthermore, due to the high sterical hindrance of the molecules
π − π-interaction which could lead to lower energy aggregates may be suppressed.
The time-dependent fluorescence intensity I(t) of the PSBF homopolymer in thin
films and dilute solution can also be plotted in terms of the Kohlrausch-Williams-
Watt (KWW) function, i.e I(t) = I0exp[−(t/t0)β], where 0 < β < 1 is a dispersion
paramater which approaches β = 1/2 in classic Forster-type donor-acceptor transfer
systems. Figure 3.19 shows the KWW plots of the fluorescence intensity for the PSBF
homopolymer in thin films and dilute solution. The KWW plots of the fluorescence
101 102 103 10410-3
10-2
10-1
100 m = 0.5
ln(I 0/I
(t))
Time (ps)
(a) KWW plot of PSBF fluorescence in-tensity in solution.
101 102 10310-3
10-2
10-1
100
m = 0.5
ln(I 0/I
(t))
Time (ps)
(b) KWW plot of PSBF fluorescence in-tensity in solid film.
Figure 3.19: Typical KWW plots of the PSBF homopolymer fluorescence intensity in dilutesolution and thin films at room temperature. The red lines are guides to the eye with a slopeof m = 0.5.
intensity show that the dispersion parameter β approaches a value of β = 0.5 in the
long time region. The spirobifluorene homopolymer fluorescence decays like expected
for a typical Forster-type donor-acceptor system. This may be interpreted as singlet
energy relaxation via the Forster energy transfer mechanism in a disordered distrib-
ution of excited state energies towards chromophores that are lower in energy. It is
surprising that the same occurs in dilute solution where a monoexponential decay of
the fluorescence was expected as observed for the Spiro-co-TAD copolymer. However,
if energy relaxation to chromophores of lower energy occurs during the lifetime of the
singlet excited state then the spectrum should red-shift in time. Figure 3.20 compares
the PL spectra in thin film and solution at the time of the pump pulse and 1.5 ns
after the pump pulse. Clearly, energy relaxation occurs in the solid state as indicated
by the red-shift of the fluorescence spectrum from 2.9 eV (0-0 vibronic) to 2.83 eV
54

Chapter 3: Photophysical properties of blue light emitting polyspirobifluorene homo-and copolymers
1,6 1,8 2,0 2,2 2,4 2,6 2,8 3,0 3,2 3,4 3,60,0
0,2
0,4
0,6
0,8
1,0
1,2700 600 500 400
2.83 eV 2.90 eV
Wavelength (nm)
PL
Em
issi
on In
tens
ity (n
orm
aliz
ed)
Energy (eV)
0 ps 1500 ps
(a) Fluorescence spectra in thin film.
1,6 1,8 2,0 2,2 2,4 2,6 2,8 3,0 3,2 3,40,0
0,2
0,4
0,6
0,8
1,0
1,2700 600 500 400
2.90 eV
Wavelength (nm)
PL
Em
issi
on In
tens
ity (n
orm
aliz
ed)
Energy (eV)
0 ps 1500 ps
(b) Fluorescence spectra in dilute solu-tion.
Figure 3.20: Fluorescence spectra of the PSBF homopolymer in thin film (a) and dilutesolution (b) at the time of the pump pulse and 1.5 ns after the pump pulse. Spectra wererecorded by integrating over 12 ps. The peak at 390 nm corresponds to the laser pump pulse.
after 1.5 ns. In solution no such red-shift occurs and the spectral position of the 0-0
vibronic remains at a position of 2.90 eV even after 1.5 ns. Therefore the reason of the
non monoexponential decay pattern of the PSBF homopolymer in solution cannot be
relaxation of excited states which is reasonable since the interchain interaction should
be suppressed in the diluted solution.
3.5.1.2 Delayed fluorescence and phosphorescence in thin films
Apart from the prompt fluorescence, which can be detected immediately after the pump
pulse and which decays within the first few nanoseconds after the excitation, there are
additional emissions which can be observed in the delayed (µs - s with respect to the
pump pulse) time region [PS99]. Firstly, so called delayed fluorescence (DF) which
usually has the same spectral position and shape as the prompt fluorescence but a sig-
nificantly longer lifetime. Secondly, phosphorescence which is considerably red-shifted
with respect to the fluorescence. The origin of the former can be the generation of
”geminate pairs” during optical excitation which survive for a certain time before they
recombine and form excited singlet states or the bimolecular fusion of two triplets,
termed triplet-triplet-annihilation, which creates an excited singlet state and a singlet
ground state. The origin of the latter is the radiative decay of triplet states to the
singlet ground state. Triplet states can be formed during the lifetime of the excited
singlet state via spin-forbidden intersystem crossing. A detailed discussion of these
phenomena is given in the theoretical part of this thesis.
55

3.5. Results
Figure 3.21 presents the delayed emission spectrum of a thin film of the PSBF ho-
2.0 2.5 3.0 3.5 4.00.0
2.0x10⁻¹
4.0x10⁻¹
6.0x10⁻¹
8.0x10⁻¹
1.0x100
700 600 500 400 300
0.0
0.1
0.2
0.3
0.4
0.5
0.6
Wavelength (nm)D
elay
ed E
mis
sion
Inte
nsity
(nor
mal
ized
)
Energy (eV)
Abs
orpt
ion
Figure 3.21: Delayed PL-spectrum from a thin film of the PSBF homopolymer at 80 K. Thespectrum is delayed by 30 ms and integrated over 30 ms. Excitation was performed at 398nm (3.12 eV).
mopolymer at 80 K. The spectrum was taken with a delay of 30 ms with respect to the
pump pulse and integrated over 30 ms. The high energy emission of the spectrum at
2.85 eV can be attributed to delayed fluorescence since its shape and spectral position
are similar to the prompt fluorescence. At 2.14 eV (579 nm) phosphorescence from the
triplet state (T1 → S0) can be observed with a vibronic band at 1.96 eV. Therefore,
the singlet-triplet gap of the material is 0.71 eV which is in good agreement with pre-
viously reported values for conjugated polymers [HBGS01] [MBH+01]. DF could also
be detected at room temperature, whereas phosphorescence could only be detected at
80 K after purging the sample with nitrogen overnight.
The intensity dependence of PF, DF and Ph on pump laser intensity of a thin film at
80 K is shown in Figure 3.22. Clearly, the prompt fluorescence increases linearly at low
pump intensities. At higher pump intensities a sublinear increase with a slope of m =
0.5 can be observed which can be attributed to bimolecular singlet-singlet annihilation
leading to a square-root dependence on pump intensity. The DF increases superlin-
early at low pump intensities and deviates to a linear dependence in the high intensity
regime, whereas the phosphorescence shows a linear increase in the beginning and a
square-root dependence at higher pump intensities due to the bimolecular deactivation
of singlet states. Bimolecular triplet-triplet annihilation (TTA) can be considered the
56
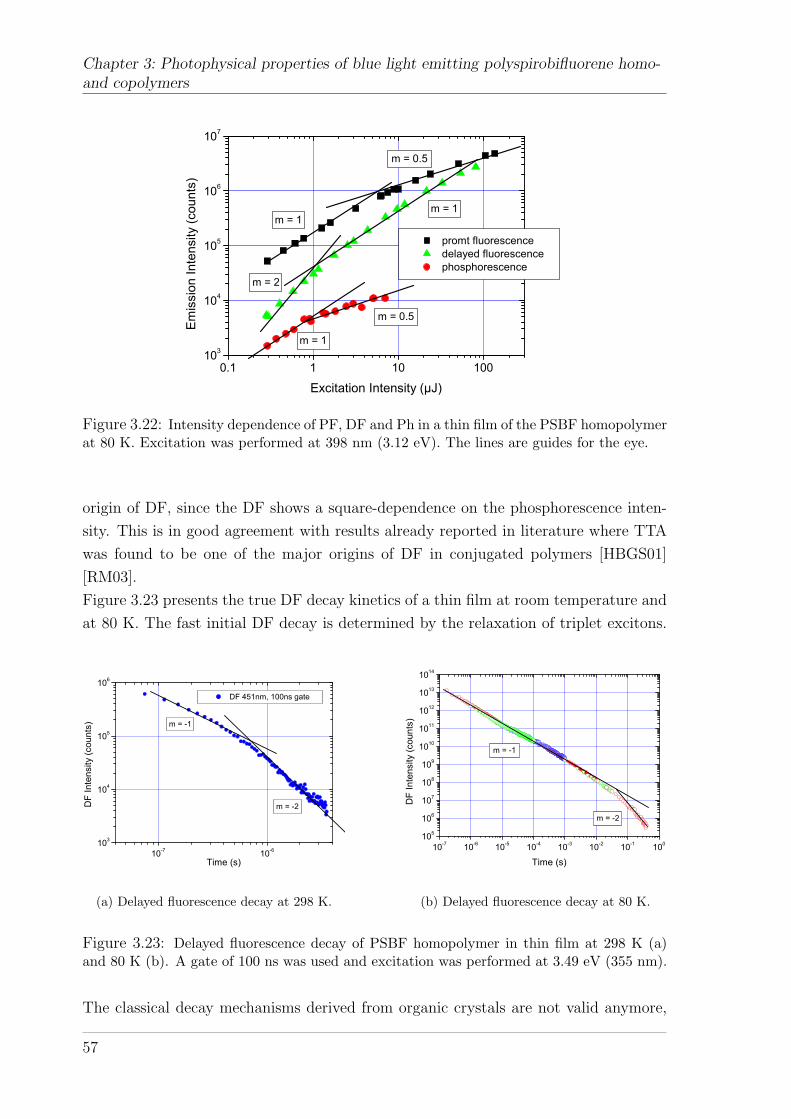
Chapter 3: Photophysical properties of blue light emitting polyspirobifluorene homo-and copolymers
0.1 1 10 100103
104
105
106
107
m = 0.5
m = 2
m = 0.5
m = 1
m = 1
promt fluorescence delayed fluorescence phosphorescence
Em
issi
on In
tens
ity (c
ount
s)
Excitation Intensity (µJ)
m = 1
Figure 3.22: Intensity dependence of PF, DF and Ph in a thin film of the PSBF homopolymerat 80 K. Excitation was performed at 398 nm (3.12 eV). The lines are guides for the eye.
origin of DF, since the DF shows a square-dependence on the phosphorescence inten-
sity. This is in good agreement with results already reported in literature where TTA
was found to be one of the major origins of DF in conjugated polymers [HBGS01]
[RM03].
Figure 3.23 presents the true DF decay kinetics of a thin film at room temperature and
at 80 K. The fast initial DF decay is determined by the relaxation of triplet excitons.
10-7 10-6103
104
105
106
m = -1
m = -2
DF 451nm, 100ns gate
DF
Inte
nsity
(cou
nts)
Time (s)
(a) Delayed fluorescence decay at 298 K.
10-7 10-6 10-5 10-4 10-3 10-2 10-1 100105
106
107
108
109
1010
1011
1012
1013
1014
m = -2
m = -1
DF
Inte
nsity
(cou
nts)
Time (s)
(b) Delayed fluorescence decay at 80 K.
Figure 3.23: Delayed fluorescence decay of PSBF homopolymer in thin film at 298 K (a)and 80 K (b). A gate of 100 ns was used and excitation was performed at 3.49 eV (355 nm).
The classical decay mechanisms derived from organic crystals are not valid anymore,
57

3.5. Results
since the recombination constant is a function of time in disordered systems. The DF
decay follows a power law of I(DF)∼t−n both at room temperature and at 80 K. Until
the triplets have reached there thermal equilibrium, DF decays with an exponent close
to n = -1. If the thermal equilibrium has been reached the exponent approaches n = -2
as predicted earlier by Scheidler et al. [SCBT94]. The transition to the non-dispersive
regime occurs approximately at 500 ns at room temperature. At 80 K the transition
occurs at around 100 µs since triplet relaxation is slower at lower temperatures.
Figure 3.24 depicts the decay of DF and Ph of a thin film at 80 K at long delay
times (typically t ≥ 100 ms). At long delay times the DF decay can be fitted to
0,0 0,2 0,4 0,6 0,8 1,0 1,2 1,4 1,6 1,8 2,010
3
104
105
106
Versuche:V043:Lebensdauer01.opj, 22.07.05
Inte
nsi
tät[c
ounts
]
Zeit [s]
EB3004, 80K, lexc
355nm, 0.5 Hz
451nm, t~0.1s580nm, t~0,4s, korrigiert mit DF Zerfall am Anfang
Figure 3.24: Decay of DF and Ph of a thin film of the PSBF homopolymer at 80 K for longdelay times. Excitation was performed at 3.49 eV (355 nm).
a single-exponential decay with a lifetime of 0.1 s. Phosphorescence decays follow a
mono-exponential law with a lifetime of 0.4 s. At short delay times the phosphores-
cence decays faster due to the bimolecular triplet-triplet fusion which occurs at higher
triplet concentrations and which leads to the observed DF.
58

Chapter 3: Photophysical properties of blue light emitting polyspirobifluorene homo-and copolymers
3.5.1.3 Delayed fluorescence and phosphorescence in frozen solution
Whereas in polymer films one has to consider the intermolecular interaction between
polymer chains, dilute frozen solutions offer the possibility to study the photophysical
properties of single polymer chains. Hence, a crucial prerequisite is a good solubility
and high dilution of the polymer since aggregates formed in solution may distort the
results. Furthermore, the solvent has to form a frozen glassy matrix which limits the
range of available solvents. Often 2-methyl-tetrahydrofuran (MTHF) is used since it is
a sufficient solvent for conjugated polymers and forms a glassy solid at 80 K.
Figure 3.25 (a) shows the delayed emission spectra of the investigated PSBF homopoly-
mer in frozen MTHF at different delay times and (b) the intensity dependence of PF,
DF and Ph at 80 K. The spectra are blue-shifted in comparison to the film spectra
1,4 1,6 1,8 2,0 2,2 2,4 2,6 2,8 3,0 3,2 3,40
1000
2000
3000
4000
5000
6000
7000
8000
800 700 600 500 400
2.05 eV
2.21 eV
2.70 eV
2.85 eV 100 ms 200 ms 500 ms 1000 ms 1500 ms 2000 ms 2500 ms 2800 ms
PL E
mis
sion
Inte
nsity
(a.u
.)
Energy (eV)
Wavelength (nm)
(a) Delayed PL in frozen MTHF.
1 10 100104
105
106
107
m = 0.5
m = 1
PF DF 100 ms Ph 100 ms
m = 0.5
m = 1
Em
issi
on In
tens
ity (a
.u.)
Laser Intensity (µJ/pulse)
(b) Intensity dependence in MTHF.
Figure 3.25: Delayed PL-spectra of PSBF homopolymer in frozen MTHF at 80 K (a) andintensity dependence of PF, DF and Ph (b) on pump energy. Excitation was performed at3.49 eV (355 nm) and spectra were integrated over 10 ms.
(compare Fig. 3.21) by 70 meV since interchain interaction is reduced in the frozen
solution and MTHF has a smaller electronic polarizability than a conjugated polymer,
therefore the solvent shift is less than the shift in solid state. DF can be observed at
2.85 eV with a vibronic band at 2.7 eV, whereas phosphorescence is located at 2.21
eV (0-0 transition) with a well-resolved vibronic structure. The intensity dependence
shown in Figure 3.25 (b) exhibits a linear increase of PF at low excitation intensities,
whereas in the high intensity regime singlet-singlet-annihilation leads to a sublinear
increase with a slope of m = 0.5. The DF basically follows the same trend. The phos-
phorescence increases sublinear over the whole range of excitation intensities, especially
in the intensity regime of singlet-singlet-annihilation.
The decay kinetics of DF (a) and Ph (b) are presented in Figure 3.26. DF decays
59

3.5. Results
102 103
104
105
n = -1
Em
issi
on In
tens
ity (a
.u.)
Time (ms)
(a) Decay of DF in frozen MTHF.
0 1000 2000 3000 4000e7
e8
e9
e10
e11
= 1.2 s
Em
issi
on In
tens
ity (a
.u.)
Time (ms)
(b) Decay of Ph in frozen MTHF.
Figure 3.26: Decay of delayed fluorescence (DF) and phosphorescence (Ph) of the PSBFhomopolymer in frozen MTHF. Excitation was performed at 3.49 eV (355 nm) with 20µJ/pulse.
according to a power law with an exponent of n = -1 over the whole time range.
Phosphorescence decays in a single-exponential fashion with a lifetime of 1.2 s at long
delay times. The origin of DF in frozen solution can be attributed to geminate pair
(GP) formation, if one takes into account the intensity dependence and the decay ki-
netics. DF decaying to a power law with n = -1 can be interpreted as a signature of
delayed geminate pair recombination. This is supported by the intensity dependence
which shows a linear increase of DF with excitation intensity and the single-exponential
decay of phosphorescence with its intrinsic lifetime. This stands in contrast to the mea-
surements on thin films where a square increase of DF with pump intensity has been
observed. It is reasonable that in the solid state, where interchain interaction is en-
hanced the triplets have a higher probability to meet each other and annihilate than
in a dilute frozen solution where a bimolecular origin of DF can in principle only be
caused by two annihilating triplets that were generated on the same polymer chain.
However, at short delay times a deviation of the phosphorescence intensity decay from
the single-exponential decay pattern occurs which may be a signature of TTA at high
triplet concentrations in the region of short delay times.
3.5.1.4 Stability against oxidation
The stability against (photo)oxidation is a crucial issue for all conjugated polymers
since oxygen and water cannot be completely avoided during device preparation. Es-
pecially polyfluorene-type polymers often suffer from an undesired green emission band
60

Chapter 3: Photophysical properties of blue light emitting polyspirobifluorene homo-and copolymers
which has been attributed to the formation of fluorenone defect sides during device op-
eration [LGSdFS02]. Although there is convincing evidence in the literature that the
formation of keto-defects is the origin of low-energy contaminations in the PL and EL
spectrum, aggregates and exciplexes may also play a role as the influence of sidechains
on the emissive properties of fluorene-type polymers/oligomers demonstrated [KJL+05].
It was found that the keto-band usually appears at around 530 nm whereas the con-
tribution from aggregate emission occurs at around 490 nm.
To check for the oxidative stability of the investigated PSBF polymers thin films were
heated to 180 C in air after spin-coating. Figure 3.27 shows the normalized PL-spectra
(a) and decay transients (b) of a thin film of the PSBF homopolymer before and after
annealing in air. All measurements were performed by exciting the polymer at 390 nm
1,6 1,8 2,0 2,2 2,4 2,6 2,8 3,0 3,2 3,4 3,60,0
0,2
0,4
0,6
0,8
1,0
700 600 500 400Wavelength (nm)
PL E
mis
sion
Inte
nsity
(nor
mal
ized
)
Energy (eV)
pristine 1h air 2 h air
(a) PL spectra of air-annealed films after1h and 2h.
-500 0 500 1000 1500 2000e-5
e-4
e-3
e-2
e-1
e0
P
L E
mis
sion
Inte
nsity
(nor
mal
ized
)
Time (ps)
pristine 1h air 2h air
(b) Fluorescence decay of air annealedfilms.
Figure 3.27: Normalized PL-spectra of a pristine and air-annealed film of the PSBF ho-mopolymer (a) and fluorescence decay transients of the same samples (b).
with a power of 500 µW. The prompt PL-spectra are equal to the spectrum of the film
presented in Figure 3.16. Upon annealing neither the spectral shape and position nor
the fluorescence intensity changed. Furthermore, the decay transients show a similar
lifetime for the pristine film in comparison to the air annealed samples. This testifies on
the excellent oxidative stability of the PSBF polymer. The reason for the improved sta-
bility compared to alkylated polyfluorenes lies in the fully aryl-substituted bridgehead
carbon and the way of its synthesis which avoids monosubstituted products. Addition-
ally the glass transition of the spiro-polymer is considerably higher than that of PF
so that the amorphous glassy state is stabilized. It was proven that the spiropolymer
forms amorphous films during spincoating by polarized optical microscopy (POM).
61
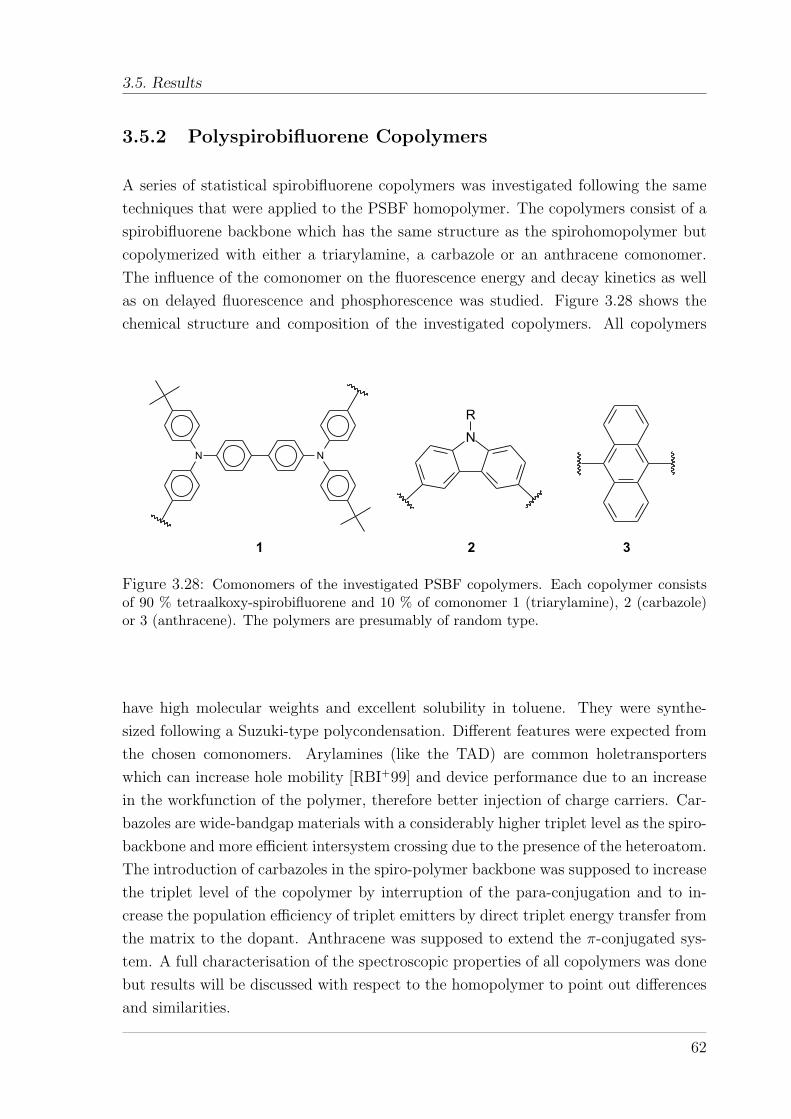
3.5. Results
3.5.2 Polyspirobifluorene Copolymers
A series of statistical spirobifluorene copolymers was investigated following the same
techniques that were applied to the PSBF homopolymer. The copolymers consist of a
spirobifluorene backbone which has the same structure as the spirohomopolymer but
copolymerized with either a triarylamine, a carbazole or an anthracene comonomer.
The influence of the comonomer on the fluorescence energy and decay kinetics as well
as on delayed fluorescence and phosphorescence was studied. Figure 3.28 shows the
chemical structure and composition of the investigated copolymers. All copolymers
N N
N
R
1 2 3
Figure 3.28: Comonomers of the investigated PSBF copolymers. Each copolymer consistsof 90 % tetraalkoxy-spirobifluorene and 10 % of comonomer 1 (triarylamine), 2 (carbazole)or 3 (anthracene). The polymers are presumably of random type.
have high molecular weights and excellent solubility in toluene. They were synthe-
sized following a Suzuki-type polycondensation. Different features were expected from
the chosen comonomers. Arylamines (like the TAD) are common holetransporters
which can increase hole mobility [RBI+99] and device performance due to an increase
in the workfunction of the polymer, therefore better injection of charge carriers. Car-
bazoles are wide-bandgap materials with a considerably higher triplet level as the spiro-
backbone and more efficient intersystem crossing due to the presence of the heteroatom.
The introduction of carbazoles in the spiro-polymer backbone was supposed to increase
the triplet level of the copolymer by interruption of the para-conjugation and to in-
crease the population efficiency of triplet emitters by direct triplet energy transfer from
the matrix to the dopant. Anthracene was supposed to extend the π-conjugated sys-
tem. A full characterisation of the spectroscopic properties of all copolymers was done
but results will be discussed with respect to the homopolymer to point out differences
and similarities.
62
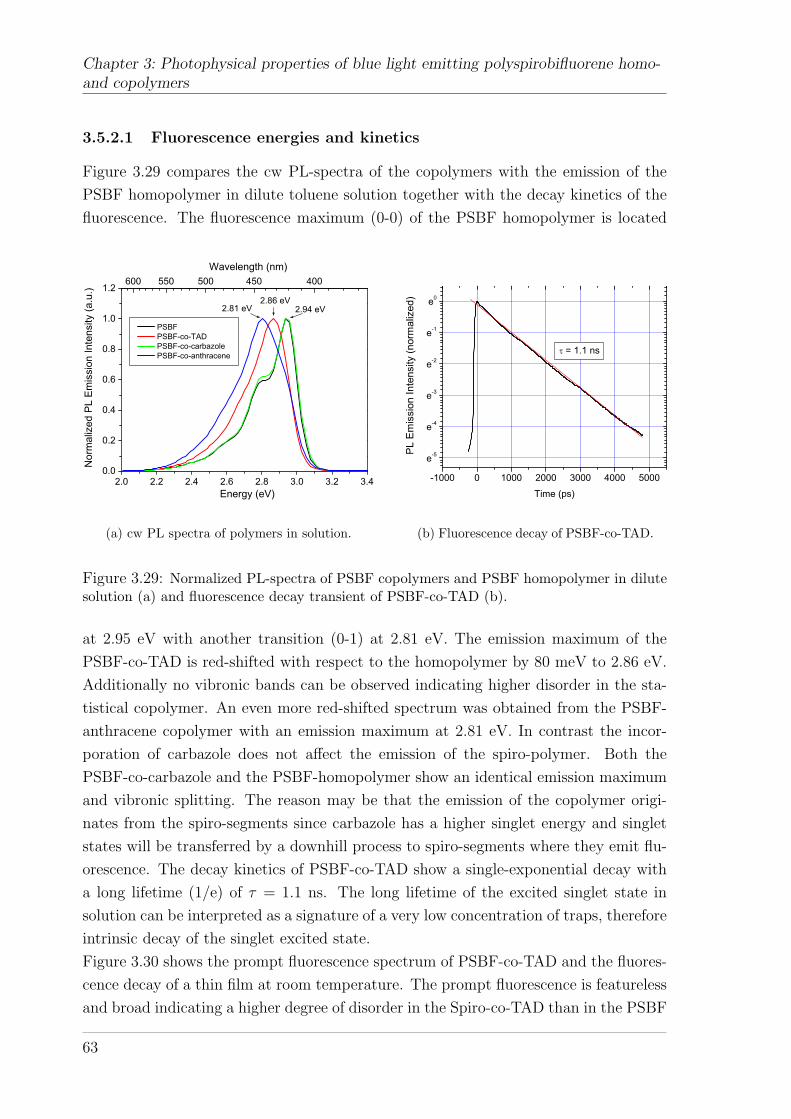
Chapter 3: Photophysical properties of blue light emitting polyspirobifluorene homo-and copolymers
3.5.2.1 Fluorescence energies and kinetics
Figure 3.29 compares the cw PL-spectra of the copolymers with the emission of the
PSBF homopolymer in dilute toluene solution together with the decay kinetics of the
fluorescence. The fluorescence maximum (0-0) of the PSBF homopolymer is located
2.0 2.2 2.4 2.6 2.8 3.0 3.2 3.40.0
0.2
0.4
0.6
0.8
1.0
1.2600 550 500 450 400
2.81 eV2.86 eV
2.94 eV
PSBF PSBF-co-TAD PSBF-co-carbazole PSBF-co-anthracene
Wavelength (nm)
Nor
mal
ized
PL
Emis
sion
Inte
nsity
(a.u
.)
Energy (eV)
(a) cw PL spectra of polymers in solution.
-1000 0 1000 2000 3000 4000 5000
e-5
e-4
e-3
e-2
e-1
e0
= 1.1 ns
PL
Em
issi
on In
tens
ity (n
orm
aliz
ed)
Time (ps)
(b) Fluorescence decay of PSBF-co-TAD.
Figure 3.29: Normalized PL-spectra of PSBF copolymers and PSBF homopolymer in dilutesolution (a) and fluorescence decay transient of PSBF-co-TAD (b).
at 2.95 eV with another transition (0-1) at 2.81 eV. The emission maximum of the
PSBF-co-TAD is red-shifted with respect to the homopolymer by 80 meV to 2.86 eV.
Additionally no vibronic bands can be observed indicating higher disorder in the sta-
tistical copolymer. An even more red-shifted spectrum was obtained from the PSBF-
anthracene copolymer with an emission maximum at 2.81 eV. In contrast the incor-
poration of carbazole does not affect the emission of the spiro-polymer. Both the
PSBF-co-carbazole and the PSBF-homopolymer show an identical emission maximum
and vibronic splitting. The reason may be that the emission of the copolymer origi-
nates from the spiro-segments since carbazole has a higher singlet energy and singlet
states will be transferred by a downhill process to spiro-segments where they emit flu-
orescence. The decay kinetics of PSBF-co-TAD show a single-exponential decay with
a long lifetime (1/e) of τ = 1.1 ns. The long lifetime of the excited singlet state in
solution can be interpreted as a signature of a very low concentration of traps, therefore
intrinsic decay of the singlet excited state.
Figure 3.30 shows the prompt fluorescence spectrum of PSBF-co-TAD and the fluores-
cence decay of a thin film at room temperature. The prompt fluorescence is featureless
and broad indicating a higher degree of disorder in the Spiro-co-TAD than in the PSBF
63

3.5. Results
1,8 2,0 2,2 2,4 2,6 2,8 3,0 3,2 3,4 3,6 3,8 4,00
200
400
600
800
1000
1200
1400600 500 400
0,0
0,1
0,2
0,3
0,4
0,5
0,6
0,7
0,8
0,9
1,0
3.63 eV
3.22 eV
2.72 eV
PL
Em
issi
on In
tens
ity (a
.u.)
Energy (eV)
Wavelength (nm)
Abs
orpt
ion
(a) PL and OD of Spiro-co-TAD.
0 500 1000 1500 2000
e-4
e-3
e-2
e-1
e0
630 ps T = 298 K
PL
Em
issi
on In
tens
ity (a
.u.)
Time (ps)
(b) Fluorescence decay of PSBF-co-TAD.
Figure 3.30: Room temperature PL-spectra and absorption (a) of Spiro-co TAD in thin filmand fluorescence decay transient (b).
homopolymer. A strong red-shift of the fluorescence maximum in comparison to the
solution as a consequence of interchain interaction in the bulk is observed. The fluo-
rescence decay transient follows a multi-exponential function and the fluorescence has
decreased by 1/e after approximately 630 ps. This value is shorter than in dilute so-
lution due to more efficient energy transfer to lower energy sites in the bulk but it is
still almost twice the lifetime of the fluorescence of PF2/6 indicating a very low defect
concentration of the polymer.
3.5.2.2 Delayed fluorescence and phosphorescence in thin films
The delayed emission of all copolymers was studied to identify the position of the triplet
level and to have a deeper insight into excited state relaxation and decay processes.
Figure 3.31 shows a comparison of the fluorescence with the delayed photoluminescence
of PSBF-co-carbazole and PSBF-co-anthracene in thin films at 80 K. The fluorescence
was measured with a gate window of 10 ns and detection was started with a time delay
of -5 ns with respect to the laser pulse. The red spectrum corresponds to a time delay
of 10 ms with 10 ms gate, whereas the blue curve represents the DF after 1 µs. The DF
of the PSBF-co-carbazole has the same spectral position as the prompt fluorescence
but the 0-0 transition is slightly reduced due to self-absorption losses. Phosphorescence
of the polymer film can be observed at 2.14 eV with a singlet to triplet gap of 0.77
eV, a typical value for conjugated polymers. It is worth mentioning that the triplet
level is the same as for the PSBF-homopolymer film. In conclusion the incorporation
of carbazole (at least to a content of 10 wt.%) does not lead to a significant shift of the
64

Chapter 3: Photophysical properties of blue light emitting polyspirobifluorene homo-and copolymers
1.8 2.0 2.2 2.4 2.6 2.8 3.0 3.2 3.4 3.6 3.8 4.00.0
0.2
0.4
0.6
0.8
1.0
1.2700 600 500 400 300
0.05
0.10
0.15
0.20
0.25
0.30
0.35
0.40
0.45
0.50
3.26 eV 3.65 eV
Fluorescence DF, Ph DF
2.74eV2.91eV
2.14eV
Wavelength [nm]
Nor
m. E
mis
sion
Inte
nsity
Energy [eV]
1.96eV
Abs
orpt
ion
(a) Prompt and delayed PL of PSBF-co-carbazole.
1.5 2.0 2.5 3.0 3.5 4.00.0
0.2
0.4
0.6
0.8
1.0
1.2900800 700 600 500 400 300
0.0
0.2
0.4
0.6
0.8
1.0
1.2
3.65 eV3.21 eV2.76eV1.70eV
Wavelength [nm]
Nor
mal
ized
Em
issi
on In
tens
ity
Energy [eV]
1.54eV
Abs
orpt
ion
DF identical to FL
(b) Delayed emission and OD of PSBF-co-anthracene.
Figure 3.31: Normalized delayed PL emission spectra of PSBF-co-carbazole (a) and PSBF-co-anthracene (b) in thin films at 80 K. The room-temperature absorption is included.
triplet level. The reason is obvious, carbazole has a higher triplet level than the spiro-
backbone and even if a triplet is created at a carbazole unit it will be transferred to the
lower lying triplet of the spiro-segments during its lifetime. Nevertheless, the picture
changes if one looks at the PSBF-co-anthracene. The DF is located at 2.76 eV and
shows the same position and structure as the prompt fluorescence. Phosphorescence
was detected at 1.70 eV with a vibronic progression of 160 meV. This is a remarkably
low triplet level for a blue emitting polymer since the singlet-triplet gap is around 1.1
eV. The reason is the incorporated anthracene which exhibits itself a triplet at around
1.7 eV [PS99] [KCAA63]. Therefore, any triplet which is generated in the polymer is
transferred during its lifetime to the lower lying triplet level of anthracene. The emis-
sion from the anthracene triplet was found to be rather weak which is a signature of
a strong non-radiative decay channel due to its low triplet energy [WCAM+01]. This
is, of course, highly relevant for device applications using this material as a matrix
polymer since the low triplet level can act as a quencher for the higher energy triplet
states of the dopant. This issue will be discussed in the following chapter which deals
with energy transfer to phosphorescent dopants and the phenomenon of photon-energy
upconversion.
The intensity dependence of the prompt fluorescence, delayed fluorescence and phos-
phorescence on pump laser density shows a similar behavior compared to the PSBF-
homopolymer. Prompt fluorescence increases in the beginning linearly with pump laser
intensity until the region of singlet-singlet annihilation is reached and a square-root de-
pendence is approached due to the bimolecular deactivation of singlet states. For the
65

3.5. Results
carbazole-containing copolymer a linear dependence of the DF and a sublinear depen-
dence of the phosphorescence on pump intensity was observed with the slope of the
phosphorescence being half of that of the DF. This points to triplet-triplet annihilation
as the origin of DF as reported for the homopolymer. It was not possible to measure
an intensity dependence of the phosphorescence from the PSBF-co-anthracene, since
phosphorescence can only be detected at very high excitation energies due to its low
quantum yield.
The DF and phosphorescence decay of a thin film of the PSBF-co-carbazole at 80 K are
depicted in Figure 3.32. A similar behavior as for the PSBF-homopolymer is observed.
10-8 10-7 10-6 10-5 10-4 10-3 10-2107
108
109
1010
1011
1012
1013
1014
Em
issi
on In
tens
ity [c
ount
s]
Time [s]
EB3035, 80K, exc
355nm, 10 Hz
(a) DF decay of PSBF-co-carbazole
0,0 0,1 0,2 0,3 0,4 0,5 0,6 0,7 0,8 0,9 1,0103
104
105
106
107
Phosphorescence Delayed Fluorescence Linear Fit = 0.39 s
Em
issi
on In
tens
ity [c
ount
s]
Time [s]
EB3035, 80K, exc
355nm, 1 Hz
(b) DF and Ph decay in long time scale
Figure 3.32: Double logarithmic presentation of the delayed fluorescence decay at shortdelay times (a) and DF and Ph decay in the second timerange (b) of a thin film of PSBF-co-carbazole at 80 K.
The delayed fluorescence decays according to a power law with a slope of n = -1 up
to 1 ms. In this time region the DF decay behavior is dominated by the relaxation of
triplet excitons. The classical decay schemes are not obeyed since the triplet-triplet
annihilation constant is a function of time. At longer delay times (seconds timeregion)
the DF decays according to a power law with a slope of n = -2 which is a signature of
TTA in the nondispersive region of triplet migration. The phosphorescence follows a
single-exponential decay fashion with a lifetime of τ ≈ 390 ms.
Figure 3.33 shows the DF and phosphorescence decay pattern for the PSBF-co-anthracene.
The DF of PSBF-co-anthracene decays according to a power law with n = -1, equal
to the results obtained for the PSBF homopolymer. In the long time region DF and
phosphorescence are weak and can only be detected at high pump laser intensity. The
phosphorescence decays according to an exponential law with a lifetime of τ ≈ 22ms
which is considerably shorter than observed for the homopolymer and the other copoly-
66

Chapter 3: Photophysical properties of blue light emitting polyspirobifluorene homo-and copolymers
10-7 10-6 10-5 10-4 10-3 10-2108
109
1010
1011
1012
1013
1014
Em
issi
on In
tens
ity [c
ount
s]
Time [s]
AEF2443, 80K, exc
355nm, 10 Hz
(a) DF decay of PSBF-co-anthracene
-0,02 0,00 0,02 0,04 0,06 0,08 0,10 0,12
106
107
108 Phosphorescence Linear Fit = 22 ms
Pho
spho
resc
ence
Inte
nsity
[cou
nts]
Time [s]
AEF2443, 80K, exc
355nm, 2 Hz
(b) DF and Ph decay in long time scale
Figure 3.33: Double logarithmic presentation of the delayed fluorescence decay at shortdelay times (a) and DF and Ph decay in the second timerange (b) of a thin film of PSBF-co-anthracene at 80 K.
mers. This is a signature of a strong non-radiative decay channel which shortens the
triplet lifetime due to non-radiative relaxation of the low energy triplet. However, a
value of τ ≈ 22ms is larger than the value of the phosphorescence lifetime found for
anthracene single crystals with τ ≈ 10ms [KCAA63].
67

3.5. Results
3.5.2.3 Delayed fluorescence and phosphorescence in solution
The spectroscopical properties of all copolymers were investigated in frozen MTHF ma-
trix to obtain the intrinsic excited state energies and lifetimes for separated polymer
chains. Since results are very similar for all three copolymers they will be discussed on
the PSBF-co-TAD and an overview of all excited state energies and lifetimes will be
given in the following discussion.
Figure 3.34 shows the prompt and delayed PL-spectrum of of PSBF-co-TAD in a frozen
glassy matrix of MTHF and the intensity dependence of all emissions. The prompt
1.5 2.0 2.5 3.0 3.50.0
0.2
0.4
0.6
0.8
1.0
1.2800 700 600 500 400
0.66 eV
2.02 eV
2.20 eV
2.69 eV
2.86 eV
PL E
mis
sion
Inte
nsity
(a.u
.)
Energy (eV)
Wavelength (nm)
(a) Prompt and delayed PL in solution.
1 10 100103
104
105
106
107
m = 2.0
m = 1
m = 0.5
m = 1
PL
Em
issi
on In
tens
ity (a
.u.)
Excitation Intensity (µJ/pulse)
PF DF Ph
(b) Intensity dependence in frozen MTHF.
Figure 3.34: Prompt and delayed PL spectra of PSBF-co-TAD in frozen MTHF at 80 Kupon pumping at 355 nm with 20 µJ / pulse. Spectra are normalized to the PL maximum.A delay of 100 ms was chosen to detect the delayed emission. The lines are guides to the eye.
and delayed fluorescence are equal in shape and position with a 0-0 transition at 2.86
eV and a vibronic progression of 170 meV. At 2.2 eV strong phosphorescence from
the forbidden T1 − S0 transition can be observed, bathochromically shifted by 0.66 eV
with respect to the DF. The phosphorescence shows the same vibronic splitting as the
fluorescence since both transitions end up in the singlet ground state, therefore the
spectrum resembles the vibronic structure of the singlet ground state S0.
Figure 3.34 (b) depicts the intensity dependence of PF, DF and Ph. The prompt
fluorescence increases linearly with pump intensity and levels off to a square-root de-
pendence at higher intensities indicating singlet-singlet annihilation as the major decay
path of singlets. At low pump intensities the DF shows a square-dependence on pump
intensity, whereas the phosphorescence follows a linear trend as expected in the regime
of monomolecular singlet decay. The square-dependence of the DF on the phospho-
68

Chapter 3: Photophysical properties of blue light emitting polyspirobifluorene homo-and copolymers
rescence intensity indicates TTA as the origin of delayed fluorescence. Only at higher
pump intensities the slopes deviate from the expected behavior since the singlets are
deactivated by a bimolecular mechanism.
The DF and phosphorescence decay follows a power law with a slope of n = -1 for
the former and a single-exponential decay with a lifetime of τ = 1.1 s for the latter as
shown in Figure 3.35. A deviation from the single-exponential decay of the phospho-
0 500 1000 1500 2000 2500 3000 3500 4000
e8
e9
e10
e11
e12
100 1000
103
104
105
DF
Inte
nsity
(a.u
.)
Time (ms)
= 1.1 s
n = -1
Phos
phor
esce
nce
Inte
nsity
(a.u
.)
Time (ms)
Figure 3.35: Decay of phosphorescence on a semi-logarithmic scale and of DF on a log-logscale of PSBF-co-TAD in frozen MTHF at 80 K. The DF decay obeys a power law with n =-1 and the phosphorescence follows an exponential decay with τ = 1.1 s.
rescence can be observed on the short time scale. This can be interpreted in terms of
a higher probability for triplets to annihilate at higher triplet concentrations, therefore
a larger TTA constant which causes a deviation from the exponential decay. However,
the results obtained for the Spiro-co-TAD are controversial and DF could also be at-
tributed to geminate pair formation since the phosphorescence decays according to a
single-exponential decay law with its intrinsic lifetime and DF features a power law
decay with n = -1 which is a signature of geminate pair recombination as the origin of
DF.
69
3.6. Discussion
3.6 Discussion
A series of four Polyspirobifluorene (PSBF) (co)polymers was investigated using ultra-
fast time-resolved Streak Camera techniques and time-delayed spectroscopy to study
their photophysical properties in film (solid state) and solution. As reference mater-
ial the tetraalkoxy-substituted PSBF homopolymer was used and its spectroscopical
features were compared to statistical PSBF copolymers each having 10 % comonomer
content, namely a triphenylamin-derivative (TAD), carbazole or anthracene. Special
interest was paid to the determination of prompt and delayed fluorescence lifetimes
and energies as well as their decay patterns. Phosphorescence was observed from each
polymer and its lifetime and energy determined in solid state and dilute solutions. The
aim of this study was to clarify the influence of the comonomer on the photophysical
properties of the polymer to develop structure-property relationships.
The solid state and solution PL of the PSBF homopolymer identify it as a pure blue
emitter with a PL maximum at 2.94 eV (422 nm) and a vibronic progression of 180
meV. In comparison the emission of the PSBF-co-TAD is red-shifted by about 80 meV
due to the presence of nitrogen atoms in conjugation with the polymer backbone. A
further red-shift to 2.81 eV is observed in the PSBF-co-anthracene due to the electron
rich anthracene moieties. Nevertheless, all copolymers can be considered blue emitters
since the main part of the emission lies in the spectral region of blue light.
Interestingly, the fluorescence lifetimes of the excited singlet states were found to be
longer compared to the blue-emitter polyfluorene, for instance. This is true for dilute
solutions as well as thin films. The fluorescence decay of the homopolymer in solution
does not obey a single-exponential decay unlike the Spiro-co-TAD. From a biexponen-
tial fit a very long-lifetime of 2.4 ns was observed for the slow decay part and around
250 ps for the fast decaying part. PSBF-co-TAD shows a fluorescence lifetime of 1.1
ns in solution at room temperature and a perfect single-exponential decay pattern.
The very long fluorescence lifetimes testify on the high purity of the investigated poly-
mers. Furthermore, the polymers exhibit a very high resistance against oxidation of
the bridge-head carbon which would result in the formation of keto-defects and unde-
sired green emission bands. Even after annealing of thin polymer films in air at 180 C
neither green emission could be observed nor a significant decrease in the fluorescence
lifetime which would indicate the formation of defects that quench the excited singlet
states. Therefore, the keto-defect is not an issue for the PSBF polymers due to the
protection of the bridge-head carbon by aryl-substitution which hinders oxidation.
Apart from the unusually long fluorescence lifetimes that were observed for the PSBF
polymers, the delayed fluorescence and phosphorescence behavior concerning energy,
intensity dependence and lifetimes is similar to that of conventional alkyl-substituted
polyfluorenes. Thus, the additional fluorene-moiety, which is perpendicular to the back-
70

Chapter 3: Photophysical properties of blue light emitting polyspirobifluorene homo-and copolymers
bone fluorene can be considered a huge solubilizing group with a protective function
against oxidation of the bridge-head carbon atom as long as spectroscopic properties
are addressed.
The intensity dependence of the prompt fluorescence shows a linear increase for low
pump intensities as expected since the generation of singlets is proportional to the
pump intensity as long as non-linear effects are not present. At higher excitation
intensities bimolecular singlet-singlet-annihilation can be observed and the intensity
dependence approaches a square-root power law. All measurements in solution and
thin films showed a quadratic dependence of the DF on the phosphorescence intensity
which indicates triplet-triplet annihilation as the origin of delayed fluorescence. Only
at high pump intensities when SSA plays an important role the dependencies deviate
from the expected behavior. The delayed fluorescence was found to decay according
to a power law with a power of n = -1 that deviates to a power of n = -2 for longer
delay times. The DF kinetics in thin films depend on the triplet relaxation since the
bimolecular annihilation constant is a function of time in disordered solids. During
the triplet migration in the dispersive regime DF decays with a power law of n = -1
until the triplet states have reached their dynamic equilibrium and DF begins to de-
cay according to a power law with a power of n = -2. This is further supported by
room-temperature measurements of the DF kinetics on the PSBF homopolymer where
a faster transition to the nondispersive regime with the DF decaying according to a
power law of n = -2 is observed.
Phosphorescence of the investigated PSBF polymers is located around 2.2 eV in solu-
tion and 2.14 eV in the solid state. Table 3.3 summarizes the excited state energies
and lifetimes in dilute solution.
Polymer PF S1 − S0 DF S1 − S0 T1 − S0 S1 − T1
PSBF-polymer 2.94 eV (2.5 ns) 2.85 eV 2.21 eV (1.2 s) 0.64 eV
PSBF-co-TAD 2.86 eV (1.1 ns) 2.86 eV 2.20 eV (1.1 s) 0.66 eV
PSBF-co-carbazole 2.94 eV 2.85 eV 2.23 eV (1.5 s) 0.62 eV
PSBF-co-anthracene 2.81 eV 2.75 eV 1.75 eV 1.0 eV
Table 3.3: Excited state energies and lifetimes of PSBF polymers in dilute
solution. PF at 298 K and DF, Ph at 80 K.
71

3.6. Discussion
The following table 3.4 contains the excited state energies and lifetimes in the solid
state (thin films).
Polymer PF S1 − S0 DF S1 − S0 T1 − S0 S1 − T1
PSBF-polymer 2.89 eV (1.0 ns) 2.84 eV 2.14 eV (0.4 s) 0.70 eV
PSBF-co-TAD 2.72 eV (630 ps) 2.69 eV 2.08 eV (0.31 s) 0.61 eV
PSBF-co-carbazole 2.91 eV 2.91 eV 2.14 eV (0.39 s) 0.77 eV
PSBF-co-anthracene 2.76 eV 2.76 eV 1.70 eV (0.22 s) 1.06 eV
Table 3.4: Excited state energies and lifetimes of PSBF polymers in thin
films. PF at 298 K and DF, Ph at 80 K.
The PF, DF and phosphorescence red-shift when going from a dilute solution towards
the solid state since there is close interaction of the single chains in the bulk which
leads to an overlap of adjacent π-orbitals and a lower energy of the excited states.
Interestingly, the red-shift is more pronounced for the triplet state than for the singlet.
This may be due to the long lifetime of the triplet state which allows the triplet to
reach low energy sites in the tail of the triplet density of states. Hence, the singlet-
triplet gap increases in the solid state. However, the TAD or carbazole comonomers
do not significantly influence the triplet energy. Only a slight blue-shift of the triplet
energy can be observed in the PSBF-co-carbazole which is not apparent anymore in the
solid state. The intrinsic triplet lifetime that can be deduced from the meaurements
in frozen MTHF are between 1.1 s to 1.5 s which is similar to the values reported for
other hydrocarbon blue-emitting polymers. The anthracene-containing PSBF is an ex-
ception due its low triplet energy around 1.7 eV. The low triplet level must be created
by the anthracene itself which has a triplet level around 1.7 eV. It creates a sink for
the triplets of the PSBF polymer which traps the triplets during their migration. Suc-
cessively the triplets decay via phosphorescence or via the non-radiative decay channel
which is strongly activated at such low triplet energies. Hence, the observed triplet
lifetime is shorter since for such a low triplet level there is significant contribution of
the non-radiative decay channel. The material has due to its low anthracene level a
singlet-triplet splitting of 1.0 eV which is unusual for conjugated polymers but gener-
ally observed for systems consisting of fused benzene rings. Due to its low triplet level
the polymer can act as a triplet quencher if it is used in a blend system together with a
phosphorescent dopant. The energy transfer channels in such systems will be discussed
in the following chapter.
72
Chapter 4
Energy transfer in polymer blendsand doped polymer matrices
This chapter deals with energy transfer in doped polymer matrices such as blue light-
emitting spirobifluorene (co)polymer films doped with lower-energy singlet or triplet
emitters. Energy down-conversion to the lower-energy dopant was investigated employ-
ing the Streak Camera technique to study the fluorescence lifetimes of the matrix as a
function of the dopant concentration. Section 4.3 describes experiments on photonen-
ergy upconversion in metallated porphyrin doped spirocopolymer matrices and suggests
another mechanism of upconversion in anthracene-containing copolymers, namely a bi-
molecular annihilation upconversion process.
4.1 Introduction - Why blends and copolymers?
The variety of different conjugated polymer backbones and substituents which can
be attached to the polymer backbone allows for simple color tuning of the PL and
EL emission of conjugated polymers. Polyfluorene derivatives cover the blue spectral
region and there is a huge variety of different PPVs that cover the spectral region
from green to orange-red. Almost any color can be achieved with these two important
classes of conjugated polymers except the high energy part of the visible light (violet)
and the low energy end of the spectrum of visible light (red to infrared). Hence, the
question arises why to use for example polymer blends consisting of two or more con-
jugated polymers or blends consisting of a polymer matrix doped with small molecule
phosphorescent emitters or even copolymers with singlet and triplet emitters having
different colors of their emission.
The answer is manifold. First, a blend system or copolymer allows to separate the
charge carrier transport from the light emission, i.e. the transport of charges can occur
through the matrix or polymer backbone while the emission originates from the dopant
or copolymerized emitter. Since the emission of the dopant that is lower in energy is
73

4.1. Introduction - Why blends and copolymers?
sensitized, only a low concentration (typically a few wt.%) of dopant is enough to
down-convert the energy of the matrix into light emission of the dopant which can be
more efficient than the host emission [LHT+99] itself. This allows for easy color tuning
over almost the whole range of visible light just by mixing two components in different
weight concentrations. Furthermore, the emission can be shifted towards white light
by superposition of blue and yellow or blue, green and red, for instance, to create a
broad EL emission. The obvious application is indoor lighting.
Secondly, blending a polymer matrix with a phosphorescent material allows for efficient
harvesting of excited states, namely triplet states. Simple spin-statistics predict a ratio
of singlet to triplet states upon recombination of charge carriers of 1 to 3 [BOTF99],
although this ratio may not be valid for conjugated polymers in general and is still
under debate [DG02] [DGB+02] [RWL+05] [SBH+03]. Only the singlet states con-
tribute to the light emission since the triplets decay predominantly via a non-radiative
decay channel due to their long lifetimes. Additionally they may get quenched by
the high concentration of charge carriers that is present in an operating device. The
presence of a heavy metal atom (for instance in a phosphorescent dye) increases the
intersystem crossing rate by enhancing the spin-orbit coupling, thus it shortens the
phosphorescence lifetime and increases the transition from T1 to S0 via the radiative
decay channel. Additionally triplet emitters are able to capture charges so that recom-
bination occurs directly at the emitter. Furthermore, they quench the singlet states
of the matrix and convert them to triplet states which successively decay via phos-
phorescence, so that in principle each injected electron hole pair can decay via light
emission [BOY+98] [BOTF99]. Theoretically this allows for an internal efficiency close
to unity which has already been demonstrated [ABTF01]. In this context especially
phosphorescent red emitters are of special interest, since they offer several advantages.
It is not trivial to have deep red emission from a singlet emitter, since the bandgap
has to be sufficiently low, therefore the emitter has to be very electron rich. Since the
triplet level on small molecules and polymers is generally below the singlet, the low
energy region can be accessed easier. Furthermore, the sensitivity of the human eye
is important to be considered since it is has its best sensitivity in green. Therefore,
to have the same efficiency of a red emitter compared to a green emitter, even more
photons have to be emitted which is hard to achieve with singlet emitters due to the
spin statistics.
Nevertheless, there are some drawbacks of blends. In general polymers are immisci-
ble which can lead to phase separation during the spin-coating procedure. The same
problem applies to blends of polymers with small molecules which additionally face the
problem of crystallization of the dopant. Crystallization or packing of small molecules
may already occur during the film preparation or later during device operation. Due
74

Chapter 4: Energy transfer in polymer blends and doped polymer matrices
to the long lifetime of the triplet state in comparison to excited singlet states close
proximity of molecules can lead to quenching of triplets by triplet-triplet annihilation.
These issues can at least partially be circumvented by copolymerization of the intended
emitter with the polymer backbone either in conjugation or as a pendant sidegroup.
Copolymerization greatly reduces the tendency of the incorporated emitter to stack or
to crystallize. Of course, phase separation is suppressed as well, since the emitter is
locked in the backbone and low concentrations are sufficient to have sensitized emis-
sion. Additionally, copolymers with several emitters can be easily accessed which are
interesting polymers for white light emission which needs emission in the blue, green
as well as the red region of visible light.
The aim of the work presented in this chapter is to understand the energy transfer
processes in polymer blends and doped polymer matrices containing at least one addi-
tional lower energy singlet or triplet emitter. The work focusses on energy transfer to
phosphorescent dopants like the platinum-octaethyl-porphyrin to correlate the matrix
structure with the photophysical properties of the blend.
75
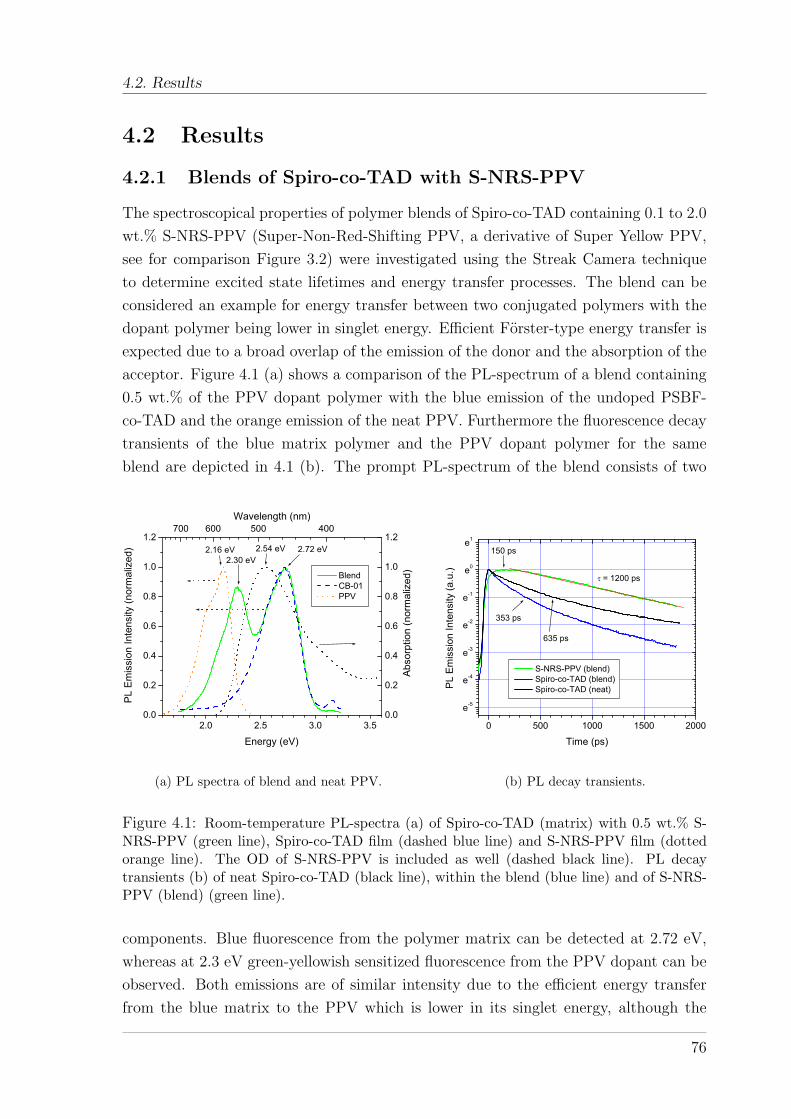
4.2. Results
4.2 Results
4.2.1 Blends of Spiro-co-TAD with S-NRS-PPV
The spectroscopical properties of polymer blends of Spiro-co-TAD containing 0.1 to 2.0
wt.% S-NRS-PPV (Super-Non-Red-Shifting PPV, a derivative of Super Yellow PPV,
see for comparison Figure 3.2) were investigated using the Streak Camera technique
to determine excited state lifetimes and energy transfer processes. The blend can be
considered an example for energy transfer between two conjugated polymers with the
dopant polymer being lower in singlet energy. Efficient Forster-type energy transfer is
expected due to a broad overlap of the emission of the donor and the absorption of the
acceptor. Figure 4.1 (a) shows a comparison of the PL-spectrum of a blend containing
0.5 wt.% of the PPV dopant polymer with the blue emission of the undoped PSBF-
co-TAD and the orange emission of the neat PPV. Furthermore the fluorescence decay
transients of the blue matrix polymer and the PPV dopant polymer for the same
blend are depicted in 4.1 (b). The prompt PL-spectrum of the blend consists of two
2.0 2.5 3.0 3.50.0
0.2
0.4
0.6
0.8
1.0
1.2
0.0
0.2
0.4
0.6
0.8
1.0
1.2700 600 500 400
2.72 eV2.54 eV2.30 eV
2.16 eV
Blend CB-01 PPV
PL E
mis
sion
Inte
nsity
(nor
mal
ized
)
Energy (eV)
Abso
rptio
n (n
orm
aliz
ed)
Wavelength (nm)
(a) PL spectra of blend and neat PPV.
0 500 1000 1500 2000
e-5
e-4
e-3
e-2
e-1
e0
e1
S-NRS-PPV (blend) Spiro-co-TAD (blend) Spiro-co-TAD (neat)
= 1200 ps
635 ps
353 ps
150 ps
PL
Em
issi
on In
tens
ity (a
.u.)
Time (ps)
(b) PL decay transients.
Figure 4.1: Room-temperature PL-spectra (a) of Spiro-co-TAD (matrix) with 0.5 wt.% S-NRS-PPV (green line), Spiro-co-TAD film (dashed blue line) and S-NRS-PPV film (dottedorange line). The OD of S-NRS-PPV is included as well (dashed black line). PL decaytransients (b) of neat Spiro-co-TAD (black line), within the blend (blue line) and of S-NRS-PPV (blend) (green line).
components. Blue fluorescence from the polymer matrix can be detected at 2.72 eV,
whereas at 2.3 eV green-yellowish sensitized fluorescence from the PPV dopant can be
observed. Both emissions are of similar intensity due to the efficient energy transfer
from the blue matrix to the PPV which is lower in its singlet energy, although the
76
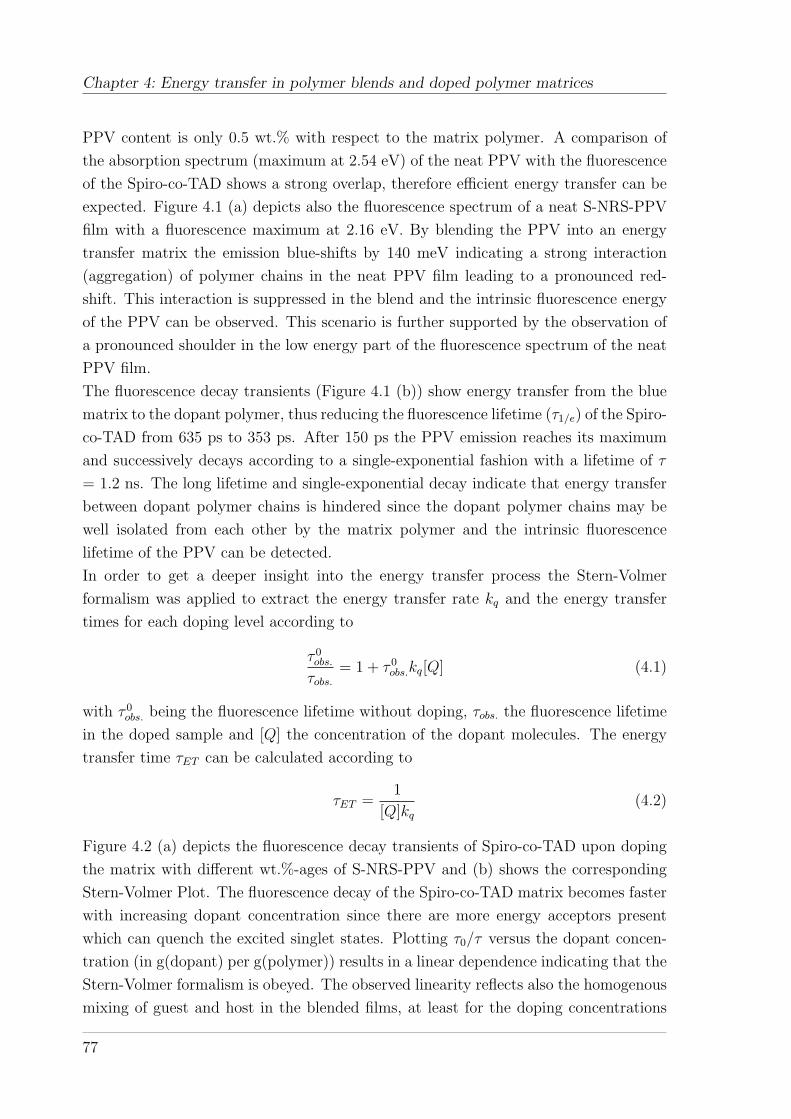
Chapter 4: Energy transfer in polymer blends and doped polymer matrices
PPV content is only 0.5 wt.% with respect to the matrix polymer. A comparison of
the absorption spectrum (maximum at 2.54 eV) of the neat PPV with the fluorescence
of the Spiro-co-TAD shows a strong overlap, therefore efficient energy transfer can be
expected. Figure 4.1 (a) depicts also the fluorescence spectrum of a neat S-NRS-PPV
film with a fluorescence maximum at 2.16 eV. By blending the PPV into an energy
transfer matrix the emission blue-shifts by 140 meV indicating a strong interaction
(aggregation) of polymer chains in the neat PPV film leading to a pronounced red-
shift. This interaction is suppressed in the blend and the intrinsic fluorescence energy
of the PPV can be observed. This scenario is further supported by the observation of
a pronounced shoulder in the low energy part of the fluorescence spectrum of the neat
PPV film.
The fluorescence decay transients (Figure 4.1 (b)) show energy transfer from the blue
matrix to the dopant polymer, thus reducing the fluorescence lifetime (τ1/e) of the Spiro-
co-TAD from 635 ps to 353 ps. After 150 ps the PPV emission reaches its maximum
and successively decays according to a single-exponential fashion with a lifetime of τ
= 1.2 ns. The long lifetime and single-exponential decay indicate that energy transfer
between dopant polymer chains is hindered since the dopant polymer chains may be
well isolated from each other by the matrix polymer and the intrinsic fluorescence
lifetime of the PPV can be detected.
In order to get a deeper insight into the energy transfer process the Stern-Volmer
formalism was applied to extract the energy transfer rate kq and the energy transfer
times for each doping level according to
τ 0obs.
τobs.
= 1 + τ 0obs.kq[Q] (4.1)
with τ 0obs. being the fluorescence lifetime without doping, τobs. the fluorescence lifetime
in the doped sample and [Q] the concentration of the dopant molecules. The energy
transfer time τET can be calculated according to
τET =1
[Q]kq
(4.2)
Figure 4.2 (a) depicts the fluorescence decay transients of Spiro-co-TAD upon doping
the matrix with different wt.%-ages of S-NRS-PPV and (b) shows the corresponding
Stern-Volmer Plot. The fluorescence decay of the Spiro-co-TAD matrix becomes faster
with increasing dopant concentration since there are more energy acceptors present
which can quench the excited singlet states. Plotting τ0/τ versus the dopant concen-
tration (in g(dopant) per g(polymer)) results in a linear dependence indicating that the
Stern-Volmer formalism is obeyed. The observed linearity reflects also the homogenous
mixing of guest and host in the blended films, at least for the doping concentrations
77
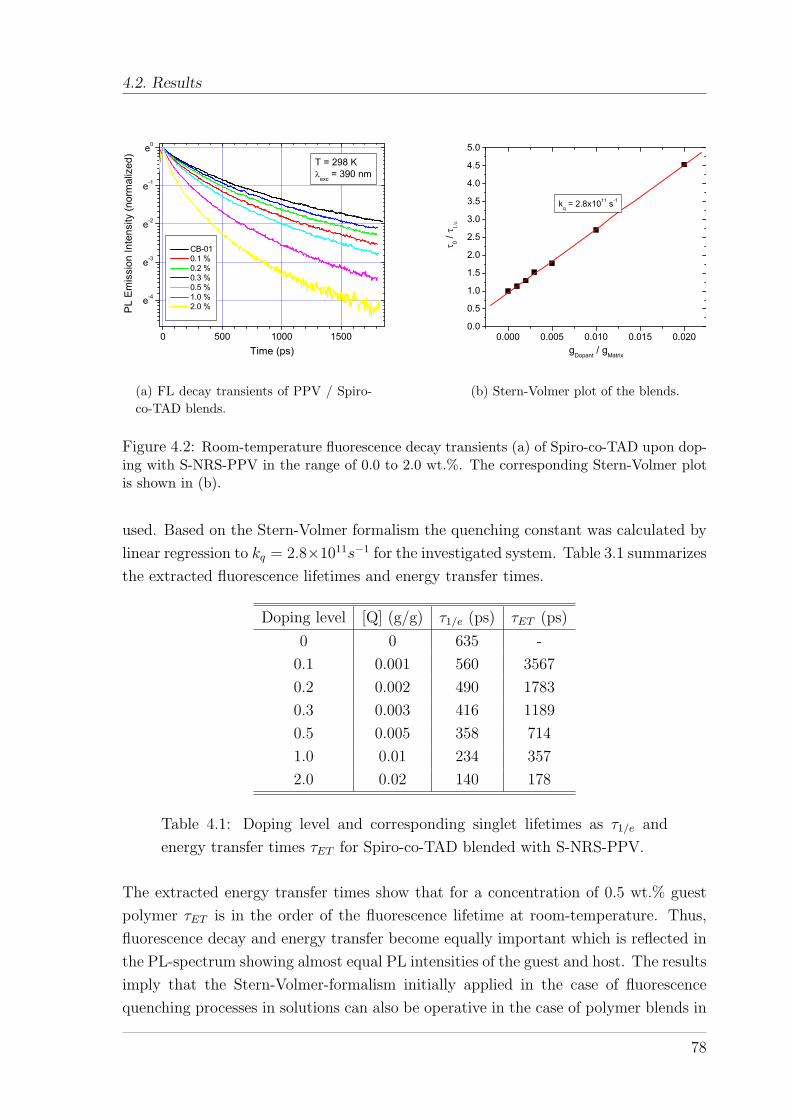
4.2. Results
0 500 1000 1500
e-4
e-3
e-2
e-1
e0
T = 298 Kexc
= 390 nm
CB-01 0.1 % 0.2 % 0.3 % 0.5 % 1.0 % 2.0 %
P
L E
mis
sion
Inte
nsity
(nor
mal
ized
)
Time (ps)
(a) FL decay transients of PPV / Spiro-co-TAD blends.
0.000 0.005 0.010 0.015 0.0200.0
0.5
1.0
1.5
2.0
2.5
3.0
3.5
4.0
4.5
5.0
kq = 2.8x10¹¹ s-1
0 /
gDopant
/ gMatrix
(b) Stern-Volmer plot of the blends.
Figure 4.2: Room-temperature fluorescence decay transients (a) of Spiro-co-TAD upon dop-ing with S-NRS-PPV in the range of 0.0 to 2.0 wt.%. The corresponding Stern-Volmer plotis shown in (b).
used. Based on the Stern-Volmer formalism the quenching constant was calculated by
linear regression to kq = 2.8×10¹¹s−1 for the investigated system. Table 3.1 summarizes
the extracted fluorescence lifetimes and energy transfer times.
Doping level [Q] (g/g) τ1/e (ps) τET (ps)
0 0 635 -
0.1 0.001 560 3567
0.2 0.002 490 1783
0.3 0.003 416 1189
0.5 0.005 358 714
1.0 0.01 234 357
2.0 0.02 140 178
Table 4.1: Doping level and corresponding singlet lifetimes as τ1/e and
energy transfer times τET for Spiro-co-TAD blended with S-NRS-PPV.
The extracted energy transfer times show that for a concentration of 0.5 wt.% guest
polymer τET is in the order of the fluorescence lifetime at room-temperature. Thus,
fluorescence decay and energy transfer become equally important which is reflected in
the PL-spectrum showing almost equal PL intensities of the guest and host. The results
imply that the Stern-Volmer-formalism initially applied in the case of fluorescence
quenching processes in solutions can also be operative in the case of polymer blends in
78

Chapter 4: Energy transfer in polymer blends and doped polymer matrices
thin films. Hence, the SV-formalism can be used to predict the energy transfer times
from a host to a guest at a given doping level.
4.2.2 Energy transfer in PSBF polymers doped with a triplet
emitter
This section contains the results of experiments on blue-emitting polymer matrices
doped with small molecule triplet emitters. One of the most investigated phospho-
rescent dyes is the platinum-octaethylporphyrin (PtOEP) [BOY+98] due to its high
intersystem crossing rate and excellent quantum efficiency which allows to prepare
OLEDs having very high efficiencies [BOTF99]. Recently, energy transfer in PtOEP
doped MeLPPP matrices has been discussed by Bagnich et al. [BIB+04] [BBN05] and
Keivanidis et al. studied energy transfer from polyfluorene to PtOEP [Kei05] as well
as upconversion fluorescence [KBM+03] which will be discussed in a following section.
The energy transfer from Spiro-matrices to PtOEP were studied for several different
matrix polymers. Due to the multitude of investigated systems only some major ex-
amples will be given in this section.
Figure 4.3 shows the fluorescence decay transients of a PSBF homopolymer matrix
0 100 200 300 400 500 600 700
e-4
e-3
e-2
e-1
e0
T = 298 K
0 wt.% 0.1 wt.% 0.2 wt.% 0.3 wt.% 0.5 wt.% 1.0 wt.%
PL
Em
issi
on In
tens
ity (n
orm
aliz
ed)
Time (ps)
(a) FL decay transients of PSBF dopedwith PtOEP.
0.000 0.005 0.010 0.0150
1
2
3
4
5
6
kq = 9.2x10¹¹ M-1s-1
0 /
PtOEP concentration (M)
(b) Stern-Volmer plot of the blends.
Figure 4.3: Room-temperature fluorescence decay transients (a) of PSBF homopolymer upondoping with PtOEP in the range of 0.0 to 1.0 wt.%. The corresponding Stern-Volmer plot isshown in (b).
doped with different concentrations of PtOEP and the corresponding Stern-Volmer
plot. With increasing the dopant concentration the fluorescence decays faster indi-
cating energy transfer from the matrix polymer to the phosphorescent dopant. From
79

4.2. Results
the slope of the Stern-Volmer plot a quenching rate of kq = 9.2 × 10¹¹M−1s−1 was
obtained. The linearity of the Stern-Volmer plot shows that the formalism is obeyed
in the investigated blend of PSBF and PtOEP. Table 3.2 contains the fluorescence life-
time of PSBF and the energy transfer times of the investigated blend. The extracted
energy transfer times indicate that PtOEP acts as a strong quencher for the excited
singlet states of the polymer matrix. Already at a dopant concentration of 0.2 wt.%
the energy transfer time matches the lifetime of the fluorescence of a non-doped PSBF
film.
Doping level [c] (mole/dm3) τ1/e (ps) τET (ps)
0 0 407 -
0.1 0.00137 282 791
0.2 0.00275 210 396
0.3 0.00412 148 264
0.5 0.00687 113 158
1.0 0.01374 67 79
Table 4.2: Doping concentration, singlet lifetimes τ1/e of the PSBF ho-
mopolymer and energy transfer times τET in PtOEP doped spirobifluorene.
The reason may be that the excited singlet states of the PSBF matrix not only transfer
to PtOEP by Forster energy transfer but also by electron transfer to the strong electron
acceptor PtOEP and successive recombination with a hole to give an excited state of
the dopant.
4.2.3 Temperature dependence of energy transfer in PtOEP
doped PSBF-co-TAD
This section deals with energy transfer from a Spiro-co-TAD matrix to PtOEP at dif-
ferent temperatures, i.e. room-temperature (296 K) and liquid nitrogen temperature
(80 K). Figure 4.4 depicts the fluorescence decay transient of Spiro-co-TAD upon dop-
ing with PtOEP at 77 K (a) and the Stern-Volmer plot (b) of the same blends at
room-temperature and at 77 K. The Stern-Volmer energy transfer constant at room
temperature is on the same order of magnitude as in the PSBF / PtOEP blend, but
the prefactor is about 30 % less. Hence energy transfer is less efficient than in the
PSBF / PtOEP blend. The energy transfer rate decreases at 77 K to 1/3 of its ini-
tial value. This is in good agreement with earlier reports about energy transfer from
polymeric hosts to guest molecules, which reported on the existence of a thermally
activated component in the energy transfer rate [LCL+00] [BRH+01].
80

Chapter 4: Energy transfer in polymer blends and doped polymer matrices
0 500 1000 1500
e-2
e-1
e0
77 K
Em
issi
on In
tens
ity (n
orm
aliz
ed)
Time (ps)
(a) FL decay transients of Spiro-co-TADdoped with PtOEP at 77 K.
0.000 0.005 0.010 0.015
1
2
3
4
5
6
7 298 K 77 K
kq = 2.3x10¹¹ M-1s-1
kq = 6.2x10¹¹ M-1s-1
0/
Dopant concentration (M)
(b) Stern-Volmer plot of the blends at 296K and at 77 K.
Figure 4.4: Low temperature (77 K) fluorescence decay transients (a) of Spiro-co-TAD upondoping with PtOEP in the range of 0.0 to 1.0 wt.%. The corresponding Stern-Volmer plotfor room-temperature and 77 K is shown in (b).
Doping (wt.%) [c] (mole/dm3) τ1/e (ps) τET (ps) τ1/e (ps) 77 K τET (ps) 77 K
0 0 681 - 908 -
0.1 0.00137 528 1174 720 3165
0.2 0.00275 347 587 621 1583
0.3 0.00412 250 391 473 1055
0.5 0.00687 186 235 370 633
1.0 0.01374 102 117 235 317
Table 4.3: Doping level, singlet lifetimes τ1/e and energy transfer times τET
for blends of Spiro-co-TAD with PtOEP at room-temperature and at 77 K.
Basically energy transfer from a polymeric host to a guest has to be described as a two
step process, i.e. diffusion of photoexcitations within the polymer matrix followed by
energy transfer to the dopant. The thermally activated component is reflected in the
observed fluorescence lifetimes at 77 K which are considerably longer than at room-
temperature and the energy transfer times that increased by a factor of approximately
3. In conclusion, at lower temperatures the exciton diffusion within the polymer host
is retarded, the consequence is the observed reduction in the energy transfer rate and
times.
It is remarkable that at room temperature already at a concentration of only 0.2 wt.%
PtOEP the energy transfer time becomes less than the observed radiative lifetime of
the non-doped film. For comparison a concentration of 0.5 wt.% S-NRS-PPV in Spiro-
81
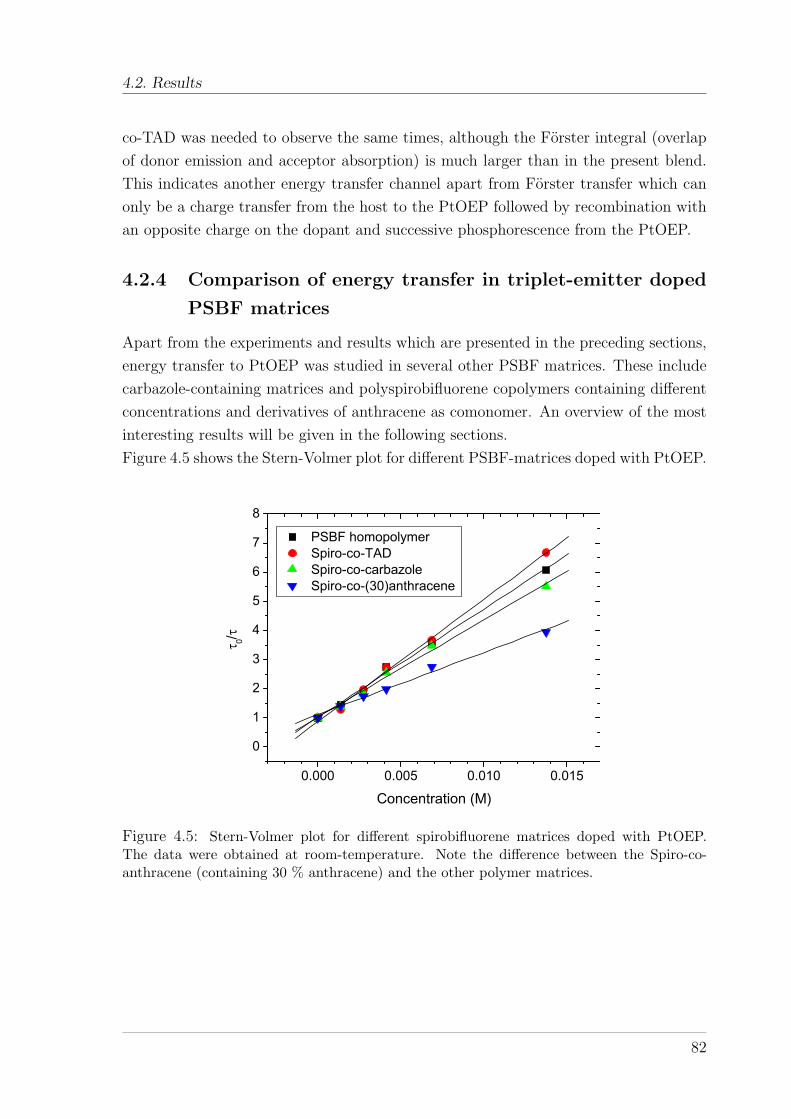
4.2. Results
co-TAD was needed to observe the same times, although the Forster integral (overlap
of donor emission and acceptor absorption) is much larger than in the present blend.
This indicates another energy transfer channel apart from Forster transfer which can
only be a charge transfer from the host to the PtOEP followed by recombination with
an opposite charge on the dopant and successive phosphorescence from the PtOEP.
4.2.4 Comparison of energy transfer in triplet-emitter doped
PSBF matrices
Apart from the experiments and results which are presented in the preceding sections,
energy transfer to PtOEP was studied in several other PSBF matrices. These include
carbazole-containing matrices and polyspirobifluorene copolymers containing different
concentrations and derivatives of anthracene as comonomer. An overview of the most
interesting results will be given in the following sections.
Figure 4.5 shows the Stern-Volmer plot for different PSBF-matrices doped with PtOEP.
0.000 0.005 0.010 0.015
0
1
2
3
4
5
6
7
8
PSBF homopolymer Spiro-co-TAD Spiro-co-carbazole Spiro-co-(30)anthracene
0/
Concentration (M)
Figure 4.5: Stern-Volmer plot for different spirobifluorene matrices doped with PtOEP.The data were obtained at room-temperature. Note the difference between the Spiro-co-anthracene (containing 30 % anthracene) and the other polymer matrices.
82
Chapter 4: Energy transfer in polymer blends and doped polymer matrices
The Stern-Volmer quenching rates obtained from the linear regression to the data
presented in Figure 4.5 are listed in the following table.
Matrix polymer τ1/e (ps) kq(M−1s−1) at 296 K
PSBF homopolymer 407 9.2× 10¹¹
Spiro-co-TAD 681 6.2× 10¹¹
Spiro-co-carbazole 386 8.7× 10¹¹
Spiro-co-(30)anthracene 769 2.8× 10¹¹
Table 4.4: Fluorescence lifetimes (without doping) and Stern-Volmer con-
stants at room-temperature for different PSBF matrices obtained from lin-
ear regression of the data presented in Figure 4.5.
Clearly, the Stern-Volmer quenching constant of the PSBF-co-(30%)anthracene doped
with PtOEP is significantly lower than compared to the other matrices. This can
already be deduced from the direct comparison of the Stern-Volmer plots presented
in Figure 4.5. It is unlikely that this effect is caused by the small difference in the
fluorescence spectra of both polymers which leads to only a small change in the overlap
of the emission of the matrix with the absorption of the guest. Furthermore the energy
transfer in such PtOEP doped systems is not exclusively of Forster type but also
PtOEP acts as strong electron scavenger since its LUMO level (-2.8 eV) is far below
the LUMO level of the polymer matrix.
In the case of anthracene-containing matrices an additional effect has to be taken
into account which leads to a quasi-reduction of the energy transfer efficiency from the
matrix to the phosphorescent dopant. Since the triplet level of the anthracene subunits
is about 1.7 eV in the polymer film it readily accepts the triplets of higher energy
phosphorescent dopants by Dexter energy transfer. This is reflected in a comparison
of the normalized PL spectra of Spiro-co-TAD and Spiro-co-(30%)anthracene doped
with PtOEP which is shown in Figure 4.6. It is obvious that the emission of the
phosphorescent dopant PtOEP in the anthracene-containing matrix is significantly
reduced to almost 10% of the emission intensity in the Spiro-co-TAD matrix which has
a higher triplet level (2.1 eV in thin films). Due to the downhill energy transfer to the
anthracene subunits the triplet level of the polymer is sensitized and bimolecular triplet-
triplet annihilation can occur within the polymer film. This leads to a repopulation
of the singlet state of the polymer, therefore a recycling of singlet states, which have
been quenched by the dopant.
Since the triplets are long-living compared to the singlet states the effect should
have an influence on the singlet decay kinetics, especially under the condition of quasi-
cw excitation. Hence, the observed quasi-less efficient energy transfer from the matrix
to PtOEP in the case of anthracene-containing polymers is a signature of repopulation
83
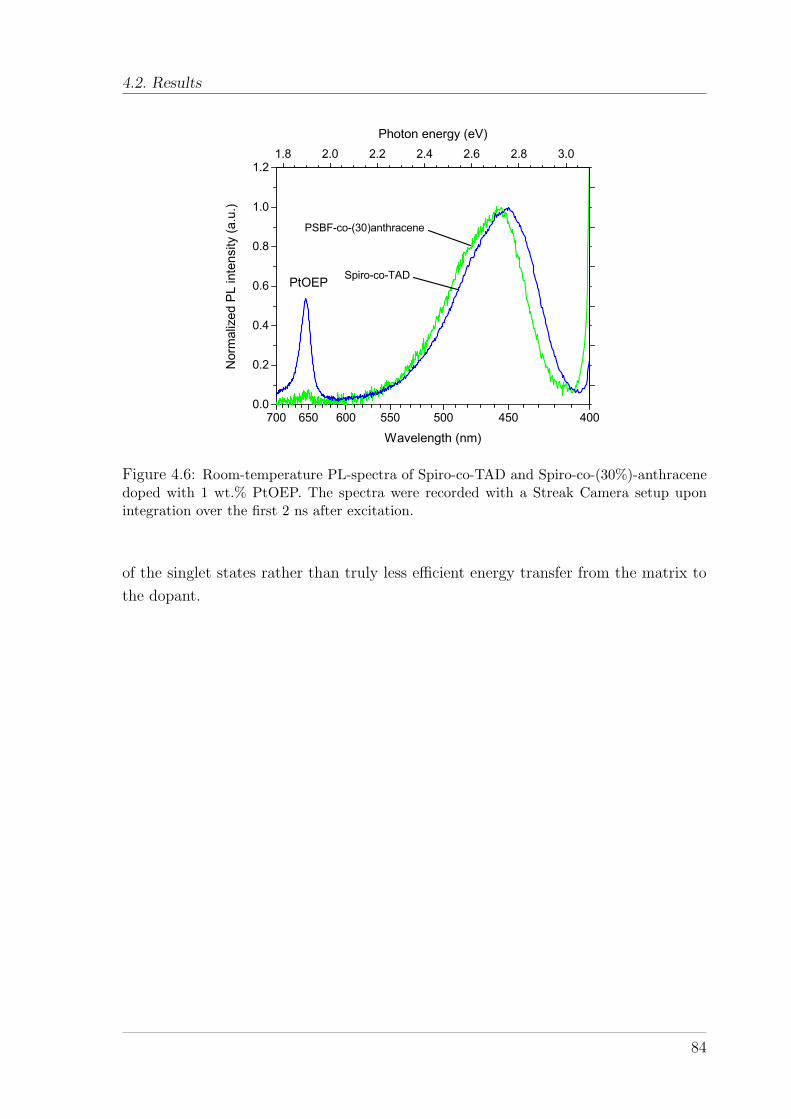
4.2. Results
700 650 600 550 500 450 4000.0
0.2
0.4
0.6
0.8
1.0
1.2
Spiro-co-TAD
PSBF-co-(30)anthracene
PtOEP
Wavelength (nm)
Nor
mal
ized
PL
inte
nsity
(a.u
.)
1.8 2.0 2.2 2.4 2.6 2.8 3.0Photon energy (eV)
Figure 4.6: Room-temperature PL-spectra of Spiro-co-TAD and Spiro-co-(30%)-anthracenedoped with 1 wt.% PtOEP. The spectra were recorded with a Streak Camera setup uponintegration over the first 2 ns after excitation.
of the singlet states rather than truly less efficient energy transfer from the matrix to
the dopant.
84
Chapter 4: Energy transfer in polymer blends and doped polymer matrices
4.3 Photon energy upconversion in PtOEP doped
PSBF matrices
In this section the results of experiments on upconversion induced fluorescence in
platinum-octaethylporphyrin (PtOEP) doped thin films of different spirobifluorene-
copolymers will be presented. Upon exciting in the range of the absorption band (2.31
eV, 537 nm) of the guest molecules, blue fluorescence from the spirobifluorene hosts was
observed. The intensity of the upconverted emission in a spirobifluorene-anthracene
copolymer was found to be one order of magnitude higher than from PtOEP doped
but anthracene free spirobifluorene copolymers and than previously reported for met-
allated porphyrin doped polyfluorene samples [KBM+03]. It is argued that the efficient
upconversion originates from triplet energy transfer from the phosphorescent dopant
to the sensitive unit of the host polymer, followed by triplet-triplet annihilation and
finally blue emission from the spirobifluorene host polymer backbone.
4.3.1 Introduction - The phenomenon of energy upconversion
The phenomenon of upconversion induced fluorescence, i.e. the generation of higher
energy photons by exciting with lower energy photons, can be achieved by different
processes, for instance two-photon absorption (TPA) using high pump laser intensi-
ties [SGSU02] [BSK+02] or multistage absorption processes involving the population
of an intermediate excited state followed by the absorption of another photon. Another
possible process is the annihilation of two triplet states, which yields vibronically ex-
cited singlet states that relax to the singlet ground state by fluorescence. Bimolecular
triplet-triplet annihilation (TTA) has been observed frequently in conjugated polymers
and is one of the main origins of delayed fluorescence apart from delayed geminate pair
recombination [HBGS01] [GB02]. Recently, efficient cw (continous wave) upconversion
fluorescence has been reported by Keivanidis et al. for metallated octaethylporphyrin
doped polyfluorene thin films [KBM+03] and by Baluschev et al. for ladder-type poly-
phenylene upon pumping the metallated porphyrin with a quasi cw-laser [BKW+05]. In
the former it was demonstrated that the pump intensities can be significantly reduced
by five orders of magnitude in comparison to two-photon excitation of polyfluorene.
In the latter a five-fold increase in upconversion efficiency in comparison to metallated
porphyrin doped polyfluorene was reported. Very recently, enhanced operational sta-
bility of upconversion fluorescence in an end-capped poly(pentaphenylene) has been
observed [BJA+05]. Nevertheless, for the application of photonenergy upconversion
the efficiency has to be further improved and the search for optimized guest-host sys-
tems is ongoing.
The test systems which are presented in this section are blue light emitting polyspirobifluorene-
85
4.3. Photon energy upconversion in PtOEP doped PSBF matrices
copolymers, especially copolymers containing different amounts of anthracene or diphenyl-
anthracene in the polymer backbone, doped with low concentrations of PtOEP. Upon
excitation of the test systems into the S0 → S1 0-0 transition of the porphyrin guest
(537 nm, 2.31 eV), upconversion induced delayed fluorescence from the polyspirobifluorene-
copolymer hosts was observed. The efficiency of upconversion was compared among the
different PSBF-hosts and with a PtOEP doped polyfluorene 2/6. It was found that the
upconverted fluorescence in the doped PSBF-co(30%)anthracene copolymer exceeded
the efficiency of the PtOEP doped anthracene free spirocopolymer and polyfluorene
thin films by almost an order of magnitude even at PtOEP concentrations as low as
0.5 wt.%. Furthermore the phosphorescence intensity of the guest molecules was consid-
erably reduced in doped films of PSBF-co-(30%)anthracene as reported in the previous
section. In the discussion of the observed results it will be argued that the mechanism
of upconversion in the case of the anthracene-containing copolymers is different from
other blue emitting polymer hosts due to the presence of anthracene. Both effects, i.e.
the increase in upconversion efficiency and the decreased guest phosphorescence, are
caused by efficient downhill triplet energy transfer from the guest to the lower triplet
level of the anthracene units of the host and successive triplet-triplet annihilation that
creates an excited blue emitting singlet state of the spirobifluorene-anthracene copoly-
mer host. This scenario is confirmed by different observations, namely a quadratic
increase of the upconverted DF intensity on pump intensity, significantly different
phosphorescence lifetimes of PtOEP in the investigated matrices and the absence of
an electric field effect on the decay kinetics of the upconverted fluorescence.
4.3.2 Experimental
4.3.2.1 Materials
PtOEP was purchased from Porphyrin System GbR and was used as received. The
polyspirobifluorene copolymers were synthesized by Covion Organic Semiconductors
GmbH. Their synthesis has been described earlier [BTS+03]. The spiropolymers stud-
ied here are copolymers with a spiro-backbone, a triarylamine unit for hole transport,
and different concentrations of an anthracene monomer. Figure 4.7 shows the chem-
ical structure of the investigated spirocopolymers and table 3.5 contains the polymer
composition.
86

Chapter 4: Energy transfer in polymer blends and doped polymer matrices
O
OO
O
x y
z
N N
Figure 4.7: Chemical structure of the polyspirobifluorene copolymers investigated as upcon-version matrices. The polymers are presumably of random type.
Matrix polymer Spiro content (x) Anthracene (y) TAD (z)
PSBF Homopolymer 100 % 0 % 0 %
Spiro-co-TAD 90 % 0 % 10 %
Spiro-co-(10%)anthracene 80 % 10 % 10 %
Spiro-co-(30%)anthracene 60 % 30 % 10 %
Table 4.5: Chemical composition of the investigated spirobifluorene copoly-
mers.
The photophysical properties of the PSBF homopolymer and the Spiro-co-TAD have
been discussed in the previous chapter. Energy transfer to phosphorescent dopants has
been discussed in the preceding sections. The Spiro-co-(10%)anthracene and the Spiro-
co-(30%)anthracene contain additionally 10% TAD since they were developed as PLED
materials and it was found that 10% TAD increases the efficiency of the blue-emitting
polymer. Polyfluorene 2/6 synthesized according to Nothofer et al. [NMM+00b] was
used to compare the efficiency of the upconversion process.
4.3.2.2 Sample preparation
Thin films for optical experiments were spin-coated from toluene solutions at 1000 rpm
for the polyfluorene 2/6, at 800 rpm for the PSBF-co-(30%)anthracene and at 1800 rpm
for Spiro-co-TAD onto pre-cleaned quartz substrates. The concentration was 1 wt.-% of
the polymer. The PtOEP doping levels were between 0.5 and 2.0 wt.-% with respect to
the polymer. The polymer films were then kept under high vacuum overnight to remove
any residual solvent and to avoid oxidation in air. The film thickness was adjusted to
about 70 nm for all samples, as measured by a TENCOR P-10 Surface Profiler. For
field quenching experiments a device structure of ITO/SiOx/Polymer/SiOx/Al was
87

4.3. Photon energy upconversion in PtOEP doped PSBF matrices
used. In order to prevent charge carrier injection into the polymer film a blocking layer
of 10 nm SiOx was thermally evaporated on cleaned ITO substrates and also on top
of the spincoated polymer film. Finally a layer of 100 nm aluminum was evaporated
as counter electrode.
4.3.2.3 Instrumentation
The absorption spectrum was measured with a Perkin-Elmer Lambda 2 spectropho-
tometer. Spectra of prompt and delayed fluorescence were recorded with an optical
multichannel analyzer (EG&G OMA III) with a time gated intensified diode array de-
tector after passing the emitted light through a spectrometer with a spectral resolution
of 0.5 nm. Prompt fluorescence was recorded with a gate width of 100 ns. A detection
window of 10 ms width was used to detect the upconverted fluorescence. Achromatic
lenses for focussing the emitted PL were used. To reduce the scattered light from the
laser excitation at 537 nm an interference filter was used in front of the spectrometer
and an additional short-pass filter was applied to reduce the phosphorescence peak of
PtOEP at 650 nm.
The samples were excited in a home-built croystat under a dynamic vacuum of 10−5
mbar reached with a turbo pump. Excitation at 2.31 eV (537 nm) was provided by an
OPO system (GWU Lasertechnik) pumped by the third harmonic of a Nd:YAG laser
with a repitition rate of 10 Hz. For excitation at 3.49 eV (355 nm) the third harmonic
of a Nd:YAG laser was used. Typical excitation intensities were 10 µJ / pulse at 3.49
eV and up to 100 µ J / pulse at 2.31 eV with a spot size of typically 2 mm in diameter.
To increase the signal-to-noise ratio the CCD was cooled and spectra were accumulated
by averaging over 100-400 pulses. No significant degradation of the polymer films could
be observed under these conditions.
4.3.3 Results
Figure 4.8 shows the normalized prompt fluorescence of a pure spiro-co-(30%)anthracene
copolymer thin film at room temperature upon excitation at 3.49 eV (355 nm) and the
normalized absorption spectrum. The prompt fluorescence is featureless at 298 K with
a maximum at 2.75 eV (451 nm). The onset of absorption is around 2.73 eV (454
nm) with virtually no optical density in the range of the absorption of the intended
guest PtOEP at 2.31 eV (537 nm). Figure 4.9 presents the prompt room temperature
emission spectra of 2 wt.% PtOEP doped thin films of the spiro-co-(30%)anthracene
and the spiro-co-TAD with polyfluorene 2/6 upon excitation of the guest molecules at
2.31 eV (537 nm). The spectra were recorded with an integration time of 10 ms and
an interference filter was applied to suppress the intense laser peak and a short-pass
88

Chapter 4: Energy transfer in polymer blends and doped polymer matrices
2.0 2.5 3.0 3.5 4.00.0
0.2
0.4
0.6
0.8
1.0
1.2
0.0
0.2
0.4
0.6
0.8
1.0
1.2700 600 500 400
PL
Em
issi
on In
tens
ity (n
orm
aliz
ed)
Energy (eV)
3.21 eV3.64 eV
2.75 eV
A
bsor
ptio
n (n
orm
aliz
ed)
Wavelength (nm)
Figure 4.8: Normalized room temperature prompt fluorescence spectrum of a thin film ofspiro-co-(30%)anthracene excited at 3.49 eV (355 nm) with an intensity of 10 µJ / pulse andnormalized absorption of a thin film.
glass filter was used to reduce the guest emission around 650 nm. From the doped
polyfluorene film, upconverted fluorescence was observed at 2.95 eV (420 nm) with a
vibronic feature at 2.80 eV (443 nm). This is in accordance with earlier reports of
polyfluorene emission spectra [HBGS01] and confirms the observation of upconversion
fluorescence as reported earlier [KBM+03] All spectra show another emission peaking
at 1.91 eV (650 nm) which corresponds to the phosphorescence of the porphyrin triplet
state.
Under equal experimental conditions, the PtOEP doped Spiro-co-(30%)anthracene
showed considerably increased upconverted blue fluorescence at 2.75 eV (450 nm) in
comparison to the doped Spiro-co-TAD and doped polyfluorene thin film. The up-
converted blue emission intensity of the doped Spiro-co-TAD was found to be slightly
weaker compared to the doped polyfluorene films. Thus, the presence of anthracene ap-
pears to be the reason for the increased upconversion efficiency. The spectral position
of the emission of the spirobifluorene-anthracene copolymer is equivalent to the prompt
fluorescence spectrum of an non-doped thin film (see Figure 4.8). Only the low energy
tail of the PL is cut off due to the filter. In comparison to the upconverted fluorescence
from the Spiro-co-TAD and the polyfluorene sample, the fluorescence peak intensity is
89
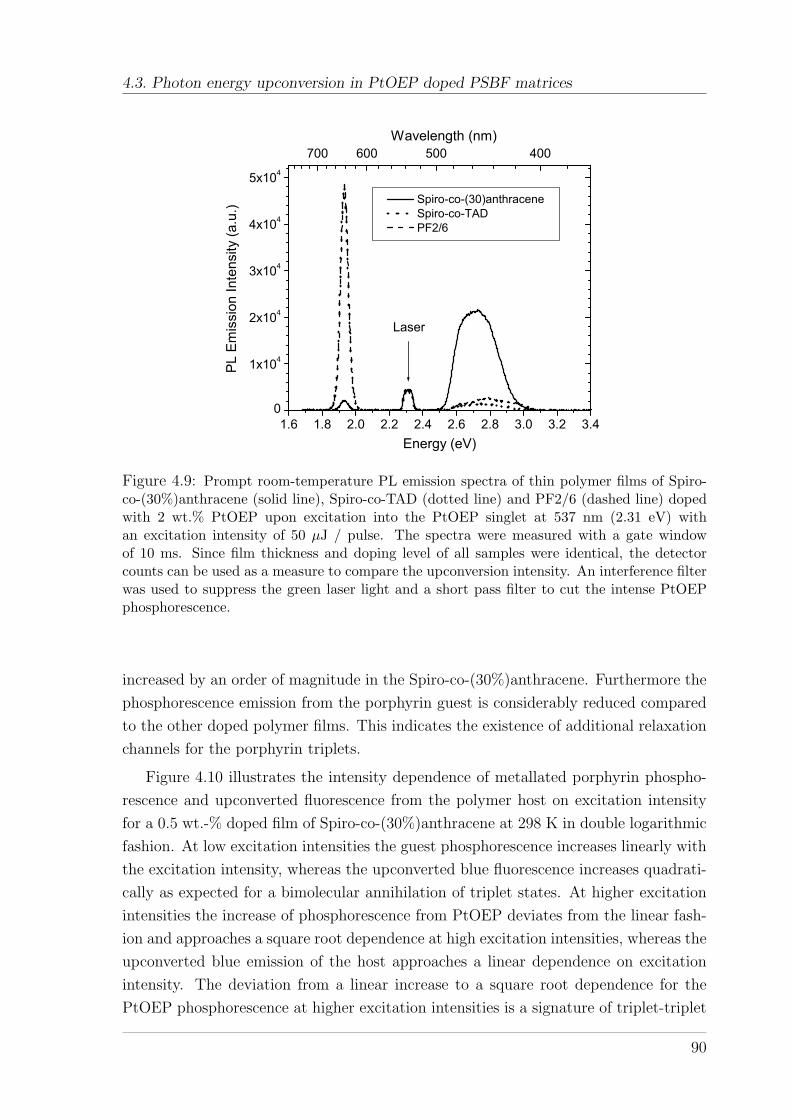
4.3. Photon energy upconversion in PtOEP doped PSBF matrices
1.6 1.8 2.0 2.2 2.4 2.6 2.8 3.0 3.2 3.40
1x10⁴
2x10⁴
3x10⁴
4x10⁴
5x10⁴
700 600 500 400
Laser
Spiro-co-(30)anthracene Spiro-co-TAD PF2/6
PL
Em
issi
on In
tens
ity (a
.u.)
Energy (eV)
Wavelength (nm)
Figure 4.9: Prompt room-temperature PL emission spectra of thin polymer films of Spiro-co-(30%)anthracene (solid line), Spiro-co-TAD (dotted line) and PF2/6 (dashed line) dopedwith 2 wt.% PtOEP upon excitation into the PtOEP singlet at 537 nm (2.31 eV) withan excitation intensity of 50 µJ / pulse. The spectra were measured with a gate windowof 10 ms. Since film thickness and doping level of all samples were identical, the detectorcounts can be used as a measure to compare the upconversion intensity. An interference filterwas used to suppress the green laser light and a short pass filter to cut the intense PtOEPphosphorescence.
increased by an order of magnitude in the Spiro-co-(30%)anthracene. Furthermore the
phosphorescence emission from the porphyrin guest is considerably reduced compared
to the other doped polymer films. This indicates the existence of additional relaxation
channels for the porphyrin triplets.
Figure 4.10 illustrates the intensity dependence of metallated porphyrin phospho-
rescence and upconverted fluorescence from the polymer host on excitation intensity
for a 0.5 wt.-% doped film of Spiro-co-(30%)anthracene at 298 K in double logarithmic
fashion. At low excitation intensities the guest phosphorescence increases linearly with
the excitation intensity, whereas the upconverted blue fluorescence increases quadrati-
cally as expected for a bimolecular annihilation of triplet states. At higher excitation
intensities the increase of phosphorescence from PtOEP deviates from the linear fash-
ion and approaches a square root dependence at high excitation intensities, whereas the
upconverted blue emission of the host approaches a linear dependence on excitation
intensity. The deviation from a linear increase to a square root dependence for the
PtOEP phosphorescence at higher excitation intensities is a signature of triplet-triplet
90
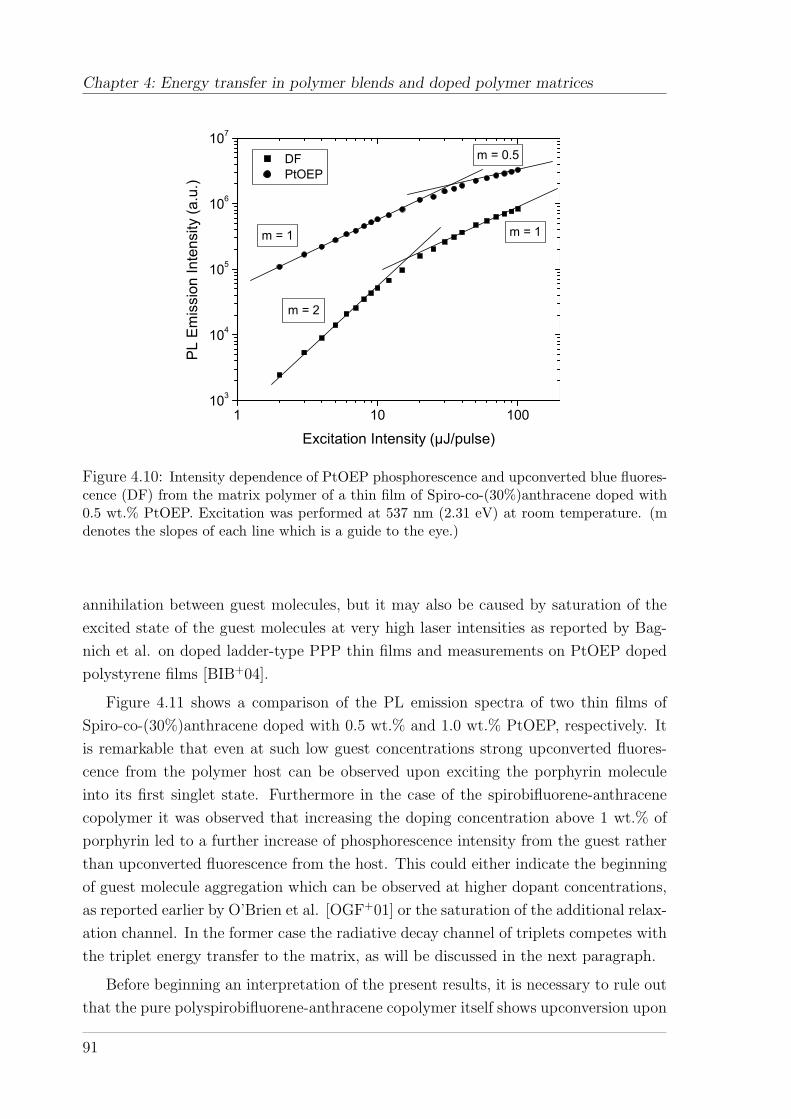
Chapter 4: Energy transfer in polymer blends and doped polymer matrices
1 10 100103
104
105
106
107
m = 0.5
m = 1m = 1
m = 2
PL
Em
issi
on In
tens
ity (a
.u.)
Excitation Intensity (µJ/pulse)
DF PtOEP
Figure 4.10: Intensity dependence of PtOEP phosphorescence and upconverted blue fluores-cence (DF) from the matrix polymer of a thin film of Spiro-co-(30%)anthracene doped with0.5 wt.% PtOEP. Excitation was performed at 537 nm (2.31 eV) at room temperature. (mdenotes the slopes of each line which is a guide to the eye.)
annihilation between guest molecules, but it may also be caused by saturation of the
excited state of the guest molecules at very high laser intensities as reported by Bag-
nich et al. on doped ladder-type PPP thin films and measurements on PtOEP doped
polystyrene films [BIB+04].
Figure 4.11 shows a comparison of the PL emission spectra of two thin films of
Spiro-co-(30%)anthracene doped with 0.5 wt.% and 1.0 wt.% PtOEP, respectively. It
is remarkable that even at such low guest concentrations strong upconverted fluores-
cence from the polymer host can be observed upon exciting the porphyrin molecule
into its first singlet state. Furthermore in the case of the spirobifluorene-anthracene
copolymer it was observed that increasing the doping concentration above 1 wt.% of
porphyrin led to a further increase of phosphorescence intensity from the guest rather
than upconverted fluorescence from the host. This could either indicate the beginning
of guest molecule aggregation which can be observed at higher dopant concentrations,
as reported earlier by O’Brien et al. [OGF+01] or the saturation of the additional relax-
ation channel. In the former case the radiative decay channel of triplets competes with
the triplet energy transfer to the matrix, as will be discussed in the next paragraph.
Before beginning an interpretation of the present results, it is necessary to rule out
that the pure polyspirobifluorene-anthracene copolymer itself shows upconversion upon
91
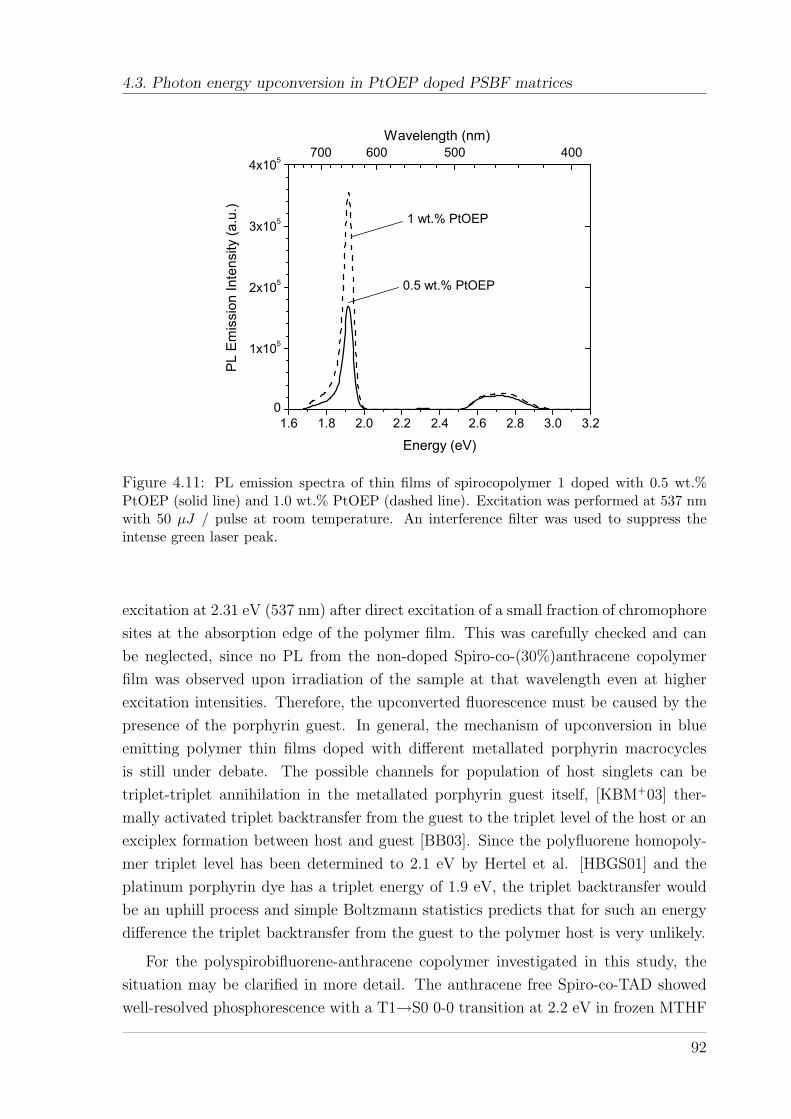
4.3. Photon energy upconversion in PtOEP doped PSBF matrices
1.6 1.8 2.0 2.2 2.4 2.6 2.8 3.0 3.20
1x10⁵
2x10⁵
3x10⁵
4x105700 600 500 400
0.5 wt.% PtOEP
1 wt.% PtOEP
PL
Em
issi
on In
tens
ity (a
.u.)
Energy (eV)
Wavelength (nm)
Figure 4.11: PL emission spectra of thin films of spirocopolymer 1 doped with 0.5 wt.%PtOEP (solid line) and 1.0 wt.% PtOEP (dashed line). Excitation was performed at 537 nmwith 50 µJ / pulse at room temperature. An interference filter was used to suppress theintense green laser peak.
excitation at 2.31 eV (537 nm) after direct excitation of a small fraction of chromophore
sites at the absorption edge of the polymer film. This was carefully checked and can
be neglected, since no PL from the non-doped Spiro-co-(30%)anthracene copolymer
film was observed upon irradiation of the sample at that wavelength even at higher
excitation intensities. Therefore, the upconverted fluorescence must be caused by the
presence of the porphyrin guest. In general, the mechanism of upconversion in blue
emitting polymer thin films doped with different metallated porphyrin macrocycles
is still under debate. The possible channels for population of host singlets can be
triplet-triplet annihilation in the metallated porphyrin guest itself, [KBM+03] ther-
mally activated triplet backtransfer from the guest to the triplet level of the host or an
exciplex formation between host and guest [BB03]. Since the polyfluorene homopoly-
mer triplet level has been determined to 2.1 eV by Hertel et al. [HBGS01] and the
platinum porphyrin dye has a triplet energy of 1.9 eV, the triplet backtransfer would
be an uphill process and simple Boltzmann statistics predicts that for such an energy
difference the triplet backtransfer from the guest to the polymer host is very unlikely.
For the polyspirobifluorene-anthracene copolymer investigated in this study, the
situation may be clarified in more detail. The anthracene free Spiro-co-TAD showed
well-resolved phosphorescence with a T1→S0 0-0 transition at 2.2 eV in frozen MTHF
92

Chapter 4: Energy transfer in polymer blends and doped polymer matrices
solution (see Figure 3.34). Since it is unlikely that the triplet state of the spiro
chain segments is affected by the incorporation of anthracene molecules, a similar
phosphorescence spectrum should have been expected for the anthracene containing
copolymer as well. However, low temperature (77 K) time-resolved measurements of
diluted frozen MTHF solutions of Spiro-co-(30%)anthracene showed no phosphores-
cence from the spiro-segments at 2.2 eV, but instead weak phosphorescence at 1.76
eV. This value corresponds to the phosphorescence energy observed for anthracene. It
appears that the incorporated anthracene units quench the phosphorescence from the
spiro-segments on the polymer backbone very efficiently via a downhill energy transfer
process. Successively, the triplet decays predominantly at the anthracene moieties via
a radiative or non-radiative process to the ground state and no phosphorescence from
the spiro-segments can be observed. In metallated porphyrin doped films of Spiro-co-
(30%)anthracene the guest triplets can be transferred to the triplet state of anthracene
(ET = energy transfer) since this is a downhill process as depicted in Figure 4.12.
Ener
gy
S0 (Spiro)
T1 (Anthracene)
T1 (Spiro)
S1 (Spiro)
T1(PtOEP)
S1(PtOEP)
1.91 eV
2.31 eV
2.75 eV
2.1 eV
1.7 eV
ISCET
TTA
Delayed Fluorescence
Time after excitation
S0 (PtOEP)
hn
Figure 4.12: Schematic representation of the energy levels and transfer mechanism in thePtOEP doped Spiro-co-(30%)anthracene that lead to the upconverted delayed fluorescence.Note that additional energy transfer channels are present which are not shown, for instance,the non-radiative decay of triplet states.
The anthracene triplets can successively undergo triplet-triplet annihilation (TTA)
with another triplet transferred from the guest molecules (homo-triplet-annihilation)
or with a triplet of the dopant (hetero-triplet-annihilation) to form an excited singlet
state of the spirobifluorene-anthracene copolymer which can successively decay yielding
blue fluorescence.
Based on this scenario, one could argue that the guest phosphorescence should
be quenched almost completely, as it has been reported earlier on doped PPV films
[LIKB03] As shown in Figure 4.9 a considerable quenching of the guest phosphores-
93
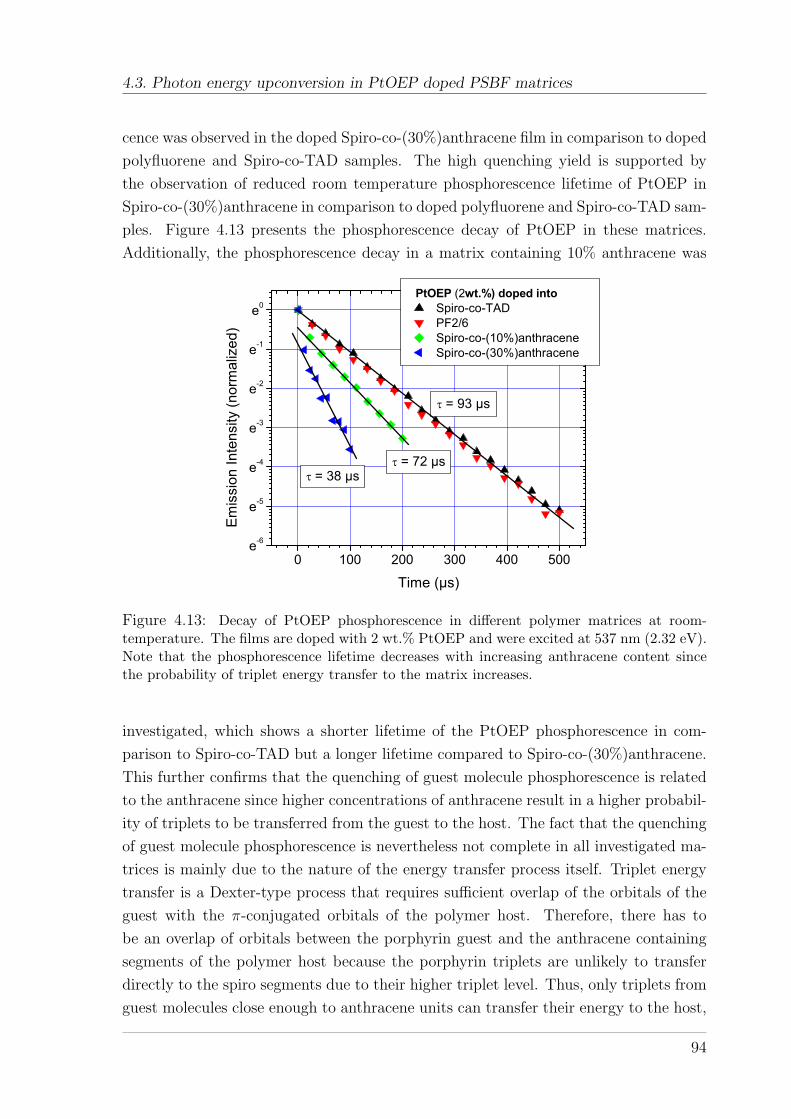
4.3. Photon energy upconversion in PtOEP doped PSBF matrices
cence was observed in the doped Spiro-co-(30%)anthracene film in comparison to doped
polyfluorene and Spiro-co-TAD samples. The high quenching yield is supported by
the observation of reduced room temperature phosphorescence lifetime of PtOEP in
Spiro-co-(30%)anthracene in comparison to doped polyfluorene and Spiro-co-TAD sam-
ples. Figure 4.13 presents the phosphorescence decay of PtOEP in these matrices.
Additionally, the phosphorescence decay in a matrix containing 10% anthracene was
0 100 200 300 400 500e-6
e-5
e-4
e-3
e-2
e-1
e0
= 38 µs = 72 µs
= 93 µs
Em
issi
on In
tens
ity (n
orm
aliz
ed)
Time (µs)
PtOEP (2wt.%) doped into Spiro-co-TAD PF2/6 Spiro-co-(10%)anthracene Spiro-co-(30%)anthracene
Figure 4.13: Decay of PtOEP phosphorescence in different polymer matrices at room-temperature. The films are doped with 2 wt.% PtOEP and were excited at 537 nm (2.32 eV).Note that the phosphorescence lifetime decreases with increasing anthracene content sincethe probability of triplet energy transfer to the matrix increases.
investigated, which shows a shorter lifetime of the PtOEP phosphorescence in com-
parison to Spiro-co-TAD but a longer lifetime compared to Spiro-co-(30%)anthracene.
This further confirms that the quenching of guest molecule phosphorescence is related
to the anthracene since higher concentrations of anthracene result in a higher probabil-
ity of triplets to be transferred from the guest to the host. The fact that the quenching
of guest molecule phosphorescence is nevertheless not complete in all investigated ma-
trices is mainly due to the nature of the energy transfer process itself. Triplet energy
transfer is a Dexter-type process that requires sufficient overlap of the orbitals of the
guest with the π-conjugated orbitals of the polymer host. Therefore, there has to
be an overlap of orbitals between the porphyrin guest and the anthracene containing
segments of the polymer host because the porphyrin triplets are unlikely to transfer
directly to the spiro segments due to their higher triplet level. Thus, only triplets from
guest molecules close enough to anthracene units can transfer their energy to the host,
94

Chapter 4: Energy transfer in polymer blends and doped polymer matrices
whereas any platinum porphyrin being surrounded by spiro chain segments (or other
PtOEP molecules) will relax from its triplet state via phosphorescence. Additionally,
it has to be taken into account that PtOEP tends to aggregate at higher doping con-
centrations [OGF+01]. Aggregation leads to a decrease of the surface area between
guest and host, and triplets may decay within the aggregate rather than diffuse to the
grain boundary to transfer to the host. Furthermore, higher dopant concentrations
may lead to a saturation of the additional relaxation channel, i.e. the triplet transfer
from PtOEP to the anthracene in the spirocopolymer. One additional effect has to
be taken into consideration that may limit the upconversion efficiency. In principal
the increase of upconversion efficiency should be much more pronounced when going
from a polymer with a higher triplet state than the dopant to a polymer with a lower
triplet state according to the exothermic nature of the downhill energy transfer. Nev-
ertheless, the peak intensity increased by one order of magnitude only. This may be
mainly due to the non-radiative relaxation channel of triplets that grows exponentially
for decreasing triplet energies in conjugated polymers as described by the energy gap
law [WCAM+01]. Thus, for a triplet energy of 1.76 eV the majority of triplets should
rather decay non-radiatively than via phosphorescence or by triplet-triplet annihilation
(TTA). Additionally, a singlet state of the polymer that is populated by TTA can, of
course, be quenched again by the lower singlet state of the platinum-porphyrin dye.
One may argue that the origin of the upconverted fluorescence could also be a charged
glass substrate
ITO layer
SiOx
aluminumLaser
Fluorescence
Phosphorescence
PtOEP
Figure 4.14: Scheme of the device setup used for field quenching experiments. Thin siliconoxide layers (SiOx) prevent charge carrier injection from the electrodes upon application ofan electric field.
exciplex state like reported by Bagnich et al. for PtOEP doped MeLPPP films [BB03].
In this case the upconverted fluorescence decay should be highly sensitive to an electric
95

4.3. Photon energy upconversion in PtOEP doped PSBF matrices
field. Therefore, we studied the decay kinetics of both, the phosphorescence of PtOEP
and the upconverted fluorescence from the spirocopolymer host under an applied elec-
tric field. Figure 4.14 shows the device setup that has been used to study the influence
of an electric field on the decay kinetics. No effect of the electric field on the decay
kinetics was observed as shown in Figure 4.15, which compares the integral decay ki-
netics of both emissions in a device consisting of Spiro-co-(30%)anthracene doped with
1 wt.% PtOEP at zero electric field and at an electric field of F = 106 V/cm. This
0.1 1 10 100
104
105
106
PL
Em
issi
on In
tens
ity (a
.u.)
Time (µs)
DF 10V PtOEP 10V DF 0V PtOEP 0V
Figure 4.15: Integral decay kinetics of phosphorescence from PtOEP and upconverted flu-orescence (DF) from the Spiro-co-(30%)anthracene matrix at zero electric field (open char-acters) and at an electric field of F = 106 V/cm (solid characters) at room temperature.Concentration of PtOEP was 1 wt.% and excitation was performed at 537 nm (2.31 eV). Agate window of 10 ms was chosen for the detection.
is in clear contrast to the earlier reported abrupt decay of delayed fluorescence that
was observed in PtOEP doped MeLPPP devices under electric field conditions [BB03]
and it indicates that the upconverted fluorescence is rather caused by triplet-triplet
annihilation than an exciplex between the guest and the host.
4.3.4 Discussion and Outlook
The results described in the previous sections emphasize the importance of a careful
consideration of all energy levels that are present in a conjugated copolymer, especially
if these polymers are used as matrices in blends with triplet emitters. A copolymer with
a low triplet level like the presented anthracene-containing copolymer results in poor
96
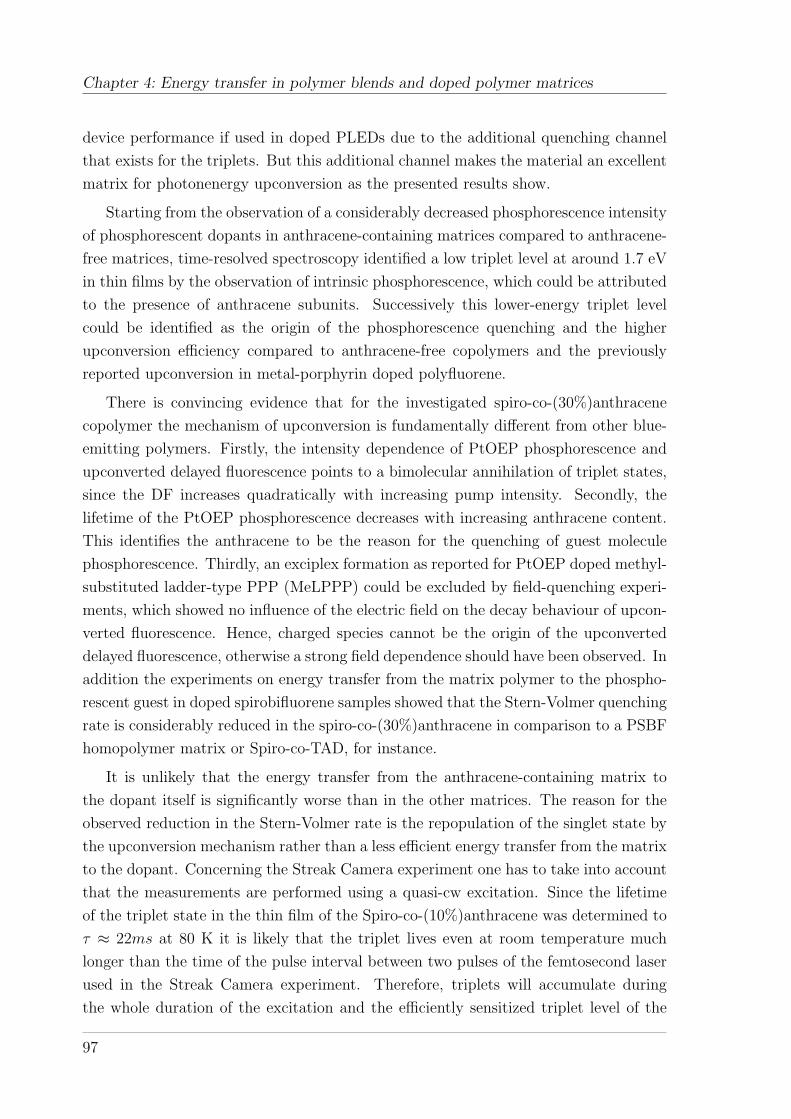
Chapter 4: Energy transfer in polymer blends and doped polymer matrices
device performance if used in doped PLEDs due to the additional quenching channel
that exists for the triplets. But this additional channel makes the material an excellent
matrix for photonenergy upconversion as the presented results show.
Starting from the observation of a considerably decreased phosphorescence intensity
of phosphorescent dopants in anthracene-containing matrices compared to anthracene-
free matrices, time-resolved spectroscopy identified a low triplet level at around 1.7 eV
in thin films by the observation of intrinsic phosphorescence, which could be attributed
to the presence of anthracene subunits. Successively this lower-energy triplet level
could be identified as the origin of the phosphorescence quenching and the higher
upconversion efficiency compared to anthracene-free copolymers and the previously
reported upconversion in metal-porphyrin doped polyfluorene.
There is convincing evidence that for the investigated spiro-co-(30%)anthracene
copolymer the mechanism of upconversion is fundamentally different from other blue-
emitting polymers. Firstly, the intensity dependence of PtOEP phosphorescence and
upconverted delayed fluorescence points to a bimolecular annihilation of triplet states,
since the DF increases quadratically with increasing pump intensity. Secondly, the
lifetime of the PtOEP phosphorescence decreases with increasing anthracene content.
This identifies the anthracene to be the reason for the quenching of guest molecule
phosphorescence. Thirdly, an exciplex formation as reported for PtOEP doped methyl-
substituted ladder-type PPP (MeLPPP) could be excluded by field-quenching experi-
ments, which showed no influence of the electric field on the decay behaviour of upcon-
verted fluorescence. Hence, charged species cannot be the origin of the upconverted
delayed fluorescence, otherwise a strong field dependence should have been observed. In
addition the experiments on energy transfer from the matrix polymer to the phospho-
rescent guest in doped spirobifluorene samples showed that the Stern-Volmer quenching
rate is considerably reduced in the spiro-co-(30%)anthracene in comparison to a PSBF
homopolymer matrix or Spiro-co-TAD, for instance.
It is unlikely that the energy transfer from the anthracene-containing matrix to
the dopant itself is significantly worse than in the other matrices. The reason for the
observed reduction in the Stern-Volmer rate is the repopulation of the singlet state by
the upconversion mechanism rather than a less efficient energy transfer from the matrix
to the dopant. Concerning the Streak Camera experiment one has to take into account
that the measurements are performed using a quasi-cw excitation. Since the lifetime
of the triplet state in the thin film of the Spiro-co-(10%)anthracene was determined to
τ ≈ 22ms at 80 K it is likely that the triplet lives even at room temperature much
longer than the time of the pulse interval between two pulses of the femtosecond laser
used in the Streak Camera experiment. Therefore, triplets will accumulate during
the whole duration of the excitation and the efficiently sensitized triplet level of the
97

4.3. Photon energy upconversion in PtOEP doped PSBF matrices
polymer will result in continous triplet-triplet annihilation which causes a background
emission of upconverted delayed fluorescence.
In conclusion the phenomena of upconversion which has been successfully studied
in our group over the past years has been extended to a more efficient system for
photonenergy upconversion in the solid state by this work. The intensities that have
to be used for the upconversion process are in the kilowatt-region, therefore much
lower than typically used for two-photon excitation. It should be possible to further
improve the upconversion efficiency by modification of the matrix polymer triplet lev-
els, for instance. A blue-emitting copolymer with a slightly higher triplet level than
the anthracene-containing copolymers could reduce the non-radiative decay channel of
triplet states while keeping the downhill triplet transfer mechanism working which is a
prerequisite for the efficient upconversion process. Even shifting the triplet level of the
polymer to higher energies towards the PtOEP may increase the efficiency since not
necessarily the triplet-triplet-fusion has to occur in the matrix. Hetero-triplet annihi-
lation between a triplet at the matrix polymer and a PtOEP triplet could also provide
enough energy to excite the singlet state of the matrix polymer.
98

Chapter 5
Charge carrier transport inπ-conjugated polymers
The following chapter deals with charge carrier transport in π-conjugated polymers.
The hole mobility of a series of spiro-bifluorene polymers was studied using a modified
time-of-flight (TOF) technique, namely the charge-generation-layer TOF technique.
Hole mobilities were determined over a wide range of electric fields and temperatures
to get a deeper insight into the charge transport in conjugated polymers, especially
in the PSBF copolymers. Experimentally obtained results were described by the well-
established disorder model of charge transport proposed by Bassler and coworkers
[BB93] [BPB91a] [BPB91b]. Before beginning the presentation and discussion of the
results obtained during this work the theoretical background of charge transport will
be discussed.
5.1 Introduction - Theoretical background
5.1.1 Charge carrier generation
Intrinsic charge carrier photogeneration is not a trivial process in organic molecules
/ semiconductors. Because the exciton binding energy, Eb, of a singlet exciton in a
conjugated polymer is of the order of 0.5 eV or larger [OWS+03] [B97] [AB04], the
dissociation into free charge carriers, i.e. an electron and a hole needs excess energy
to overcome the coulomb attraction. Since the thermally provided energy kT is at
room-temperature about 25 meV, the dissociation of a relaxed singlet exciton without
further energy is very unlikely. This has already been known from earlier studies
of charge carrier generation in organic crystals where the exciton binding energy is
even larger (1 eV) since the extension of an exciton located on a small molecule is
on the order of 0.1 nm only [PS99], whereas the extension of a singlet exciton in a
conjugated polymer is about 1 nm [vdHBMB01] [RBGS01]. Unfortunately, there is
99

5.1. Introduction - Theoretical background
no direct method to measure the exciton binding energy in conjugated polymers since
the oscillator strength of the transition from an exciton to unbound charge carriers
is vanishingly small. The only exception are high quality diacetylene crystals, where
the singlet exciton transition and the band to band transition have been measured
employing the electro-reflection method. A value of Eb ∼ 0.6eV was determined for
various polydiacetylene crystals [HWBE95]. Due to the large value of Eb in organic
molecules the rate constant of exciton dissociation cannot compete with the intrinsic
decay processes, i.e. the radiative decay of an excited singlet state via fluorescence,
for instance. However, action spectra of photoconductivity in conjugated polymers
showed that photoconduction already starts at the optical absorption edge [Hee97].
Hence, there is a chance for the dissociation of an exciton but mostly due to exciton
breaking at an electrode [BBSM98] or via charge transfer to dopants, which can be
extrinsic or intrinsic [IEB+02]. Truly intrinsic charge carrier photogeneration always
requires a strong electric field to break the exciton [AB04], excess photon energy to
excite into higher singlet states or higher photon dose to enter the regime of singlet-
singlet annihilation [HNK+99] [HRS+01].
In organic materials the generation of free charge carriers from a singlet exciton is
a multistep process. Between the relaxed singlet exciton and the free charge carriers
an intermediate state plays an important role in the photophysics of organic solids
which is a coulombically bound electron-hole pair, termed geminate pair (GP) [PS99].
In organic crystals the GP is metastable relative to the S1 exciton and much shorter
lived than the S1 state unless traps are present [PS99]. Hence, in disordered organic
solids, e.g. conjugated polymers [FNF+02], their lifetime is greatly extended due to
the inherent presence of traps which help to create a GP from an excited singlet state.
The existence of GPs in conjugated polymers has been proven by several observations,
for example, the occurrence of thermally stimulated luminescence [KSV+01] [KVB+04]
and the observation of a strong electric field effect on the delayed fluorescence intensity
in MeLPPP [SASB99] and PhPPV [GB02] samples. As discussed in the first chapter
delayed fluorescence can be caused by triplet-triplet annihilation and geminate pair
recombination, but only GPs should react on an electric field since triplets are non-
charged species.
The question of how GPs are formed in organic materials is of crucial importance
in understanding photoconductivity. The initial event in molecular crystals is a field-
and temperature-independent autoionization of a Franck-Condon state with sufficient
energy. The generated GP can successively either recombine or fully dissociate during
the field- and temperature-assisted Brownian motion. The latter process is described
by Onsager’s theory [Ons38] where the field and temperature dependence is entirely
100
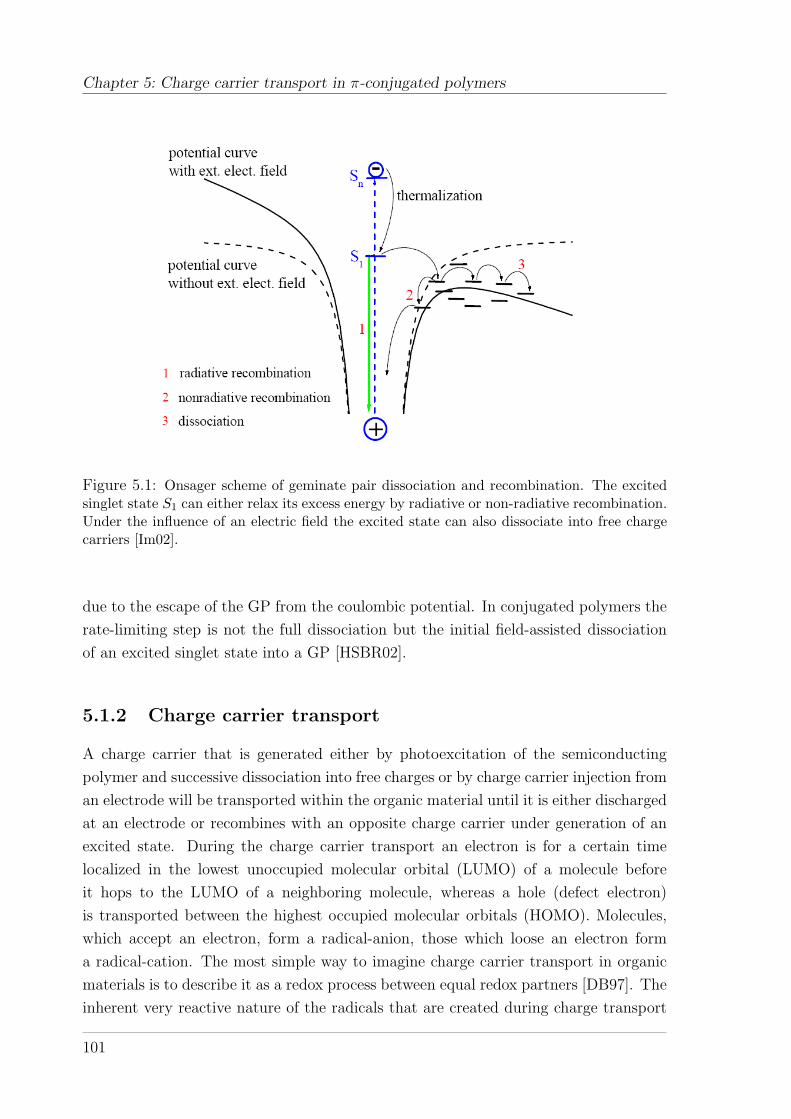
Chapter 5: Charge carrier transport in π-conjugated polymers
Figure 5.1: Onsager scheme of geminate pair dissociation and recombination. The excitedsinglet state S1 can either relax its excess energy by radiative or non-radiative recombination.Under the influence of an electric field the excited state can also dissociate into free chargecarriers [Im02].
due to the escape of the GP from the coulombic potential. In conjugated polymers the
rate-limiting step is not the full dissociation but the initial field-assisted dissociation
of an excited singlet state into a GP [HSBR02].
5.1.2 Charge carrier transport
A charge carrier that is generated either by photoexcitation of the semiconducting
polymer and successive dissociation into free charges or by charge carrier injection from
an electrode will be transported within the organic material until it is either discharged
at an electrode or recombines with an opposite charge carrier under generation of an
excited state. During the charge carrier transport an electron is for a certain time
localized in the lowest unoccupied molecular orbital (LUMO) of a molecule before
it hops to the LUMO of a neighboring molecule, whereas a hole (defect electron)
is transported between the highest occupied molecular orbitals (HOMO). Molecules,
which accept an electron, form a radical-anion, those which loose an electron form
a radical-cation. The most simple way to imagine charge carrier transport in organic
materials is to describe it as a redox process between equal redox partners [DB97]. The
inherent very reactive nature of the radicals that are created during charge transport
101

5.1. Introduction - Theoretical background
can already cause problems in terms of stability of the organic material if, for instance,
oxygen or water are present which lead to a degradation.
Of course, the processes that occur during charge transport are more complicated in
organic materials than described so far, since the inherent disorder causes the HOMO
and LUMO levels to be distributed in energy rather than of constant energy. The
origin of the distribution of energies is the same that causes the distribution of excited
and ground state energies, i.e. the presence of an ensemble of different conjugation
lengths that exist in a conjugated polymer due to kinks in the polymer chain and the
different interaction of chain segments with their environment. The most often used
type of distribution of energies is a Gaussian distribution which is described by the
width σ [B93]. Transport descriptions which are based on the Gaussian distribution
of transport sites will be discussed in more detail later. Figure 5.2 shows a simplified
E
HOMO
LUMO
+
-
+
-
Hopping
Figure 5.2: Simplified scheme of charge carrier transport within the HOMO (holes) andLUMO (electron) levels. Further explanation see text.
scheme of charge carrier transport between the HOMO and LUMO levels of transport
sites. The charge carrier is transported, for instance under an applied electric field,
by hopping between neighboring sites until it reaches a trap or gets discharged at the
counter electrode. Note that Figure 5.2 is simplified a lot, since it ignores band bending
within the electric field and the possibility of backward jumps against the electric field.
Furthermore no statement on the shape of the distribution of energies is made. Before
beginning a detailed discussion about the different models of charge carrier transport
and the description of its field- and temperature dependence the experimental methods
to determine the charge carrier mobility shall be discussed in more detail.
102
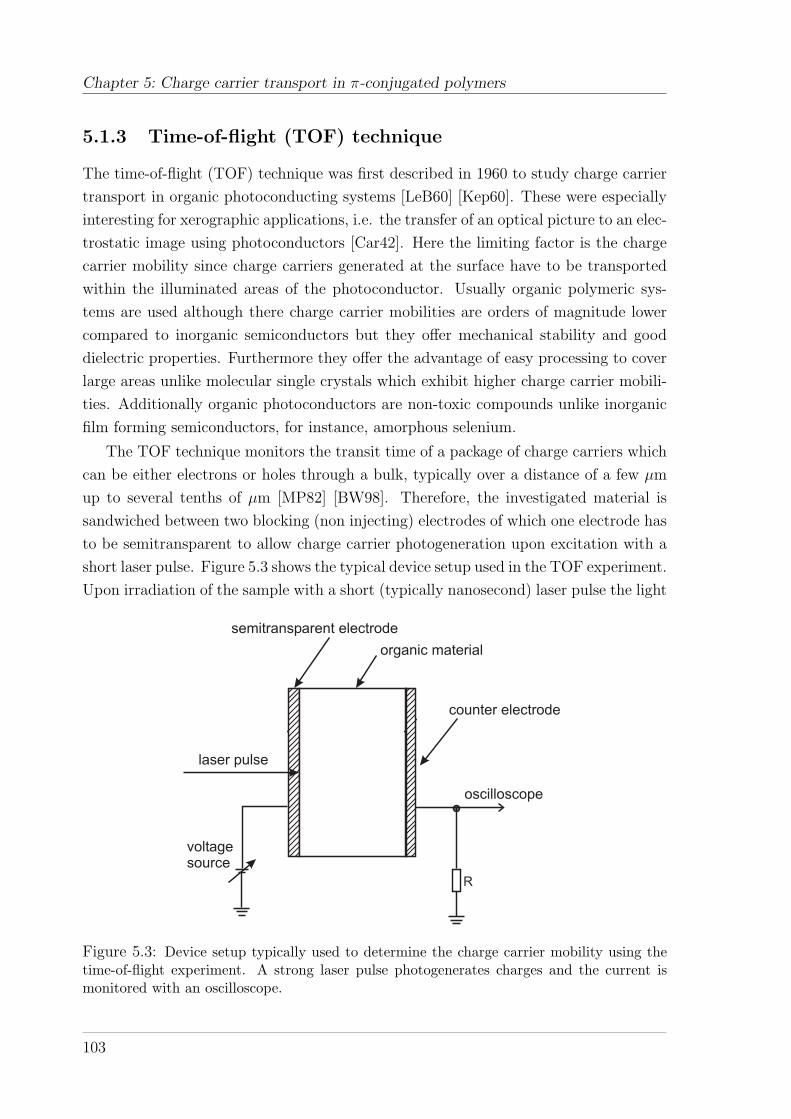
Chapter 5: Charge carrier transport in π-conjugated polymers
5.1.3 Time-of-flight (TOF) technique
The time-of-flight (TOF) technique was first described in 1960 to study charge carrier
transport in organic photoconducting systems [LeB60] [Kep60]. These were especially
interesting for xerographic applications, i.e. the transfer of an optical picture to an elec-
trostatic image using photoconductors [Car42]. Here the limiting factor is the charge
carrier mobility since charge carriers generated at the surface have to be transported
within the illuminated areas of the photoconductor. Usually organic polymeric sys-
tems are used although there charge carrier mobilities are orders of magnitude lower
compared to inorganic semiconductors but they offer mechanical stability and good
dielectric properties. Furthermore they offer the advantage of easy processing to cover
large areas unlike molecular single crystals which exhibit higher charge carrier mobili-
ties. Additionally organic photoconductors are non-toxic compounds unlike inorganic
film forming semiconductors, for instance, amorphous selenium.
The TOF technique monitors the transit time of a package of charge carriers which
can be either electrons or holes through a bulk, typically over a distance of a few µm
up to several tenths of µm [MP82] [BW98]. Therefore, the investigated material is
sandwiched between two blocking (non injecting) electrodes of which one electrode has
to be semitransparent to allow charge carrier photogeneration upon excitation with a
short laser pulse. Figure 5.3 shows the typical device setup used in the TOF experiment.
Upon irradiation of the sample with a short (typically nanosecond) laser pulse the light
laser pulse
semitransparent electrode
organic material
counter electrode
R
oscilloscope
voltagesource
Figure 5.3: Device setup typically used to determine the charge carrier mobility using thetime-of-flight experiment. A strong laser pulse photogenerates charges and the current ismonitored with an oscilloscope.
103

5.1. Introduction - Theoretical background
is absorbed by the organic material and excitations are created (see section charge
carrier generation). Due to the applied electric field a fraction of the generated excitons
is dissociated into free charge carriers. One type of carrier is immediately discharged
at the semitransparent electrode, the other carriers are transported through the bulk
towards the counter electrode. They create a drift current which can be detected in the
external electric circuit as a voltage drop over the resistor R. A prerequisite of the TOF
experiment is strong absorption of the incident light beam since the spatial extension
of the charge carrier package which is created has to be small compared to the film
thickness in order to be neglected. Otherwise there would be a significant distortion of
the experiment. A typical TOF transient is depicted in Figure 5.4.
Timet
t
0
Ph
oto
cu
rre
nt
transit
tail
plateau
initial current spike
Figure 5.4: Scheme of an idealized time-of-flight transient. After the initial spike the currentsettles to a plateau. When the first carriers arrive at the counter electrode the current dropsand a typical tail can be observed in the transient. The arrival of the first carriers usuallydetermines the transit time tT which can be determined by the intersection of the tangent tothe plateau and to the tail.
The sample is excited at the time t0. An initial current spike shows the generation
of charge carriers. Normally the current does not immediately settle to a plateau
since a certain time is needed to discharge the opposite carriers at the semitransparent
electrode. If disorder is present an initial current drop can also occur due to the
relaxation of charge carrier within the density of states but then the current levels
off to a constant value indicating the migration of the charge carrier package through
the bulk. The current stays constant until the package reaches the counter electrode.
Then the current drops since the charge carriers are getting discharged at the counter
electrode. The shape of the tail reflects the broadening of the charge carrier package
104
Chapter 5: Charge carrier transport in π-conjugated polymers
during its migration through the bulk which can be caused by the inherent diffusion
of carriers or shallow traps that are present in the bulk [MP82]. The mobility of the
charge carriers can be calculated from the transit time using the equation
µ =d2
tT × U=
d
tT × F(5.1)
where d is the thickness of the sample (typically in cm), tT is the transit time of charge
carriers and U or F are the applied voltage or electric field, respectively. Hence, the
unit of the charge carrier mobility µ is typically cm2/(V s).
There are several boundary conditions in time-of-flight experiments. The first one,
that has already been mentioned, is that the initial spatial extension of the charge
carrier package must be negligible compared to the film thickness. Therefore, often
µm thick films are used which are not always easy to prepare by standard film-casting
procedures like spin-coating, for instance. Second, the RC time constant, which is
determined by the capacitance C of the whole setup including the sample capacitance
and the resistance R that is mainly caused by the wire connections and the resistor used
to create the voltage drop, has to be at least one order of magnitude smaller compared
to the transit time. If RC and tT are of a comparable value the measurement will be
distorted since the response of the external circuit is not fast enough. Thirdly, one
has to check carefully that the amount of charge carriers created in the sample does
not significantly change the electric field through the sample. If too many carriers are
created within the sample the external electric field will be shielded by the internally
created charge carriers and the calculated mobility will not be the intrinsic charge
carrier mobility anymore.
5.1.4 Charge-generation-layer TOF technique
A modification of the conventional time-of-flight technique employs an additional charge-
generation-layer (CGL) to generate and inject charge carriers into the investigated or-
ganic material (for a review of TOF techniques see [MP93]). Figure 5.5 presents such
a device structure. The fundamental difference compared to the TOF-Device shown
in Fig. 5.3 is the generation of charge carriers exclusively within the CGL not in the
bulk of the investigated organic material. Therefore, the CGL has to have an absorp-
tion which does not overlap with the absorption of the organic material otherwise the
incoming light beam would be absorbed within the bulk. This can be realized, for
example, if the charge transport through a blue emitting polymer (large band gap) is
investigated and a dye is used as CGL which absorbs in the longer wavelength region
from green to red (see Figure 5.6). Since the charge carriers are created at the interface
between the two organic layers the bias is reversed compared to the conventional TOF
105

5.1. Introduction - Theoretical background
hn
ITO electrode
organic material
dye layer
Al electrode
R
oscilloscope voltagesource
Figure 5.5: Device setup used for the charge-generation-layer time-of-flight technique. Notethat the laser pulse passes the organic material and excites the dye layer only, therefore thebias is reversed in the device compared to a conventional TOF experiment.
LUMO
HOMO
Polymer d > 1 µm PDI ~ 10 nm
+
-
E
+++++
Laser l = 537 nm
+
Figure 5.6: Simplified scheme of the energy levels in a CGL-TOF device for hole transportstudies. The energy of the HOMO of the CGL has to be equal or lower than the energy ofthe HOMO of the polymer to ensure sensitized charge carrier generation.
setup and charge carriers migrate towards the semitransparent electrode. Using a CGL
offers some advantages over the conventional bulk excitation. Since the CGL is very
thin (typically a few nanometers) compared to the polymer layer a very narrow charge
106

Chapter 5: Charge carrier transport in π-conjugated polymers
carrier package is injected into the investigated polymer. Therefore, in the beginning
the spatial extension of the carrier package is much smaller compared to bulk excitation
where excitation occurs within the first few 100 nm. Hence, the investigated polymer
layer can be thinner than using bulk excitation since the condition of a comparably
thin package of charges is already fulfilled for films of µm thickness or even thinner
films. This allows to prepare the polymer films by spin-coating, whereas for the bulk
excitation thick films are often prepared by drop-casting. However, drop-casted films
may show a different morphology compared to spin-coated ones, but morphology is a
crucial parameter which influences the charge carrier mobility [BPB92]. Furthermore,
the mobility values of a spin-coated µm thin film may be better comparable to values
in real devices where the film thickness is typically a few 100 nm. Additionally, the
charge carrier generation can be sensitized at the interface between the dye layer and
the polymer layer if the energy levels are chosen in such a manner that, for instance,
in the case of hole transport the energy of the HOMO level of the polymer is closer
to the vacuum level than the energy of the HOMO of the dye. Sensitized charge car-
rier generation allows low laser intensities to be used because of larger charge carrier
generation yields than in the case of bulk excitation.
The CGL-TOF technique has also some drawbacks. Since there is no dye available
which has a high energy of the LUMO combined with a small bandgap, only holes
can be created by sensitized injection at the polymer / dye interface. Furthermore the
energy of the HOMO of the dye has to be below or at least equal to the HOMO energy
of the polymer to allow sensitized charge carrier injection. If the HOMO level of the
dye is higher than that of the polymer, holes will stay in the CGL rather than being
injected into the polymer since an injection barrier is formed at the interface. The
careful adjustment of the energy levels can become tricky if the polymer has already
a quite low energy of the HOMO, for instance, in the case of polyfluorenes which
typically have an ionization potential about -5.7 eV with respect to the zero vacuum
level [CZC+05].
Finally the dye layer cannot be spin-coated on top of the polymer layer since its
thickness is too small and the polymer layer would probably be dissolved by the solvent.
Therefore, the dye layer is evaporated but this requires that the dye can be evaporated
in high vacuum and does not decompose upon heating.
107

5.1. Introduction - Theoretical background
5.1.5 Other techniques to determine the charge carrier mo-
bility
5.1.5.1 Dark-injection space-charge-limited current transient method
The dark-injection space-charge-limited current transient method (DI SCLC) monitors
the response of the current transient of the investigated sample on a step voltage. For
DI SCLC experiments a device structure that allows exclusively the injection of only
one type of charge carrier has to be used, i.e. electron-only or hole-only devices. To
have space-charge-limited conditions the contact between the injecting electrode and
the material has to be ohmic, otherwise the current is injection-limited since the charge
carriers have to overcome an additional injection barrier. Therefore, for hole-only
devices typically ozone-treated indium-tin-oxide (ITO) electrodes are used which are
coated with an additional layer of poly(ethylenedioxythiophene)/polystyrenesulphonic
acid (PEDOT) to create an ohmic contact for hole injection. Ohmic contacts for
electron-only devices usually consist of earth-alkali metals such as calcium or barium.
If the contact is ohmic a characteristic temporal evolution of the current transient can
be observed with a maximum in time. The position of the maximum in time allows to
calculate the space-charge-free transit time according to [LM70]
tDI = 0.786× tT (5.2)
where tDI is the maximum in time and tT the transit time. Apart from ohmic injection
contacts that are required for DI SCLC measurements, the material has to be trap-free
since otherwise the typical temporal evolution with a maximum cannot be observed.
This means that the material itself has to exhibit non-dispersive charge carrier trans-
port to be suitable for the DI SCLC technique. The advantage of this method is that
even thin films of a thickness of a few 100 nm can be studied and the method is rather
simple to apply. However, at very low thicknesses, the RC time constant comes into
play due to the presence of an initial long capacitive response in the current transient.
If the RC time constant is of a comparable value as the transit time, it becomes impos-
sible to measure the transit time accurately or to see any maximum at all. The only
way to overcome this problem is to use a bridge circuit where a differential amplifier is
used to substract the capacitive response of the circuit to recover the SLCL transient
[SRM99].
5.1.5.2 Space-charge-limited current-voltage measurements
If the contact between an electrode and the organic material is ohmic and the material
is trap-free, the steady-state current density J of a device as a function of the applied
108

Chapter 5: Charge carrier transport in π-conjugated polymers
voltage can be measured and used to extract the mobility according to
J(V ) =9εε0µV 2
8d3(5.3)
where ε is the dielectric constant of the material (ε ∼ 3 for organic materials) and d
is the film thickness. This expression as well as the expression for DI SCLC assumes
electric-field-independent mobility which is obviously not true for disordered organic
materials. However, if traps are absent and the transport is nondispersive, the ex-
pressions can still be used and µ represents some average value of mobility [AP86]
[GABS98] [SRM99] [CBA+00].
5.1.5.3 Time-resolved microwave conductivity measurements
The pulse-radiolysis time-resolved microwave conductivity technique (PR-TRMC) [IdHW77]
[WdH91] has been applied to determine charge carrier mobilities both in the solid state
[SWdH+94] [WvdC03] [PDW+04] as well as in solution [GSW+02]. Briefly, the mate-
rial under investigation is ionized by a single nanosecond pulse of electron radiation
in the energy range of MeV. This creates charge carriers in the material which in-
crease the conductivity of the sample, if they are mobile. The increase in conductivity
is monitored as a transient attenuation of microwaves, which propagate through the
sample. From the obtained conductivity values and the energy that was absorbed in
the sample the sum of electron and hole mobilities can be deduced. It is not possible
to differentiate between electron and hole mobility since PR-TRMC does not allow to
separate the contributions of both types of charge carriers.
Furthermore one has to be careful when comparing mobilities of PR-TRMC ex-
periments with mobilities obtained from other experimental techniques. PR-TRMC
measures the one dimensional mobility of charge carriers in a small volume which
could be a few repeat units only in the case of discotic materials or a polymer chain,
if measurements are done in solution. Hence, higher mobilities are obtained than ob-
served in classical TOF experiments for instance, since here the true bulk mobility is
investigated and the disorder of the whole film comes into play. Therefore mobilities
obtained by different techniques can vary by orders of magnitude.
5.1.5.4 Field-effect transistor mobilities
A scheme of a typical top-contact organic field-effect transistor (OFET) is shown in
Figure 5.7. Often regioregular polythiophenes are used as semiconducting materials
since they offer high charge carrier mobilities which are desired for OFET-applications
[BDL96] [KB00]. A potential difference is applied between source and drain and the
current Ids between source and drain monitored as a function of the source-drain voltage
109

5.1. Introduction - Theoretical background
silicon substrate/ gate
Insulatinglayer
organic semiconductor source drain
Figure 5.7: Scheme of a top-contact organic field-effect transistor (OFET).
Vds. The transistor can be switched by applying a potential difference between the
gate electrode and the source electrode Vgs. If Vgs = 0 an ideal transistor will not show
any current flow Ids = 0, even if high source-drain-voltages are applied. Figure 5.8
shows typical I-V characteristics of an n-type OFET taken from reference [CZC+05].
The source-drain-current in the saturation region of Ids is described by the following
Figure 5.8: Output characteristics of an n-FET using F8BT as organic semiconductor. Seereference [CZC+05] for further explanations.
equation,
Ids =WCi
2Lµ(VG − V0)
2 (5.4)
where µ is the field-effect mobility, W is the transistor channel width, L is the length
of the channel, Ci is the capacitance per unit area of the insulating layer, and VG and
V0 are the gate voltage and the extrapolated threshold voltage, respectively [YSY+05].
From the I-V-characteristics the so called field effect mobility µ can be determined.
110

Chapter 5: Charge carrier transport in π-conjugated polymers
The field-effect mobility is not necessarily the same as obtained from other techniques,
for instance time-of-flight measurements. TOF directly observes the migration of a
charge carrier package through a bulk under the condition that the number of charges
moving in the bulk is small against the number of charges stored in the external circuit
(capacitor). In an OFET the charge carrier density in the investigated volume of
the organic semiconductor is much higher, i.e. the DOS is populated much more.
This effect can lead to different mobility values obtained for OFETs although the
same organic semiconductor is used. Very recently ambipolar light-emitting organic
transistors were reported [ZFS06] in addition to n-type OFETs [YSY+05] which allowed
the spatial control of the recombination zone and determination of hole and electron
mobility in a single device and measurement.
5.1.6 Models of charge carrier transport
Charge carrier transport in organic materials is dominated by the presence of an energy
distribution of the transport sites within the HOMO and LUMO levels. Therefore, the
classical model of valence and conduction bands used for inorganic semiconductors in
solid state physics cannot be applied to disordered organic semiconductors. This notion
was not uncontroversial in the beginning because it had been proposed that organic
semiconductors resemble the properties of one-dimensional semiconductors [HKSS88]
[Hee01]. Electron-electron interaction was thought to be negligible relative to electron-
lattice interaction. In this case the nature of an optical excitation in organic semicon-
ductors would be an electronically decoupled polaron (free charge carrier) rather than
an exciton with a distinct binding energy.
Meanwhile there is overwhelming evidence that photophysics and charge carrier
transport in conjugated polymers is not fundamentally different from other organic
materials [PS99]. Hence, charge carrier transport in conjugated polymers has to be
considered as transfer of a single charge carrier between energetically different trans-
port molecules or transport sites. Chemically this is nothing else than a redox-process
between two molecules. Therefore, the field- and temperature dependence is dominated
by the elementary step of charge transfer between two transport sites. The activation
energy of the transport process consists of two contributions, an intermolecular con-
tribution, which results from the transfer of the charge carrier between chemically
identical transport sites, which are slightly different in energy due to the inherent
disorder, hence, a distribution of energies, and an intramolecular contribution due to
the possible change of conformation of the transport site. The main difference of all
transport models is the weighting of these two contributions [MP04]. For example,
the disorder model of charge carrier transport (hopping model) proposed by Bassler
and coworkers completely neglects any polaronic contribution, whereas other models
111

5.1. Introduction - Theoretical background
neglect the aspect of disorder [B93] [BPB91b]. Hence, it is important to study the
field- and temperature-dependence of charge carrier mobilities in organic systems to
get a deeper insight into the fundamental processes of charge carrier transport in order
to determine which model describes the underlying processes best.
5.1.6.1 Dispersive and nondispersive charge carrier transport
Looking at the charge carrier transport mechanism in organic semiconductors one has
to differentiate between two extreme cases of charge transport, namely the Gauß trans-
port where the diffusivity of the charge carriers is time-independent and the so called
dispersive charge carrier transport [MP82].
Gauß-type charge carrier transport occurs, if the generated charge carrier package
migrates through the bulk with a constant speed. This is the case if the time a charge
carrier stays on each transport site is equal for all carriers. Only thermal diffusion of
charge carriers leads to a spatial broadening of the charge carrier package during its mi-
gration. Since this is a statistical process the resulting charge carrier package will be of
+
-
hn t = 0
+++
+++
+++
+++
+++
tt0
+++
+++
+++
+++
+++
+++
+++
+++
+++
t t1 2
1 2 3
(a) Charge carrier package during Gaussiantransport.
ttt t0
1 2
I
0
1
2
3
(b) Corresponding current transient.
Figure 5.9: Scheme of diffusive charge carrier (hole) transport through a TOF device (a).After the generation of a charge carrier package (1) it becomes broader due to diffusive broad-ening (2) and finally it arrives at the counter electrode (3). The corresponding photocurrenttransient (b) exhibits a plateau followed by a tail.
Gaussian shape. During the migration of the charge carrier package a constant current
is observed, which results in a plateau of the corresponding TOF transient. When the
charge carriers arrive at the counter electrode the current drops and a typical tail can
be observed in the current transient. The tail is a signature of the diffusive broadening
of the charge carrier package during its migration through the bulk. Figure 5.9 shows
112
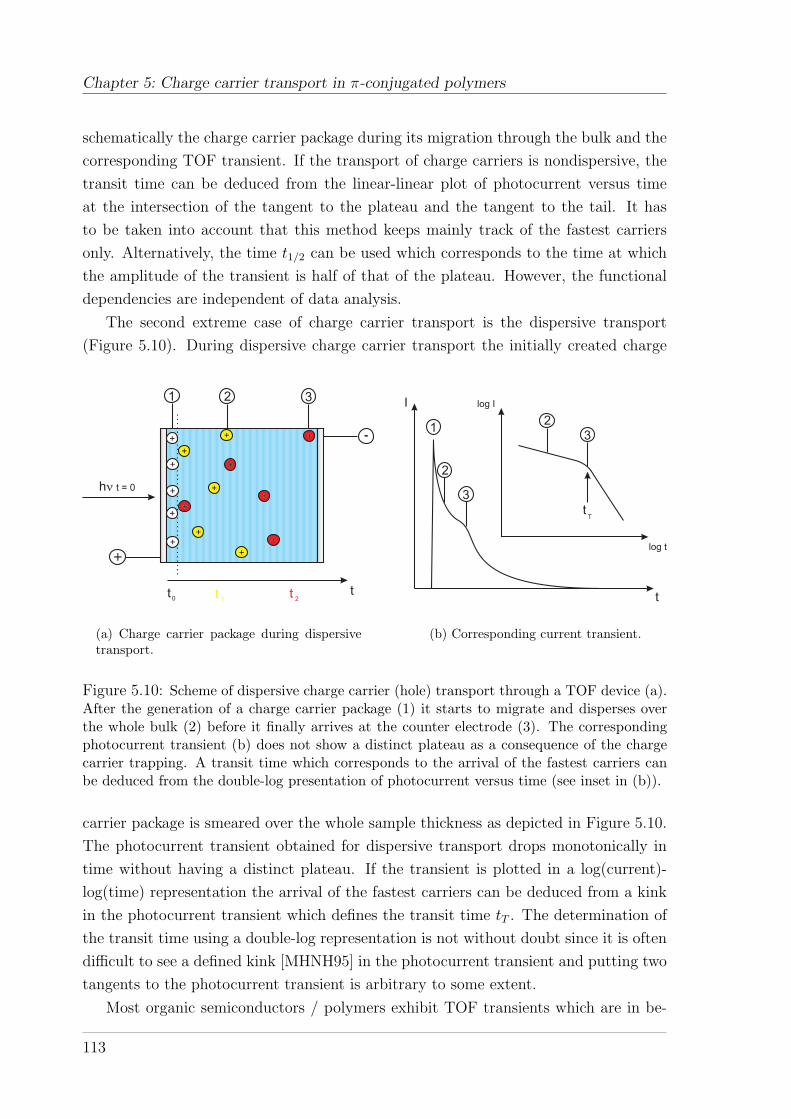
Chapter 5: Charge carrier transport in π-conjugated polymers
schematically the charge carrier package during its migration through the bulk and the
corresponding TOF transient. If the transport of charge carriers is nondispersive, the
transit time can be deduced from the linear-linear plot of photocurrent versus time
at the intersection of the tangent to the plateau and the tangent to the tail. It has
to be taken into account that this method keeps mainly track of the fastest carriers
only. Alternatively, the time t1/2 can be used which corresponds to the time at which
the amplitude of the transient is half of that of the plateau. However, the functional
dependencies are independent of data analysis.
The second extreme case of charge carrier transport is the dispersive transport
(Figure 5.10). During dispersive charge carrier transport the initially created charge
+
-+++
+++
+++
+++
+++
tt0
+++
++
+++
+++
+++
+++
+++
+++
+++
+++
t t1 2
1 2 3
hn t = 0
(a) Charge carrier package during dispersivetransport.
I
t
log I
log t
tT
1
2
3
23
(b) Corresponding current transient.
Figure 5.10: Scheme of dispersive charge carrier (hole) transport through a TOF device (a).After the generation of a charge carrier package (1) it starts to migrate and disperses overthe whole bulk (2) before it finally arrives at the counter electrode (3). The correspondingphotocurrent transient (b) does not show a distinct plateau as a consequence of the chargecarrier trapping. A transit time which corresponds to the arrival of the fastest carriers canbe deduced from the double-log presentation of photocurrent versus time (see inset in (b)).
carrier package is smeared over the whole sample thickness as depicted in Figure 5.10.
The photocurrent transient obtained for dispersive transport drops monotonically in
time without having a distinct plateau. If the transient is plotted in a log(current)-
log(time) representation the arrival of the fastest carriers can be deduced from a kink
in the photocurrent transient which defines the transit time tT . The determination of
the transit time using a double-log representation is not without doubt since it is often
difficult to see a defined kink [MHNH95] in the photocurrent transient and putting two
tangents to the photocurrent transient is arbitrary to some extent.
Most organic semiconductors / polymers exhibit TOF transients which are in be-
113

5.1. Introduction - Theoretical background
tween these two extreme cases. They can feature a distinct plateau followed by a
pronounced tail indicating that disorder leading to a distribution of transport sites
plays an important role in charge carrier transport. This case is called nondispersive
transport since the mean hopping time between transport sites is constant during the
charge transport. Hence, there is a thermal equilibrium between charge carriers which
are trapped within the distribution of sites and released from their traps. This leads
to a plateau in the current transient, whereas the tail results from the broadening of
the charge carrier package due to trapping in shallow traps plus the inherent diffusive
broadening.
The situation changes if traps are present in the material which are so deep that
they lead to significantly different hopping times between transport sites. Such traps
are outside the distribution of transport sites that is created by the organic semi-
conductor, hence they are deep traps caused by chemical or physical / morphological
defects. Furthermore inherent or deliberate doping can create deep traps which lead
to dispersive current transients. Chemically a trap for holes is a molecule or segment
of the polymer chain which has an energy of the HOMO that is above the energy of
the HOMO of the surrounding molecules, hence it has a lower oxidation potential. On
the other hand an electron trap has to have a lower energy of its LUMO, therefore a
lower reduction potential.
5.1.6.2 The disorder model of charge carrier transport
In 1991 Bassler and coworkers published a model of charge carrier transport in dis-
ordered molecular solids [BPB91b] which is based on the framework of the gaussian
disorder formalism. The underlying assumption of the model is hopping of a charge
carrier in a hopping manifold whose site energies are distributed in a Gaussian density
of states (DOS) with the width σ and the energy ε relative to the center of the DOS.
ρ(ε) =1
(2πσ2)1/2exp
(− ε2
2σ2
)(5.5)
Apart from the energetic disorder of transport sites also positional disorder was taken
into account which arises from fluctuations of intermolecular distances or mutual ori-
entation of neighboring molecules. The positional disorder was assumed to be also of
Gaussian shape with a width Σ. The former is also called diagonal-disorder, whereas
the latter is named off-diagonal disorder.
Assuming a Gaussian DOS for the energetic and positional distribution of transport
sites Monte Carlo simulations of charge carrier hopping were performed to study their
walk in the test system under the action of a bias field. Details of these simulations
can be found in the references [BPB91b] [SBS81].
114
Chapter 5: Charge carrier transport in π-conjugated polymers
Hopping of charge carriers was assumed to be controlled by jump rates of the Miller-
Abrahams form [MA60]
νij = ν0exp
(Γij
∆Rij
a
)
exp− εj−εi
kT, εj > εi
1, εj < εi
(5.6)
where νij is the hopping rate between two sites i and j, which is a product of a prefactor
ν0, a wavefunction overlap factor and a Boltzmann-factor in the case that the jump
occurs to a transport site which is higher in energy. Γ is a mean overlap parameter, ∆Rij
is the distance between the sites i and j and a is the lattice constant. Only energetic
disorder is taken into account in equation 3.5. Positional disorder can be included by
assuming an additional distribution for the overlap parameter Γ. Polaronic effects are
excluded since the factor for jumps to transport sites that are lower in energy was set
to 1 [BPB91b].
Field-dependent mobilities were computed for different diagonal- disorder para-
meters and off-diagonal disorder parameters. In all cases the mobility approaches a
logµ ∝ βE1/2 field dependence at moderately high electric fields (F & 7×10⁵V/cm) ac-
cording to the Poole-Frenkel-behaviour. The temperature dependence of the mobility
in the zero-field limit is given by
µ = µ0 × exp
[−
(Tc
T
)2]
(5.7)
with a characteristic temperature Tc at which the temperature dependence of the zero-
field mobility changes its slope. Since the characteristic temperature Tc is related to the
width of the DOS by kTc = 2σ/3 the zero-field mobility as a function of temperature
T and width σ can be expressed as
µ(σ, F = 0) = µ0 × exp
[−
(2σ
3kT
)2]
(5.8)
Finally combining all results a universal law for the field- and temperature-dependence
of the mobility taking into account the energetic disorder σ and the positional disorder
Σ was predicted [BPB91b]
µ(σ, Σ, T, F ) = µ0 × exp
[−
(2σ
3kT
)2]× expC
[( σ
kT
)2
− Σ2
]√F (5.9)
where C = 2.9 × 10⁻⁴(cm/V )1/2 is an empirical constant. Without going further into
details, which can be found in the references, one has to mention that within the frame-
work of this model the following experimental observations are predicted: (1) strong
temperature dependence of the mobility; (2) Poole-Frenkel-type field-dependence logµ ∝
115

5.1. Introduction - Theoretical background
βE1/2; (3) decrease of the slope β of the field dependence with increasing temperature;
(4) plateau regions of nondispersive TOF signals; (5) anomalously broadened tails of
TOF signals (6) the 1/T 2 type temperature dependence of the zero-field mobility and
its (7) change of slope below a critical temperature when the TOF signals become
dispersive.
Equation 5.9 is valid for temperatures above the critical temperature only, i.e.
Tg > T > Tc, where Tg is the glass transition temperature and Tc the low temperature
nondispersive to dispersive transition temperature, which was predicted by the simula-
tions. At Tc the temperature dependence of the mobility changes according to [BB93]
[HB95]
µ ∝ exp
[−
(2σ
3kT
)2]
, T > Tc (5.10)
µ ∝ exp
[−
( σ
2kT
)2]
, T < Tc (5.11)
where Tc is defined as
σ2c =
(σ
kTc
)2
= 44.8 + 6.7× logL0 (5.12)
with L0 being the length in (dimensionless) centimeters. Here, the length (thickness) of
the disordered material comes into play because carriers have more time to reach their
thermal equilibrium if the length is increased. Therefore, the transition to dispersive
transport occurs at lower temperatures. The dispersive transport regime below Tc
is a consequence of the fact that at lower temperatures the time which is needed
for the charge carriers to attain their dynamic equilibrium increases faster than the
transit time tT [BB93]. Hence, TOF transients must become dispersive, i.e. loose
their plateau region at lower temperatures. A further criterion for this transition is the
observed break in the predicted 1/T 2 temperature dependence of the mobility. Figure
5.11 depicts the situation of the DOS for two different temperatures. If charge carriers
are generated, for instance by photoexcitation, with random energy within the DOS,
they first relax towards their thermal equilibrium energy. Hence, another density of
states is created that is shifted by σ2/kT with respect to the center of the DOS. It
is called occupied density of states (ODOS). The center of the ODOS correlates to
the thermal equilibrium energy which depends on the temperature of the system. At
low temperatures the ODOS is centered within the tail of the DOS, whereas at higher
temperatures it is shifted towards the center of the DOS. The created charge carrier
that achieved its thermal equilibrium energy is successively promoted to higher energy
transport sites within the DOS under the assistance of the applied electric field. Here
the charge carrier is transported but it always has the tendency to relax back to its
thermal equilibrium energy. The dynamic equilibrium can be reached faster at higher
116
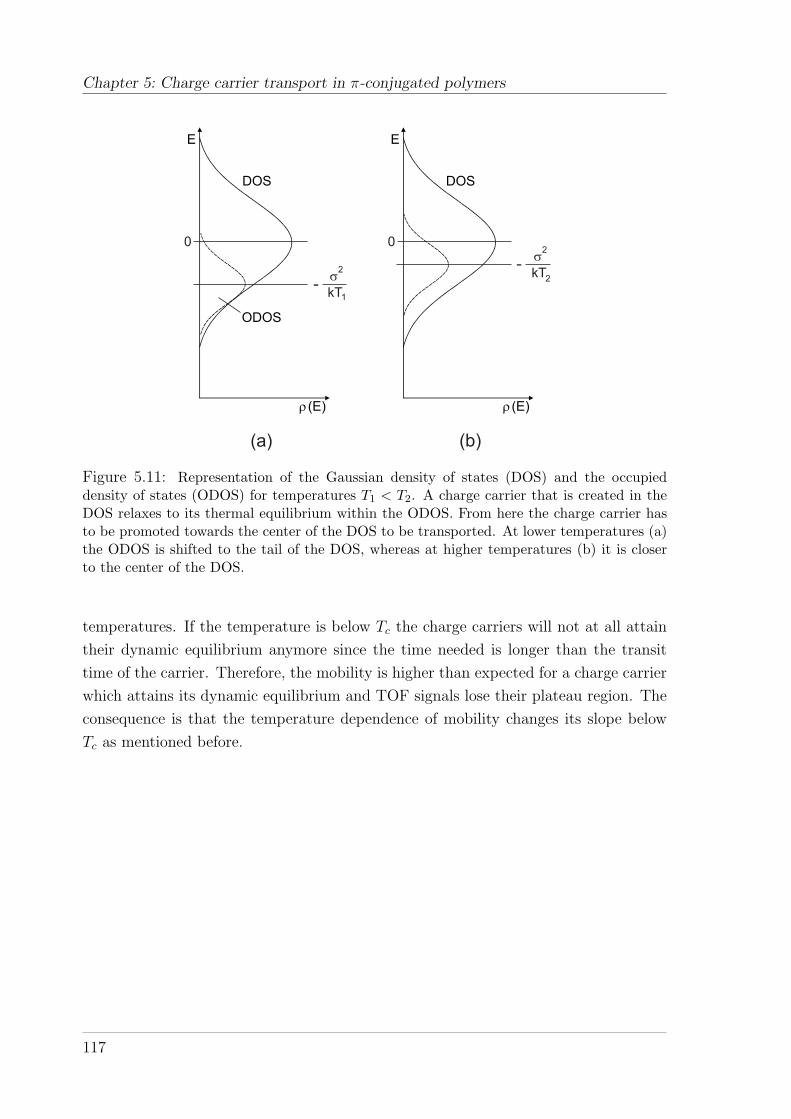
Chapter 5: Charge carrier transport in π-conjugated polymers
E
r (E)
DOS
0
s2
kT1
E
r (E)
DOS
0s
2
kT2
(a) (b)
ODOS
--
Figure 5.11: Representation of the Gaussian density of states (DOS) and the occupieddensity of states (ODOS) for temperatures T1 < T2. A charge carrier that is created in theDOS relaxes to its thermal equilibrium within the ODOS. From here the charge carrier hasto be promoted towards the center of the DOS to be transported. At lower temperatures (a)the ODOS is shifted to the tail of the DOS, whereas at higher temperatures (b) it is closerto the center of the DOS.
temperatures. If the temperature is below Tc the charge carriers will not at all attain
their dynamic equilibrium anymore since the time needed is longer than the transit
time of the carrier. Therefore, the mobility is higher than expected for a charge carrier
which attains its dynamic equilibrium and TOF signals lose their plateau region. The
consequence is that the temperature dependence of mobility changes its slope below
Tc as mentioned before.
117

5.1. Introduction - Theoretical background
5.1.7 Charge carrier mobility in organic materials
Before entering the experimentally obtained results on charge carrier transport in
polyspirobifluorene materials it is worth discussing the results of charge carrier mobil-
ity measurements on organic materials (small molecules, polymers, molecularly doped
polymers) that are present in the literature.
The highest charge carrier mobilities for organic materials were measured on single
crystals of naphthalene, anthracene or perylene with mobilities ranging from 10−2cm2/V s
to 102cm2/V s at low temperatures [MHC75] [KZ75] [WSK85] [Kar89] . In contrast to
these quite high charge carrier mobilities, classical amorphous organic photoconductors
like the poly-(N-vinylcarbazol) exhibit mobilities in the range of 10−7 − 10−6cm2/V s
[Gil72] [Hoe65] [Mor72] [PG78] depending on temperature and electric field. Fur-
thermore, the transport is highly dispersive, i.e. trap-dominated [GD89]. The huge
difference of the mobility values between organic single crystals and amorphous organic
polymers demonstrates the influence of disorder on the charge carrier transport.
Apart from small molecules, molecularly doped polymer matrices were intensively
studied due to their appealing properties for Xerography. Often Triphenylamine-
derivatives were used as dopant molecules in poly-carbonate or polystyrene matri-
ces. Triphenylamine (TPA) [PGM76] [Pfi77] [BMC78] [BCH78] [Bor90] [SGS90] and
its dimer N,N’-Diphenyl-N,N’-bis(3-methylphenyl)-[1,1’-biphenyl]-4,4’-diamine (TPD)
[SYP84] exhibit mobilities up to 10−3cm2/V s with a non-dispersive current transient
indicating the absence of deep traps. For the fundamental study of charge transport in
disordered molecular solids the results of Monte-Carlo simulations were compared with
experimentally observed mobility values of 1,1-bis-(di-4-tolylaminophenyl)cyclohexane
(TAPC) and TAPC-doped bisphenol-A-polycarbonate (BPPC) [BPB91b]. Pure TAPC
showed hole mobilities up to 10−2cm2/V s. The simulated results of charge carrier trans-
port applying the disorder formalism were meanwhile verified on several other small
molecules.
Since the first observation of electroluminescence of conjugated polymers the ques-
tion of charge carrier mobilities and transport models for semiconducting polymers
arose. An important study was performed by Hertel et al., who reported about
nondispersive hole transport in the conjugated ladder-type polymer MeLPPP [HSB98]
[HBSH99]. Because of the intrinsically low disorder of the polymer and its well-defined
structure it is an ideal object for charge transport studies in conjugated polymers. The
mobility was found to reach values as high as 10−3cm2/V s at 300 K, hence two orders
of magnitude higher than previously reported for PPV derivatives.
One of the most important classes of blue-emitting polymers are the polyfluorenes.
Nondispersive hole transport in poly(9,9-dioctylfluorene) (PFO) was reported by Re-
decker et al. [RB98]. Room-temperature hole mobilities were determined to 4 ×
118

Chapter 5: Charge carrier transport in π-conjugated polymers
10−4cm2/V s at an electric field of 5 × 10⁵V/cm. No clear electron current was ob-
served, indicating highly dispersive transport with deep trapping of electrons, as found
for other conjugated polymers as well. The origin of dispersive electron transport is not
fully understood yet. There is no reason why an electron should have a lower mobility
than a hole unless traps are present which exclusively trap electrons. Recent studies
on electron mobilities in n-type OFETs suggest that electrons can be as fast or even
faster than holes [CZC+05].
Hole mobility measurements using the TOF technique on copolymers of fluorene
with triarylamine derivatives were reported by Redecker et al. [RBI+99] and Poplavskyy
et al. [PNB04]. The incorporated triarylamines can greatly improve the hole mobility
leading to values of 3× 10⁻⁴− 3× 10⁻³ at electric fields of 2.5× 10⁵V/cm. Sometimes
dispersive TOF transients are observed indicating significantly higher disorder and /
or trap states in the investigated polymers.
Poly-p-phenylene-vinylene type polymers usually feature dispersive TOF transients.
Nondispersive hole transport in MEH-PPV was reported by Inigo et al. [ITF+01] but
the presented TOF-signals do not exhibit a clear and distinct plateau, hence charge
carrier transport is more a mixture of nondispersive and dispersive transport. Never-
theless, a room-temperature hole mobility between 10−6−10−5cm2/V s was determined
and results were shown to follow the disorder model. Similar values were reported for
several other PPV-derivatives by employing the TOF-technique [LYT04] and the SCLC
technique [Mar00].
Hole transport in a polyphenylenevinylene-ether using bulk-excitation and sensitized
injection from a rhodamine 6G layer was studied by Im et al. [IB00]. Mobilities up
to 10−3cm2/V s were observed and results interpreted in the framework of the disorder
formalism. The charge-generation-layer time-of-flight technique using a perylene deriv-
ative was used to examine hole transport in a spincoated dendrimer film by Markham
et al. [MAS+02]. This method was adopted to study charge carrier transport in the
PSBF copolymers presented in the present work.
Nondispersive hole transport was reported for amorphous films of a methoxy-spirobifluorene-
arylamine compound by Poplavskyy et al. [PN03] comparing mobility values obtained
from TOF experiments with values obtained from dark-injection space-charge-limited
current transients and space-charge-limited current-voltage measurements. Results
were fitted to the disorder formalism of charge carrier transport. Hole mobilities of
two other spirocompounds were investigated by Bach et al. [BDCSG00] and mobilities
in the order of 10−4cm2/V s were observed. So far there was no study on hole transport
in polyspirobifluorene-copolymers.
Last but not least an important class of organic photoconductors are discotic liq-
uid crystals (DLCs) such as triphenylene derivatives [ACF+93] [ASS+94] [SGP+96],
119
5.1. Introduction - Theoretical background
hexa-benzocoronene-derivatives (HBCs) [KPW+05], porphyrins [SWdH+91] and ph-
thalocyanines [FMSO04] [IHB+05]. Due to their disc-like structure and liquid-crystal
properties they can be arranged into columnar structures with a considerably high de-
gree of macroscopic order and high charge carrier mobility along their stacking axis.
Hole and electron mobilities were reported to reach values of 0.1cm2/V s [ASS+94]
[ITH+05] for triphenylene derivatives measured by the TOF technique and were found
to be independent of the applied electric field within one phase of the DLC implying
that charge transport in these materials follows a band-type model [LKB05] as typically
found for inorganic semiconductors.
120

Chapter 5: Charge carrier transport in π-conjugated polymers
5.2 Experimental part
5.2.1 Materials
Hole transport in three different spirobifluorene-copolymers was studied using the
charge-generation layer time-of-flight technique and results were compared with those
obtained for the polyspirobifluorene homopolymer. The structure of the homopolymer
is shown left in Figure 5.12. To understand the influence of different comonomers on
the charge carrier mobility and on the important transport parameters that can be ex-
tracted from fitting the experimental data to the Gaussian disorder formalism of charge
carrier transport, polymers containing 10% of the following comonomers presented in
Figure 5.12 were investigated. The spirobifluorene (co)polymers investigated in this
N N
N
R
12 3
O
OO
O
n
4
Figure 5.12: Chemical structure of the alkoxy-substituted spirobifluorene homopolymer 1used for TOF experiments. The comonomers of the copolymers investigated are depicted aswell. They contain either 10% of a triarylamine derivative 2, an anthracene 3 or substitutedcarbazole 4. The polymers are presumably of random type.
work were synthesized at Covion Organic Semiconductors GmbH and used as received.
Their synthesis has been described in World Patent WO 03/020790 [BTS+03]. All
polymers show excellent solubility in common organic solvents like toluene used as a
solvent for spin-coating. The composition of all polymers is listed in table 3.1.
(Co)polymer Spiro content TAD Carbazole Anthracene
PSBF Homopolymer 1 100 % 0 % 0 % 0 %
Spiro-co-TAD 2 90 % 10 % 0 % 0 %
Spiro-co-(10%)anthracene 3 90 % 0 % 10 % 0 %
Spiro-co-(10%)carbazol 4 90 % 0 % 0 % 10 %
Table 5.1: Chemical composition of the copolymers which were used in
TOF experiments.
121
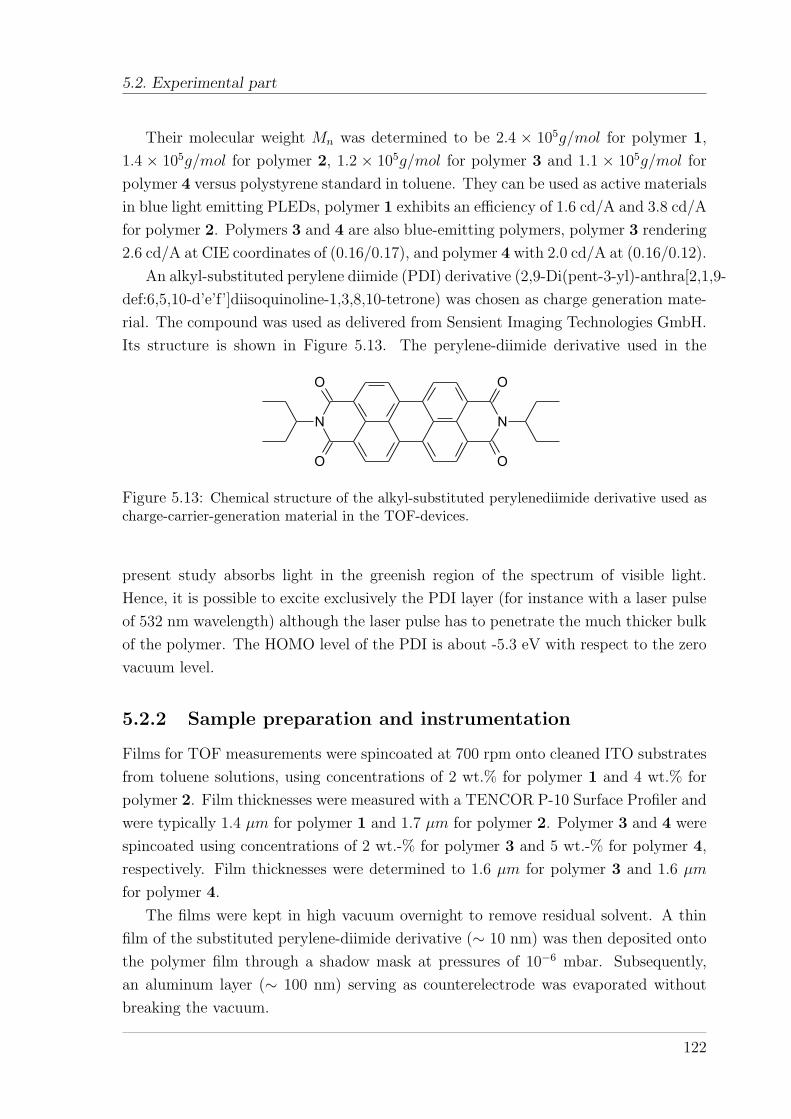
5.2. Experimental part
Their molecular weight Mn was determined to be 2.4 × 10⁵g/mol for polymer 1,
1.4 × 10⁵g/mol for polymer 2, 1.2 × 10⁵g/mol for polymer 3 and 1.1 × 10⁵g/mol for
polymer 4 versus polystyrene standard in toluene. They can be used as active materials
in blue light emitting PLEDs, polymer 1 exhibits an efficiency of 1.6 cd/A and 3.8 cd/A
for polymer 2. Polymers 3 and 4 are also blue-emitting polymers, polymer 3 rendering
2.6 cd/A at CIE coordinates of (0.16/0.17), and polymer 4 with 2.0 cd/A at (0.16/0.12).
An alkyl-substituted perylene diimide (PDI) derivative (2,9-Di(pent-3-yl)-anthra[2,1,9-
def:6,5,10-d’e’f’]diisoquinoline-1,3,8,10-tetrone) was chosen as charge generation mate-
rial. The compound was used as delivered from Sensient Imaging Technologies GmbH.
Its structure is shown in Figure 5.13. The perylene-diimide derivative used in the
N N
O
O
O
O
Figure 5.13: Chemical structure of the alkyl-substituted perylenediimide derivative used ascharge-carrier-generation material in the TOF-devices.
present study absorbs light in the greenish region of the spectrum of visible light.
Hence, it is possible to excite exclusively the PDI layer (for instance with a laser pulse
of 532 nm wavelength) although the laser pulse has to penetrate the much thicker bulk
of the polymer. The HOMO level of the PDI is about -5.3 eV with respect to the zero
vacuum level.
5.2.2 Sample preparation and instrumentation
Films for TOF measurements were spincoated at 700 rpm onto cleaned ITO substrates
from toluene solutions, using concentrations of 2 wt.% for polymer 1 and 4 wt.% for
polymer 2. Film thicknesses were measured with a TENCOR P-10 Surface Profiler and
were typically 1.4 µm for polymer 1 and 1.7 µm for polymer 2. Polymer 3 and 4 were
spincoated using concentrations of 2 wt.-% for polymer 3 and 5 wt.-% for polymer 4,
respectively. Film thicknesses were determined to 1.6 µm for polymer 3 and 1.6 µm
for polymer 4.
The films were kept in high vacuum overnight to remove residual solvent. A thin
film of the substituted perylene-diimide derivative (∼ 10 nm) was then deposited onto
the polymer film through a shadow mask at pressures of 10−6 mbar. Subsequently,
an aluminum layer (∼ 100 nm) serving as counterelectrode was evaporated without
breaking the vacuum.
122

Chapter 5: Charge carrier transport in π-conjugated polymers
For TOF measurements the sample was housed in a temperature controlled home
built cryostat under a dynamic vacuum of typically 10−5 mbar. Excitation at 532 nm
was provided by an optical parametric oscillator (OPO, GWU Lasertechnik GmbH,
Germany) pumped by the third harmonic of a Nd:YAG laser. The samples were illu-
minated from the ITO side and the current transient was detected with a Tektronix
oscilloscope (TDS 524A) triggered by the laser pulse. The excitation intensity was
chosen to generate not more than 5 % of the charge stored at the device interface to
avoid space-charge effects and the RC time constant of the circuit was kept below 500
ns.
Cyclic voltammetry measurements were performed on thin films which were pre-
pared by drop-casting the polymer from dichloromethane solution onto a platinum
disk electrode (0.8mm2). The measurements were recorded in acetonitrile with 0.1 M
tetrabutylammonium perchlorate as supporting electrolyte at a scan rate of 50 mV/s.
A platinum wire was used as counter electrode and a silver wire covered with silver
chloride as quasi-reference electrode (QRE). The oxidation potentials were determined
as the half-wave oxidation potential E1/2 at half-height of the oxidation wave. The
oxidation potentials were referenced against Fc/Fc+ and converted into ionization po-
tentials assuming an energy of the HOMO for the ferrocene/ferricenium standard of
-4.8 eV with respect to the zero vacuum level.
123

5.3. Cyclic voltammetry measurements
5.3 Cyclic voltammetry measurements
Cyclic voltammetry measurements on thin polymer films were performed to determine
their ionization potentials with respect to the zero vacuum level. The position of the
energy of the HOMO of the polymer is important for the TOF-experiments using the
CGL-TOF technique to avoid injection barriers between the CGM and the polymer.
Before discussing the experimental results, the background of cyclic voltammetry may
be discussed briefly.
5.3.1 Cyclic voltammetry - Background
Cyclic voltammetry is an electrochemical method to determine the oxidation and reduc-
tion potentials of a compound with respect to a reference that has a known oxidation
/ reduction potential. The setup itself consists of an electrochemical cell with three
different electrodes, namely working electrode, reference electrode and counter elec-
trode, that are submerged in a solution (typically dichloromethane) of the investigated
material together with an supporting electrolyte (for example, tetrabutylammonium
perchlorate / tetrafluoroborate). If solid state measurements are performed, the work-
ing electrode is covered with the compound. A periodic triangular voltage wave with a
constant scan rate of typically 100 mV/s is applied between the working electrode and
the reference electrode and the current flux at the working electrode is measured. The
circuit is completed by a current carrying counter electrode which supplies the current
needed by the working electrode.
A cyclic voltammogram represents the current flux as a function of the applied
voltage. Typically a low background current is observed due to impurities in the
solvent and / or residues of oxygen and water. If the applied electric field exceeds
the reduction or oxidation potential of the investigated compound, a steep increase of
the current flux can be detected. Upon reversing the scan direction typically a shifted
but mirror symmetric peak should be observed which would identify the oxidation /
reduction as reversible. If this is not the case, then the material was destroyed or the
oxidation / reduction is simply not reversible. One has to be careful not to oxidize
organic compounds so much that they get destroyed and the typical shape of the
cyclic voltammogram is lost. Often the reduction is more complicated to observe since
the range of potentials that can be used is limited by the solvent / electrolyte. Side
reactions can occur and interfere with the cyclic voltammogram of the investigated
compound. Especially for blue-emitting polymers often no reduction wave can be
observed because of their high reduction potential.
The setup used for the present experiment consisted of a platinum disc working
electrode with a diameter of 1 mm, a silver wire used as reference electrode and a
124

Chapter 5: Charge carrier transport in π-conjugated polymers
platinum wire employed as counter electrode. Acetonitrile with 0.1 M concentration
of tetrabutylammonium perchlorate was used as supporting electrolyte and measure-
ments were performed on thin films of the polymers that were drop-casted onto the
working electrode from dichloromethane solution. All measurements were referenced to
the oxidation potential of the ferrocene/ferricenium couple which was +0.41 V in the
present experiment. An ionization potential of -4.8 eV with respect to the zero-vacuum
level was assumed for the Fc/Fc+ couple.
5.3.2 Results and Discussion
A typical cyclic voltammogram of the investigated polyspirobifluorene homopolymer is
presented in Figure 5.14. The determination of the oxidation potential from the exper-
-200 0 200 400 600 800 1000 1200-8
-6
-4
-2
0
2
4
6
8
E1/2
= +0.88 V
Fc/Fc+
E1/2
= +0.41 V
Cur
rent
(µA
)
Potential (mV vs. Ag/Ag+ QRE)
Figure 5.14: Typical cyclic voltammogram measured on a thin film of polymer 1 at a scanrate of 50 mV/s. The oxidation of the Fc/Fc+ couple is marked at +0.41 V. At +0.88 V thehalf-height oxidation potential of the polymer is indicated by the dashed line.
imentally obtained cyclic voltammogram can be achieved by different ways. Sometimes
the value of the potential at the onset of the oxidation wave is used which is caused
by molecules / chain segments with HOMO levels in the upper tail of the distribution
of energies. More often the value of the potential at half-height of the oxidation wave
is used which is approximately between the current maxima of the oxidation wave.
This is referred to as half-wave oxidation potential E1/2. However, one has to take
into consideration that the oxidation / reduction potentials determined by CV contain
a systematic error if compared with the potentials that exist in real devices since the
125
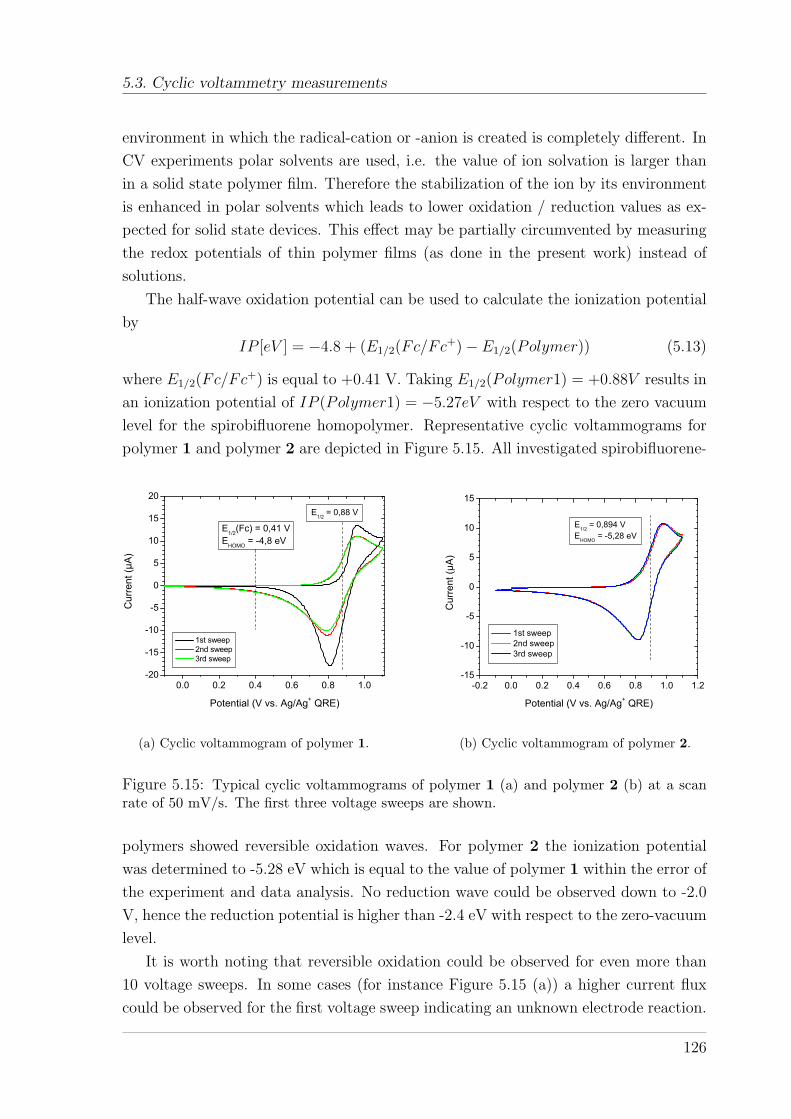
5.3. Cyclic voltammetry measurements
environment in which the radical-cation or -anion is created is completely different. In
CV experiments polar solvents are used, i.e. the value of ion solvation is larger than
in a solid state polymer film. Therefore the stabilization of the ion by its environment
is enhanced in polar solvents which leads to lower oxidation / reduction values as ex-
pected for solid state devices. This effect may be partially circumvented by measuring
the redox potentials of thin polymer films (as done in the present work) instead of
solutions.
The half-wave oxidation potential can be used to calculate the ionization potential
by
IP [eV ] = −4.8 + (E1/2(Fc/Fc+)− E1/2(Polymer)) (5.13)
where E1/2(Fc/Fc+) is equal to +0.41 V. Taking E1/2(Polymer1) = +0.88V results in
an ionization potential of IP (Polymer1) = −5.27eV with respect to the zero vacuum
level for the spirobifluorene homopolymer. Representative cyclic voltammograms for
polymer 1 and polymer 2 are depicted in Figure 5.15. All investigated spirobifluorene-
0.0 0.2 0.4 0.6 0.8 1.0-20
-15
-10
-5
0
5
10
15
20
E1/2
(Fc) = 0,41 VE
HOMO = -4,8 eV
E1/2
= 0,88 V
1st sweep 2nd sweep 3rd sweep
Cur
rent
(µA
)
Potential (V vs. Ag/Ag+ QRE)
(a) Cyclic voltammogram of polymer 1.
-0.2 0.0 0.2 0.4 0.6 0.8 1.0 1.2-15
-10
-5
0
5
10
15
E1/2
= 0,894 VE
HOMO = -5,28 eV
1st sweep 2nd sweep 3rd sweep
Cur
rent
(µA
)
Potential (V vs. Ag/Ag+ QRE)
(b) Cyclic voltammogram of polymer 2.
Figure 5.15: Typical cyclic voltammograms of polymer 1 (a) and polymer 2 (b) at a scanrate of 50 mV/s. The first three voltage sweeps are shown.
polymers showed reversible oxidation waves. For polymer 2 the ionization potential
was determined to -5.28 eV which is equal to the value of polymer 1 within the error of
the experiment and data analysis. No reduction wave could be observed down to -2.0
V, hence the reduction potential is higher than -2.4 eV with respect to the zero-vacuum
level.
It is worth noting that reversible oxidation could be observed for even more than
10 voltage sweeps. In some cases (for instance Figure 5.15 (a)) a higher current flux
could be observed for the first voltage sweep indicating an unknown electrode reaction.
126

Chapter 5: Charge carrier transport in π-conjugated polymers
If the oxidation potential was significantly increased above the first oxidation wave an
irreversible oxidation of the polymer film occurred accompanied by a color change of
the polymer film from slightly yellowish to deep red.
127
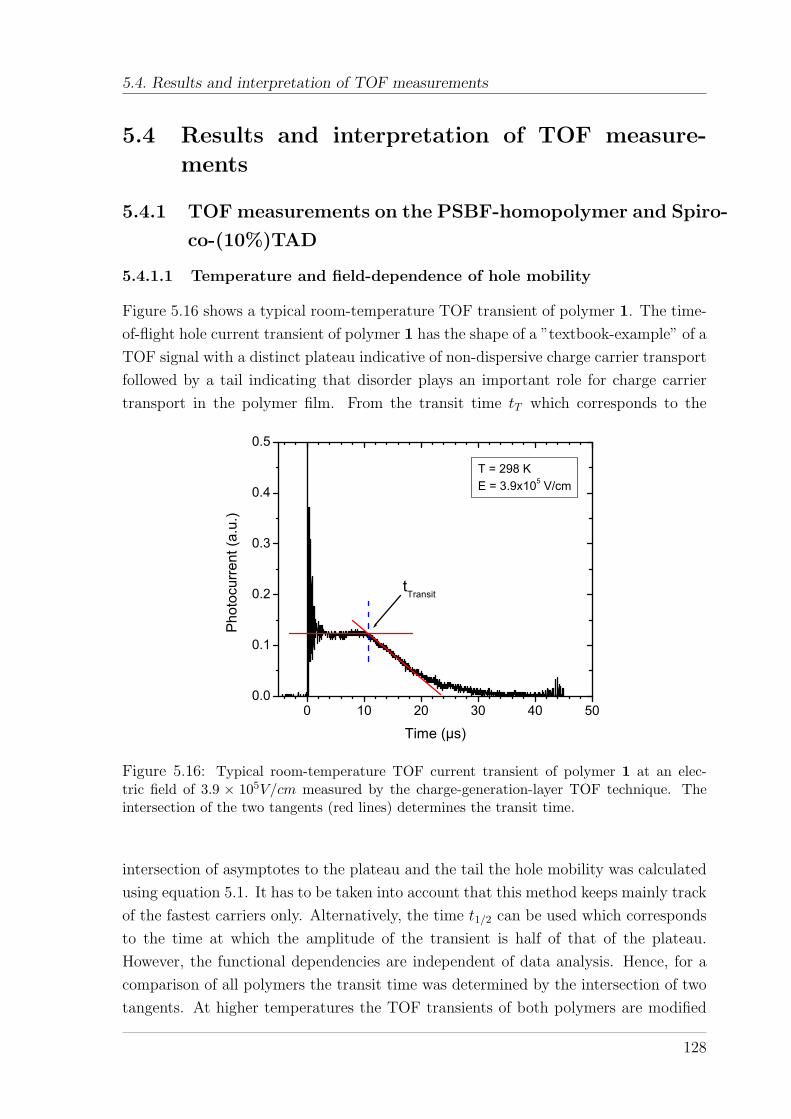
5.4. Results and interpretation of TOF measurements
5.4 Results and interpretation of TOF measure-
ments
5.4.1 TOF measurements on the PSBF-homopolymer and Spiro-
co-(10%)TAD
5.4.1.1 Temperature and field-dependence of hole mobility
Figure 5.16 shows a typical room-temperature TOF transient of polymer 1. The time-
of-flight hole current transient of polymer 1 has the shape of a ”textbook-example” of a
TOF signal with a distinct plateau indicative of non-dispersive charge carrier transport
followed by a tail indicating that disorder plays an important role for charge carrier
transport in the polymer film. From the transit time tT which corresponds to the
0 10 20 30 40 500.0
0.1
0.2
0.3
0.4
0.5
tTransit
T = 298 KE = 3.9x10⁵ V/cm
Pho
tocu
rren
t (a.
u.)
Time (µs)
Figure 5.16: Typical room-temperature TOF current transient of polymer 1 at an elec-tric field of 3.9 × 10⁵V/cm measured by the charge-generation-layer TOF technique. Theintersection of the two tangents (red lines) determines the transit time.
intersection of asymptotes to the plateau and the tail the hole mobility was calculated
using equation 5.1. It has to be taken into account that this method keeps mainly track
of the fastest carriers only. Alternatively, the time t1/2 can be used which corresponds
to the time at which the amplitude of the transient is half of that of the plateau.
However, the functional dependencies are independent of data analysis. Hence, for a
comparison of all polymers the transit time was determined by the intersection of two
tangents. At higher temperatures the TOF transients of both polymers are modified
128

Chapter 5: Charge carrier transport in π-conjugated polymers
by a cusp. The origin of the cusp will be discussed in the next section. Table 4.2
summarizes the results of a typical field-dependence measurement of hole mobility for
polymer 1.
Voltage (V) F (V/cm) F 1/2(V/cm)1/2 tT (µs) µH(cm2/V s)
20 1.42× 10⁵ 376.6 111 8.96× 10⁻⁶
25 1.77× 10⁵ 421.1 76 1.05× 10⁻⁵
30 2.13× 10⁵ 461.3 51.7 1.28× 10⁻⁵
35 2.48× 10⁵ 498.2 38.2 1.49× 10⁻⁵
40 2.84× 10⁵ 532.6 29.3 1.70× 10⁻⁵
45 3.19× 10⁵ 564.9 22.0 2.00× 10⁻⁵
50 3.55× 10⁵ 595.5 17.2 2.31× 10⁻⁵
55 3.90× 10⁵ 624.6 13.9 2.60× 10⁻⁵
60 4.26× 10⁵ 652.3 11.5 2.88× 10⁻⁵
65 4.61× 10⁵ 679.0 9.4 3.25× 10⁻⁵
70 4.96× 10⁵ 704.6 7.8 3.64× 10⁻⁵
75 5.32× 10⁵ 729.3 6.6 4.02× 10⁻⁵
80 5.67× 10⁵ 753.2 5.5 4.52× 10⁻⁵
Table 5.2: Electric field F, its square-root F 1/2, the transit time tT and
the mobility µH obtained for a 1.4µm thin sample of polymer 1 at room-
temperature.
In order to extract the charge transport parameters and to get a deeper insight into the
transport properties the hole mobilities of both polymers were measured over a wide
range of electric fields and temperatures. Figure 5.17 depicts the field and temperature
dependence of the hole mobility of polymer 1 and figure 5.18 of polymer 2 for a selection
of temperatures. The hole mobility shows a strong dependence on the electric field F
and the temperature T. The higher the temperature of the sample the higher the hole
mobility. Furthermore the hole mobility follows the Poole-Frenkel-type field depen-
dence of logµH ∝ F 1/2 as expected for charge carrier transport within an amorphous
solid. The slope β of the field dependence increases with decreasing temperature. All
these observations have been described by Bassler and co-workers [BPB91b] in their
disorder model of charge carrier transport and have been predicted by Monte Carlo
simulations assuming a Gaussian density of states (DOS) for the energy distribution
of hopping sites as discussed in the theoretical part.
5.4.1.2 Temperature dependence of zero-field mobility
The data presented in Figure 5.17 and 5.18 were fitted according to a F 1/2-field-
dependence. From the fit the zero field mobilities µ(F = 0, T ) and the slopes for
129
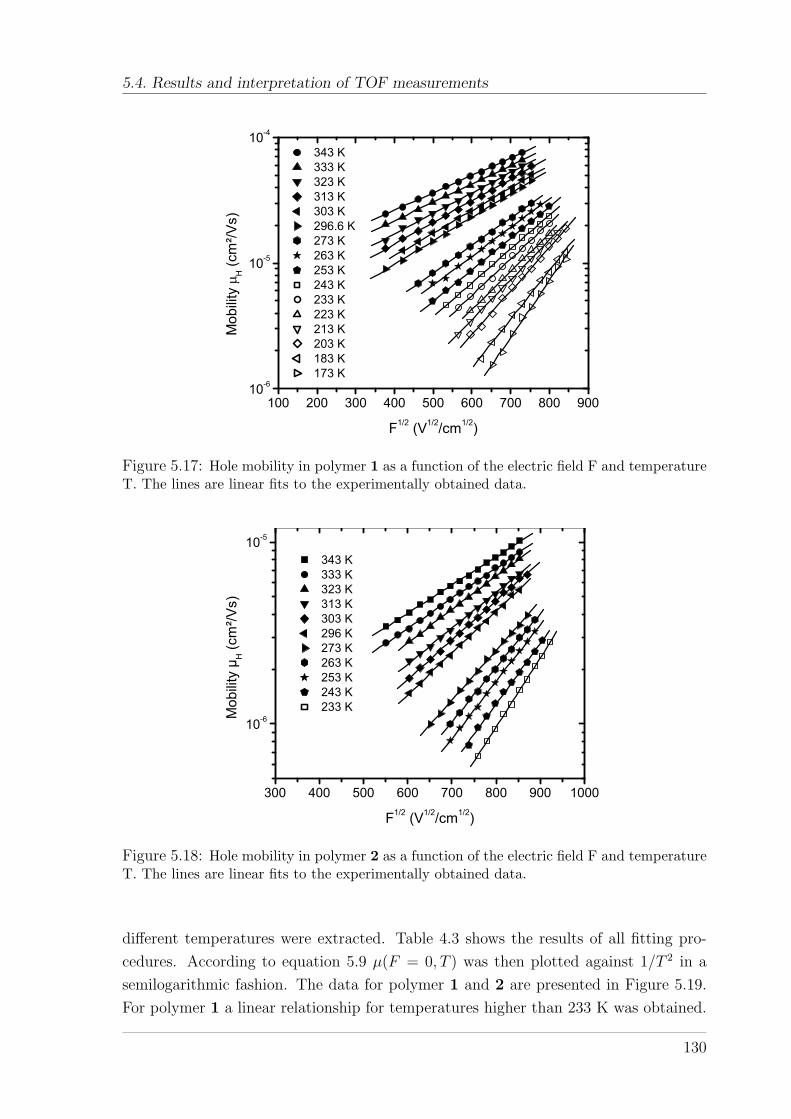
5.4. Results and interpretation of TOF measurements
100 200 300 400 500 600 700 800 90010-6
10-5
10-4
343 K 333 K 323 K 313 K 303 K 296.6 K 273 K 263 K 253 K 243 K 233 K 223 K 213 K 203 K 183 K 173 K
Mob
ility
H (c
m²/V
s)
F1/2 (V1/2/cm1/2)
Figure 5.17: Hole mobility in polymer 1 as a function of the electric field F and temperatureT. The lines are linear fits to the experimentally obtained data.
300 400 500 600 700 800 900 1000
10-6
10-5
343 K 333 K 323 K 313 K 303 K 296 K 273 K 263 K 253 K 243 K 233 K
Mob
ility
µH (c
m²/V
s)
F1/2 (V1/2/cm1/2)
Figure 5.18: Hole mobility in polymer 2 as a function of the electric field F and temperatureT. The lines are linear fits to the experimentally obtained data.
different temperatures were extracted. Table 4.3 shows the results of all fitting pro-
cedures. According to equation 5.9 µ(F = 0, T ) was then plotted against 1/T 2 in a
semilogarithmic fashion. The data for polymer 1 and 2 are presented in Figure 5.19.
For polymer 1 a linear relationship for temperatures higher than 233 K was obtained.
130
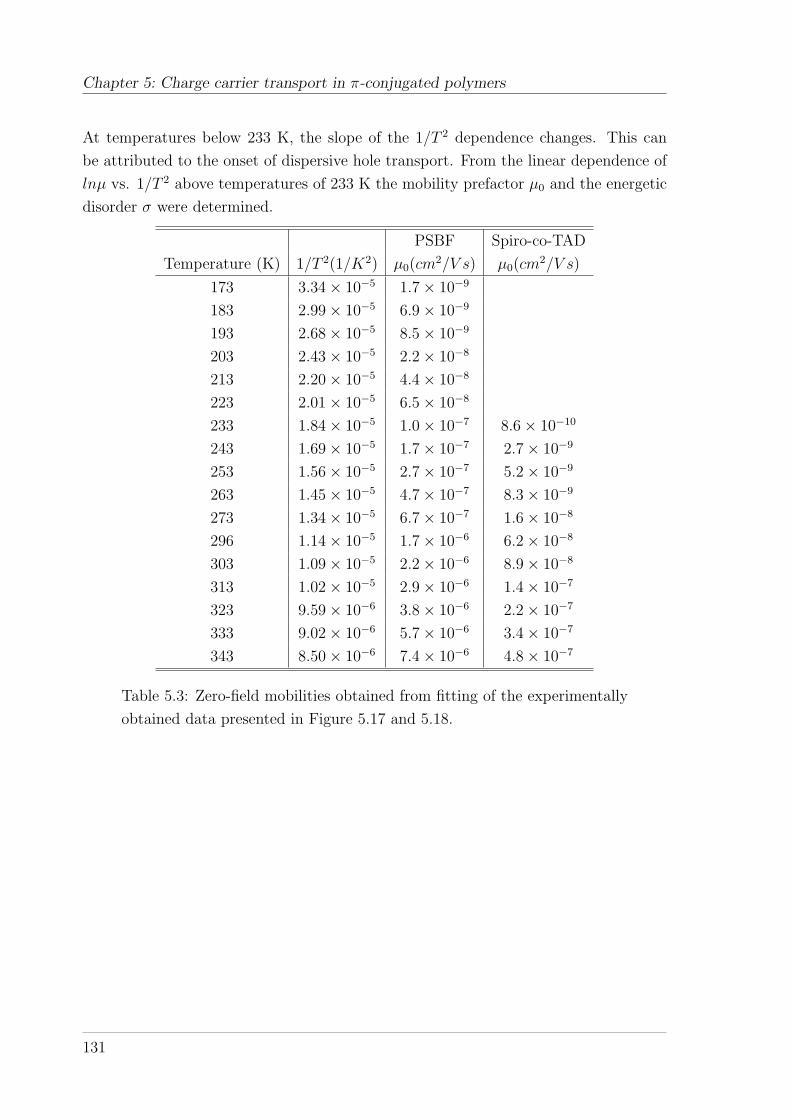
Chapter 5: Charge carrier transport in π-conjugated polymers
At temperatures below 233 K, the slope of the 1/T 2 dependence changes. This can
be attributed to the onset of dispersive hole transport. From the linear dependence of
lnµ vs. 1/T 2 above temperatures of 233 K the mobility prefactor µ0 and the energetic
disorder σ were determined.
PSBF Spiro-co-TAD
Temperature (K) 1/T 2(1/K2) µ0(cm2/V s) µ0(cm
2/V s)
173 3.34× 10⁻⁵ 1.7× 10⁻⁹
183 2.99× 10⁻⁵ 6.9× 10⁻⁹
193 2.68× 10⁻⁵ 8.5× 10⁻⁹
203 2.43× 10⁻⁵ 2.2× 10⁻⁸
213 2.20× 10⁻⁵ 4.4× 10⁻⁸
223 2.01× 10⁻⁵ 6.5× 10⁻⁸
233 1.84× 10⁻⁵ 1.0× 10⁻⁷ 8.6× 10⁻¹⁰
243 1.69× 10⁻⁵ 1.7× 10⁻⁷ 2.7× 10⁻⁹
253 1.56× 10⁻⁵ 2.7× 10⁻⁷ 5.2× 10⁻⁹
263 1.45× 10⁻⁵ 4.7× 10⁻⁷ 8.3× 10⁻⁹
273 1.34× 10⁻⁵ 6.7× 10⁻⁷ 1.6× 10⁻⁸
296 1.14× 10⁻⁵ 1.7× 10⁻⁶ 6.2× 10⁻⁸
303 1.09× 10⁻⁵ 2.2× 10⁻⁶ 8.9× 10⁻⁸
313 1.02× 10⁻⁵ 2.9× 10⁻⁶ 1.4× 10⁻⁷
323 9.59× 10⁻⁶ 3.8× 10⁻⁶ 2.2× 10⁻⁷
333 9.02× 10⁻⁶ 5.7× 10⁻⁶ 3.4× 10⁻⁷
343 8.50× 10⁻⁶ 7.4× 10⁻⁶ 4.8× 10⁻⁷
Table 5.3: Zero-field mobilities obtained from fitting of the experimentally
obtained data presented in Figure 5.17 and 5.18.
131

5.4. Results and interpretation of TOF measurements
0.5 1.0 1.5 2.0 2.5 3.0 3.5 4.010-11
10-10
10-9
10-8
10-7
10-6
10-5
10-4
polymer 1 polymer 2
T = 253 K
T = 233 K
Mob
ility
µH (c
m²/V
s)
1/T2 x 105 [K-2]
Figure 5.19: The zero-field mobility extracted from fitting the data in Figure 5.17 and 5.18as a function of 1/T 2.
Plotting the slope β(T ) of the field dependence against (σ/kT )2, as depicted in
Figure 5.20, allowed to extract C0 and the positional disorder Σ. The same analyti-
cal procedure was applied to the data obtained for polymer 2. The zero-field room-
temperature hole mobility of polymer 1 is in the order of 10−6cm2/V s. The hole
mobility can assume values of 4× 10⁻⁵cm2/V s at electric fields of 5× 10⁵V/cm which
can be easily reached in organic light emitting diodes.
In comparison to previous reports on hole mobilities of conjugated polymers, the
hole mobility of polymer 1 is orders of magnitude lower than, for instance, found in the
ladder-type polymer MeLPPP. However, among the π-conjugated polymers MeLPPP
is an exception in many cases. Its vibronically well-resolved fluorescence spectrum
implies that the polymer is far more ordered than any other conjugated polymer. This
leads to a hole mobility as high as 1× 10⁻³cm2/V s (T = 303 K, F = 6× 10⁴V/cm) as
reported earlier by Hertel et al. [HSB98] [HBSH99]. Furthermore, the dependence of
the mobility on field and temperature resembles that of molecular crystals rather than
of disordered conjugated polymers, except that the mobility is 2 to 3 orders lower.
It was shown that the relatively low mobility compared to molecular crystals is an
inherent feature of MeLPPP and not caused by traps. It is reasonable that charge
carrier mobility is lower in conjugated polymers even without defects that may act as
traps because charge transport occurs via on-chain migration and interchain hopping
of carriers between adjacent chains, the latter being the rate limiting step. Otherwise
the mobility should be much higher as indicated by the on-chain mobility of PPV
132

Chapter 5: Charge carrier transport in π-conjugated polymers
[HdHSW98]. However, spiropolymer 1 shows a hole mobility which is also one order
of magnitude lower than reported earlier for the well-investigated polymer poly(9,9-
dioctylfluorene) (PFO) [RB98] although the width of the density of states is higher in
PFO (103 meV) [PNB04] compared to 86 meV for polymer 1, which is some average
value for a conjugated polymer.
5.4.1.3 Interpretation of charge carrier transport parameters
The following table 4.4 presents the charge carrier transport parameters determined
for polymer 1 and from fitting the experimentally obtained data to equation 5.9.
Polymer µH(cm2/V s) µ0(cm2/V s) σ(eV ) C0(cm/V )1/2 Σ
PSBF 1.7× 10⁻⁶ a) 2.9× 10⁻⁴ 0.086 3.5× 10⁻⁴ ≈ 0
Spiro-co-TAD 6.2× 10⁻⁸ a) 1.5× 10⁻⁴ 0.107 3.6× 10⁻⁴ 1.8
Table 5.4: The charge carrier transport parameters of polymer 1 and 2.a) Zero-field mobility at room-temperature.
The extrapolation of the δµ/δF dependence on (σ/kT )2 (see Figure 5.20) to β = 0
results in a positional disorder close to zero (within experimental error) for polymer 1.
It appears that the lower mobility is an inherent feature of the polymer rather than a
0 5 10 15 20 250
1
2
3
4
5
6
7
8
polymer 1 polymer 2
=
(ln µ
/µ0)/
(F1/
2 ) [10
-3(c
m/V
)1/2 ]
( /kT)2
Figure 5.20: The slope β as a function of the disorder parameter σ = (σ/kT )2 for polymer1 and polymer 2.
consequence of traps. The constant C0 which is a measure for the charge carrier hopping
133

5.4. Results and interpretation of TOF measurements
distance may be further analyzed. Compared to a value of 2.9×10⁻⁴(cm/V )1/2 obtained
by Bassler and coworkers [BPB91b] from their Monte Carlo simulations using a hopping
distance of 0.6 nm the value of C0 for polymer 1 and 2 is 3.6× 10⁻⁴(cm/V )1/2. This is
lower than reported for TOF measurements on MEH-PPV (C0 = 1.7×10⁻³(cm/V )1/2)
[ITF+01], but higher than reported for PFO (C0 = 2.5×10⁻⁴(cm/V )1/2) [PKC+02] and
very similar to that found for the small molecular compound spiro-MeOTAD (C0 =
3.4× 10⁻⁴(cm/V )1/2) [PN03].
During charge transport the inherent disorder of any polymer allows only a few
favorable jump paths per chain segment. Charge carriers will move along the backbone
and only where there is sufficient overlap of wavefunctions with another polymer chain
charge carriers can hop from one chain to another. Interchain charge carrier transport
in a polymer can only proceed where two polymer chains are packed close enough to
each other. Due to the spiro-center and its bulky substituent interchain interaction
and chain movement should be hindered. Although there is not much difference for
the constant C0 compared to other conjugated polymers, the mobility prefactor µ0 is
considerably lower, for instance, one order of magnitude lower than reported for the
ladder-type MeLPPP [HSB98].
The hole mobility changes for spirocopolymer 2 which contains 10 % of a triarylamine-
biphenyl comonomer. As reported earlier by Redecker et al. [RBI+99] the incorpora-
tion of triarylamine into polyfluorenes can lead to an increase in hole mobility. For
spirocopolymer 2 the situation is different. The zero-field mobility drops to a value of
6.2× 10⁻⁸cm2/V s. Under high electric field conditions room temperature mobilities of
2.7 × 10⁻⁶cm2/V s at F = 5 × 10⁵V/cm were measured. This is more than one order
of magnitude less than in spiropolymer 1. Nevertheless, TOF transients of polymer 2
(Figure 5.21) exhibit a plateau indicative of non-dispersive charge carrier transport but
the tail is much more pronounced than for TOF transients of polymer 1. Obviously,
disorder is increased in this material and leads to a higher dispersion of TOF tran-
sients. This is confirmed by the charge carrier transport parameters extracted from
experimental data. The mobility prefactor µ0 is decreased to almost half of the value
of polymer 1. Furthermore, the width of the density of states is increased to 107 meV
by the incorporated triarylamine subunits. Additionally, the positional disorder pa-
rameter is increased to a value of 1.8 in polymer 2 whereas for polymer 1 a disorder
parameter close to zero was obtained.
The situation in polymer 2 can be understood as follows. It appears that the
incorporated triarylamine comonomer acts as a trap for the holes. As an approximation
the DOS of the copolymer can be described as the sum of the density of states of
the spirocopolymer and the DOS of the triarylamine comonomers. Effectively, this
leads to an increase of the width for copolymer 2. Moreover, the positional disorder
134

Chapter 5: Charge carrier transport in π-conjugated polymers
0 20 40 60 80 100 120 140
polymer 2
polymer 1
F = 7.3x10⁵ V/cm
F = 3.9x10⁵ V/cm
Phot
ocur
rent
(a.u
.)
Time (µs)
Figure 5.21: Direct comparison of TOF hole current transients obtained for polymer 1 andpolymer 2. The electric field values are depicted in the figure.
parameter is increased compared to polymer 1 which can be explained by the change
of morphology that must take place by the incorporation of triarylamine subunits since
they request the formation of a kink between the spiro centered segments. Further,
it is known that a biphenyl-moiety is twisted rather than planar which introduces
additional disorder into the polymer. The above described scenario is supported by the
observation of equal values of the constant C0 for both polymers indicating that charge
carrier transport occurs via identical hopping paths and hopping distances. One can
conclude that the charge carriers are transported mainly by the spiro-backbone and
jump between adjacent spiro-segments that have sufficient overlap of wavefunctions
whereas the triarylamine units act as traps reducing the hole mobility in polymer 2.
Their concentration may be too low to open an additional transport path.
Finally, the change of slope in the 1/T 2 dependence which is commonly attributed
to a transition from nondispersive to dispersive hole transport occurs approximately
at 253 K in polymer 2 whereas for polymer 1 the transition takes place at 233 K
indicating higher order in the latter. Earlier simulation studies predicted an equation
which enables us to calculate the critical temperature at which the transition from
nondispersive to dispersive transport should occur (equation 5.12) [BPB92]. Using
a variance of σ = 86meV predicts a dispersive transport regime below Tc = 229K
for polymer 1. This is in excellent agreement with the experimentally obtained value
(see Figure 5.19) which showed a dispersive transport regime for measurements below
135
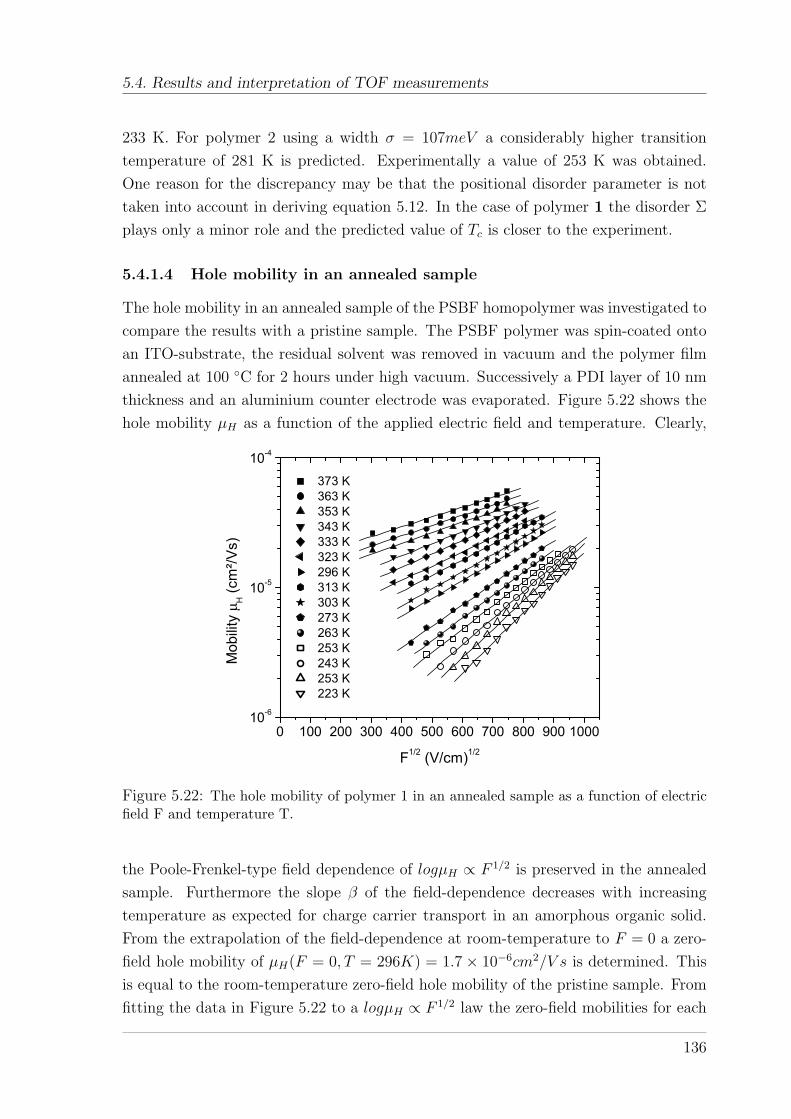
5.4. Results and interpretation of TOF measurements
233 K. For polymer 2 using a width σ = 107meV a considerably higher transition
temperature of 281 K is predicted. Experimentally a value of 253 K was obtained.
One reason for the discrepancy may be that the positional disorder parameter is not
taken into account in deriving equation 5.12. In the case of polymer 1 the disorder Σ
plays only a minor role and the predicted value of Tc is closer to the experiment.
5.4.1.4 Hole mobility in an annealed sample
The hole mobility in an annealed sample of the PSBF homopolymer was investigated to
compare the results with a pristine sample. The PSBF polymer was spin-coated onto
an ITO-substrate, the residual solvent was removed in vacuum and the polymer film
annealed at 100 C for 2 hours under high vacuum. Successively a PDI layer of 10 nm
thickness and an aluminium counter electrode was evaporated. Figure 5.22 shows the
hole mobility µH as a function of the applied electric field and temperature. Clearly,
0 100 200 300 400 500 600 700 800 900 100010-6
10-5
10-4
373 K 363 K 353 K 343 K 333 K 323 K 296 K 313 K 303 K 273 K 263 K 253 K 243 K 253 K 223 K
Mob
ility
H (c
m²/V
s)
F1/2 (V/cm)1/2
Figure 5.22: The hole mobility of polymer 1 in an annealed sample as a function of electricfield F and temperature T.
the Poole-Frenkel-type field dependence of logµH ∝ F 1/2 is preserved in the annealed
sample. Furthermore the slope β of the field-dependence decreases with increasing
temperature as expected for charge carrier transport in an amorphous organic solid.
From the extrapolation of the field-dependence at room-temperature to F = 0 a zero-
field hole mobility of µH(F = 0, T = 296K) = 1.7× 10⁻⁶cm2/V s is determined. This
is equal to the room-temperature zero-field hole mobility of the pristine sample. From
fitting the data in Figure 5.22 to a logµH ∝ F 1/2 law the zero-field mobilities for each
136
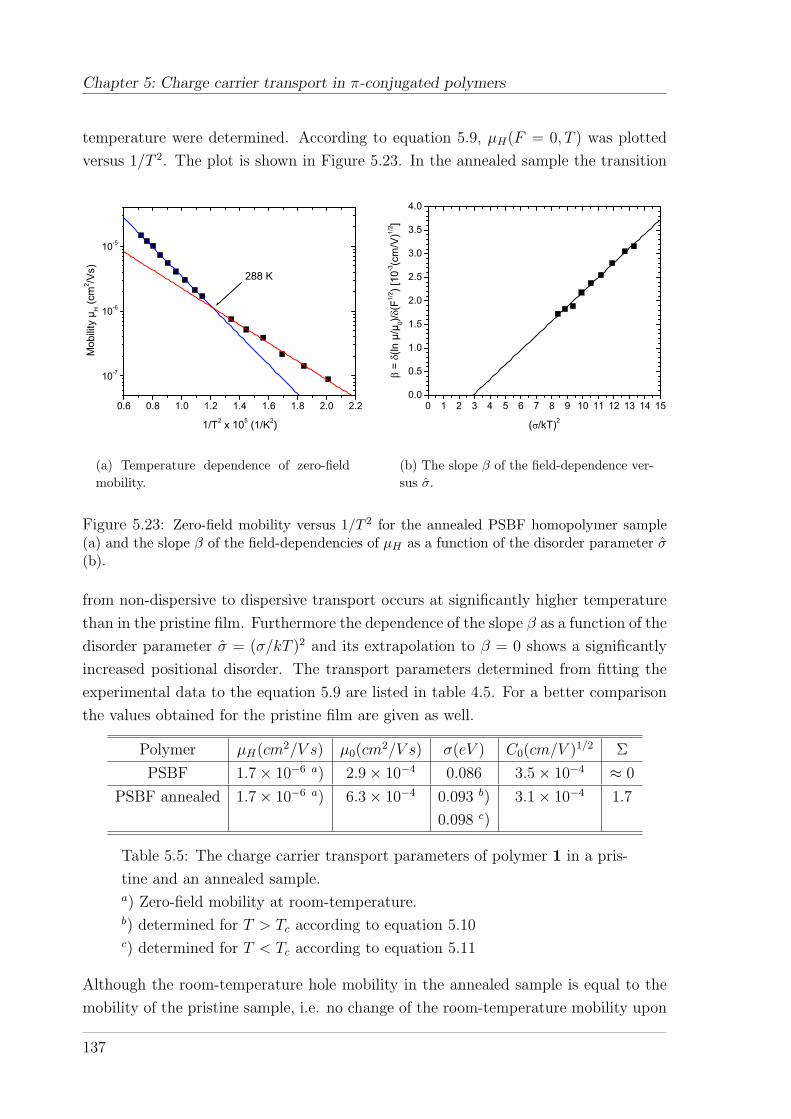
Chapter 5: Charge carrier transport in π-conjugated polymers
temperature were determined. According to equation 5.9, µH(F = 0, T ) was plotted
versus 1/T 2. The plot is shown in Figure 5.23. In the annealed sample the transition
0.6 0.8 1.0 1.2 1.4 1.6 1.8 2.0 2.2
10-7
10-6
10-5
288 K
Mob
ility
µH (c
m2 /V
s)
1/T2 x 105 (1/K2)
(a) Temperature dependence of zero-fieldmobility.
0 1 2 3 4 5 6 7 8 9 10 11 12 13 14 150.0
0.5
1.0
1.5
2.0
2.5
3.0
3.5
4.0
=
(ln µ
/µ0)/
(F1/
2 ) [10
-3(c
m/V
)1/2 ]
( /kT)2
(b) The slope β of the field-dependence ver-sus σ.
Figure 5.23: Zero-field mobility versus 1/T 2 for the annealed PSBF homopolymer sample(a) and the slope β of the field-dependencies of µH as a function of the disorder parameter σ(b).
from non-dispersive to dispersive transport occurs at significantly higher temperature
than in the pristine film. Furthermore the dependence of the slope β as a function of the
disorder parameter σ = (σ/kT )2 and its extrapolation to β = 0 shows a significantly
increased positional disorder. The transport parameters determined from fitting the
experimental data to the equation 5.9 are listed in table 4.5. For a better comparison
the values obtained for the pristine film are given as well.
Polymer µH(cm2/V s) µ0(cm2/V s) σ(eV ) C0(cm/V )1/2 Σ
PSBF 1.7× 10⁻⁶ a) 2.9× 10⁻⁴ 0.086 3.5× 10⁻⁴ ≈ 0
PSBF annealed 1.7× 10⁻⁶ a) 6.3× 10⁻⁴ 0.093 b) 3.1× 10⁻⁴ 1.7
0.098 c)
Table 5.5: The charge carrier transport parameters of polymer 1 in a pris-
tine and an annealed sample.a) Zero-field mobility at room-temperature.b) determined for T > Tc according to equation 5.10c) determined for T < Tc according to equation 5.11
Although the room-temperature hole mobility in the annealed sample is equal to the
mobility of the pristine sample, i.e. no change of the room-temperature mobility upon
137

5.4. Results and interpretation of TOF measurements
annealing the film can be observed, the other charge transport parameters have changed
significantly. The width of the energetic disorder has been increased by annealing
to above 93 meV determined from the nondispersive transport regime and 98 meV
determined from the dispersive transport regime. The positional disorder is increased
to Σ = 1.7, whereas for the pristine film a width of the positional disorder of Σ ≈ 0 was
obtained. Both, the increase in the energetic disorder and in the positional disorder,
may lead to the observed increase in the transition temperature from a non-dispersive to
a dispersive transport regime. The remaining question is, what has been chemically or
physically changed in the polymer film upon annealing. This is not trivial to answer,
since the shape of the TOF signals show still non-dispersive hole transport in the
annealed sample. Whatever type of ”defect” is created in the film it does not form
deep traps for holes. Only the width of the DOS is increased. Since the annealing
temperature was below the glass transition temperature Tg of the polymer a substantial
change in the film morphology is unlikely.
138

Chapter 5: Charge carrier transport in π-conjugated polymers
5.4.2 TOF measurements on Spiro-co-(10%)anthracene andSpiro-co-(10%)carbazole
5.4.2.1 Temperature and field-dependence of hole mobility
Figure 5.24 shows representative TOF transients of the polyspirobifluorene-anthracene
copolymer (polymer 3) at different temperatures at constant electric field. The room
0 10 20 30 40 50 60 70 800.0
0.1
0.2
0.3
0.4
0.5
0.6
F = 4.4x10⁵ V/cm
T = 253 KT = 293 K
T = 323 K
T = 343 K
Cusp
Phot
ocur
rent
(a.u
.)
Time (µs)
Figure 5.24: Typical room-temperature TOF hole current transients of polymer 3 at an elec-tric field of 4.4×10⁵V/cm and varying sample temperature. Note that at higher temperaturesa cusp developes.
temperature (T = 293 K) TOF transient shows a clear plateau indicative of non-
dispersive hole transport with a pronounced tail that represents the diffusion broad-
ening of the charge carrier package during its transport through the polymer film. At
higher temperatures, the TOF transients are modified by the emergence of a cusp.
The cusp becomes more pronounced with increasing temperature. The origin of this
cusp is an important feature of charge carrier transport within a disordered density
of transport states as will be discussed later. At lower temperatures, the length of
the tail of the TOF transients increases but the plateau persists even at the lowest
temperatures investigated in this study. The transit time of the charge carrier pack-
age can be determined from the intersection of asymptotes to the plateau and the
tail. This corresponds to the time when the charge carrier package starts arriving
at the counter electrode. Using this method one has to take into consideration that
one keeps mainly track of the fastest charge carriers. Recent studies of charge carrier
transport in conjugated materials have shown that a transit time which corresponds
139

5.4. Results and interpretation of TOF measurements
to the time at which the amplitude of the transient has decayed to half or even to a
quarter of its initial value leads to results which are better comparable to those ob-
tained from space charge limited current (SCLC) measurements [CBA+00] [PNB04].
However, the functional dependencies are independent of data analysis, though the
absolute values may change to lower mobility. The mobility was calculated according
to equation 5.1. The TOF measurements were performed over a wide range of elec-
100 200 300 400 500 600 700 800 900
10-5
10-4
343 K 333 K 323 K 313 K 303 K 293 K 273 K 263 K 253 K 243 K 233 K 223 K 213 KM
obilit
y µ H
(cm
²/Vs)
F1/2 (V/cm)1/2
Figure 5.25: Hole mobility of polymer 3 as a function of the electric field F and the temper-ature T. The lines are linear fits to the data.
tric fields and temperatures. Figure 5.25 depicts the hole mobility of polymer 3 as a
function of the electric field at different temperatures. Figure 5.26 contains the data
for polymer 4. The mobilities follow a lnµH ∝ F 1/2 dependence on electric field at all
temperatures investigated. Further, the slope of the field dependence increases with
decreasing temperature. Such behaviour has been described by Bassler and coworkers
in their disorder formalism of charge carrier transport [BPB91b] [B93]. The disorder
formalism assumes an energetic and a positional distribution of transport sites which
are both of Gaussian shape. The former is called diagonal disorder and described by
the disorder parameter which corresponds to the width of the transport density of
states, whereas the latter is called off-diagonal disorder described by the positional
disorder parameter Σ. The model takes into account neither the history of the charge
carrier during its migration through the density of states nor any correlation between
different transport sites. Moreover, the transport sites are considered as points having
no spatial extension which is a somewhat questionable simplification of the reality in
140
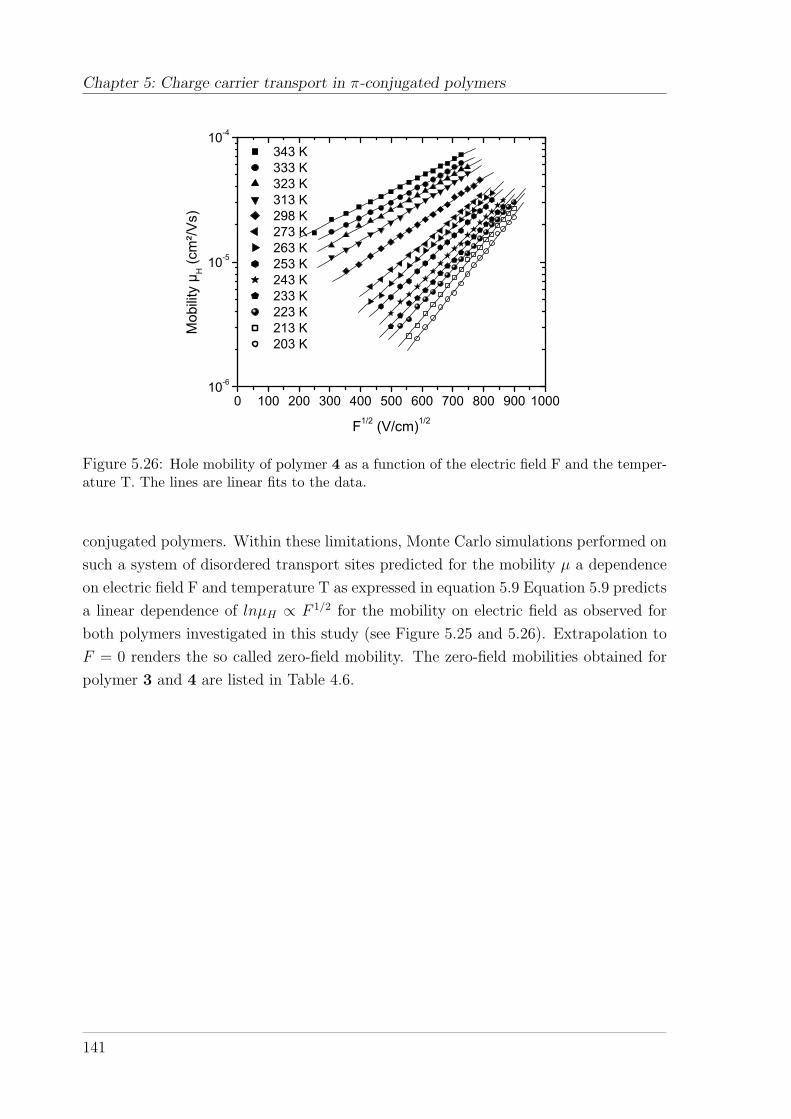
Chapter 5: Charge carrier transport in π-conjugated polymers
0 100 200 300 400 500 600 700 800 900 100010-6
10-5
10-4
343 K 333 K 323 K 313 K 298 K 273 K 263 K 253 K 243 K 233 K 223 K 213 K 203 K
Mob
ility
µ H (c
m²/V
s)
F1/2 (V/cm)1/2
Figure 5.26: Hole mobility of polymer 4 as a function of the electric field F and the temper-ature T. The lines are linear fits to the data.
conjugated polymers. Within these limitations, Monte Carlo simulations performed on
such a system of disordered transport sites predicted for the mobility µ a dependence
on electric field F and temperature T as expressed in equation 5.9 Equation 5.9 predicts
a linear dependence of lnµH ∝ F 1/2 for the mobility on electric field as observed for
both polymers investigated in this study (see Figure 5.25 and 5.26). Extrapolation to
F = 0 renders the so called zero-field mobility. The zero-field mobilities obtained for
polymer 3 and 4 are listed in Table 4.6.
141

5.4. Results and interpretation of TOF measurements
Spiro-co-anthracene Spiro-co-carbazole
Temperature (K) 1/T 2(1/K2) µ0(cm2/V s) µ0(cm
2/V s)
203 2.43× 10⁻⁵ - 3.7× 10⁻⁸
213 2.20× 10⁻⁵ 1.3× 10⁻⁷ 5.7× 10⁻⁸
223 2.01× 10⁻⁵ 1.9× 10⁻⁷ 1.1× 10⁻⁸
233 1.84× 10⁻⁵ 3.0× 10⁻⁷ 1.5× 10⁻⁷
243 1.69× 10⁻⁵ 4.3× 10⁻⁷ 2.3× 10⁻⁷
253 1.56× 10⁻⁵ 6.0× 10⁻⁷ 3.5× 10⁻⁷
263 1.45× 10⁻⁵ 7.8× 10⁻⁷ 5.2× 10⁻⁷
273 1.34× 10⁻⁵ 1.1× 10⁻⁶ 8.1× 10⁻⁷
296 1.14× 10⁻⁵ 1.8× 10⁻⁶ 2.1× 10⁻⁶
303 1.09× 10⁻⁵ 2.3× 10⁻⁶ -
313 1.02× 10⁻⁵ 3.1× 10⁻⁶ 3.6× 10⁻⁶
323 9.59× 10⁻⁶ 4.2× 10⁻⁶ 5.3× 10⁻⁶
333 9.02× 10⁻⁶ 5.0× 10⁻⁶ 6.8× 10⁻⁶
343 8.50× 10⁻⁶ 6.6× 10⁻⁶ 8.8× 10⁻⁶
Table 5.6: Zero-field mobilities obtained from fitting of the experimentally
obtained data presented in Figure 5.17 and 5.18.
5.4.2.2 Temperature dependence of the zero-field mobility
As also predicted from equation 5.9, plotting logµ(F = 0, T ) as a function of 1/T 2
leads to a linear dependence (Figure 5.27) from which the energetic disorder parameter
and the mobility prefactor µ0 can be determined. Further, plotting the slopes β of the
field dependencies against (σ/kT )2 gives access to the positional disorder parameter
and the intersite hopping constant C0 (Figure 5.28).
However, due to the above mentioned limitations, especially the point shape of the
molecules that was used to derive equation 5.9, these values may have some intrinsic
uncertainty and should be interpreted carefully. Nevertheless, it should be possible
to compare structurally similar compounds among each other. The charge transport
parameters derived from fitting the experimentally obtained mobility data are summa-
rized in Table 4.7. Both polymers exhibit a zero-field mobility which is in the order
of 10−6cm2/V s at room temperature. For electric fields above 5 × 10⁵V/cm, very
common for conventional organic LEDs, the mobility reaches values in the order of
10−5cm2/V s. These values are comparable to the charge carrier mobility found for the
spiro-homopolymer.
142

Chapter 5: Charge carrier transport in π-conjugated polymers
0.8 1.0 1.2 1.4 1.6 1.8 2.0 2.2 2.410-7
10-6
10-5
286 K
Mob
ility
µ H (c
m²/V
s)
1/T² x 105 (1/K2)
(a) Temperature dependence of zero-fieldmobility of polymer 3.
0.8 1.0 1.2 1.4 1.6 1.8 2.0 2.2 2.4 2.6
10-7
10-6
10-5
T = 258 K
Mob
ility
µ H (c
m²/V
s)
1/T2 x 105 (1/K2)
(b) Temperature dependence of zero-fieldmobility of polymer 4.
Figure 5.27: Zero-field hole mobility versus 1/T 2 for polymer 3 and 4. The lines representlinear fits to the data for the high temperature and the low temperature regime.
Polymer µH(cm2/V s) µ0(cm2/V s) σ(eV ) C0(cm/V )1/2 Σ
Spiro-co-anthracene 3 1.8× 10⁻⁶ a) 2.1× 10⁻⁴ 0.083 b) 3.4× 10⁻⁴ ≈ 0
0.086 c)
Spiro-co-carbazole 4 2.1× 10⁻⁶ a) 4.9× 10⁻⁴ 0.089 b) 3.6× 10⁻⁴ 1.1
0.088 c)
Table 5.7: Charge carrier transport parameters of polymer 3 and 4.a) Zero-field mobility at room-temperature.b) determined for T > Tc according to equation 5.10c) determined for T < Tc according to equation 5.11
The results of TOF experiments on that polymer and a comparison of its mobility
and charge transport parameters with those of other conjugated polymers, for instance
the far more ordered MeLPPP, [HSB98] [HBSH99] an alkylsubstituted polyfluorene
(PFO) [PKC+02] [RB98] and MEH-PPV [ITF+01] can be found in the previous section.
Not only are the charge transport mobilities observed for both polymers in this
study similar to the previously reported homopolymer, but also the width of the trans-
port density of states and the intersite hopping constant C0 are of similar values.
Thus, the incorporation of anthracene or carbazole does not significantly change the
transport properties which can be understood since the HOMO energy of carbazole
and anthracene is below the HOMO energy of the alkoxy-substituted spirobifluorene
(≈ −5.3eV ) backbone. The data thus reflect an in-chain dilution with 10% anti-traps
in both cases.
143
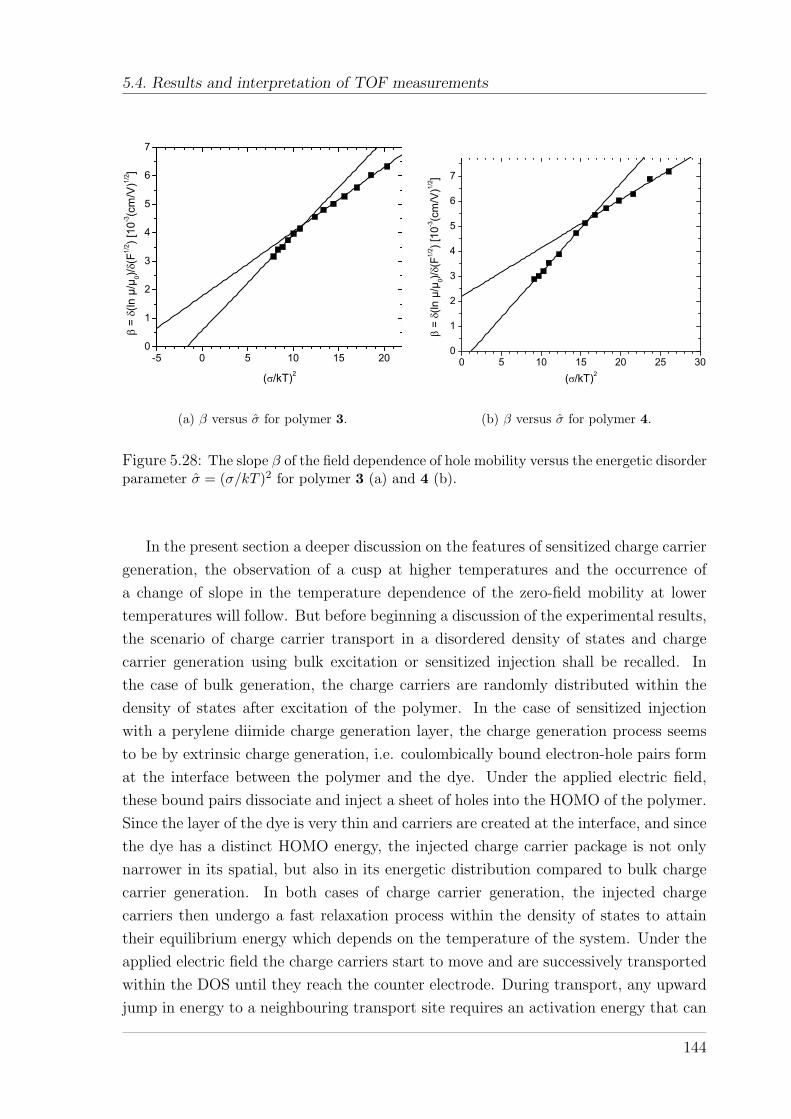
5.4. Results and interpretation of TOF measurements
-5 0 5 10 15 200
1
2
3
4
5
6
7
=
(ln µ
/µ0)/
(F1/
2 ) [10
-3(c
m/V
)1/2 ]
( /kT)2
(a) β versus σ for polymer 3.
0 5 10 15 20 25 300
1
2
3
4
5
6
7
=
(ln µ
/µ0)/
(F1/
2 ) [10
-3(c
m/V
)1/2 ]
( /kT)2
(b) β versus σ for polymer 4.
Figure 5.28: The slope β of the field dependence of hole mobility versus the energetic disorderparameter σ = (σ/kT )2 for polymer 3 (a) and 4 (b).
In the present section a deeper discussion on the features of sensitized charge carrier
generation, the observation of a cusp at higher temperatures and the occurrence of
a change of slope in the temperature dependence of the zero-field mobility at lower
temperatures will follow. But before beginning a discussion of the experimental results,
the scenario of charge carrier transport in a disordered density of states and charge
carrier generation using bulk excitation or sensitized injection shall be recalled. In
the case of bulk generation, the charge carriers are randomly distributed within the
density of states after excitation of the polymer. In the case of sensitized injection
with a perylene diimide charge generation layer, the charge generation process seems
to be by extrinsic charge generation, i.e. coulombically bound electron-hole pairs form
at the interface between the polymer and the dye. Under the applied electric field,
these bound pairs dissociate and inject a sheet of holes into the HOMO of the polymer.
Since the layer of the dye is very thin and carriers are created at the interface, and since
the dye has a distinct HOMO energy, the injected charge carrier package is not only
narrower in its spatial, but also in its energetic distribution compared to bulk charge
carrier generation. In both cases of charge carrier generation, the injected charge
carriers then undergo a fast relaxation process within the density of states to attain
their equilibrium energy which depends on the temperature of the system. Under the
applied electric field the charge carriers start to move and are successively transported
within the DOS until they reach the counter electrode. During transport, any upward
jump in energy to a neighbouring transport site requires an activation energy that can
144
Chapter 5: Charge carrier transport in π-conjugated polymers
be provided by the electric field or by thermal activation. If deep traps are absent, all
carriers are transported with almost the same average speed resulting in a constant
current as observed in the TOF transients. However, the initially created charge carrier
package undergoes a diffusive broadening during its migration through the bulk which
results in a pronounced tail of the TOF transients.
For decreasing temperature, the simulations predicted a change of the slope of the
zero-field mobility dependence on temperature as expressed by the equations 5.10, 5.11
and 5.12, respectively. For temperatures below Tc, the charge carriers cannot attain
their dynamic equilibrium any more since the relaxation process towards the dynamic
equilibrium is slower, upward jumps and ”detours” being impeded by a lack of thermal
activation energy. The dependence of the zero-field mobility on temperature decreases
as a consequence of an incomplete relaxation process. This has been qualitatively
confirmed in several prior studies of charge transport in conjugated polymers. For
the poylmers presented in this section, the temperature dependence of the zero-field
mobility changes its slope at approximately 286 K for polymer 3 and 258 K for polymer
4 (see Figure 5.27) although the plateau in the transients, indicative of non-dispersive
transport, remains even below Tc (see Figure 5.28). The reason may be the injection of
charge carriers from the CGL close to their thermal equilibrium energy into the DOS
so that no further thermal relaxation process occurs. However, in the low-temperature
transport regime charge carriers do not attain their dynamic transport equilibrium
anymore. It is remarkable that extracting the width σ of the transport density of
states from the temperature dependence below Tc according to equation 5.11 leads to
very similar values of (see Table 4.5) as obtained from the temperature dependence
above Tc using equation 5.10. It thus appears that the disorder formalism does not
only give a qualitative description of the change of slope in the 1/T 2 dependence for
conjugated polymers, but even a quantitative one. This is a somewhat unexpected
result given the aforementioned initial assumptions that were used to derive equations
5.10 and 5.11.
However, the disorder model also has its limitations since the positional disorder
parameter was not taken into account in deriving equation 5.12. This negligence is
obviously problematic in the case of an amorphous film of a disordered conjugated
polymer that was prepared by spin-coating. Hence, the transition temperatures Tc
calculated from the σ-values are not in accordance with the experimentally observed
transition temperatures, and a meaningful positional disorder parameter Σ could not
be derived in all cases.
145

5.4. Results and interpretation of TOF measurements
5.4.2.3 The occurrence of a cusp at higher temperatures
Finally, the emergence of a cusp in the TOF transients at higher temperatures has to
be discussed. The observation of a cusp has sometimes been reported in the literature
[NvdAdS+93] [OKK+99]. In the present study, the slope of the cusp increased with
increasing temperature, but the occurrence of the cusp was found to be independent
of the applied electric field and laser excitation intensity. A comparison of TOF hole
transient signals is presented in Figure 5.29.
0 20 40 60 800.0
0.1
0.2
0.3
0.4
0.5
F = 4.4x10⁵ V/cm
Phot
ocur
rent
(a.u
.)
Time (µs)
213 K 223 K 233 K 243 K 253 K 263 K 273 K 293 K 303 K 313 K 323 K 333 K 343 K
(a) TOF signals of polymer 3.
0 20 40 60 80 100 1200.0
0.1
0.2
0.3
0.4
0.5
0.6
343 K 333 K 323 K 313 K 296 K 273 K 263 K 253 K 243 K 233 K 223 K 213 K 203 K
F = 4.6x10⁵ V/cm
Phot
ocur
rent
(a.u
.)
Time (µs)
(b) TOF signals of polymer 4.
Figure 5.29: TOF hole current transients for polymer 3 and 4 at the same electric field butdifferent temperatures . Note the emergence of a cusp at higher temperatures.
The cusp might be an important intrinsic feature of the transport between randomly
disordered transport sites rather than caused by space charge effects as one could
suggest. Borsenberger et al. [BPB91a] suggested an explanation based on the idea
that the initial occupancy of charge carriers created in a DOS of localized states is
important for the occurrence of a cusp. If charge carriers are created randomly in the
DOS they will relax to their thermal equilibrium energy ε∞ = −(σ2/kT ) with respect
to the center of the DOS. Hence, this causes a displacement current in the sample that
will decay in time. The current settles to a plateau if the relaxation time is shorter
than the transit time, otherwise the signal will be dispersive. In the case of sensitized
charge carrier injection the charges can be injected with there quasi-equilibrium energy
into the DOS. The current will immediately settle to a plateau until the charge carriers
arrive at the counter electrode. On the other hand if the energy at which the charge
carriers are injected into the DOS is below there equilibrium energy they have to climb
up to transport sites which are higher in energy in order to get transported. The
present results support this idea. The occupied density of states shifts with increasing
146

Chapter 5: Charge carrier transport in π-conjugated polymers
E
r(E)
DOS
0
Einj
(1)
ODOS
E
0
(2)
Einj
s2
kT1
e¥= -
s2
kT1
e¥= -
r(E)
Figure 5.30: Representation of the energetic situation of the DOS at room temperature T1
(1) and at a higher temperature T2 (2) assuming a constant energy of injection Einj . In case(1) the holes are injected close to their equilibrium energy Eeq. Transport of charges canoccur immediately. In case (2) the holes are injected into the tail of the occupied density ofstates (ODOS), therefore they have to reach transport sites closer to the center of the ODOSbefore transport can occur. This process may cause the cusp that can be observed at highertemperatures.
temperature closer to the center of the DOS. Thus, at higher temperatures the charge
carriers are injected from the CGL into transport sites which are in the tail of the
ODOS (situation (2) in Figure 5.30). Hence, in the beginning the charge carriers are
trapped in the tail of the ODOS and have to be heated up to transport sites which are
closer to the equilibrium energy of the ODOS in order to be transported. As a result
the speed of the charge carriers increases with time since the density of transport sites
increases and more transport sites can be reached by the charge carriers. This may
lead to a continuously increasing current as observed in the TOF transients and to the
emergence of a cusp that becomes more pronounced at higher temperatures.
147

5.5. Discussion and Outlook
5.5 Discussion and Outlook
The charge-generation-layer time-of-flight technique was successfully applied to mea-
sure the hole mobility of a series of spirobifluorene copolymers. These include a spirobi-
fluorene homopolymer as reference polymer, a TAD-containing copolymer as well as an
anthracene and carbazole-containing copolymer. All investigated (co)polymers exhibit
non-dispersive hole transport indicated by a distinct plateau in the TOF hole current
transient. This testifies on the high purity and defect-free structure of the polymers
since deep traps for holes are absent which would lead to a dispersion of transit times,
thus dispersive TOF transients. Furthermore TOF transients could be measured for
temperatures as high as 100 C which shows also the good thermal stability of the
polymers and equal TOF signals could be obtained even after repetitive measurements
without any significant change of the TOF transients testifying on the hole transport
stability of the polymers.
The zero-field hole mobility of the spirobifluorene homopolymer was determined
to be in the order of 10−6cm2/V s. It reaches values in the order of 10−5cm2/V s at
electric fields above 105V/cm which are typical for organic LEDs. Thus, the transit
time of the charge carrier in a device with a typical thickness of the organic layer of
100 nm would be significantly below 1µs. The hole mobility is considerably reduced
in the spirobifluorene copolymer containing 10% TAD, whereas the carbazole- and
anthracene-containing copolymers exhibit similar hole mobilities. The zero-field room-
temperature hole mobility of the Spiro-co-TAD copolymer is around 6 × 10⁻⁸cm2/V s
and in the order of 10−6cm2/V s at high electric fields, hence it is approximately one
order of magnitude lower than the hole mobility of the homopolymer. Nevertheless
a plateau indicating non-dispersive hole transport can still be observed in the TOF
transients although the tail is anomalously broadened. In conclusion the TAD units act
as shallow traps for holes leading to a significantly reduced mobility in the copolymer.
The hole mobilities of all four copolymers were measured over a wide range of elec-
tric fields and temperatures. A Poole-Frenkel-type field-dependence of logµH ∝ F 1/2
was obeyed for all fields and temperatures measured. The disorder model of charge
carrier transport proposed by Bassler and coworkers was applied to extract the typ-
ical charge transport parameters, which are the energetic width σ of the transport
density of states and the width of the positional disorder Σ. From a comparison of
the obtained parameters one can conclude that the incorporation of TAD leads to a
broadening of the energy distribution of the density of states implying the formation
of shallow traps in the copolymer since σ is significantly increased from 86 meV in the
homopolymer to 107 meV in the copolymer. This is confirmed by the significantly more
pronounced tail in the TOF signals of the TAD-containing copolymer compared to the
homopolymer as discussed above. Furthermore the positional disorder is increased in
148
Chapter 5: Charge carrier transport in π-conjugated polymers
the Spiro-co-TAD due to the presence of the comonomer which forms kink linkages
in the spiro-backbone. The anthracene- and carbazole-containing copolymers show a
width of the energy distribution of the density of transport states which is comparable
to that of the homopolymer. The positional disorder is increased in the carbazole-
containing copolymer, whereas for the anthracene-containing copolymer it is similar to
the homopolymer. From this one can conclude that mainly the width σ of the energy
distribution of transport sites influences the hole mobility of polymers of similar back-
bone structures. In comparison to polyfluorene the width σ of the spirohomopolymer
is even lower but its hole mobility is also lower. This implies that other effects also
influence the hole mobility. Usually the rate-limiting step in charge carrier transport
is the interchain charge transfer not the intrachain transfer. The interchain jump of a
charge carrier may be slower in the case of spiropolymers due to their bulky structure
which hinders interchain interaction in comparison to polyfluorene-type polymers.
Finally, the validity of the disorder formalism of charge carrier transport in the
present case of spiropolymers has to be discussed. The model predicts a Poole-Frenkel-
type field dependence at high electric fields of logµH ∝ F 1/2 with the slope β decreasing
with increasing temperature. Both predictions have been observed for all spiropoly-
mers investigated. At lower electric fields a deviation from the Poole-Frenkel-behavior
towards higher mobilities is predicted. This could not be observed in the present study.
The logµH ∝ F 1/2 dependence is preserved over the whole range of investigated electric
fields. The reason may be that in the investigated range of electric fields the field de-
pendence has already approached the square-root dependence since TOF signals were
measured at fields higher than 105V/cm.
Furthermore the model predicts a 1/T 2 dependence of the zero-field mobility on tem-
perature with a change of slope below a critical temperature Tc linked to a critical
disorder parameter σ. Not only the 1/T 2 dependence is obeyed for all polymers but
also the predicted change of slope was observed. The most striking observation is that
the model not only predicts the change of slope in a qualitative manner but also quan-
titatively since extracting the width σ according to equation 5.10 for the nondispersive
regime and equation 5.11 below Tc lead to similar values. This is astonishing since
many simplifications in deriving equation 5.9 were done. For example, the transport
sites are considered point like which is obviously not true in the case of conjugated
polymers and the model neglects any history of the charge carrier during its migration
through the distribution of transport sites and any intersite correlation.
Nevertheless, the model has its limitations and should not be stressed over a certain
limit. Not in all cases a meaningful positional disorder parameter Σ could be extracted
from the data. For instance, the analysis of the slope β as a function of the energetic
disorder parameter σ leads to negative values of Σ2 in case of the homopolymer. The
149
5.5. Discussion and Outlook
reason could be a failure of the model or the uncertainty of the experiment. If the
parameter Σ is close to zero the experimental error could cause negative values of Σ2.
However, in conclusion the experimental observations show that hole transport in the
present amorphous spirobifluorene copolymers can be described very well by the dis-
order formalism and results underline the validity of the model for charge transport in
semiconducting polymers.
150

Chapter 6
Amplified spontaneous emission inpolymer waveguides
This chapter presents results of experiments on amplified spontaneous emission (ASE)
in thin polymer film waveguides upon optical pumping. Light amplification in a novel
fully-arylated poly(indenofluorene) was characterized by optical spectroscopy to de-
termine the material parameters for ASE such as, threshold pump intensity value for
light amplification, gain and loss constants. Furthermore the oxidative stability of the
polymer was investigated upon optical pumping under ambient conditions. A new ex-
perimental setup, that has not been described in literature up to now, was developed
employing a laser beam homogenizer to achieve highest reproducibility and accuracy
of results. Before entering the discussion of the obtained results a short introduction
to the phenomenon of ASE in conjugated polymers will be given.
6.1 Introduction - Theoretical background
6.1.1 Motivation
Since the first observation of electroluminescence from conjugated polymers, research
in organic electronics has been stimulated by the technological applications of polymers
in light emitting diodes (OLEDs), field effect transistors (OFETs), photodetectors and
solar cells (OSC). Moreover, in 1996 Hide et al. reported the first observation of gain
narrowing and stimulated emission in optically pumped thin polymer films [HDGS+96]
[HSDGH96] of poly(phenylenevinylene), poly(phenylene) and poly(fluorene) deriva-
tives. This stimulated the idea of using conjugated polymers as gain medium in or-
ganic lasers since these would offer many advantages, such as low-cost lasers, easy
processability of materials and wide tuning range of the emission wavelength. It is
worth mentioning that optically pumped solid state dye lasers had been realized long
before in the form of dye molecules doped into different matrices [WU71] [HPS71]
151

6.1. Introduction - Theoretical background
[KS71] [RBE+89] or as organic crystals [Kar72] [ABB+73]. However, these two classes
of organic gain media have severe drawbacks, since dye doped matrices have poor
charge transport properties and organic crystals are very fragile. Hence, conjugated
polymers could overcome these problems due to their high photoluminescence quan-
tum yields, charge transport properties and inherent mechanical properties. Up to
now gain narrowing and lasing in conjugated polymers has been reported for many
different polymer structures and device architectures, such as microcavities [TDF96],
slab waveguides [HDGS+96] [FOG+96], distributed Bragg reflectors (DBR) [BDSB97]
and distributed feedback (DFB) structures [KS71] [MDGH+98] [KHH+98] [RMD+99]
[RLF+00]. But so far only optically pumped polymer lasers have been demonstrated,
the aim of an electrically driven polymer injection laser has not been achieved yet and
it is an open question whether it will ever be possible to have a polymer injection laser.
6.1.2 Stimulated emission in organic materials
The fundamental process of lasing is stimulated emission (SE). In a two-level system
stimulated emission occurs if an incoming photon of the same wavelength interacts with
a molecule in the excited state and stimulates it to relax radiatively. To achieve a sig-
nificant contribution from stimulated rather than spontaneous emission from molecules
that are in a radiation field of photons, the Boltzmann equilibrium has to be disturbed
in such a way that the population of the upper state exceeds the population of the
lower state (i.e. population inversion). This is not a trivial issue since all molecules are
in their electronic ground state at room temperature and strong optical pumping is re-
quired to achieve population inversion of the two states. However, population inversion
can be achieved much easier in a four level system, if the two levels that contribute to
the stimulated emission are not directly involved in the pumping process. This is the
case for organic laser dyes and conjugated polymers where vibronic sublevels create a
four-level system of stimulated emission [SWG+98] [WSH+99] [SRLM01]. Figure 6.1
shows a typical four-level system of organic molecules. In the present case of a four
level system absorption occurs from the ground state S0(ν = 0) to the S1 state into
the vibrational ground level or into higher vibrational sublevels. A fast vibrational
relaxation occurs into the S1(ν = 0) level from which a radiative transition (sponta-
neous or stimulated) occurs into the S0(ν = 1) level. Successively the S0(ν = 1) level
is depopulated by vibrational relaxation to the vibrational ground state of S0. Hence,
the two levels which contribute to SE are not directly involved in the pump process.
Furthermore, the vibrational relaxations are faster than the radiative lifetime of the
excited molecule which leads to an immediate population inversion between S1(ν = 0)
and S0(ν = 1), a prerequisite for amplification of light.
A photon that is emitted can now stimulate the emission of a photon from another
152

Chapter 6: Amplified spontaneous emission in polymer waveguides
S1
S0
E
r
hn
1
23
0
0
1
23
Figure 6.1: Coordination coordinate diagram of the vibronic levels that contribute to thefour-level system for stimulated emission in organic molecules. Solid lines indicate transitionsthat absorb or emit a photon, dashed lines indicate vibrational relaxations. The transitionfrom S1(ν = 0) to S0(ν = 1) (red) denotes the process that leads to stimulated emission(SE).
molecule that is in its excited state. This process can continue which leads to a cascade
of emission processes as depicted in Figure 6.2. If the majority of photons stimulates
other molecules to emit before the photons can leave the medium, amplification of light
occurs. Therefore, a key parameter is the wavelength dependent effective stimulated
emission cross-section σSE of the excited states which is given by [SRLM01]
σSE(λ) =λ4f(λ)
8πn2c0τ(6.1)
where f(λ) is the normalized spectral distribution of the photoluminescence, n is the
refractive index of the medium, c0 is the vacuum speed of light and τ is the radiative
lifetime of the involved optical transition. In the absence of other competing processes
stimulated emission leads to amplification of light. At small intensities the output
intensity can be described by
Iout = Iin × exp(σSE ×Nexc × L) (6.2)
with Iin and Iout the intensities of the incoming and outcoming beam, Nexc the volume
density of excited states and L the length of the light path in the sample. The laser
potential of a medium is furthermore characterized by the wavelength dependent gain
coefficient gnet = σSENexc. Gain narrowing occurs when the condition g(λ)× L ≥ 1 is
fulfilled for light that propagates inside the sample. The exponential term in equation
153

6.1. Introduction - Theoretical background
6.2 leads to a preferential amplification of light at the wavelength of maximum gain.
Highest net gain is typically found at the position of the 0-1 singlet transition due
to the above mentioned reasons. Furthermore, the linewidth of the amplified emis-
sion decreases with increasing Nexc. In real world systems loss channels exist which
reduce the gain coefficient leading to an effective gain coefficient of geff = gnet − gloss
[KL99]. The gain losses stem from linear absorption in the gain region, excited state
absorption (originating from excited singlet states), population of the triplet state or
light scattering within the gain medium. The latter relates to the optical film quality.
In conjugated polymers also geminate pairs (GP) have to be considered which give
rise to strong photoinduced absorption bands [SRLM01]. Photoinduced absorption is
supposed to be one of the major loss channels for stimulated emission in conjugated
polymers sometimes leading to only weak and very short-lived SE. PIA can be studied
by pump-prope experiments. Furthermore the degree of photooxidation plays an im-
portant role in the amount of stimulated emission that a conjugated polymer exhibits
since oxidative defects act as strong excited state quenchers [DTHF97] thus leading
to a significant reduction of the volume density of excited states or the generation of
charged absorbing species [YRP+94] even if defects are present in small concentrations
only. In conclusion a conjugated polymer has to fulfill the following conditions to show
stimulated emission:
1. high photoluminescence quantum yield, high oscillator strength
and a high chromophore density.
2. no spectral overlap between photoinduced absorptions and
stimulated emission.
3. excellent oxidative stability and defect free polymer structure to
suppress quenching effects.
The first point is fulfilled by many conjugated polymers. They have high PL quantum
yields and considerably high oscillator strength due to their fully allowed π → π∗ tran-
sitions. Regarding the overlap of PIA and SE not many structures seem to fulfill this
condition. The first materials reported to show SE were PPV derivatives [HDGS+96]
[HSDGH96] but the inherent oxidative instability of PPVs limits their applicability
and causes high pump intensity threshold values for SE. Especially the ladder-type
PPP derivative MeLPPP was found to exhibit high net gain for amplification of light
and low threshold pump intensities for stimulated emission [ZGT+97] [ZKG+99]. Fur-
thermore, the group of Bradley (Imperial College London) reported on a series of very
stable polyfluorene derivatives with very low threshold values for ASE covering the
whole wavelength region of visible light [HBTS02] [XHB03] [XHHB03] [XHSB05].
In order to observe amplification of light in a gain medium the emitted photons have
154
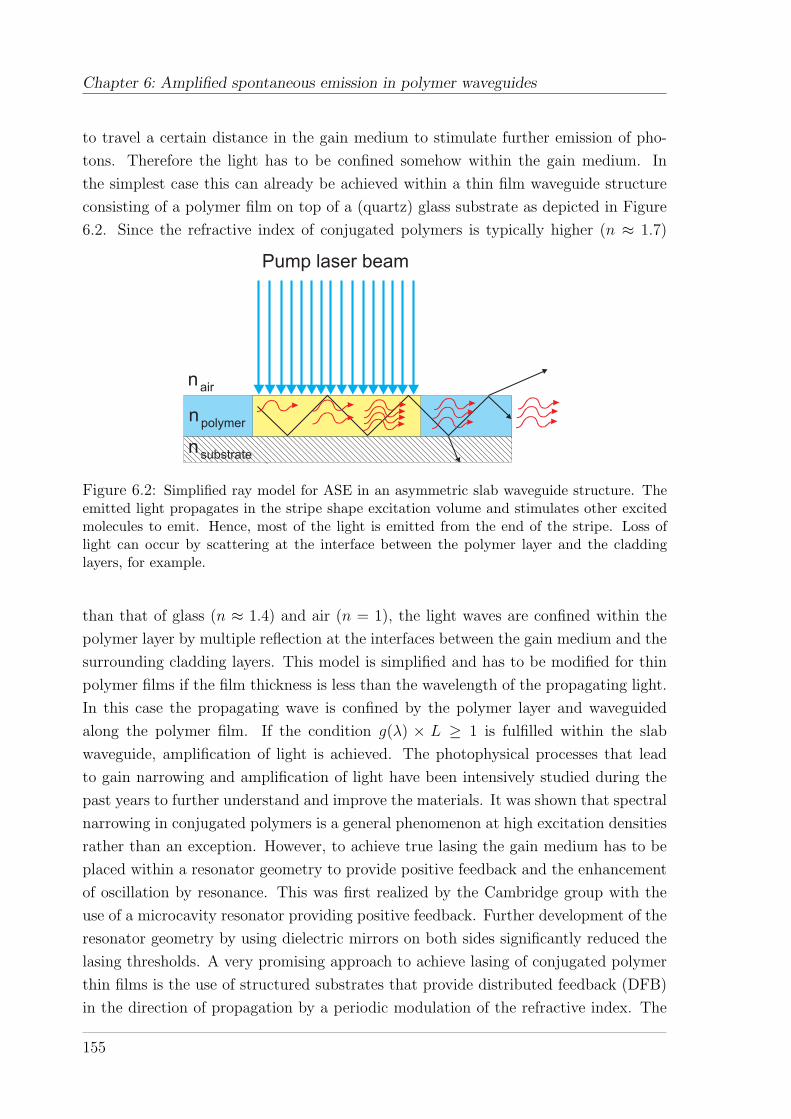
Chapter 6: Amplified spontaneous emission in polymer waveguides
to travel a certain distance in the gain medium to stimulate further emission of pho-
tons. Therefore the light has to be confined somehow within the gain medium. In
the simplest case this can already be achieved within a thin film waveguide structure
consisting of a polymer film on top of a (quartz) glass substrate as depicted in Figure
6.2. Since the refractive index of conjugated polymers is typically higher (n ≈ 1.7)
n substrate
npolymer
nair
Pump laser beam
Figure 6.2: Simplified ray model for ASE in an asymmetric slab waveguide structure. Theemitted light propagates in the stripe shape excitation volume and stimulates other excitedmolecules to emit. Hence, most of the light is emitted from the end of the stripe. Loss oflight can occur by scattering at the interface between the polymer layer and the claddinglayers, for example.
than that of glass (n ≈ 1.4) and air (n = 1), the light waves are confined within the
polymer layer by multiple reflection at the interfaces between the gain medium and the
surrounding cladding layers. This model is simplified and has to be modified for thin
polymer films if the film thickness is less than the wavelength of the propagating light.
In this case the propagating wave is confined by the polymer layer and waveguided
along the polymer film. If the condition g(λ) × L ≥ 1 is fulfilled within the slab
waveguide, amplification of light is achieved. The photophysical processes that lead
to gain narrowing and amplification of light have been intensively studied during the
past years to further understand and improve the materials. It was shown that spectral
narrowing in conjugated polymers is a general phenomenon at high excitation densities
rather than an exception. However, to achieve true lasing the gain medium has to be
placed within a resonator geometry to provide positive feedback and the enhancement
of oscillation by resonance. This was first realized by the Cambridge group with the
use of a microcavity resonator providing positive feedback. Further development of the
resonator geometry by using dielectric mirrors on both sides significantly reduced the
lasing thresholds. A very promising approach to achieve lasing of conjugated polymer
thin films is the use of structured substrates that provide distributed feedback (DFB)
in the direction of propagation by a periodic modulation of the refractive index. The
155
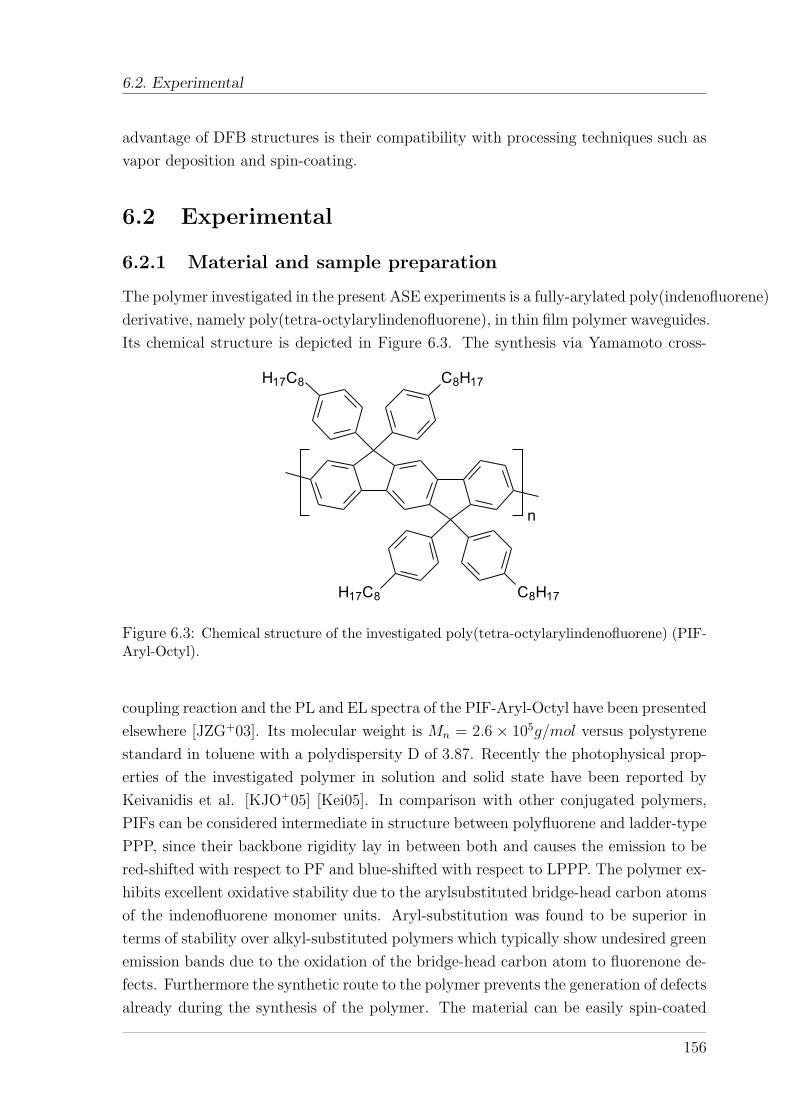
6.2. Experimental
advantage of DFB structures is their compatibility with processing techniques such as
vapor deposition and spin-coating.
6.2 Experimental
6.2.1 Material and sample preparation
The polymer investigated in the present ASE experiments is a fully-arylated poly(indenofluorene)
derivative, namely poly(tetra-octylarylindenofluorene), in thin film polymer waveguides.
Its chemical structure is depicted in Figure 6.3. The synthesis via Yamamoto cross-
C8H17H17C8
C8H17H17C8
n
Figure 6.3: Chemical structure of the investigated poly(tetra-octylarylindenofluorene) (PIF-Aryl-Octyl).
coupling reaction and the PL and EL spectra of the PIF-Aryl-Octyl have been presented
elsewhere [JZG+03]. Its molecular weight is Mn = 2.6 × 10⁵g/mol versus polystyrene
standard in toluene with a polydispersity D of 3.87. Recently the photophysical prop-
erties of the investigated polymer in solution and solid state have been reported by
Keivanidis et al. [KJO+05] [Kei05]. In comparison with other conjugated polymers,
PIFs can be considered intermediate in structure between polyfluorene and ladder-type
PPP, since their backbone rigidity lay in between both and causes the emission to be
red-shifted with respect to PF and blue-shifted with respect to LPPP. The polymer ex-
hibits excellent oxidative stability due to the arylsubstituted bridge-head carbon atoms
of the indenofluorene monomer units. Aryl-substitution was found to be superior in
terms of stability over alkyl-substituted polymers which typically show undesired green
emission bands due to the oxidation of the bridge-head carbon atom to fluorenone de-
fects. Furthermore the synthetic route to the polymer prevents the generation of defects
already during the synthesis of the polymer. The material can be easily spin-coated
156

Chapter 6: Amplified spontaneous emission in polymer waveguides
from toluene solution. Thin polymer films of thickness 70 - 160 nm were prepared by
spin-coating (900 - 5000 rpm) from filtered (1µm pore size) 10 mg/ml toluene solution
onto carefully cleaned quartz substrates. The thickness of the polymer films was mea-
sured with a Dektak surface profiler. The absorption and PL emission spectra were
found to match the previously reported data with a maximum absorption in the solid
state at 3.0 eV (410 nm) and a well-resolved fluorescence with a 0-0 transition at 2.84
eV (437 nm) and a 0-1 transition at 2.66 eV (466 nm) [JZG+03] [Kei05] [KJO+05].
The refractive index of the aryl-substituted PIF was determined by variable-angle el-
lipsometry to n = 1.78 at a wavelength of 469 nm. Hence, the thin polymer film forms
an asymmetric planar waveguide structure with the cladding layers being the quartz
substrate (n = 1.46) and air (n = 1).
6.2.2 Experimental setup and techniques
The determination of the typical ASE parameters of a gain medium, for instance a
conjugated polymer, which are the gain coefficient g, the loss coefficient α and the ASE
threshold pump intensity requires an experimental setup that is fundamentally different
from ”normal” time-resolved photoluminescence spectroscopy setups. Whereas for PL
spectroscopy typically a round shape excitation area is used and the emitted light is
detected perpendicular to the sample surface, ASE experiments need a stripe-shape
excitation region and detect the edge-emitted light from the stripe-shape excitation
area to determine the gain and loss coefficient of the material. This is a consequence
of the ASE mechanism itself where amplification occurs in the excited area only and
waveguiding leads to emission of most of the light from the end of the photopumped
sample region. Moreover, the pump intensity distribution within the stripe should
be homogeneous, i.e. a flat-top intensity profile is desired so that results are not
affected by intensity distributions within the excitation area. Employing a stripe shape
excitation area the gain coefficient of the material can be determined by gradually
increasing the length of the pump stripe while keeping one end of the stripe at the
sample edge, whereas the loss coefficient can be determined by gradually increasing the
non-pumped region between the stripe and the sample edge monitoring the intensity
of the edge-emitted light. This will be discussed in more detail in the section of
results and discussion. The typical ASE setup described in literature consists of a
cylindrical lens to create a narrow stripe shape beam and mechanical apertures to
control the dimensions of the beam [MDGH+98] [ZGT+97]. However, this method has
some drawbacks. The intensity profile cannot be perfectly flat-top since a beam having
a Gaussian profile is focussed into a stripe shape beam, hence the intensity profile has
to deviate from the flat-top structure especially at the borders of the excitation stripe.
Secondly, inhomogeneities within the pump beam are rather focussed than equalized,
157
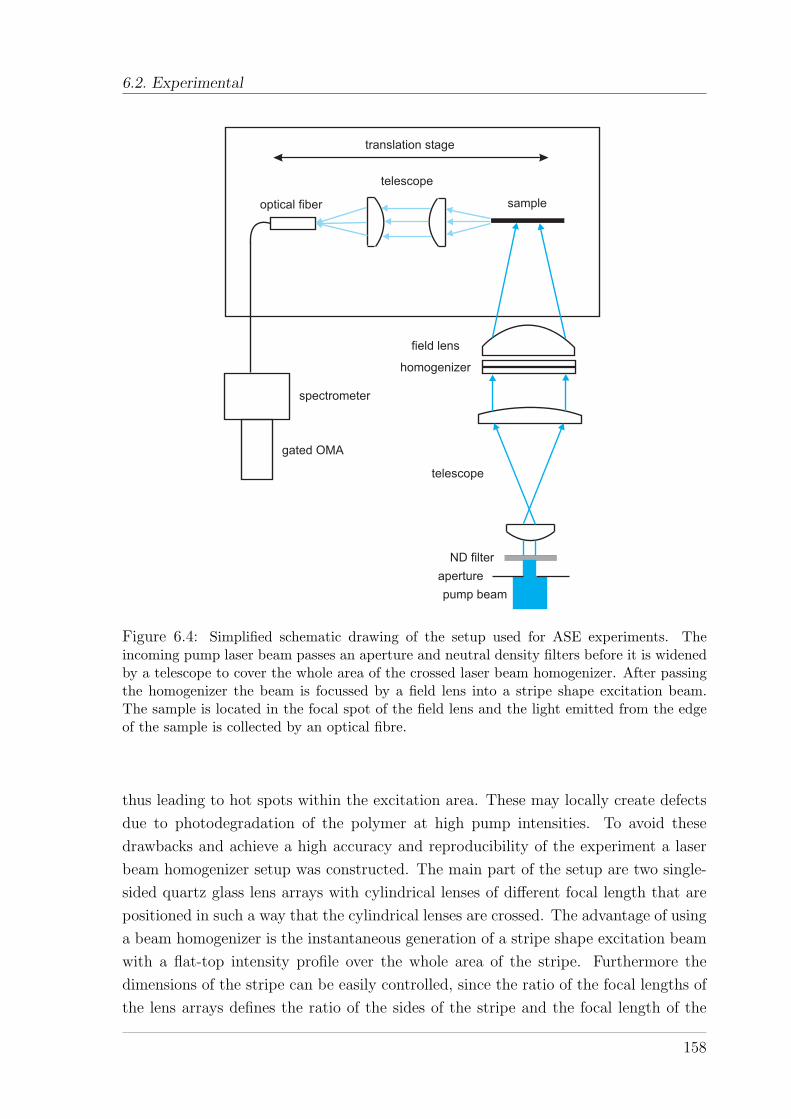
6.2. Experimental
spectrometer
homogenizer
field lens
telescope
ND filter
aperture
telescope
sampleoptical fiber
pump beam
gated OMA
translation stage
Figure 6.4: Simplified schematic drawing of the setup used for ASE experiments. Theincoming pump laser beam passes an aperture and neutral density filters before it is widenedby a telescope to cover the whole area of the crossed laser beam homogenizer. After passingthe homogenizer the beam is focussed by a field lens into a stripe shape excitation beam.The sample is located in the focal spot of the field lens and the light emitted from the edgeof the sample is collected by an optical fibre.
thus leading to hot spots within the excitation area. These may locally create defects
due to photodegradation of the polymer at high pump intensities. To avoid these
drawbacks and achieve a high accuracy and reproducibility of the experiment a laser
beam homogenizer setup was constructed. The main part of the setup are two single-
sided quartz glass lens arrays with cylindrical lenses of different focal length that are
positioned in such a way that the cylindrical lenses are crossed. The advantage of using
a beam homogenizer is the instantaneous generation of a stripe shape excitation beam
with a flat-top intensity profile over the whole area of the stripe. Furthermore the
dimensions of the stripe can be easily controlled, since the ratio of the focal lengths of
the lens arrays defines the ratio of the sides of the stripe and the focal length of the
158

Chapter 6: Amplified spontaneous emission in polymer waveguides
field lens defines its total area. Hence, the experiments necessary to obtain the gain
coefficient and loss coefficient can be easily performed.
For measuring the gain, the stripe shape excitation profile can be cut with a razor
blade as a mechanical shutter to change the length of the stripe. The edge-distance
dependence of ASE can be easily accessed by moving the sample on a translation stage,
while detecting the edge-emitted light via an optical fibre. A schematic drawing of the
setup is presented in Figure 6.4.
Excitation of the samples was performed by short laser pulses at 3.0 eV (410 nm, 8
ns, 10 Hz) obtained from an optical parametric oscillator (OPO, GWU Lasertechnik)
pumped by the third harmonic of a frequency-tripled Nd:YAG laser system (Spectra
Physics, Quanta Ray INDI). The raw OPO beam (Gaussian intensity profile) was
widened by a telescope to illuminate the whole area (35× 35mm2) of the homogenizer
consisting of two crossed lens arrays (LIMO Lissotschenko Mikrooptik, single-sided
standard homogenizer 9002.29-1 and 9002.32-1) with cylindrical lenses having a ratio
of their focal lengths 1 to 8. A plano-convex field lens (focal length f = 60 mm)
collected the laser light which passed through the homogenizer and focussed it into a
stripe shape excitation beam. The dimensions of the excitation beam were determined
(a) Raw OPO beam before homogenizer. (b) Homogenized flat-top intensity pro-file.
Figure 6.5: 3D image of the raw OPO pump laser beam (a) before passing the homogenizerand flat-top stripe-shape excitation beam in the focus of the collecting lens (b) after passingthe homogenizer at the position of the sample.
with a beam profiler (Newport LBP-2) to be 8× 1mm2 with an almost perfectly flat-
top intensity profile. Figure 6.5 shows the laser beam profile after the first aperture
but before passing the telescope and homogenizer and the stripe shape excitation area
after passing the homogenizer in the focus of the field lens. The energy per area of the
laser pulse was controlled by a set of calibrated neutral density filters. One end of the
159

6.2. Experimental
excitation stripe was positioned at the sample edge. The edge-emitted light from the
end of the stripe was focussed onto an optical fiber coupled to a grating spectrometer
with a resolution of 0.5 nm. Finally the light was detected using a time-gated optical-
multichannel analyzer (OMA III, EG&G) triggered by the electrical laser pulse. For
the detection of ASE a gate window of 100 ns was chosen. To increase the signal to
noise ratio the spectra were accumulated over 100 measurements.
160

Chapter 6: Amplified spontaneous emission in polymer waveguides
6.3 Results and discussion
Figure 6.6 shows the emission spectra of a polyindenofluorene thin film (d ∼ 146nm)
detected from the sample edge at three different pump energy densities. At the low-
est pump energy density shown here (3.6µJ/cm2 corresponding to 450W/cm2) the
emission resembles the typical vibronic splitting of a fluorescence spectrum. Upon fur-
1.5 2.0 2.5 3.0 3.50.0
0.2
0.4
0.6
0.8
1.0
1.2800 700 600 500 400
3.6 µJ/cm2
9.1 µJ/cm2
28.8 µJ/cm2
Wavelength (nm)
Laser
ASE
PL E
mis
sion
Inte
nsity
(nor
mal
ized
)
Energy (eV)
(a) Intensity dependent PL spectra.
2.50 2.55 2.60 2.65 2.70 2.75 2.800.0
2.0x10⁵
4.0x10⁵
6.0x10⁵
8.0x10⁵
1.0x10⁶
1.2x10⁶
1.4x10⁶
1.6x106490 480 470 460 450
Pump energy density
PL E
mis
sion
Inte
nsity
(a.u
.)
Energy (eV)
Wavelength (nm)
(b) Intensity dependent shift of ASE peak.
Figure 6.6: Figure (a): Edge detected PL-spectra from a poly(tetraarylindenofluorene) thinfilm (d ∼ 146nm) upon pumping the sample with a stripe shape beam of 8 × 1mm2 at 3.0eV (410 nm). Spectra are normalized to the 0-1 vibronic. The pump energy densities aredepicted in the legend. The sharp peak at 3.02 eV (410 nm) corresponds to reflection ofthe pump laser beam. Figure (b): Blueshift of the ASE peak with increasing pump energydensity.
ther increasing the pump energy density, the 0-1 vibronic band becomes much more
pronounced compared to the other vibronics. Furthermore the fluorescence spectrum
collapses into one single peak at 469 nm (2.64 eV) with a full width at half maximum
of 4 nm. A gradual blue-shift of the ASE peak maximum with increasing pump energy
could be observed (see Figure 6.6 (b)) indicating that the ASE process occurs on a
time scale faster than the spectral relaxation of the excited states. The reason for the
observed gain narrowing is waveguiding along the stripe shape excitation region leading
to amplification of light at the spectral position of the highest gain with most of the
light being emitted from the ends of the stripe. The coincidence of the ASE peak with
the 0-1 transition of the fluorescence has frequently been observed in such experiments
and can be explained by a quasi-four level vibronic system with the highest net gain and
lowest threshold value at the position of the 0-1 vibronic as explained in the theoretical
part and in ref. [WSH+99] [SWG+98]. Figure 6.7 depicts the intensity dependence of
161
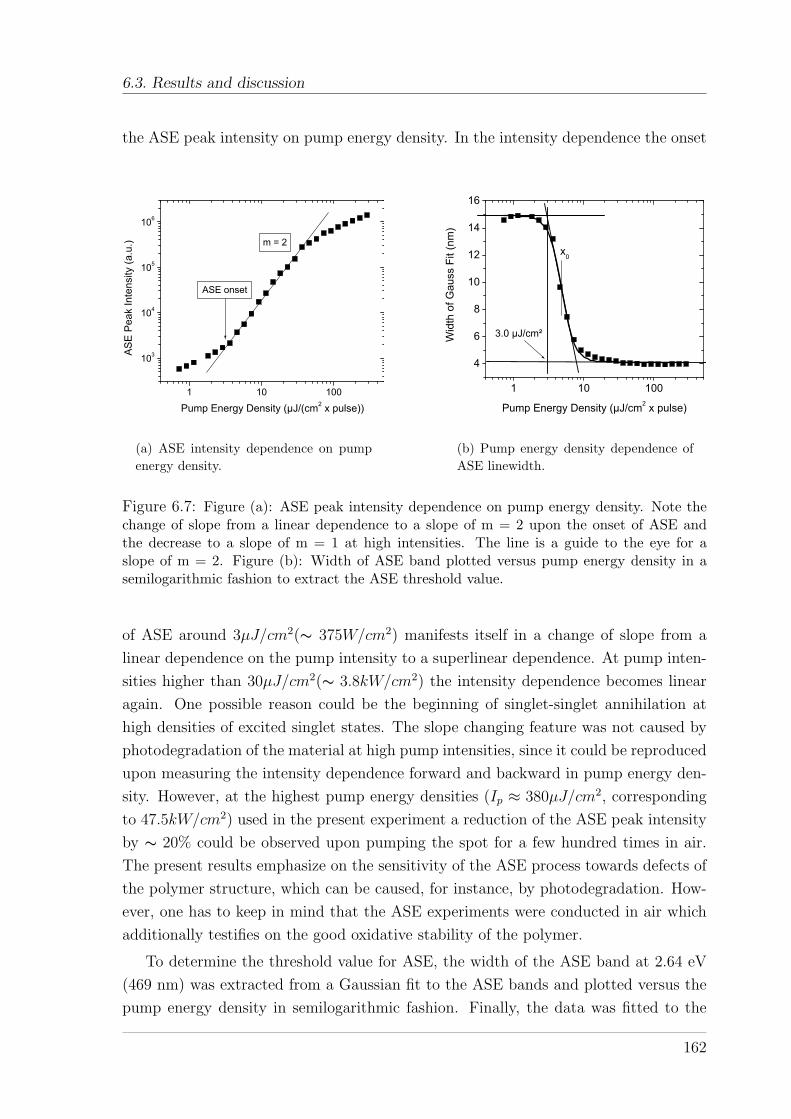
6.3. Results and discussion
the ASE peak intensity on pump energy density. In the intensity dependence the onset
1 10 100
103
104
105
106
ASE onset
m = 2
ASE
Peak
Inte
nsity
(a.u
.)
Pump Energy Density (µJ/(cm2 x pulse))
(a) ASE intensity dependence on pumpenergy density.
1 10 100
4
6
8
10
12
14
16
3.0 µJ/cm²
x0
Wid
th o
f Gau
ss F
it (n
m)
Pump Energy Density (µJ/cm2 x pulse)
(b) Pump energy density dependence ofASE linewidth.
Figure 6.7: Figure (a): ASE peak intensity dependence on pump energy density. Note thechange of slope from a linear dependence to a slope of m = 2 upon the onset of ASE andthe decrease to a slope of m = 1 at high intensities. The line is a guide to the eye for aslope of m = 2. Figure (b): Width of ASE band plotted versus pump energy density in asemilogarithmic fashion to extract the ASE threshold value.
of ASE around 3µJ/cm2(∼ 375W/cm2) manifests itself in a change of slope from a
linear dependence on the pump intensity to a superlinear dependence. At pump inten-
sities higher than 30µJ/cm2(∼ 3.8kW/cm2) the intensity dependence becomes linear
again. One possible reason could be the beginning of singlet-singlet annihilation at
high densities of excited singlet states. The slope changing feature was not caused by
photodegradation of the material at high pump intensities, since it could be reproduced
upon measuring the intensity dependence forward and backward in pump energy den-
sity. However, at the highest pump energy densities (Ip ≈ 380µJ/cm2, corresponding
to 47.5kW/cm2) used in the present experiment a reduction of the ASE peak intensity
by ∼ 20% could be observed upon pumping the spot for a few hundred times in air.
The present results emphasize on the sensitivity of the ASE process towards defects of
the polymer structure, which can be caused, for instance, by photodegradation. How-
ever, one has to keep in mind that the ASE experiments were conducted in air which
additionally testifies on the good oxidative stability of the polymer.
To determine the threshold value for ASE, the width of the ASE band at 2.64 eV
(469 nm) was extracted from a Gaussian fit to the ASE bands and plotted versus the
pump energy density in semilogarithmic fashion. Finally, the data was fitted to the
162
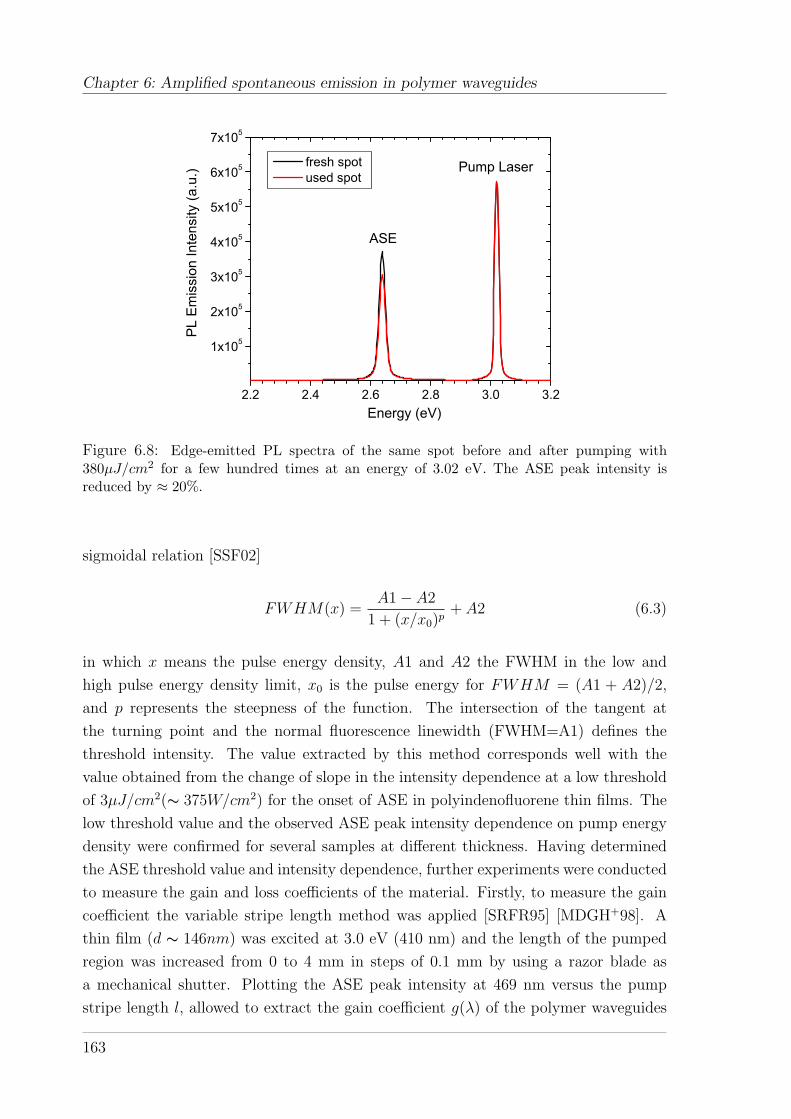
Chapter 6: Amplified spontaneous emission in polymer waveguides
2.2 2.4 2.6 2.8 3.0 3.2
1x10⁵
2x10⁵
3x10⁵
4x10⁵
5x10⁵
6x10⁵
7x10⁵
Pump Laser
ASE
PL E
mis
sion
Inte
nsity
(a.u
.)
Energy (eV)
fresh spot used spot
Figure 6.8: Edge-emitted PL spectra of the same spot before and after pumping with380µJ/cm2 for a few hundred times at an energy of 3.02 eV. The ASE peak intensity isreduced by ≈ 20%.
sigmoidal relation [SSF02]
FWHM(x) =A1− A2
1 + (x/x0)p+ A2 (6.3)
in which x means the pulse energy density, A1 and A2 the FWHM in the low and
high pulse energy density limit, x0 is the pulse energy for FWHM = (A1 + A2)/2,
and p represents the steepness of the function. The intersection of the tangent at
the turning point and the normal fluorescence linewidth (FWHM=A1) defines the
threshold intensity. The value extracted by this method corresponds well with the
value obtained from the change of slope in the intensity dependence at a low threshold
of 3µJ/cm2(∼ 375W/cm2) for the onset of ASE in polyindenofluorene thin films. The
low threshold value and the observed ASE peak intensity dependence on pump energy
density were confirmed for several samples at different thickness. Having determined
the ASE threshold value and intensity dependence, further experiments were conducted
to measure the gain and loss coefficients of the material. Firstly, to measure the gain
coefficient the variable stripe length method was applied [SRFR95] [MDGH+98]. A
thin film (d ∼ 146nm) was excited at 3.0 eV (410 nm) and the length of the pumped
region was increased from 0 to 4 mm in steps of 0.1 mm by using a razor blade as
a mechanical shutter. Plotting the ASE peak intensity at 469 nm versus the pump
stripe length l, allowed to extract the gain coefficient g(λ) of the polymer waveguides
163

6.3. Results and discussion
according to
I(λ) =A(λ)Ip
g(λ)
(eg(λ)l − 1
)(6.4)
where AIp corresponds to the part of spontaneous emission which is proportional to the
pump energy. Equation 6.4 can be derived from the one-dimensional approximation
dI
dz= AIp + gI (6.5)
where I is the luminescence intensity propagating along the z axis. The term AIp
corresponds to spontaneous emission proportional to the pumping intensity Ip, whereas
the term gI describes stimulated emission with a gain coefficient g. Figure 6.9 shows
an example of a dataset obtained at a pump energy density of 38µJ/cm2. The ASE
0.0 0.1 0.2 0.3 0.4
103
104
105
ASE
Peak
Inte
nsity
(a.u
.)
Excitation Stripe Length (cm)
(a) ASE intensity dependence on stripelength in semilogarithmic representation.
0.00 0.05 0.10 0.15
0
5
10
15
20
25
g = 21 cm-1
ASE
Peak
Inte
nsity
(a.u
.)
Stripe Length (cm)
(b) ASE intensity dependence on stripelength in linear representation.
Figure 6.9: Figure (a): Stripe length dependence of ASE peak intensity at a pump energydensity of 38µJ/cm2. Figure (b): The first exponential subset of data plotted on linear scaleand fitted to equation 6.4
peak intensity tends to deviate from the exponential increase when the stripe becomes
longer than 1.6 mm. This effect can be explained by gain saturation which occurs
at long pump stripe lengths when the light traveling in the waveguide is so strongly
amplified that it depletes a substantial fraction of the excitations leading to a reduction
of the gain coefficient [MDGH+98]. Hence, the effect becomes more pronounced at
higher pump energy densities leading to a gain saturation at even shorter pump stripe
lengths. From the exponential part of the plot a maximum gain coefficient of 21cm−1
was determined by this method which is comparable to gain coefficients obtained for
other conjugated polymers; but lower than the maximum net gain reported for PFO
which exhibited gain coefficients up to 74cm−1 [HBTS02]. The gain coefficient may
164
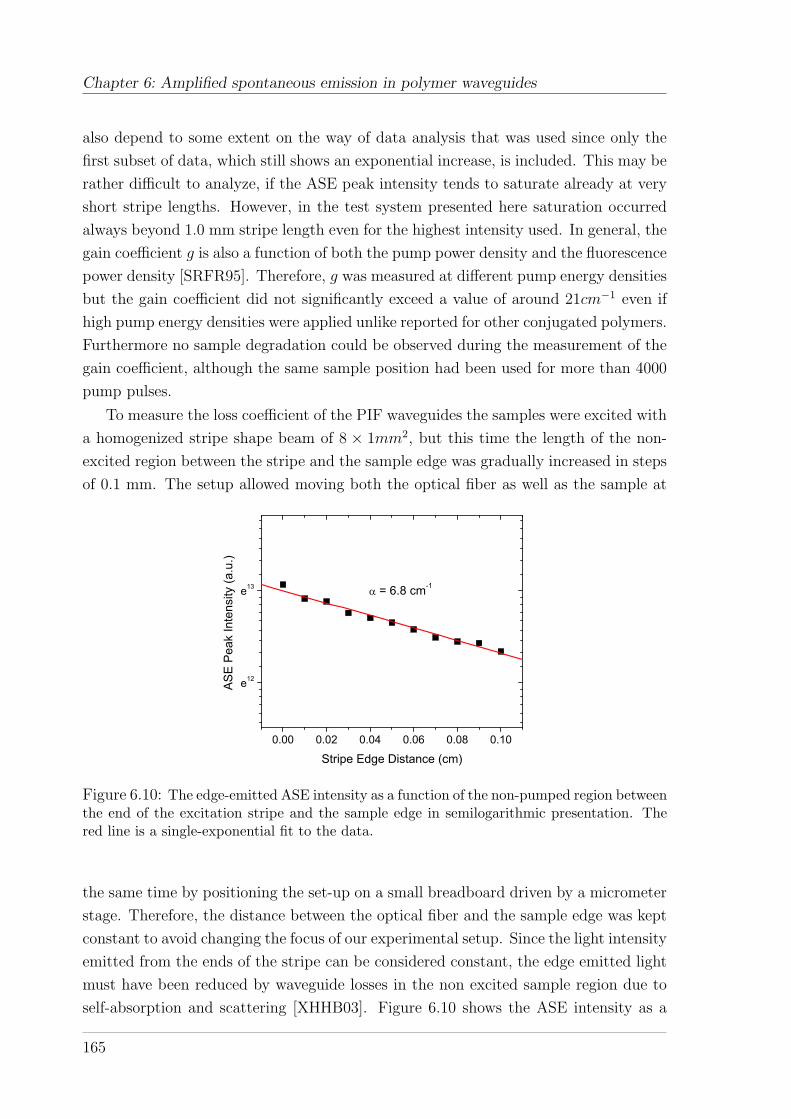
Chapter 6: Amplified spontaneous emission in polymer waveguides
also depend to some extent on the way of data analysis that was used since only the
first subset of data, which still shows an exponential increase, is included. This may be
rather difficult to analyze, if the ASE peak intensity tends to saturate already at very
short stripe lengths. However, in the test system presented here saturation occurred
always beyond 1.0 mm stripe length even for the highest intensity used. In general, the
gain coefficient g is also a function of both the pump power density and the fluorescence
power density [SRFR95]. Therefore, g was measured at different pump energy densities
but the gain coefficient did not significantly exceed a value of around 21cm−1 even if
high pump energy densities were applied unlike reported for other conjugated polymers.
Furthermore no sample degradation could be observed during the measurement of the
gain coefficient, although the same sample position had been used for more than 4000
pump pulses.
To measure the loss coefficient of the PIF waveguides the samples were excited with
a homogenized stripe shape beam of 8 × 1mm2, but this time the length of the non-
excited region between the stripe and the sample edge was gradually increased in steps
of 0.1 mm. The setup allowed moving both the optical fiber as well as the sample at
0.00 0.02 0.04 0.06 0.08 0.10
e12
e13 = 6.8 cm-1
ASE
Peak
Inte
nsity
(a.u
.)
Stripe Edge Distance (cm)
Figure 6.10: The edge-emitted ASE intensity as a function of the non-pumped region betweenthe end of the excitation stripe and the sample edge in semilogarithmic presentation. Thered line is a single-exponential fit to the data.
the same time by positioning the set-up on a small breadboard driven by a micrometer
stage. Therefore, the distance between the optical fiber and the sample edge was kept
constant to avoid changing the focus of our experimental setup. Since the light intensity
emitted from the ends of the stripe can be considered constant, the edge emitted light
must have been reduced by waveguide losses in the non excited sample region due to
self-absorption and scattering [XHHB03]. Figure 6.10 shows the ASE intensity as a
165
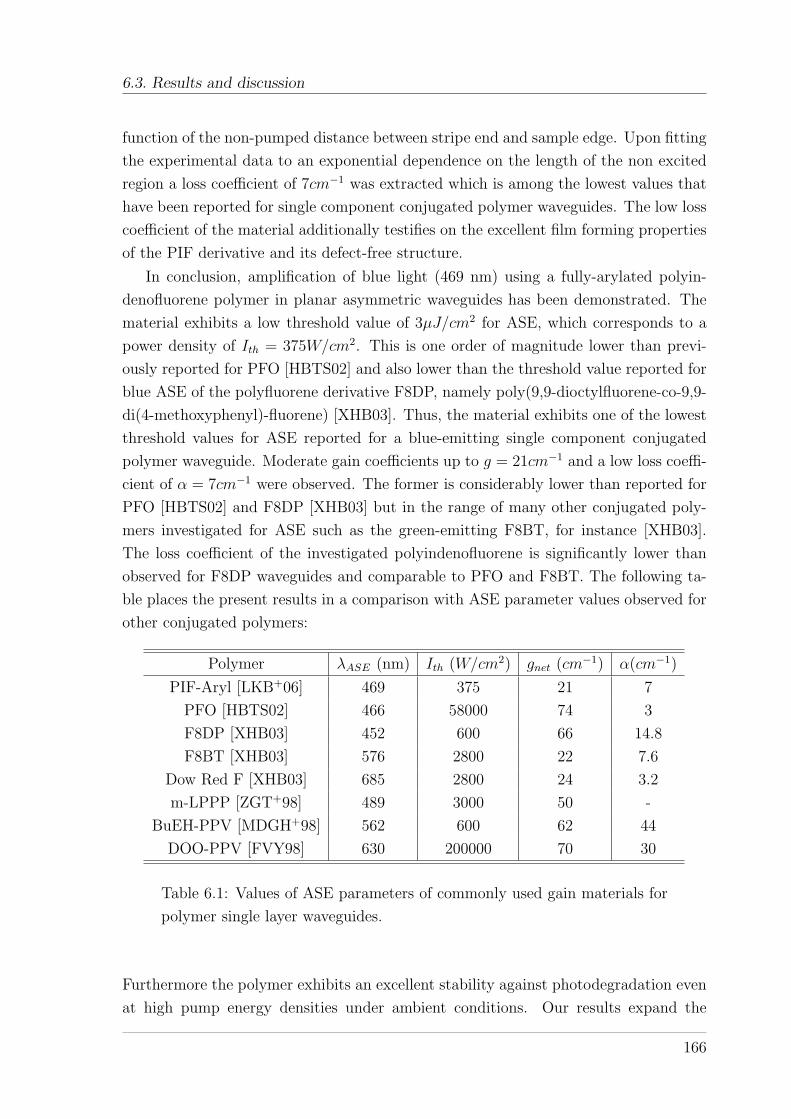
6.3. Results and discussion
function of the non-pumped distance between stripe end and sample edge. Upon fitting
the experimental data to an exponential dependence on the length of the non excited
region a loss coefficient of 7cm−1 was extracted which is among the lowest values that
have been reported for single component conjugated polymer waveguides. The low loss
coefficient of the material additionally testifies on the excellent film forming properties
of the PIF derivative and its defect-free structure.
In conclusion, amplification of blue light (469 nm) using a fully-arylated polyin-
denofluorene polymer in planar asymmetric waveguides has been demonstrated. The
material exhibits a low threshold value of 3µJ/cm2 for ASE, which corresponds to a
power density of Ith = 375W/cm2. This is one order of magnitude lower than previ-
ously reported for PFO [HBTS02] and also lower than the threshold value reported for
blue ASE of the polyfluorene derivative F8DP, namely poly(9,9-dioctylfluorene-co-9,9-
di(4-methoxyphenyl)-fluorene) [XHB03]. Thus, the material exhibits one of the lowest
threshold values for ASE reported for a blue-emitting single component conjugated
polymer waveguide. Moderate gain coefficients up to g = 21cm−1 and a low loss coeffi-
cient of α = 7cm−1 were observed. The former is considerably lower than reported for
PFO [HBTS02] and F8DP [XHB03] but in the range of many other conjugated poly-
mers investigated for ASE such as the green-emitting F8BT, for instance [XHB03].
The loss coefficient of the investigated polyindenofluorene is significantly lower than
observed for F8DP waveguides and comparable to PFO and F8BT. The following ta-
ble places the present results in a comparison with ASE parameter values observed for
other conjugated polymers:
Polymer λASE (nm) Ith (W/cm2) gnet (cm−1) α(cm−1)
PIF-Aryl [LKB+06] 469 375 21 7
PFO [HBTS02] 466 58000 74 3
F8DP [XHB03] 452 600 66 14.8
F8BT [XHB03] 576 2800 22 7.6
Dow Red F [XHB03] 685 2800 24 3.2
m-LPPP [ZGT+98] 489 3000 50 -
BuEH-PPV [MDGH+98] 562 600 62 44
DOO-PPV [FVY98] 630 200000 70 30
Table 6.1: Values of ASE parameters of commonly used gain materials for
polymer single layer waveguides.
Furthermore the polymer exhibits an excellent stability against photodegradation even
at high pump energy densities under ambient conditions. Our results expand the
166

Chapter 6: Amplified spontaneous emission in polymer waveguides
available set of polymers that can be used for light amplification by the class of polyin-
denofluorenes. These may be attractive materials as gain media for organic lasers
and light amplifiers due to their very low threshold values for ASE and their excellent
stability.
167
Chapter 7
Conclusions and Outlook
The research area of conjugated organic materials has witnessed a tremendous increase
in academic and industrial interest over the past decades, the driving force being the
exciting photophysical phenomena ongoing in these materials and the possibility to
use them in optoelectronic devices which would exhibit unique properties. However,
many issues have still to be solved before the age of plastic electronics can begin.
Any product that enters the mass market has to compete with conventional already
established technologies like the liquid crystals in the display market and the silicon-
based technologies like solar cells and computer transistors the biggest problem being
still the limited lifetime of organic materials due to the inherent reactivity in their
excited / charged state. Hence, at the present time conjugated organic materials have
in general demonstrated their potential to be used for full-color display applications
but in particular semiconducting polymers still need a lot of improvement to fulfill
the requirements concerning efficiency and lifetime. These issues can only be solved
by a detailed understanding of their photophysical properties, structure-property and
morphology-property relationships. The very interdisciplinary field of organic electron-
ics needs understanding of both synthetic chemistry as well as solid state physics. Any
approach ignoring the above mentioned statements has to rely on trial-and-error.
The photophysical measurements that were done during the experimental period of
this thesis were aimed towards a deeper understanding of structure-property relation-
ships. Therefore from the broad pool of available materials those were chosen for a
detailed study of their photophysical properties which are related to each other in such
a way that they form a series of copolymers with one main parameter varying. For
instance, for the time-resolved studies materials were selected in which the type of the
comonomer was varied from a triarylamine derivative over carbazole to anthracene to
compare their properties with those of the homopolymer. The same applies to the
materials chosen for the investigation of their charge carrier mobility.
A major aim of the spectroscopical characterization was the investigation of delayed
168

Chapter 7: Conclusions and Outlook
emission from conjugated polymers in solution and solid state which is mostly con-
nected to long-living triplet excited states. The observation of phosphorescence from
triplet states for all investigated spirobifluorene copolymers allowed the determination
of the triplet energy for the spirobifluorene backbone to 2.14 eV in the solid state and
2.2 eV in a frozen glassy matrix. The triplet energies and decay kinetics as well as the
delayed fluorescence decay behavior was found to be similar to the well-investigated
polyfluorene 2/6 which is reasonable since the bulky substituent of the spirobifluorene
monomer unit is in principle not electronically coupled to the backbone. However,
the fluorescence lifetimes of PSBF polymers in solution and solid state were found to
exhibit those of other blue-emitting conjugated polymers which can be attributed to
the low defect concentration and high purity of the investigated polymers.
It was shown that the incorporation of anthracene led to an additional low energy
triplet level at 1.7 eV in the solid state. This has on the one hand severe impact to
blend systems that consist of anthracene-containing matrices doped with triplet emit-
ters since any higher energy triplet emitter will transfer at least a part of its triplets
to the matrix where they decay non-radiatively, thus leading to a decrease of the emis-
sion efficiency of the dopant. Therefore such materials were found to be not suitable
for triplet emitter doped LEDs. On the other hand it was demonstrated that the low
triplet level increases the efficiency of solid state photonenergy upconversion at least by
one order of magnitude in comparison to anthracene-free blue-emitting matrices doped
with metallated porphyrins. A bimolecular annihilation upconversion mechanism was
developed and experimentally verified. Results have been published in [LWI+05]. The
bimolecular annihilation upconversion mechanism opens the possibility for further im-
provements of the upconversion efficiency in the solid state and in solution by chemical
modification of the components.
For the investigation of charge carrier transport in a series of PSBF copolymers a
modified time-of-flight (TOF) technique was used which employs a thin layer of a pery-
lene diimide derivative as charge generation layer (CGL). This method was found to
be superior over the conventional TOF technique which uses bulk generation of charge
carriers. The thin sheet of charges that is created at the interface to the polymer layer
allows for very reproducible measurements on relatively thin polymer films using thick-
nesses in the range of 1− 2µm which are accessible by spin-coating. Therefore results
are better comparable to thin spin-coated layers which are typically used in organic op-
toelectronic devices such as OLEDs. The hole mobility was found to be on the order of
10−6cm2/V s for the spirobifluorene homopolymer which is approximately one order of
magnitude lower than found for polyfluorene 2/6. The reason for the reduced hole mo-
bility is probably the decreased interchain interaction in spiropolymers due to the bulky
substituent which hinders the interchain charge transport. It was found that carbazole
169

or anthracene comonomers do not significantly influence the hole mobility whereas the
incorporated triarylamine derivative greatly reduces the hole mobility by more than
one order of magnitude. The reason lies in the different positions of the HOMO levels
with respect to each other. Whereas carbazole and anthracene have a higher oxidation
potential than the spirobifluorene backbone the triarylamine comonomers have a lower
oxidation potential, thus they act as shallow traps for holes reducing the hole mobility.
The observed temperature- and field-dependence of hole mobility could be very well
analyzed within the framework of the Gaussian disorder model showing the validity of
the model for charge carrier transport in disordered organic solids. Results have been
published in [LWI+06a] and [LWI+06b]. With the present technique using a perylene
diimide derivative as CGL it was not possible to study electron transport since the
PDI derivative is an electron acceptor with respect to the PSBF polymers, hence a
huge energy barrier hinders electron injection from the dye into the polymer. Intrinsic
charge carrier generation showed very fast decaying electron transients. The question
of electron mobility in the investigated compounds thus remains open. It is not possible
to decide whether electrons are trapped in the polymers resulting in a highly disper-
sive electron transport or the transport of electrons is just too fast to be detected with
the present setup. Recent studies of ambipolar charge transport in organic field effect
transistors have addressed this question and results imply that electron transport in
conjugated polymers can be at least as fast as hole transport if not exceeding the hole
mobility.
The spectroscopical experiments were extended to the characterization of ampli-
fied spontaneous emission (ASE) in thin film polymer waveguides. Therefore a new
spectroscopical setup had to be developed which takes into account the special re-
quirements that have to be fulfilled to study ASE in slab waveguide structures. The
investigated fully-arylated poly(indenofluorene) showed very low-threshold values for
blue ASE in combination with an excellent oxidative stability of the polymer. Exper-
imentally the gain and loss coefficient of the material were determined. The results
have been reported in [LKB+06]. However, the present experiments do not allow yet to
fully understand why some polymers exhibit low threshold values for ASE and others
do need high pump energy densities to reach the threshold value for ASE, if it occurs
at all. This question can only be addressed by future experiments which could start
from the investigated PIF-Octyl-Aryl derivative and vary the backbone and substituent
structure. Furthermore additional spectroscopic techniques such as pump-probe spec-
troscopy to compare excited state absorption of different polymer structures could help
to further understand the photophysical processes that lead to the occurrence of ASE
in polymer waveguides. This is especially interesting since the development of electri-
cally driven organic lasers using semiconducting polymers is still an open issue which
170

Chapter 7: Conclusions and Outlook
desires very detailed knowledge of all the photophysical processes that contribute to
organic lasing.
171

Bibliography
[AB04] V.I. Arkhipov and H. Bassler, Phys. Status Solidi A 201 (2004), 1152–1187.
[ABB+73] A.S. Avanesyan, V.A. Benderskii, V.K. Brinkenstein, V.L. Broude, andA.G. Lavrushko, Phys. Status Solidi A 19 (1973), K121.
[ABTF01] C. Adachi, M.A. Baldo, M.E. Thompson, and S.R. Forrest, J. Appl.Phys. 90 (2001), no. 10, 5048.
[ACF+93] D. Adam, F. Closs, T. Frey, D. Funhoff, D. Haarer, H. Ringsdorf,P. Schuhmacher, and K. Siemensmeyer, Phys. Rev. Lett. 70 (1993),457.
[AP86] M. Abkowitz and D.M. Pai, Philos. Mag. B 53 (1986), 193.
[ASS+94] D. Adam, P. Schuhmacher, J. Simmerer, L. Haussling, K. Siemensmeyer,K.H. Etzbach, H. Ringsdorf, and D. Haarer, Nature (London) 371(1994), 141.
[B93] H. Bassler, Phys. Status Solidi B 175 (1993), 15–56.
[B97] , Primary photoexcitations in conjugated polymers: Molecularexciton versus semiconductor band model, World Scientific, Singapore,1997.
[BB93] H. Bassler and P.M. Borsenberger, Chem. Phys. 177 (1993), 763–771.
[BB03] S.A. Bagnich and H. Bassler, Chem. Phys. Lett. 381 (2003), 464.
[BBB+90] J.H. Burroughes, D.D.C Bradley, A.R. Brown, R.N. Marks, K. Mackay,R.H. Friend, P.L. Burns, and A.B. Holmes, Nature (London) 347 (1990),539.
[BBN05] S.A. Bagnich, H. Bassler, and D. Neher, J. Lumin. 112 (2005), no. 1-4.
[BBSM98] S. Barth, H. Bassler, U. Scherf, and K. Mullen, Chem. Phys. Lett. 288(1998), 147–154.
[BCH78] P.M. Borsenberger, L.E. Contois, and D.C. Hoesterey, J. Chem. Phys.68 (1978), 637.
172

BIBLIOGRAPHY
[BCS+99] V.N. Bliznuyk, S.A. Carter, J.C. Scott, G. Klarner, R.D. Miller, andD.C. Miller, Macromolecules 32 (1999), 361.
[BDCSG00] U. Bach, K. De Cloedt, H. Spreitzer, and M. Gratzel, Adv. Mater.(Weinheim) 12 (2000), no. 14, 1060.
[BDL96] Z. Bao, A. Dodabalapur, and A.J. Lovinger, Appl. Phys. Lett. 69 (1996),4108.
[BDSB97] M. Berggren, A. Dodabalapur, R.E. Slusher, and Z. Bao, Nature (Lon-don) 389 (1997), 466.
[BIB+04] S.A. Bagnich, C. Im, H. Bassler, D. Neher, and U. Scherf, Chem. Phys.299 (2004), no. 1, 11.
[BJA+05] S. Baluschev, J. Jacob, Y.S. Avlasevich, P.E. Keivanidis, T. Miteva,A. Yasuda, G. Nelles, A.C. Grimsdale, K. Mullen, and G. Wegner,ChemPhysChem 6 (2005), no. 7.
[BKW+05] S. Baluschev, P.E. Keivanidis, G. Wegner, J. Jacob, A.C. Grimsdale,K. Mullen, T. Miteva, A. Yasuda, and G. Nelles, Appl. Phys. Lett. 86(2005), 061904.
[BMC78] P.M. Borsenberger, W. Mey, and A. Chowdry, J. Appl. Phys. 49 (1978),273.
[Bor90] P.M. Borsenberger, J. Appl. Phys. 68 (1990), 6263.
[BOTF99] M.A. Baldo, D.F. O’Brien, M.E. Thompson, and S.R. Forrest, Phys.Rev. B 60 (1999), no. 20, 14422.
[BOY+98] M.A. Baldo, D.F. O’Brien, Y. You, A. Shoustikov, S. Sibley, M.E.Thompson, and S.R. Forrest, Nature (London) 395 (1998), 151.
[BPB91a] P.M. Borsenberger, L. Pautmeier, and H. Bassler, J. Chem. Phys. 95(1991), 1258.
[BPB91b] , J. Chem. Phys. 94 (1991), no. 8, 5447.
[BPB92] , Phys. Rev. B 46 (1992), 12145.
[BRH+01] A.R. Buckley, M.D. Rahn, J. Hill, J. Cabanillas-Gonzalez, A.M. Fox,and D.D.C. Bradley, Chem. Phys. Lett. 339 (2001), 331.
[BSK+00] H. Becker, H. Spreitzer, W. Kreuder, E. Kluge, H. Schenk, I. Parker,and Y. Cao, Adv. Mater. (Weinheim) 12 (2000), no. 1, 42.
[BSK+02] C. Bauer, B. Schnabel, E.-B. Kley, U. Scherf, H. Giessen, and R.F.Mahrt, Adv. Mater. (Weinheim) 14 (2002), 673.
[BTS+03] H. Becker, K. Treacher, H. Spreitzer, A. Falcou, P. Stossel, A. Busing,and P. Parham, World Patent No. PCT WO03/020790, 2003.
173

BIBLIOGRAPHY
[Bub04] Christoph Bubeck, Photophysics of polymers, Max Planck Institute forPolymer Research, Mainz, WS2003/2004.
[Bur92] P.L. Burn, J. Chem. Soc. Perk. T 1 (1992), 3225.
[BW98] P.M. Borsenberger and D.S. Weiss, Organic photoreceptors for xerogra-phy, Marcel Dekker, New York, 1998.
[Car42] C.F. Carlson, US Patent 2 297 691, 1942.
[CBA+00] A.J. Campbell, D.D.C. Bradley, H. Antoniadis, M. Inbasekaran, W.W.Wu, and E.P. Woo, Appl. Phys. Lett. 76 (2000), 1734.
[CBBS86] R.R. Chance, D.S. Boudreaux, J.L. Bredas, and R. Silbey, Handbook ofconducting polymers, p. 825, Dekker: New York, 1986.
[CBF+90] N.F. Colaneri, D.D.C. Bradley, R.F. Friend, P.L. Burn, A.B. Holmes,and C.W. Spangler, Phys. Rev. B 42 (1990), 11670–11681.
[Chi04] Chunyan Chi, Liquid crystalline oligofluorenes and their derivatives:Synthesis, characterization and physical properties, Ph.D. thesis, Jo-hannes Gutenberg Universitat Mainz, 2004.
[CKF+98] N. Chawdhury, A. Kohler, R.F. Friend, M. Younus, P.R. Raithby, andJ. Lewis, Macromolecules 31 (1998), 722–727.
[CKF+99] N. Chawdhury, A. Kohler, R.F. Friend, W.-Y. Wong, J. Lewis,M. Younus, P.R. Raithby, T.C. Corcoran, M.R.A. Al-Mandhary, andM.S. Khan, J. Chem. Phys. 110 (1999), 4963–4970.
[CZC+05] L.-L. Chua, J. Zaumseil, J.-F. Chang, E.C.-W. Ou, P.K.-H. Ho, H. Sir-ringhaus, and R.H. Friend, Nature (London) 434 (2005), 194.
[DB97] M. Deußen and H. Bassler, Organische leuchtdioden, Chemie in UnsererZeit 31 (1997), no. 2, 76–86.
[DG02] A.S. Dhoot and N.C. Greenham, Adv. Mater. (Weinheim) 14 (2002),1834.
[DGB+02] A.S. Dhoot, D.S. Ginger, D. Beljonne, Z. Shuai, and N.C. Greenham,Chem. Phys. Lett. 360 (2002), 195.
[DMB+06] F. Dubin, R. Melet, T. Barisien, R. Grousson, L. Legrand, M. Schott,and V. Voliotis, Nature Physics 2 (2006), 32–35.
[DMSdM+03] F.B. Dias, A.L. Macanita, J. Seixas de Melo, H.D. Burrows, R. Guntner,U. Scherf, and A.P. Monkman, J. Chem. Phys. 118 (2003), no. 15, 7119.
[Dre69] J. Dresner, RCA Rev. 30 (1969), 322.
[DRSF97] V. Dyakonov, G. Rosler, M. Schworer, and E.L. Frankevich, Phys. Rev.B 56 (1997), 3852–3862.
174
BIBLIOGRAPHY
[DTHF97] G.J. Denton, N. Tessler, N.T. Harrison, and R.H. Friend, Phys. Rev.Lett. 78 (1997), 733.
[EJ70] R. Englman and J. Jortner, Mol. Phys. 18 (1970), 145.
[FMSO04] H. Fujikake, T. Murashige, M. Sugibayashi, and K. Ohta, Appl. Phys.Lett. 85 (2004), 3474.
[FNF+02] E. Frankevich, Y. Nishihara, A. Fuiji, M. Ozaki, and K. Yoshino, Phys.Rev. B 66 (2002), 155203.
[FOG+96] S.V. Frolov, M. Ozaki, W. Gellermann, Z.V. Vardeny, and K. Yoshino,Jpn. J. Appl. Phys. 35 (1996), L1371.
[For05] S.R. Forrest, Nature (London) 428 (2005), 911–918.
[FSY93] M. Fukuda, K. Sawada, and K. Yoshino, J. Polym. Sci. Poly. Chem. 31(1993), 2465–2471.
[FVY98] S.V. Frolov, Z.V. Vardeny, and K. Yoshino, Phys. Rev. B 57 (1998),9141.
[GABS98] C. Giebler, H. Antoniadis, D.D.C. Bradley, and Y. Shirota, Appl. Phys.Lett. 72 (1998), 2448.
[Gar93] R.O. Garay, Adv. Mater. (Weinheim) 5 (1993), 561.
[GB02] A. Gerhard and H. Bassler, J. Chem. Phys. 117 (2002), 7350.
[GD89] G. Giro and P.G. DiMarco, Chem. Phys. Lett. 162 (1989), 221.
[GEP+97] W. Graupner, S. Eder, K. Petritsch, G. Leising, and U. Scherf, Synth.Met. 84 (1997), 507–510.
[Gil72] W.D. Gill, J. Appl. Phys. 43 (1972), 5033.
[GKL+99] M. Grell, W. Knoll, D. Lupo, A. Meisel, T. Miteva, D. Neher, H.-G.Nothofer, U. Scherf, and A. Yasuda, Adv. Mater. (Weinheim) 11 (1999),671–675.
[GLUL92] G. Grem, G. Leditzky, B. Ullrich, and G. Leising, Adv. Mater. (Wein-heim) 4 (1992), 36–37.
[GSW+02] F.C. Grozema, L.D.A. Siebbeles, J.M. Warman, S. Seki, S. Tagawa, andU. Scherf, Adv. Mater. (Weinheim) 14 (2002), no. 3, 228.
[HB95] S. Heun and P.M. Borsenberger, Chem. Phys. 200 (1995), 245–255.
[HBGS01] D. Hertel, H. Bassler, R. Guentner, and U. Scherf, J. Chem. Phys. 115(2001), 10007.
[HBSH99] D. Hertel, H. Bassler, U. Scherf, and H.H. Horhold, J. Chem. Phys. 110(1999), no. 18, 9214.
175

BIBLIOGRAPHY
[HBTS02] G. Heliotis, D.D.C. Bradley, G. Turnbull, and I.D.W Samuel, Appl.Phys. Lett. 81 (2002), no. 3, 415.
[HDGS+96] F. Hide, M.A. Diaz-Garcia, B. Schwartz, M.R. Andersson, Q. Pei, andA. Heeger, Science 273 (1996), 1833.
[HdHSW98] R.J.O.M. Hoofman, M.P. de Haas, L.D.A. Siebbeles, and J.M. Warman,Nature (London) 392 (1998), 54.
[Hee97] A.J. Heeger, Primary photoexcitations in conjugated polymers: Molec-ular exciton versus semiconductor band model, World Scientific, Singa-pore, 1997.
[Hee01] , Angew. Chem. Int. Ed. 40 (2001), 2591–2611.
[Heu] S. Heun, unpublished results.
[HKSS88] A.J. Heeger, S. Kivelson, J.R. Schrieffer, and W.P. Su, Rev. Mod. Phys.60 (1988), 781–850.
[HMG+93] S. Heun, R.F. Mahrt, A. Greiner, U. Lemmer, H. Bassler, D.A. Halliday,D.D.C. Bradley, P.L. Burn, and A.B. Holmes, J. Phys.-Condes. Matter5 (1993), 247–260.
[HNK+99] A. Haugeneder, M. Neges, C. Kallinger, W. Spirkl, U. Lemmer, J. Feld-mann, M.C. Amann, and U. Scherf, J. Appl. Phys. 85 (1999), 1124–1130.
[Hoe65] H. Hoegl, J. Phys. Chem. 69 (1965), 755.
[HPS71] T.W. Hansch, M. Pernier, and A.L. Schawlow, IEEE J. Quantum Elect.QE-7 (1971), 45.
[HRS+01] D. Hertel, Yu.V. Romanovskii, B. Schweitzer, U. Scherf, and H. Bassler,Synth. Met. 116 (2001), 139–143.
[HS65] W. Helfrich and W.G. Schneider, Phys. Rev. Lett. 14 (1965), 229.
[HSB98] D. Hertel, U. Scherf, and H. Bassler, Adv. Mater. (Weinheim) 10 (1998),no. 14, 1119.
[HSBR02] D. Hertel, E.V. Soh, H. Bassler, and L.J. Rothberg, Chem. Phys. Lett.361 (2002), 99–105.
[HSDGH96] F. Hide, M.A. Schwartz, M.A. Diaz-Garcia, and A. Heeger, Chem. Phys.Lett. 256 (1996), 424.
[HSN+01] D. Hertel, S. Setayesh, H.G. Nothofer, U. Scherf, K. Mullen, andH. Bassler, Adv. Mater. (Weinheim) 13 (2001), 65–70.
[HSP97] G.R. Hayes, I.D.W. Samuel, and R.T. Philips, Phys. Rev. B 56 (1997),3838–3843.
176

BIBLIOGRAPHY
[HW94] H. Haken and H.-C. Wolf, Molekulphysik und quantenchemie, Springer,Berlin, 1994.
[HWBE95] A. Horvath, G. Weiser, G.L. Baker, and S. Etemad, Phys. Rev. B 51(1995), 2751.
[IB00] C. Im and H. Bassler, J. Chem. Phys. 113 (2000), no. 9, 3802.
[IdHW77] P.P. Infelta, M.P. de Haas, and J.M. Warman, Radiat. Phys. Chem. 10(1977), 353.
[IEB+02] C. Im, E.V. Emelianova, H. Bassler, H. Spreitzer, and H. Becker, J.Chem. Phys. 117 (2002), 2961–2967.
[IHB+05] H. Iino, J. Hanna, R.J. Bushby, B. Movaghar, B.J. Whitaker, and M.J.Cook, Appl. Phys. Lett. 87 (2005), 132102.
[ILS+02] C. Im, J. Lupton, P. Schouwink, S. Heun, H. Becker, and H. Bassler, J.Chem. Phys. 117 (2002), 1395–1402.
[Im02] Chan Im, Optoelektronische eigenschaften von π-konjugierten poly-meren, Ph.D. thesis, Fachbereich Chemie der Philipps-Universitat Mar-burg, 2002.
[ITF+01] A.R. Inigo, C.H. Tan, W. Fann, Y.-S. Huang, G.-Y. Perng, and S.-A.Chen, Adv. Mater. (Weinheim) 13 (2001), no. 7, 504.
[ITH+05] H. Iino, Y. Takayashiki, J. Hanna, R.J. Bushby, and D. Haarer, Appl.Phys. Lett. 87 (2005), no. 192105.
[JSG+05] J. Jacob, S. Sax, M. Gaal, E.J.W. List, A.C. Grimsdale, and K. Mullen,Macromolecules 38 (2005), no. 24, 9933–9938.
[JSP+04] J. Jacob, S. Sax, T. Piok, E.J.W. List, A.C. Grimsdale, and K. Mullen,J. Am. Chem. Soc. 126 (2004), 6987–6995.
[JZG+03] J. Jacob, J. Zhang, A.C. Grimsdale, K. Mullen, M. Gaal, and E.J.W.List, Macromolecules 36 (2003), 8240.
[Kad91] L. Kador, J. Chem. Phys. 95 (1991), no. 8, 5574–5581.
[Kar72] N. Karl, Phys. Status Solidi A 13 (1972), 651.
[Kar80] A.J. Karpfen, J. Phys. C 12 (1980), 5673.
[Kar89] N. Karl, Mol. Cryst. Liquid Cryst. 171 (1989), 157.
[KB00] H.E. Katz and Z. Bao, J. Phys. Chem. B 104 (2000), 671.
[KBM+03] P.E. Keivanidis, S. Baluschev, T. Miteva, G. Nelles, U. Scherf, A. Ya-suda, and G. Wegner, Adv. Mater. (Weinheim) 15 (2003), no. 24, 2095.
177
BIBLIOGRAPHY
[KCAA63] R.G. Kepler, J.C. Caris, P. Avakian, and E. Abramson, Phys. Rev. Lett.10 (1963), 400.
[KCY05] M. Kertesz, C.H. Choi, and S. Yang, Chem. Rev. 105 (2005), no. 10,3448–3481.
[Kei05] P.E. Keivanidis, Energy transfer in π-conjugated polymers, Ph.D. thesis,Johannes Gutenberg Universitat Mainz, 2005.
[Kep60] R.G. Kepler, Phys. Rev. 119 (1960), 1226.
[KGH98] A. Kraft, A.C. Grimsdale, and A.B. Holmes, Angew. Chem. Int. Edit.(Weinheim) 37 (1998), 402.
[KHH+98] C. Kallinger, M. Hilmer, A. Haugeneder, M. Perner, W. Spirkl, andU. Lemmer, Adv. Mater. (Weinheim) 10 (1998), 920.
[KJL+05] J. Kang, J. Jo, S.Y. Lee, P.E. Keivanidis, G. Wegner, and D.Y. Yoon,unpublished (2005).
[KJO+05] P.E. Keivanidis, J. Jacob, L. Oldridge, P. Sonar, B. Carbon-nier, S. Baluschev, A.C. Grimsdale, K. Mullen, and G. Wegner,ChemPhysChem 6 (2005), 1650.
[KKA78] M. Kertesz, J. Koller, and A. Azman, Chem. Phys. 27 (1978), 273.
[KL99] G. Kranzelbinder and G. Leising, Rep. Prog. Phys. 63 (1999), 729–762.
[KLD+94] R. Kersting, U. Lemmer, M. Deussen, H.J. Bakker, R.F. Mahrt, H. Kurz,V.I. Arkhipov, and H. Bassler, Phys. Rev. Lett. 73 (1994), 1440–1443.
[KLM+93] R. Kersting, U. Lemmer, R.F. Mahrt, K. Leo, H. Kurz, H. Bassler, andE.O. Gobel, Phys. Rev. Lett. 70 (1993), 3820–3823.
[Klo82] Walter Kloepffer, Electronic properties of polymers, ch. 5, p. 161, Wiley-Interscience Publication, 1982.
[KPGM02] J. Kruger, R. Plass, M. Gratzel, and H.-J. Matthieu, Appl. Phys. Lett.81 (2002), 367.
[KPW+05] M. Kastler, W. Pisula, D. Wasserfallen, T. Pakula, and K. Mllen, J.Am. Chem. Soc. 127 (2005), 4286.
[KRM04] S. King, C. Rothe, and A. Monkman, J. Chem. Phys. 121 (2004), 10803.
[KS71] H. Kogelnik and C.V. Shank, Appl. Phys. Lett. 18 (1971), 152.
[KSV+01] A. Kadashchuk, Yu. Sbryshevskii, A. Vakhin, N. Ostapenko, V.I.Arkhipov, E.V. Emelianova, and H. Bassler, Phys. Rev. B 63 (2001),115205.
178
BIBLIOGRAPHY
[KVB+04] A. Kadashchuk, A. Vakhin, I. Blonski, D. Beljonne, Z. Shuai, J.L.Bredas, V.I. Arkhipov, P. Heremans, E.V. Emelianova, and H. Bassler,Phys. Rev. Lett. 93 (2004), 066803.
[KWF+02] A. Kohler, J.S. Wilson, R.F. Friend, M.K. Al-Suti, M.S. Khan, A. Ger-hard, and H. Bassler, J. Chem. Phys. 116 (2002), 9457–9463.
[KZ75] N. Karl and J. Ziegler, Chem. Phys. Lett. 32 (1975).
[LCL+00] E.J.W List, C. Creely, G. Leising, N. Schulte, A.D. Schluter, U. Scherf,K. Mullen, and W. Graupner, Chem. Phys. Lett. 325 (2000), 132.
[LCM02] J.M. Lupton, M.R. Craig, and E.W. Meijer, Appl. Phys. Lett. 80 (2002),4489.
[LeB60] O.H. LeBlanc, J. Chem. Phys. 33 (1960), 626.
[LFV00] P.A. Lane, S.V. Frolov, and Z.V. Vardeny, Semiconducting polymers,Wiley-VCH, Weinheim, 2000.
[LGSdFS02] E.J.W. List, R. Guentner, P. Scanducci de Freitas, and U. Scherf, Adv.Mater. (Weinheim) 14 (2002), 374.
[LHT+99] E.J.W. List, L. Holzer, S. Tasch, G. Leising, U. Scherf, K. Mullen,M. Catellani, and S. Luzzati, Solid State Commun. 109 (199), 455.
[LIKB03] F. Laquai, C. Im, A. Kadashchuk, and H. Bassler, Chem. Phys. Lett.375 (2003), 286.
[LKB05] L.J. Lever, R.W. Kelsall, and R.J. Bushby, Phys. Rev. B 72 (2005),035130.
[LKB+06] F. Laquai, P.E. Keivanidis, S. Baluschev, J. Jacob, K. Mullen, andG. Wegner, Appl. Phys. Lett. 87 (2006), 261917.
[LKN+01] E.J.W. List, C.H. Kim, A.K. Naik, U. Scherf, G. Leising, W. Graupner,and J. Shinar, Phys. Rev. B 64 (2001), 155204.
[LM70] M.A. Lampert and P. Mark, Current injection in solids, Academic, NewYork, 1970.
[LWI+05] F. Laquai, G. Wegner, C. Im, A. Busing, and S. Heun, J. Chem. Phys.123 (2005), 074902.
[LWI+06a] F. Laquai, G. Wegner, C. Im, H. Bassler, and S. Heun, J. Appl. Phys.accepted (2006).
[LWI+06b] , J. Appl. Phys. accepted (2006).
[LYT04] S.-H. Lee, T. Yasuda, and T. Tsutsui, J. Appl. Phys. 95 (2004), no. 7,3825.
179
BIBLIOGRAPHY
[MA60] A. Miller and E. Abrahams, Phys. Rev. 120 (1960), 745.
[Mar00] H.C.F. Martens, Phys. Rev. B 61 (2000), no. 11, 7489.
[MAS+02] J.P.J. Markham, T.D. Anthopoulos, I.D.W. Samuel, G.J. Richards, P.L.Burn, C. Im, and H. Bassler, Appl. Phys. Lett. 81 (2002), no. 17, 3266.
[MBH+00] A.P. Monkman, H.D. Burrows, I. Hamblett, S. Navaratnam, U. Scherf,and C. Schmitt, Chem. Phys. Lett. 327 (2000), 111–116.
[MBH+01] A.P. Monkman, H.D. Burrows, L.J. Hartwell, L.E. Horsburgh, I. Ham-blett, and S. Navaratnam, Phys. Rev. Lett. 86 (2001), 1358.
[MBHN01] A.P. Monkman, H.D. Burrows, I. Hamblett, and S. Navaratnam, Chem.Phys. Lett. 340 (2001), 467–472.
[MDGH+98] M.D. McGehee, M.A. Diaz-Garcia, F. Hide, R. Gupta, E.K. Miller, andD. Moses, Appl. Phys. Lett. 72 (1998), 1536.
[MF05] G. Malliaras and R.H. Friend, Phys. Today 58 (2005), 53–58.
[MHC75] H. Mohwald, D. Haarer, and G. Castro, Chem. Phys. Lett. 32 (1975),433.
[MHNH95] H. Meyer, D. Haarer, H. Naarmann, and H.H. Horhold, Phys. Rev. B52 (1995), 2587.
[MHOB01a] S.C.J. Meskers, J. Hubner, M. Oestreich, and H. Bassler, Chem. Phys.Lett. 339 (2001), 223–228.
[MHOB01b] , J. Phys. Chem. 105 (2001), 9139–9149.
[MLK+94] B. Mollay, U. Lemmer, R. Kersting, R.F. Mahrt, H. Kurz, H.F. Kauff-mann, and H. Bassler, Phys. Rev. B 50 (1994), 10769–10779.
[Moe88] W.E. Moerner, Persistent spectral hole burning, science and applica-tions, Springer Verlag, Heidelberg, 1988.
[Mor72] J. Mort, Phys. Rev. B 5 (1972), 3329.
[MP82] J. Mort and G. Pfister, Electronic properties of polymers, ch. 6, p. 215,Wiley-Interscience Publication, 1982.
[MP93] A.R. Melnyk and D.M. Pai, Physical methods of chemistry, 2nd ed.,vol. 8, p. 321, Wiley, New York, 1993.
[MP04] N.R. Mirchin and A. Peled, J Sci. Eng. 1 (2004), no. 4, 782–810.
[MRG86] B. Movaghar, B. Ries, and M. Grunewald, Phys. Rev. B 34 (1986),5574–5582.
[MT95] J. Michl and E.W. Thulstrup, Spectroscopy with polarized light, VCH,Weinheim, 1995.
180

BIBLIOGRAPHY
[NMM+00a] H.-G. Nothofer, A. Meisel, T. Miteva, D. Neher, M. Forster, M. Oda,G. Lieser, D. Sainova, A. Yasuda, D. Lupo, W. Knoll, and U. Scherf,Macromol. Symp. 154 (2000), 139–148.
[NMM+00b] H.G. Nothofer, A. Meisel, T. Miteva, D. Neher, M. Forster, M. Oda,G. Lieser, D. Sainova, A. Yasuda, D. Lupo, W. Knoll, and U. Scherf,Macromol. Symp. 154 (2000), 139.
[NvdAdS+93] M. Novo, M. van der Auweraer, F.C. de Schryver, P.M. Borsenberger,and H. Bassler, Phys. Status Solidi B 177 (1993), 223.
[OGF+01] D.F. O’Brien, C. Giebeler, R.B. Fletcher, A.J. Cadby, L.C. Palilis, D.G.Lidzey, P.A. Lane, D.D.C. Bradley, and W. Blau, Synth. Met. 116(2001), 379.
[OKK+99] A. Ochse, A. Kettner, J. Kopitzke, J.-H. Wendorff, and H. Bassler, Phys.Chem. Chem. Phys. 1 (1999), 1757.
[Ons38] L. Onsager, Phys. Rev. 54 (1938), 554.
[OUMY91] Y. Ohmori, K. Uchida, K. Muro, and K. Yoshino, Jpn. J. Appl. Phys.30 (1991), L1941–L1943.
[OWS+03] R. Oesterbacka, M. Wohlgenannt, M. Shkunov, D. Chinn, and Z.V.Vardeny, J. Chem. Phys. 118 (2003), 8905–8916.
[Par77] D.E. Parry, Chem. Phys. Lett. 46 (1977), 605.
[PDW+04] J. Piris, M.G. Debije, M.D. Watson, K. Mullen, and J.M. Warman, Adv.Funct. Mater. (Weinheim) 14 (2004), no. 11, 1047.
[Pei55] R.E. Peierls, Quantum theory of solids, Clarendon Press, Oxford, 1955.
[Per83] R.I. Personov, Spectroscopy and excitation dynamics in condensed mole-cular systems, North Holland, Amsterdam, 1983.
[Per95] H.-H. Perkampus, Uv-vis spektroskopie und ihre anwednungen, Springer,Berlin, 1995.
[Pfi77] G. Pfister, Phys. Rev. B 16 (1977), 3676.
[PFU+99] J. Partee, E.L. Frankevich, B. Uhlhorn, J. Shinar, Y. Ding, and T.J.Barton, Phys. Rev. Lett. 82 (1999), 3673–3676.
[PG78] G. Pfister and C.H. Griffiths, Phys. Rev. Lett. 40 (1978), 659.
[PGM76] G. Pfister, S. Grammatica, and J. Mort, Phys. Rev. Lett. 37 (1976),1360.
[PKC+02] D. Poplavskyy, T. Kreouzis, A.J. Campbell, J. Nelson, and D.D.C.Bradley, Mater. Res. Soc. Symp. Proc. 725 (2002), P.1.4.1–11.
181

BIBLIOGRAPHY
[PN03] D. Poplavskyy and J. Nelson, J. Appl. Phys. 93 (2003), no. 1, 341.
[PNB04] D. Poplavskyy, J. Nelson, and D.D.C. Bradley, Macromol. Symp. 212(2004), 415–420.
[PS99] M. Pope and C.S. Swenberg, Electronic processes in organic crystals andpolymers, Oxford Science Publications, 1999.
[RB87] B. Ries and H. Bassler, J. Mol. Electron. 3 (1987), 15–24.
[RB98] M. Redecker and D.D.C. Bradley, Appl. Phys. Lett. 73 (1998), no. 11,1565.
[RBE+89] R. Reisfeld, D. Brusilovsky, M. Eyal, E. Miron, Z. Burstein, and J. Ivri,Chem. Phys. Lett. 160 (1989), 43.
[RBGM88] B. Ries, H. Bassler, M. Grunewald, and B. Movaghar, Phys. Rev. B 37(1988), 5508–5517.
[RBGS01] J. Rissler, H. Bassler, F. Gebhard, and P. Schwerdtfeger, Phys. Rev. B64 (2001), 045122.
[RBI+99] M. Redecker, D.D.C. Bradley, M. Inbasekaran, W.W. Wu, and E.P Woo,Adv. Mater. (Weinheim) 11 (1999), no. 3, 241.
[RBR+89] R. Richert, H. Bassler, B. Ries, M. Movaghar, and M. Grunewald, Philos.Mag. Lett. 59 (1989), 95–102.
[RGS+99] Yu. V. Romanovskii, A. Gerhard, B. Schweitzer, R.I. Personov, andH. Bassler, Chem. Phys. 249 (1999), 29–39.
[RGS+00] Yu. V. Romanovskii, A. Gerhard, B. Schweitzer, U. Scherf, R.I. Per-sonov, and H. Bassler, Phys. Rev. Lett. 84 (2000), 1027–1030.
[RGSM01] C. Rothe, R. Guentner, U. Scherf, and A.P. Monkman, J. Chem. Phys.115 (2001), 9557–9562.
[RLF+00] S. Riechel, U. Lemmer, J. Feldmann, T. Benstem, W. Kowalsky, andA. Gombert, Appl. Phys. B 71 (2000), 897.
[RM03] C. Rothe and A.P. Monkman, Phys. Rev. B 68 (2003), 075208.
[RMD+99] J.A. Rogers, M. Meier, A. Dodabalapur, E.J. Laskowski, and M.A. Cap-puzzo, Appl. Phys. Lett. 74 (1999), 3257.
[RPK+05] K.A. Rufanov, A.R. Petrov, V.V. Kotov, F. Laquai, and J. Sundermeyer,Eur. J. Inorg. Chem. (2005), 3805–3807.
[RSP+03] M. Reufer, F. Schindler, S. Patil, U. Scherf, and J.M. Lupton, Chem.Phys. Lett. 381 (2003), 60–66.
182
BIBLIOGRAPHY
[RWL+05] M. Reufer, M.J. Walter, P.G. Lagoudakis, A.B. Hummel, J.S. Kolb, H.G.Roskos, U. Scherf, and J.M. Lupton, Nat. Mater. (London) 4 (2005),340.
[SASB99] B. Schweitzer, V.I. Arkhipov, U. Scherf, and H. Bassler, Chem. Phys.Lett. 313 (1999), 57–62.
[SB62] Strickler and Berg, J. Chem. Phys. 37 (1962), 814.
[SBH+03] M. Segal, M.A. Baldo, R.J. Holmes, S.R. Forrest, and Z.G. Soos, Phys.Rev. B 68 (2003), no. 7, 075211.
[SBK+98] H. Spreitzer, H. Becker, E. Kluge, W. Kreuder, H. Schenk, R. Demandt,and H. Schoo, Adv. Mater. (Weinheim) 10 (1998), no. 16, 1340.
[SBS81] G. Schonherr, H. Bassler, and M. Silver, Philos. Mag. B 44 (1981), 47.
[SCBT94] M. Scheidler, B. Cleve, H. Bassler, and P. Thomas, Chem. Phys. Lett.225 (1994), 431.
[SGP+96] J. Simmerer, B. Glsen, W. Paulus, A. Kettner, P. Schuhmacher,D. Adam, K.-H. Etzbach, K. Siemensmeyer, J.H. Wendorff, H. Rings-dorf, and D. Haarer, Adv. Mater. (Weinheim) 8 (1996), 815.
[SGS90] L.B. Schein, D. Glatz, and J.C. Scott, Phys. Rev. Lett. 65 (1990), 472.
[SGSU02] R. Schroeder, W. Graupner, U. Scherf, and B. Ullrich, J. Chem. Phys.116 (2002), 3449.
[Sie67] W.J. Siebrand, Chem. Phys. 47 (1967), 2411.
[SJG+05] F. Schindler, J. Jacob, A.C. Grimsdale, U. Scherf, K. Mullen, J.M. Lup-ton, and J. Feldmann, Angew. Chem. Int. Ed. 44 (2005), 1520–1525.
[SL05] F. Schindler and J.M. Lupton, ChemPhysChem 6 (2005), 926–934.
[SM91] U. Scherf and K. Mullen, Macromol. Rapid Comm. 12 (1991), 489.
[SRFR95] Y. Sorek, R. Reisfeld, I. Finkelstein, and S. Ruschin, Appl. Phys. Lett.66 (1995), no. 10, 1169.
[SRLM01] U. Scherf, S. Riechel, U. Lemmer, and R.F. Mahrt, Curr. Opin. SolidState Mat. Sci. 5 (2001), 143–154.
[SRM99] J.C. Scott, S. Ramos, and G.G. Malliaras, J. Imaging Sci. Techn. 43(1999), 234.
[SRR+05] D. Schneider, T. Rabe, T. Riedl, T. Dobbertin, M. Kroger, H. Becker,H.H. Johannes, W. Kowalsky, T. Weimann, J. Wang, P. Hinze, A. Ger-hard, P. Stossel, and H. Vestweber, Adv. Mater. (Weinheim) 17 (2005),31.
183
BIBLIOGRAPHY
[SSF02] J. Salbeck, M. Schorner, and T. Fuhrmann, Thin Solid Films 417 (2002),20–25.
[SSS+00] F. Steuber, J. Staudigel, M. Stossel, J. Simmerer, A. Winnacker,H. Spreitzer, F. Weissortel, and J. Salbeck, Adv. Mater. (Weinheim)12 (2000), 130.
[SWB81] L. Sebastian, G. Weiser, and H. Bassler, Chem. Phys. 61 (1981), no. 1-2,125–135.
[SWB98] J. Salbeck, F. Weissortel, and J. Bauer, Macromol. Symp. 125 (1998),121.
[SWdH+91] P.G. Schouten, J.M. Warman, M.P. de Haas, M.A. Fox, and H.-L. Pan,Nature (London) 353 (1991), 736.
[SWdH+94] P.G. Schouten, J.M. Warman, M.P. de Haas, C.F. van Nostrum,G.H. Gelinck, R.J.M. Nolte, M.J. Copyn, J.W. Zwikker, M.K. Engel,M. Hanack, Y.H. Chang, and W.T. Ford, J. Am. Chem. Soc. 116 (1994),6880–6894.
[SWG+98] B. Schweitzer, G. Wegmann, H. Giessen, D. Hertel, H. Bassler, and R.F.Mahrt, Appl. Phys. Lett. 72 (1998), no. 23, 2933.
[SYP84] M. Stolka, J.F. Yanus, and D.M. Pai, J. Phys. Chem. 88 (1984), 4707.
[TDF96] N. Tessler, G.J. Denton, and R.H. Friend, Nature (London) 382 (1996),695.
[TvS87] C.W. Tang and S.A. van Slyke, Appl. Phys. Lett. 51 (1987), 913.
[Val02] B. Valeur, Molecular fluorescence: Principles and applications, Wiley-VCH, Weinheim, 2002.
[VBB+01] H. Vestweber, H. Becker, A. Busing, O. Gelsen, S. Heun, E. Kluge,W. Kreuder, H. Schenk, H. Spreitzer, P. Stssel, and K. Treacher, ITG-Fachbericht, Displays and Vacuum Electronics 31 (2001).
[vdHBMB01] J.W. van der Horst, P.A. Bobbert, M.A.J. Michels, and H. Bassler, J.Chem. Phys. 114 (2001), 6950–6957.
[WCAM+01] J.S. Wilson, N. Chawdhury, M.R.A. Al-Mandhary, M. Younus, M.S.Khan, P.R. Raithby, A. Kohler, and R.H. Friend, J. Am. Chem. Soc.123 (2001), 9412.
[WdH91] J.M. Warman and M.P. de Haas, Pulse radiolysis, ch. 6, CRC Press,Boca Raton, FL 1991.
[WG93] F. Wudl and S. Gordana, Patent US5189136, 1993.
[WGLV99] M. Wohlgenannt, W. Graupner, G. Leising, and Z.V. Vardeny, Phys.Rev. B 60 (1999), 5321–5330.
184
BIBLIOGRAPHY
[WKF+00] J.S. Wilson, A. Kohler, R.F. Friend, M.K. Al-Suti, M.R.A. Al-Mandhary, M.S. Khan, and P.R. Raithby, J. Chem. Phys. 113 (2000),7627–7634.
[WSH+99] G. Wegmann, B. Schweitzer, M. Hopmeier, M. Oestreich, H. Giessen,and R.F. Mahrt, Phys. Chem. Chem. Phys. 1 (1999), 1795–1800.
[WSK85] W. Warta, R. Stehle, and N. Karl, Appl. Phys. A 36 (1985), 163.
[WU71] H.P. Weber and R. Ulrich, Appl. Phys. Lett. 19 (1971), 38.
[WvdC03] J.M. Warman and A.M. van de Craats, Mol. Cryst. Liquid Cryst. 396(2003), 41.
[XHB03] R. Xia, G. Heliotis, and D.D.C. Bradley, Appl. Phys. Lett. 82 (2003),no. 21, 3599.
[XHHB03] R. Xia, G. Heliotis, Y. Hou, and D.D.C. Bradley, Org. Electron. 4 (2003),165–177.
[XHSB05] R. Xia, G. Heliotis, P.N. Stavrinou, and D.D.C. Bradley, Appl. Phys.Lett. 87 (2005), 031104.
[YRP+94] M. Yan, L.J. Rothberg, F. Papadimitrakopoulos, M.E. Galvin, and T.M.Miller, Phys. Rev. Lett. 73 (1994), 744.
[YSY+05] H. Yang, T.S. Shin, L. Yang, K. Cho, C.Y. Ryu, and Z. Bao, Adv. Funct.Mater. (London) 15 (2005), no. 4, 671.
[ZFS06] J. Zaumseil, R.H. Friend, and H. Sirringhaus, Nature Materials 5 (2006),69–74.
[ZGT+97] C. Zenz, W. Graupner, S. Tasch, G. Leising, K. Mullen, and U. Scherf,Appl. Phys. Lett. 71 (1997), no. 18, 2566.
[ZGT+98] C. Zenz, W. Graupner, S. Tasch, G. Leising, K. Iskra, J. Flieser, andT. Neger, J. Appl. Phys. 84 (1998), 5445.
[ZKG+99] C. Zenz, G. Kranzelbinder, W. Graupner, S. Tasch, and G. Leising,Synth. Met. 101 (1999), 222–225.
185

Appendix A
Abbreviations
A Acceptor
AFM Atomic force microscopy
ASE Amplified spontaneous emission
C Capacitance
CGL Charge generation layer
CGM Charge generation material
CT Charge transfer state
CV Cyclic voltammetry
cw continous wave
D Donor
DF delayed fluorescence
DFB Distributed feedback
DI SCLC dark-injection space-charge limited current
DOS Density of states
DRS / DS Dielectric relaxation spectroscopy
DSC Differential scanning calorimetry
Eb exciton binding energy
Eg energy of the optical gap
EL Electroluminescence
ET Energy transfer
Fc ferrocene
F8BT Poly(dioctylfluorene)-co-bithiophene
FWHM full width at half maximum
eV electron volt, 1 eV = 1.6× 10⁻¹⁹J
GDM Gaussian disorder model
GP geminate pair
HOMO Highest occupied molecular orbital
186

Appendix A: Abbreviations
IC Internal conversion
ISC Intersystem Crossing
ITO Indium tin oxide, i.e. transparent electrode material
K Kelvin
LCD Liquid crystal display
LED Light emitting diode
LEP Light emitting polymer
LUMO Lowest unoccupied molecular orbital
m slope
MEH-PPV poly(2-methoxy-5-(2’-ethylhexyloxy)-1,4-phenylene-vinylene)
MeLPPP methylsubstituted ladder-type Poly-p-phenylen
MTHF 2-Methyl-tetrahydrofuran
Mn Number average of molecular weight
Mw Weight average of molecular weight
Nd:YAG Nd:yttrium aluminum garnet (laser)
OD optical density, i.e. absorption
ODOS Occupied density of states
OFET Organic field effect transistor
OLED Organic light emitting diode
OMA optical multichannel analyser
OPO Optical parametric oscillator
OSC Organic solar cell
PA Poly(acetylene)
PDA Poly(diacetylene)
PDI Perylene diimide
PEDOT Poly(ethylenedioxythiophene)/polystyrenesulphonic acid
PF prompt fluorescence
PF2/6 Poly(9,9-di(ethylhexyl)fluorene)
PFO Poly(9,9-dioctylfluorene)
Ph Phosphorescence
PhPPV phenylsubstituted PPV
PIA Photoinduced absorption
PIF Poly(indenofluorene)
PL Photoluminescence
PLE Photoluminescence excitation
PLED Polymer light emitting diode
POM Polarized optical microscopy
PPP Poly-p-phenylene
187

Appendix A: Abbreviations
PR-TRMC Pulse-radiolysis time-resolved microwave conductivity
PVK Poly-(N-vinylcarbazol)
PtOEP 2,3,7,8,12,13,17,18-octaethyl-21H,23H-Porphyrin-Platinum(II)
PS Polystyrene
PSBF Polyspirobifluorene polymer
QRE Quasi-reference electrode
RC resistance×capacitance, i.e. response time of an electrical circuit
RFEB Random free energy barrier (model)
RT room temperature
σ Width of energetic disorder
Σ Width of positional disorder
S0 Singlet ground state
S1 first singlet excited state
Sn nth singlet excited state
SCLC Space-charge limited current
SE Stimulated emission
SHG Second harmonic generator
S-NRS-PPV Super-Non-Red-Shifting PPV (similar to SY-PPV)
SSA singlet-singlet-annihilation
SSF Site-selective fluorescence (spectroscopy)
SV Stern-Volmer
SY-PPV Super-Yellow PPV (phenylsubstituted PPV, COVION)
T1 first excited triplet state
TAD Triarylamine derivative
TCSPC Time-correlated single photon counting
TEM Transmission electron microscopy
THF Tetrahydrofuran
TOF time-of-flight (technique)
TTA Triplet-triplet-annihilation
UV-VIS ultraviolet-visible
The other abbreviations used in this thesis, especially constants, have their usual mean-
ing unless otherwise stated in the text.
188
Appendix B
List of scientific publications
Previous Publications:
[LIKB03] F. Laquai, C. Im, A. Kadashchuk, H. Bassler, ”Sensitized intrinsic phospho-
rescence from a phenyl-substituted poly-phenylene-vinylene derivative”, Chem. Phys.
Lett. 375 (2003) 286.
[RPK+05] K.A. Rufanov, A.R. Petrov, V.V. Kotov, F. Laquai, and J. Sundermeyer,
”A Lutetium Cyclopentadienyl-Phosphazene Constrained Geometry Complex (CGC):
First Isolobal Analogues of Group 4 Cyclopentadienyl-Silylamido CGC Systems”, Eur.
J. Inorg. Chem. (2005) 3805-3807.
Recent Publications: (accepted papers only)
[LWI+06b] F. Laquai, G. Wegner, C. Im, H. Bassler, S. Heun, ”Nondispersive hole
transport in carbazole- and anthracene-containing polyspirobifluorene copolymers stud-
ied by the charge-generation layer time-of-flight technique”, J. Appl. Phys. 99 (2006)
033710.
[LWI+06a] F. Laquai, G. Wegner, C. Im, H. Bassler, S. Heun, ”Comparative study
of hole transport in polyspirobifluorene polymers measured by the charge-generation
layer time-of-flight technique”, J. Appl. Phys. 99 (2006) 023712.
[LKB+06] F. Laquai, P.E. Keivanidis, S. Baluschev, J. Jacob, K. Mullen, and G. Weg-
ner, ”Low-threshold amplified spontaneous emission in thin films of poly(tetraaryl-
indenofluorene)”, Appl. Phys. Lett. 87 (2005) 261917.
[LWI+05] F. Laquai, G. Wegner, C. Im, A. Busing, and S. Heun, ”Efficient upconver-
sion fluorescence in a blue-emitting spirobifluorene-anthracene copolymer doped with
low concentrations of Pt(II)octaethylporphyrin”, J. Chem. Phys. 123 (2005) 074902.
189
Appendix C: Publications
Conference contributions:
F. Laquai, P.E. Keivanidis, S. Baluschev, G. Wegner, J. Jacob, and K. Mullen 3rd
European Conference on Molecular Electronics and Related Phenomena, Winterthur,
Switzerland, 27th - 30th September 2005, ”Low-threshold amplified spontaneous emis-
sion in thin films of poly(tetraarylindenofluorene)”.
J.-Y. Li, F. Laquai, A. Ziegler, G. Wegner, 8th Polymers for Advanced Technologies
International Symposium, Budapest, Hungary, 13th - 16th September 2005, ”Amplified
Spontaneous Emission in Optically Pumped Neat Films of Novel Polyfluorene Deriva-
tives”.
F. Laquai, C. Im, H. Bassler, S. Heun, and G. Wegner, 8th European Conference on
Molecular Electronics, Bologna, Italy, 29th June - 2nd July 2005, ”Comparative Study
of Hole Transport in Spirobifluorene Copolymers measured by the Charge-Generation
Layer Time-of-Flight Technique”.
F. Laquai, and C. Im, 7th European Conference on Molecular Electronics, Avignon,
France, 10th - 14th September 2003, ”Sensitized Phosphorescence from π-conjugated
Electroluminescent Polymers”.
190