electronic device for arterial pulse waveform semiology · arterial pulse waveform in an ......
TRANSCRIPT

Abstract—The visualization of the arterial pulse waveform
has been a problem to clinical physicians because normally, the
medic has to imagine the pulse from palpation. But in this work
we provide a simple electronic device, designed and assembled
from elements such as operational amplifiers, resistances, and
commercial capacitors, among others. We use analogic filters
(active and passive), compensators, amplifiers, a common
fototransistor and a light emitting diode as sensor, which is in
contact with a human arterial pulse palpation site (wrist or
neck). In the results it is possible to see a clear signal from an
arterial pulse waveform in an oscilloscope screen. Finally,
remain in the future work to integrate a display to see the
waveform in other devices, also to perform arterial pulse
waveform semiology automatically.
Index Terms—Arterial pulse waveform, semiology,
operational amplifiers, electronic device.
I. INTRODUCTION
In clinical medicine, the semiotics is a physician s tool for
diagnosis of probable syndromes in a patient. Among the
signs and symptoms in a patient, the semiotics studies the
arterial pulse (AP). The AP is an indirect sign of the pressure
of the vascular system, and it has been studied since ancient
times, e.g. in the Traditional Chinese Medicine [1]. The AP is
observed by physicians to look for some evidence of health or
disease, but its detection need large amount of practice and
has a subjective component that may varies with the physician
criteria [2]. Modern physicians have two kind of technic to
measure the AP, the invasive and the non-invasive [3], [4], in
the first, it is used a needle in the interior of the artery to
measure the pressure, waveform and oximetry with very
specific and, sometimes, complex devices [4]. It is worth
mention that invasive technics are mostly used in controlled
environments such as the intensive care within a hospital, and
should be perform by trained personal only, additionally the
risk of bleeding, infection and thrombosis are higher that the
non-invasive technics [5]. In the second case, in the
non-invasive technics, it is used the palpation to feel a
probable waveform, intensity, and frequency, but with
electronic devices, now is possible to perceive the pulse
indirectly through oximetry [6].
In this work, the main objective is to design a simple
electronic circuit to acquire the waveform of the arterial pulse
in order to visualize possible alterations. The circuit is the
Manuscript received April 25, 2016; revised September 16, 2016.
Octavio Diaz-Hernandez is with the Universidad Nacional Autonoma de
Mexico, Departamento de Ingenieria Electrica Electronica, Facultad de
Estudios Superiores Aragon, Mexico City, Mexico (e-mail:
Livier Baez-Rivas is with Universidad Nacional Autonoma de Mexico,
Departamento de Ingenieria en Sistemas Médicos, Facultad de Ingenieria,
Mexico City, Mexico (e-mail: [email protected]).
main core of a device, which is projected to be used in
common examination room or doctor office, besides the
personal who uses it, will not require specialized medical
training.
II. RELATED WORK
Measurement of health parameters is an important
necessity for physicians during clinical examination, and a
great opportunity for engineers to propose medical devices, in
this paper, we centered our attention in the arterial pulse. In
this section, we mention some other researchers that have
proposed other devices to measure pulse. In [7], Almen et al.
uses the principles of plethysmography to monitor pulse rate
of the patient as he/she undergoes training and displays the
result on the LabVIEW-based pc application. In [8], Ates et al.
uses a red and IR (Infrared) LEDs (light emitting diode) sent
signals to the photodiode, and then a ratio between the signals
(red and IR) received by photodiode is analyzed to estimate
the oxygen saturation value (SpO2), the algorithm of the
estimation is performed by a fuzzy logic method. In [9],
Corciova et al developed a medical device for a monitoring
peripheral hemodynamics with plethysmography using the
impedance technique. Their system combines the analog
amplifiers with digital signal processing to acquire real time
monitoring. In [10] Dai, Y. and J. Luo designed an oximeter
using infrared spectroscopy, but their novelty was to integrate
a wireless technology (bluetooth) and applications on a
smartphone, which processes pulse wave signal with digital
algorithm, calculates the value of oxygen saturation (SpO2)
and pulse rate, and finally presents them along with pulse
wave graph visually through the smart mobile APP interface.
In [11], Khandoker et al., developed a simple and low cost
oximeter photoplethyasmograph device which has been
interfaced with mobile phone through USB (Universal Serial
Bus). The mobile device is used to display the patient's blood
oxygen saturation and pulse rate, and thus reduced the cost. In
[12], Lin et al., designed and implemented a wearable and
wireless finger base-type pulse oximeter using the tissue
optical simulation technique and the Monte Carlo method.
And they founded that can facilitate precise a SpO2
measurement even in a fingertip-type pulse oximeter.
III. THEORY BACKGROUND
A. Physiology
In the modern physiology, there is a concept named
Vascular Pressure Wave (VPW), which is arisen from the
heart during the systole and is originated in the descending
aorta. Then it travels through the vessels walls of the
periphery arteries much faster that the blood stream itself. The
Octavio Diaz-Hernandez and Livier Baez-Rivas
Electronic Device for Arterial Pulse Waveform Semiology
294
International Journal of Information and Electronics Engineering, Vol. 6, No. 5, September 2016
doi: 10.18178/ijiee.2016.6.5.641
original systolic wave bounds in the peripheral veins and runs
backwards centripetally forming a second wave. In the
periphery arteries the pressure wave can be palpate as the
arterial pulse (AP). The main features of the AP are frequency,
rhythm, intensity, shiftiness, symmetry, and width. The
waveform of the AP is shown in the Fig. 1.
Fig. 1. Normal waveform of the AP.
B. Semiotics
Semiology or semiotics is the field of clinical pathology
that studies signs and symptoms of syndromes, diseases and
their consequences. The arterial pulse (AP) is the most
fundamental sign in clinical medicine, and has since been
identified with the physician and the art of medicine. The AP
can be perceived from any artery, but in order to be feel by the
outside, the artery needs to be superficial and to be located on
a plane, in this manner, the most common and palpable pulses
are two: the radial artery pulse, which is located at the wrist
between the brachioradialis and palmaris tendons. Also the
carotid artery pulse, which can normally be felt in the neck by
pressing the fingertips against the side of the windpipe, or
trachea [6].
C. Types of Arterial Pulse
Pulsus alternans is a variation in pulse amplitude occurring
with alternate beats due to changing systolic pressure. The
main cause of pulsus alternans is failure of the heart left
ventricle, and is more common with faster heart rate. It may
be seen in patients with severe aortic regurgitation. Also
pulsus alternans is often triggered by ectopic beats. See Fig.
2.
Fig. 2. Representation of Pulsus alternans.
Another finding can be that systolic arterial pressure
normally falls during inspiration, called pulsus paradoxus.
See Fig. 3.
Fig. 3. Representation of Pulsus paradoxus.
The pulsus paradoxus is correlated to the inspiratory
decline of left ventricular stroke volume and is an important
physical finding in cardiac tamponade, chronic obstructive
pulmonary disease, morbid obesity, hypovolemic shock, and
infrequently in constrictive pericarditis and restrictive
cardiomyopathy.
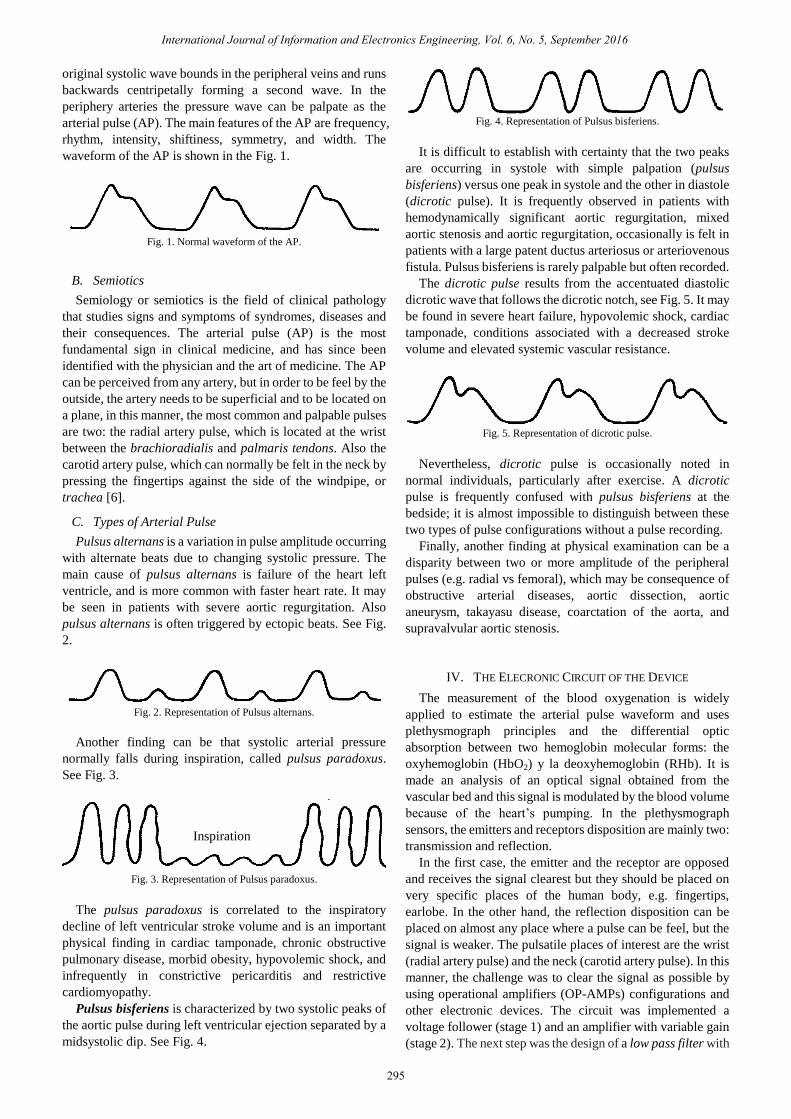
Pulsus bisferiens is characterized by two systolic peaks of
the aortic pulse during left ventricular ejection separated by a
midsystolic dip. See Fig. 4.
Fig. 4. Representation of Pulsus bisferiens.
It is difficult to establish with certainty that the two peaks
are occurring in systole with simple palpation (pulsus
bisferiens) versus one peak in systole and the other in diastole
(dicrotic pulse). It is frequently observed in patients with
hemodynamically significant aortic regurgitation, mixed
aortic stenosis and aortic regurgitation, occasionally is felt in
patients with a large patent ductus arteriosus or arteriovenous
fistula. Pulsus bisferiens is rarely palpable but often recorded.
The dicrotic pulse results from the accentuated diastolic
dicrotic wave that follows the dicrotic notch, see Fig. 5. It may
be found in severe heart failure, hypovolemic shock, cardiac
tamponade, conditions associated with a decreased stroke
volume and elevated systemic vascular resistance.
Fig. 5. Representation of dicrotic pulse.
Nevertheless, dicrotic pulse is occasionally noted in
normal individuals, particularly after exercise. A dicrotic
pulse is frequently confused with pulsus bisferiens at the
bedside; it is almost impossible to distinguish between these
two types of pulse configurations without a pulse recording.
Finally, another finding at physical examination can be a
disparity between two or more amplitude of the peripheral
pulses (e.g. radial vs femoral), which may be consequence of
obstructive arterial diseases, aortic dissection, aortic
aneurysm, takayasu disease, coarctation of the aorta, and
supravalvular aortic stenosis.
IV. THE ELECRONIC CIRCUIT OF THE DEVICE
The measurement of the blood oxygenation is widely
applied to estimate the arterial pulse waveform and uses
plethysmograph principles and the differential optic
absorption between two hemoglobin molecular forms: the
oxyhemoglobin (HbO2) y la deoxyhemoglobin (RHb). It is
made an analysis of an optical signal obtained from the
vascular bed and this signal is modulated by the blood volume
because of the heart’s pumping. In the plethysmograph
sensors, the emitters and receptors disposition are mainly two:
transmission and reflection.
In the first case, the emitter and the receptor are opposed
and receives the signal clearest but they should be placed on
very specific places of the human body, e.g. fingertips,
earlobe. In the other hand, the reflection disposition can be
placed on almost any place where a pulse can be feel, but the
signal is weaker. The pulsatile places of interest are the wrist
(radial artery pulse) and the neck (carotid artery pulse). In this
manner, the challenge was to clear the signal as possible by
using operational amplifiers (OP-AMPs) configurations and
other electronic devices. The circuit was implemented a
voltage follower (stage 1) and an amplifier with variable gain
(stage 2). The next step was the design of a low pass filter with
Inspiration
295
International Journal of Information and Electronics Engineering, Vol. 6, No. 5, September 2016

a cutoff frequency of 3 Hz (stage 3). Next there is a
compensator (derivative OP-AMP configuration) which had a
1.8 hz frequency (stage 4), the compensator eliminate noise
from the signal. Finally, we added a non-inverting amplifier,
post compensator, (stage 5). See appendix A: Circuit
A. Calculus of the Gain and Numeric Analysis
After the test for obtain the signal, we added the different
stages.
1) The follower
In this configuration (Fig. 6) did not use any resistances.
OPAMP
Input signal
Output signal
Fig. 6. OPAMP follower configuration.
Gain = 1 (1)
2) Non Inverting Amplifier
The gain was between 4.5 and 6 and it is applied the
equation (2) for the configuration shown in Fig. 7.
OPAMP
Input signal
Output signal
R1
R2
Fig. 7. OPAMP Non inverting amplifier configuration.
Gain= (R2/R1)+1 (2)
where the R2 was between 3.5 and 5 kΩ, while R1 was 1 kΩ.
3) Low pass filter
In order to calculate the resistance (R), in the low pass filter
configuration (see Fig. 8) we applied the equation (3).
OPAMP
RR
R*
C
C
Input signal
Output signal
Fig. 8. OPAMP Low pass filter configuration.
FC = 1 / 2 R C (3)
where FC is the cutoff frequency in hertz, C is the capacitor in
microfarads, which was fixed in 33uF and the frequency in 3
Hz in order to eliminate noise from other biological signals
such as intestinal movements, breath, or cardiac signals,
among others. Then the resistance R was of 1.2kΩ.
Additionally, the R* is a dampening circuit to avoid instability
around cutoff frequency, and it has 5.6 kΩ.
4) Compensator (derivate)
For the compensator (see Fig. 9) we use a derivative
configuration of the OP-AMP, the frequency was fixed on 1.8
Hz (Fd) and 10 uF for the capacitor. The resistance was
calculated with (4).
OPAMP
R
C
Input signal
Output signal
Fig. 9. OPAMP Derivator configuration.
𝑅d = 12 Fd C (4)
Then the resistance was 8.84 kΩ approximately and we
implement it with a potentiometer (variable resistance).
5) Non-inverting amplifier (post compensator)
Finally, we added a non-inverting amplifier with a gain of
3.2 and we use equation (2) to calculate the resistances. The
R2 was 2.2 kΩ, while R1 was 1 kΩ
V. TEST AND RESULT
In the next photographs (see Fig. 10-Fig. 14), we show the
test on a healthy person in the various stages mentioned
earlier.
Fig. 10. Output signal from sensor, 50 mV per division.
Fig. 11. Output signal from follower, 50 mV per division.
296
International Journal of Information and Electronics Engineering, Vol. 6, No. 5, September 2016

Fig. 12. Output signal from non-inverting amplifier, 200 mV per division.
Fig. 13. Output signal from low pass filter, 200 mV per division.
Fig. 14. Yellow signal, output from low pass filter, 500 V per division. Blue
signal, output from compensator (derivate) with a derivate frequency of
1.8Hz, 1 V per division.
As seen in the Fig. 14 (in yellow), the signal is clear and
concordant with the normal arterial pulse waveform.
VI. CONCLUSION
We have measured arterial pulse waveform with a device
built with simple hardware and other passive elements. The
tolerance of the elements, such the resistance, capacitors, and
amplifiers is acceptable. Other devices, as the “Pulse Sensor,”
which is based on a photodiode (APDS 9008) and an
Operational Amplifier, are more expensive or inaccessible,
this is why our device has advantage. In one hand, the
components can be easily found and bought, and in the other,
it can be assembly in a simple breadboard. This device is
expensive in comparison to ours, approximately the circuit
with the APDS 9008, can be bought in 38 US dollar, and our
design around 10 US dollar. We will compare them in a later
study. The results show that is possible to clear a noisy signal
(such as arterial pulse waveform measured through the skin
and other tissues) and make it readable for anyone with or
without medical training. For example, the cardiologist can
make a physical examination of any arterial pulse waveform
with this hardware. Additionally, it is possible to calibrate the
device with different gains in order to visualize the pulse
through different layers, such as skin, fur, or adipose tissue.
The isolation of the circuit is important due to
electromagnetic waves there are in our environment
nowadays, we achieve a clean signal despite we worked on a
laboratory full of power sources, radiofrequency and wireless
internet; afterwards we will test our circuit in a doctor office.
The next step of the design is the integration of a display, such
as a LCD (Liquid Crystal Display), a mobile device, or
another handheld device. Also remains as ongoing work, the
possibility to automatically achieve a diagnosis of the arterial
pulse waveform with a programmed algorithm. The semiotics
of the arterial pulse can lead to cardiac or vascular conditions
and it is relevant to provide to the physician of a method for
objective evaluation, which come to be available in common
clinical examination room, and not only in the intensive care
units, within hospitals of research facilities.
APPENDIX A: CIRCUIT
The sensor used in this project is composed by a Light
Emitting Diode (infrared) and a fototransistor, also we made
tests with an fotodiode as receptor, with very similar results.
The first input signal labeled as “Sensor” in Fig. 15 is
connected to the collector of the fototransistor.
OPAMP
Input signal (sensor)
OPAMPR1
1k
R2
3.5k
OPAMP
C3
OPAMP
Output signal
R71k
R8
2.2k
STAGE 1
STAGE 2
STAGE 3
STAGE 4
STAGE 5
A
B
C
D
OPAMP
R4
1.2k
R3
1.2k
R5*
5.6k
C1
33uF
C2
33uF
R6
8.84k
Fig. 15. Schematics of the main circuit.
Also, the stages are shown in the next Fig. 16, where also
place the sensor and the measured signal.
297
International Journal of Information and Electronics Engineering, Vol. 6, No. 5, September 2016

Fig. 16. The system with input and output signals.
ACKNOWLEDGMENT
The authors wish to thank to Facultad de Estudios
Superiores Aragón and Facultad de Ingeniería of the
Universidad Nacional Autónoma de México.
REFERENCES
[1] D. Wang, D. Zhang, and J. C. Chan, “Feature extraction of radial
arterial pulse,” in Proc. 2014 International Conference on Medical
Biometrics, 2014.
[2] I. S. N. Murthy and G. Sita, “Digital models for arterial pressure and
respiratory waveform,” IEEE Transactions on Biomedical
Engineering, vol. 40, no. 8, pp. 717-726, 1993.
[3] U. Sharath et al., “Blood pressure evaluation using
sphygmomanometry assisted by arterial pulse waveform detection by
fiber Bragg grating pulse device,” Journal of Biomedical Optics, vol.
18, no. 6, 2013.
[4] J. Kumasawa et al., “Detecting central-venous oxygen desaturation
without a central-venous catheter: Utility of the difference between
invasively and noninvasively measured blood pressure,” Journal of
Critical Care, vol. 33, pp. 257-261, 2016.
[5] I. Ibrahim et al., “Point-of-care bedside gas analyzer: limited use of
venous pCO2 in emergency patients,” The Journal of Emergency
Medicine, vol. 41, no. 2, pp. 117–123, 2011.
[6] A. Surós and J. Surós, Semiología Médica y Técnica Exploratoria,
Elsevier 2001, España: Masson.
[7] M. J. T. Almen et al., “NI LabVIEW based breathing trainer with
biofeedback and plethysmography,” Bangkok, Thailand: Institute of
Electrical and Electronics Engineers Inc., 2014.
[8] G. Ates and K. Polat, “Measuring of oxygen saturation using pulse
oximeter based on fuzzy logic,” IEEE Computer Society, 2012.
[9] C. Corciova et al., Design an Impedance Plethysmography System for
Measuring Limb Blood Flow, 2011, Springer Verlag.
[10] Y. Dai and J. Luo, “Design of noninvasive pulse oximeter based on
bluetooth 4.0 BLE,” Institute of Electrical and Electronics Engineers
Inc., 2014.
[11] A. H. Khandoker, J. Black, and M. Palaniswami, “Smartphone-based
low cost oximeter photoplethysmography,” IEEE Computer Society,
2010.
[12] B.-S. Lin et al., “Design of a finger base-type pulse oximeter,” Review
of Scientific Instruments, vol. 87, no. 1, 2016.
Octavio Diaz-Hernandez was born in Mexico, 1979.
He received the B.S. degree in mechatronics
engineering from the National Autonomous University
of Mexico (UNAM) in 2007. Obtained the M.S. and
Ph.D. degrees in mechanical engineering in 2010 and
2014, respectively.
He is currently full time professor at UNAM, in the
Facultad de Estudios Superiores Aragón. He has
worked on projects about mobile and serial robots,
teleoperated systems, artificial intelligence, biomechanical analysis, and
other mechatronic devices. He has been involved with CONACyT (Consejo
Nacional de Ciencia y Tecnología) in Mexico as research assistant. Since
2007, he has lectured subjects such as Analog and Digital Electronics,
Mechatronics, Automation, and Design. He has participated in numerous
projects at the CDMIT since 2008. He has published articles in conferences
for example: Five DOF Instrumented Master Device For Experimental
Understanding Of Intuitive Teleoperation. ASME-IMECE 2011, Denver,
Colorado, USA. And in a journal: Analysis of human intuition towards
artificial intuition synthesis for robotics. Mechatronics and Applications:
An International Journal (MECHATROJ), Vol. 1, No.1, 2015. His Areas of
interest and research are mechatronic systems, robotics, teleoperated
manipulators, robotics for rehabilitation, applied electronic systems,
biomechanics, and bioinstrumentation.
Dr. Diaz-Hernandez is currently member of IEEE (Institute of Electrical
and Electronics Engineers) and SOMIM (Sociedad Mexicana de Ingeniería
Mecánica).
Livier Baez-Rivas was born in Mexico in 1982, she
graduated from the Institute Polytechnic National
Engineering Bionics, in 2007 and received master’s
degree in mechanical engineering area mechatronics,
at the National Autonomous University of Mexico –
UNAM, 2011.
She is with the Academic Technical of Division of
Mechanical and Industrial Engineering and Professor
of Mechatronics Engineering and Biomedical Systems
Engineering, Operations Coordinator of the School of in Biomedical
Systems Engineering at Engineering Faculty at UNAM, focusing on projects
biomedical instrumentation, biomechanics, analog electronics and teaching
in engineering. Areas of interest polysomnography systems for the
identification and biosignal processing, technology development assistance
biomedico-hospital environment and teaching-learning processes for
engineering.
298
International Journal of Information and Electronics Engineering, Vol. 6, No. 5, September 2016